a study on friction coefficient and wear coefficient of coated systems submitted to micro-scale...
TRANSCRIPT

Surface & Coatings Technology 215 (2013) 224–233
Contents lists available at SciVerse ScienceDirect
Surface & Coatings Technology
j ourna l homepage: www.e lsev ie r .com/ locate /sur fcoat
A study on friction coefficient and wear coefficient of coated systems submitted tomicro-scale abrasion tests
Ronaldo Câmara Cozza ⁎Centro Universitário da FEI – Fundação Educacional Inaciana “Padre Sabóia de Medeiros”, Departamento de Engenharia Mecânica, Av. Humberto de Alencar Castelo Branco, 3972, 09850-901,São Bernardo do Campo, SP, BrazilCEETEPS – Centro Estadual de Educação Tecnológica “Paula Souza”, FATEC-Mauá, Av. Antônia Rosa Fioravante, 804, 09390-120, Mauá, SP, Brazil
⁎ Tel.: +55 11 4353 2900; fax: +55 11 4109 5994.E-mail address: [email protected].
0257-8972/$ – see front matter © 2012 Elsevier B.V. Allhttp://dx.doi.org/10.1016/j.surfcoat.2012.06.088
a b s t r a c t
a r t i c l e i n f oAvailable online 6 November 2012
Keywords:Ball-cratering wear testingThin filmsCoatingsFriction coefficientWear coefficient
Several works on friction coefficient during abrasive wear tests are available in the literature, but only a few werededicated to the friction coefficient in micro-abrasive wear tests conducted with rotating ball. This work aims tostudy the influence of titanium nitride (TiN) and titanium carbide (TiC) coating hardness on the friction coefficientandwear coefficient in ball-crateringmicro-abrasivewear tests. A ball of AISI 52100 steel and two specimens of AISID2 tool steel, one coated with TiN and another coated with TiC, were used in the experiments. The abrasive slurrywas preparedwith black silicon carbide (SiC) particles and distilledwater. Two normal forces and six slidingdistances were defined, and both normal and tangential forces were monitored constantly during all tests.The movement of the specimen in the direction parallel to the applied force was also constantly monitoredwith the help of an electronic linear ruler. This procedure allowed the calculation of crater geometry, andthus the wear coefficient for the different sliding distances without the need to stop the test. The frictioncoefficient was determined by the ratio between the tangential and the normal forces, and for both TiNand TiC coatings, the values remained, approximately, in the same range (from μ=0.4 to μ=0.9). On theother hand, the wear coefficient decreased with the increase in coating hardness.
© 2012 Elsevier B.V. All rights reserved.
1. Introduction
Recently, the micro-scale abrasive wear test has gained large accep-tance in universities and research centers, being widely used in studieson the abrasive wear of materials. Fig. 1a [1] presents a schematicdiagram of the principle of this abrasive wear test, where a rotating ballis forced against the tested specimen, in the presence of an abrasiveslurry. There are two main equipment configurations to conduct thistype of test: “free-ball” and “fixed-ball”. Fig. 1b [2,3] and 1c [1,3,4]shows examples of these equipments.
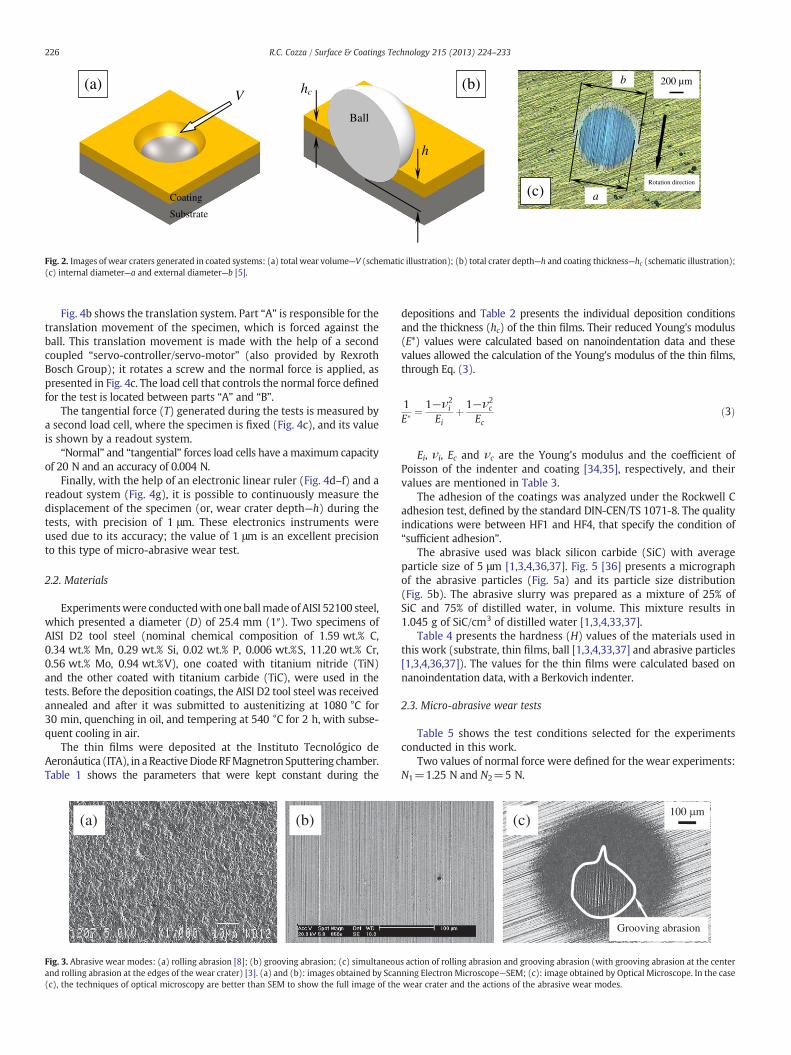
The aim of themicro-abrasivewear test is to generate “wear craters”on the specimen. Fig. 2 presents images of such craters when generatedin coated systems, together with an indication of the total wear volume(V), the total crater depth (h), the coating thickness (hc), the internalcrater diameter (a) [5] and the external crater diameter (b) [5].
The internal andexternal diameters of thewear crater are commonlymeasured by optical microscopy, but other methods are available. Forexample, Computer Aided Design (CAD) software [1,3] has been usedfor this purpose. The total wear volume and the total crater depth maybe determined as a function of b, using Eqs. (1) [6] and (2) [7],
rights reserved.
respectively, where R is the radius of the ball. These equations are alsovalid for non-coated systems.
V≅ πb4
64Rfor b≪ R ð1Þ
h≅ b2
8Rfor b≪ R ð2Þ
Two abrasive wear modes are usually observed on the surface ofthe worn crater: “rolling abrasion” results when the abrasive particlesroll on the specimen, while “grooving abrasion” is observed when theabrasive particles slide [8–11] on the specimen. Depending on testconditions, “rolling abrasion” and “grooving abrasion” can occur simulta-neously in a given crater [1,3,4,8–10]. Fig. 3a [8], b and c [3] presents,respectively, images of “rolling abrasion”, “grooving abrasion” and asimultaneous action of “rolling and grooving abrasion”.
The micro-abrasive wear test has been applied in the study of theabrasive wear of metallic [1–3,8] and non-metallic [3,4,11–15] materialsand, depending on the equipment configuration, it is possible to applynormal loads (N) from 0.01 N [9,10] to 10 N [1,8,11,16,17] and ball rota-tional speeds (n) up to 80 rpm [1,12].
The wear behavior of different materials is analyzed based on thedimensions of the wear crater and/or on the wear mode. Since theearly works of Hutchings [7–10,14,18], other important contributions

Nomenclature
a internal diameter of the wear crater (substrate) [mm]b external diameter of the wear crater (coating) [mm]D diameter of the ball [mm]Ec Young's modulus of the coating [GPa]Ei Young's modulus of the indenter [GPa]E* reduced Young's modulus [GPa]h total depth of the wear crater (coating+substrate) [mm]hc coating thickness [mm]H hardness [GPa]k wear coefficient [mm3/N.m]kc wear coefficient of the coating [mm3/N.m]ks wear coefficient of the substrate [mm3/N.m]kt total wear coefficient (substrate+coating) [mm3/N.m]n ball rotational speed [rpm]N normal force [N]Q wear rate [mm3/m]R radius of the ball [mm]S sliding distance [m]t test time [s]T tangential force (friction force) [N]v tangential sliding velocity [m/s]V total wear volume (volume of the wear crater:
coating+substrate) [mm3]Vc wear volume of the coating [mm3]Vs wear volume of the substrate [mm3]
Greek lettersα significance levelμ friction coefficientμhigher higher friction coefficientμlower lower friction coefficientνc coefficient of Poisson of the coatingνi coefficient of Poisson of the indenterξ dimensionless constant (it indicates the severity of wear)
(b)
Shaft Specimen Ball
(a)
Normal force – N
Specimen
Fig. 1. Micro-abrasive wear testing by rotating ball: (a) schematic diagram of its princ
225R.C. Cozza / Surface & Coatings Technology 215 (2013) 224–233
have been provided in terms of this type of test, such as: thewearmodetransition [8–10], the wear coefficient (k) [12,13], micro-abrasive wearof coated systems [12–15,18–20], micro-contact modeling of abrasivewear [21–24], ridge formation [16,17,25,26] and angularity of abrasiveparticles [27].
Many works on friction coefficient (μ) during abrasive wear andother types of tests are available in the literature [28–31], but only afew were dedicated to the friction coefficient in micro-abrasive weartests with rotating ball [14,22,32,33]. In particular, Shipway [22] hasanalyzed the friction coefficient in terms of the shape and movementof the abrasive particles, Kusano and Hutchings [32] presented a theo-retical model for friction coefficient in micro-abrasive wear tests withfree ball equipment configuration and Cozza et al. [33] measured thetangential force developed during tests conducted in a fixed ball equip-ment configuration, which allowed direct calculation of the frictioncoefficient by the ratio between the tangential and normal forces.
With the intent to collaboratewith the understanding of the behaviorof the friction coefficient and wear coefficient of thin films in micro-scaleabrasionwear tests by rotative ball, this work has two purposes: to studythe influence of TiN and TiC coatings hardness on the i) friction coefficientand ii) wear coefficient.
2. Experimental details
2.1. Micro-abrasive wear test equipment
Equipment with fixed-ball configuration (Fig. 4a) was used in themicro-scale abrasive wear tests. This equipment was designed and as-sembled with some mechanical and electrical differences from fixed-ball equipments found in the literature [8–12,16,17,25,26,31].
In the test apparatus used in this work, the ball is fixed by two shafts,similar to systems available commercially [10,23], and their rotation(shafts and ball) is controlled by a couple “servo-motor/servo-controller”,which was purchased from Rexroth Bosch Group. This system allows theoperator to select rotational speeds of the ball from 10−5 rpm up to9000 rpm, in both directions (clockwise and counter-clockwise).
(c)
Shaft Specimen Ball
Tangential force – T
Ball
Abrasive slurry
n
iple [1];. (b) “free-ball” configuration [2,3]; (c) “fixed-ball” configuration [1,3,4].
hc
Ball
(b)
h
V (a)
Coating
Substrate
(c)
200 µm b
a Rotation direction
Fig. 2. Images of wear craters generated in coated systems: (a) total wear volume—V (schematic illustration); (b) total crater depth—h and coating thickness—hc (schematic illustration);(c) internal diameter—a and external diameter—b [5].
226 R.C. Cozza / Surface & Coatings Technology 215 (2013) 224–233
Fig. 4b shows the translation system. Part “A” is responsible for thetranslation movement of the specimen, which is forced against theball. This translation movement is made with the help of a secondcoupled “servo-controller/servo-motor” (also provided by RexrothBosch Group); it rotates a screw and the normal force is applied, aspresented in Fig. 4c. The load cell that controls the normal force definedfor the test is located between parts “A” and “B”.
The tangential force (T) generated during the tests is measured bya second load cell, where the specimen is fixed (Fig. 4c), and its valueis shown by a readout system.
“Normal” and “tangential” forces load cells have amaximum capacityof 20 N and an accuracy of 0.004 N.
Finally, with the help of an electronic linear ruler (Fig. 4d–f) and areadout system (Fig. 4g), it is possible to continuously measure thedisplacement of the specimen (or, wear crater depth—h) during thetests, with precision of 1 μm. These electronics instruments wereused due to its accuracy; the value of 1 μm is an excellent precisionto this type of micro-abrasive wear test.
2.2. Materials
Experimentswere conductedwith one ballmade of AISI 52100 steel,which presented a diameter (D) of 25.4 mm (1″). Two specimens ofAISI D2 tool steel (nominal chemical composition of 1.59 wt.% C,0.34 wt.% Mn, 0.29 wt.% Si, 0.02 wt.% P, 0.006 wt.%S, 11.20 wt.% Cr,0.56 wt.% Mo, 0.94 wt.%V), one coated with titanium nitride (TiN)and the other coated with titanium carbide (TiC), were used in thetests. Before the deposition coatings, the AISI D2 tool steel was receivedannealed and after it was submitted to austenitizing at 1080 °C for30 min, quenching in oil, and tempering at 540 °C for 2 h, with subse-quent cooling in air.
The thin films were deposited at the Instituto Tecnológico deAeronáutica (ITA), in a ReactiveDiodeRFMagnetron Sputtering chamber.Table 1 shows the parameters that were kept constant during the
(a) (b)
Fig. 3. Abrasive wear modes: (a) rolling abrasion [8]; (b) grooving abrasion; (c) simultaneouand rolling abrasion at the edges of the wear crater) [3]. (a) and (b): images obtained by Scan(c), the techniques of optical microscopy are better than SEM to show the full image of the
depositions and Table 2 presents the individual deposition conditionsand the thickness (hc) of the thin films. Their reduced Young's modulus(E*) values were calculated based on nanoindentation data and thesevalues allowed the calculation of the Young's modulus of the thin films,through Eq. (3).
1E�
¼ 1−ν2i
Eiþ 1−ν2
c
Ecð3Þ
Ei, νi, Ec and νc are the Young's modulus and the coefficient ofPoisson of the indenter and coating [34,35], respectively, and theirvalues are mentioned in Table 3.
The adhesion of the coatings was analyzed under the Rockwell Cadhesion test, defined by the standard DIN-CEN/TS 1071-8. The qualityindications were between HF1 and HF4, that specify the condition of“sufficient adhesion”.
The abrasive used was black silicon carbide (SiC) with averageparticle size of 5 μm [1,3,4,36,37]. Fig. 5 [36] presents a micrographof the abrasive particles (Fig. 5a) and its particle size distribution(Fig. 5b). The abrasive slurry was prepared as a mixture of 25% ofSiC and 75% of distilled water, in volume. This mixture results in1.045 g of SiC/cm3 of distilled water [1,3,4,33,37].
Table 4 presents the hardness (H) values of the materials used inthis work (substrate, thin films, ball [1,3,4,33,37] and abrasive particles[1,3,4,36,37]). The values for the thin films were calculated based onnanoindentation data, with a Berkovich indenter.
2.3. Micro-abrasive wear tests
Table 5 shows the test conditions selected for the experimentsconducted in this work.
Two values of normal force were defined for the wear experiments:N1=1.25 N and N2=5 N.
(c)100 m
Grooving abrasion
s action of rolling abrasion and grooving abrasion (with grooving abrasion at the centerning Electron Microscope—SEM; (c): image obtained by Optical Microscope. In the casewear crater and the actions of the abrasive wear modes.

227R.C. Cozza / Surface & Coatings Technology 215 (2013) 224–233
The ball rotational speed was n=37.6 rpm, which was previouslyselected by Trezona et al. [8] and Adachi and Hutchings [9,10]. Forn=37.6 rpm and D=25.4 mm (D=1″; R=12.7 mm), the tangentialsliding velocity at the external diameter of the ball is equal tov=0.05 m/s, which probably reduces or eliminates the occurrence ofhydrodynamic effects during the tests [10].
Tests were run for six different sliding distances (S), S1=10 m,S2=16 m, S3=25 m, S4=40 m, S5=63 m and S6=100 m. Thesevalueswere based on the Renard's Series—R20/4 [38]. The correspondenttest times were, respectively, t1=200 s (3 min 20 s), t2=320 s (5 min
(a) Shafts
Sphere
Shafts
Ball
L
Specimen
Load cell for normal force control
(c)
(b)
Part B
Back view of the equipment.
Fig. 4. (a) Micro-abrasive wear test equipment with fixed-ball configuration; (b) translation syschematic illustration; (d) full viewof the electronic linear ruler and support built with profilesof the electronic linear ruler with the part “B”; (g) readout system that works together with thdepth—h) during the tests, with a precision of 1 μm.
20 s), t3=500 s (8 min 20 s), t4=800 s (13 min 20 s), t5=1260 s(21 min) and t6=2000 s (33 min 20 s), as presented in Table 5.
The electronic linear ruler presented in Fig. 4 allowed constantmonitoring of the crater depth (h), and thus the calculation of thewear volume, for each test time, without the need to stop the testfor crater dimension measuring. Three repetitions were conductedfor each value of N, totalizing 12 experiments. Each value of normalforce, N1 and N2, is the same for each test time, from t1 to t6.
The abrasive slurry was continuously agitated andwasmanually fedto the specimen-ball contact, with the help of a dropper, at a rate of one
Load cell for tangential force measurement
inear displacement of the specimen (“h”)
Rotation of the screw(linear displacement of the specimen and application of the normal force)
Part A
stem; (c) general view of the equipment used in the experiments of this work—specimen:“U”; (e) flattened piece of granite fabricated to support the electronic linear ruler; (f) fixinge electronic linear ruler and indicates the displacement of the specimen (or, wear crater

(d)
Support built with profiles “U”.
Linear ruler
Flattened piece of granite fabricated to support the linear ruler.
(e)
(f)
Fixing of the linear ruler with the part “B”.
Linear ruler. (g)
Front view of the
equipment.
Fig. 4 (continued).
228 R.C. Cozza / Surface & Coatings Technology 215 (2013) 224–233
drop every 20 s. This frequency is equal to that selected by Kusano andHutchings [32], for the same type of micro-abrasive wear test.
2.4. Data acquisition and result analysis
The calculation of individual values for the wear volumes of thecoating and the substrate was conducted based on the followingprocedure.
First, for each test time presented in Table 4, the respective craterdepth (h) was measured (with the electronic linear ruler), and fromEq. (4) [8], the total wear volume (V) (coating and substrate) couldbe calculated. R is the radius of the ball and the dimension h (totaldepth of the wear crater) is schematized in Fig. 2b.
V≅πRh2 for h≪ R: ð4Þ
The wear volume of the substrate (Vs) and the wear volume of thecoating (Vc) were calculated from Eqs. (5) and (6), respectively; hc isthe coating thickness (Fig. 2b).
Vs≅πR h−hcð Þ2 for h≪ R ð5Þ
Vc≅πR 2hhc−h2c� �
for h≪ R: ð6Þ
Table 1Constant parameters of deposition of the TiN and TiC coatings.
Parameter Condition
Temperature 350 °CPolarization voltage 0 VRF generator power applied about the magnetron cathode 500 WInitial pressure of Ar 3 mTorrBase pressure 2×10⁻⁶ Torr
The total wear coefficient (kt), the wear coefficient of the substrate(ks) and the wear coefficient of the coating (kc) were calculated fromEqs. (7), (8) and (9), respectively.
kt ¼πRh2
NSð7Þ
ks ¼πR h−hcð Þ2
NSð8Þ
kc ¼πR 2hhc−h2c
� �
NSð9Þ
Values of normal load (N) and tangential force (T) were registeredduring all the tests, once every t=40 s. Then, the friction coefficientwas determined using Eq. (10).
μ ¼ TN
ð10Þ
For each specimen (“AISI D2 tool steel coated with TiN” and “AISID2 tool steel coated with TiC”), the three curves of friction coefficientas a function of the test time (μ= f(t)) obtained under N1=1.25 Nwere compared with the three curves of μ= f(t) obtained underN2=5 N through ANOVA (Analysis of Variance [39]), with a signifi-cance level (α) of 10%.
Table 2Conditions of deposition of the TiN and TiC coatings.
Thin film Flux of N2
[sccm]Flux of CH4
[sccm]
FN2FN2 þFAr
FCH4FCH4 þFAr
Pressure[mTorr]
Time[min]
hc[μm]
TiN 6.0 – 0.23 – 3.5 165.0 2.0TiC – 5.0 – 0.19 2.5 105.0 2.3
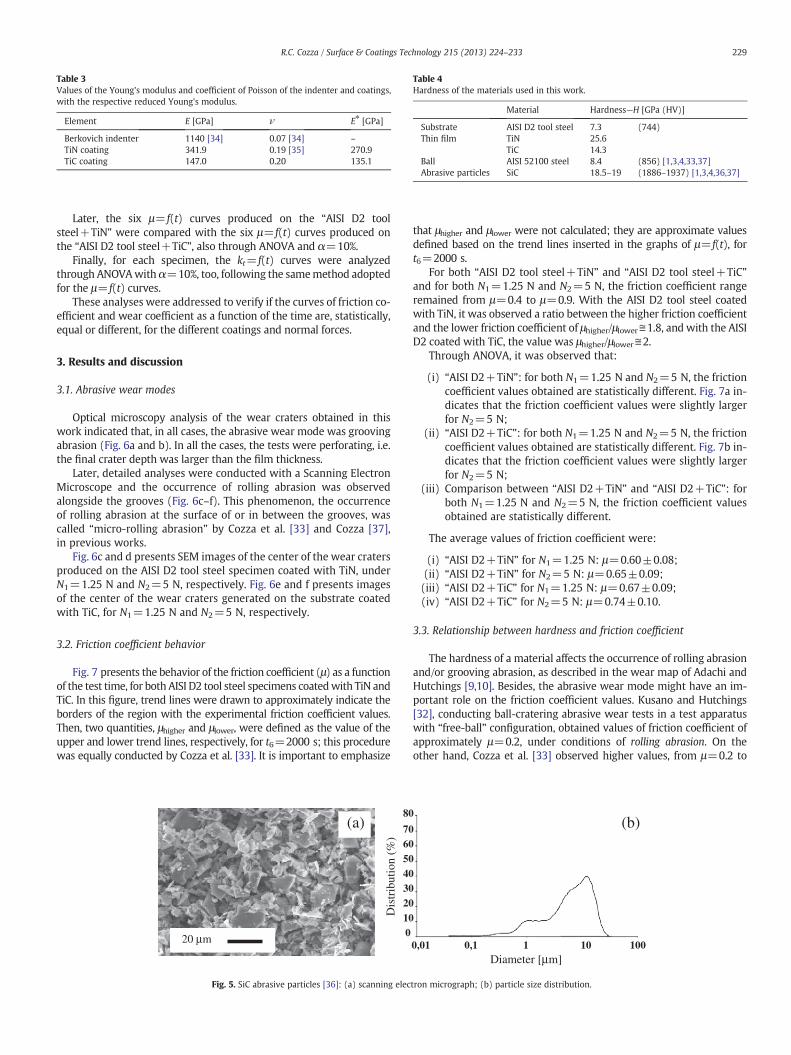
Table 3Values of the Young's modulus and coefficient of Poisson of the indenter and coatings,with the respective reduced Young's modulus.
Element E [GPa] ν E⁎ [GPa]
Berkovich indenter 1140 [34] 0.07 [34] –
TiN coating 341.9 0.19 [35] 270.9TiC coating 147.0 0.20 135.1
Table 4Hardness of the materials used in this work.
Material Hardness—H [GPa (HV)]
Substrate AISI D2 tool steel 7.3 (744)Thin film TiN 25.6
TiC 14.3Ball AISI 52100 steel 8.4 (856) [1,3,4,33,37]Abrasive particles SiC 18.5–19 (1886–1937) [1,3,4,36,37]
229R.C. Cozza / Surface & Coatings Technology 215 (2013) 224–233
Later, the six μ= f(t) curves produced on the “AISI D2 toolsteel+TiN” were compared with the six μ= f(t) curves produced onthe “AISI D2 tool steel+TiC”, also through ANOVA and α=10%.
Finally, for each specimen, the kt= f(t) curves were analyzedthrough ANOVAwith α=10%, too, following the samemethod adoptedfor the μ= f(t) curves.
These analyses were addressed to verify if the curves of friction co-efficient and wear coefficient as a function of the time are, statistically,equal or different, for the different coatings and normal forces.
3. Results and discussion
3.1. Abrasive wear modes
Optical microscopy analysis of the wear craters obtained in thiswork indicated that, in all cases, the abrasive wear mode was groovingabrasion (Fig. 6a and b). In all the cases, the tests were perforating, i.e.the final crater depth was larger than the film thickness.
Later, detailed analyses were conducted with a Scanning ElectronMicroscope and the occurrence of rolling abrasion was observedalongside the grooves (Fig. 6c–f). This phenomenon, the occurrenceof rolling abrasion at the surface of or in between the grooves, wascalled “micro-rolling abrasion” by Cozza et al. [33] and Cozza [37],in previous works.
Fig. 6c and d presents SEM images of the center of the wear cratersproduced on the AISI D2 tool steel specimen coated with TiN, underN1=1.25 N and N2=5 N, respectively. Fig. 6e and f presents imagesof the center of the wear craters generated on the substrate coatedwith TiC, for N1=1.25 N and N2=5 N, respectively.
3.2. Friction coefficient behavior
Fig. 7 presents the behavior of the friction coefficient (μ) as a functionof the test time, for both AISI D2 tool steel specimens coatedwith TiN andTiC. In this figure, trend lines were drawn to approximately indicate theborders of the region with the experimental friction coefficient values.Then, two quantities, μhigher and μlower, were defined as the value of theupper and lower trend lines, respectively, for t6=2000 s; this procedurewas equally conducted by Cozza et al. [33]. It is important to emphasize
(a)
20 µm
Dis
trib
utio
n (%
)
80
706050403020100
Fig. 5. SiC abrasive particles [36]: (a) scanning elec
that μhigher and μlower were not calculated; they are approximate valuesdefined based on the trend lines inserted in the graphs of μ= f(t), fort6=2000 s.
For both “AISI D2 tool steel+TiN” and “AISI D2 tool steel+TiC”and for both N1=1.25 N and N2=5 N, the friction coefficient rangeremained from μ=0.4 to μ=0.9. With the AISI D2 tool steel coatedwith TiN, it was observed a ratio between the higher friction coefficientand the lower friction coefficient of μhigher/μlower≅1.8, and with the AISID2 coated with TiC, the value was μhigher/μlower≅2.
Through ANOVA, it was observed that:
(i) “AISI D2+TiN”: for both N1=1.25 N and N2=5 N, the frictioncoefficient values obtained are statistically different. Fig. 7a in-dicates that the friction coefficient values were slightly largerfor N2=5 N;
(ii) “AISI D2+TiC”: for both N1=1.25 N and N2=5 N, the frictioncoefficient values obtained are statistically different. Fig. 7b in-dicates that the friction coefficient values were slightly largerfor N2=5 N;
(iii) Comparison between “AISI D2+TiN” and “AISI D2+TiC”: forboth N1=1.25 N and N2=5 N, the friction coefficient valuesobtained are statistically different.
The average values of friction coefficient were:
(i) “AISI D2+TiN” for N1=1.25 N: μ=0.60±0.08;(ii) “AISI D2+TiN” for N2=5 N: μ=0.65±0.09;(iii) “AISI D2+TiC” for N1=1.25 N: μ=0.67±0.09;(iv) “AISI D2+TiC” for N2=5 N: μ=0.74±0.10.
3.3. Relationship between hardness and friction coefficient
The hardness of a material affects the occurrence of rolling abrasionand/or grooving abrasion, as described in the wear map of Adachi andHutchings [9,10]. Besides, the abrasive wear mode might have an im-portant role on the friction coefficient values. Kusano and Hutchings[32], conducting ball-cratering abrasive wear tests in a test apparatuswith “free-ball” configuration, obtained values of friction coefficient ofapproximately μ=0.2, under conditions of rolling abrasion. On theother hand, Cozza et al. [33] observed higher values, from μ=0.2 to
0,01 0,1 1 10 100Diameter [µm]
(b)
tron micrograph; (b) particle size distribution.

Table 5Test conditions selected for the micro-abrasive wear experiments.
Test condition ⇒ 1 2 3 4 5 6
Normal force—N1 [N] 1.25 1.25 1.25 1.25 1.25 1.25Normal force—N2 [N] 5 5 5 5 5 5Sliding distance—S [m] 10 16 25 40 63 100Ball rotational speed—n [rpm] 37.6 37.6 37.6 37.6 37.6 37.6Tangential sliding velocity—v [m/s] 0.05 0.05 0.05 0.05 0.05 0.05Test time—t 200 s 320 s 500 s 800 s 1260 s 2000 s
(3 min 20 s) (5 min 20 s) (8 min 20 s) (13 min 20 s) (21 min) (33 min 20 s)
230 R.C. Cozza / Surface & Coatings Technology 215 (2013) 224–233
μ=1.2, in a test devicewith “fixed-ball” configuration and under condi-tions of grooving abrasion.
The range of friction coefficient values obtained in this work (fromμ=0.4 to μ=0.9) is included in the range obtained in the previouswork of Cozza et al. [33] (from μ=0.2 to μ=1.2) and it may be relatedwith the dominant occurrence of grooving abrasion.
In terms of the specimens analyzed in this work, the substrate(AISI D2 tool steel) was the same for both TiN and TiC coated speci-mens and then it is probably correct to consider that its hardness
(c)
(e)
(a)
Fig. 6.Wear craters obtained in the experiments. (a) AISI D2 tool steel with TiN and (b) AISInote only the occurrence of grooving abrasion. (c)–(f): Occurrence of micro-rolling abrasionormal force of N1=1.25 N and N2=5 N, respectively; (e) and (f): AISI D2 tool steel coateS6=100 m.
had the same influence on the occurrence of the abrasive wearmode (grooving abrasion in all experiments) and on the friction co-efficient behavior. In fact, although the curves μ= f(t) are statisticallydifferent, the average values are similar (“AISI D2 tool steel+TiN”:0.6 and 0.65, to 1.25 N and 5 N, respectively; “AISI D2 toolsteel+TiC”: 0.67 and 0.74, to 1.25 N and 5 N, respectively). Thus,in this work, the hardness of the coatings did not have a significantinfluence on the friction coefficient values as a function of the testtime.
(d)
(f)
(b)
D2 tool steel with TiC; images obtained with Optical Microscope, where it is possible ton, as related in previous works [33,37]. (c) and (d): AISI D2 tool steel coated with TiN,d with TiC, normal force of N1=1.25 N and N2=5 N, respectively. Sliding distance of

0.0
0.2
0.4
0.6
0.8
1.0
1.2
0 250 500 750 1000 1250 1500 1750 2000 2250
Fric
tion
coef
fici
ent -
µ
Test time -t [s]
µhigher
µ lower
(a)N1 = 1.25 N
N2 = 5 N TiN
Fric
tion
coef
fici
ent -
µ
Test time -t [s]
0.0
0.2
0.4
0.6
0.8
1.0
1.2
0 250 500 750 1000 1250 1500 1750 2000 2250
µhigher
µ lower
(b)N1 = 1.25 N
N2 = 5 N TiC
Fig. 7. Friction coefficient as a function of the test time. AISI D2 tool steel coated with (a) TiN and (b) TiC, against abrasive particles of SiC (average particle size of 5 μm) and ball ofAISI 52100 steel.
231R.C. Cozza / Surface & Coatings Technology 215 (2013) 224–233
In this work, Analysis of Variance was not addressed to friction co-efficient as a function of the hardness of the substrate because thesubstrate material was the same (AISI D2 tool steel) for both TiNand TiC coatings.
3.4. Wear coefficient behavior
Fig. 8 presents the behavior of the wear coefficient as a function ofthe test time, for the “AISI D2 tool steel coated with TiN” and “AISI D2tool steel coated with TiC”. This figure shows the total wear coefficient(kt) (substrate+coating), the wear coefficient of the substrate (ks)and the wear coefficient of the coating (kc).
Through ANOVA, it was observed that:
(i) For N1=1.25 N: the wear coefficient values obtained are sta-tistically different, for TiN and TiC coatings. Fig. 8a indicatesthat the wear coefficient values were larger for the TiC coatings(lower hardness);
(ii) ForN2=5 N: thewear coefficient values obtained are statisticallydifferent, for TiN and TiC coatings. Fig. 8b indicates that the wearcoefficient values were larger for the TiC coatings (lower hard-ness);
(iii) Comparison between “AISI D2+TiN” and “AISI D2+TiC”: for bothN1=1.25 N andN2=5 N thewear coefficient values obtained arestatistically different.
For both “AISI D2 tool steel+TiN” and “AISI D2 tool steel+TiC”,the application of the normal force N2=5 N resulted in higher valuesof kt, ks and kc than with N1=1.25 N, which is a result in qualitativeagreement with the literature [11,40]; higher normal forces favorhigher wear coefficients and lower normal forces favor lower wear
coefficients. Besides, with the increase of the thin film hardness, thewear coefficient decreased, which is also in qualitative agreementwith the Archard's law (Eq. (11) [41]).
Q ¼ ξNH: ð11Þ
Where Q is the rate of wear and ξ is a dimensionless constant thatindicate the severity of wear [41].
Analyzing Fig. 8a and b, it is possible to note that, for both TiN and TiCcoatings, the wear coefficients of the coatings (kc - TiC and kc - TiN) aresimilar for the two values of normal force. This similarity is related to asimilarity infilm thickness (2.0 μmand2.3 μm,TiN andTiC, respectively),which provides similarwear volumes. Nevertheless, it is important to no-tice that, from approximately 400 s, the wear coefficient kc of the coatingwith the lowest hardness (TiC)was consistently higher than thatwith thehighest hardness (TiN).
Each specimen presented a distinct behavior in terms of the wearcoefficient (kt and ks) as a function of the test time. For the “AISI D2tool steel+TiN”, the total wear coefficient and the wear coefficientof the substrate decreased as a function of the test time, while the ktand ks values for the “AISI D2 tool steel+TiC” presented a maximumpoint at about t4=800 s. In micro-abrasive wear tests it is usuallyrecommended to conduct a comparison between two tested materialsonly after the steady state of wear is achieved, i.e. after the pointwhere no significant variation in wear coefficient is observed as a func-tion of time. This idea opposes a direct comparison between the valuesof ks and kt in Fig. 8, since the steady state of wear was not achieved insome cases, especially with the TiC-coated specimen. On the otherhand, some work must be dedicated to the understanding of why two

0.00
0.05
0.10
0.15
0.20
0.25
0.30
0.35
0.40
0.45
0.50
0 200 400 600 800 1000 1200 1400 1600 1800 2000
(a)
Wea
r co
effi
cien
t -k
[10-
3 m
m3 /
N.m
]
Test time -t [s]
kt - TiC kt - TiN ks - TiC ks - TiN
kc - TiC
kc - TiN
kt - TiC
kt - TiN
ks - TiC
ks - TiN
kc - TiC kc - TiN
Test time -t [s]
0.00
0.05
0.10
0.15
0.20
0.25
0.30
0.35
0.40
0.45
0.50
0 200 400 600 800 1000 1200 1400 1600 1800 2000
(b)
Wea
r co
effi
cien
t - k
[10
-3 m
m3 /
N.m
]
Fig. 8. Wear coefficient as a function of the test time. (a) N1=1.25 N—TiN and TiC coatings; (b) N2=5 N—TiN and TiC coatings.
232 R.C. Cozza / Surface & Coatings Technology 215 (2013) 224–233
coated specimens with the same substrate material presented suchdifference in behavior.
4. Conclusions
The results obtained in this work have indicated that:
(1) The hardness of the coatings did not have a significant influenceon the friction coefficient values; they remained in the samerange, from μ=0.4 to μ=0.9, and with average values between0.6 and 0.74. Besides, for both “AISI D2 tool steel+TiN” and“AISI D2 tool steel+TiC” the friction coefficient curvespresented, practically, the same behavior, independent of thehardness of the coatings;
(2) The TiN-coated specimen (higher hardness) presented lowerwearcoefficient values (kt, ks and kc) than the TiC-coated specimen. Interms of the wear coefficient of the coating kc, the difference maybe associated eitherwith thehigher thickness or to the lowerhard-ness of the TiC coating.
Acknowledgments
The author gratefully acknowledges FAPESP—São Paulo ResearchSupport Foundation, for the full financial support through ProjectNumber 2012/00930-5 for the oral presentation of this paper at the39th ICMCTF—International Conference on Metallurgical Coatings &Thin Films, Prof. Maria Helena Santos Takeda, from PolytechnicSchool of the University of São Paulo, for the help in the statistics
analysis, Prof. José Carlos Bressiani, from Nuclear and Energetic Re-searches Institute, for the silicon carbide and the abrasive particlesize distribution analysis, Paulo Zanini, Rafael Rozolen and VitorBenkard Lira, from Rexroth Bosch Group, for the help in the start-upof the servo-motors and servo-controllers.
References
[1] R.C. Cozza, M.Sc. Dissertation, Polytechnic School of the University of São Paulo,São Paulo - SP, Brazil, 2006, 217 p. (Available online: http://www.teses.usp.br/).
[2] W.M. da Silva, R. Binder, J.D.B. de Mello, Wear 258 (2005) 166.[3] R.C. Cozza, J.D.B. de Mello, D.K. Tanaka, R.M. Souza, Wear 263 (2007) 111.[4] R.C. Cozza, D.K. Tanaka, R.M. Souza, Surf. Coat.Technol. 201 (2006) 4242.[5] R.C. Cozza, R.C. Cozza, A.A.C. Recco, A.P. Tschiptschin, R.M. Souza, D.K. Tanaka,
Tecnol. Metal. Mater. Miner. São Paulo 6 (4) (2010) 237 abr.-jun. (Available online:http://www.abmbrasil.com.br/).
[6] D.A. Kelly, I.M. Hutchings, Wear 250 (2001) 76.[7] K.L. Rutherford, I.M. Hutchings, J. Test. Eval. 25 (2) (1997) 250.[8] R.I. Trezona, D.N. Allsopp, I.M. Hutchings, Wear 225–229 (1999) 205.[9] K. Adachi, I.M. Hutchings, Wear 255 (2003) 23.
[10] K. Adachi, I.M. Hutchings, Wear 258 (2005) 318.[11] K. Bose, R.J.K. Wood, Wear 258 (2005) 322.[12] J.C.A. Batista, A. Matthews, C. Godoy, Surf. Coat.Technol. 142–144 (2001) 1137.[13] J.O. Bello, R.J.K. Wood, Wear 258 (2005) 294.[14] K.L. Rutherford, I.M. Hutchings, Surf. Coat.Technol. 79 (1996) 231.[15] A. Ramalho, Surf. Coat.Technol. 197 (2005) 358.[16] P.H. Shipway, C.J.B. Hodge, Wear 237 (2000) 90.[17] M.G. Gee, A. Gant, I.M. Hutchings, R. Bethke, K. Schiffman, K. Van Acker, S. Poulat,
Y. Gachon, J. von Stebut, Wear 255 (2003) 1.[18] I.M. Hutchings, Tribol. Int. 31 (1–3) (1998) 5.[19] D.N. Allsopp, I.M. Hutchings, Wear 251 (2001) 1308.[20] K.L. Rutherford, I.M. Hutchings, Tribol. Lett. 2 (1996) 1.[21] J.A. Williams, Wear 225–229 (1999) 1.[22] P.H. Shipway, Wear 257 (2004) 984.[23] P.E. Sinnett-Jones, J.A. Wharton, R.J.K. Wood, Wear 259 (2005) 898.

233R.C. Cozza / Surface & Coatings Technology 215 (2013) 224–233
[24] J.A. Williams, A.M. Hyncica, J. Phys. D: Appl. Phys. 25 (1992) A81.[25] R.I. Trezona, I.M. Hutchings, Wear 233–235 (1999) 209.[26] D.N. Allsopp, R.I. Trezona, I.M. Hutchings, Tribol. Lett. 5 (1998) 259.[27] G.B. Stachowiak, G.W. Stachowiak, Wear 256 (2004) 600.[28] Y. Xie, J.A. Williams, Wear 196 (1996) 21.[29] A. Neville, V. Kollia-Rafailidi, Wear 252 (2002) 227.[30] S. Dhanasekaran, R. Gnanamoorthy, Wear 262 (2007) 617.[31] L. Ceschini, G. Palombarini, G. Sambogna, D. Firrao, G. Scavino, G. Ubertalli, Tribol.
Int. 39 (2006) 748.[32] Y. Kusano, I.M. Hutchings, Wear 258 (2005) 313.[33] R.C. Cozza, D.K. Tanaka, R.M. Souza, Wear 267 (2009) 61.[34] G.M. Pharr, Mater. Sci. Eng. A 253 (1998) 151.
[35] R.F. Bunshah, HANDBOOK of Hard Coatings—Deposition Technologies, Propertiesand Applications, Materials Science and Processing Technology Series, NoyesPublications, William Andrew Publishing, LLC, Norwich, New York, USA, 2001.
[36] V.A. Izhevskyi, L.A. Genova, J.C. Bressiani, A.H.A. Bressiani, Cerâmica 50 (2004) 261.[37] R.C. Cozza, Ph.D. Thesis, Polytechnic School of the University of São Paulo, São
Paulo - SP, Brazil, 2011, 327 p. (Available online: http://www.teses.usp.br/).[38] Standard DIN 804 - Edition: March/1977.[39] G.E.P. Box, J.S. Hunter,W.G. Hunter, Statistics for Experimenters—Design, Innovation,
and Discovery, 2nd Edition JohnWiley & Sons, Inc., Hoboken, New Jersey, USA, 2005.[40] K. Bose, R.J.K. Wood, Diam. Relat. Mater. 12 (2003) 753.[41] I.M. Hutchings, Tribology—Friction and Wear of Engineering Materials, 7th edition
Edward Arnold, a division of Hodder Headline PLC, London, UK, 1992.