a study on atmospheric halo visualization - … · chapter 2 halo phenomena 2.1 general description...
TRANSCRIPT

A Study on Atmospheric Halo Visualization
Sung Min Hong and Gladimir Baranoski
Technical Report CS-2003-26
September, 2003
School of Computer ScienceUniversity of Waterloo
200 University venue WestWaterloo, Ontario, Canada N2L 3G1

2

Contents
1 Introduction 3
2 Halo Phenomena 52.1 General description of halo phenomena . . . . . . . . . . . . . . 52.2 Ice crystal model and halo phenomena . . . . . . . . . . . . . . 6
3 Survey of Halo Simulation 153.1 History of halo simulation . . . . . . . . . . . . . . . . . . . . . 153.2 Basic Monte Carlo Methods . . . . . . . . . . . . . . . . . . . . 163.3 Extended Monte Carlo Methods . . . . . . . . . . . . . . . . . 193.4 Photo Realistic Rendering . . . . . . . . . . . . . . . . . . . . . 21
4 Implementation 254.1 Ice crystal modelling . . . . . . . . . . . . . . . . . . . . . . . . 254.2 Sunlight modelling . . . . . . . . . . . . . . . . . . . . . . . . . 264.3 Parametrization of ice crystal orientation . . . . . . . . . . . . 274.4 Monte Carlo ray tracing . . . . . . . . . . . . . . . . . . . . . . 29
5 Application 315.1 Initial setup . . . . . . . . . . . . . . . . . . . . . . . . . . . . . 315.2 22◦ halo simulation . . . . . . . . . . . . . . . . . . . . . . . . . 325.3 Parhelion and parhelic circle simulation . . . . . . . . . . . . . 335.4 Composite halo simulation . . . . . . . . . . . . . . . . . . . . . 33
6 Conclusion 37
A Reflectance of Dielectrics 41
i

ii CONTENTS

List of Figures
2.1 22◦ halo at the South Pole redrawn from [15]. . . . . . . . . . . 62.2 Some crystal collected at the South Pole redrawn from [15]. . . 62.3 Frequent halos redrawn from [15]. . . . . . . . . . . . . . . . . . 72.4 Ice crystal and light ray directions redrawn from [5] . . . . . . 72.5 Mechanism of 22◦ halos redrawn from [7]. . . . . . . . . . . . . 82.6 Deviation angles for 22◦ and 46◦ halos redrawn from [10]. . . . 92.7 Refractive index vs. wavelength and temperature redrawn from
[4]. . . . . . . . . . . . . . . . . . . . . . . . . . . . . . . . . . . 102.8 22◦ halos and viewing mechanism redrawn from [7]. . . . . . . 112.9 Light pass in ice crystal and parhelia photo redrawn from [7]. . 122.10 Light path for circumzenithal arc and photo redrawn from [7]. . 132.11 Typical light paths for parhelic circle redrawn from [15]. . . . . 132.12 Viewing mechanism [7] and parhelic circle photo [15]. . . . . . . 14
3.1 Typical paths of sunrays through an ice crystal . . . . . . . . . 183.2 22◦ halo image by the Monte Carlo ray tracing redrawn from [12] 193.3 Model of ray tracing through ice crystal layer redrawn from [12] 203.4 Complex halo image by multiple scattering redrawn from [16] . 213.5 Computer generated 22◦ halo redrawn from [9] . . . . . . . . . 223.6 Computer generated halo in outdoor scene redrawn from [6] . . 23
4.1 Parametric model of ice crystal . . . . . . . . . . . . . . . . . . 264.2 Sunlight model and projection circle . . . . . . . . . . . . . . . 27
5.1 22◦ halo vs. the Sun’s elevation (a) 0◦ (b) 30◦ (c) 60◦ (d) 90◦ . 325.2 Parhelia vs. the Sun’s elevation (a) 0◦ (b) 10◦ (c) 20◦ (d) 30◦
(e) 40◦ (f) 50◦ . . . . . . . . . . . . . . . . . . . . . . . . . . . 345.3 Top: Halo photo taken at the South Pole by Tape [15]; Bottom:
Composite halo simulation . . . . . . . . . . . . . . . . . . . . . 355.4 Top: upper tangent arc photo taken by Tape [15]; Bottom: up-
per tangent arc simulation . . . . . . . . . . . . . . . . . . . . . 36
1

2 LIST OF FIGURES
A.1 Incoming waves whose E-fields are normal and parallel to theplane of incidence redrawn from [8]. . . . . . . . . . . . . . . . 41

Chapter 1
Introduction
Halos, arcs or spots of light in the sky, are caused by the play of sunlight onice crystals in the atmosphere. In this project, a visualization model of theatmospheric halos is presented and demonstrated in the context of a MonteCarlo ray tracer. The model includes the geometric optics of hexagonal typecrystals.
The impact of such simulations of natural phenomena has been to providestunning confirmation of several extraordinary phenomena and extend our un-derstanding of the nature. The deep understanding helps the improvement ofmany useful technology like the remote sensing of the atmosphere, then even-tually improve our lives. In addition, increased computing power and plenty ofmeasured atmospheric data have made it feasible to create physically correcthalo images.
The structure of this report is outlined as follows. Chapter 2 explains whatis the halo phenomena and what kind of halos exist. Chapter 3 gives briefdescriptions of history, widely used ray tracing methods and current trendsof the halo simulation. Chapter 4 presents a Monte Carlo ray tracer basedon the idea of Pattloch and Trankle [12]. The ray tracer uses a wavelengthdependent refractive index for an ice crystal [3, 4]. Chapter 5 demonstratessome simulation results obtained by the method developed in chapter 4.
3

4 CHAPTER 1. INTRODUCTION

Chapter 2
Halo Phenomena
2.1 General description of halo phenomena
A halo is a luminous ring around the Sun or Moon. When it appears aroundthe Sun, it is a solar halo; when it forms around the Moon, it is a lunar halo.Figure 2.1 shows various halo phenomena at the South Pole, which was takenby Tape [15]. Halos are produced all the year round from tropics to the polesby tiny ice crystals in cirrus clouds1 5 to 10km high in the always cold uppertroposphere2. Sometimes in very cold weather they are also formed by crystalsclose to ground level. Ice crystals appear in front of buildings or other objects,and the association of halos with ice crystals becomes obvious.
The crystals behave like jewels, refracting and reflecting sunlight betweentheir faces, sending light rays in particular directions. Regardless of their overallproportions, all the crystals have identical interfacial angles, which come froma deeper crystalline order at molecular scale. The submicroscopic order andsymmetry give us regular and predictable halos. Walter Tape [15] collected theice crystals when he took the picture, which is shown in figure 2.2.
Figure 2.2 shows the simple hexagonal shapes that produce a surprisingvariety of optical effects in the sky. The largest hexagonal crystal in that pic-ture is about 0.5mm across, but typical dimensions of many of those crystalsare 0.05 to 0.1mm [7]. When their ice crystals are smaller than 0.01mm, lightis significantly diffracted, so halos are weak and diffuse. Crystals larger than0.05mm refract and reflect light cleanly to produce halos. The sharpest halosoccur when the crystals have precise alignments and this needs crystals largerthan 0.1mm. However, the largest crystals of 1mm or more are rarely of suffi-cient optical quality and have defects which spoil their halos. These crystals arecommonly aligned in particular directions. This results from the aerodynamic
1principal clouds type; a high elevation, wispy cloud without shadows.2The troposphere is the lowest layer of Earth’s atmosphere and site of all weather on
Earth.
5

6 CHAPTER 2. HALO PHENOMENA
Figure 2.1: 22◦ halo at the South Pole redrawn from [15].
drag forces on crystals as they fall slowly downwards.
2.2 Ice crystal model and halo phenomena
Greenler [7] showed that all the halo phenomena results from reflecting fromand refracting through the hexagonal ice crystal as they take on different shapesand orientations. The refraction halos show the partitioning of the incominglight into ice crystals due to the wavelength depended refraction leading to
Figure 2.2: Some crystal collected at the South Pole redrawn from [15].

2.2. ICE CRYSTAL MODEL AND HALO PHENOMENA 7
Figure 2.3: Frequent halos redrawn from [15].
colorful halos. These kinds of halos include 22◦ halo, parhelia (sundogs), cir-cumzenithal halo and tangent arcs. On the other hand, the color of the reflec-tion halos is unchanged leading to white, however when the sun is low in itselevation, the reflection halos caused by the sun become reddish. These latterhalos include parhelic circle, pillar and so forth. Figure 2.3 shows how thesehalos can be seen in the sky.
A. Refraction halos
Figure 2.4: Ice crystal and light ray directions redrawn from [5]
Figure 2.4 shows a simplified simulation model for a hexagonal ice crystal.If the ratio of axial height to radius of its base is less than 2, the crystal iscalled a plate, otherwise called a pencil [7]. Greener [7] identified the sunlight

8 CHAPTER 2. HALO PHENOMENA
ray paths for various ice crystals and corresponding halos. Glassner [5] clas-sified the paths of transmission paths through the crystal into five differenttypes, which are illustrated in figure 2.4; “LL” for a path from a lid to anotherlid, “LS” for a path from a lid to a side face, “SD” for a path from a side to adirectly adjacent side face, “SF” for a path from a side to a next side of a directneighbor and “SO” for a path from a side to an opposite side. These light pathsare reversible. Since the refraction coefficient of ice is approximately 1.31 andthe neighboring side faces make 120◦ angle, there exist some important rela-tionships between incident light and refracted light, which are responsible forthe halo phenomena. Paths connecting neighbor sides, that is, “SD” can notoccur in hexagonal type ice crystals because total internal reflection3 occursinside the crystals. “LL” and “SO” paths do not change light paths. The re-maining light paths, “LS” and “SF” explain various halo phenomena; accordingto ice crystal facial orientation with respect to the incident rays, the rays willdeflect them to a lesser or greater extent [7].
D
Oblique view Section view
Light ray
Figure 2.5: Mechanism of 22◦ halos redrawn from [7].
22◦ and 46◦ halos
22◦ halos are visible all over the world and throughout the year. Millionsof ice crystals glint down from 3 to 5 mile high cirrostratus4 haze to form ahalo. figure 2.5 shows that the “SF” rays in figure 2.4 gives these halos. Therays pass randomly aligned hexagonal prism crystal with faces inclined at 60◦
to each other. The random orientations form a circular halo. Rays passingthrough two of their side faces are deflected through angles from 22◦ up to a
3For incident angles greater than or equal to a critical angle, all the incoming energy isreflected back into the incident medium.
4principal cloud type: a high elevation fibrous cloud of large extent without shadows.

2.2. ICE CRYSTAL MODEL AND HALO PHENOMENA 9
little bit over 40◦, which are expressed as “D” in figure 2.6. Skew rays, whichare not in a plane perpendicular to the prism axis, are deflected even further[7].
Figure 2.6: Deviation angles for 22◦ and 46◦ halos redrawn from [10].
Figure 2.6 shows why most rays, however, are deflected through anglesclose to 22◦. This is the so-called ”minimum deviation” phenomenon. Thelarge plateau around the minimum deviation angle in figure 2.6 explaines thatrays cluster together near to the angle where they are deviated least [7]. Nearthe minimum-deviation orientation, the deviation of the light ray is sensitiveto small rotations of the crystal; that is, the direction of the emerging raychanges very little as the crystal is rotated several degrees either way from theminimum position. As a consequence, when light rays pass through crystalswith all possible orientations, there is a concentration of rays deviated by anglesnear 22◦. This gives 22◦ halos a bright inner edge. Rays deflected more than 22◦
produce the outer halo light which fades away with increasing angular distancefrom the Sun. Unlike 22◦ halos, light rays from top (bottom) to side or fromside to top (bottom) are responsible for 46◦ halos. As shown in figure 2.6,the allowable incident angle range of 46◦ halos is much smaller than that of

10 CHAPTER 2. HALO PHENOMENA
22◦ halos, so the brightness of 46◦ halos is lower than that of 22◦ halos. Thisexplains that 46◦ halos are frequently invisible while 22◦ halos are bright.
300400
500600
700800
−100
−80
−60
−40
−20
01.32
1.33
1.34
1.35
1.36
1.37
wavelength (µm)
Refractive index of ice
temperature (Celsius)
Figure 2.7: Refractive index vs. wavelength and temperature redrawn from [4].
Figure 2.7 shows the refractive index variation of ice as the wavelength ofthe incident light and the temperature change. Since the sunlight is composedof various wavelength components, every ice crystal plays a role of a prismfor the sunlight. According to figure 2.7, red light component having longwavelength is refracted less strongly than other color components because theice crystal has a smaller refractive index for long wavelength light than thatfor short wavelength components. Therefore, the halo’s inner edge is red huedsometimes tapering away through oranges and yellows to blue. All but red areindistinct and washed out because they overlap considerably [11].
To see a ray of sunlight deviated by 22◦ directly to our eye, we would lookat an angle 22◦ away from the Sun. The result of such refraction by a largenumber of ice crystals, tumbling through the air with random orientations, isa circle around the sun with the angular radius of the inner edge equal to 22◦.Figure 2.8 shows the viewing mechanism of 22◦ halos and its photo by [7].

2.2. ICE CRYSTAL MODEL AND HALO PHENOMENA 11
Figure 2.8: 22◦ halos and viewing mechanism redrawn from [7].
Parhelion (sundog)
Sundogs (parhelia, mock suns) are the second most frequent of the halos. Icecrystals do not always fall with random orientations. Plate crystals will tend tofall with the axis connecting its flat bases vertical, the flat bases oriented nearlyhorizontally. With the sun low in the sky, these plate crystals would have theproper orientation to refract light to the observer from the sides of the halo,but not from the top of the halo. The better the orientation of the ice crystals,the smaller and brighter are the resulting spots on either side of the sun. Insome cases they can be quite bright and of an apparent size comparable to thatof the sun. Parhelia are often brightly colored because the crystals refract eachcolor by a different amount [7]. Figure 2.9 shows a typical light path in an icecrystal and a photo of sundog.
The colors most visible in halos are the longer wavelengths: red, orange,and yellow. There are three reasons for this [10]. First, dispersion5 is leastfor these wavelengths and they are not spread over nearly as large an anglein the sky as the short wavelengths are. This makes them brighter than theshort wavelengths, which is well explained in figure 2.6. Second, most halosare seen against the bluish background sky. The greens and blues blend in,leaving the reds and oranges showing the strongest color contrast. Third, whenthe sun is low in the sky, it usually appears yellow-orange in color due toRayleigh scattering and absorption. The ice crystals receive more of the longerwavelength than the shorter ones, and scatter them accordingly.
For skew rays, the angle of minimum deviation is greater than for normal
5In this context, this refers to separation of sunlight into colors by refraction

12 CHAPTER 2. HALO PHENOMENA
Figure 2.9: Light pass in ice crystal and parhelia photo redrawn from [7].
rays, and the angle increases as the skew increases. This effect is manifestedin the distance of parhelia from the Sun for different elevations of the Sun. Iffalling plate crystals are oriented with their bases horizontal, light from the sunon the horizon will pass through their normal plane and produce parhelia withan inner edge 22◦ away from the Sun. But as the Sun’s elevation increases, theray pass through these oriented plate crystals with more and more skew, andthe resulting parhelia appear farther and farther from the sun. The effect islarge enough that the parhelia can easily be seen to lie outside the 22◦ halo formoderate sun elevation. The simulation result will explains this phenomenonin chapter 5.
Circumzenithal arc
Like parhelia, circumzenithal arc is generated by plate crystals. The cir-cumzenithal arc is colored near the top. The arc appears about 25 days a year,with spectral colors which are sometimes well separated like a rainbow. As itsname suggests, it lies on a circle centered at the zenith. Computer simulationsshow parhelia and a circumzenithal arc caused by plate crystals falling withroughly horizontal orientations [15]. Down-coming Sun’s rays enter the upper-most horizontal face and leave through a vertical side face. The refraction ofrays nearly parallel to faces inclined at 90◦ produces very pure in the contextof wavelength and well separated prismatic colors. When the sun is higherthan about 32.3◦, the rays cannot leave the side face but are instead totallyinternally reflected. Figure 2.10 shows a typical light path in a crystal and thebright colors in the circumzenithal arc.
B. Reflection halos

2.2. ICE CRYSTAL MODEL AND HALO PHENOMENA 13
Figure 2.10: Light path for circumzenithal arc and photo redrawn from [7].
There is often a white band at sun’s altitude, so white that it is sometimeseasy to mistake it for cloud. This is the parhelic circle. When complete it goesall around the sky. Complete circles are rarities but sections extending outwardfrom sundogs are quite common. It is formed by millions of ice crystals withvertical faces each mirroring the sun around the sky. This can be generated byexternally reflected rays without rays entering the crystal or internally reflectedrays. The simplest ray path is that of a single external reflection but there aremany others, some most intricate. There can be no light color separation dueto refraction, which is a kind of prism effect and so the arc is almost completelywithout color.
Figure 2.11: Typical light paths for parhelic circle redrawn from [15].
Figure 2.11 shows some reflection light paths responsible for the parheliccircle. External reflections contribute most near to the sun. Rays reflectedonce inside the crystals produce much of the halo intensity. Opposite the sun,rays internally reflected twice or even more add their brightness. Relativecontributions depend on solar altitude and the crystal thickness.
A vertical mirror that intercepts a ray of light coming from the sun with

14 CHAPTER 2. HALO PHENOMENA
30◦ above the horizon reflects the light in a direction of 30◦ below the horizon.An observer would look up to see the ray coming from a direction of 30◦ abovethe horizon. As the vertical mirror addresses different directions around thehorizon, it reflects the light in different azimuth directions, but always directsthe light downward at an angle of 30◦ [7]. The result of a collection of verticalmirrors with all other possible orientations is a circle of white light extendingaround the sky at constant elevation above the horizon, passing thorough thesun. Figure 2.12 shows viewing mechanism and its photo [7, 15].
Figure 2.12: Viewing mechanism [7] and parhelic circle photo [15].

Chapter 3
Survey of Halo Simulation
3.1 History of halo simulation
For many halos, the orientations and ray paths have long been known, thanksto the ingenuity of many scientists over the past several centuries long beforecomputers are used [15]. In the late 17th century, E. Mariotte showed howrandomly oriented crystals would cause the 22◦ halo and how crystals withaxes vertical would cause the parhelia(sundogs). In the mid-nineteenth M. A.Bravais described crystal orientations and ray paths for many common halos,and he calculated halo shapes as a function of sun elevation. In 1925, Wegenershowed how to calculate the shapes of most of the known halos, illustrating hisresults with detailed plots of many infrequent halos. These earlier investigatorsused ray tracing methods with paper and pencil.
In 1980 Greenler [7] published his elegant Rainbows, Halos, and Glories.In his book, he explained how to apply a path tracing method to simulatehalos with a computer. He got the intensity variations of simple halos andby superposing them, was able to describe complex halo phenomena. In 1984Pattloch and Trankle [12] introduced a hit and miss Monte Carlo method todisplay halos, which uses the Fresnel equations as reflection and transmissionprobabilities. With the method, they simulated infrequent halos, which can beexplained by complex ice crystal displays. The impact of these simulations hasbeen to provide stunning confirmation of several extraordinary halo displaysand to resolve much of the controversy regarding the cause of the infrequenthalos.
The early Monte Carlo simulation employed the assumption that each lightbeam strikes a perfectly formed crystal and then suffers no further scatteringafterward. Trankle and Greenler [16] included multiple scattering in cloudsof finite optical depth to see if it could explain any unusual halo phenom-ena. Although they found that multiple scattering could account for a fewrare phenomena such as parhelia with subparhelia, which mean several subsize
15

16 CHAPTER 3. SURVEY OF HALO SIMULATION
sundogs tailing the primary sundog, its primary effect is to wash out the halobeams. Takano and Liou [14] also considered multiple scattering effects on thevisualization of halos. They computed halo phenomena caused by horizontallyoriented plate and column ice crystals and showed the multiple scattering isresponsible for some infrequent halos like an anthelion1. In addition to multi-ple scattering effects, Gedzelman [3] extends the computer simulations of halosby including color. He used an wavelength dependent index of refraction butexcluded effects of polarization.
The proposed method mentioned above are mainly focused on the visual-ization as scientific purpose to identify what factors make halos and how thehalos can be seen. Therefore, the final images of computer simulation are usu-ally collections of coarse dots, which are good enough for verification purposesbut far from realistic halo images. Glassner tried to overcome this gap, so hetried various blurring methods to transform dotted images into smooth images[5, 4]. Jackel and Walter proposed an atmospheric rendering method in or-der to obtain realistic images in terms of Mie scattering and applied a parallelcomputation strategy for individual wavelength calculations [9]. And they putcomputer generated halo images into outdoor scenes which were also made bya computer. On the other hand, Gonzato and Marchand presented a techniquefor generating photo-realistic pictures of halos [6]. They indicated that Glass-ner’s blurring method to obtain smooth halo images is not proper because ittries to apply an uniform reconstruction technique for a non-uniform sampling.Their method is based on an algorithm for reconstructing the uniform versionof images from non-uniform samplings. With the technique, they obtainednatural looking computer generated halos.
3.2 Basic Monte Carlo Methods
A. The Inverse Ray Tracing Algorithm
Greenler provided the physical foundation of almost all halo simulationalgorithms [7]. He proposed to consider the case of a ray of sun being deviatedby on single ice crystal during its travel through an ice cloud including thecrystal. The problem is to compute the quantity of light passing through eachpixel of the image representing the simulated halo. From the complexity pointof view, using a standard ray tracing algorithm is not feasible. Indeed, for aray leaving the eye and passing through the pixel, the algorithm has to testall the orientations in order to find the ones which deviate the ray into thedirection of the light source. Greenler proposed to use an inverse ray tracingalgorithm instead. Knowing the direction of the ray of light leaving the crystalis equivalent to knowing where to look in the sky for light coming to your eye
1A luminous white spot that appears on the parhelic circle and 180◦ in azimuth awayfrom the sun.

3.2. BASIC MONTE CARLO METHODS 17
from the crystal with that particular orientation. His algorithm is presented asthe following 4 steps.
Step 1. Choose one crystal and select its orientation from possible randomorientations
Step 2. Cast a ray from a light source like the sun to the crystal and calculatethe deviation of ray.
Step 3. Place the crystal on a proper location in order to see the light rayfrom the light source. This positioning is simply done by plotting a lightpoint on a fisheye view image of the atmosphere
Step 4. Repeat the previous steps for a preset number of light rays.
B. The Monte Carlo method
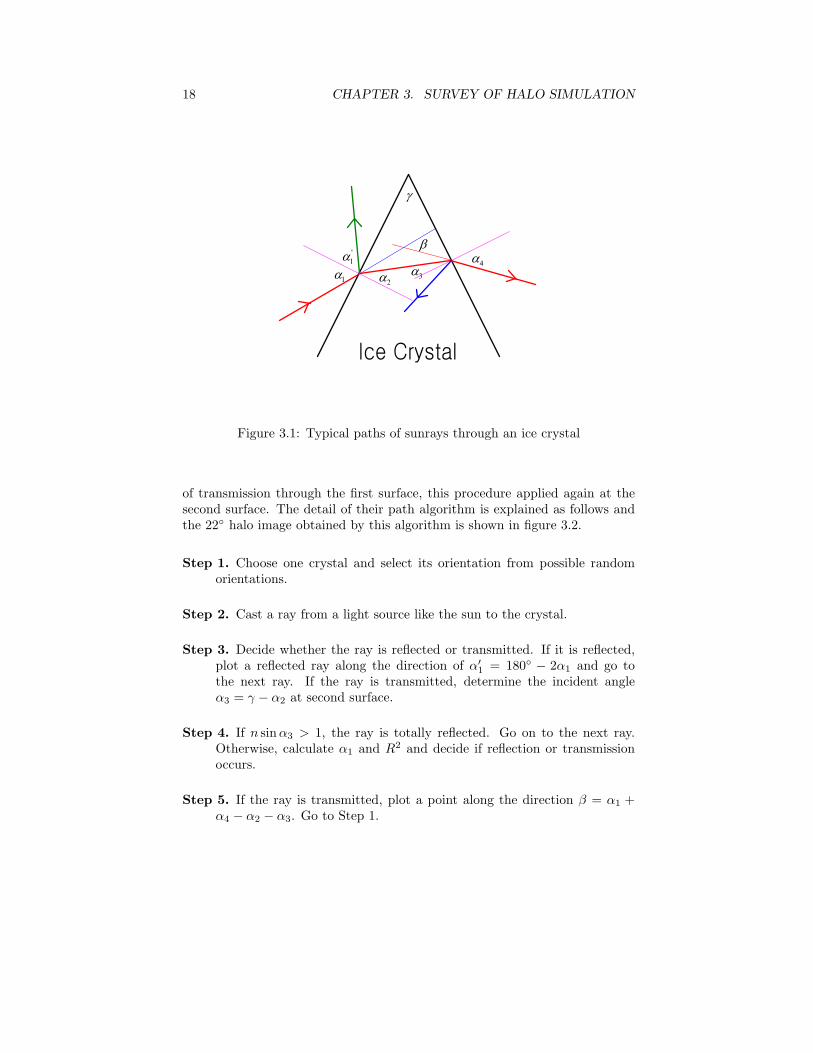
Pattloch and Trankle defined a stochastic process for the reflection andrefraction of the sunlight for a given distribution of crystals [12]. Paths ofdifferent ray classes occur, that is, whether the ray is reflected or transmitted isdetermined by the stochastic process. The algorithm follows the path for severalinternal reflections until it leaves the crystal. They repeated this numericalexperiment for about 105 light rays and the number of repetitions seems tobe sufficient for the intensity of all possible halos, but this number may notbe enough for the visualization purpose because its output image is too crude.They explained a stochastic model with an ice crystal in figure 3.1, which isknown to produce the 22◦ and 46◦ halos. The laws of geometrical optics at thefirst surface are given as
α′1 = α1 (reflection law) (3.1)
sinα1
sinα2= n, n ≈ 1.31 (refraction law). (3.2)
The Fresnel equations [8] for the reflection amplitudes for perpendicular,parallel polarization, and the reflectance in natural light are
r⊥ = − sin (α1 − α2)sin (α1 + α2)
(3.3)
r‖ =tan (α1 − α2)tan (α1 + α2)
(3.4)
R =12(r2⊥ + r2‖) (see the appendix for details). (3.5)
In the spirit of the hit-and-miss Monte Carlo method, the ray to be re-flected or transmitted has the probability R or 1−R, respectively. In the case
18 CHAPTER 3. SURVEY OF HALO SIMULATION
4
3
'1
1 2
Figure 3.1: Typical paths of sunrays through an ice crystal
of transmission through the first surface, this procedure applied again at thesecond surface. The detail of their path algorithm is explained as follows andthe 22◦ halo image obtained by this algorithm is shown in figure 3.2.
Step 1. Choose one crystal and select its orientation from possible randomorientations.
Step 2. Cast a ray from a light source like the sun to the crystal.
Step 3. Decide whether the ray is reflected or transmitted. If it is reflected,plot a reflected ray along the direction of α′
1 = 180◦ − 2α1 and go tothe next ray. If the ray is transmitted, determine the incident angleα3 = γ − α2 at second surface.
Step 4. If n sinα3 > 1, the ray is totally reflected. Go on to the next ray.Otherwise, calculate α1 and R2 and decide if reflection or transmissionoccurs.
Step 5. If the ray is transmitted, plot a point along the direction β = α1 +α4 − α2 − α3. Go to Step 1.

3.3. EXTENDED MONTE CARLO METHODS 19
Figure 3.2: 22◦ halo image by the Monte Carlo ray tracing redrawn from [12]
3.3 Extended Monte Carlo Methods
A. Multiple Scattering Algorithm
When sunlight is scattered by a layer of ice crystals, some rays are scatteredby two or more ice crystals in the layer, and some pass through without anyscattering, which is shown in figure 3.3. Multiple scattering increases back-ground intensity and the sharp structures of single scattering are smeared out[16]. In the region near the sun, multiple scattering effects of reflection and re-fraction may be superimposed upon diffraction effects. The multiple scatteringeffects are responsible for the 44◦ parhelion, the anthelion, and so forth.
The hit-and-miss Monte Carlo procedure used in single scattering is alsoappropriate to simulate multiple scattering of sunlight by a layer of ice crystals[16]. Takano and Liou[14] developed a radiative transfer method to solve thesolar radiation in an optically anisotropic media like cirrus clouds including icecrystals. Using the radiative transfer schemes, they demonstrated scatteringeffects. They simulated halos produced by horizontally oriented ice crystals.Gedzelman extended his computer simulations of both halos and rainbows byusing an algorithm to describe some of the effects of light scattering throughthe atmosphere and through clouds of finite optical thickness [3]. The follow-ing steps summarize the extended Monte Carlo method proposed by Trankleand Greenler and a halo image by considering multiple scattering is shown infigure 3.4.

20 CHAPTER 3. SURVEY OF HALO SIMULATION
D
Ice crystal layer
Incoming rays
Drawing plane
Figure 3.3: Model of ray tracing through ice crystal layer redrawn from [12]
Step 1. Follow the path of a ray from the Sun through a horizontal, plane-parallel layer of optical depth D in units of the mean free path. Seefigure 3.1. The incident angle is given by the sun elevation.
Step 2. Draw a random free path � from the distribution p(�) = exp (−�) andnew direction from the single scattering algorithm.
Step 3. Repeat the steps until the ray leaves the layer, above or below.
Step 4. Plot a point at the intersection of the ray with the drawing plane.
B. Coloring Halos
Gedzelman [3] used a wavelength dependent index of refraction in his sim-ulation of halos and rainbows, which is nice = 1.3203− 0.0333λ (µm). It is notmentioned in [3] where he obtained the refractive index formula. Glassner [4]tried to obtain smooth color in halo images. The formula Glassner used for theindex of refraction is derived from Sellmeier’s formula, which is approximatedin two term form, is nice = A + B
λ2 . The coefficient A and B are temperaturedependent and shown as follows.
A(T ) = 1.32491 − 0.00000399278T − 0.00000120678T 2, (3.6)
B(T ) = 3105.31 + 1.25203T − 0.0353608T 2, (3.7)
where T is in Celsius. Figure 2.7 shows the refractive index variation accordingto the changes of wavelength and temperature.

3.4. PHOTO REALISTIC RENDERING 21
Figure 3.4: Complex halo image by multiple scattering redrawn from [16]
3.4 Photo Realistic Rendering
Glassner applied various smoothing methods to dot patterns existing in usualhalo simulation images for naturally looking halo images [4]. His first trial isblurring the dotted image, then he applied a Gaussian blob over each spot andfinally he used a multi-resolution composting method. The results of such trialswere frequently too blurry or too speckled.
Jackel and Walter [9] used a radiation intensity for the effects of scatteringand absorption in rendering halos. They divided the atmosphere into cells tofacilitate the visible radiation and assigned scattering and absorption param-eters to each cell and calculated the scattered radiation pointing toward theobserver. In their simulation, the scattering calculation for 21 different wave-lengths were done to preserve dispersion effects. Each wavelength calculationwas carried out by using parallel computing scheme. And they made the halosimulation as an integral parts of a virtual environment. Figure 3.5 shows oneof their simulated images.
Gonzato and Marchand [6] addressed the problem Glassner mentioned,which is how to recover as accurately as possible as the missing data in halosimulation images in the Monte Carlo method. They indicated that Glassnertried to apply an uniform reconstruction technique for non-uniform sampling,so his method resulted in clumsy images. They proposed the irregular sampling

22 CHAPTER 3. SURVEY OF HALO SIMULATION
Figure 3.5: Computer generated 22◦ halo redrawn from [9]
theory for photo realistic2 halo image reconstruction. They used the Marvasti-Allebach reconstruction algorithm [1] for picture issued from halo simulations.Their detail procedure is shown below and their halo image is shown in fig-ure 3.6.
Step 1. Interpolate the unknown pixels by using the known sampling values.Many interpolation techniques can be used, such as the Voronoi inter-polation: nearest neighborhood interpolation, using the arithmatic meanfor equally-spaced neighbors.
Step 2. Apply a low pass filtering to the interpolated picture. Perform a localnon-uniform reconstruction by adaptively choosing for every pixel thebest size for reconstruction filter.
Step 3. Compare the reconstructed picture and the original one. If the error,which is the square sum of differences between original values and re-constructed values at known pixel points, exceeds a predetermined limit,then repeat the first two steps.
Glassner’s [4] trial to smooth colors in halo images and transform the rawimages into visually realistic halo images, seems to be unsuccessful, which is
2In this context, it means that computer generated halos look as if they had been naturalscenes captured by a camera.

3.4. PHOTO REALISTIC RENDERING 23
Figure 3.6: Computer generated halo in outdoor scene redrawn from [6]
mentioned in the beginning of this section. Jackel and Walter [9] assert thattheir method can give realistic looking halo images by using atmospheric render-ing technique and various wavelength rays, but they didn’t mention anythingabout postprocessing3 after obtaining ray-traced halo images. According toGonzato and Marchand [6], the halo images obtained by the inverse ray trac-ing method have an intrinsic problem, that is, the pixels in the images are notuniformly sampled, so classic filtering methods based on regular sampling cannot be applied to the halo images by satisfaction. They proposed a filteringmethod based on non-regular sampling and assert that their method can givephoto realistic halo images without losing physical characteristics.
3In this context, postprocessing means interpolating and filtering of raw ray-traced haloimages, which are proposed by Gonzato and Marchand [6]

24 CHAPTER 3. SURVEY OF HALO SIMULATION

Chapter 4
Implementation
The implementation of atmospheric halo visualization is composed of four subparts. The first thing is to model an ice crystal using geometric parameters.Then it is necessary to define parameters for sun rays to reach observers viathe ice crystal. The next thing is the parametrization of the ice crystal ori-entation, which enables us to adjust the crystal orientation according to thecorresponding probabilities. Finally, the Monte Carlo ray tracing method isbriefly described. As mentioned in the previous chapter, it is called an inverseray tracing because it uses rays from the Sun instead of from the observer’seye.
4.1 Ice crystal modelling
There are many possible types of ice crystals. Laboratory experiments showthat crystal type depends on the temperature and humidity under which thecrystal forms and grows [15]. In cirrus clouds, ice tends to form simpler platesor columns which are shaped like pencils, under the appropriate combination oftemperature and humidity. These hexagonal crystal forms produce a surprisingvariety of optical effects in the sky. In this work only this simple hexagonalshape will be considered because the crystal type can explain most halos andhelp us to understand the other halo phenomena. All the hexagonal formsare parameterized by two shape variables, which are shown in figure 4.1. Thecrystal is composed of eight polygons, which are used to check if the sunlightintersects the crystal. As mentioned earlier, when the sunlight hits the face ofthe crystal, it reflects or refract at the face depending upon the incident angleof the sunlight and the refractive index of the crystal. Sellmeier’s formula forthe refractive index of ice which was used by Glassner [4], is used in this work.
The orientation of ice crystal are described with Euler angles [2]. Accordingto Euler’s theorem, any rotations are defined by three parameters. Althoughthere are several different notational conventions, in this work x-convention is
25

26 CHAPTER 4. IMPLEMENTATION
Figure 4.1: Parametric model of ice crystal
used. In the x-convention, the rotation given by Euler angles (φ, θ and ψ),where the first rotation is by an angle φ about the z-axis, the second is by anangle θ about the x-axis, and the third is by an angle ψ about the z-axis again.
4.2 Sunlight modelling
Since the Sun is far from the earth and the size of the Sun is much larger thanthat of the earth, the sunlight can be regarded as a set of collimated rays. TheSun is assumed to move only in y-z plane shown figure 4.2, so the rays fromthe Sun are parallel to the plane. Although the Sun is modelled as a pointin y-z plane, all the rays for simulating the sunlight have different origins andsame directions. The destinations of the rays are limited to the circle which isperpendicular to the rays. The radius of the circle should be large enough toinclude an entire ice crystal. The radius of the ray circle R can be given
R =√r2 + h2 (4.1)
The destination points of the rays are randomly determined. Let’s tworandom variables be ξ1 and ξ2, respectively. Then the destination point of the

4.3. PARAMETRIZATION OF ICE CRYSTAL ORIENTATION 27
Figure 4.2: Sunlight model and projection circle
ray in the circle is represented by a azimuth angle φ and a radius ζ.
φ = 2πξ1 (4.2)
ζ = R cos−1(√
1 − ξ2
)(4.3)
And assuming that the elevation angle of the Sun is θsun and the distance fromthe center of the circle to the Sun is d, then a ray γ is defined as follows.
γorigin = {ζ cosφ, d cos θsun − ζ sinφ sin θsun, d sin θsun + ζ sinφ cos θsun}(4.4)
γdirection = {0, − cos θsun, − sin θsun} (4.5)
4.3 Parametrization of ice crystal orientation
Pattloch and Trankle [12] proposed probabilistic formula for the Euler anglesof the ice crystal. According to them, the angular motion of the ice crystalin terms of the Euler angles can be described with crystal shape dependentprobability formula. Since the angular motion of the crystal is stimulated byBrownian motion and atmospheric fluctuations, such nondeterministic expres-sions are more appropriate than deterministic expression. They classified the

28 CHAPTER 4. IMPLEMENTATION
ice crystals into 4 categories in order to give probabilistic expressions for theEuler angles.
(1) Randomly oriented tiny crystal or cubelike crystals; for the tiny crystals,a is not restricted, but a ≈ 1 for the cubelike crystals.
p(θ) =sin(θ)
2, 0 ≤ θ < 180 (4.6)
p(φ) =1
360, 0 ≤ φ < 360, (4.7)
p(ψ) =1
360, 0 ≤ ψ < 360. (4.8)
(2) Oriented plates with a < 1.
p(θ) =1π
1√θ2
m − θ2, −θm ≤ θ ≤ θm, (4.9)
where θm = 0.4,−1.0 or 2.5 in degrees, p(φ) and p(ψ) are same as in (1).
(3) Singly oriented columns with a > 1. The same distribution functions areapplied to these crystals, but the perfect orientation of θ is π
2 .
(4) Doubly oriented columns with a > 1. In addition to θ, the perfect orien-tation of φ is set to 0. Because of the hexagonal symmetry of the crystal,there is an upper limit of the largest maximum rotation angle to φ, whichis given 30◦.
p(φ) =160, −30 ≤ φ ≤ 30, (4.10)
These mathematical expressions for the angular motion are very useful com-pared to the data for the angular motion given by Tape [15] because the formerform is more convenient for simulation. However, the probabilistic forms arenot so easy to be used in actual programs, so the mathematical expressionsfor the probabilities are converted into the direct expressions for θ, φ and ψusing three random variables ξ1, ξ2 and ξ3. This function inversion procedureis mentioned in [13].
(1a) Randomly oriented crystals.
θ = arccos (1 − 2ξ1), 0 ≤ ξ1 < 1 (4.11)φ = 2πξ2, 0 ≤ ξ2 < 1, (4.12)ψ = 2πξ3, 0 ≤ ξ3 < 1. (4.13)

4.4. MONTE CARLO RAY TRACING 29
(2a) Oriented plates with a < 1.
θ = θm sinπ(ξ1 − 0.5), 0 ≤ ξ1 < 1, (4.14)
where θm is same as given in (1) but in radians.
(3a) Singly oriented columns with a > 1.
θ =π
2+ θm sinπ(ξ1 − 0.5), 0 ≤ ξ1 < 1, (4.15)
where φ and ψ are same as in (1a).
(4a) Doubly oriented columns with a > 1.
φ = π +π
6(ξ2 − 0.5), 0 ≤ ξ2 < 1. (4.16)
4.4 Monte Carlo ray tracing
As mentioned in chapter 3, Greenler [7] introduced the computer aided simu-lation of the atmospheric halos. Pattloch and Trankle extended his method byadopting Monte Carlo simulation. Afterwards, many researchers [16, 14, 3, 15,5, 4, 9, 6] diversified their method by including the effects of multiple scatter-ing, the wavelength dependency of the sunlight refraction, the complex shapesthe crystals and etc. The Monte Carlo simulation used in this work is basedon the method Pattloch and Trankle [12] proposed in 1984. The simulationmethod is described as follows.
Preprocessing As mentioned in the previous sections 4.1 and 4.2, An icecrystal is modelled by 8 polygons, of which top and bottom polygons arehexagonal and sides are rectangular. The length of the hexagonal is setto 1 and the height of the rectangle is determined by the aspect ratiowhich varies according to the type of the ice crystal. The orientation ofthe crystal is determined by the Euler angles which are determined bythree random variables ξ1, ξ2 and ξ3.
Step 1. Set the following numbers before starting the ray tracing.(a) Total number of rays to be traced.(b) Elevation angle of the Sun.(c) Proportions of ice crystals with different shape and orientation.(d) Three different wavelength numbers(for example, red, green and blue1).(e) Proportions of rays with different wavelength.
1These three colors are minimum number of colors to express a genral color and thenumber of colors can be increased in the actual programs.

30 CHAPTER 4. IMPLEMENTATION
Step 2. Randomly determine the following parameters whenever a new ray iscreated.(a) The type of the ice crystal (for example, oriented plate with a < 1).(b) The orientation of the ice crystal, θ, φ and ψ.(c) The destination point of the ray in the projection circle.(d) The wavelength of the ray.
Step 3. Check if the ray hits the crystal. If the ray misses the crystal, thenincrement the number of rays traced and go to Step 2.
Step 4. By using the wavelength dependent refractive index, which is shownfigure 2.7 and explained in section 3.3, and the incident angle of the ray tothe crystal, examine whether the ray refracts or reflects when the ray hitthe crystal face. This step is briefly mentioned in the previous chapter 3.
Step 5. Trace the refracted ray or the reflected ray until it gets out of thecrystal. The number of internal reflections is limited to 10, therefore whenthe number of the internal reflections exceeds this limit, then incrementthe number of rays and go to step 2.
Step 6. Check if the outgoing ray is visible to the observer. That is, if thecrystal can be located on the upper hemisphere to give the same raydirection, we can decide whether the outgoing ray is visible or not.
Step 7. Add the ray color intensity to the pixel where the crystal should belocated if the ray is visible.
Step 8. Increment the number of rays if the total number does not exceed thepreset limit of the total ray numbers and go to Step 2. Otherwise, stopthis simulation.

Chapter 5
Application
5.1 Initial setup
Before starting the simulation of various halos using the ray tracer devel-oped in the previous chapter, several parameters without having randomcharacteristics should be determined. As mentioned earlier, 4 differenttypes of hexagonal ice crystals are used in this work. The proportionsof the types should be determined before the simulation. The similarquantities are the sunlight color components, red, green and blue. Theproportions of the color components in the sunlight and the correspondingwavelength are determined in advance. The aspect ratio of each crystaltype varies every crystal by crystal, but the ratio for each crystal type isassumed to be fixed. The following shows the detail initial setup.
(1) Ice crystal data1
type proportions aspect ratiorandomly oriented 0.65 1.0
oriented plate 0.05 0.5singly oriented 0.20 2.0doubly oriented 0.10 2.0
(2) Sunlight color data2
1In the table, the proportions show a tentative set of composition and the aspect ratiosare typical values.
2In the table, the proportions of red, green and blue show a tentative set of compositionand the wavelengths for the colors are typical values.
31

32 CHAPTER 5. APPLICATION
color proportions wavelength (µm)red 0.4 706
green 0.5 589blue 0.1 404
In the above setup, the proportions of the crystal types vary accord-ing to the halo type. In the simulation, a ray contributes its corre-sponding color to a bluish background, where the color of the ray isdetermined randomly during the simulation. The background color is(0.3, 0.3, 0.8). The red, green and blue contributions to the backgroundare (0.25, 0.0, 0.0), (0.0, 0.25, 0.0) and (0.0, 0.0, 0.25), respectively. Be-sides, the sun elevation angle, the total number of rays, the limit ofinternal reflection and etc. are initially given.
5.2 22◦ halo simulation
In this simulation, the proportions of ice crystal types are (1.0, 0.0, 0.0, 0.0).That is, there are only randomly oriented crystals floating in the air. The
Figure 5.1: 22◦ halo vs. the Sun’s elevation (a) 0◦ (b) 30◦ (c) 60◦ (d) 90◦

5.3. PARHELION AND PARHELIC CIRCLE SIMULATION 33
total number of rays3 is 2×10⁶. These crystals causes a bright 22◦ degreehalo and a faint 46◦ halo. These halos are positioned around the Sun, sothe halos move with the Sun. Figure 5.1 shows the 22◦ and 46◦ aroundthe Sun at different the Sun’s elevations.
5.3 Parhelion and parhelic circle simulation
In this simulation, the proportions of ice crystal types are (0.9, 0.1, 0.0, 0.0).There are majority of randomly oriented crystals and small portion of ori-ented plates floating in the air. The total number of rays is 2 × 10⁶ assame as before. These crystals causes a bright 22◦ degree halo, a faint46◦ halo, parhelia (sundogs) and parhelic circle. Figure 5.1 shows thehalos around the Sun at different the Sun’s elevations. As mentioned inchapter 2, the sundogs move away from the 22◦ halo circle as the Sun’selevation angle increase. In addition to the sundogs (the parhelia closeto the Sun), the simulation shows 120◦ parhelia.
5.4 Composite halo simulation
In this composite halo simulation, the proportions of ice crystal typesare (0.65, 0.05, 0.20, 0.10). There are still majority of randomly orientedcrystals, small portion of oriented plates, significant portions of singlyand doubly oriented crystals floating in the air. The total number of raysis 3× 10⁶, which is increased from 2× 10⁶ to show various kinds of halos.These crystals causes a upper tangent arc, a supralateral and more inaddition to the halos mentioned above. Figure 5.3 shows the simulatedhalos with the photo taken at the South Pole by W. Tape [15]. Accordingto Tape [15], singly oriented columns cause the tangent arcs, supralateralarcs and some parhelic circle intensity. It is noticeable that there are alot of similarities between the simulation image and the photo.
Figure 5.4 shows the frontal viewing images obtained with 90◦ horizontaland vertical viewing angles unlike the above fisheye viewing images. Thesimulation image closes up the upper tangent arc and the parhelia (sun-dogs). The figure also compares the picture taken by W. Tape [15]. Thesimulation describes the real halo image very closely. This simulation isobtained when the Sun is at 20◦ in its elevation angle. To obtain thisimage, 107 rays, which is needed to give proper intensities of halo imagesin the frontal view, are used.
3The number of rays is selected to give proper intensities to halo images.

34 CHAPTER 5. APPLICATION
Figure 5.2: Parhelia vs. the Sun’s elevation (a) 0◦ (b) 10◦ (c) 20◦ (d) 30◦ (e)40◦ (f) 50◦

5.4. COMPOSITE HALO SIMULATION 35
Figure 5.3: Top: Halo photo taken at the South Pole by Tape [15]; Bottom:Composite halo simulation

36 CHAPTER 5. APPLICATION
Figure 5.4: Top: upper tangent arc photo taken by Tape [15]; Bottom: uppertangent arc simulation

Chapter 6
Conclusion
In this report, the atmospheric halo phenomena have been explained anda ray tracer based on the Monte Carlo method has been presented anddemonstrated. The comparison of the simulation results with the photostaken for the same phenomena shows that the ray tracer gives reason-able results. This ray tracer is very useful for simulating the phenomenaand identifying atmospheric data like proportions of ice crystals and ori-entations. However, the halo images obtained with this ray tracer aresomewhat crude, so those images are not appropriate for outdoor render-ing purpose.
As briefly mentioned in chapter 3, if atmospheric rendering techniquesare incorporated to the ray-tracing, then the halo images can be morephysically reasonable. In addition to that, filtering methods based onnon-regular sampling can improve the speckled images obtained fromthe inverse ray tracer. Thus future works for enhancing those roughsimages without losing any physical correctness are required to adopt thosetechniques in the ray tracer.
37

38 CHAPTER 6. CONCLUSION

References
[1] Feichtinger, H. G., Grachenig, K., and Strohmer, T. Ef-ficient numerical methods in non-uniform sampling theory. Nu-merische Mathematik 69 (1995), 423–440.
[2] Francis S. Hill, J. Computer Graphics Using OpenGL, second ed.Prentice Hall, Upper Saddle River, New Jersey, 2001.
[3] Gedzelman, S. D. Simulating rainbows and halos in color. AppliedOptics 33, 21 (1994), 4607–4613.
[4] Glassner, A. Computer-generated solar halos and sun dogs. IEEEComputer Graphics and Applications (Mar. 1996), 77–81.
[5] Glassner, A. Solar halos and sun dogs. IEEE Computer Graphicsand Applications (Jan. 1996), 83–87.
[6] Gonzato, J.-C., and Marchand, S. Efficient simulation of halosfor computer graphics. In 8 ECS & IA, pp. 1–6.
[7] Greenler, R. Rainbows, halos, and glories. Cambridge UniversityPress, Cambridge, 1980.
[8] Hecht, E. Optics, third ed. Addison-Wesley, 1998.
[9] Jackel, D., and Water, B. Simulation and visualization of halos.In ANIGRAPH (1998).
[10] Lynch, D. K., and Livingston, W. Color and Light in Nature.Cambridge University Press, Cambridge, 1995.
[11] Minneart, M. G. J. Light and Color in the Outdoors. Springer-Verlag, Berlin, 1993.
[12] Pattloch, F., and Trankle, E. Monte carlo simulation andanalysis of halo phenomena. J. Opt. Soc. Am 1, 5 (1984), 520–526.
[13] Shirley, P. Fundamentals of Computer Graphics. A K Peters,Natick Massachusetts, 2002.
[14] Takano, Y., and Liou, K.-N. Halo phenomena modified by mul-tiple scattering. J. Opt. Soc. Am 7, 5 (1990), 885–889.
39

40 REFERENCES
[15] Tape, W. Atmospheric Halos, vol. 64 of Antarctic Research Series.American Geophysical Union, Washington, D.C., 1994.
[16] Trankle, E., and Greenler, R. G. Multiple-scattering effectsin halo phenomena. J. Opt. Soc. Am 4, 3 (1987), 591–599.

Appendix A
Reflectance of Dielectrics
This appendix is extracted and summarized from [8]. If the wavelength oflight is small in comparison to the size of the apparatus, one may use, as afirst approximation, the techniques of Geometrical Optics. In Geometri-cal Optics the dominant property of light is its wave nature. Therefore asfar as Geometrical Optics is concerned, it will suffice admirably to treatlight as an electromagnetic wave. Suppose that the incident monochro-matic lightwave is planar, so that it has the form from figure A.1
Figure A.1: Incoming waves whose E-fields are normal and parallel to the planeof incidence redrawn from [8].
41

42 APPENDIX A. REFLECTANCE OF DIELECTRICS
Ei = E0i cos(ki · r − ωit) (A.1)Er = E0r cos(kr · r − ωrt+ εr) (A.2)Et = E0t cos(kt · r − ωtt+ εt). (A.3)
Here εr and εt are phase constants relative to Ei and are introducedbecause the position of the origin.
The laws of Electromagnetic Theory lead to certain requirements thatmust be met by the fields, and they are referred to as the boundaryconditions. Whatever the polarization of the wave, we shall resolve its E-and B- fields into components parallel and perpendicular to the plane ofincidence and treat these constituents separately. Applying the boundarycondition to perpendicular and parallel E’s to the plane of incidence givesthe following well known Fresnel Equations for dielectrics.
r⊥ ≡(E0r
E0i
)⊥
=ni cos θi − nt cos θt
ni cos θi + nt cos θt(A.4)
t⊥ ≡(E0t
E0i
)⊥
=2ni cos θi
ni cos θi + nt cos θt(A.5)
r‖ ≡(E0r
E0i
)‖
=nt cos θi − ni cos θt
ni cos θt + nt cos θi(A.6)
t‖ ≡(E0t
E0i
)‖
=2ni cos θi
ni cos θt + nt cos θi(A.7)
Here r denotes the amplitude reflection coefficient, and t does the ampli-tude transmission coefficient.
Let Ii, Ir, and It be the incident, reflected, and transmitted flux densi-ties, respectively. The cross sectional areas of the incident, reflected, andtransmitted beams are, respectively, A cos θi, A cos θr, and A cos θt. Ac-cordingly, the incident power is IiA cos θi. And similarly IrA cos θr andItA cos θt are the reflected power and the transmitted power, respectively.We define the reflectance R to be the ratio of the reflected power to theincident power.
R ≡ IrA cos θr
IiA cos θi=IrIi. (A.8)
Similarly, the transmittance T is defined as the ratio of the transmittedto the incident flux and is given by

43
T ≡ ItA cos θt
IiA cos θi. (A.9)
Since the quotient Ir/Ii equals E20r/E
20i,
R =(E0r
E0i
)2
(A.10)
T =nt cos θt
ni cos θi
(E0t
E0i
)2
. (A.11)
Let’s now write an expression representing the conservation of energy.The total energy flowing into area A per unit time must equal the energyflowing outward from it per unit time:
IiA cos θi = IrA cos θr + ItA cos θt. (A.12)
With equations A.8 and A.9, this is simply
R+ T = 1 (A.13)
where there was no absorption. It is convenient to use the componentforms, that is,
R⊥ = r2⊥ (A.14)
R‖ = r2‖ (A.15)
T⊥ =nt cos θt
ni cos θit2⊥ (A.16)
T‖ =nt cos θt
ni cos θit2‖. (A.17)
Furthermore, it can be shown that
R⊥ + T⊥ = 1 (A.18)R‖ + T‖ = 1. (A.19)

44 APPENDIX A. REFLECTANCE OF DIELECTRICS
If the incoming light is unpolarized, we can represent it by two familiarorthogonal, incoherent, equal amplitude states. Incidentally, the factthat they are equal in amplitude means that the amount of energy inone of these two polarization states is the same as that in the other(i.e.,Ii‖ = Ii⊥ = Ii/2). Thus,
Ir⊥ = R⊥Ii2
(A.20)
Ir‖ = R‖Ii2. (A.21)
The reflectance in natural light, R = Ir/Ii, is therefore given by
R =Ir‖ + Ir⊥
Ii=R‖ +R⊥
2. (A.22)

Index
22◦ halos, 8, 3346◦ halos, 9, 33
aerodynamic drag force, 6amplitude reflection coefficient, 42amplitude transmission coefficient, 42anthelion, 16aspect ratio, 29, 31atmospheric fluctuation, 27atmospheric rendering method, 16
B-field, 42bluish background sky, 11blurring method, 16Brownian motion, 27
circumzenithal arc, 12cirrostratus, 8cirrus clouds, 5color components, 31color separation, 13conservation of energy, 43crystal orientation, 25crystal type, 25, 33cubelike crystal, 28
dielectrics, 42dispersion, 11, 21doubly oriented column, 28
E-field, 42electromagnetic theory, 42electromagnetic wave, 41Euler angles, 25, 29Euler’s theorem, 25external reflection, 13
fisheye view, 17, 33flux density, 42Fresnel equations, 15, 17, 42frontal view, 33
Gaussian blob, 21geometric optics, 3, 17, 41
halo, 3, 5hexagonal crystal, 5, 25
ice crystal, 5implimentation, 25infrequent halos, 15inner edge, 10internal reflection, 17, 30interpolation, 22
low pass filtering, 22lunar halo, 5
Marvasti-Allebach reconstruction method, 22Mie scattering, 16minimum deviation phenomena, 9mock sun, 11Monte Carlo method, 15, 17, 25, 37Monte Carlo ray tracer, 3Monte Carlo simulation, 29multi-resolution composting method, 21multiple scattering, 15, 19
natural light, 44non-uniform sampling, 16, 21
optical depth, 15optical thickness, 19optically anisotropic media, 19
45

46 INDEX
parallel computation, 16, 21parametrization, 25parhelic circle, 13, 33parhelion, 11, 33path tracing method, 15pencil, 7plane of incidence, 42plate, 7polarization, 16, 17, 42polygon, 25, 29prism effect, 13probabilistic formula, 27probability, 17projection circle, 30proportions, 31, 33
radiative transfer method, 19random orientation, 17random variable, 26ray tracing algorithm, 16ray tracing method, 15reconstruction, 21reflectance, 42reflection halos, 7refracting halos, 6refraction coefficient, 8refractive index, 10, 20, 25, 30
scattering, 15Sellmeier’s formula, 25singly oriented column, 28skew rays, 9solar halo, 5spectral colors, 12stochastic model, 17stochastic process, 17subparhelia, 15sun’s elevation, 12sundog, 11, 33supralateral arc, 33
temperature dependent, 20total internal reflection, 8transmission paths, 8transmittance, 42
troposphere, 5
upper tangent arc, 33
viewing mechanism, 10, 14
wavelength, 10wavelength dependent, 16, 20, 30
x-convention, 25