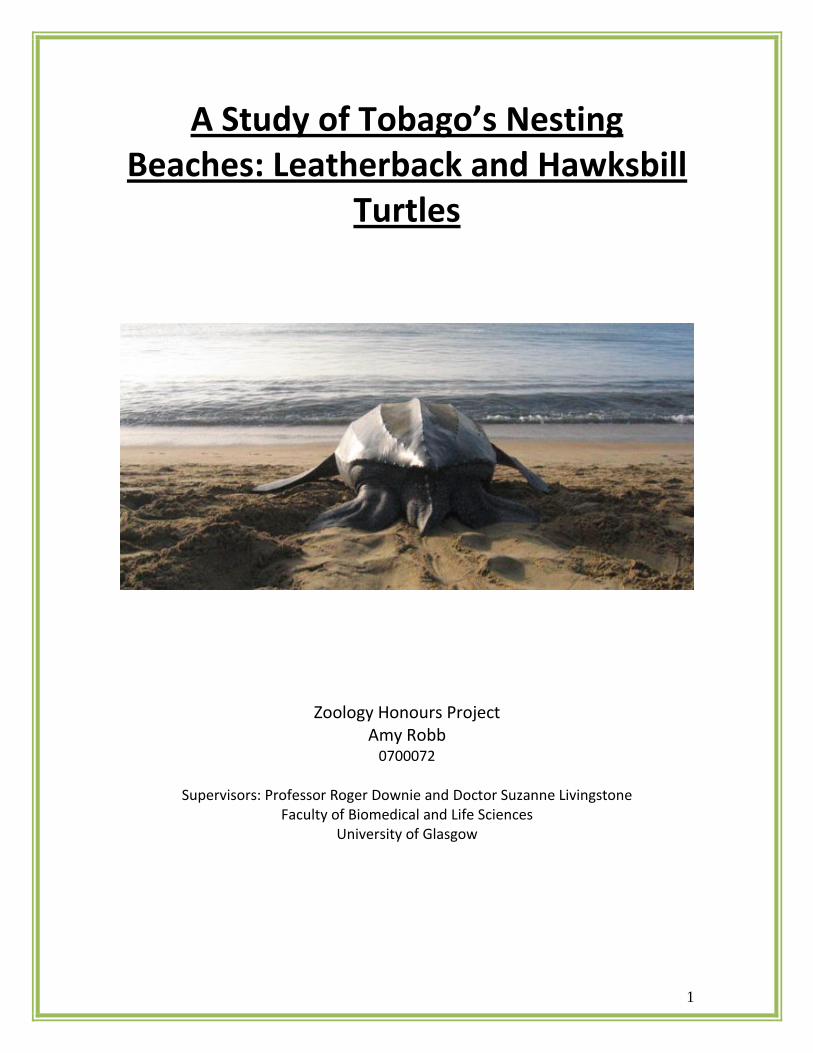
a study of tobago’s nestingbeaches: leatherback and hawksbill turtles
DESCRIPTION
Research conducted by Amy Robb, final year undergraduate student, faculty of Biomedical and Life Sciences, Glasgow University in conconjunction with SOS TobagoTRANSCRIPT
1
A Study of Tobago’s Nesting Beaches: Leatherback and Hawksbill
Turtles
Zoology Honours Project Amy Robb
0700072
Supervisors: Professor Roger Downie and Doctor Suzanne Livingstone Faculty of Biomedical and Life Sciences
University of Glasgow

2
Abstract There are a number of threatened sea turtle species that nest and forage around the
island of Tobago including the leatherback (Dermochelys coriacea), the hawksbill
(Eretmochelys imbricata) and the green turtle (Chelonia mydas). This study surveyed
Tobago’s beaches in 2010 relevant to sea turtle nesting numbers, species and
topographical profile. Three index beaches were patrolled nightly between 1st March
and 30th September and eleven non-index beaches were patrolled weekly between 16th
June and 5th August in conjunction with the local NGO Save Our Sea Turtles (SOS)
Tobago. No green turtles were recorded nesting on Tobago in 2010 but they have been
reported to nest on the island in the past. Leatherback turtles were recorded nesting in
high numbers over the 14 beaches with a total of 448 confirmed nests and hawksbill
turtles were recorded nesting in lower numbers with 42 confirmed nests. Average false
crawl rates were calculated for leatherback turtles to be 16.7% over the three index
beaches on Tobago. Average false crawl rates were calculated to be higher for hawksbill
turtles at 25% over the three index beaches. All the beaches patrolled were profiled and
the profile was analysed in relation to nesting density and Google Earth and Bing Maps
were used to present the distribution of sea turtle nesting visually. The information
obtained provides a useful foundation from which further research can be developed,
including making a population estimate for the island.
3
Table of Contents
Abstract......................................................................................2
Introduction Sea Turtles.......................................................................5 Tobago.............................................................................7
Sea Turtles In Tobago......................................................8 SOS Tobago......................................................................9 Assessing Population Size...............................................10 Beach Profiling................................................................11 Using GIS.........................................................................13 Project Aims....................................................................13
Methods Location of Study Sites....................................................14 Data Collection on Nesting Turtles.................................15 Beach Profiling................................................................17 Mapping..........................................................................18
Statistical Methods.........................................................19
Results Leatherback turtles..........................................................20 Nesting.................................................................20 False crawls..........................................................21 Beach Profiling.....................................................23
Hawksbill turtles..............................................................24 Nesting.................................................................24 False Crawls..........................................................25 Beach Profiling.....................................................27
Mapping...........................................................................28 Limitations in Data Collection..........................................45
Discussion Leatherback turtles..........................................................48 Nesting Behaviour................................................48 False crawls..........................................................49 Population Model.................................................51 Beach Profiling......................................................52
Hawksbill turtles...............................................................53 Nesting Behaviour................................................53 False crawls..........................................................55 Beach Profiling.....................................................57
Mapping...........................................................................58 Limitations and Recommendations.................................59
Recommendations and Future Research.........................60
Summary of Findings.................................................................62

4
Afterword...................................................................................63 Acknowledgements...................................................................64
References..................................................................................65
Appendix.....................................................................................70
5
Introduction
Sea Turtles
Sea turtles, along with tortoises and freshwater turtles belong to the order Testudines.
There are seven living species of sea turtles, six of which belong to the family
Cheloniidae: the hawksbill turtle (Eretmochelys imbricata), the green turtle (Chelonia
mydas), the flatback turtle (Natator depressus), the loggerhead turtle (Caretta caretta),
the olive ridley (Lepidochelys olivacea) and the kemp’s ridley (Lepidochelys kempii). The
leatherback (Dermochelys coriacea) (Davenport, 1997) belongs to the family
Dermochelyidae in which there is only one species. There is some controversy over the
East Pacific green turtle sometimes known as the black turtle. However, it is generally
accepted as a subspecies of the green turtle (Chelonia mydas agassizii), although some
researchers believe that it is a separate species (Chelonia agassizii) (Karl and Bowen,
1999).
Tobago has three of the seven species of sea turtles nesting on its shores, the
leatherback, the hawksbill and, although it has not been recorded nesting on Tobago for
several years, the green turtle (G. Lalsingh, personal communication, 2010).
The leatherback turtle is the largest of all the sea turtles, weighing over 900kg and with
a carapace of up to 188cm long (Scott, 2004). The carapace of the leatherback is unusual
in that it is formed from a layer of tough leathery skin instead of hard shell.
Leatherbacks are pelagic and the most widely distributed of the sea turtles, found in all
the oceans but the Arctic and Antarctic. They are highly adapted for a pelagic lifestyle,
with a unique flipper structure and flipper proportions to allow for powerful swimming.
Their large body size, effective insulation and control of their blood flow allows for great
diving depth and toleration of colder waters. In Tobago, the leatherback nesting season
is from March to August, but the season differs between localities. They nest
approximately every three years on average, emerging onto beaches in darkness to nest

6
approximately every ten days and laying in total around four to eight clutches a season
(Reina et al, 2002). When they nest they use their back flippers to dig a hole around
80cm deep, and into it deposit 80-120 soft-shelled eggs, including infertile capsules, that
will take between 57 and 75 days to hatch, depending on incubation temperature
(Davenport, 1997).
The hawksbill is one of the smaller of the sea turtles, usually less than one metre in
length and around 80kg in weight. It is characterised by a hooked beak on its upper jaw
that is hawk-like in appearance (Spotila, 2004). This beak allows them to feed in coral
reefs on sponges. Their presence often indicates a healthy reef and it has even been
suggested that they have a positive effect on coral reefs, improving biodiversity and
maintaining community dynamics (Leon and Bjorndal, 2002). They are found in tropical
and sub-tropical seas around the world. The hawksbill is poached in large numbers, for
its meat and eggs, but mainly for its intricate shell which is used in tortoiseshell
products. Due to this, hawksbill populations have been under severe decline (Bjorndal,
Bolton and Lagueux, 1993; IUCN, 2008). Hawksbills will nest every two to three years,
coming onto the beach every 14 to 16 days and laying in total five to six clutches per
season. They dig a nest with their back flippers, around 40cm deep and deposit into it
around 160 soft shelled eggs, including infertile capsules (Burton and Burton, 2002).
They prefer to nest on isolated, small beaches in the vegetation zone and the hawksbills
small size and agility allows them to do so. The nesting season on Tobago is April to
September.
The green sea turtle is so named due to the green tinge to the fat found under the
plastron, caused by the diet they have. They are the only species of sea turtle to be
completely herbivorous, feeding on sea-grass meadows and algae in shallow, coastal
waters. They measure from around 81cm in length up to 120cm and weigh around
180kg. The green turtle is found in tropical and sub-tropical seas around the world
(Balazs, 1980).
7
All three species of sea turtle nesting on Tobago are enlisted as Endangered or Critically
Endangered on the IUCN Red List of Threatened Species (IUCN, 2010).
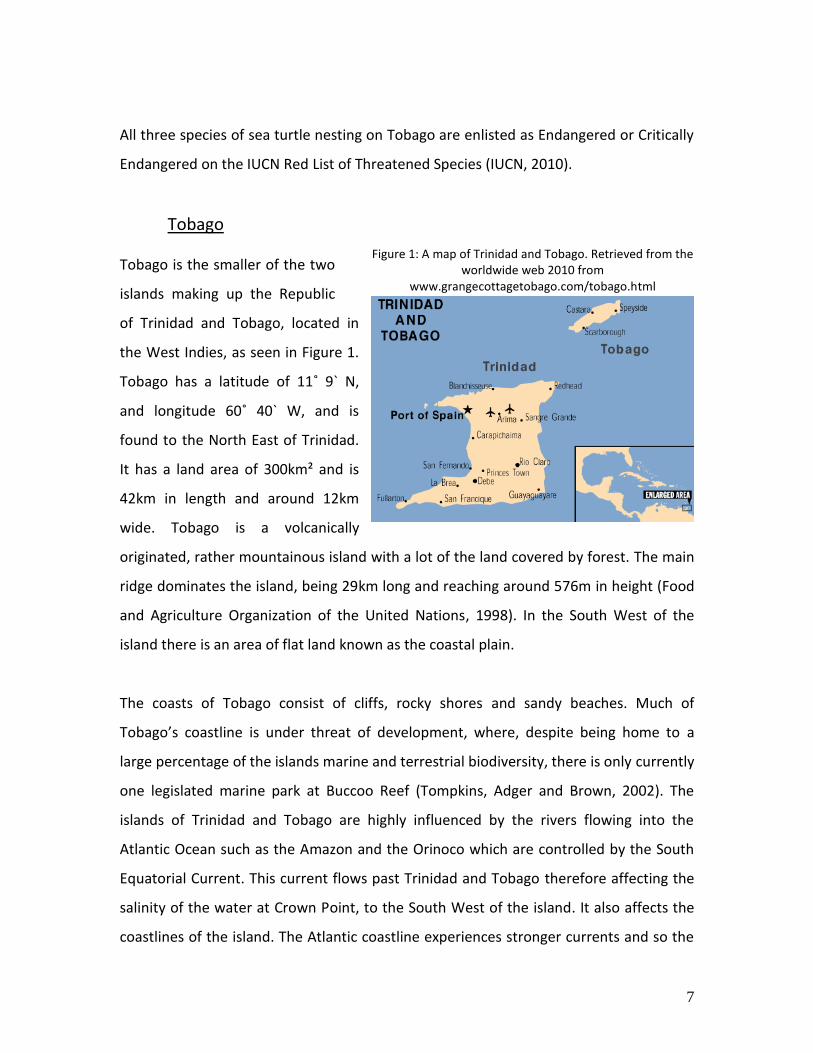
Tobago
Tobago is the smaller of the two
islands making up the Republic
of Trinidad and Tobago, located in
the West Indies, as seen in Figure 1.
Tobago has a latitude of 11˚ 9` N,
and longitude 60˚ 40` W, and is
found to the North East of Trinidad.
It has a land area of 300km² and is
42km in length and around 12km
wide. Tobago is a volcanically
originated, rather mountainous island with a lot of the land covered by forest. The main
ridge dominates the island, being 29km long and reaching around 576m in height (Food
and Agriculture Organization of the United Nations, 1998). In the South West of the
island there is an area of flat land known as the coastal plain.
The coasts of Tobago consist of cliffs, rocky shores and sandy beaches. Much of
Tobago’s coastline is under threat of development, where, despite being home to a
large percentage of the islands marine and terrestrial biodiversity, there is only currently
one legislated marine park at Buccoo Reef (Tompkins, Adger and Brown, 2002). The
islands of Trinidad and Tobago are highly influenced by the rivers flowing into the
Atlantic Ocean such as the Amazon and the Orinoco which are controlled by the South
Equatorial Current. This current flows past Trinidad and Tobago therefore affecting the
salinity of the water at Crown Point, to the South West of the island. It also affects the
coastlines of the island. The Atlantic coastline experiences stronger currents and so the
Figure 1: A map of Trinidad and Tobago. Retrieved from the worldwide web 2010 from
www.grangecottagetobago.com/tobago.html

8
waters are less calm than on the Caribbean coastline. Tobago experiences a semi-diurnal
tide, the cycle lasting just over 12 hours (Kenny, 2000).
Sea Turtles in Tobago
There are very few data on the distribution of sea turtles in Tobago. Dow et al (2007)
reported that hawksbills are found nesting mainly along the Caribbean side of Tobago,
in particular to the north-east. Leatherbacks have been recorded nesting all around the
island on both the Caribbean and Atlantic sides, however most occurrences of nesting
are on the Caribbean coastline. The green turtle has been recorded nesting in small
numbers on the Caribbean side of Tobago (Dow et al, 2007), however there have been
no recorded incidences of greens nesting on the island in the last few years. The last
recording of the tracks of a green turtle on Tobago was in 2007, the outcome of the
nesting attempt was unknown (G. Lalsingh, personal communication, 2010). Sightings of
greens in the water, however, are common, with the turtles feeding on the sea-grass
beds and algae surrounding the island (Kenny, 2008).
An honours project in 2005 looked at the conservation and distribution of nesting sea
turtles around the island of Tobago (Cawley, 2005). The study found that turtles nested
mainly on the Caribbean side of the island rather than the Atlantic coastline. The nesting
population of female leatherbacks was estimated to be between 155 and 258. The
nesting population of female hawksbills was estimated to be between 50 and 88. There
were no recordings of green sea turtles but were reports of green turtles foraging in
Tobago’s coastal waters. Through interviewing local people they found that there has
been a noticeable decline in nesting turtle numbers in recent years and that there was a
lack in knowledge and awareness of the conservation status of sea turtles and their
vulnerability (Cawley, 2005).

9
Since 2005 there have been several other research projects on the sea turtles of Tobago
including:
-A Masters of Research project in 2008 collected incubation temperature profiles from
leatherback turtle nests on Tobago. The study found that a lower mean incubation
temperature led to advantageous morphology traits in hatchlings (Mickelson, 2008).
-A Masters of Research Thesis in 2010 looked at how the morphology and artificial light
influenced the terrestrial transit in leatherbacks nesting on Tobago. It was found that
morphology and light had little influence on the transit in leatherbacks however artificial
light did cause confusion and disorientation (Walker, 2010).
All of the research carried out on the sea turtles of Tobago helps to collect information
on a threatened species where data is much needed. The main threats to the sea turtles
in Tobago are poaching for meat, eggs and shells. Turtle meat and eggs are a traditional
cuisine in Tobago and the shells are used to make jewellery and decorative crafts.
Coastal development is also becoming an increasing threat. Beach chairs, gazebos and
litter obstruct and can be danger to nesting turtles and light pollution confuses both
adults and hatchlings. Fishing is also a common practise in Tobago and turtles can
become entangled in nets and lines (www.seeturtles.org).
All sea turtles that inhabit or nest on the islands of Trinidad or Tobago are protected by
the Conservation of Wildlife Act (1963) and the Fisheries Act (1975), however illegal
poaching still occurs often. All sea turtles and their eggs are only officially protected
during the nesting season and can be hunted legally from October to February, despite
their high conservation status (Lalsingh, 2010).
SOS Tobago
Data collection on sea turtles in Tobago first began in 2000 when a non-governmental
and non-profit organisation, Save Our Sea Turtles (SOS) Tobago was established. SOS
Tobago is community-based and involves both local and foreign volunteers doing much

10
of the data collection. SOS Tobago is involved in four main activities: research,
protection, education and eco-tourism (Leotaud, 2001). They protect the sea turtles by
consistently monitoring three main index beaches through night patrols during the
nesting season. During these patrols data is collected and this activity also helps to
prevent poaching. SOS volunteers tag (using both Passive Integrated Transponder tags
and flipper tags) hawksbills and leatherbacks that come up to nest, and recording other
relevant data about the nesting turtles. SOS Tobago also provides assistance for any
graduates or undergraduates that wish to carry out research projects in Tobago. They
believe strongly in education to help conserve the sea turtles and raise public awareness
through talks, school visits and field trips. They also help to educate tourists, fisherman,
tour guides and villagers. They are involved in eco-tourism by working with tour guides,
guest houses and hotels to encourage turtle friendly practices on the nesting beaches.
Assessing population size
Many other small islands like Tobago have nesting turtle populations. Barbados, for
example, is an island slightly bigger than Tobago 300km away, with nesting populations
of sea turtles. Like Tobago, Barbados has leatherbacks, hawksbills and greens in the
area. Loggerheads are also seen but rarely (Horrocks, 1992). The Barbados Sea Turtle
Project was initiated in 1987 and has carried out a large amount of research there
(Beggs, Horrock and Krueger, 2007). Initially they monitored populations to allow
population estimates of nesting sea turtles populations on Barbados. However now,
beach nesting monitoring occurs, as does in water monitoring. They also do genetic
analysis, rescue and rehabilitation, and satellite telemetry (Barbados Sea Turtle Project
Website).
To be able to conserve sea turtles, knowledge on population size and distribution is key
(Hays, 2000). However, this can be a problem, when the species remain submerged
except for air replenishment, for most of their life-span, as is the case with sea turtles.
Indeed, it is only females that emerge to nest on a beach and they only do so once every

11
two or three years. Long term patrolling of beaches during the nesting season, and the
use of tagging as an aid, is one way to estimate the turtle population of an area. By
regular patrols, threats to the turtles and their eggs through poaching are reduced and
an estimate of turtle nesting numbers can be produced (Horrocks, 1992). Counting
tracks and nesting females is relatively simple, but the resulting data can be difficult to
interpret. Females will only nest once every two or three years and may come onto the
beach several times in one season. Also the females may not use the same beach every
season. Nesting female numbers can show considerable variation from year to year as a
consequence of this. This problem can be reduced by using population models which
can estimate turtle populations for a specific area for a season whilst taking into account
these factors. A recent study by Allen et al (2010) used this method, applying a Poisson
distribution to the number of seen turtles to estimate the number of unseen turtles on
Cousin Island of the Seychelles. There are now several models that have been developed
that can be used for this purpose.
Beach Profiling
Horrocks (1992) states that in conserving marine turtles it is first important to ascertain
what areas and conditions are critical to their survival. Beach surveys can monitor
nesting turtles, allowing numbers and trends to be determined. Beach profiling,
however, can also be used to monitor the nesting habitat of turtles. There have been
long-term concerns over the changing conditions of coastal sandy beaches and their
ability to support nesting turtle populations (Fish et al, 2008). There has been an
increase in human activity in coastal areas with more coastal development, tourism, and
industrialization. The Wider Caribbean Region is classed as a Small Island Developing
State, or SID, and many are tourist-dependant, including Tobago. This means that the
coasts are more likely to be developed and so the beaches are more likely to be affected
by light and noise pollution, and erosion (Varela-Acevedo et al, 2009). There is a lack of
knowledge on what the important features are of a nesting beach for different species
of sea turtle and what is important in nest site selection. Through beach profiling it may

12
be possible to look at the profile of a beach and determine if it is suitable for nesting
turtles.
When a female decides to nest several factors can influence the choice of beach.
Leatherbacks prefer a deep water approach and little or no reef and they require a wide
entry onto the beach (Pritchard, 1971). They also prefer a high energy beaches where
currents produce a steep-fronted profile (Bouchard and Bjorndal, 2000). This could be
due to the difficulty leatherbacks have on land locomotion. A steep approach would
allow the nest to be above high tide levels without the turtle having to travel long
distances up the beach (Hendrickson, 1980). They also prefer open sandy beaches to
protect their plastron from damage on sharp reefs (Eckert, 1987). Green turtles are
thought to prefer beaches with a slightly steep sloped entry and moderate to high
energy waves on approach (Brock, Reece and Ehrhart, 2009). Hawksbills, however,
prefer a steeper slope and calmer waters on emergence on isolated, sheltered beaches
(Varela-Acevedo et al, 2009). They are one of the more flighty species of sea turtles
when nesting and it takes very little movement or noise to cause them to abandon a
nesting attempt. The nesting beaches of hawksbills usually have offshore barrier reefs,
and thick vegetation. Hawksbills are known to nest high on the beach, often amongst
vegetation (Witzell, 1983).
Once a turtle has started to lay its eggs is not easily disturbed, but when a female is
emerging from the sea or attempting to nest she may be startled by lights, noise or
unusual activity and return to sea without nesting. A nest site may be abandoned if an
obstruction is met such as the roots of trees or rocks, if the physical properties of the
sand are not correct or if the egg chamber collapses repeatedly. This is known as a false
crawl or a non-nesting emergence. Turtles may false crawl several times before
choosing a suitable nesting site. The rates of these false crawls may help to determine if
the suitability of the beach is changing over time (Williams-Walls et al, 1983).

13
Using GIS
Geographic Information System or GIS is becoming increasingly popular. It is a
programme that can store, analyse, and present data linked to a location (Schuurman,
2004). The use of GIS in turtle conservation could help to improve our understanding of
exactly where turtles are nesting in an area and what beaches are critical to turtle
nesting and conservation. The areas in which GIS can be used in turtle conservation are
numerous. Data collected over many years can be transformed into a simple format that
is visually easy to understand and from which conservation management plans can be
formed (Breman, 2002). A study by Maktav et al (2000) formed a digital terrain model of
the Lztuzu beach in Turkey where sea turtles nest. They found that GIS was extremely
useful in presenting the data. They state that GIS can be used to combine data on land
and water and that the data can be visually examined to determine how turtles are
affected by environmental, land use and ecological changes.
Project Aims
This project is designed to collect information and draw conclusions on the beaches of
Tobago, relevant to nesting sea turtle numbers, sea turtle species and topographical
profiles of the beaches.
The aims of this project were to:
Estimate the populations of the different species of sea turtles nesting in
Tobago, looking at previously un-monitored beaches using a model, and data
from three index beaches
Profile the major sea turtle nesting beaches on Tobago and look at these in
conjunction with nesting density
Present the data visually using GIS technology so that it is useful for SOS Tobago
to use it in their monitoring and future research

14
Materials and Methods
Location of Study Sites
All research was carried out on the Island of Tobago in collaboration with Save Our Sea
Turtles Tobago. Data was collected from three index beaches; Turtle Beach, Grafton and
Mt. Irvine Back Bay, as can be seen in Figure 2. These beaches are patrolled every year
by SOS.
Figure 2: A map of Tobago showing the location of the study sites around the island. Retrieved from the worldwide web 2010 from www.grangecottagetobago.com/tobago.html
Data on nesting turtle numbers was also collected from other (non-index) beaches
around the island, most of which had seldom previously been studied. These beaches
included Englishman’s Bay, Parlatuvier, Dead Bay, Bloody Bay, Argyle (Carapuse Bay),
Fort Granby, Minister’s Bay (Big Bacolet), Lambeau, Crown Point, Kilgwyn Bay and Sandy
Point, as seen in Figure 2. These beaches are described in detail later on in this project.
15
Data collection on nesting turtles
Materials used:
Data collection sheets and pen
Global Positioning System (GPS)
Measuring tape
Latex Gloves
Bags for nest relocation
Head torch with red filter
Flipper tags and PIT tags with tagging device
The three index beaches were patrolled at night between the hours of 8pm and 6am
every day of the week between the 1st of March and the 30 th of September 2010. This
was done by two groups of volunteers, with one group covering Turtle Beach and the
other patrolling both Grafton and Mt. Irvine Back Bay. Beaches were patrolled at 30
minute intervals, ensuring a regular SOS presence to dissuade illegal poaching and also
ensuring that all turtles were encountered during an early stage of the laying process.
When a turtle or turtle tracks were encountered, a data sheet (Figure 3, Appendix) was
filled in. Only fresh nests were recorded. On the first patrol all nests found were
recorded. On the second patrol GPS prevented the same nests being recorded. It was
relatively easy to identify the turtle nests. Although turtles camouflage it was possible to
see disturbance in the sand and turtle tracks going to and from the nest. It was also
relatively easy to distinguish between species. The tracks of a leatherback were wider
and the flipper marks were symmetrical. Hawksbill tracks were much narrower and the
flipper marks were asymmetrical. If a turtle was seen the species of turtle, time seen,
weather and beach were noted. The patrol members would then sit down on the beach,
far enough from the turtle so as not to disturb it but to still allow monitoring. Once a
turtle deposited 10 or so eggs they would reach a trance-like state from which they
could not be disturbed. It was then that data collection would begin by shining a red
light on the posterior end of the turtle and checking for identification tags. Tag numbers
16
where present were recorded. When no tag was present one was applied to the flap of
skin between the tail and the rear flipper, on each side. A Passive Integrated
Transponder (PIT) tag was inserted into the front right shoulder, if the patrol carried the
equipment to do so. Measurements of the carapace were taken using a 2m flexible
measuring tape. Length was measured keeping the measuring tape as close to the
longitudinal central ridge on the carapace as possible, running from just behind the
turtles head to the posterior tip. The breadth was measured at the widest point from
the lateral ridges, the measuring tape perpendicular to the longitudinal central ridge.
Any distinguishing features such as bite marks or damaged carapace were noted. The
GPS location of the nest was taken to prevent double counting of nests and the beach
zone was recorded. When the turtle had finished laying the outcome and time of entry
back into the sea was noted. If the turtle became confused by lights, people or dogs this
was also recorded. On occasion turtle tracks were encountered after the turtle had
returned to sea. These were classed as estimated lays or unknowns if patrollers were
unsure about the outcome.
The more non-index beaches were patrolled in the daytime between the hours of 7am
and 5pm from the 16th of June until the 5th of August in the following order:
Englishman’s Bay, Parlatuvier, Bloody Bay, Dead Bay, Argyle, Fort Granby, Minister’s Bay
(otherwise known as Big Bacolet), Lambeau, Kilgwyn, Crown Point and Sandy Point. A
car was used for transport between the beaches and the patrols occurred once a week
on a Tuesday where possible. The team of four people included an expert on Tobago’s
sea turtles. When turtle tracks were encountered the data was collected the same as on
the index beaches using a data sheet (Figure 3, Appendix).

17
Beach profiling
Materials used for beach profiling:
Measuring Tape
Abney level
Compass
Data collection sheet and pen
Camera
Global Positioning System (GPS)
Two researchers (Person A and Person B)
The beaches were profiled using the WWF Beach Profiling Manual (Fish, 2011) as a
guide between 16th June and the 5th August 2010. Across the width of the beach,
sampling points 50m apart were measured. From these points the length of the beach
was profiled, with the profile being perpendicular to the water, as seen in Figure 4.
Figure 4: A diagrammatic picture showing beach profiling. Constructed using Adobe Photoshop.
Two people were required to profile the beaches, labelled person A and person B for
clarity. The eye level of person A was determined on person B by standing side by side
and noting where, on person B, person A’s eye level was. Person A then stood at the top
of the sampling point with the Abney level, GPS and compass, and person B stood at the
bottom of the sampling point. The compass bearing of the profile was measured and the
GPS was used to record the starting point. Starting from person A at the top of the
beach person B then stood at the next point of change in slope as seen in Figure 5.

18
Figure 5: A diagram showing the beach profiling. Taken from WWF Profiling Manual (Fish, 2011).
The Abney level was used by lining the eye piece mark up with the eye level determined
on person B. The level was measured by moving the bubble to the centre of the mark on
the eyepiece. The distance between person A and person B was measured and recorded
along with the slope taken from the Abney level. This process was continued at the next
change in slope, with person B moving down to the next point of change in the slope,
and person A moving to the point previously occupied by person B. After the whole
sampling point had been measured person A and B moved to the next sampling point
50m along the beach and repeated the process.
Mapping
The initial plan was to use GIS technology to present the data. However in the end this
route was not possible and so Google Earth and Bing Maps were used to present the
data. Google Earth had only parts of the island available to view in detail and so Bing
maps had to be used to view some of the beaches. However to be able to input the data
into Bing Maps a demo version of software had to be used. This means that the maps
have the words ‘staging’ printed across them.

19
Statistical Analysis
The false crawl results were analysed using a General Linear Model in Minitab 15
Statistical Software. Data first had to undergo Arcsine Transformation before entry into
Minitab.
20
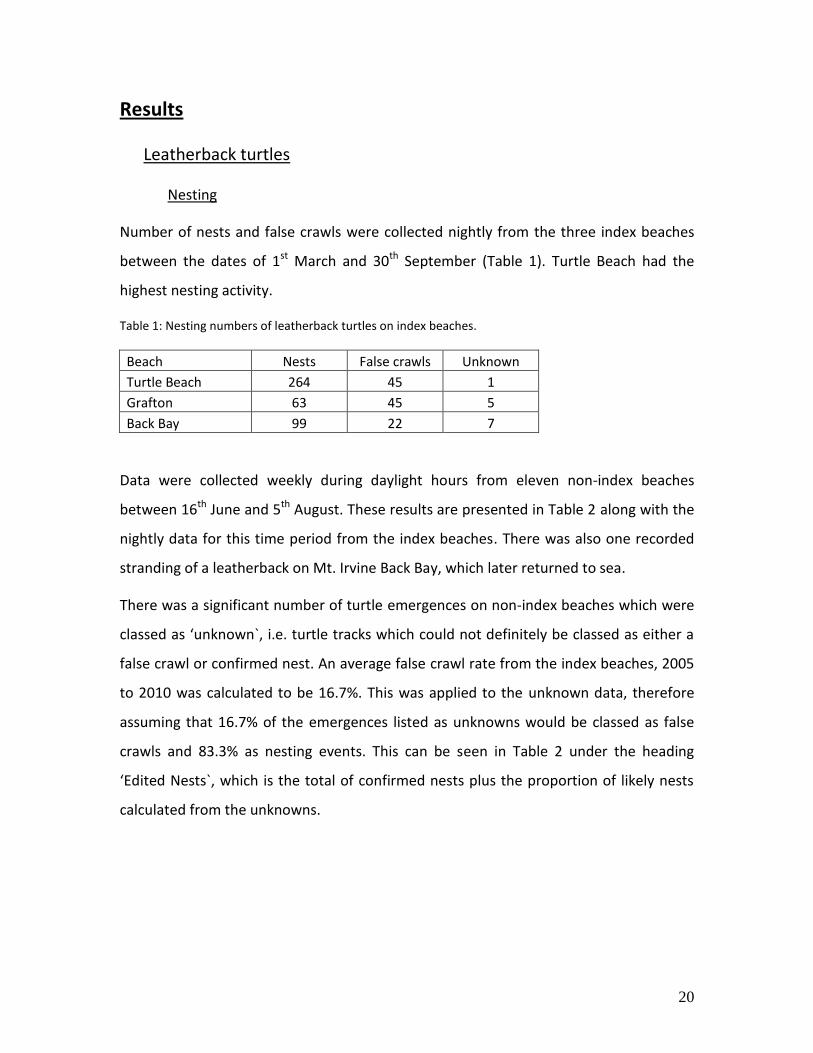
Results
Leatherback turtles
Nesting
Number of nests and false crawls were collected nightly from the three index beaches
between the dates of 1st March and 30th September (Table 1). Turtle Beach had the
highest nesting activity.
Table 1: Nesting numbers of leatherback turtles on index beaches.
Beach Nests False crawls Unknown
Turtle Beach 264 45 1
Grafton 63 45 5
Back Bay 99 22 7
Data were collected weekly during daylight hours from eleven non-index beaches
between 16th June and 5th August. These results are presented in Table 2 along with the
nightly data for this time period from the index beaches. There was also one recorded
stranding of a leatherback on Mt. Irvine Back Bay, which later returned to sea.
There was a significant number of turtle emergences on non-index beaches which were
classed as ‘unknown`, i.e. turtle tracks which could not definitely be classed as either a
false crawl or confirmed nest. An average false crawl rate from the index beaches, 2005
to 2010 was calculated to be 16.7%. This was applied to the unknown data, therefore
assuming that 16.7% of the emergences listed as unknowns would be classed as false
crawls and 83.3% as nesting events. This can be seen in Table 2 under the heading
‘Edited Nests`, which is the total of confirmed nests plus the proportion of likely nests
calculated from the unknowns.

21
Table 2: Nesting numbers of leatherback turtles on index and non-index beaches.
Beach Coast Nests False crawls Unknown Edited Nesting
Turtle Beach Caribbean 96 14 1 97
Grafton Caribbean 30 18 2 32
Mt. Irvine Back Bay Caribbean 36 5 0 36
Englishman's Bay Caribbean 4 1 5 8
Parlatuvier Caribbean 2 1 2 4
Bloody Bay Caribbean 6 3 15 18
Dead Bay Caribbean 10 3 10 18
Argyle Atlantic 0 0 0 0
Fort Granby Atlantic 0 0 0 0
Ministers Bay Atlantic 0 1 5 4
Lambeau Atlantic 0 0 0 0
Kilgwyn Atlantic 0 0 0 0
Crown Point Atlantic 0 0 0 0
Sandy Point Atlantic 0 0 0 0
Total 217
In the above table the first seven nests are located on the Caribbean coastline. The last
seven nests are located on the Atlantic coastline. There is a total of 217 nests in the
Edited Nesting column. From this it was calculated that 98% of leatherback turtles nest
on the Caribbean coastline of Tobago compared with only 2% on the Atlantic coastline
during this time period.
False Crawls
By analysing data from 1st March to 30th September, 2005 to 2010 on index beaches an
average false crawl rate for leatherback turtles was 16.7%. However, the false crawl rate
varied depending on the beach, for example in 2010 the average false crawl rate on
Grafton Beach is 37.7%, whereas on Mt. Irvine Back Bay it is only 15%. There are also
fluctuations between years. Interestingly in 2006 on Mt. Irvine Back Bay there is an
average false crawl rate of 0%. This can be seen in Table 3.

22
Table 3: Average leatherback false crawl rates in % for each beach per year.
Beach 2005 2006 2007 2008 2009 2010
All Beaches 5.5 7.8 19.8 15 27.4 24.8
Turtle Beach 4.3 11.5 15.1 3.5 16.6 14.6
Grafton 7.9 11.8 8.3 23.4 38.2 41.7
Mt. Irvine Back Bay 4.2 0 36 18 27.4 18.2
When in the form of a graph (Figure 6), it is easy to see that there is a general increase
in false crawl rates from 2005 to 2010, particularly in the case of Grafton. In 2007 there
is a large increase in the rate of false crawls on Mt. Irvine Back Bay.
Figure 6: A graph showing the % false crawl rates for leatherbacks for different beaches (N=2159).
0
10
20
30
40
50
2005 2006 2007 2008 2009 2010
Average %
Year
Average % of false crawls in leatherbacks per beach per year
TurtleBeach
Grafton
Mt. IrvineBack Bay
The results were input into Minitab using a General Linear Model and it was found that
the differences in false crawl rates between beaches were not significantly different
from each other (F=1.26, DF=2, P=0.324) or years (F=2.22, DF=5, P=0.133). Therefore an
average false crawl rate for the index beaches is a valid figure to use for the correction
of the unknowns.
23
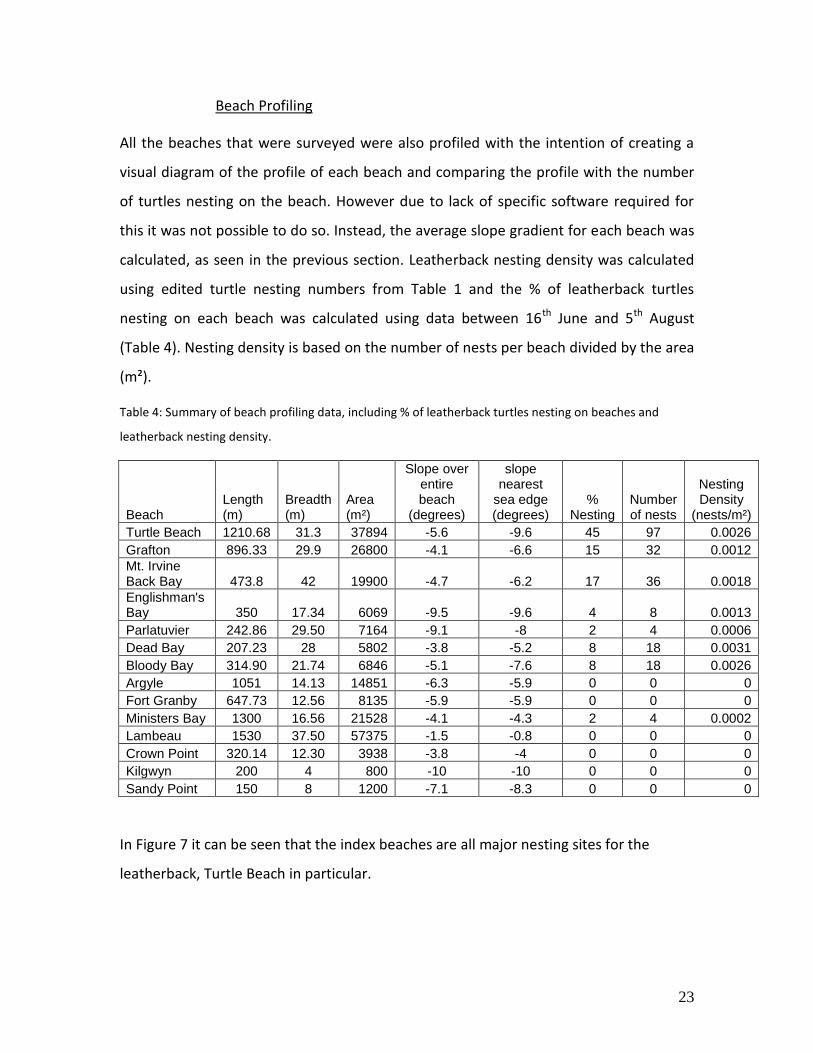
Beach Profiling
All the beaches that were surveyed were also profiled with the intention of creating a
visual diagram of the profile of each beach and comparing the profile with the number
of turtles nesting on the beach. However due to lack of specific software required for
this it was not possible to do so. Instead, the average slope gradient for each beach was
calculated, as seen in the previous section. Leatherback nesting density was calculated
using edited turtle nesting numbers from Table 1 and the % of leatherback turtles
nesting on each beach was calculated using data between 16th June and 5th August
(Table 4). Nesting density is based on the number of nests per beach divided by the area
(m²).
Table 4: Summary of beach profiling data, including % of leatherback turtles nesting on beaches and
leatherback nesting density.
Beach Length (m)
Breadth (m)
Area (m²)
Slope over entire beach
(degrees)
slope nearest
sea edge (degrees)
% Nesting
Number of nests
Nesting Density
(nests/m²)
Turtle Beach 1210.68 31.3 37894 -5.6 -9.6 45 97 0.0026
Grafton 896.33 29.9 26800 -4.1 -6.6 15 32 0.0012
Mt. Irvine Back Bay 473.8 42 19900 -4.7 -6.2 17 36 0.0018
Englishman's Bay 350 17.34 6069 -9.5 -9.6 4 8 0.0013
Parlatuvier 242.86 29.50 7164 -9.1 -8 2 4 0.0006
Dead Bay 207.23 28 5802 -3.8 -5.2 8 18 0.0031
Bloody Bay 314.90 21.74 6846 -5.1 -7.6 8 18 0.0026
Argyle 1051 14.13 14851 -6.3 -5.9 0 0 0
Fort Granby 647.73 12.56 8135 -5.9 -5.9 0 0 0
Ministers Bay 1300 16.56 21528 -4.1 -4.3 2 4 0.0002
Lambeau 1530 37.50 57375 -1.5 -0.8 0 0 0
Crown Point 320.14 12.30 3938 -3.8 -4 0 0 0
Kilgwyn 200 4 800 -10 -10 0 0 0
Sandy Point 150 8 1200 -7.1 -8.3 0 0 0
In Figure 7 it can be seen that the index beaches are all major nesting sites for the
leatherback, Turtle Beach in particular.

24
Figure 7: The % of leatherbacks nesting on beaches.
Hawksbill Turtles
Nesting
Data were collected nightly from index beaches between the dates of 1st March and 30th
September (Table 5). On the 28th July a hawksbill turtle was found dead from poaching
on Grafton Beach.
Table 5: Nesting numbers of hawksbill turtles on index beaches.
Beach Nests False crawls Unknown
Turtle Beach 7 6 0
Grafton 4 7 0
Mt. Irvine Back Bay 13 3 0
Data were collected nightly from three index beaches and weekly during daylight hours
from eleven non-index beaches between 16th June and 5th August (Table 4). On the 22nd
June a local on Englishman’s Bay alerted the patrol to hawksbill turtle tracks where the
tracks led up to a body pit with none leaving. From the body pit evidence could be seen
25
where the turtle was dragged on its back to tyre marks. It can be assumed from this that
the hawksbill turtle was poached.
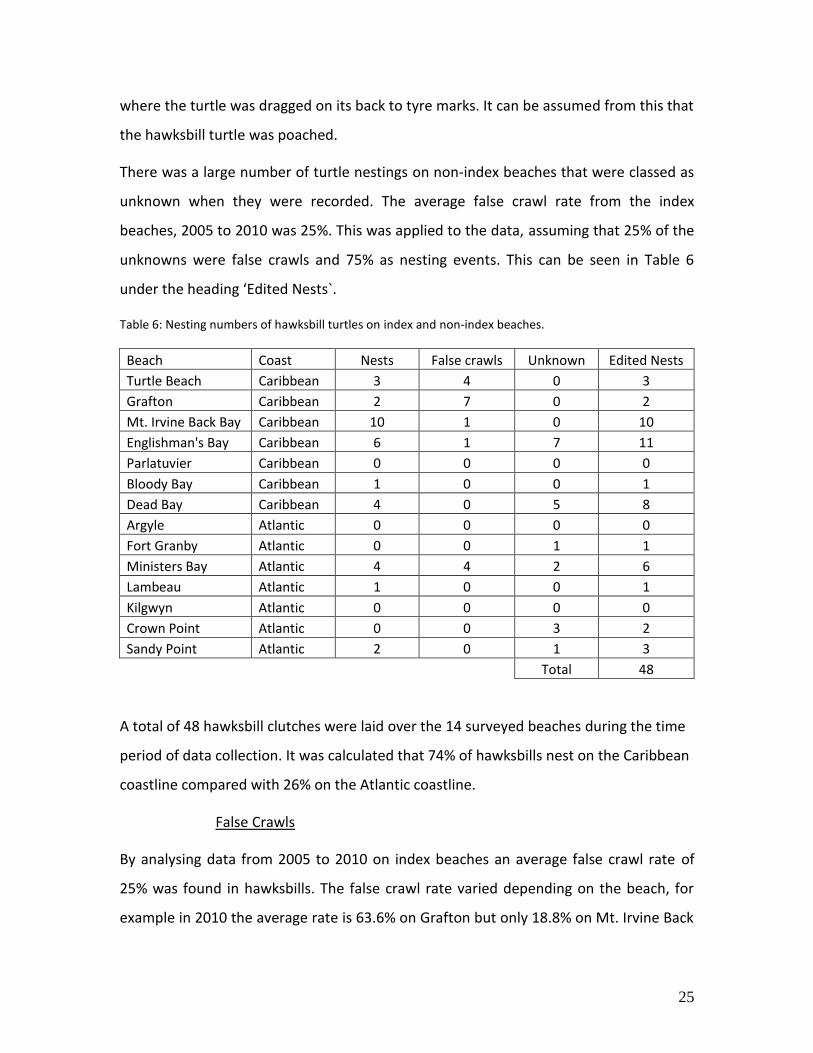
There was a large number of turtle nestings on non-index beaches that were classed as
unknown when they were recorded. The average false crawl rate from the index
beaches, 2005 to 2010 was 25%. This was applied to the data, assuming that 25% of the
unknowns were false crawls and 75% as nesting events. This can be seen in Table 6
under the heading ‘Edited Nests`.
Table 6: Nesting numbers of hawksbill turtles on index and non-index beaches.
Beach Coast Nests False crawls Unknown Edited Nests
Turtle Beach Caribbean 3 4 0 3
Grafton Caribbean 2 7 0 2
Mt. Irvine Back Bay Caribbean 10 1 0 10
Englishman's Bay Caribbean 6 1 7 11
Parlatuvier Caribbean 0 0 0 0
Bloody Bay Caribbean 1 0 0 1
Dead Bay Caribbean 4 0 5 8
Argyle Atlantic 0 0 0 0
Fort Granby Atlantic 0 0 1 1
Ministers Bay Atlantic 4 4 2 6
Lambeau Atlantic 1 0 0 1
Kilgwyn Atlantic 0 0 0 0
Crown Point Atlantic 0 0 3 2
Sandy Point Atlantic 2 0 1 3
Total 48
A total of 48 hawksbill clutches were laid over the 14 surveyed beaches during the time
period of data collection. It was calculated that 74% of hawksbills nest on the Caribbean
coastline compared with 26% on the Atlantic coastline.
False Crawls
By analysing data from 2005 to 2010 on index beaches an average false crawl rate of
25% was found in hawksbills. The false crawl rate varied depending on the beach, for
example in 2010 the average rate is 63.6% on Grafton but only 18.8% on Mt. Irvine Back

26
Bay. There were large fluctuations between beaches and years, perhaps due to small
sample size (Table 7).
Table 7: Average hawksbill false crawl rates in % for each beach per year.
Beach 2005 2006 2007 2008 2009 2010
All Beaches 12.2 26.9 33.3 8.3 26.2 42.9
Turtle Beach 16.7 55.6 0 0 28.6 46.2
Grafton 0 0 0 25 33.3 63.6
Mt. Irvine Back Bay 20 25 100 0 16.7 18.8
In the form of a graph, as seen in Figure 8, it can be seen that there are large
fluctuations in false crawl % rates between years however there does seem to be a
general increase in false crawl rates form 2005 to 2010. From 2008 onwards there is a
steady increase in the rate of false crawls every year. Similar to the leatherback false
crawl rates, there is a large increase in 2007 on Mt. Irvine Back Bay.
Figure 8: A graph showing the % false crawl rates for hawksbills for different beaches (N=116).
0
20
40
60
80
100
2005 2006 2007 2008 2009 2010
Average %
Year
Average % of false crawls in hawksbill per beach per year
Turtle
Beach
Grafton
Mt. IrvineBack Bay
The results were input into Minitab using a General Linear Model and it was found that
the differences in false crawl rates between beaches were not significantly different
from each other (F=0.2, DF=2, P=0.824) or years (F=0.45, DF=5, P=0.8

27
Beach Profiling
All the beaches that were surveyed were also profiled with the intention of creating a
visual diagram of the profile of each beach and comparing the profile with the number
of turtles nesting on the beach. However due to lack of specific software required for
this it was not possible to do so. Instead, the average slope gradient for each beach was
found. Hawksbill nesting density was calculated using edited turtle nesting numbers
from Table 6 and the % of hawksbill turtles nesting on each beach was calculated using
data between 16th June and 5th August (Table 8).
Table 8: Summary of beach profiling data, including % of hawksbill turtles nesting on beaches and
hawksbill nesting density.
Beach Length Area
Slope over entire beach
(degrees)
slope nearest
sea edge (degrees)
Number of nests
% Nesting
Nesting Density
Turtle Beach 1210.68 37894 -5.6 -9.6 3 6 0.00008
Grafton 896.33 26800 -4.1 -6.6 2 4 0.00007
Mt. Irvine Back Bay 473.8 19900 -4.7 -6.2 10 21 0.00050
Englishmans 350 6069 -9.5 -9.6 11 23 0.00181
Parlatuvier 242.86 7164 -9.1 -8 0 0 0
Dead Bay 207.23 5802 -3.8 -5.2 8 17 0.00138
Bloody Bay 314.90 6846 -5.1 -7.6 1 2 0.00015
Argyle 1051 14851 -6.3 -5.9 0 0 0
Fort Granby 647.73 8135 -5.9 -5.9 1 2 0.00012
Ministers Bay 1300 21528 -4.1 -4.3 6 13 0.00028
Lambeau 1530 57375 -1.5 -0.8 1 2 0.00002
Crown Point 320.14 3938 -3.8 -4 2 4 0.0005
Kilgwyn 200 800 -10 -10 0 0 0
Sandy Point 150 1200 -7.1 -8.3 3 6 0.00250
Englishman’s Bay, Mt. Irvine Back Bay, Dead Bay and Minister’s Bay are all important
nesting sites for the hawksbill (Figure 9).

28
Figure 9: The % of hawksbills nesting on beaches.
Mapping
Bing Maps and Google Earth were used to form satellite images of the beaches showing
turtle nesting sites, both hawksbill and leatherback. A GPS was used to record nesting
sites. However in some cases due to a bad signal and the inaccuracy of a GPS, nesting
sites may be recorded around 5 metres away from their actual location, as can be seen
in the maps where nesting points are recorded close to the water or amongst the trees.
The data seen in the maps consists of all turtle nesting events (both hawksbill and
leatherback) including false crawls from 16th June to the 5th August. In some of the maps
the turtle nesting numbers may not match tables due to GPS coordinates missing from
the occasional event.
29
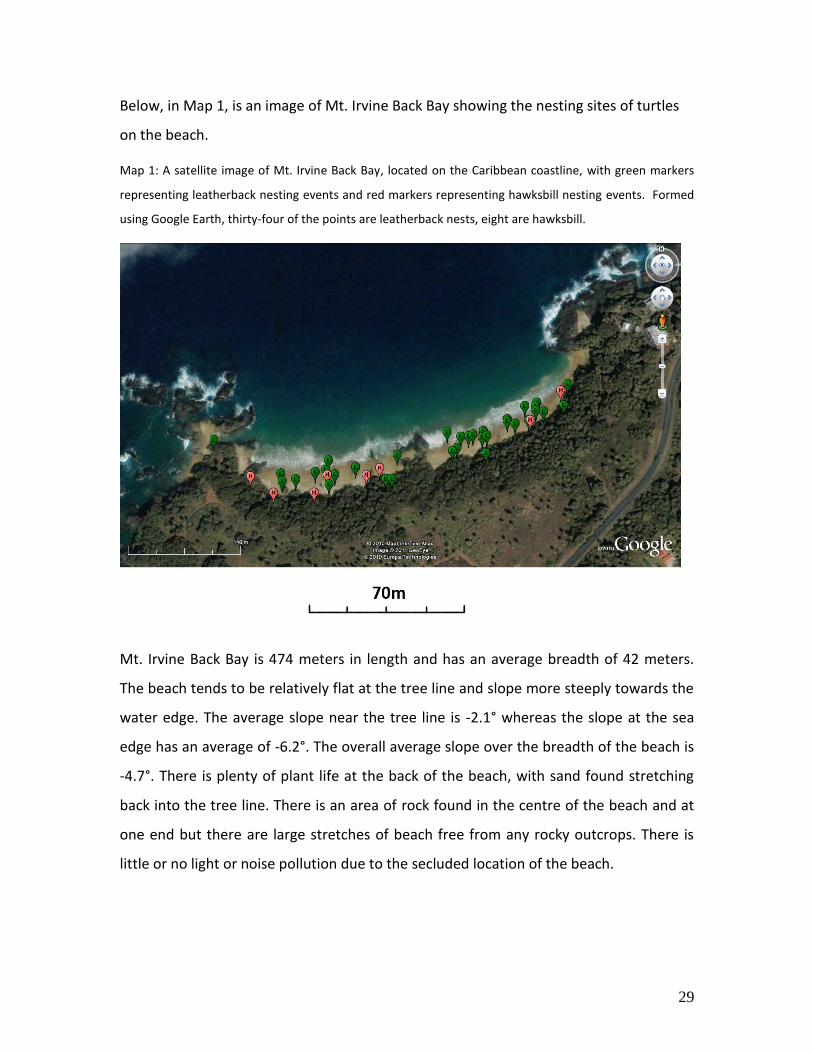
Below, in Map 1, is an image of Mt. Irvine Back Bay showing the nesting sites of turtles
on the beach.
Map 1: A satellite image of Mt. Irvine Back Bay, located on the Caribbean coastline, with green markers
representing leatherback nesting events and red markers representing hawksbill nesting events. Formed
using Google Earth, thirty-four of the points are leatherback nests, eight are hawksbill.
Mt. Irvine Back Bay is 474 meters in length and has an average breadth of 42 meters.
The beach tends to be relatively flat at the tree line and slope more steeply towards the
water edge. The average slope near the tree line is -2.1° whereas the slope at the sea
edge has an average of -6.2°. The overall average slope over the breadth of the beach is
-4.7°. There is plenty of plant life at the back of the beach, with sand found stretching
back into the tree line. There is an area of rock found in the centre of the beach and at
one end but there are large stretches of beach free from any rocky outcrops. There is
little or no light or noise pollution due to the secluded location of the beach.
30
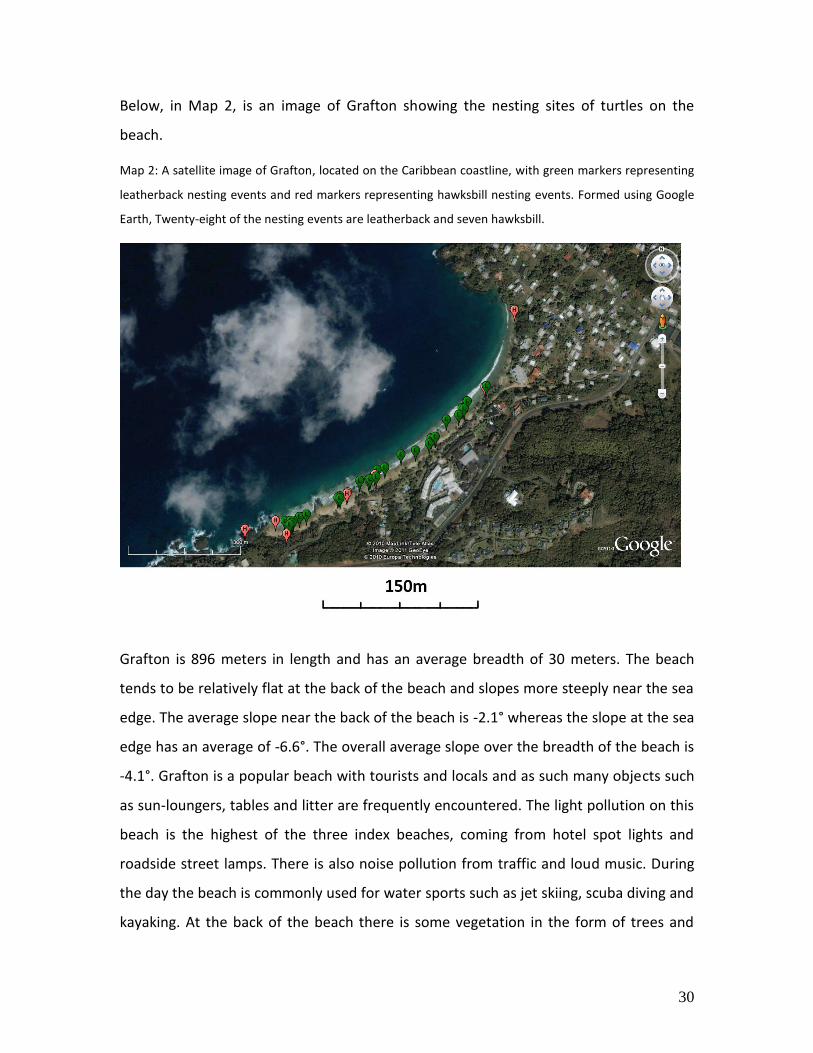
Below, in Map 2, is an image of Grafton showing the nesting sites of turtles on the
beach.
Map 2: A satellite image of Grafton, located on the Caribbean coastline, with green markers representing
leatherback nesting events and red markers representing hawksbill nesting events. Formed using Google
Earth, Twenty-eight of the nesting events are leatherback and seven hawksbill.
Grafton is 896 meters in length and has an average breadth of 30 meters. The beach
tends to be relatively flat at the back of the beach and slopes more steeply near the sea
edge. The average slope near the back of the beach is -2.1° whereas the slope at the sea
edge has an average of -6.6°. The overall average slope over the breadth of the beach is
-4.1°. Grafton is a popular beach with tourists and locals and as such many objects such
as sun-loungers, tables and litter are frequently encountered. The light pollution on this
beach is the highest of the three index beaches, coming from hotel spot lights and
roadside street lamps. There is also noise pollution from traffic and loud music. During
the day the beach is commonly used for water sports such as jet skiing, scuba diving and
kayaking. At the back of the beach there is some vegetation in the form of trees and

31
small bushes. Along the length of the beach are several drains, causing pools of
stagnant, unclean water. On occasion turtles will become stranded in these pools,
unable to escape them due to the steep sides.

32
Below, in Map 3, is an image of Turtle Beach showing the nesting sites of turtles on the
beach.
Map 3: A satellite image of Turtle Beach, located on the Caribbean coastline, with green markers
representing leatherback nesting events and red markers representing hawksbill nesting events. Formed
using Google Earth, with 81 counts of leatherback nesting events and five hawksbill.
Turtle Beach is 1211 meters in length and has an average breadth of 31 meters. The
beach tends to be almost flat at the back of the beach and slopes very steeply at the
water’s edge. The average slope near the back of the beach is -1.8° whereas the slope at
the sea edge has an average of -9.6°. The overall average slope over the breadth of the
beach is -5.6°. Turtle Beach, like Grafton, is popular with tourists. Sun-loungers, tables,
litter and parasols are commonly found. There is a fishery based on the beach with nets
and small boats found on the beach regularly. During the day there is often jet skiing
and kayaking in the water. Along the back of the beach in some areas it is highly
developed with little vegetation and often the top of the beach meets stone walls or
hotels. In other areas there is lots of vegetation at the back of the beach. There are two

33
rivers that cross the beach, one at the Northern end and one at the Southern end of the
beach. There is light pollution from hotel spotlights and often noise pollution from
people, loud music and traffic.

34
Below, in Map 4, is an image of Englishman’s Bay showing the nesting sites of turtles on
the beach. The word ‘Staging` that is present on the map is a watermark present on all
Bing Maps and is not significant. It was not possible for these maps to separate
leatherback and hawksbill nesting events and so the number of each is stated in the
map description below.
Map 4: A satellite image of Englishman’s Bay, located on the Caribbean coastline, with turtle nests
represented by the yellow spots, formed from Bing Maps. Fifteen of the points are leatherback nesting
events, ten are hawksbill.
Englishman’s Bay is 350 meters in length and has an average breadth of 17 meters. The
beach tends to slope steeply from the back of the beach, continuing to the sea. The
average slope from the back of the beach is the same as the average slope from the sea
edge at -9.6°. The overall average slope over the breadth of the beach is -9.5°.
Englishman’s Bay is relatively secluded with little or no light or noise pollution at night.
The back of the beach is covered with vegetation on one side and rocks on the other.

35
Below, in Map 5, is an image of Parlatuvier showing the nesting sites of turtles on the
beach.
Map 5: A satellite image of Parlatuvier, located on the Caribbean coastline, with turtle nests represented
by the yellow spots, formed from Bing Maps. All five points are leatherback nesting events.
Parlatuvier is 243 meters in length and has an average breadth of 30 meters. The beach
tends to have a relatively steep slope at the back of the beach, becoming slightly
steeper at the water’s edge. The average slope near the back of the beach is -7.7° and
the slope at the sea edge has an average of -8°. The overall average slope over the
breadth of the beach is -9.1°. Parlatuvier is used often for fishing with many nets
covering the beach and a long pier with many boats in the water. There is very little
vegetation at the back of the beach due to development although there are some small
bushes and grasses present. There may be some light pollution due to the proximity of
buildings.

36
Below, in Map 6, is an image of Dead Bay showing the nesting sites of turtles on the
beach.
Map 6: A satellite image of Dead Bay, located on the Caribbean coastline, with turtle nests represented by
the yellow spots, formed from Bing Maps. Twenty-three of the points are leatherback nesting events, nine
are hawksbill.
Dead Bay is 207 meters in length and has an average breadth of 28 meters. The beach
tends to slope gently at the tree-line becoming steeper towards the water’s edge. The
average slope near the back of the beach is -3.3° whereas the slope at the sea edge has
an average of -5.2°. The overall average slope over the breadth of the beach is -3.8°.
Dead Bay is very secluded with a forest track and steep cliff track leading to the beach.
There is a river running down the beach which tends to vary in the path it cuts across
the beach. There would be no light or noise pollution on the beach at night due to its
remote location.

37
Below, in Map 7, is an image of Bloody Bay showing the nesting sites of turtles on the
beach.
Map 7: A satellite image of Bloody Bay, located on the Caribbean coastline, with turtle nests represented
by the yellow spots, formed from Bing Maps. Twenty-four of the points are leatherback nesting events,
one is hawksbill.
Bloody Bay is 315 meters in length and has an average breadth of 22 meters. The beach
tends to slope gently at the tree line, becoming steeper towards the water’s edge. The
average slope near the back of the beach is -2.3° whereas the slope at the sea edge has
an average of -7.6°. The overall average slope over the breadth of the beach is -5.1°. Due
to construction work Bloody Bay is covered in many small boulders and car tracks were
frequently seen on the beach. There was limited vegetation at the back of the beach but
there were some grasses. At night there would be little or no light or noise pollution due
to the secluded location of the beach.

38
Below, in Map 8, is an image of Argyle.
Map 8: A satellite image of Argyle, located on the Atlantic coastline, formed from Bing Maps. There were
no recordings of turtle tracks on this beach.
Argyle is 1051 meters in length and has an average breadth of 14 meters. The beach
tends to slope from the tree line to the water’s edge with little difference in the slope,
becoming slightly less steep towards the water’s edge. The average slope near the back
of the beach is -6.6° whereas the slope at the sea edge has an average of -5.9°. The
overall average slope over the breadth of the beach is -6.3°. The beach is long and
narrow with tides reaching the vegetation line at the back of the beach. There may be
some light pollution at night due to proximity of hotels and buildings.

39
Below, in Map 9, is an image of Fort Granby showing the nesting sites of turtles on the
beach.
Map 9: A satellite image of Fort Granby, located on the Atlantic coastline, with turtle nests represented by
the yellow spots, formed from Bing Maps. The only instance of turtle nesting events on this beach is
hawksbill.
Fort Granby is 648 meters in length and has an average breadth of 13 meters. The beach
tends to slope steeply at the tree-line, becoming only slightly less steep towards the
water’s edge. The average slope near the back of the beach is -6.8° whereas the slope at
the sea edge has an average of -5.9°. The overall average slope over the breadth of the
beach is -5.9°. Fort Granby Bay is similar to Argyle in that it is long and narrow with a
steeper slope towards the back of the beach and in that the tides come up high, often
covering the entire beach. There is little or no light or noise pollution at night due to the
secluded location of the bay.
40
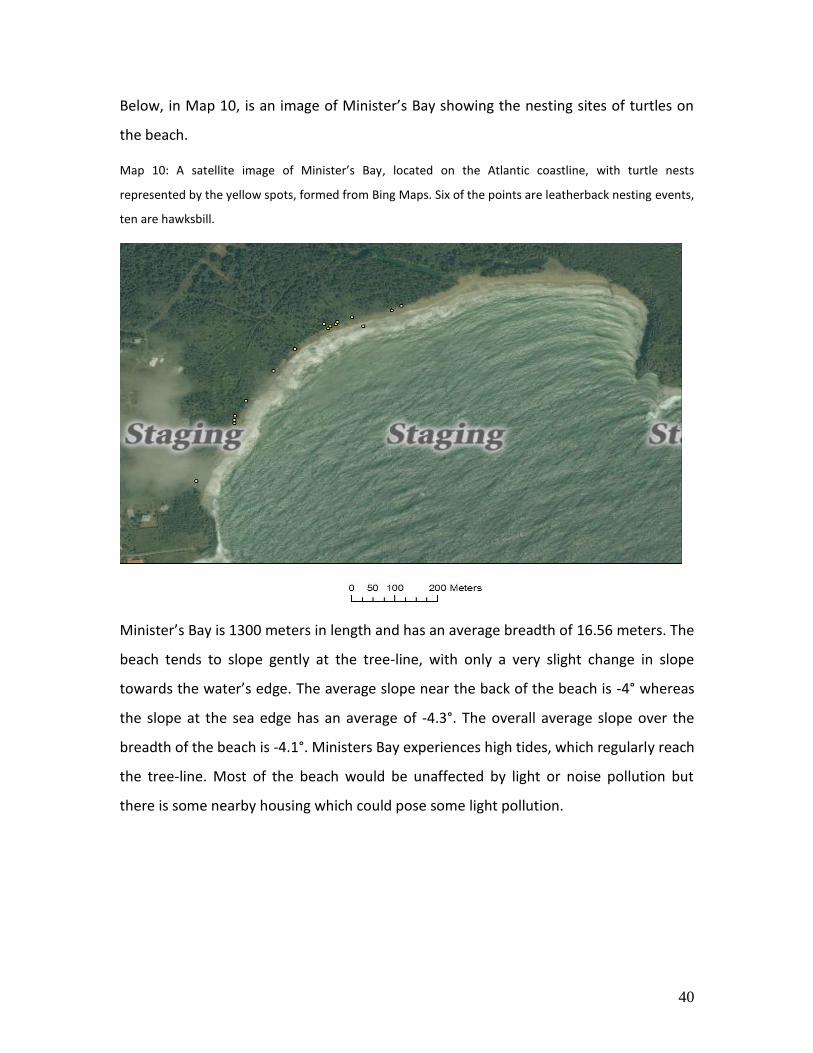
Below, in Map 10, is an image of Minister’s Bay showing the nesting sites of turtles on
the beach.
Map 10: A satellite image of Minister’s Bay, located on the Atlantic coastline, with turtle nests
represented by the yellow spots, formed from Bing Maps. Six of the points are leatherback nesting events,
ten are hawksbill.
Minister’s Bay is 1300 meters in length and has an average breadth of 16.56 meters. The
beach tends to slope gently at the tree-line, with only a very slight change in slope
towards the water’s edge. The average slope near the back of the beach is -4° whereas
the slope at the sea edge has an average of -4.3°. The overall average slope over the
breadth of the beach is -4.1°. Ministers Bay experiences high tides, which regularly reach
the tree-line. Most of the beach would be unaffected by light or noise pollution but
there is some nearby housing which could pose some light pollution.
41
Below, in Map 11, is an image of Lambeau showing the nesting sites of turtles on the
beach. There was one instance during data collection where the tracks of hatchlings
were found and the nest was located. Other than this case no other instances of nesting
was recorded.
Map 11: A satellite image of Lambeau, located on the Atlantic coastline, with turtle nests represented by
the yellow spots, formed from Google Earth. The only instance of turtle nesting was hawksbill.
Lambeau is 1530 meters in length and has an average breadth of 38 meters. The beach
tends to slope very gently, with a slight decrease in slope towards the water’s edge. The
average slope near the back of the beach is -2.1° whereas the slope at the sea edge has
an average of -0.8°, almost horizontal. The overall average slope over the breadth of the
beach is -1.5°. On this beach tides cover the breadth of the beach regularly. There is
vegetation at the back of the beach including trees, bushes and grasses. There may be
some light pollution at night due to the proximity of hotels and buildings.
42
Below, in Map 12, is an image of Crown Point showing the nesting sites of turtles on the
beach.
Map 12: A satellite image of Crown Point, located on the Atlantic coastline, with turtle nests represented
by the yellow spots, formed from Google Earth. All instances of turtle nesting events were hawksbill.
Crown Point is 320 meters in length and has an average breadth of 12 meters. The
beach tends to slope gently at the tree-line, becoming only slightly steeper towards the
water’s edge, with very little difference in slope along the breadth of the beach. The
average slope near the back of the beach is -3.8° and the slope at the sea edge has an
average of -4°. The overall average slope over the breadth of the beach is -3.8°. At the
back of the beach there are large amounts of vegetation. The tide reaches high on the
beach, regularly meeting the tree-line and covering the entire breadth if the beach.
Crown Point is located extremely close to the airport and as such would receive high
levels of light and noise pollution.

43
Below, in Map 13, is an image of Kilgwyn. There was no evidence of turtle nesting
events on the beach during data collection.
Map 13: A satellite image of Kilgwyn, located on the Atlantic coastline, formed from Google Earth.
Kilgwyn is 200 meters in length and has an average breadth of 4 meters. The beach
tends to slopes very steeply with just one slope maintained along the 4 metres and no
change in slope. The overall average slope over the breadth of the beach is -10°. Kilgwyn
Bay is located very near to the airport, which is found just outside the top edge of Map
13. As such the bay may experience light and noise pollution. Vegetation is found in
large amounts in the form of trees and bushes at the top of the beach. Tides regularly
reach the tree-line covering the entire breadth of the beach.
44
Below, in Map 14, is an image of Sandy Point showing the nesting sites of turtles on the
beach.
Map 14: A satellite image of Sandy Point, located on the Atlantic coastline, with turtle nests represented
by the yellow spots, formed from Google Earth. All instances of turtle nesting were hawksbill.
Sandy Point is 150 meters in length and has an average breadth of 8 meters. The beach
tends to slope steeply at the tree-line, becoming steeper towards the water’s edge. The
average slope near the back of the beach is -6° and the slope at the sea edge has an
average of -8.3°. The overall average slope over the breadth of the beach is -7.1°. Sandy
Point is located next to the airport runway and as such may receive high levels of light
and noise pollution. The beach has large amounts of vegetation at the back in the form
of large bushes. It is popular with people as it is easy to access from the road.
45
Limitations in Data Collection
There are some recognised limitations in the data collection methods used for this
project. During the data collection on non-index beaches, it was possible there could
have been some variation in effort and surveyor experience. During the profiling and
surveying there were always two people who carried out the work every week, myself
and an experienced observer, Giancarlo Lalsingh, who was the only person to decide the
category of the nesting event. The two helpers for beach profiling changed most weeks,
but I was there to oversee procedures and ensure they remained the same in each case.
In data collection for the non-index beaches the observers varied, with different groups
on different beaches every night, however there was always an experienced leader in
the group to ensure data collection was carried out correctly.
In surveying the non-index beaches the aim was to patrol every beach each week.
However sometimes this was not possible. On occasion, bad weather conditions would
prevent this by making roads impassable, and conditions dangerous in the case of
lightning storms. On others high tides meant that only parts of some beaches could be
surveyed due to access. The beaches were surveyed as often as possible keeping in
mind the health and safety of the team. The circumstances during weeks of patrols can
be seen below in Table 8. The circumstances are stated as ‘possible` to patrol, ‘not
possible` to patrol or the patrol was ‘not completed`.

46
Table 8: Showing when and where patrols took place on non-index beaches.
Beaches Week 1 Week 2 Week 3 Week 4 Week 5 Week 6 Week 7 Week 8
Englishman's Bay Possible Possible Possible
Not Possible Possible Possible Possible Possible
Parlatuvier Possible Possible Possible Not Possible Possible Possible Possible Possible
Bloody Bay Possible Possible Possible Not Possible Possible Possible Possible Possible
Dead Bay Possible Possible Possible Not Possible Possible Possible Possible Possible
Argyle Possible Not Completed Possible
Not Possible Possible
Not Completed Possible
Not Completed
Fort Granby Possible Possible Possible Not Possible Possible Possible Possible Possible
Ministers Bay Possible Possible Possible Not Possible
Not Possible Possible Possible Possible
Lambeau Possible Possible Possible Not Possible
Not Possible Possible Possible Possible
Kilgwyn Possible Possible Possible Not Possible
Not Possible Possible Possible Possible
Crown Point Possible Possible Possible Not Possible
Not Possible Possible Possible Possible
Sandy Point Possible Possible Possible Not Possible
Not Possible Possible Possible Possible
The turtle nesting season occurs during the rainy season in Tobago. Often there would
be heavy rainfall. There were some concerns that this would cause turtle tracks and
nesting behaviour to be washed away. Although the condition of the nests did
deteriorate over the weeks, generally, despite heavy rain, the tracks were still able to be
observed. This was not the case on beaches where high tides washed away all evidence
of turtle nesting behaviour.
Species identification errors may occur in cases where tracks are particularly
deteriorated or data collectors are relatively in-experienced however the tracks of
different species are distinct enough that this would be a rare occurrence and not
enough to cause significant effects on the results.

47
During daylight surveys of non-index beaches it was always the case that turtle tracks
were encountered rather than the turtles themselves. Often it was difficult to determine
the outcome of tracks and so they were identified as unknown. This became confusing
when evaluating the data as such a large amount of the data was classed under this
category.
48
Discussion
Leatherback
Sea Turtle Nesting Behaviour
In Table 1 it can be seen that there are a significant number of leatherback turtle nests
recorded in Tobago, with 426 confirmed nests in the season over the three index
beaches. Previous research has stated that Trinidad and Tobago support the second
largest nesting group of leatherback in the western hemisphere (Lum, 2005).
In Table 2 it can be seen that the three index beaches have the largest numbers of
leatherbacks nesting on them, Turtle Beach in particular is a key nesting site. This may
be due to the nesting preferences of the species. Leatherbacks tend to prefer beaches
with a deep approach, high wave energy and a steep front (Livingstone, 2006). The
three main index beaches are all long, open and relatively wide, all features that
leatherbacks prefer (Nordmoe et al, 2004). It may be that the index beaches on Tobago
are more suited to the larger, more cumbersome leatherback turtle.
In this study it was found that 98.4% of leatherback nest on the Caribbean coastline and
only 1.6% on the Atlantic coastline. The Caribbean coast of Tobago is more sheltered
and protected from exposure and erosion than the Atlantic coast. In the study by
Horrocks and Scott (1991) they found that the beaches on the west coast in Barbados
tended to be steeper in slope on emergence from the water than east or south coast
beaches. From this study the results were similar in that the Caribbean coastline had an
average gradient of -7.5 near the sea edge as compared to -5.6 on the Atlantic coastline.
With leatherbacks preferring a steep gradient on emergence from the sea this could be
another reason as to why turtles choose to nest mainly on the Caribbean coastline. A
previous study by Cawley (2005) found the Atlantic coast of Tobago to be far more
populated and under more development than the Caribbean coast. One of the main
roads is found on the Atlantic side of the island, often running close to beaches. There
was evidence of sand mining in 2005 on the beaches on this side of the island and there

49
was evidence still in 2010 on Fort Granby (Cawley, 2005). Both development and sand
mining leads to flatter beaches, with less vegetation and less suitable substrate for
nesting, perhaps the reason for fewer nests on the Atlantic Coast.
With leatherback turtles nesting on three main beaches on Tobago this makes
monitoring them relatively easy. By patrolling only the three main index beaches nearly
all of the leatherback turtle nesting population of Tobago can be covered. This means
that fewer resources such as time and money are required to ensure the conservation
and research of this species on Tobago.
False crawls
A false crawl rate was used in the results to determine how likely the recorded unknown
nesting behaviour was to be either a false crawl or a nesting attempt. The false crawl
rates were not found to be significant and this may be due to small sample size.
Certainly in the case of 0% false crawl rate in 2008, there were only 16 leatherbacks that
nested on the beach that year, none of which false crawled. However the average false
crawl rates that were calculated fit well within other false crawl rates found in previous
studies.
For leatherback the average false crawl rate for all index beaches from 2005 to 2010
was 16.7%. A study by Livingstone (2006) found false crawl rates to vary between 8.3%
and 24.9% with a mean of 11.8% over five beaches whilst another study found false
crawl rates to vary between 16% and 25% (Tucker, 1988). A study by Hilterman and
Goverse (2003) found that leatherbacks had a false crawl rate ranging from 8% to 16%.
Another study found that leatherback false crawls are relatively rare, usually under 10%
(Schroeder and Murphy, 1999). Yet another study found leatherback false crawl rates to
be 17.78% (Gaos et al, 2006).
50
From 2005 to 2010 the average leatherback false crawl rate seems to undergo a general
increase each year, from 5.5% in 2005 to 22.1% in 2010. Grafton in particular has a high
increase over the years. It is hard to tell if this increase in false crawl rates is due to an
increase in patrol effort or due to an increase in development and Tobago’s popularity
as a tourist resort. Patrol effort from SOS Tobago has increased over the last 5 years,
with an increase in numbers of patrollers available and hours spent patrolling. Initially
patrols began at 9pm and ended at 2am at the beginning of the season in 2005, moving
to 3am during peak nesting season. However in 2010 this had increased to beginning at
8pm and ending at 4am, with morning walks until 6am also included during peak season
(Lalsingh, 2010, Clovis, 2005). The increase in false crawl rate could also be due to the
development of hotels, beach lighting and an increase in use by people. Tobago is
becoming an increasingly popular tourist resort and there is more development on
beaches and beach fronts as a result.
There are many factors that may cause sea turtles to false crawl, some of them
unknown. The presence of people and predators can cause turtles to false crawl as can
light or noise. Grafton and Turtle Beach experience both light and noise pollution, with
people and dogs common on the beach at night. Grafton in particular experiences very
high levels of light and noise pollution along the majority of the beach. The light
pollution comes from hotels and building spot lights, the noise pollution from loud
music being played most nights from a bar found at the tree line of the beach. Grafton
had the highest false crawl rates for leatherbacks in every year, except in 2007 where it
was Mt. Irvine Back Bay. These results show that although light and noise pollution may
be a strong influencing factor in the rate of false crawls it is not the only one.
In 2007 there was a particularly high rate of false crawls for leatherback turtles on Mt.
Irvine Back Bay. This beach is highly dynamic in terms of erosion and sand movement
and it may be that in 2007 the profile of the beach was simply unsuitable for nesting.
51
When a female nests large amounts of valuable energy are required to drag her body up
the beach and down the beach. When disturbed she may false crawl up to several time
in one night, preventing her from nesting and using up this valuable energy.
Interestingly in a masters project it was found that loggerhead female turtles face
increased stress levels following a false crawl and due to this she is more at risk of being
struck by boats, leading to injury or even death (Sobin, 2008).
Because of this false crawls are a particularly important aspect of turtle nesting
behaviour. Not only does an increase in false crawl rates use up large amounts of
valuable energy and lead to an increased risk of injury and death but they may also
indicate the suitability of a beach for nesting. They can be studied over a period of years
to see if there are changes in characteristics of a beach, for instance an increased
presence of people or changes in profile. The rate of false crawl may also indicate the
effects of beach front development. It would be interesting to study the false crawl
rates further and to look at the effect of light and noise pollution on false crawls. Due to
the false crawl rates in this study not being significant no conclusions can be drawn
about the effect of lighting on sea turtle nesting behaviour. The three index beaches
have different levels of light pollution with Grafton receiving the highest levels and Mt.
Irvine Back Bay receiving almost no light pollution. Further research could use these
beaches to look at the relationship between light pollution and nesting behaviour.
Population Model
One of the aims of the project was to use a population model to estimate the number of
sea turtles that nest on Tobago. Unfortunately it was not possible to complete this as
the model was still in the development stages and could not be finished in time. This
could be used in the future to better understand Tobago’s nesting populations.

52
The data from the index beaches was suitable to use in the model but data from the
non-index beaches was not partly because of small sample size, and the uncertainty of
the data due to unknowns.
Models are a useful tool for a better understanding of worldwide populations, which is
required in the conservation of the species. Without first having an estimate of sea
turtle populations, it is hard to know to what extent they need protected. By forming
estimates of where turtle nesting populations are highest, conservation and
management plans can be formed to ensure that areas of high numbers have adequate
protection.
Beach Profiling
From Table 4 it can be seen that there are varying degrees of slopes on the beaches
studied from -1.5 on Lambeau to -10 on Kilgwyn. There does not seem to be a pattern in
the overall slope gradient and the percentage of turtles nesting and so although it may
be an influencing factor, it is not the only factor affecting the number of nesting turtles.
Turtle beach is a major nesting site for leatherbacks supporting nearly half of all turtles
nesting on Tobago. There seems to be no significance in the length, area or slope of
turtle beach as many of the other beaches have similar characteristics but fewer or no
turtles nesting on them. Turtle Beach may be a popular nesting site due to the offshore
profile. It has a deep, wide approach and very little in the way of obstructions, ideal for
leatherback turtles.
In the study by Horrocks and Scott (1991) they found that the beaches on the west coast
in Barbados tended to be steeper in slope on emergence from the water than east or
south coast beaches. From this study the results were similar in that the Caribbean
coastline had an average gradient of -7.5 near the sea edge as compared to -5.6 on the
Atlantic coastline. This may be one of the reasons as to why more leatherbacks nest on
the Caribbean coastline as opposed to the Atlantic coastline. A steeper gradient on

53
entry to the beach from the water would mean that leatherbacks have less distance to
travel to ensure that the nest is above the water level mark.
There are long term concerns over the ability of beaches to sustain turtle populations
due to the constant development that is occurring along coastlines. It is now understood
that development can have a great impact on turtle survival rates. Harewood and
Horrocks (2008) conducted a study on Barbados to assess the impacts of coastal
development on hatchling success. This is something that affects hatchlings on many
small Caribbean islands, Tobago included. They found that coastal development has a
large impact on the survival rate of hatchlings and can decrease a hatchlings survival
rate significantly. As Tobago becomes more established as a tourist destination the rate
of development can only increase. Development can affect the beach profile
dramatically by causing coastlines to be more susceptible to erosion and extreme
weather. By regular profiling of Tobago’s beaches important characteristics in a turtle
nesting beach can be established. There is a lack of knowledge about what factors of a
beach are important for nesting turtles and so looking at beach profiles in relation to
density could help to improve on this.
Hawksbill turtles
Nesting Behaviour
In Table 1 it can be seen that hawksbill numbers are very low on the three index
beaches, with only 24 recorded nests. Half of these 24 nests are found on Mt. Irvine
Back Bay. This beach is the most isolated of the three and is without light or noise
pollution. Due to its location it is the quietest of the three index beaches in terms of
human disturbance, with no development and very little human presence.
Although turtles do nest on the index beaches their numbers tend to be higher on small
isolated beaches towards the North of the island. These beaches receive fewer numbers

54
of visitors and tend to be less developed, as such having more available vegetation
along the back of the beach. These beaches can be seen in Table 2, which shows
hawksbill nests for non-index and index beaches over the same time period. Here it can
be seen that hawksbill nests are generally higher on non-index beaches than index
beaches, excepting Mt. Irvine Back Bay, with 33 confirmed nests and 48 estimated nests
in total. Although offshore coral reefs around Tobago provide excellent feeding grounds
for hawksbill sea turtles, the island does not support a large population of nesting
hawksbills. In 2005 the annual nesting population of hawksbills was estimated to be
between 28 and 47 (Cawley, 2005). Hawksbills nest in over 70 countries, mostly in low
densities. There is large nesting colony found in Australia, however generally hawksbill
turtles nest in low numbers over many countries, the Caribbean included, and the
nesting populations on Tobago do not reach high numbers. However almost half of the
worlds export of turtle shells is thought to originate from the Caribbean and Latin
American region and so there is great need for turtles in this area to be protected and
conserved (Mortimer and Donnelly, 2008). Hawksbill turtles prefer lower wave energy
on isolated beaches. It may be that Tobago’s beaches are in general less sheltered and
more exposed, leading to a lowered preference for nesting in the hawksbill turtle.
It has been found in a previous study on nest site choice of hawksbill turtles in Barbados,
a nearby island, that the west coast beaches are preferred rather than the south or east
coast (Horrocks and Scott, 1991). This was also recorded in Tobago, with 74% of
hawksbill nests found on the north-west Caribbean coastline compared with only 26%
on the south-east Atlantic coastline. This is similar to the leatherbacks, although less
extreme, and the same reasons may apply. It could be that hawksbills prefer the steeper
sloped entry onto the beach that has been recorded on the Caribbean coastline or it
may be due to the high levels of development that are found on the Atlantic coastline,
causing the flightier hawksbill to nest on quieter beaches on the Caribbean coast.

55
Hawksbills tend to nest on many different beaches over the nesting season when
compared to the leatherback. This nesting behaviour of the hawksbill can make them
very difficult to study and also more difficult to protect and conserve. In leatherbacks
most nests are to be found on the three main index beaches, meaning that even with
limited resources, these beaches can be patrolled and the majority of the turtles and
nests protected. In the case of hawksbills there are many different beaches on which
small numbers of nests are present. Unless large resources are available it is very
difficult to patrol these beaches as often as required to collect data and to protect the
turtles and their eggs from poaching. This proves to be a problem on Tobago where
leatherbacks, due to their large size, are often less susceptible to poaching than the
hawksbills. In recent years, when the poaching of a sea turtle occurs on Tobago, it is
most likely to be a hawksbill. They are easier to manoeuvre and carry away and they are
also less protected. Since the index beaches are now carefully and regularly monitored,
this may mean that poachers go to other less protected beaches to look for turtles,
beaches where hawksbills are more likely to nest. Most of the poaching occurring in
recent years is relevant to hawksbills and this may be because most of the turtles
protected on the beaches patrolled are leatherbacks. SOS Tobago have made a start in
conserving sea turtles on Tobago and do the best with what limited resources they
have. The work that they have done has already made a significant difference in
reducing the number of sea turtles poached each nesting season and educating the
public on the status of sea turtles. However their funding is limited and they do not have
the resources to regularly patrol non-index beaches, where it is most needed to
conserve hawksbills.
False crawls
The false crawl rates were not found to be significant and this may be due to small
sample size as hawksbill numbers were very low on the index beaches. For many years
only one or two and occasionally no nests were recorded on index beaches. Generally
where the false crawl rate is 0% there was only one hawksbill nest recorded for the
56
beach for the whole season. The hawksbill false crawl rate was higher than the
leatherback false crawl rate at 25%. Hawksbills are known to be more flighty and are
easily disturbed. This is probably due to their small size and manoeuvrability. Being
smaller they will be more susceptible to predators and so are more likely to employ an
escape mechanism by returning to the sea at any sign of disturbance. Indeed in a study
by McIntosh et al (2003) the false crawl rate was found to be as high as 93.8% on one
beach with an average of 56.5% for all beaches. One of the beaches, the least developed
with the most vegetation had a very low false crawl rate of 8.9%.
In this study, the false crawl rate is highest on Turtle Beach in 2005 and 2006, Mt. Irvine
Back Bay in 2007, and Grafton from 2008 to 2010. However in this it may be that the
sample size is not significantly high enough to draw any accurate conclusions from the
data. In 2007 the total number of hawksbill turtle nests was only eight and in 2008 only
nine.
As discussed previously false crawl rates can be a useful indication of the changing
aspects of a beach. In a nearby island, Barbados, it has been observed that hawksbill
turtles are deterred by highly-lit wide beaches when nesting, choosing instead to nest in
darker areas on narrower beaches (Knowles et al, 2009). It has also been recorded that
human presence and light pollution can cause an increase in the number of false crawls
(Witherington and Martin, 1996). By studying false crawl rates year by year, an overall
pattern may be found which could indicate whether a beach is suitable for nesting or
unsuitable due to lighting, development or human presence. In beginning to understand
this, a start can be made on trying to improve beach suitability for sea turtles and
prevent their nesting habitat from becoming unsuitable.
Although one of the aims of this project was to complete a population model with the
data, the nesting numbers of hawksbill turtles on Tobago in 2010 were too low for a
population model to be applied.

57
Beach Profiling
From table 8 there does not seem to be a pattern in the slope preferences of hawksbill
turtles. Englishman’s Bay with 23% of nesting turtles has an overall slope of -9.5, with -
9.6 at the sea edge, whereas Mt. Irvine Back Bay, with 21% of nesting turtles has a much
lower slope at -4.7 overall and -6.2 at the sea edge. However in other studies it has been
recorded that hawksbills prefer a specific elevation, between 0.3 and 1.8m (Varela-
Acevedo et al, 2009). This was not included in this study and so it may be that slope is
not an important aspect but that elevation is. It can be seen from Table 8 that Mt. Irvine
Back Bay, Englishman’s Bay and Dead Bay are all key nesting beaches. These are all
relatively short, secluded beaches. Mt. Irvine Back Bay and Englishman’s Bay have an
abundance of vegetation found at the back of the beach. Dead Bay has slightly less
vegetation at some points, though there is still plenty to be found. It may be that these
beaches have shallow approaches to the beach and that offshore are rocks and coral to
be found. These have been shown to be preferred by the hawksbill turtle in a nesting
beach (Eckert et al, 1999). Future research could involve a study of the offshore profiles
of these beaches.
In a previous study by Horrocks and Scott (1991) they found that the beaches on the
west coast on the nearby island of Barbados tended to be steeper in slope on
emergence from the water, than east or south coast beaches. From this study the
results were similar in that the Caribbean coastline had an average gradient of -7.5 near
the sea edge as compared to -5.6 on the Atlantic coastline. Although slope seems to be
unrelated to turtle nesting percentage in this study it may be due to small sample size,
or it could be that slope is also an indicator of elevation, which has been shown to affect
hawksbill beach choice. It may be that hawksbills prefer to nest on the Caribbean
coastline, not only because it is more sheltered, but due to this the slope on emergence
is steeper and the elevation is more suitable.
58
As stated previously regular profiling of Tobago’s nesting beaches may help to establish
important characteristics in sea turtle beach and nest site choice. By doing so perhaps in
the future, as a preliminary survey, beaches can be profiled in accordance to its
suitability as a turtle nesting beach, indicating whether there might perhaps be turtle
nesting occurring there. It could also indicate how recent development is affecting
coastal habitats and changing the profile of a beach.
Mapping
One of the aims of the project was to use GIS to create a visual representation of the
turtle nests. Unfortunately this was not possible however Google Earth and Bing maps
were used to present the data visually, if not as effectively as would have been
preferred. The GPS was not as accurate as desired and so the data points may be up to
five metres away from the actual nesting point. Despite this the maps are useful for a
visual examination of the data and to give an idea of relative location of turtle nests. For
instance on Grafton and Turtle Beach it can be seen that there are no nests found to the
north of the beach. This may be due to incoming wave direction, making nesting in this
area difficult.
Using GIS to visually present data is useful in that it can store data from many different
sources in a similar format. It can be used to analyse patterns and in the future could be
used to monitor changes over time. It cannot only be used for mapping nest locations
but also recording migration patterns over time, feeding sites and nesting beach
profiles. GIS not only creates maps presenting data but also stores data, linking it
geographically and creating relationships betweens features spatially and physically.

59
Limitations and Recommendations
There are a number of limitations and aspects of the methodology that could be
improved.
There were many beaches on Tobago that could not be surveyed due to time and
money limitations and it was not possible to collect data for the whole turtle nesting
season. SOS Tobago collected data from the index beaches from the 1st March until 30th
September, however it was only possible to patrol non-index beaches from 16th June
until 5th August and the patrols could only be done weekly compared to nightly for index
beaches. Therefore deductions are limited since the data collected only represents a
small sample of the turtle nesting population on non-index beaches. The actual turtle
nesting numbers may be significantly higher than the data collected suggests.
If surveys of the non-index beaches spanned the whole nesting season instead of just
some of the season and if they occurred daily rather than weekly the results obtained
would be more accurate. However given the circumstances it was not viable to do so.
On some beaches such as Argyle and Kilgwyn there are no recorded instances of turtle
nesting. However this does not necessarily mean these beaches are not used for turtle
nesting, it simply means that during patrols no turtle nesting behaviour was observed. In
the case of Lambeau, no turtle nests were recorded during patrols. However towards
the end of the nesting season hatchling tracks were noted. It could be that on beaches
where there are high tides, turtle nesting behaviour is washed away regularly, giving the
impression on weekly checks that no turtle nesting behaviour occurs.
Due to the long life span of sea turtles and the length of time they take to reach
maturity this data is not useful in examining long term trends in the sea turtle
populations of Tobago.

60
Recommendations and Future Research
Future research on the nesting behaviour of sea turtles on Tobago could include doing
more frequent surveys of non-index beaches. This could help to prevent the regular
poaching of threatened hawksbill turtles and lead to more conclusive data about what
beaches are important as hawksbill nesting sites and also to a better idea of hawksbill
nesting numbers for the island. By doing so, a more accurate population estimate can
be made for the island as a whole. It would be interesting to do a yearly population
estimate to be able to study population fluctuations in the future and to begin to
understand changes in the turtle nesting population of Tobago.
It would be interesting to study the beaches on which high tides may have washed away
turtle tracks, to see if turtles are actually nesting on these beaches. It could be that
turtles are nesting on these beaches, but high tides may still cause hatchlings to die
during development due to flooding. It would be interesting to survey these beaches
during the nesting season nightly to discover if turtles are nesting and to find out the
success rate of the nests if there is nesting occurring.
Due to time limitations it was only possible to profile the beaches once. However
beaches are highly dynamic and susceptible to change through erosion and accretion.
Visible change can occur over a period of years, months, days and even hours due to
wave and wind action, extreme weather and the flooding of rivers. Ideally beaches
would be profiled once a month to establish the beach dynamics and trends in accretion
and erosion, if not monthly then quarterly. Further information could be noted during
profiling that was not included in this study such as dominant vegetation type, sand
composition including grain size and compaction, high tide mark, low tide mark and
wave composition. These features would allow a more accurate characterisation of a
suitable nesting beach.

61
It would be interesting to conduct interviews with locals to see if their reports of where
sea turtles are found match with what was observed in this study. Often fisherman and
coastal residents are very knowledgeable about whether turtles are found on local
beaches. It may be that turtles are nesting in significant numbers on other beaches not
surveyed.
It was not possible to use a population model in this study. This could be the next step in
assessing Tobago’s sea turtle nesting. By using data over the whole nesting season for
both leatherback and hawksbill turtles and including non-index beaches to ensure an
accurate numbers for hawksbill nesting, a more reliable estimate could be formed.
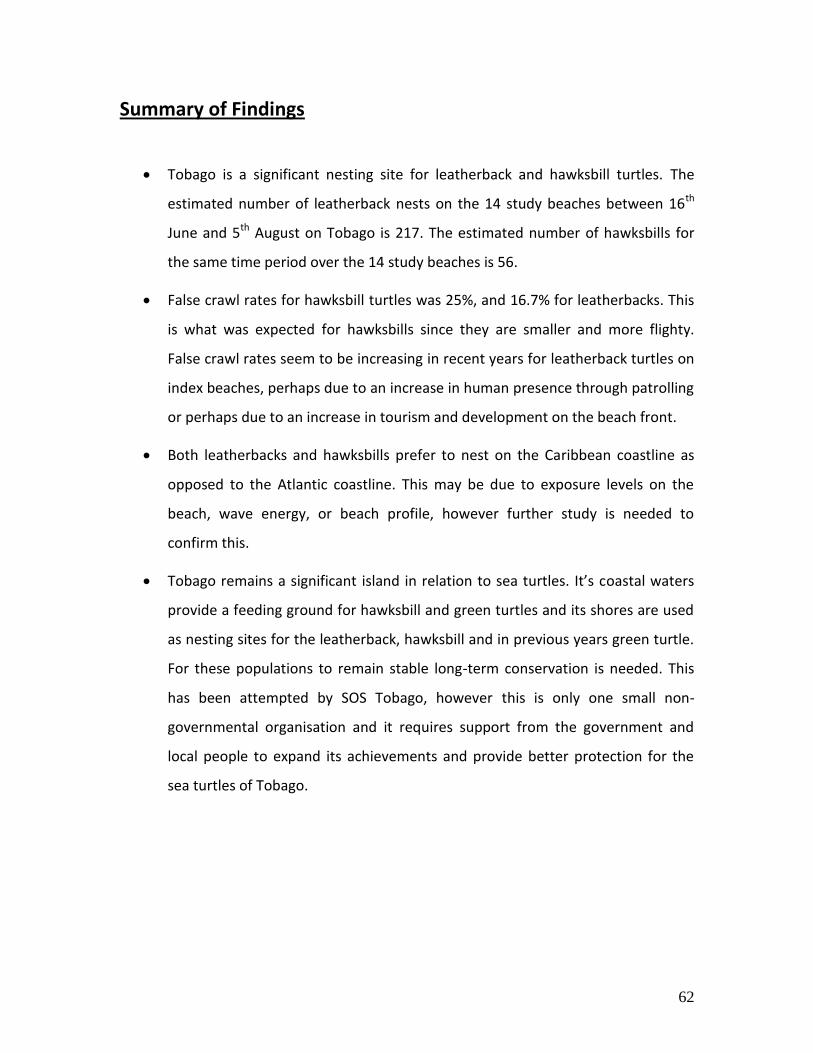
62
Summary of Findings
Tobago is a significant nesting site for leatherback and hawksbill turtles. The
estimated number of leatherback nests on the 14 study beaches between 16th
June and 5th August on Tobago is 217. The estimated number of hawksbills for
the same time period over the 14 study beaches is 56.
False crawl rates for hawksbill turtles was 25%, and 16.7% for leatherbacks. This
is what was expected for hawksbills since they are smaller and more flighty.
False crawl rates seem to be increasing in recent years for leatherback turtles on
index beaches, perhaps due to an increase in human presence through patrolling
or perhaps due to an increase in tourism and development on the beach front.
Both leatherbacks and hawksbills prefer to nest on the Caribbean coastline as
opposed to the Atlantic coastline. This may be due to exposure levels on the
beach, wave energy, or beach profile, however further study is needed to
confirm this.
Tobago remains a significant island in relation to sea turtles. It’s coastal waters
provide a feeding ground for hawksbill and green turtles and its shores are used
as nesting sites for the leatherback, hawksbill and in previous years green turtle.
For these populations to remain stable long-term conservation is needed. This
has been attempted by SOS Tobago, however this is only one small non-
governmental organisation and it requires support from the government and
local people to expand its achievements and provide better protection for the
sea turtles of Tobago.

63
Afterword
In the completion of my dissertation I have learned that even with the most careful
plans involved, field work is highly changeable and a certain amount of flexibility is
required when things do not go according to plan. Field work is unpredictable and even
the most carefully considered plans may have to change due to unforeseeable events. I
had not before considered the difficulties involved in the planning of research. There are
so many little things that need to be taken into account for the simplest of tasks.
I have released just how many limitations there are in research in terms of time,
resources and funding. I have also learned that by completing a research study in one
area, this opens up many other interesting areas and ideas to further explore.

64
Acknowledgements
I would like to give a sincere thank you to Suzanne Livingstone and Roger Downie, for
their time and guidance throughout the development of this project and for their
continued support and encouragement.
I am indebted to Giancarlo Lalsingh, the program coordinator of SOS Tobago, without
whom the research could not have been carried out. He patiently drove me round the
island week after week allowing me to collect data. His experience and knowledge were
invaluable and his dedication to the conservation of sea turtles is admirable. I would
also like to thank all other staff members of SOS Tobago for giving me the opportunity
to go out to Tobago and work with sea turtles.
I am extremely grateful for the friendship of all the members of the Tobago Expedition
2010, and in particular Steven McGee-Callender, Katie Thompson and Joseph Crisp for
their help and assistance in beach profiling and day patrols. Their support was
invaluable. The advice and friendship of Rosanna Mooney and Grant Walker was much
appreciated when beach profiling and after returning to the UK.
I am thankful for the time my brothers Nicholas and Christopher Robb spent on helping
me with their IT skills and for the support of all my family.
I would like to express my gratitude to Mike Shand for his expertise in mapping and
geography and Kenny Roberts for providing an Abney Level for use in Tobago.
65
References Allen, Z. C., Shah, N. J., Grant, A., Derand, G., and Bell, D. (2010) Hawksbill Turtle Monitoring in Cousin Island Special reserve, Seychelles: An eight-fold increase in annual nesting numbers. Endangered Species Research, 11, 195-200. Balazs, G. H. (1980) Synopsis of Biological Data on the Green Turtle in the Hawaiin Islands. NOAA Tech Report. NOAA-TM-NMFS-SWFC-7, 1-141. Beggs, J. A., Horrocks, J. A., and Krueger, B. H. (2007) Increase in Hawksbill Sea Turtle Eretmochelys imbricata nesting in Barbados, West Indies. Endangered Species Research, 3, 159-168. Bjorndal, K. A., and Bolton, A. B., and Lagueux, C. J. (1993) Decline of the Nesting Populations of Hawksbill Turtles at Tortuguero, Costa Rica. Conservation Biology, 7, 4, 925-927. Bouchard, S. S. and Bjorndal, K. A. (2000) Sea Turtles as Biological Transporters of Nutrients and Energy from Marine to Terrestrial Ecosystems. Ecology, 81, 8, 2305-2313. Breman, J. (2002) Marine Geography: GIS for the Oceans and Seas. ESRI. Brock, K. A., Reece, J. S., and Ehrhart. L. M. (2009) The Effects of Artificial Beach Nourishment on Marine Turtles: Differences between Loggerhead and Green Turtles. Restoration Ecology, 17, 2, 297-307. Burton, M., and Burton, R. (2002) The International Wildlife Encyclopedia, Volume 9. Marshall Cavendish. Cawley, B. (2005) The Nesting and Conservation Status of Sea Turtles in Tobago. Honours Project. University of Glasgow. Clovis, T. (2005) SOS Tobago Annual Report (Mar-Nov 2005). Save Our Sea Turtles Tobago. Davenport, J. (1997) Temperature and the life-history strategies of sea turtles. Journal of Thermal Biology, 22, 6, 479-488. Dow, W., Eckert, K., Palmer, M., and Kramer, P. (2007). An Atlas of Sea Turtle Nesting Habitat for the Wider Carribean Regions. The Wider Carribean Sea Turtle Conservation Eckbert, K. L. (1987) Environmental Unpredictability and Leatherback Sea Turtle (Dermochelys coriacea) Nest Loss. Herpetologica, 43, 3, 315-323.
66
Eckert, K. L., Bjorndal, K. A., Abreu-Grobois, F. A., and Donnelly, A. (1999) Research and Management Techniques for the Conservation of Sea Turtles. IUCN/SSC Marine Turtle Specialist Group, Publication No. 4. Fish, M. R. (2011) Guidelines for measuring beach profiles. WWF Report, Vancouver, pp8. Fish, M. R., Cote, I. M., Horrocks, J. A., Mulligan, B., Watkinson, A. R., and Jones, A. P. (2008) Construction Setback Regulations and Sea-level Rise Mitigating Sea Turtle Nesting Beach Loss. Ocean and Coastal Management, 51, 330-341. Food and Agriculture Organization of the United Nations. (1998) Forestry Policies in the Carribean: Reports of 28 Selected Countries and Territories. Food and Agriculture Org. Gaos, A. R., Yanez, I. L. and Arauz, R. M. (2006) Sea Turtle Conservation and Research on the Pacific Coast of Costa Rica. Summary Report. Harewood, A., and Horrocks, J. (2008) Impacts of coastal development on hawksbill hatchling survival and swimming success during the initial offshore migration. Biological Conservation, 141, 394-401. Hays, G. C. (2000) The Implications of Variable Remigration Intervals for the Assessment of Population Size in Marine Turtles. Journal of Theoretical Biology, 206, 221-227. Hendrickson, J. R. (1980) The Ecological Strategies of Sea Turtles. American Zoologist, 20, 597-608. Hilterman, M. L. and Goverse, E. (2003) Aspects of Nesting and Nest Success of the Leatherback Turtle (Dermochelys coriacea) in Suriname, 2002. Guianas Forests and Environmental Conservation Project (GFECP). Technical Report, World Wildlife Guianas/ Biotopic Foundation, pp31.
Horrocks, J. A. (1992) WIDECAST Sea Turtle Recovery Action Plan for Barbados. CEP Technical Report No. 12 Horrocks, J. A. and Scott, N. McA. (1991) Nest Site Location and Nest Success in the Hawksbill Turtle Eretmochelys imbricata in Barbados, West Indies. Marine Ecology Progress Series, 69, 1-8. Karl, S. A., and Bowen, B. W. (1999) Evolutionary Significant Units Versus Geopolitical Toxonomy: Molecular Systematics of an Endangered Sea Turtle (genus Chelonia). Conservation Biology, 13, 5, 990-999.

67
Kenny, J. S. (2000) Views from the ridge: Exploring the Natural History of Trinidad and Tobago. Prospect Press. Kenny, J. S. (2008) The Biological Diversity of Trinidad and Tobago: A naturalist’s notes. Prospect Press. Knowles, J. E., Eckert, K. L. and Horrocks, J. A. (2009) In the Spotlight: An Assessment of Beachfront Lighting at Four Hotels in Barbados, with Recommendations for Reducing Threats to Sea Turtles. Wider Caribbean Sea Turtle Conservation Network (WIDECAST) Technical Report No. 12, 1-128. Lalsingh, G. (2010) Summary of Sea Turtle Nesting Activity 2010. Save Our Sea Turtles Tobago. Leon, Y. M., and Bjorndal, K. A. (2002) Selective Feeding in the Hawksbill Turtle, an Important Predator in Coral Reef Ecosystems. Marine Ecology Progress Series, 245, 249-258. Leotaud, N. (2001) Organisational Profile: Save Our Sea Turtles (SOS) Tobago: A Research, Education and Action Programme (REAP). Marine Turtle Newsletter, 93, 13. Livingstone, S. R. (2006) Sea Turtle Ecology and Conservation on the North Coast of Trinidad. University of Glasgow, PhD Thesis. Lum, L. L. (2005) Beach dynamics and nest distributions of the leatherback turtle (Dermochelys coriacea) at Grande Riviere Beach, Trinidad and Tobago. Rev. Biol. Trop, 53, 239-248. Maktav, D., Sunar, F., Yalin, D., and Aslan, E. (2000) Monitoring Loggerhead Sea Turtle (Caretta caretta) Nests in Turkey Using GIS. Coastal management, 28, 2, 123-132. McIntosh, I., Goodman, K. and Parrish-Ballentine, A. (2003) Tagging and Nesting Research on Hawksbill Turtles (Eretmochelys imbricata) at Jumby Bay, Long Island, Antigua, West Indies: 2003 Annual Report. Wider Caribbean Sea Turtle Conservation Network. Mickelson, L. (2008) The Influence of Incubation Temperature on Hatchlings Leatherback (Dermochelys coriacea) Morphology: Effects on Locomotion Performance and Fitness. Masters of Research Thesis. Mortimer, J. A., and Donnelly, M. (2008) Eretmochelys imbricata in IUCN 2010. IUCN List of Threatened Species. Version 2010.4. www.iucnredlist.org

68
NOAA National Marine Fisheries Services, U.S. Fish and Wildlife Service. (2007). Leatherback Sea Turtle (Demochelys coriacea) 5 Year Review: Summary and Evaluation. National Marine Fisheries, 1-81. Nordmoe, E. D., Sieg, A. E., Sotherland, P. R., Spotila, J. R., Paladino, F. V., and Reina, R. D. (2004) Animal Behaviour, 68, 387-394. Pritchard, P. C. H. (1971) The leatherback or leathery turtle, Dermochelys coriacea. IUCN. Reina, R. D., Mayor, P. A., Spotila, J. R., Piedra, R., and Paladino, F. V. (2002) Nesting Ecology of the Leatherback Turtle, Dermochelys coriacea, at Parque Nacional Marino Las Baulas, Costa Rica: 1988-1989 to 1999-2000. Copeia, 3, 653-664. Schroeder, B. and Murphy, S. (1999). Population Surveys (Ground and Aerial) on Nesting Beaches. Research and Management Techniques for the Conservation of Sea Turtles. IUCN/SSC Marine Turtle Specialist Group Publication No.4, pp. 45-55. Schuurman, N. (2004) GIS: A short Introduction. Wiley-Blackwell. Scott, C. (2004) Endangered and Threatened Animals of Florida and their Habitats. University of Texas Press. Sobin, J. M. (2008) Diving Behaviour of Female Loggerhead Turtles (Caretta caretta) During their Internesting Interval and an Evaluation of the Risk of Boat Strikes. Masters Project, Duke University. Spotila, J. R. (2004) Sea Turtles: A Complete Guide to Their Biology, Behaviour and Conservation. JHU Press. Tompkins, E., Adger, W. N., and Brown. K. (2002) Institutional Networks for Inclusive Coastal Management in Trinidad and Tobago. Environmental Planning, 34, 1095- 1111. Tucker, A. D. (1988) A Summary of leatherback turtle Dermochelys coriacea nesting at Culebra, Puerto Rico, from 1984-1987 with management recommendation. U.S. Fish and Wildlife Service, Vero Beach, Florida. Varela-Acevedo, E., Eckert, K. L., Eckert, S. A., Cambers, G., and Horrocks, J. A (2009) Sea Turtle Nesting Beach Characterization Manual. North Carolina. Walker, G. (2010) The Influence of Morphology and Artificial Light on the Terrestrial Transit of the Leatherback Turtle, Dermochelys coriacea. Masters of Research Thesis. University of Glasgow.
69
Williams-Walls, N., O’Hara, J., Gallagher, R. M., Worth, D. F., Peery, B. D., and Wilcox, J. R. (1983) Spatial and Temporal Trends of Sea Turtle Nesting on Hutchinson Island, Florida, 1971-1979. Bulletin of Marine Science, 33, No.1, 55-66. Witherington, B.E. and Martin, R. E. (1996) Understanding, assessing, and resolving light-pollution problems on sea turtle nesting beaches. Florida Marine Research Institute Technical Report, 1-73.
Witzell, W. N. (1983) Synopsis of Biological Data on the Hawksbill Turtle, Eretmochelys imbricata. Food and Agriculture Org.
Websites Barbados Sea Turtle Project Website: http://www.barbadosseaturtles.org/ IUCN. (2010) IUCN Red List of Threatened Species: www.iucn.org See Turtles Website: www.seeturtle.org

70
Appendix Figure 3: Data sheet used in data collection on patrols.
All raw data is attached on a CD disk.