a study of thit large aperture …arizona.openrepository.com/arizona/bitstream/10150/...a study of...
TRANSCRIPT
A study of thin large aperture proportional counters
Item Type text; Thesis-Reproduction (electronic)
Authors Gumble, Roger Steven, 1941-
Publisher The University of Arizona.
Rights Copyright © is held by the author. Digital access to this materialis made possible by the University Libraries, University of Arizona.Further transmission, reproduction or presentation (such aspublic display or performance) of protected items is prohibitedexcept with permission of the author.
Download date 15/07/2018 06:45:27
Link to Item http://hdl.handle.net/10150/347577

A STUDY OF THIT LARGE APERTURE PROPORTIONAL COUNTERS
byRoger Steven Gumble
A Thesis Submitted to the Faculty of theDEPARTMENT OF PHYSICS
In Partial Fulfillment of the Requirements For the Degree ofMASTER OF SCIENCE
In the Graduate CollegeTHE UNIVERSITY OF ARIZONA
1 9 6 6

STATEMENT BY AUTHOR
This thesis has been submitted in partial fulfillment of requirements for an advanced degree at The University of Arizona and is deposited in the University Library to be made available to borrowers under rules of the Library.
Brief quotations from this thesis are allowable without special permission, provided that accurate acknowledgment of source is made. Requests for permission for extended quotation from or reproduction of this manuscript in whole or in part may be granted by the head of the major department or the Dean of the Graduate College when in his judgment the proposed use of the material is in the interests of scholarship. In all other instances, however, permission must be obtained from the author.
SIGNED:
APPROVAL BY THESIS DIRECTOR This thesis has been approved on the date shown below:
' f ' /2-y i?&CT. Bowen U DateT. Bowen
Professor of Physics

ACKNOWLEDGMENTS
I especially wish to thank Dr. T. Bowen, who proposed this experiment, for his guidance and encouragement throughout the duration of this research. Special thanks are due to members of the High Energy Physics Group who gave assistance and encouragement, and also special thanks are due to the Physics Creative Laboratory and Physics Electronics Shop for their high quality work and for their assistance. This work was in part supported by NSF funds.
TABLE OF CONTENTSPage
LIST OF TABLES vLIST OF ILLUSTRATIONS . . . . . . . . . . . . . . . . . . . . . . . viABSTRACT ......... vii
CHAPTER IINTRODUCTION . . . . . . . . . . . . . . . . . . . . 1
CHAPTER IITHEORY . . . . . . . . ............. . . . . . . . . . . . . . 5
CHAPTER IIIEXPERIMENTAL APPARATUS . ......... . . . . . . . . . . . . . . 9EXPERIMENTAL PROCEDURE . . . . . . . . . . . . ........ . . . . 12
CHAPTER IVRESULTS - GENERAL OBSERVATIONS ............. . . . . . . . . lUSPECIFIC OBSERVATIONS . . . . . . . . . . . . . . . . . . . . . . l6
CHAPTER VCONCLUSIONS . . . . . . . . . . . . . . . . . . . . . . . . . . . 18
TABLES 1 - U . . . . . . . . . . . . . ........ . . . . . . . . . 19-22
ILLUSTRATIONS 1 - 13 . . . . . . . . . . . . . . . . . . . . . . . 23-35LIST OF REFERENCES ......... . . . . . . . . . . . . 36

LIST OF TABLES
Table Page
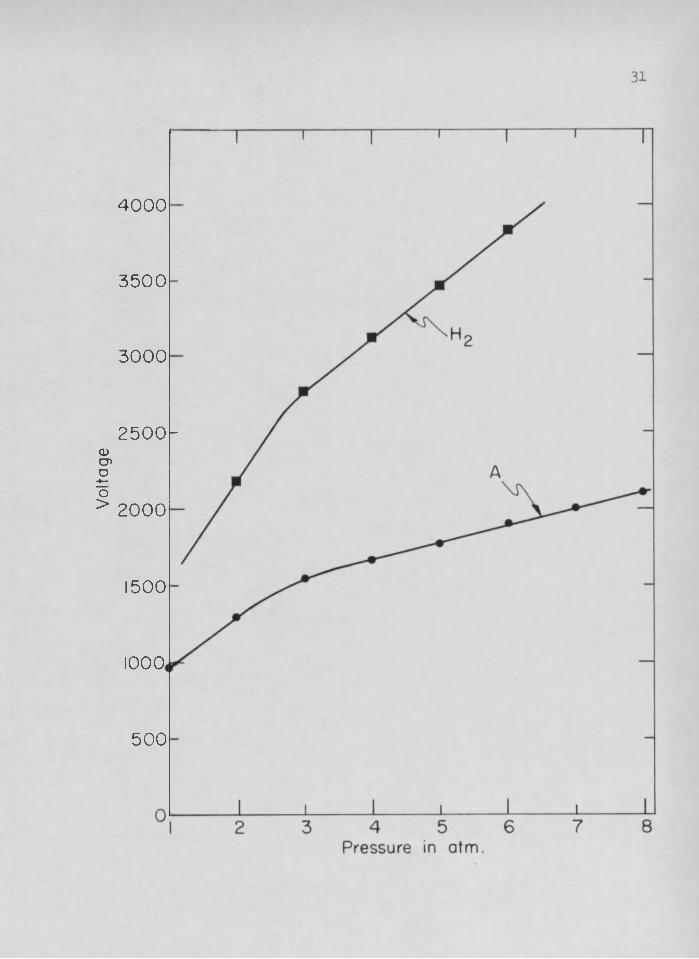
1. Voltages at which plateaus began on the efficiencycurves for argon and hydrogen in counter B . . . ........... 19
2. The probability of no ion pair being collected, P0 ,in counter B filled with argon and with hydrogen........... 20
3. The efficiency in percent of counter B filled withargon and with hydrogen......... . 21
4. Values of a, b, f, and Tr as found for counter Bfilled with argon and with hydrogen . . . . . ............. 22
v

LIST OF ILLUSTRATIONS
Figure Page1. Pressure Vessel for Wire Support F r a m e s ................ 232. Counter A and Wire Support Frame........................ .. 2k
3. Counter B ............... 254. Counter C ................. 265. Block Diagram of Experiment............................ .. 276. Preamplifier Circuit Diagram . . . . . . . . . . . . . . . . . 287. Efficiency Curve for Counter B Filled with Argon
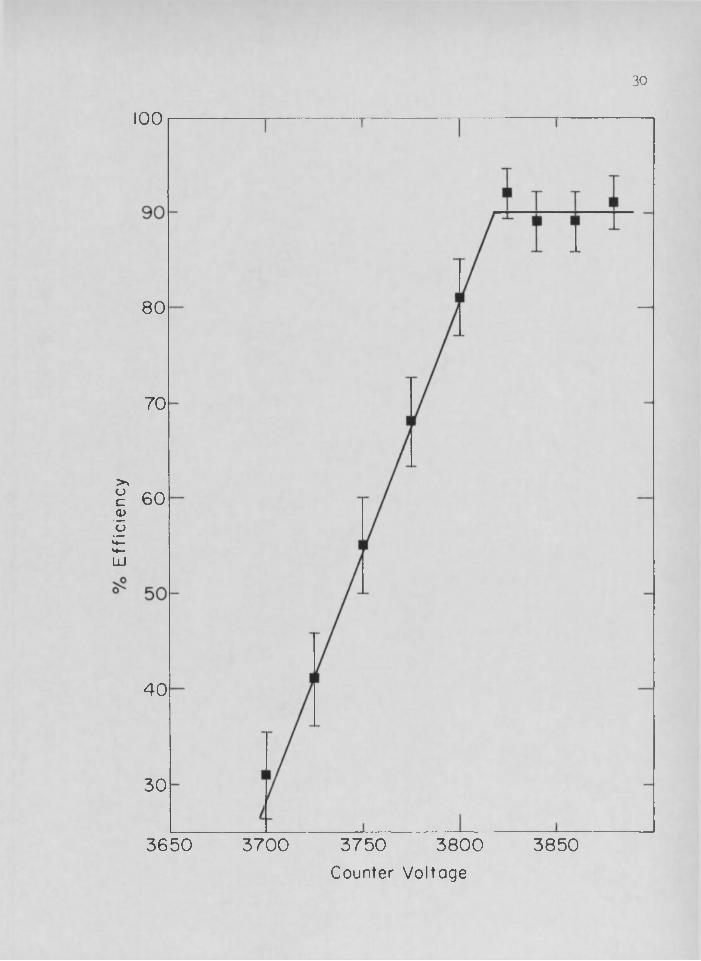
to 7 Atmospheres of Pressure ......... 298. Efficiency Curve for Counter B Filled with Hydrogen
to 6 Atmospheres of Pressure............................ . 309. Voltages at the Beginning of the Plateaus of the
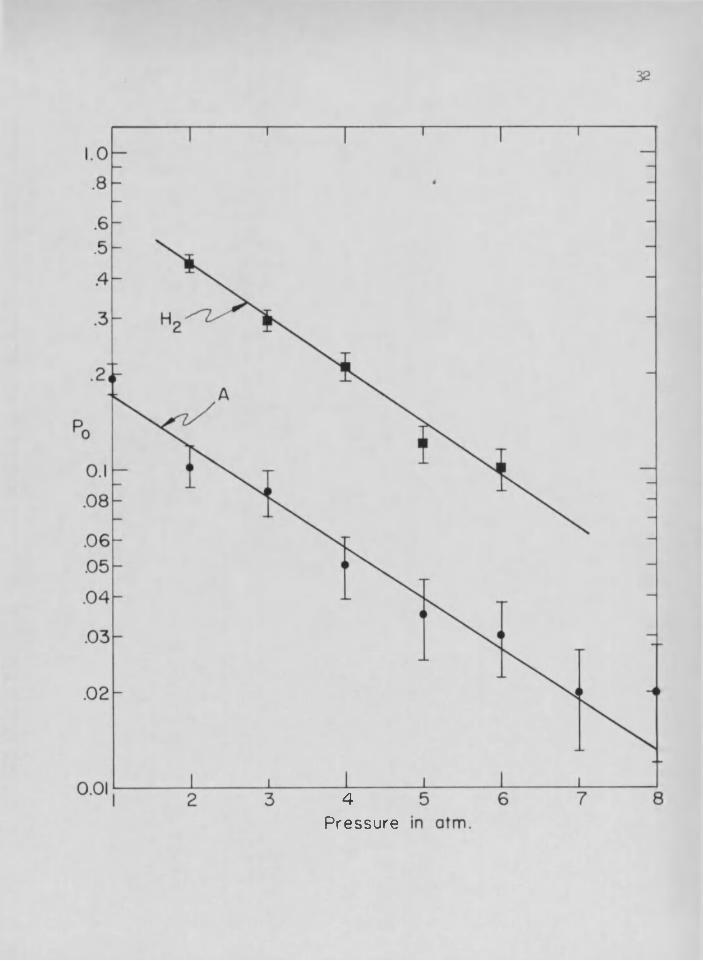
Efficiency Curves for Argon and for Hydrogen in Counter B . . 3110. Semi-Logarithmic Plot of Po for Argon and for Hydrogen
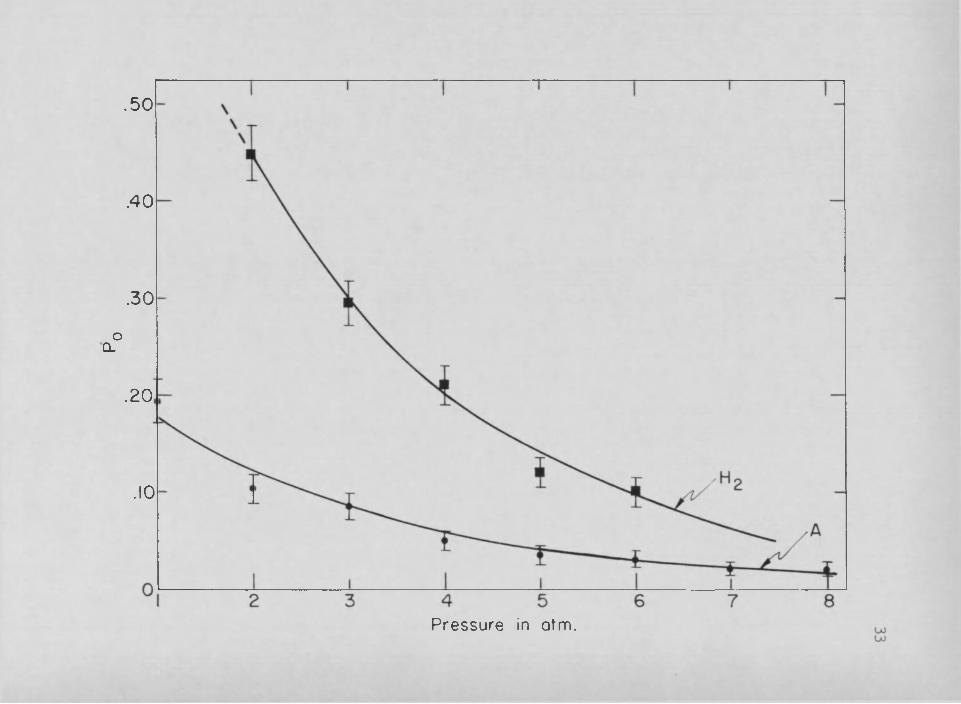
in Counter B ........................................... 3211. Probability of No Ion Pair Being Collected for Argon
and for Hydrogen in Counter B ........... 3312. The efficiency, P, in Percent, of Counter B Filled with
Argon and with Hydrogen ......... . . . ......... 3413. Photographs of Pulses from Counter B . . . . . . . . . . . . . 35
vi
ABSTRACT
The efficiency and the characteristics of multiwire high pressure thin large aperture proportional counters, as a function of the counter pressure, of the counter geometries, and of various gases, was investigated to discover the counter with the highest efficiency and best stability. A scintillation counter telescope was used to indicate when a cosmic ray particle traversed the thin dimension of the counter. This telescope triggered the horizontal sweep on an oscilloscope of which the vertical display showed the signal from the proportional counter. Of the three different geometries investigated, the one with parallel wires spaced l/4" apart in the same plane, all being at the same voltage, gave the best efficiency and was the most stable. Four different gases were tried in this counter: argon, helium, hydrogen,and an 80% neon - 20% helium mixture. In this counter, argon gave the highest efficiency achieved: 98% at 8 atmospheres of pressure.
vii
CHAPTER I
INTRODUCTION
The designs of different particle detectors incorporate the fact that charged particles interacting with matter lose a finite quantity of energy to the material. This energy is then converted into a signal by the particle detector. In proportional counters, plastic scintillation counters, and other counters, the energy lost by the particle goes into ionizing and exciting atoms or molecules in the counter material. For a given charged particle, the energy loss is dependent
upon the velocity of the particle. The greater the velocity a particle
has, the less time it will spend in a given volume, lowering the proba
bility of it interacting with and ionizing an atom or molecule in the
medium which it is traversing. Thus, the higher the energy of a particle, the less energy it will lose, making high energy particles more difficult to detect than low energy particles. The more dense the material, the more atoms and molecules with which a particle can interact; thus, the higher the density of the material used in detecting high energy particles, the better the efficiency of the instrument.
Although a proportional counter is inherently a more efficient
instrument than a scintillation counter, the latter has a shorter resolving time and does not require as complicated amplifiers. Thus, in

the field of high energy particle physics, scintillation counters have become widely used as particle detectors„
However, the advantages offered by scintillation counters are accompanied by a disadvantage which can be illustrated by considering the experimental arrangement for the particle reaction if + p -* A + K°. Here a beam of pions is incident upon a liquid hydrogen target after passing through two scintillation counters, number 1 and number 2. In the target a pion will collide with a proton, producing a A particle and a K° particle, both being neutrally charged particles. These pass through a third counter directly behind the target. In the region beyond the third counter the K° will decay into a proton and a pion.These two charged particles will then pass through a fourth counter.The criterion for an event is that counters 1, 2, and 4 send out a signal in coincidence, while the third counter is in anticoincidence with the other three. The requirements of this third counter are that it must be highly efficient for anticoincidence work and that it place as little mass as possible in the beam. The latter requirement is imposed because the more mass that is placed in the beam at this position, the higher the probability that a rr~ will react with a nucleon in an atom or molecule in the counter material rather than in the liquid hydrogen, which produces background events.
For this experimental arrangement, a scintillation counter using scintillation plastic of l/l6" thickness will have the minimal efficiency that can be tolerated. Since most scintillation plastics have

a specific gravity that is close to that of water, such a scintillation counter would put a cross sectional mass density of 158 milligram/cm3 in the beam.
If the scintillation counter could be replaced by a proportional counter, less mass would be placed in the beam, lowering the probability of a reaction occurring in the counter. The temperature of a gas in contact with the liquid hydrogen target would be 20°K. Thus, if a thin large aperture proportional counter 1/4" thick were placed in contact with the target, the counter, filled with gas to atmospheric pressure, would put in the beam a cross sectional mass density of 15.5 milligram/cm2 for argon, 6.6 milligram/cm3 for a 80% neon and 20% helium mixture, 1.5 milligram/cm2 for helium, and .8 milligram/cm3 for hydrogen,
Since a proportional counter has greater internal amplification, through the process of electron multiplication, than an ionization chamber, the proportional counter will be the more suitable. The Gei- ger-Mueller counter was not considered because its dead time is greater than that of a proportional counter.
The question arises as to whether or not such a counter would have the required efficiency. The purpose of this investigation was to determine the efficiency of a proportional counter of this type. From Charles' law in thermodynamics, one atmosphere of gas at 2.0°K in a given volume will have a pressure of 15 atmospheres at room temperature.Since the discharge mechanism in a gas is independent of temperature and

4depends upon the mean free path which is a function of the density of the gas, the efficiency of a high pressure, thin large aperture counter was determined as a function of pressure at room temperature, This was carried out using different gases and different counter geometries. The source of particles used in this research was cosmic rays.
CHAPTER II
THEORY
A high energy particle passing through a gas will create ionpairs; the number produced depends upon the charge and velocity of theparticle, the path length in the gas, and the density of the gas. Taking the path length and the density of the gas to be the same for each particle, the number of ion pairs created depends upon the velocity of the particle.
Because of the statistical fluctuations in the number of ionpairs created by particles in cosmic radiation, it is necessary to consider the mean number of ion pairs, m, produced by these particles, m will depend upon the density of the gas, but from Boyle's law in thermodynamics, the density of a gas is proportional to the pressure of the gas. Thus, m can be written as a linear function of the pressure
m = ap, (l)
where a is a positive constant and p is the pressure, m will be linearly dependent on the density of the gas only if the path length remains fixed.
The probability, P , of a particle producing n ion pairs is given by Poisson's distribution, and is
Pn = (mn/n!)e~m .
5

Thus, the probability of no ion pair production is
(2)
This can be written as
ln(Po) = -ap . (3)
Mow consider two regions of gas at the same pressure whichgive different values for mean ion pair production. Let these regions be adjacent so the particles can pass through one or the other. This is, in effect, the same situation that exists in a counter where the electrons and ions in some regions are not as readily collected by the counter as in other regions. For these conditions P0 is given by
where ap and bp are the mean number of ion pairs collected from the first and second regions respectively, with a chosen greater than b, and where f is the fraction of particles passing through the first region.
At high pressures the probability of no ion pair production is approximately
So - fe"ap + (l-f)e-bp
Po => (l-f)e"bp .
Taking the logarithm of both sides gives
ln(Po) = In(l-f) - bp . (4)The signal from a proportional counter is an electrical pulse;
7thus, if no ion pairs are collected, no pulse will be observed. This means that there is associated with P0 a probability of having no pulse, Q,, and in fact, Q = P0 .
But, the probability of having a pulse, P, is given by
P = (1-0,)
or by
P - (1-Po) . (5)
which is also the efficiency of the counter.The statistical error in measuring Po must be considered.
When a particle is known to have passed through the counter, there willbe either one pulse or no pulse associated with the particle. If N suchmeasurements,
•̂•1 5 • • • , . . . Xy ,
are made in which the pulses are counted, then an arbitrary measurement will have the value
x - 1 if there is a pulse* 0 if there is no pulse.
Now, since the probability of a pulse = P and the probability of nopulse = (l-P) = 0, the mean value of such a measurement will be
= P*1 + Q ’O = P (6)

The variance of this measurement will be
V(x.) * (x.-x)3 = x.3 - (x.)“ = PQ (7)
1 NI 1 Xi1 NThe average value of N measurements is — 2 x. so the vari
ance of the mean value is
-i N i Hv% I xi> ■ 7 v<$ xi>
1 N ‘- — 2 V(x.)H2 1 11 Ng- — 2 PQ,H3 1
— -i— PQ, — 03r*
Thus, a(l 2 x^) « y ® (8)From this relation, the greater the number of measurements the
less will be the uncertainty in P and Q =$ p0 . For one hundred measurements, this becomes

CHAPTER III
EXPERIMENTAL APPARATUS AND PROCEDURE
Experimental Apparatus
Each of the three counters investigated was placed in the pressure vessel shown in Figure 1„ The high voltage lead-in was a Fu- site #109-Hermitic Terminal. The terminal and the high voltage wire were cemented in the 3/10" diameter hole with epoxy adhesive, the hole being completely filled to add strength and to discourage spurious electrical discharge in this region. The ground terminal was a Fusite #105- H.T. soft soldered in the 3/l6" diameter hole.
Figure 1 also illustrates a wire support frame in place, the frames being constructed of stainless steel sides and fiberglas epoxy ends. Each support frame held thirteen wires which were the counterpart to the central wire in the usual cylindrical counter geometry. The inside dimension was 3 l/2" square, giving the counter an aperture area of 12 1/4 square inches. The depth of the frame was 1/4", the thickness of the counter. Details of a wire frame are shown in Figure 2.
Stainless steel wires of .001" diameter were stretched the length of the frame and run parallel to the sides, forming a horizontal plane centered vertically in the wire frame. Each wire was electrically spot welded at one end to an inch length of .032" diameter stainless steel wire. The smaller diameter wires were threaded through holes in
9

the ends of the wire frame which was positioned vertically in a small vise that could be pivoted to vary the angle of inclination of the frame. The wires were then stretched by gravity with a bolt nut taped to the lower end of the wire, the .032" diameter wires at the top being unable to pass through the smaller holes in the fiberglas. The larger holes at the top of the frame, through which the larger diameter wires passed, were filled with epoxy which was allowed to set. The frame was then turned over and inclined at approximately 30 degrees, the wires with the bolt nuts attached dangling over the side. The holes in this end were filled with epoxy, the dangling wires being cut off after the epoxy had set (see section A-A in Figure 2 for details). To stop corona discharge from the bare ends of the smaller diameter wires, these ends were covered with epoxy. The spacing between wires was l/4". The larger diameter wires were spot welded to a cross connecting length of stainless steel wire of the same diameter which could then be soft soldered to either a high voltage lead or to a ground potential lead. At each end of a high voltage wire, a l/4" length of #20 Teflon spaghetti tubing was epoxyed in the fiberglas to increase the path length along the insulating material from the high voltage wire to the grounded bottom of the counter. Thus, under high voltage, the surface of the insulation would be less likely to break down and allow arcing to occur.
Three different counters, designated A, B, and C, were investigated. In counter A, illustrated by Figure 2, every other wire was at positive high voltage with the alternate wires at ground potential. In counters B and C, every wire was at high voltage; in counter C, however.
brass walls at ground potential were inserted between the wires. These counters are illustrated in Figure 3 and Figure 4. When the wire support frames were positioned in the high pressure vessel, a brass plate 3 2/10" long and 4" wide was centered over the frame to complete the counter geometry.
The passage of a particle through the proportional counter was detected by a counter telescope formed by three overlapping scintillation counters. The first two counters were centered directly above and below the proportional counter and the last, three inches below the second one. The third counter was added to eliminate any accidental coincidences. The resolving time of this counter telescope was approxi- . mately 37 nsec. Plastic scintillators 2" square and l/4" thick were used in the first two counters, while the third used a piece 6" square and 1/4" thick.
A block diagram of the experiment is given in Figure 5« The horizontal sweep on the oscilloscope was triggered upon coincidence of the three counters. The vertical display on the oscilloscope was fed by the output from the preamplifier which amplified the pulses from the proportional counter. This preamplifier had a fast rise time of approximately 20 nsec and a small rms noise voltage of approximately 10 pV referred to the grid of the first tube, Tx . A schematic of the preamplifier is given in Figure 6 (Bennett, 1964, p. 24).
12Experimental Procedure
The dependence of the efficiency and of the behavior of the proportional counter upon the pressure, the gas, and the counter geometry was studied.
Since the counter was run at pressures of one atmosphere and higher, the problem of outgassing was not considered although each part was thoroughly cleaned in an acetone bath before the counter was assembled. In filling the counter with commercial grade argon and helium, it was filled to a pressure of 100 p.s.i.g. and was emptied after a length of time which allowed the gas and air in the counter to mix thoroughly. The counter was flushed seven times in this fashion before data -were.(taken. This same technique was employed for hydrogen, except that 75 p.s.i.g. was the maximum delivery pressure of the regulator used, and the counter was flushed eight times with the gas being vented to the out-of-doors. When the counter was filled with a 80% neon and 20% helium mixture, it was first evacuated and then flushed only twice because of the expense of the mixture and of the risk of contaminating the gas. The above-mentioned gases were the ones investigated.
The efficiency of the counter was determined by observing 100 triggered traces on the oscilloscope and counting the number with pulses at the beginning. For a given pressure the counter voltage was increased in steps, the counter efficiency being determined at each step and plotted versus the voltage. The voltage was increased until a plateau in the efficiency curve was well established, or until either the Geiger region was reached or unstable corona discharge was observed. The
13efficiency on the plateau of these curves or at the end of the proportional region was taken as the efficiency of the counter at this pressure.
For each particular gas, the pressure in the counter was increased in steps of one atmosphere, and an efficiency curve as described above was made for each step. From these efficiency curves the pressure dependence of the efficiency of the counter, P, and of the probability of no ion pairs being collected, Po, was determined. Graphs of both P and P0 were constructed.
A semi-logarithmic plot was then made to determine the constants f and b of eq.. (4), by the straight curve which best fits the experimental points.
Photographs were taken to establish the rise time, T , of thepulses.

CHAPTER IV
RESULTS
General Observations
Counter AArgon. For argon, the efficiency'curves for given pressures
had well-defined plateaus, but the proportional region on these plateaus was short, being no more than 15 volts wide. Beyond this, the counter quickly slipped into the Geiger region which was also small, being approximately 25 volts wide. The expected unstable corona discharge followed by stable corona discharge was then observed as the voltage was increased.
Helium. When the counter was run with helium, only stable discharge was observed, being preceded by none of the expected proportional or Geiger regions. This characteristic for helium persisted throughout the pressure range studied.
Counter BArgon. The efficiency curves for argon in counter B also had
well-established plateaus. On these plateaus the proportional region was wide in comparison to counter A. The width of this region was for most pressures approximately 60 volts. With an increase in counter voltage, no Geiger region of any significant width was observed.Usually unstable corona discharge followed the proportional region with
14

15an increase in voltage. With a further rise in voltage, stable discharge occurred. An efficiency curve obtained from counter B filled with argon is illustrated in Figure 7-
Helium. For helium, the results for counter A were repeated. Hydrogen. Filled with hydrogdn this counter was quite stable,
except that the result at one atmosphere was not reproducible. The proportional regions on the plateaus of the efficiency curves were wide, being over 60 volts in width. No Geiger region was readily observed. Figure 8 shows an efficiency curve for. this counter. The efficiency of counter B when filled with hydrogen was not as good as when filled with argon. The voltages at which the plateau regions began for hydrogen were higher than those for argon. This is shown in Table 1 and Figure 9>
Neon-Helium. The 80% neon 20% helium mixture run in the counter proved to be more stable than helium. The difficulties encountered with this gas mixture were that none of the results were reproducible and that while the Geiger region was well-defined, the proportions al region was not.
Counter C
Counter C, filled with argon, proved to be unstable with the
proportional and Geiger regions not being well-defined. It was unstable
to the point that most of the data were unreliable and inconsistent.
Counters A, B, and C
While no quantitative measurements were made, there appeared to be a correlation between the purity of the gas in the counter and the stability of the counter. The general observation was that with the

16more pure gas, unstable and stable corona discharge began at a lower voltage than with a less pure mixture of the same gas. These observations are in accordance with the findings of Colli and Facchini (1952).
Specific Observations
From the efficiency curves made, the values for P0 and P were determined for counter B filled with argon and with hydrogen. These results are tabulated in Tables 2 and 3. The values in Table 2 graphed on a semi-logarithmic plot as in Figure 10 gave the values of a, b, and f in eq. (3) and eq. (4). From the data, it was determined that for the pressure range studied that P0 was given by
P0 = .25e*-36p
for argon and by
Pq = .97e"'39p
for hydrogen. These results are illustrated along with the observed values in Figure 11. For argon in counter B, it was found that f = .75 while b = .36 with a being indeterminable. For hydrogen, it was determined that a = .39 and 1 s f > .85; b could not be ascertained with the data taken.
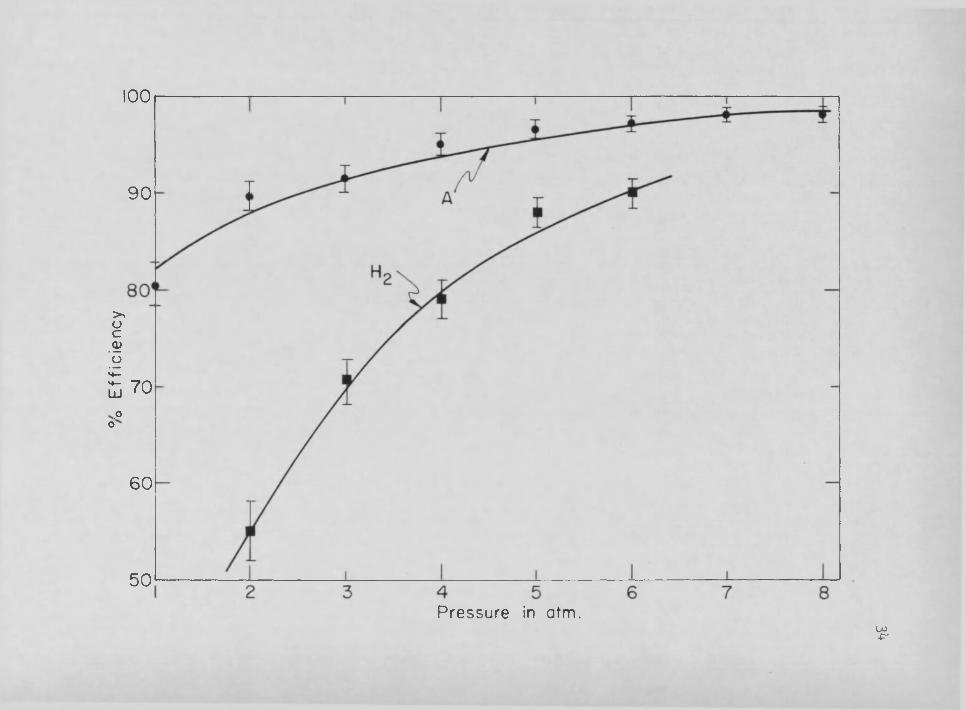
The efficiency, P, of counter B filled with argon and with hydrogen was determined from eq. (5) and the above results. The curves for P are graphed and the observed points plotted in Figure 12.
17From photographs taken. Figure 13, the rise time, T , of the
pulses from the counter filled with argon was observed to be approximately 4 psec. When filled with hydrogen, the pulses had a rise time of roughly 2 usee.
These constants and times are tabulated in Table 4.
CHAPTER V
CONCLUSIONS
From the observed behavior of the three counters and the efficiencies obtained from each, counter B, having the best stability and having the highest efficiency of the three counters, appears to offer the best counter geometry.
Although the slopes of the curves in Figure 10 are nearly the same for argon and for hydrogen in the given pressure range, the regions contributing most to the inefficiency are not the same. Since hydrogen essentially obeys eq. (2),
Po - e--39p ,
the inefficiency is governed predominantly by the more sensitive region in the counter. With argon in the counter, the main contribution to Po is from the less sensitive region since eq. (4),
Po - (1 - .75)e~"36p ,
was observed.Even though counter B is well-behaved and efficiencies up to
98% were achieved with argon and with hydrogen in the studied pressure range, it would be instructive and possibly rewarding to conduct further studies of counter B at still higher pressures with these gases and to investigate other possible counter geometries.
18
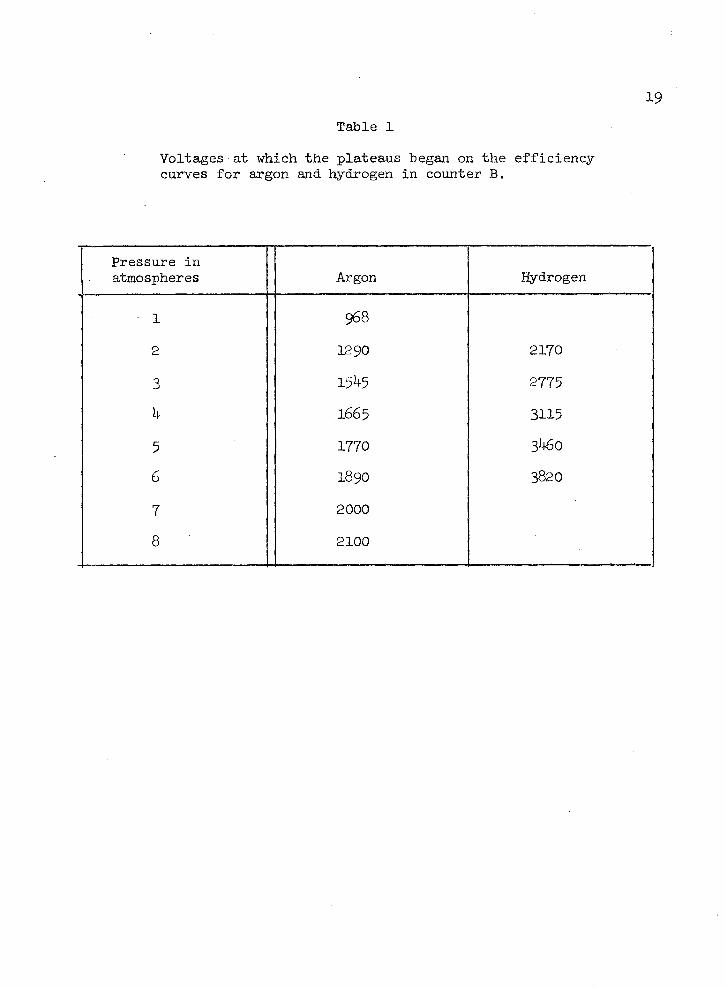
19Table 1
Voltages at which the plateaus began on the efficiency curves for argon and hydrogen in counter B.
Pressure in atmospheres Argon Hydrogen
1 9682 1290 2170
3 1545 27754 1665 31155 1770 34606 1890 3820
7 20008 2100
20Table 2
The probability of no ion pair being collected, Po, in counter B filled with argon and with hydrogen.
Pressure in atmospheres Argon %
1 .194 ± .0232 .103 ± .015 ■ .447 ± .0293 .085 ± .014 .295 ± .023h .05 ± .011 .21 ± .025 .035 ± .01 .12 ± .0166 .03 ± .008 .10 ± .0157 .02 ± .0078 .02 ± .008

21Table 3
The efficiency in percent of counter B filled with argon and with hydrogen.
Pressure in atmospheres Argon Hydrogen
1 80.6% ±2.3%2 89.7% ± 1.5% 55.3% ± 2 .9%3 91.5% . ±1.4% 70.5% ±2.3%4 95. % ± 1.1% 79. % ± 2 %
5 96.5% ± 1. % 88. % i 1.6%6 97. % ± .8% 90. % ± 1.5%7 98. % ± .7%8 98. % ± .8%
22Table 4
Values of a, b, f, and Tr as found for counter B filled with argon and with hydrogen.
Argon Hydrogen
a .39b .36f . .75 ^ 1
> .85Tr 4 |isec 2 p.sec

Removable Wire SupportSubassembly
5 7 /8 " Dio.0 .2 5 0
3/16 Dia. Hole0.I571 0 .5 0 0
.250
4 .0 0 00 .5 0 0 0 .7 5 0
8.000
Fusite # I 0 9 - H T<Vx High Voltage
\ V \a LeadEl=+ 0 .5 0 0
3/10 Dia. Hole
\ EpoxyGround Lead
Fusite # I 0 5 - H TLU
4 .0 0 0
El: 0 .0 0 0_ j— ir-
\0 Ring Groove E I:+ 0 .5 0 0
1/4 - 2 0 Threaded Hole (2 4 Equally Spaced)
Section A - AFigure 1. Pressure Vessel for Wire Support Frames.
.0 4 0 " Dia. Hole ( .0 2 5 " Dio. Where Teflon Is not Used)
0 3 2 Dio. S ta in less \ Steel Wire
.001 Dia. Stainless Steel Wire
To Ground
3/161/4
1/41/41/4
1/4
1/4
EpoxyTo High Voltage
Fiberglos
Stainless Steel # 2 0 Teflon Tubing ^ Section A—A
Epoxy
4"
1/4" | o o o o o o o o o o o o o
Figure 2. Counter A and Wire Support Frame.
25
n a n n nTo High Voltage
Figure 3* Counter B.
26
A
To High Voltage
E.001 d ia /
stainless steel wire
\ . 0 I 8 " thick brass walls
Section A-AFigure 4. Counter C.

verticaldisplay oscilloscope
proportionalcounter
preamplifier
5 kv power supply
-=EHi§-
externaltrigger
scaler
discriminator
discriminator
discriminator
coincidencecircuit
Figure 5. Block Diagram of Experiment.

8254 6688 6688 6688 6922POSITIVE HIGH
VOLTAGECMCM .02CM
CMCMCM CM
CM 3 9 0CMinCM
0.1 -r-CM
■y/S/SA1 7 - - — — —
390^ OUT6.3DC.001 CM
5KV 220k
1.5 _L 25 T
J -3 .0 0.1 zho< T ooTs
2525 25
150.012.0/200
Ta, T3, T4, T5 FILAI4ETJTS DC BIASED AT 4^ VOLTSFigure 6. Preamplifier Circuit Diagram.
roco
Figure 7. Efficiency Curve for Counter B Filled with Argon to 7 Atmospheres of Pressure.
Efficiency
29
100
90
80
70
60
o
40
30
1950 2000 20501850 19001800Counter Voltage
Figure 8 Efficiency Curve for Counter B Filled with Hydrogen to 6 Atmospheres of Pressure.
Efficiency
30
100
80
70
60
40
30
38003650 3700 3750 3850Counter Vo l tage

Figure 9 Voltages at the Beginning of the Plateaus of the Efficiency Curves for Argon and for Hydrogen in
Counter B.
Voltage
4 0 0 0
3500
3000
2500b
2000
1500
1000
5 0 0

Figure 10. Semi-Logarithmic Plot of Po for Argon and for Hydrogenin Counter B.
4Pressure

Figure 11. Probability of No Ion Pair Being Collected for Argon and for Hydrogen in Counter B.
.50
.40
.30
oCL
.20
.10
Pressure in atm.

Figure 12. The Efficiency, P, in Percent, of Counter B Filled with Argon and with Hydrogen.
Efficiency
100
90
70po
60
50
Pressure in atm. UO-pr
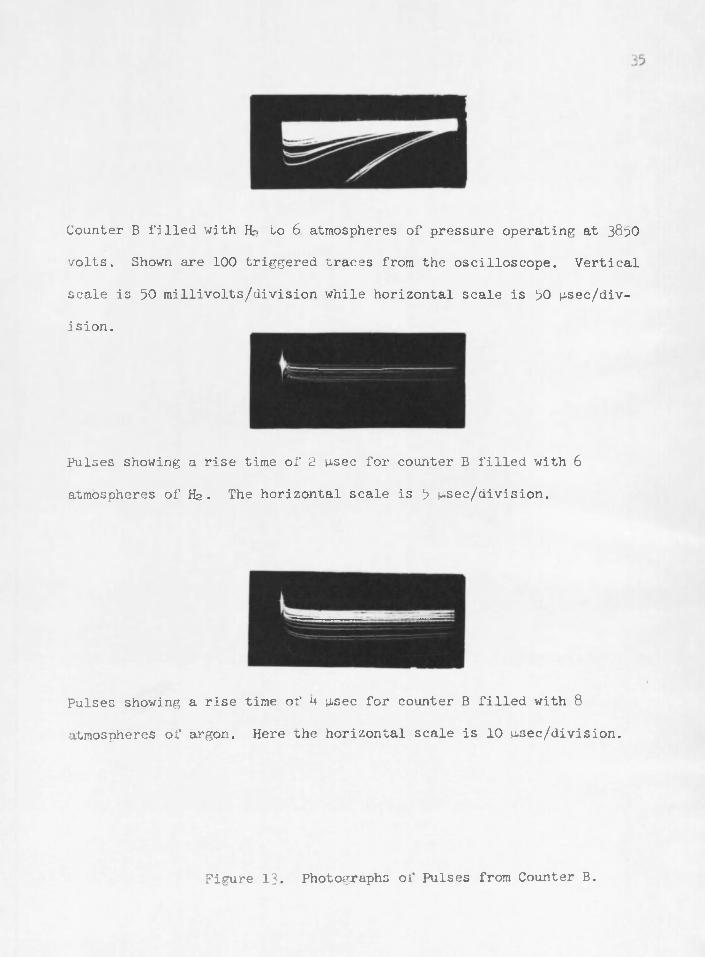
Counter B filled with Hr to 6 atmospheres of pressure operating at 38^0 volts. Shown are 100 triggered traces from the oscilloscope. Vertical scale is 50 millivolts/division while horizontal scale is 50 psec/div- ision.
Pulses showing a rise time of 2 M-sec for counter B filled with 6
atmospheres of Ha. The horizontal scale is 5 ^sec/division.
Pulses showing a rise time of 4 ^sec for counter B filled with 8 atmospheres of argon. Here the horizontal scale is 10 ^sec/division.
Figure 13. Photographs of Pulses from Counter B.
LIST OF REFERENCES
Bennett, Edgar F., A Study of the l/E Slowing-Down Neutron Spectrum Using Urr-Recoil Proportional Counters, ANL-6897 (September 1964) „
Colli, Laura and Facchini, Ugo, Discharge Mechanism in Argon Counters, Pbys. Rev. 88, 987 (1952).