a study of the effects of placing a ... 2014 pci/nbc 1 a study of the effects of placing a...
TRANSCRIPT

Castrodale 2014 PCI/NBC
1
A STUDY OF THE EFFECTS OF PLACING A LIGHTWEIGHT CONCRETE DECK
ON PRESTRESSED GIRDERS DESIGNED FOR A NORMAL WEIGHT CONCRETE DECK
Reid W. Castrodale, PhD, PE, Castrodale Engineering Consultants, PC, Concord, NC
ABSTRACT A study was performed to demonstrate the effects of changing the deck concrete type after a new design has been completed using a normal weight concrete deck, and for projects where a normal weight concrete deck is being replaced on an existing bridge. Lightweight concrete decks are usually used to reduce structure weight to improve ratings or structural efficiency, or to allow reuse of existing substructure units when widening a bridge. But lightweight concrete has also recently been considered as a strategy to reduce deck cracking. Therefore, this study is also important for new designs where a deck could be either normal weight concrete or lightweight concrete depending on the crack reduction strategy selected by a contractor. This paper examines the consequences of replacing a normal weight concrete deck with either a sand lightweight concrete deck or an all lightweight concrete deck. The effect of the change in deck type is evaluated for key design parameters, quantities related to service and strength limit state behavior, and rating factors. Typical prestressed concrete girder bridge cross-sections are studied for short, medium and long spans so the effect of the changing dead to live load ratios can be observed. Keywords: Lightweight concrete, bridge deck, cracking, service load stresses, strength limit state, camber

Castrodale 2014 PCI/NBC
2
INTRODUCTION AND PROBLEM STATEMENT
Lightweight concrete has been used for bridge decks since at least the 1930s1. The reduced density of lightweight concrete is useful to improve the load rating of existing structures or to allow widening of bridge decks without strengthening the existing superstructure and substructure elements. It has also been recognized that lightweight concrete decks have less early age cracking and improved durability for the same quality of concrete, so the primary justification for the use of lightweight concrete may be its enhanced durability in some cases. For example, VDOT is considering allowing a contractor several options for reducing the cracking of deck concrete. One of the options they are considering is to use a lightweight concrete deck.
The purpose of this analytical investigation is to study the effect on various design parameters of changing a normal weight concrete deck to lightweight concrete for a bridge with prestressed concrete girders. This study is applicable to rehabilitation projects where the deck is being replaced as well as a new project where it may be desirable to use a lightweight concrete deck instead of the as-designed normal weight concrete deck to improve the durability and life span of the deck.
A significant factor motivating this study was the concern expressed by some that placing a lightweight concrete deck on girders designed for a normal weight concrete deck would reduce the rating of the structure. This concern was based on the correct assumption that the modulus of elasticity of lightweight concrete is typically less than values for normal weight concrete, and this would cause a reduction in the stiffness of the bridge. The decreased stiffness would result in an increase in stresses and other performance-related quantities. This study looks at the complete picture to determine whether these concerns are realized in typical bridge designs.
The main parameters that are affected by replacing a normal weight concrete deck with a lightweight concrete deck include:
Material properties
Composite section properties
Live load distribution factors
Design moments and shears
Prestress losses and effective prestress
Service load concrete stresses
Flexure and shear strength
Cambers and deflections
Inventory and operating ratings for flexure and shear
Castrodale 2014 PCI/NBC
3
Some of the above quantities and other design parameters are affected by the ratio of dead to live loads. Therefore, designs with short, medium and long spans were considered in this study. Different girder types were used for the different spans. Full depth composite decks were used for all spans and girder types. For the short span designs, two types of girder cross-sections were considered – a conventional AASHTO Type II girder and a NEXT F section. Because these two girder sections have significantly different areas, it was anticipated that the change in deck concrete properties may have a different effect on the service load behavior and should therefore be considered. Bulb tee girder cross-sections, which have been adopted by VDOT and are very similar to the NEBT sections, were used for the medium and long span girders. A two lane overpass structure was used for all designs Details of the girders, span lengths, and typical sections are provided in the next section.
Three types of concrete are considered in this study for the deck: normal weight concrete (NWC), sand lightweight concrete (SLWC), and all lightweight concrete (ALWC). Descriptions of the types of lightweight concrete, and the deck and girder concrete densities used in the designs are provided in the next section. Using three types of deck concrete in the study provides information on the full range of possible deck densities that may be used for bridge design.
For this study, an initial design was completed for a normal weight girder with a normal weight deck for each span and girder type. Then the deck concrete was changed to sand lightweight concrete or to all lightweight concrete and design calculations were rerun. When the deck concrete type was changed, no modifications were made to the original girder design, that is, the concrete strengths and strand pattern from the design with the normal weight concrete deck were used for the subsequent designs.
The current author has coauthored two earlier papers that provide information on how girder designs can be modified if lightweight concrete is used for the deck or for the girder concrete2,3. The reader is referred to other papers for a discussion of the characteristics and properties of lightweight aggregates and lightweight concrete4,5. These other references also address the cost of lightweight concrete, which is typically higher than conventional normal weight concrete.
DESIGN METHODS, ASSUMPTIONS AND PARAMETERS
Designs were completed in the typical manner for the normal weight concrete deck on normal weight concrete prestressed girders. Strands were added to satisfy service load stresses at midspan. In some cases, other design criteria such as cambers were considered, so several strands were added to increase low cambers. Girders for the short and medium spans were designed using straight strands with debonding, while the long-span girders used draped strands. A design was achieved that satisfied design parameters, but no special effort was taken to optimize the design.
Tensile stresses at ends of girders at release were limited according to requirements of the AASHTO LRFD Bridge Design Specifications6. The quantity of mild reinforcement required

Castrodale 2014 PCI/NBC
4
was kept as low as practical with a reasonable amount of debonding or draping. Debonding and draping negatively affect the camber, so some designs required give and take between these quantities. Debonding limits of the LRFD Specifications were used.
When the deck was changed from normal weight concrete to lightweight concrete, no adjustments were made to girder design input parameters such as concrete strengths or the strand pattern.
Details of the assumptions and design approach used in the study are presented in the remainder of this section.
GIRDER SPANS
Girder spans used for the study are listed in Table 1.
Table 1 Girders spans used in designs
Design Span (ft) Girder Length (ft)
Short Span 44 45
Medium Span 109 110
Long Span 174 175
TYPICAL SECTION AND DECK DIMENSIONS
The typical section of the bridge was dimensioned for two 12 ft lanes with a 3.5 ft shoulder and a 1.5ft wide barrier on each side, for an overall deck width (out to out) of 34 ft and a roadway width (curb to curb) of 31 ft.
For girder designs, four girders were used with a spacing of 9 ft and an overhang of 3.5 ft. For the NEXT F girder design, the four beams were all detailed with a top flange width of 8’-5.5” for a nominal spacing of 8.5 ft.
The typical sections and nominal spans are shown in Figure 1.
The cast-in-place deck for all designs was 8 inches thick. The deck was assumed to be reinforced with conventional reinforcement and was detailed to be composite with the prestressed concrete girders.

Castrodale 2014 PCI/NBC
5
Fig. 1 Typical sections considered in study
GIRDER CROSS-SECTIONS
For the short span designs, two types of sections were considered: a 24 in. deep NEXT F beam and an AASHTO Type II girder, which is 36 in. deep. Two types of beam sections were considered because the cross-sectional area of the NEXT beam is much greater than a conventional I-beam which may affect the results of the study. Furthermore, since the composite deck is fully supported by the top flange, the NEXT beam designs may benefit from the reduced cracking potential of lightweight concrete. An AASHTO Type II girder was used for the conventional girder design rather than the shallower PCBT section because the PCBT section was greatly under-utilized for the short span. Even the Type II was under-utilized, so 0.5 in. diameter strands were used to give a reasonable number of strands and allow debonding to control stresses. Dimensions for both of these sections were obtained from appendices in the PCI Bridge Design Manual7.
For the medium and long spans, standard VDOT PCBT girder sections were used8. The PCBT-53 section was used for the medium span. For the long span girders, the depth of the bottom flange on the standard PCBT-93 was increased from 7 in. to 9 in. to allow for another row of strands. Therefore, the section is identified as a PCBT-95 girder. Dimensions for the PCBT-53 and PCBT-95 girders are shown in Figure 2.

Castrodale 2014 PCI/NBC
6
PCBT‐53 PCBT‐95 (PCBT‐93 is shown, with modifications)
Fig. 2 Dimensions of VDOT standard girder sections used for medium and long span designs (from VDOT standard girder details8)
MATERIAL PROPERTIES
Concrete properties for the selected designs are shown in Table 2. Sand lightweight concrete and all lightweight concrete are types of concrete defined in the LRFD Specifications. Sand lightweight concrete uses normal weight sand and coarse lightweight aggregate while all lightweight concrete uses lightweight aggregate for both the sand and coarse fractions in the mixture. Sand lightweight concrete has been the more commonly used type of lightweight concrete in recent years.
Table 2 Concrete properties for designs
f'ci f'c Density, wc Density, DL
Deck (ksi) (ksi) (kcf) (kcf)
NWC – 4.0 0.145 0.150
SLWC – 4.0 0.115 0.120
ALWC – 4.0 0.100 0.105
Girder
NWC – NEXT F 5.0 6.0 0.145 0.150
NWC – Type II 6.5 8.0 0.145 0.150
NWC – PCBT-53 6.5 8.0 0.145 0.150
NWC – PCBT-95 7.5 10.0 0.145 0.150
*
**
* ‐ 9” ** ‐ 7’‐11”

Castrodale 2014 PCI/NBC
7
The lightweight concrete densities shown in Table 2 represent typical values for the equilibrium density of the two types of lightweight concrete. Some variation in density is possible for different sources of lightweight aggregate. For simplicity, the normal weight concrete density was taken as 0.145 kcf for all cases, rather than using the expressions given in LRFD Table 3.5.1-1 which relates the density to a function of the concrete compressive strength.
The dead load densities (DL) shown in Table 2 were used for computing dead loads and include an allowance for reinforcement of 0.005 kcf. This allowance is customary but may underestimate the contribution of the mild reinforcement and strands to the effective unit weight of the concrete, especially when the girder is heavily prestressed.
The modulus of elasticity for each type of concrete was computed using LRFD Eq. 5.4.2.4-1 using K1 = 1.0 and the appropriate values for f′ci, f′c, and wc shown in Table 2.
The prestressing steel used in the designs was 0.6-in. diameter Grade 270 low-relaxation seven-wire strands, except for the Type II girder designs for which 0.5-in. diameter Grade 270 low-relaxation seven-wire strands were used.
DESIGN METHODS
Design calculations were performed using a commercial prestressed concrete girder design program. The images of the typical sections in Figure 1 were generated by the program.
All spans were designed as simply supported. The design span was taken as 1 ft less than the girder length in all cases, resulting in the center of bearing being located 0.5 ft from each end of the girder.
Designs were performed using the provisions of the current LRFD Specifications. Both service and strength limit state requirements were checked, but all designs were governed by the service limit state. Concrete limiting stresses used in the designs are shown in Table 3.
Table 3 Limiting stresses used in design (ksi)
Tensile stress at release 0.24f′ci *
Compressive stress at release 0.6 f′ci
Tensile stress at service limit state 0.19f′c
Compression at service limit state 0.6 f′c
* - Requires mild reinforcement to be provided to resist the tensile force.
Strands were transformed for computing section properties.
Prestress losses were computed using the detailed method of the LRFD Specifications. The only modifications made to the loss computation procedure for lightweight concrete was the use of the reduced modulus of elasticity. The reduced modulus of elasticity had a direct

Castrodale 2014 PCI/NBC
8
effect on the elastic shortening loss, which increased. LRFD Equation 5.4.2.4-1, which includes a term for the density of concrete, was used to compute the modulus of elasticity using the concrete densities listed in Table 2.
The design program used PCI multipliers to estimate cambers at erection and final conditions. At erection, the PCI multipliers were used. However, for final cambers, only the PCI multipliers for the prestress camber and girder dead load were used. No factor was applied to the deflections for the all other dead loads, that is, a factor of 1.0 was used for these loads. This approach is well accepted because it has been observed that cambers typically do not change significantly after the composite deck has been placed and cured.
Debonding was used to control stresses at release for short and medium span designs. The requirements of the LRFD Specifications were used. Generally, the debonding limits were reached prior to the tension at the top of the end of the girder falling below 0.200 ksi. Therefore, it was assumed that mild reinforcement would be placed in the top flange at the ends of the girder to satisfy the tensile stress requirements of the specifications. For the long span designs, strands were draped because debonding alone could not control the stresses as required by the LRFD Specifications.
Transverse reinforcement was detailed to satisfy shear requirements. However, the design was not optimized. Results should be adequate to demonstrate expected trends.
DESIGN LOADS
The design loads listed below were used for this study. Simplifications were made in some instances because of the preliminary and comparative nature of this study.
Live loads were computed using HL-93.
Live load distribution factors were computed for all designs using the expressions in Table 4.6.2.2.2b-1for the Type k section defined in Table 4.6.2.2.1-1. The Guidelines for Northeast Extreme Tee Beam (Next Beam)9 recommends a different procedure for computing live load distribution factors for NEXT beams, but the simplified approach was used for this study.
The full thickness of the deck was considered to be effective structurally. No allowance was made for wear of the deck.
A haunch was not included in calculations for either section properties or dead loads.
A barrier rail load of 406 plf was used for all designs, which was taken from the NCDOT standards10. The load from two barriers was distributed equally to the four girders.
A 0.015 ksf allowance for a future wearing surface was included for the area between curbs.
No load was included for deck forms.
No diaphragms were considered.

Castrodale 2014 PCI/NBC
9
COST CONSIDERATIONS
The cost of lightweight concrete is typically greater than normal weight concrete because of the additional cost for the high-temperature processing required to manufacture lightweight aggregate. Transportation costs can also be a significant component of the cost of lightweight aggregate because of the limited number and distribution of plants manufacturing structural lightweight aggregates in the US. The higher cost of lightweight aggregate results in an increased cost of lightweight concrete compared to normal weight concrete. The additional cost for lightweight concrete over normal weight concrete (often referred to as the “cost premium” for lightweight concrete) will vary with location and cost of normal weight aggregate. The cost premium for lightweight concrete usually ranges from $15/cy to $40/cy, but may be more if transportation costs are high. However, the additional cost of lightweight concrete is usually more than offset by the total project cost savings that can be attributed to the use of lightweight concrete.
The differences in cost between the normal weight concrete deck design and the lightweight concrete deck designs were not evaluated in this study.

Castrodale 2014 PCI/NBC
10
RESULTS OF DESIGNS
This section provides a summary of some of the most relevant information from the comparative designs.
MATERIAL PROPERTIES
Concrete properties for the designs are shown in Table 2. The moduli of elasticity for the girder and deck concretes, computed using the 28 day concrete strength, and modular ratios for the composite section are shown in Table 4.
For all spans and beam types, the modulus of elasticity for the sand lightweight concrete deck was 70.6% of the modulus of elasticity for the normal weight concrete deck; for the all lightweight concrete deck, the corresponding ratio was 57.3%. These are the same values as the ratios between the modular ratios for the respective types of concrete. The significant reduction in modulus of elasticity and modular ratio indicates that there will be significant reductions in the composite section properties for designs using lightweight concrete.
Table 4 Modulus of elasticity of girder and deck concrete and modular ratio, n
Span & Girder Type
Deck Concrete
Type
Mod. of Elasticity
Girder
Mod. of Elasticity
Deck
Modular Ratio, n
(ksi) (ksi)
45 ft NEXT 24 F
NWC 4,463 3,644 0.816
SLWC 4,463 2,574 0.577
ALWC 4,463 2,087 0.468
45 ft Type II
NWC 5,154 3,644 0.707
SLWC 5,154 2,574 0.499
ALWC 5,154 2,087 0.405
110 ft PCBT-53
NWC 5,154 3,644 0.707
SLWC 5,154 2,574 0.499
ALWC 5,154 2,087 0.405
175 ft PCBT-93
NWC 5,762 3,644 0.632
SLWC 5,762 2,574 0.447
ALWC 5,762 2,087 0.362

Castrodale 2014 PCI/NBC
11
COMPOSITE SECTION PROPERTIES
The composite section area, the distance from the bottom of the girder to the centroid of the composite section, and the composite moment of inertia for the different designs are summarized in Table 5.
Table 5 Composite section properties – Area, centroid and moment of inertia
Span & Girder Type
Deck Concrete
Type
Composite Area
Centroid from
Bottom
Composite Moment of
Inertia
(in2) (in.) (in4)
45 ft NEXT 24 F
NWC 1,664 20.12 127,724
SLWC 1,468 19.07 112,925
ALWC 1,379 18.50 104,902
45 ft Type II
NWC 990 30.67 193,924
SLWC 810 28.60 173,883
ALWC 729 27.33 161,658
110 ft PCBT-53
NWC 1,445 38.68 683,777
SLWC 1,266 36.09 614,100
ALWC 1,184 34.65 575,520
175 ft PCBT-93
NWC 1,735 60.95 2,615,603
SLWC 1,574 57.07 2,358,658
ALWC 1,501 55.03 2,223,673
Castrodale 2014 PCI/NBC
12
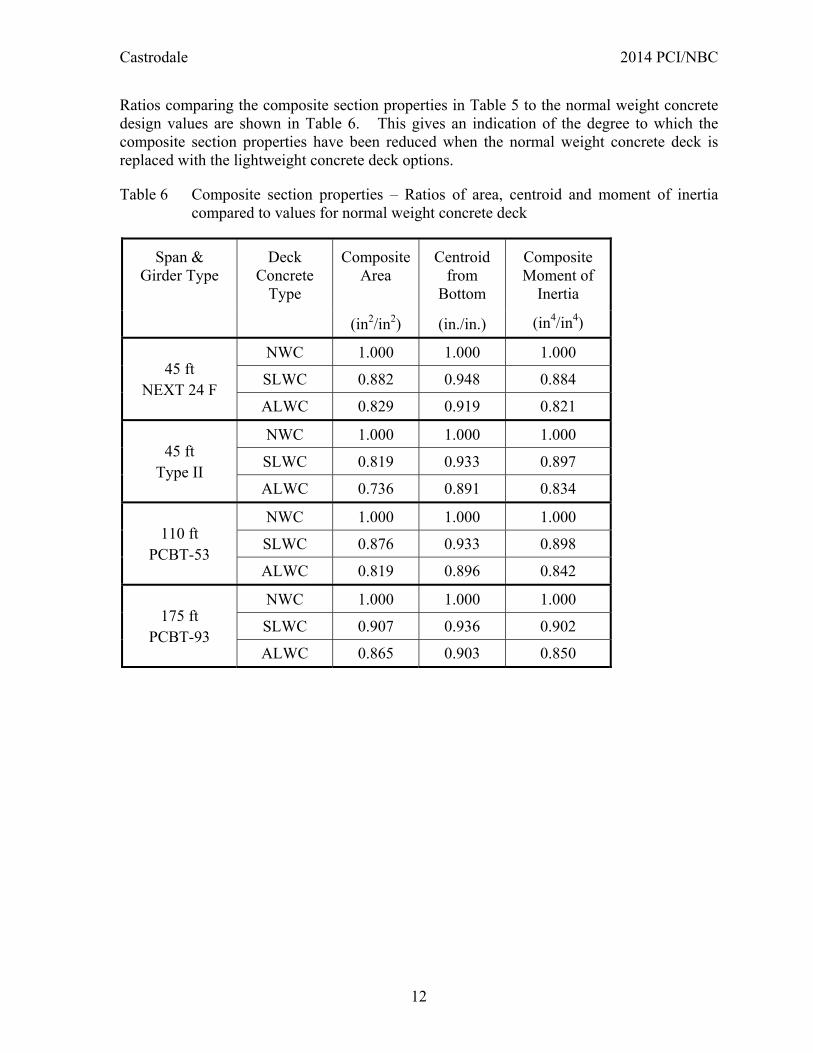
Ratios comparing the composite section properties in Table 5 to the normal weight concrete design values are shown in Table 6. This gives an indication of the degree to which the composite section properties have been reduced when the normal weight concrete deck is replaced with the lightweight concrete deck options.
Table 6 Composite section properties – Ratios of area, centroid and moment of inertia compared to values for normal weight concrete deck
Span & Girder Type
Deck Concrete
Type
Composite Area
Centroid from
Bottom
Composite Moment of
Inertia
(in2/in2) (in./in.) (in4/in4)
45 ft NEXT 24 F
NWC 1.000 1.000 1.000
SLWC 0.882 0.948 0.884
ALWC 0.829 0.919 0.821
45 ft Type II
NWC 1.000 1.000 1.000
SLWC 0.819 0.933 0.897
ALWC 0.736 0.891 0.834
110 ft PCBT-53
NWC 1.000 1.000 1.000
SLWC 0.876 0.933 0.898
ALWC 0.819 0.896 0.842
175 ft PCBT-93
NWC 1.000 1.000 1.000
SLWC 0.907 0.936 0.902
ALWC 0.865 0.903 0.850

Castrodale 2014 PCI/NBC
13
The composite section modulus for the top of the deck, top of girder and bottom of girder are summarized in Table 7. The most important of these quantities is the section modulus for the bottom of the girder since the service load stress at the bottom of the girder typically governs designs.
Table 7 Composite section properties – Section moduli
Span & Girder Type
Deck Concrete
Type
Section Modulus, Top Deck
Section Modulus,
Top Girder
Section Modulus, Bot Girder
(in3) (in3) (in3)
45 ft NEXT 24 F
NWC 13,172 32,954 6,347
SLWC 15,149 22,926 5,920
ALWC 16,615 19,067 5,671
45 ft Type II
NWC 20,572 36,374 6,323
SLWC 22,611 23,504 6,079
ALWC 23,939 18,636 5,916
110 ft PCBT-53
NWC 43,334 47,765 17,676
SLWC 49,359 36,313 17,016
ALWC 53,928 31,360 16,611
175 ft PCBT-93
NWC 98,342 76,808 42,916
SLWC 114,951 62,179 41,332
ALWC 127,968 55,630 40,410
Ratios comparing the composite section properties in Table 7 to the normal weight concrete design values are shown in Table 8. This gives an indication of the degree to which the composite section properties have been reduced when the normal weight concrete deck is replaced with the lightweight concrete deck options. It is interesting to note that the section modulus for the bottom of the girder changes no more than 7% for the sand lightweight concrete design and no more than 11% for the all lightweight concrete designs. Considering the large magnitude of the reductions of the modulus of elasticity and modular ratio, these reductions are relatively small, indicating that the impact on the design will not be as great as might be anticipated from the change in material property values.

Castrodale 2014 PCI/NBC
14
Table 8 Composite section properties – Ratios of section moduli compared to values for normal weight concrete deck
Span & Girder Type
Deck Concrete
Type
Section Modulus, Top Deck
Section Modulus,
Top Girder
Section Modulus, Bot Girder
(in3/in3) (in3/in3) (in3/in3)
45 ft NEXT 24 F
NWC 1.000 1.000 1.000
SLWC 1.150 0.696 0.933
ALWC 1.261 0.579 0.893
45 ft Type II
NWC 1.000 1.000 1.000
SLWC 1.099 0.646 0.961
ALWC 1.164 0.512 0.936
110 ft PCBT-53
NWC 1.000 1.000 1.000
SLWC 1.139 0.760 0.963
ALWC 1.244 0.657 0.940
175 ft PCBT-93
NWC 1.000 1.000 1.000
SLWC 1.169 0.810 0.963
ALWC 1.301 0.724 0.942
LIVE LOAD DISTRIBUTION FACTORS
The live load distribution factor for flexure was computed using the expression for the Type k section in LRFD Table 4.6.2.2.2b-1. Changing the deck to lightweight concrete resulted in a slight increase to the live load distribution factor that was constant for the geometry examined. The increase in live load distribution factor for the sand lightweight concrete deck compared to the normal weight concrete deck was 3.2%, and the increase for the all lightweight concrete deck was 5.2%.
The change in the Kg factor, which is used in computing the live load distribution factor for moment, was quite large. The change was again constant for the geometry examined. The increase in Kg for the sand lightweight concrete deck compared to the normal weight concrete deck was 41.6%, and the increase for the all lightweight concrete deck was 74.6%. This indicates that the effect of Kg on the live load distribution factor is minor.
The live load distribution factor for shear was unaffected by changing the type of deck concrete.

Castrodale 2014 PCI/NBC
15
DESIGN MOMENTS AND SHEARS
Service limit state design moments for deck dead load, total dead load, live load with impact, and the total service load moment are summarized for the designs in Table 9. Moments shown in the table are for midspan. These moments are close to the maximum live load and service load moments for each design.
Table 9 Selected service load moments at midspan
Span & Girder Type
Deck Concrete
Type
Deck Dead Load
Moment
Total Dead Load
Moment
Live Load + Impact Moment
Total Service Load
Moment
(k ft) (k ft) (k ft) (k ft)
45 ft NEXT 24 F
NWC 206 530 625 1,155
SLWC 165 489 645 1,134
ALWC 144 468 657 1,125
45 ft Type II
NWC 218 388 672 1,060
SLWC 174 344 693 1,037
ALWC 153 323 707 1,030
110 ft PCBT-53
NWC 1,337 3,052 2,275 5,327
SLWC 1,069 2,785 2,347 5,132
ALWC 936 2,651 2,391 5,042
175 ft PCBT-93
NWC 3,406 9,134 4,511 13,645
SLWC 2,725 8,453 4,654 13,107
ALWC 2,384 8,112 4,742 12,854

Castrodale 2014 PCI/NBC
16
Ratios comparing the several of the quantities in Table 9 to the total dead load or total service load moments are shown in Table 10. These values give an indication of the relative magnitudes of the deck dead load moment to the total dead load and total service load moments and also the relative magnitude of the live load moment to the total service load moment. As expected, the live load moment is a more significant portion of the total service load moment for the shorter spans. It is also clear that the dead load moment of the short span NEXT beam is a much larger part of the total load moment than for the Type II girder of the same span.
Table 10 Ratios of selected service load moments to total dead load or total service load moments at midspan
Span & Girder Type
Deck Concrete
Type
Deck Dead Load Moment/
Total Dead Load
Moment
Deck Dead Load Moment/
Total Serv. Load Moment
Live Load Moment /
Total Service Load
Moment
45 ft NEXT 24 F
NWC 38.8% 17.8% 54.1%
SLWC 33.7% 14.5% 56.9%
ALWC 30.7% 12.8% 58.4%
45 ft Type II
NWC 56.1% 20.5% 63.4%
SLWC 50.6% 16.8% 66.8%
ALWC 47.3% 14.8% 68.7%
110 ft PCBT-53
NWC 43.8% 25.1% 42.7%
SLWC 38.4% 20.8% 45.7%
ALWC 35.3% 18.6% 47.4%
175 ft PCBT-93
NWC 37.3% 25.0% 33.1%
SLWC 32.2% 20.8% 35.5%
ALWC 29.4% 18.5% 36.9%

Castrodale 2014 PCI/NBC
17
Service limit state design shears for deck dead load, total dead load, live load with impact, and the total service load shear are summarized for the designs in Table 11. Shears shown in the table are for the critical shear location computed by the program. For strength design, the factored shears at this location are taken as the maximum design shears for the span.
Table 11 Selected service load shears at the critical section for shear
Span & Girder Type
Deck Concrete
Type
Deck Dead Load Shear
Total Dead Load Shear
Live Load + Impact
Shear
Total Service Load Shear
(kips) (kips) (kips) (kips)
45 ft NEXT 24 F
NWC 16.8 43.3 70.5 113.8
SLWC 13.4 39.9 70.5 110.4
ALWC 11.7 38.2 70.5 108.7
45 ft Type II
NWC 17.1 30.5 71.5 102.0
SLWC 13.7 27.1 71.5 98.6
ALWC 12.0 25.4 71.5 96.9
110 ft PCBT-53
NWC 45.5 103.8 102.4 206.2
SLWC 36.4 94.7 102.4 197.1
ALWC 31.8 90.1 102.4 192.5
175 ft PCBT-93
NWC 72.4 194.3 122.3 316.6
SLWC 58.0 179.9 122.3 302.2
ALWC 50.7 172.6 122.3 294.9

Castrodale 2014 PCI/NBC
18
Ratios comparing several of the quantities in Table 11 to the total dead load or total service load shears are shown in Table 12. These values give an indication of the relative magnitudes of the deck dead load shear to the total dead load and total service load shears and also the relative magnitude of the live load shear to the total service load shear. As expected, the live load shear is a more significant portion of the total service load moment for the shorter spans. As was noted for the moments, it is again clear that the dead load shear of the short span NEXT beam is a much larger part of the total shear than for the Type II girder of the same span.
Table 12 Ratios of selected service load shears to total dead load or total service load shears at the critical section for shear
Span & Girder Type
Deck Concrete
Type
Deck Dead Load
Shear/ Total
Dead Load Shear
Deck Dead Load
Shear/ Total
Serv. Load Shear
Live Load Shear / Total
Service Load Shear
45 ft NEXT 24 F
NWC 38.8% 14.8% 62.0%
SLWC 33.6% 12.1% 63.9%
ALWC 30.6% 10.8% 64.9%
45 ft Type II
NWC 56.1% 16.8% 70.1%
SLWC 50.6% 13.9% 72.5%
ALWC 47.2% 12.4% 73.8%
110 ft PCBT-53
NWC 43.8% 22.1% 49.7%
SLWC 38.4% 18.5% 52.0%
ALWC 35.3% 16.5% 53.2%
175 ft PCBT-93
NWC 37.3% 22.9% 38.6%
SLWC 32.2% 19.2% 40.5%
ALWC 29.4% 17.2% 41.5%

Castrodale 2014 PCI/NBC
19
PRESTRESS LOSS AND EFFECTIVE PRESTRESS
Values for the total prestress loss and the effective prestress, computed using the detailed method of the LRFD Specifications, are summarized in Table 13. The change in prestress loss compared to the loss for the normal weight concrete deck design is also shown.
Table 13 Prestress loss and effective prestress
Span & Girder Type
Deck Concrete
Total Prestress
Loss
Change in PS Loss
Compared to NWC
Effective Prestress
Change in Effect. PS Compared to NWC
(ksi) (ksi)
45 ft NEXT 24 F
NWC 18.39 0.0% 184.11 0.0%
SLWC 19.08 3.7% 183.42 -0.4%
ALWC 19.34 5.2% 183.16 -0.5%
45 ft Type II
NWC 18.47 0.0% 184.04 0.0%
SLWC 18.98 2.8% 183.52 -0.3%
ALWC 19.21 4.0% 183.29 -0.4%
110 ft PCBT-53
NWC 18.97 0.0% 183.53 0.0%
SLWC 20.37 7.4% 182.13 -0.8%
ALWC 21.00 10.7% 181.50 -1.1%
175 ft PCBT-93
NWC 16.87 0.0% 185.63 0.0%
SLWC 18.27 8.3% 184.23 -0.8%
ALWC 18.92 12.2% 183.58 -1.1%
The total prestress loss increases modestly in all cases with the use of lightweight concrete in the deck. It is significant to note that the relative change to the effective prestress, which is the factor of greater importance, is small, not exceeding 1.1% even for the all lightweight concrete cases.
SERVICE LOAD STRESSES
While changing the type of deck concrete has an effect on stresses at all locations across the depth of the composite girder, this discussion is limited to the stresses at the bottom of the girder at midspan, which typically governs the design.
Concrete stresses at the bottom of the girder at midspan due to deck dead load, live load plus impact, and full dead load with prestress effects are given in Table 14. One of the columns

Castrodale 2014 PCI/NBC
20
shows the live load plus impact stress after being factored by the live load factor for Service III which is 0.8. This reduced stress is used as a component of the full service load stress rather than the full value of the live load plus impact stress.
Table 14 Concrete stresses at bottom of girder at midspan for selected service load conditions
Span & Girder Type
Deck Concrete
Deck Dead Load
Live Load + Impact
0.80 x Live Load + Impact
Full Dead Load +
Prestress
(ksi) (ksi) (ksi) (ksi)
45 ft NEXT 24 F
NWC -0.664 -1.181 -0.945 0.642
SLWC -0.531 -1.307 -1.046 0.754
ALWC -0.465 -1.390 -1.112 0.808
45 ft Type II
NWC -0.790 -1.275 -1.020 0.746
SLWC -0.632 -1.369 -1.095 0.894
ALWC -0.553 -1.433 -1.146 0.967
110 ft PCBT-53
NWC -1.245 -1.544 -1.235 0.730
SLWC -0.996 -1.655 -1.324 0.950
ALWC -0.872 -1.728 -1.382 1.057
175 ft PCBT-93
NWC -1.218 -1.261 -1.009 0.722
SLWC -0.975 -1.351 -1.081 0.935
ALWC -0.853 -1.408 -1.126 1.040
The values shown in Table 14 demonstrate that the dead load stress caused by the deck is reduced when lightweight concrete is used. This reduction is directly proportional to the reduction in density of the concrete.
The live load stress is increased for the lightweight concrete decks due to the reduction in the section modulus and the slight increase in the live load distribution factor. This means that there is an increased stress range in the bottom fiber of the girder when the normal weight concrete deck is replaced by a lightweight concrete deck. Even though the concrete stress range at the bottom of the girder increases slightly, this would have a very minor effect on the stress range in the strands. Since the designs conform to the tensile stress limits in the LRFD Specifications, it is assumed that fatigue in strands will not be an issue.

Castrodale 2014 PCI/NBC
21
It should be noted that the increase in live load stress is roughly offset by the decrease in deck dead load stress. This effect will be more clearly evident when the full service load stress is presented in Table 15.
Under full dead load conditions, the girders with lightweight concrete decks have more compression than the sections with the normal weight concrete decks.
Concrete stresses at the bottom of the girder at full service load conditions are given in Table 15. The table also presents the allowable tensile stress in the girder, which is not affected by the type of deck concrete. In the last column, the ratio of the full service load (SL) stress to the allowable tensile stress is presented.
Table 15 Concrete stress at bottom of girder for full service load conditions and comparison to allowable tensile stress
Span & Girder Type
Deck Concrete
Full Service Load Stress
Allowable Tensile Stress
Full SL Stress as
% of Allowable
(ksi) (ksi)
45 ft NEXT 24 F
NWC -0.303 -0.465 65.1%
SLWC -0.291 -0.465 62.5%
ALWC -0.304 -0.465 65.3%
45 ft Type II
NWC -0.274 -0.537 51.0%
SLWC -0.201 -0.537 37.4%
ALWC -0.180 -0.537 33.5%
110 ft PCBT-53
NWC -0.505 -0.537 94.0%
SLWC -0.374 -0.537 69.6%
ALWC -0.325 -0.537 60.5%
175 ft PCBT-93
NWC -0.287 -0.601 47.8%
SLWC -0.146 -0.601 24.3%
ALWC -0.087 -0.601 14.5%
Data in Table 15 show that for the typical girder type designs, the bottom fiber tensile stress at full service load conditions is noticeably reduced when the normal weight concrete deck is replaced with a lightweight concrete deck. Only for the NEXT beam is the difference in bottom fiber stress small for the designs being compared. Because the bottom fiber stress at full service load conditions is less for the lightweight concrete deck designs when compared

Castrodale 2014 PCI/NBC
22
to the normal weight concrete deck designs, additional stress can be accommodated before the allowable tensile stress for the girder is exceeded. This provides an additional margin for overloads and other unanticipated load effects for the lightweight concrete designs.
FLEXURAL STRENGTH
Flexural strength parameters at midspan are presented in Table 16. These include the factored moment, factored flexural resistance, and the ratio of these two quantities.
Table 16 Flexural strength quantities at midspan
Span & Girder Type
Deck Concrete
Factored Moment,
Mu
Factored Flexural
Resistance Mr
Ratio: Mr / Mu
(k ft) (k ft)
45 ft NEXT 24 F
NWC 1,763 1,810 1.03
SLWC 1,746 1,810 1.04
ALWC 1,742 1,810 1.04
45 ft Type II
NWC 1,668 1,701 1.02
SLWC 1,651 1,701 1.03
ALWC 1,647 1,701 1.03
110 ft PCBT-53
NWC 7,839 8,041 1.03
SLWC 7,631 8,041 1.05
ALWC 7,542 8,041 1.07
175 ft PCBT-93
NWC 19,421 21,850 1.13
SLWC 18,820 21,850 1.16
ALWC 18,549 21,850 1.18
Data in Table 16 indicate that the factored moment is reduced slightly when the normal weight concrete deck is replaced with a lightweight concrete deck as expected because of the reduced deck weight. The factored flexural resistance is unchanged by a change in deck concrete type because there is no difference in the strength limit state design parameters for normal weight or lightweight concrete. This includes the computation of the stress in the strands at the strength limit state. Due to the slight reduction in the factored moment, the flexural capacity ratio improves slightly with the use of lightweight concrete.

Castrodale 2014 PCI/NBC
23
SHEAR STRENGTH
Shear strength parameters at the critical section for shear are presented in Table 17. These include the factored shear, the concrete shear contribution, and the required steel contribution to shear capacity.
Table 17 Shear strength quantities at critical section for shear
Span & Girder Type
Deck Concrete
Factored Shear, Vu
Concrete Shear
Contrib., Vc
Required Steel Shear
Contrib., Vs
(ksi) (ksi)
45 ft NEXT 24 F
NWC 178.0 237.0 0.0
SLWC 173.8 237.6 0.0
ALWC 171.7 237.9 0.0
45 ft Type II
NWC 163.8 72.5 109.6
SLWC 159.6 74.0 103.2
ALWC 157.4 74.8 100.1
110 ft PCBT-53
NWC 310.5 106.1 238.8
SLWC 299.1 108.9 223.5
ALWC 293.4 110.2 215.8
175 ft PCBT-93
NWC 459.2 322.3 164.5
SLWC 441.1 327.3 139.3
ALWC 432.0 329.8 126.8
Data in Table 17 indicate that the factored shear is reduced slightly when the normal weight concrete deck is replaced with a lightweight concrete deck as expected because of the reduced deck weight. The concrete shear contribution is slightly increased with the change in deck concrete type. Due to the interaction of several parameters, there is a slight reduction in the required resistance provided by shear reinforcement for all cases except the NEXT beam, where no shear resistance is required from reinforcement.

Castrodale 2014 PCI/NBC
24
CAMBERS AND DEFLECTIONS
Cambers and deflections are important parameters in the design of prestressed girders. While these quantities do not affect the safety of the bridge, they do affect the constructability and serviceability of the bridge.
The reduction in deflection from the deck dead load is directly related to the density of the concrete, so those ratios are constant at 80% for sand lightweight concrete and 70% for all lightweight concrete.
The final cambers and live load deflections at midspan are presented in Table 18 for the designs. The calculation of the final camber includes the PCI multipliers as described earlier in the paper. The type of deck concrete does not affect the camber at erection because the girder designs are identical.
Table 18 Final camber and live load deflections at midspan
Span & Girder Type
Deck Concrete
Final Camber
Live Load Deflection
Total Deflection
(in.) (in.) (in.)
45 ft NEXT 24 F
NWC 1.02 -0.38 0.63
SLWC 1.07 -0.45 0.62
ALWC 1.10 -0.49 0.60
45 ft Type II
NWC 0.46 -0.23 0.23
SLWC 0.52 -0.27 0.25
ALWC 0.55 -0.30 0.25
110 ft PCBT-53
NWC 1.79 -1.34 0.44
SLWC 2.11 -1.55 0.56
ALWC 2.26 -1.68 0.58
175 ft PCBT-93
NWC 1.08 -1.58 -0.50
SLWC 1.49 -1.81 -0.31
ALWC 1.70 -1.95 -0.26
Data in Table 18 indicate that the final camber is increased when the normal weight concrete deck is replaced with a lightweight concrete deck as expected because of the reduced deck weight. The increase in final camber is minor for the short span designs, but increases for the longer spans. Where the difference in camber is significant for lightweight concrete designs, the engineer or contractor evaluate the effect of the increased camber. If the increased

Castrodale 2014 PCI/NBC
25
camber is greater than can be tolerated, the bearing seat elevations or the roadway profile may need to be adjusted to accommodate the increased camber. It may also be possible to reduce the camber in lightweight concrete designs by adding several strands.
The live load deflection is slightly increased for lightweight concrete designs because of the reduced section properties. The total deflections, which include the live load deflection, are relatively constant, especially for the short span designs.
LOAD RATINGS
The design program computed rating factors for the following conditions:
Inventory rating: Service load – tension & compression
Inventory rating: Strength – flexure and shear
Operating rating: Flexure and shear
The following figures graphically present the rating factors for each of these six conditions. A load rating factor of 1.0 or greater indicates that the design criteria have been satisfied and the full design capacity of the bridge is available. A higher load rating factor indicates a greater capacity to resist overloads or other unanticipated load effects.
Inventory rating factors for service load tensile stress are shown in Figure 3 for each span and girder type.
Fig. 3 Inventory rating: Service load – tensile stress

Castrodale 2014 PCI/NBC
26
The rating factors shown in Figure 3 indicate that the factor trends vary for the different spans and section types. In all cases, the rating factors are greater than 1.0. For the NEXT 24 beam, the use of lightweight concrete provided a slight drop in the rating factor, while for the Type II girder, lightweight concrete resulted in an increased rating factor. For the PCBT-53 girder, the rating factors increased moderately with the use of lightweight concrete, while for the PCBT-95, the rating factors remained constant. While the results of this comparison are inconclusive regarding a trend, it is clear that the use of lightweight concrete may possibly make a minor reduction in the tensile rating factor, but could also provide a moderate increase.
Inventory rating factors for service load compression stress are shown in Figure 4. The data in this figure show clear trends. For all design cases, the rating factors are significantly reduced when lightweight concrete is used, but the factors remain well above 1.0. This rating factor is rarely significant, so the reductions caused by lightweight concrete are not significant.
Fig. 4 Inventory rating: Service load – compression stress
Inventory rating factors for flexural strength are shown in Figure 5. The data in this figure indicate that the rating factors are increased when lightweight concrete is used, although the increase is minor especially for the short span designs. The factors are nearly 1.0 for the short spans, indicating that strength may govern some short span designs. As spans increase, the rating factors also increase more for the lightweight concrete designs, giving a comfortable margin above the value of 1.0.

Castrodale 2014 PCI/NBC
27
Fig. 5 Inventory rating: Strength – Flexure
Inventory rating factors for shear strength are shown in Figure 6.
Fig. 6 Inventory rating: Strength – Shear

Castrodale 2014 PCI/NBC
28
The data in this figure indicate a clear trend that the rating factors are increased when lightweight concrete is used. All rating factors remain above 1.0, although the factor for the medium span design approaches 1.0. The increase in rating factor when lightweight concrete is used is somewhat larger than the increase for flexural strength (note the difference in vertical scale) and does not appear to depend on the span length. The shear rating factor for the NEXT 24 beam is very high, probably because of the greater concrete shear area available with the two webs.
It is significant to note that the shear rating factors are greater for lightweight concrete designs even though the LRFD Specifications require the use of a reduction factor and a reduced resistance factor to compute the shear resistance for lightweight concrete. This applies to both inventory and operating rating factors.
Operating rating factors for flexure are shown in Figure 7. The data indicate a trend similar to that observed in the inventory rating for flexure – a small effect of using lightweight concrete for the short spans, but a noticeable increase for the longer spans. All factors are comfortably above 1.0.
Fig. 7 Operating rating: Flexure
Operating rating factors for shear are shown in Figure 8. The data indicate a clear trend that the rating factors are increased when lightweight concrete is used. Trends are similar to the inventory rating factors for shear. All rating factors remain above 1.0.

Castrodale 2014 PCI/NBC
29
Fig. 8 Operating rating: Shear
CONCLUSIONS
The comparisons reported in this paper have demonstrated that, for supporting prestressed concrete girders designed for a composite normal weight concrete deck, the replacement of the normal weight concrete deck with a sand lightweight concrete deck or an all lightweight concrete deck can be done without significant changes to the structural performance of the bridge, and certainly without negative consequences.
For the set of designs considered in the study, it was found that replacing a normal weight concrete deck with a lightweight concrete deck without making any modifications to the supporting prestressed concrete girders has the following effects:
While changes in material and composite section properties related to the change in concrete type are relatively large, the effect on more significant design parameters such as concrete stresses, flexural and shear strength, and cambers are moderate and are generally improved.
For all six of the rating factors considered, the change produced either a minor effect, or the rating factors were improved.
The results provide a basis for designers to allow the change in deck concrete type to obtain improved structural efficiency or to enhance durability without major concerns about the effect of the change on the design and performance of the bridge.

Castrodale 2014 PCI/NBC
30
While the results of this study may be convincing, the author recommends that bridge designers make their own investigation of the consequences of changing the type of deck concrete using design parameters and loads specific to the bridge for which the change is being considered.
ACKNOWLEDGEMENTS
Support for the development of this paper was provided by the Expanded Shale, Clay and Slate Institute (ESCSI).
The PSBeam software (version 4.26) used to perform the design computations for this study was provided by Eriksson Technologies, Inc.
REFERENCES 1. Castrodale, R.W., and Harmon, K.S., “Increasing Design Efficiency Using Lightweight Concrete for Prestressed Girder Bridges,” Paper 55, Proceedings, 2005 National Bridge Conference, Palm Springs, CA, PCI, October 16-19, 2005.
2. Castrodale, R.W., Eriksson, R.L., and Barngrover, B., “Comparative Bridge Designs Using Normal Weight and Lightweight Concrete,” Paper 45, Proceedings, 2009 National Bridge Conference, San Antonio, TX, PCI, September 13-15, 2009.
3. Castrodale, R.W., and Harmon, K.S., “Design of Prestressed Concrete Bridge Members Using Lightweight Concrete,” Paper 43, Proceedings, 2006 National Bridge Conference, Grapevine, TX, PCI, October 22-25, 2006.
4. ACI Committee 213, “Guide for Structural Lightweight Aggregate Concrete,” American Concrete Institute, Farmington Hills, MI, 2003.
5. Chapter 46 “Lightweight Concrete and Aggregates,” in Significance of Tests and Properties of Concrete and Concrete-Making Materials, ASTM Special Technical Publication 169D, ASTM International, West Conshocken, PA, 2006.
6. AASHTO LRFD Bridge Design Specifications, 6th Edition with interims, American Association of State Highway and Transportation Officials, Washington, DC, 2012.
7. Bridge Design Manual, 3rd Edition, PCI, Chicago, IL, 2011.
8. Manual of the Structure and Bridge Division, Volume V – Part 4: Prestressed Concrete Beam Standards, Virginia DOT, Richmond, VA, 2012.
9. Guidelines for Northeast Extreme Tee Beam (NEXT Beam), PCI Northeast, Belmont, MA, 2012.
10. Structure Design Unit - Design Manual, North Carolina DOT, Raleigh, NC, 2007.