a study of the economic activity of minnesota's reuse ... · pdf filea study of the...
TRANSCRIPT
Minnesota Management & Budget, 203 Administration Building, 50 Sherburne Avenue, St. Paul, MN 55155 Telephone: 651-259-3800 • Fax: 651-797-1311 • TTY: 800-627-3529 • www.mad.state.mn.us/
Minnesota Pollution Control Agency
A Study of the Economic Activity of Minnesota’s Reuse, Repair and Rental Sectors November 2011

Project team Peter Butler Division director Bill Clausen Assistant division director Kristin Batson Contact information Voice: 651-259-3800 E-mail: [email protected] Fax: 651-797-1311 Website: http://www.mad.state.mn.us/ Address: 203 Administration Building 50 Sherburne Avenue St. Paul, Minnesota 55155 Other formats To obtain these materials in an alternative format, — for example, large print or cassette tape — call voice 651-259-3800 or Minnesota relay, 7-1-1 or 800-627-3529 (voice, TTY, ASCII). Management Analysis & Development Management Analysis & Development is Minnesota government’s in-house fee-for-service management consulting group. We are in our 27th year of helping public managers increase their organization’s effectiveness and efficiency. We provide quality management consultation services to local, regional, state, and federal government agencies, and public institutions.

Contents Executive Summary 1 Introduction 2 Description of the Reuse Sector 4 Description of Minnesota’s Economy 13 The Minnesota Reuse Sector’s Economic Activity 19 Conclusions 23 Appendices 24


Executive Summary For this study’s purpose, the reuse sector encompasses three activities: used product sales, repairs, and rental services. Reusing materials and products, salvaging and refurbishing materials, extending a product’s life through repair, or renting products may reduce virgin-material demand and solid waste in cases when they replace or delay the need for new items. This study examines the economics associated with reuse by:
• Estimating the reuse, repair and rental sectors’ employment numbers and economic activity; and
• Describing whether consumer spending on reuse activities results in more or less overall local spending.
Minnesota’s reuse sector directly employs almost 46,000 people and generates at least $4 billion in gross sales annually, or 1.8 percent of employed people and 1.6 percent of the state’s gross domestic product. For comparison, the tourism sector has 238,000 employees and $11 billion in sales. Automotive-related industries represent 75 percent of the reuse sector’s gross sales and 60 percent of employees. The top five industries are:
• General automotive repair: 6,520 employees.
• New car dealers (used sales & repairs only): 6,070 employees.
• Automotive body, paint, & interior repair: 5,560 employees.
• Used merchandise stores: 2,930 employees.
• Other automotive mechanical & electrical repair: 2,240 employees. Most reuse firms have one to two employees and represent a small portion of economic activity while the largest firms account for the majority of reuse jobs and sales. Regional metropolitan areas’ reuse-sector employees and sales are generally in proportion to the population. Many counties’ reuse employment positively correlates with jobs generally. Limited academic research exists on the economics of reuse, but five interviewed experts agreed that reuse activities keep money local. They stated that the economic impact increases with the value added within Minnesota, but is relatively small for used items. The experts also noted that buying used does not change people’s spending habits or how money circulates, and they described the difficulty in estimating statewide economic impacts because of multiple possibilities. The reuse sector pays approximately $1 billion in wages annually and an estimated $159 million in state business, individual income and sales taxes. The 46,000 direct reuse jobs generate another 4,600 jobs in supporting industries. Reuse sector employees’ personal spending supports 8,300 jobs in unrelated industries. The state’s three largest thrift store operations generate $53 million in annual sales and divert at least 11,000 tons from landfills. They reported 154,000 annual volunteer hours, which equates to $1.1 million to $1.5 million depending on the value of a volunteer hour.
1
Introduction The Minnesota Pollution Control Agency (MPCA) commissioned this study to better understand the economics associated with reuse, the solid-waste management hierarchy’s second tier. The hierarchy indicates best management strategies for solid waste in order of best to worst: reduce, reuse, recycle, incineration, landfill. The study’s purpose was to:
• Estimate the reuse sector’s employment numbers and economic activity in Minnesota’s economy; and
• Describe whether consumer dollars spent in the reuse sector result in more or less overall local spending.
Scope
This study presents readily-available economic information on business activities that extend the useful life of consumer goods and:
• Assesses the economic activity of Minnesota’s reuse sector and not the environmental aspects.
• Defines the reuse sector more broadly than in national and other states’ studies by including repairs, which extend a product’s useful life, and rentals, which are an alternative to purchasing new items.
• Excludes recycling, online sales activities, and person-to-person sales, rentals and repairs.
• Excludes economic rebound effects associated reuse. That is, if people buy more material goods because a dollar goes further when spent in the reuse sector.
• Relies primarily upon 2009 business activity data, with no time-series data. Method
MPCA staff developed the project goals and study questions, then contracted with Management Analysis & Development (MAD) to collect and analyze the data and write this report. MPCA and MAD staff frequently discussed data and methodological issues when key decisions were required. The overall method was to:
• Define the reuse sector to identify industries for inclusion.
• Obtain the selected industries’ most recent employment and sales data.
• Adjust the data as necessary to isolate reuse activities included in larger functions.
• Estimate these industries’ economic activity with the REMI Policy Insight 2 region-economic modeling software.
• Interview local economists and review literature to qualitatively describe how consumers’ reuse-sector spending affects Minnesota’s economy.
2
Data source and adjustments
Management Analysis & Development purchased a dataset with the selected reuse industries from Dun & Bradstreet’s Government Solutions division on June 8, 2011. Dun & Bradstreet acquires and supplements the Minnesota Secretary of State’s Business Filings list with NAICS codes and employment and sales data. MPCA and Management Analysis staff considered the Dun & Bradstreet data to be the most current and complete. The data included sole proprietors and 2009 sales and employee counts, and Dun & Bradstreet staff had reviewed 89 percent of the records within the last six months. This dataset also listed each firm so miscoded ones and outliers could be excluded. However, Dun & Bradstreet estimated 28 percent of the firms’ employee numbers and 75 percent of sales “based on defined norms for the industry and size of business.” The dataset excludes chain stores’ sales data, so underestimates sales by an unknown amount for small reuse industries dominated by large chain stores, such as pawn shops and thrift stores. Management Analysis excluded firms that did not fit the reuse definition or had no Minnesota employees. Management Analysis also applied percentages to eight industries’ total sales and employees to estimate only the reuse components. The reuse percentages are based on industry-specific sources and telephone calls to a small number of Minnesota businesses. All data are rounded to the nearest $100,000 for sales and nearest 10 for employees. Appendix A documents the data sources, specific adjustments and quantitative methods for future replication.
3
Description of the Reuse Sector This section describes the type, number and size of businesses engaged in reuse activities. To decide which industries to include, MPCA defined reuse as:
• When the first owner of an item sells or gives the item to another person or entity, or donates the item to charity or community groups.
• Salvaging and refurbishing materials to extend their life and reduce the overall first costs of constructing materials and products.
• Extending a product’s life through repair so it can be used longer and replace the need for a new item.
MPCA’s definition is broader than a National Recycling Coalition study’s, which excluded repair services and explained that reuse businesses “recover products or components that were disposal-bound and sell them back into the stream of commerce [emphasis added].” 1 However, other organizations consider repair a part of reuse.2 Reuse is not recycling, which alters an object’s physical form by extracting base materials for processing into a new item. A reused object maintains its original or similar purpose without significant alteration. Reuse activities may reduce virgin material demand and the related impacts of extracting and processing virgin materials, depending on the consumer’s actions. Influencing factors include whether the reused item is a substitute for an equivalent new item or if reuse savings are spent on other new, virgin-material goods, perhaps negating the overall material conservation. However, such analysis is beyond this study’s scope. Reuse industries
Industries meeting the MPCA’s reuse definition were drawn from the North American Industry Classification System (NAICS), which federal and state governments and the private sector use to classify business establishments for statistical and other purposes (Table 1). Reuse industries without a specific NAICS code were excluded, such as pallet remanufacturers and material exchanges.3
4
1 National Recycling Coalition, “Frequently Asked Questions about the U.S. Recycling Economic Information Study,” October 2001, page 1. http://www.epa.gov/osw/conserve/rrr/rmd/rei-rw/pdf/faq.pdf. 2 See Appendix B for further explanation. 3 These businesses are in larger NAICS codes. Other reuse studies survey these businesses for jobs data.
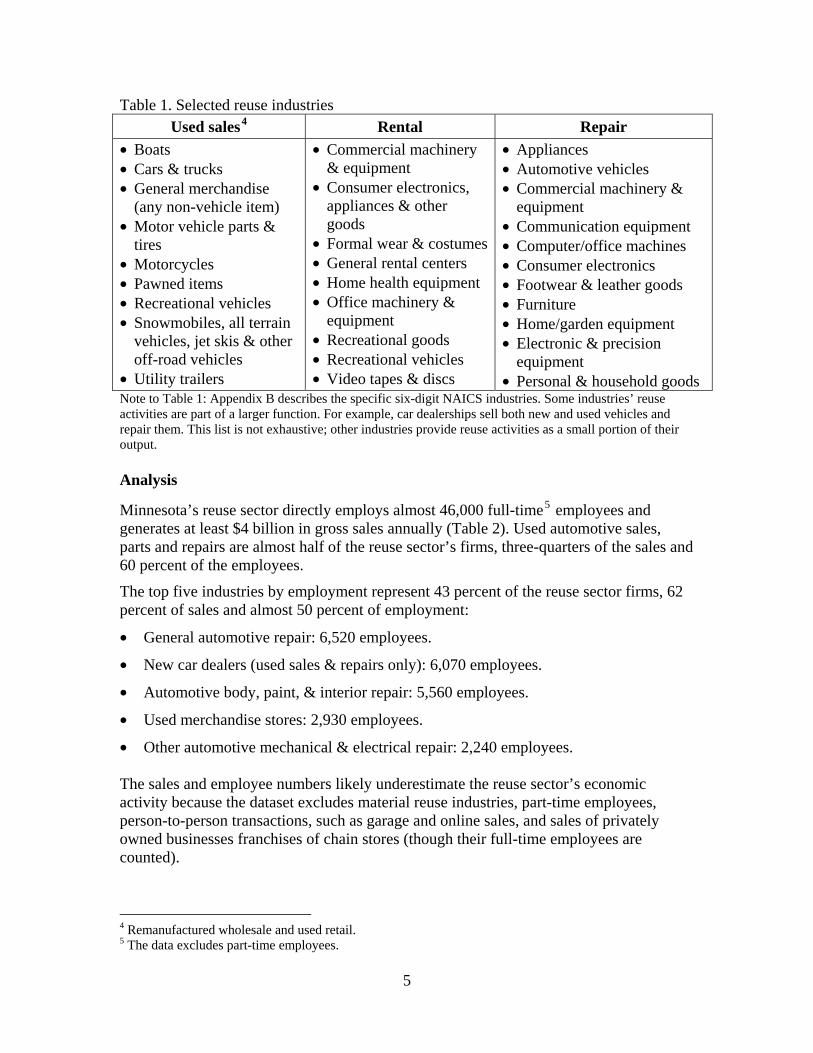
Table 1. Selected reuse industries Used sales4 Rental Repair
• Boats • Cars & trucks • General merchandise
(any non-vehicle item) • Motor vehicle parts &
tires • Motorcycles • Pawned items • Recreational vehicles • Snowmobiles, all terrain
vehicles, jet skis & other off-road vehicles
• Utility trailers
• Commercial machinery & equipment
• Consumer electronics, appliances & other goods
• Formal wear & costumes• General rental centers • Home health equipment • Office machinery &
equipment • Recreational goods • Recreational vehicles • Video tapes & discs
• Appliances • Automotive vehicles • Commercial machinery &
equipment • Communication equipment • Computer/office machines • Consumer electronics • Footwear & leather goods • Furniture • Home/garden equipment • Electronic & precision
equipment • Personal & household goods
Note to Table 1: Appendix B describes the specific six-digit NAICS industries. Some industries’ reuse activities are part of a larger function. For example, car dealerships sell both new and used vehicles and repair them. This list is not exhaustive; other industries provide reuse activities as a small portion of their output. Analysis
Minnesota’s reuse sector directly employs almost 46,000 full-time5 employees and generates at least $4 billion in gross sales annually (Table 2). Used automotive sales, parts and repairs are almost half of the reuse sector’s firms, three-quarters of the sales and 60 percent of the employees.
The top five industries by employment represent 43 percent of the reuse sector firms, 62 percent of sales and almost 50 percent of employment:
• General automotive repair: 6,520 employees.
• New car dealers (used sales & repairs only): 6,070 employees.
• Automotive body, paint, & interior repair: 5,560 employees.
• Used merchandise stores: 2,930 employees.
• Other automotive mechanical & electrical repair: 2,240 employees. The sales and employee numbers likely underestimate the reuse sector’s economic activity because the dataset excludes material reuse industries, part-time employees, person-to-person transactions, such as garage and online sales, and sales of privately owned businesses franchises of chain stores (though their full-time employees are counted).
4 Remanufactured wholesale and used retail. 5 The data excludes part-time employees.
5
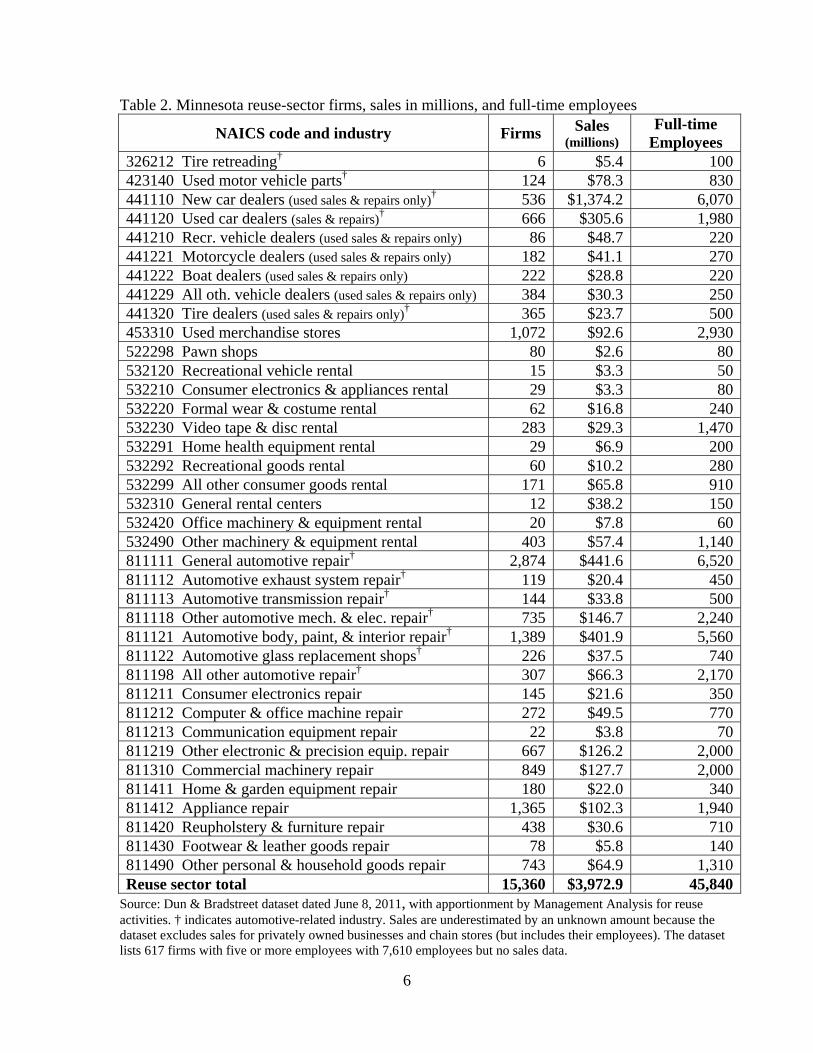
Table 2. Minnesota reuse-sector firms, sales in millions, and full-time employees
NAICS code and industry Firms Sales (millions)
Full-time Employees
326212 Tire retreading† 6 $5.4 100423140 Used motor vehicle parts† 124 $78.3 830441110 New car dealers (used sales & repairs only)† 536 $1,374.2 6,070441120 Used car dealers (sales & repairs)† 666 $305.6 1,980441210 Recr. vehicle dealers (used sales & repairs only) 86 $48.7 220441221 Motorcycle dealers (used sales & repairs only) 182 $41.1 270441222 Boat dealers (used sales & repairs only) 222 $28.8 220441229 All oth. vehicle dealers (used sales & repairs only) 384 $30.3 250441320 Tire dealers (used sales & repairs only)† 365 $23.7 500453310 Used merchandise stores 1,072 $92.6 2,930522298 Pawn shops 80 $2.6 80532120 Recreational vehicle rental 15 $3.3 50532210 Consumer electronics & appliances rental 29 $3.3 80532220 Formal wear & costume rental 62 $16.8 240532230 Video tape & disc rental 283 $29.3 1,470532291 Home health equipment rental 29 $6.9 200532292 Recreational goods rental 60 $10.2 280532299 All other consumer goods rental 171 $65.8 910532310 General rental centers 12 $38.2 150532420 Office machinery & equipment rental 20 $7.8 60532490 Other machinery & equipment rental 403 $57.4 1,140811111 General automotive repair† 2,874 $441.6 6,520811112 Automotive exhaust system repair† 119 $20.4 450811113 Automotive transmission repair† 144 $33.8 500811118 Other automotive mech. & elec. repair† 735 $146.7 2,240811121 Automotive body, paint, & interior repair† 1,389 $401.9 5,560811122 Automotive glass replacement shops† 226 $37.5 740811198 All other automotive repair† 307 $66.3 2,170811211 Consumer electronics repair 145 $21.6 350811212 Computer & office machine repair 272 $49.5 770811213 Communication equipment repair 22 $3.8 70811219 Other electronic & precision equip. repair 667 $126.2 2,000811310 Commercial machinery repair 849 $127.7 2,000811411 Home & garden equipment repair 180 $22.0 340811412 Appliance repair 1,365 $102.3 1,940811420 Reupholstery & furniture repair 438 $30.6 710811430 Footwear & leather goods repair 78 $5.8 140811490 Other personal & household goods repair 743 $64.9 1,310Reuse sector total 15,360 $3,972.9 45,840
Source: Dun & Bradstreet dataset dated June 8, 2011, with apportionment by Management Analysis for reuse activities. † indicates automotive-related industry. Sales are underestimated by an unknown amount because the dataset excludes sales for privately owned businesses and chain stores (but includes their employees). The dataset lists 617 firms with five or more employees with 7,610 employees but no sales data.
6
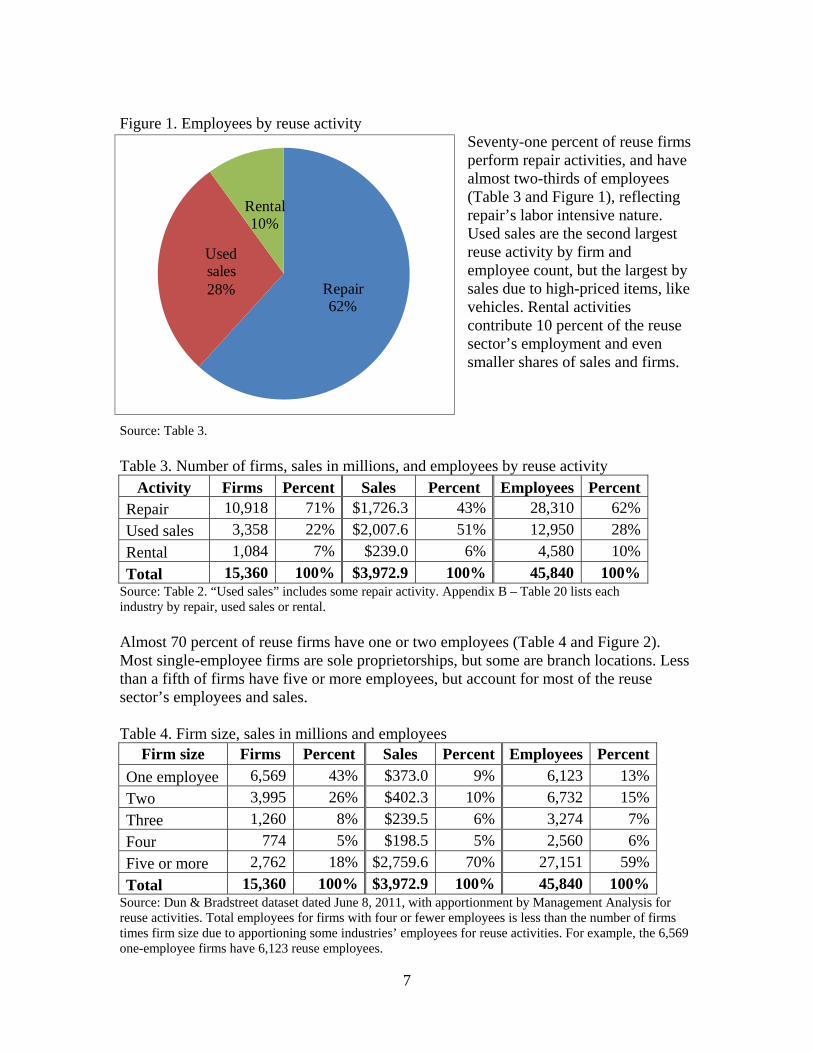
Figure 1. Employees by reuse activity
Seventy-one percent of reuse firms perform repair activities, and have almost two-thirds of employees (Table 3 and Figure 1), reflecting repair’s labor intensive nature. Used sales are the second largest reuse activity by firm and employee count, but the largest by sales due to high-priced items, like vehicles. Rental activities contribute 10 percent of the reuse sector’s employment and even smaller shares of sales and firms.
Repair62%
Used sales28%
Rental10%
Source: Table 3. Table 3. Number of firms, sales in millions, and employees by reuse activity
Activity Firms Percent Sales Percent Employees Percent Repair 10,918 71% $1,726.3 43% 28,310 62% Used sales 3,358 22% $2,007.6 51% 12,950 28% Rental 1,084 7% $239.0 6% 4,580 10% Total 15,360 100% $3,972.9 100% 45,840 100%
Source: Table 2. “Used sales” includes some repair activity. Appendix B – Table 20 lists each industry by repair, used sales or rental. Almost 70 percent of reuse firms have one or two employees (Table 4 and Figure 2). Most single-employee firms are sole proprietorships, but some are branch locations. Less than a fifth of firms have five or more employees, but account for most of the reuse sector’s employees and sales. Table 4. Firm size, sales in millions and employees
Firm size Firms Percent Sales Percent Employees Percent One employee 6,569 43% $373.0 9% 6,123 13% Two 3,995 26% $402.3 10% 6,732 15% Three 1,260 8% $239.5 6% 3,274 7% Four 774 5% $198.5 5% 2,560 6% Five or more 2,762 18% $2,759.6 70% 27,151 59% Total 15,360 100% $3,972.9 100% 45,840 100%
Source: Dun & Bradstreet dataset dated June 8, 2011, with apportionment by Management Analysis for reuse activities. Total employees for firms with four or fewer employees is less than the number of firms times firm size due to apportioning some industries’ employees for reuse activities. For example, the 6,569 one-employee firms have 6,123 reuse employees.
7
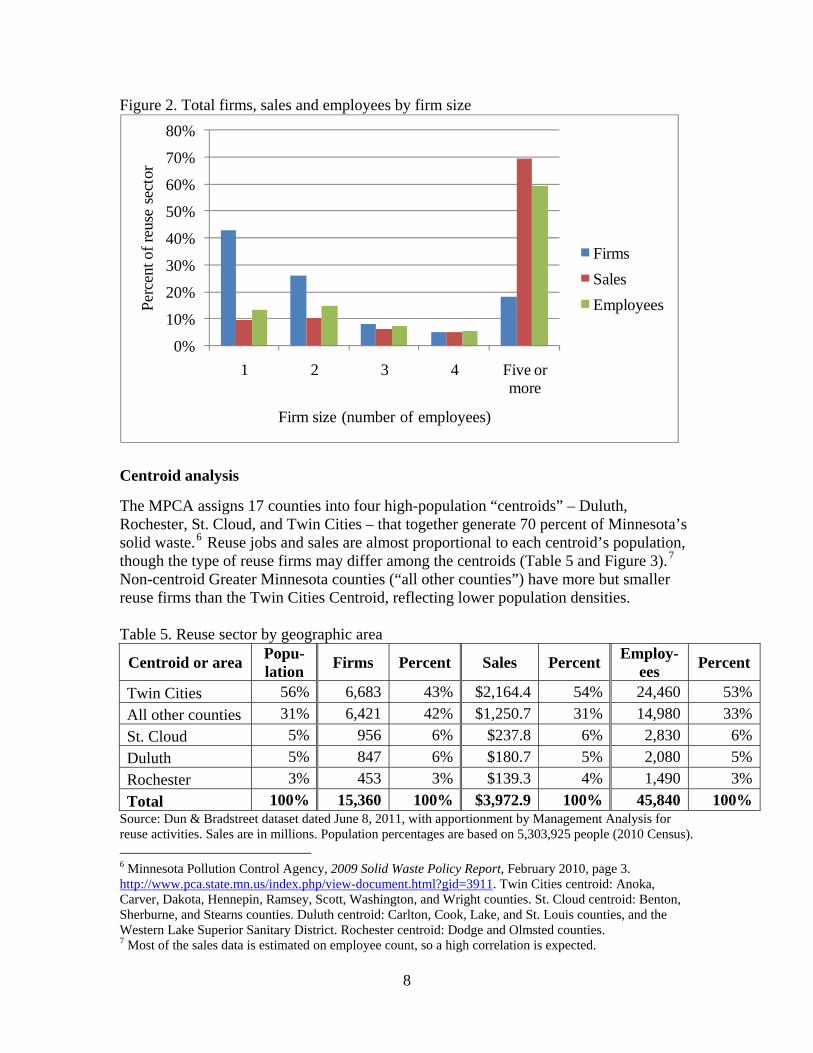
Figure 2. Total firms, sales and employees by firm size
0%
10%
20%
30%
40%
50%
60%
70%
80%
1 2 3 4 Five or more
Perc
ent o
f reu
se s
ecto
r
Firm size (number of employees)
FirmsSalesEmployees
Centroid analysis
The MPCA assigns 17 counties into four high-population “centroids” – Duluth, Rochester, St. Cloud, and Twin Cities – that together generate 70 percent of Minnesota’s solid waste.6 Reuse jobs and sales are almost proportional to each centroid’s population, though the type of reuse firms may differ among the centroids (Table 5 and Figure 3).7 Non-centroid Greater Minnesota counties (“all other counties”) have more but smaller reuse firms than the Twin Cities Centroid, reflecting lower population densities. Table 5. Reuse sector by geographic area
Centroid or area Popu- lation Firms Percent Sales Percent Employ-
ees Percent
Twin Cities 56% 6,683 43% $2,164.4 54% 24,460 53%All other counties 31% 6,421 42% $1,250.7 31% 14,980 33%St. Cloud 5% 956 6% $237.8 6% 2,830 6%Duluth 5% 847 6% $180.7 5% 2,080 5%Rochester 3% 453 3% $139.3 4% 1,490 3%Total 100% 15,360 100% $3,972.9 100% 45,840 100%
Source: Dun & Bradstreet dataset dated June 8, 2011, with apportionment by Management Analysis for reuse activities. Sales are in millions. Population percentages are based on 5,303,925 people (2010 Census). 6 Minnesota Pollution Control Agency, 2009 Solid Waste Policy Report, February 2010, page 3. http://www.pca.state.mn.us/index.php/view-document.html?gid=3911. Twin Cities centroid: Anoka, Carver, Dakota, Hennepin, Ramsey, Scott, Washington, and Wright counties. St. Cloud centroid: Benton, Sherburne, and Stearns counties. Duluth centroid: Carlton, Cook, Lake, and St. Louis counties, and the Western Lake Superior Sanitary District. Rochester centroid: Dodge and Olmsted counties. 7 Most of the sales data is estimated on employee count, so a high correlation is expected.
8

Figure 3. Percent of state population and reuse sector by geographic area
0%
10%
20%
30%
40%
50%
60%
Twin Cities All other counties
St. Cloud Duluth RochesterPerc
ent o
f pop
ulat
ion
and
reus
e se
ctor
Centroid or area
PopulationFirmsSalesEmployees
County analysis
Nine reuse employees exist per 1,000 people statewide, with county ratios ranging from 14 to 4 per 1,000 (Table 6). The 10 largest counties’ ratios are close to the statewide ratio, with the exception of Stearns County’s 11 employees per 1,000 (large regional center) and Washington County’s seven employees per 1,000 (bedroom communities). No pattern exists between most counties’ population size and the reuse employees-to-population ratio (Figure 4). Table 6. Ratio of reuse employees per 1,000 people (sorted by highest ratio)
County Employees Population Ratio County Employees Population Ratio Kandiyohi 601 42,239 14.2 Steele 326 36,576 8.9 Yellow Medicine 143 10,438 13.7 Dakota 3,516 398,552 8.8 Pennington 180 13,930 12.9 Roseau 136 15,629 8.7 Jackson 132 10,266 12.9 Carlton 306 35,386 8.7 Goodhue 583 46,183 12.6 Watonwan 95 11,211 8.5 Crow Wing 767 62,500 12.3 Winona 436 51,461 8.5 Benton 472 38,451 12.3 Cass 238 28,567 8.3 Blue Earth 768 64,013 12.0 Murray 71 8,725 8.2 Brown 296 25,893 11.4 Ramsey 4,157 508,640 8.2 Lyon 293 25,857 11.3 Hennepin 9,361 1,152,425 8.1 Stearns 1,693 150,642 11.2 St. Louis 1,622 200,226 8.1 Cottonwood 131 11,687 11.2 Mahnomen 44 5,413 8.1 Becker 360 32,504 11.1 Nobles 172 21,378 8.0 Koochiching 146 13,311 11.0 McLeod 293 36,651 8.0
9 Table continued on next page.
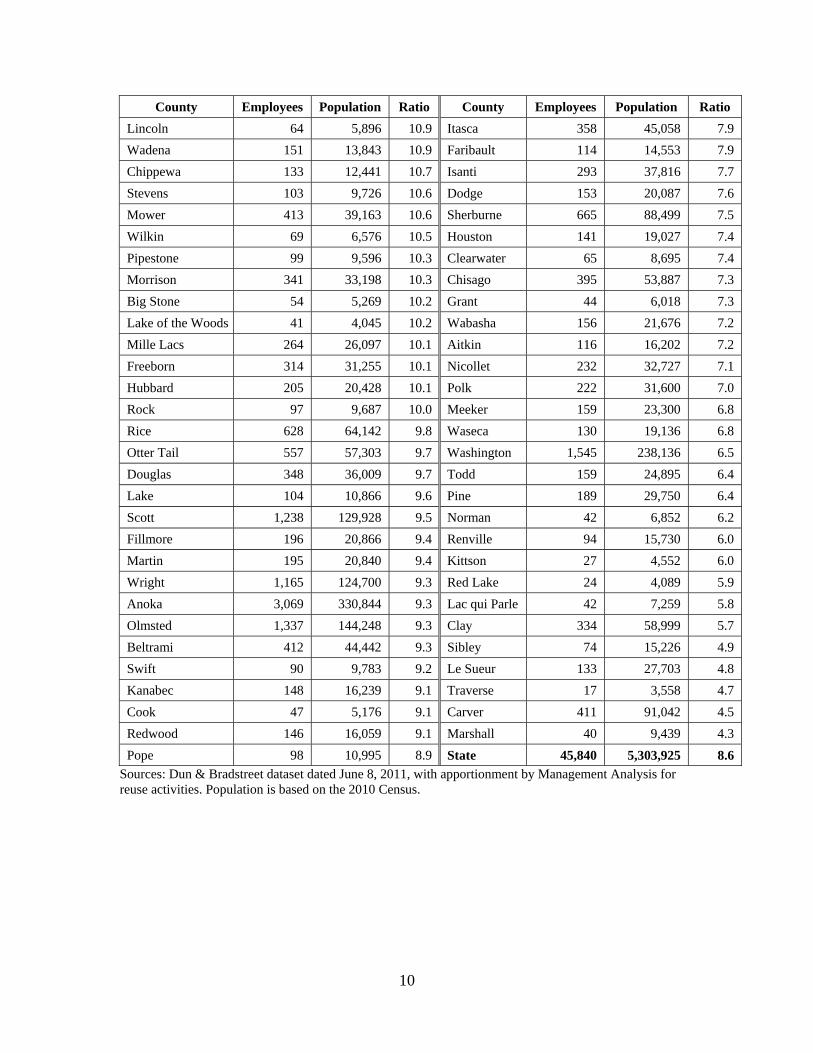
10
County Employees Population Ratio County Employees Population Ratio Lincoln 64 5,896 10.9 Itasca 358 45,058 7.9 Wadena 151 13,843 10.9 Faribault 114 14,553 7.9 Chippewa 133 12,441 10.7 Isanti 293 37,816 7.7 Stevens 103 9,726 10.6 Dodge 153 20,087 7.6 Mower 413 39,163 10.6 Sherburne 665 88,499 7.5 Wilkin 69 6,576 10.5 Houston 141 19,027 7.4 Pipestone 99 9,596 10.3 Clearwater 65 8,695 7.4 Morrison 341 33,198 10.3 Chisago 395 53,887 7.3 Big Stone 54 5,269 10.2 Grant 44 6,018 7.3 Lake of the Woods 41 4,045 10.2 Wabasha 156 21,676 7.2 Mille Lacs 264 26,097 10.1 Aitkin 116 16,202 7.2 Freeborn 314 31,255 10.1 Nicollet 232 32,727 7.1 Hubbard 205 20,428 10.1 Polk 222 31,600 7.0 Rock 97 9,687 10.0 Meeker 159 23,300 6.8 Rice 628 64,142 9.8 Waseca 130 19,136 6.8 Otter Tail 557 57,303 9.7 Washington 1,545 238,136 6.5 Douglas 348 36,009 9.7 Todd 159 24,895 6.4 Lake 104 10,866 9.6 Pine 189 29,750 6.4 Scott 1,238 129,928 9.5 Norman 42 6,852 6.2 Fillmore 196 20,866 9.4 Renville 94 15,730 6.0 Martin 195 20,840 9.4 Kittson 27 4,552 6.0 Wright 1,165 124,700 9.3 Red Lake 24 4,089 5.9 Anoka 3,069 330,844 9.3 Lac qui Parle 42 7,259 5.8 Olmsted 1,337 144,248 9.3 Clay 334 58,999 5.7 Beltrami 412 44,442 9.3 Sibley 74 15,226 4.9 Swift 90 9,783 9.2 Le Sueur 133 27,703 4.8 Kanabec 148 16,239 9.1 Traverse 17 3,558 4.7 Cook 47 5,176 9.1 Carver 411 91,042 4.5 Redwood 146 16,059 9.1 Marshall 40 9,439 4.3 Pope 98 10,995 8.9 State 45,840 5,303,925 8.6
Sources: Dun & Bradstreet dataset dated June 8, 2011, with apportionment by Management Analysis for reuse activities. Population is based on the 2010 Census.
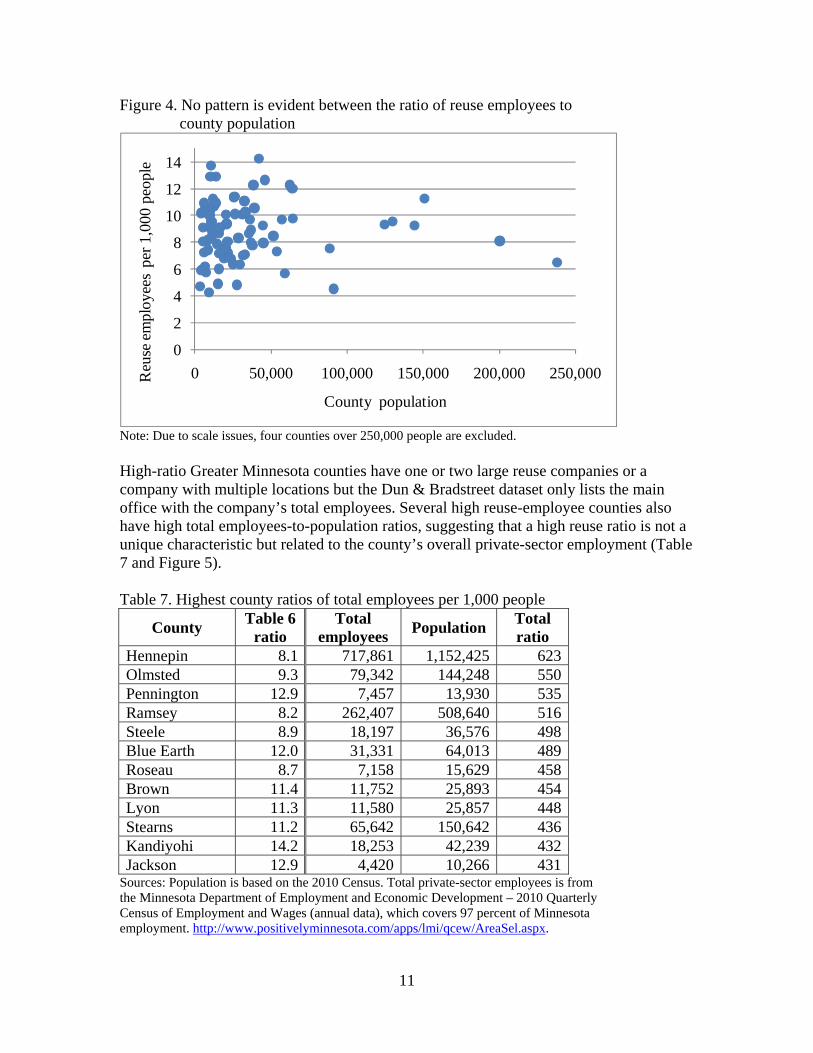
Figure 4. No pattern is evident between the ratio of reuse employees to county population
0
2
4
6
8
10
12
14
0 50,000 100,000 150,000 200,000 250,000Reu
se em
ploy
ees
per 1
,000
peo
ple
County population
Note: Due to scale issues, four counties over 250,000 people are excluded. High-ratio Greater Minnesota counties have one or two large reuse companies or a company with multiple locations but the Dun & Bradstreet dataset only lists the main office with the company’s total employees. Several high reuse-employee counties also have high total employees-to-population ratios, suggesting that a high reuse ratio is not a unique characteristic but related to the county’s overall private-sector employment (Table 7 and Figure 5). Table 7. Highest county ratios of total employees per 1,000 people
County Table 6 ratio
Total employees Population Total
ratio Hennepin 8.1 717,861 1,152,425 623Olmsted 9.3 79,342 144,248 550Pennington 12.9 7,457 13,930 535Ramsey 8.2 262,407 508,640 516Steele 8.9 18,197 36,576 498Blue Earth 12.0 31,331 64,013 489Roseau 8.7 7,158 15,629 458Brown 11.4 11,752 25,893 454Lyon 11.3 11,580 25,857 448Stearns 11.2 65,642 150,642 436Kandiyohi 14.2 18,253 42,239 432Jackson 12.9 4,420 10,266 431
Sources: Population is based on the 2010 Census. Total private-sector employees is from the Minnesota Department of Employment and Economic Development – 2010 Quarterly Census of Employment and Wages (annual data), which covers 97 percent of Minnesota employment. http://www.positivelyminnesota.com/apps/lmi/qcew/AreaSel.aspx.
11
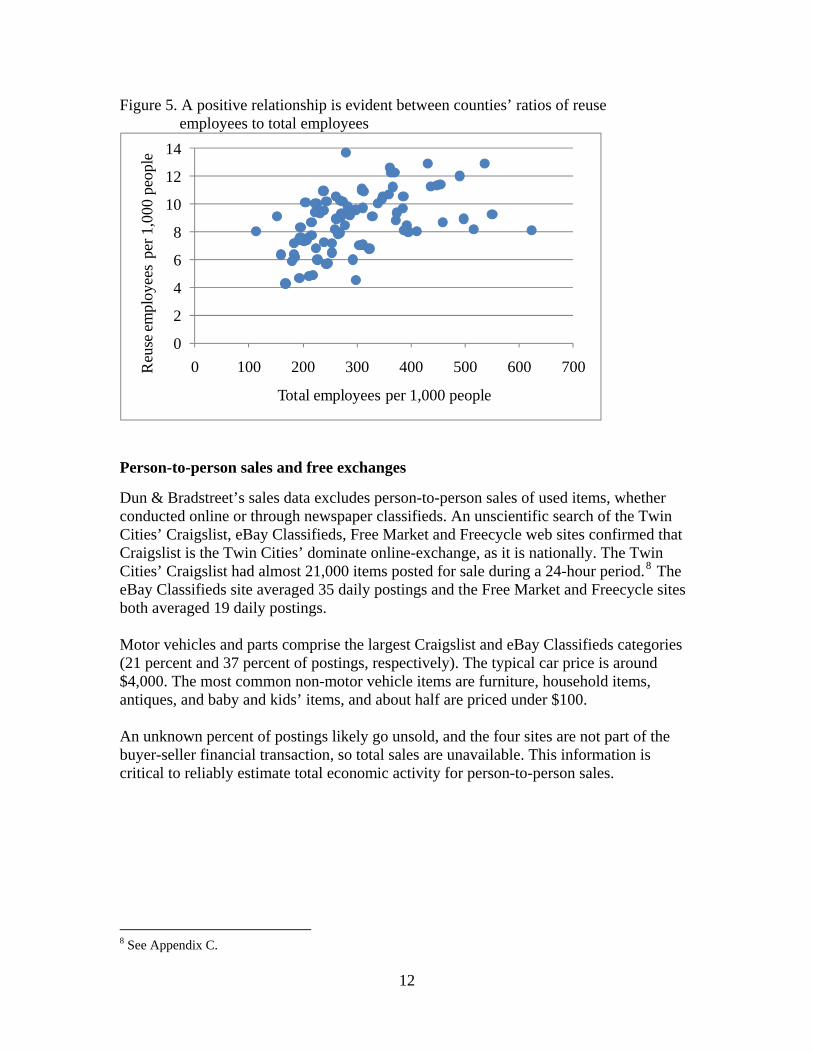
Figure 5. A positive relationship is evident between counties’ ratios of reuse employees to total employees
0
2
4
6
8
10
12
14
0 100 200 300 400 500 600 700Reu
se em
ploy
ees
per 1
,000
peo
ple
Total employees per 1,000 people
Person-to-person sales and free exchanges
Dun & Bradstreet’s sales data excludes person-to-person sales of used items, whether conducted online or through newspaper classifieds. An unscientific search of the Twin Cities’ Craigslist, eBay Classifieds, Free Market and Freecycle web sites confirmed that Craigslist is the Twin Cities’ dominate online-exchange, as it is nationally. The Twin Cities’ Craigslist had almost 21,000 items posted for sale during a 24-hour period.8 The eBay Classifieds site averaged 35 daily postings and the Free Market and Freecycle sites both averaged 19 daily postings. Motor vehicles and parts comprise the largest Craigslist and eBay Classifieds categories (21 percent and 37 percent of postings, respectively). The typical car price is around $4,000. The most common non-motor vehicle items are furniture, household items, antiques, and baby and kids’ items, and about half are priced under $100. An unknown percent of postings likely go unsold, and the four sites are not part of the buyer-seller financial transaction, so total sales are unavailable. This information is critical to reliably estimate total economic activity for person-to-person sales.
8 See Appendix C.
12
Description of Minnesota’s Economy This section describes qualitatively the impact on Minnesota’s economy when consumers buy used items or rent or repair items rather than buying new items. This information provides context for the next section by answering these questions:
• When consumers save money buying used items (as opposed to new), what do they do with their savings? Is this money used to buy more items that would not have been purchased otherwise, spent on services, or saved?
• How do Minnesotans’ savings circulate through the economy? Does money spent in Minnesota stay here?
• Does money spent on services “leak” more slowly out of the state’s borders than money spent on goods (as the services are more likely to be in-state, while the goods are more likely to be produced out-of-state). Does this leave more money in Minnesota’s economy?
• To the extent that less money spent on consumer goods results in more money spent on services, what happens to the money spent on services?
• How does buying reused compare with the alternative, which is buying new products in terms of impact on the economy? How does buying reused compare to buying from a store that sells mostly new items only? How much of each dollar spent on reused goods stays in the state compared to a dollar spent on new goods?
Composition of Minnesota’s economy
In 2009, Minnesota private and public sector organizations produced $258 billion of goods and services (Table 8).9 The five largest industries are real estate rental and leasing, manufacturing, government services, finance and insurance services, and health care and social assistance administration (56 percent). Gross domestic product excludes the value of used items, which were counted in a previous year’s output when new, but includes the value of services associated with selling a used item.
13
9 This figure, called gross domestic product (GDP), represents Minnesota labor and capital’s value added to production. Value added “is gross output (sales or receipts and other operating income, commodity taxes, and inventory change) less the value of its intermediate inputs (consumption of goods and services purchased from other U. S. industries or imported).” U.S. Department of Commerce – Bureau of Economic Analysis, Gross Domestic Product by State Estimation Methodology, 2006, page 2. https://www.bea.gov/regional/pdf/gsp/GDPState.pdf#page=8
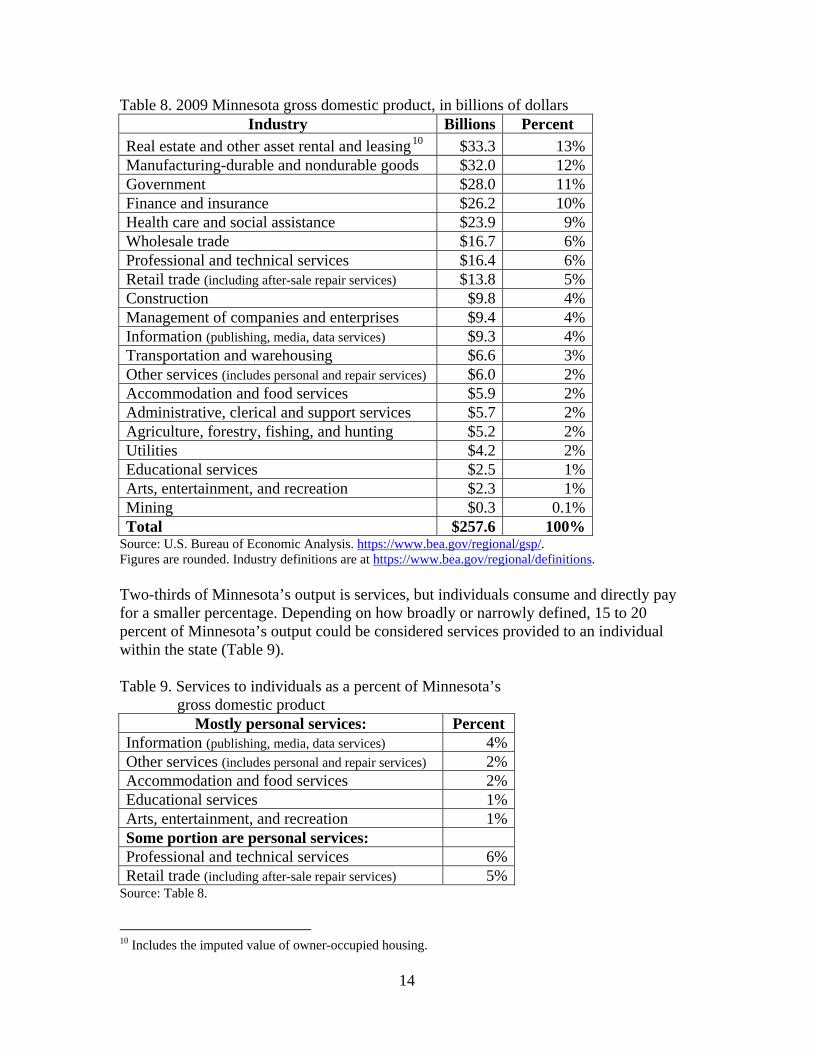
Table 8. 2009 Minnesota gross domestic product, in billions of dollars Industry Billions Percent
Real estate and other asset rental and leasing10 $33.3 13% Manufacturing-durable and nondurable goods $32.0 12% Government $28.0 11% Finance and insurance $26.2 10% Health care and social assistance $23.9 9% Wholesale trade $16.7 6% Professional and technical services $16.4 6% Retail trade (including after-sale repair services) $13.8 5% Construction $9.8 4% Management of companies and enterprises $9.4 4% Information (publishing, media, data services) $9.3 4% Transportation and warehousing $6.6 3% Other services (includes personal and repair services) $6.0 2% Accommodation and food services $5.9 2% Administrative, clerical and support services $5.7 2% Agriculture, forestry, fishing, and hunting $5.2 2% Utilities $4.2 2% Educational services $2.5 1% Arts, entertainment, and recreation $2.3 1% Mining $0.3 0.1% Total $257.6 100%
Source: U.S. Bureau of Economic Analysis. https://www.bea.gov/regional/gsp/. Figures are rounded. Industry definitions are at https://www.bea.gov/regional/definitions. Two-thirds of Minnesota’s output is services, but individuals consume and directly pay for a smaller percentage. Depending on how broadly or narrowly defined, 15 to 20 percent of Minnesota’s output could be considered services provided to an individual within the state (Table 9). Table 9. Services to individuals as a percent of Minnesota’s gross domestic product
Mostly personal services: Percent Information (publishing, media, data services) 4%Other services (includes personal and repair services) 2%Accommodation and food services 2%Educational services 1%Arts, entertainment, and recreation 1%Some portion are personal services: Professional and technical services 6%Retail trade (including after-sale repair services) 5%
Source: Table 8.
10 Includes the imputed value of owner-occupied housing.
14

Consumer spending patterns
Housing, transportation, personal insurance and pensions, food, and healthcare comprise 80 percent of the typical Twin Cities household’s expenditures (Table 10). An extra dollar of income is likely spent on these goods and services. Table 10. 2008-2009 average annual household expenditures for Minneapolis – St. Paul metropolitan statistical area
Category Dollars Percent Housing $19,164 34%Transportation $8,833 16%Personal insurance & pensions $6,969 12%Food (at home & away) $6,887 12%Healthcare $3,314 6%Entertainment $3,217 6%Cash contributions $2,518 4%Apparel & services $1,864 3%Education $871 2%Miscellaneous $832 1%Personal care products & services $733 1%Alcoholic beverages $683 1%Tobacco products & smoking supplies $328 1%Reading $128 0.2%Total $56,341 100%
Source: U. S Bureau of Labor Statistics – Consumer Expenditure Survey, Table 22. Selected Midwestern metropolitan statistical areas: Average annual expenditures and characteristics, Consumer Expenditure Survey, 2008-2009, October 2010. http://www.bls.gov/cex/2009/msas/midwest.xls. Consumer spending is directed towards the basic necessities and any discretionary income gained from reuse activities will likely have a small impact on Minnesota’s economy, especially if spent on personal services. However, personal services are more likely to be produced in Minnesota because the services are provided to an individual, such as hair styling, dining out, entertainment, gym memberships and dry cleaning. The economics of reuse
Academic researchers have not studied extensively the economics of reuse. One study noted that, “Over the past four decades, economists have investigated recycling. However, only a few studies have been performed so far that address the economics of reuse.”11 Web and online catalogue searches found a few academic papers, which mostly discuss theoretical models of consumer and producer behavior, pricing effects on new items, and waste disposal impacts.
11 Yokoo, Hide-Fumi, “An Economic Theory of Reuse.” Copyright by Integrated Research System for Sustainability Science, United Nations University, and Springer 2009. Published online on October 15, 2009. http://www.springerlink.com/content/265421gu453m33w8/.
15

Management Analysis & Development interviewed five experts to understand the reuse sector’s economic impacts:
• An Iowa State University associate scientist who conducts regional economic impact studies on recycling, reuse and other industries and was a consultant to the 2001 U.S. Recycling Economic Information Study, which estimated the number of direct, indirect and induced jobs.
• The Minnesota Department of Employment and Economic Development’s economic analysis director, who studies Minnesota’s business sectors and jobs.
• The Minnesota state economist, who produces the Minnesota Department of Management & Budget’s state revenue forecasts and is a University of Minnesota – Twin Cities professor.
• A University of Minnesota – Twin Cities associate professor and extension economist who studied the economics of solid waste disposal.
• A vice president of a national consulting firm’s solid waste practice, which conducted the 2001 U.S. Recycling Economic Information Study and similar economic impacts studies for individual states.
Interviewees agreed that reuse keeps money local and that the economic impact increases with the amount of activity within Minnesota. They explained why:
• “Is there a local connection and is the company based here to capture the capital gains? Certainly, personal services are more likely performed in Minnesota than a manufactured product.”
• If you buy a used t-shirt [locally for] $10 rather than $20, that $10 goes largely to the person that sold it to you. You have another $10 to spend on something new as well. There is an extra round of spending…an extra kick from the $10 in savings.”
• “It depends on the items you buy. In general, reuse is keeping more money in your economy.”
For example, 34 percent of every auto repair dollar is for employee compensation, 17 percent is for gross operating surplus, and 13percent for vehicle parts nationally. The remaining dollar is spent on taxes (5 percent), real estate (3 percent) and a multitude of services and goods.12 A locally- owned repair-business could retain at least 50 percent of the repair dollar in the state (payroll, gross surplus and locally purchased services). In contrast, new car dealerships’ payroll, advertising and rent expenses are 13 percent of total new car sales nationally.13
16
12 Bureau of Economic Analysis, 2002 Benchmark Detailed Input-Output Table for U.S.; Commodity-by-Industry Direct Requirements, NAICS 8111A0 (Automotive repair and maintenance, except car washes). http://www.bea.gov/industry/. Equivalent information is unavailable for new car dealerships. 13 National Automobile Dealers Association, State of the Industry Report 2011, page 3. http://www.nada.org/NR/rdonlyres/0798BE2A-9291-44BF-A126-0D372FC89B8A/0/NADA_DATA_08222011.pdf.
One web site stated that “reuse companies tend to be small and locally owned and operated, providing local jobs and increased capital retention.”14 However, the interviewed economists believe reuse activities provide little value added. A couple noted that retail activity generally has little value added because few items are Minnesota made and repair services require parts, not just in-state labor. Minnesota’s gross domestic product excludes the value of used items, which were counted in a previous year’s output when new, but includes the value of services from repurposing and selling them. Another website noted that reuse’s environmental and economic benefits increase with the item’s size and cost: “new furniture is both resource-intensive and expensive. Repair, repainting, and reupholstering of used furniture can replace the purchase of new furniture.”15 While reuse extends the useful life of expensive-but-infrequently-purchased durable goods, such as furniture, cars, and large home-appliances, a national recycling study describes reuse’s limitation: “the [value added] cannot exceed the value inherent in a new product made from raw materials – otherwise people would buy the new product.”
16 One exception is antiques, whose value can exceed new items, depending on scarcity, quality, availability of reproductions and collecting trends.17 Interviewees also stated that reuse spending primarily benefits the individual consumer but has no effect on the macro-economy:
• “The economy doesn’t care how the money is spent. Reuse allows you to stretch your dollar but hasn’t expanded the economy.”
• “The consumer who buys used will buy something else or save it, both of which help the economy. But the impacts are probably the same proportion whether new or used: the money will get recycled one way or the other.”
• “Some would argue that reuse has very little economic impact other than providing more choices to consumers.”
• “For the individual, he is better off, whether the item is produced here or elsewhere. The money he saves is the same as he gets in his paycheck.”
Interviewees suggested analyzing specific items and consumer behavior to understand the reuse sector’s economic impacts. Some interviewees recommended including materials and energy savings, transportation and sorting costs, and resource scarcity factors. Any analysis should consider:
• How much of a product or service is produced locally.
• The reused product’s original resource requirements.
17
14Institute for Local Self-Reliance, “Job Creation Through Product Reuse.” http://www.ilsr.org/recycling/reusejobs.html. 15 Advameg, Inc., Pollution Issues. http://www.pollutionissues.com/Re-Sy/Reuse.html. 16 R. W. Beck, Inc., U.S. Recycling Economic Information Study, prepared for the National Recycling Coalition, July 2001, page 4-14. http://www.epa.gov/osw/conserve/rrr/rmd/rei-rw/pdf/n_report.pdf. 17 Lennon Hall Antiques, “Top 10 collectible value factors.” http://www.upon-bamboo-fly-fishing-rods-and-reels.com/top-10-collectible-value-factors.html.

18
• The reused product’s remaining useful life.
• The economic activity displaced by the reuse spending.
• How consumers spend their savings from reuse activities. During the latest economic downturn, the news media reported that more consumers were buying used goods and bartering to save money and that thrift stores experienced significant increases in sales and new customers. New consignment and thrift stores opened, too. Often consumers directed the savings to reduce debt or make home improvements or to adjust their spending to less household income.18 A Federal Reserve Bank report noted that “a large proportion of families in all wealth groups and across the range of changes in wealth expressed the need for greater precautionary savings.”19 One interviewed economist stated that banks invest deposits for the highest rates of return, which might be out-of-state or even internationally. A few reuse industries are shrinking. One report explains that online and cable subscription services have eroded the DVD, game and video rental-store market, while higher disposable incomes and low-priced imports have encouraged people to buy rather than rent formal wear.20 In contrast, online used merchandise purchases are growing, evident by the success of eBay and Craigslist. One source noted that the recession has played a major role, but suggested that “a shift in values” towards green purchasing habits is occurring.21 In conclusion, reuse activities retain and recirculate money in a local economy, offer consumers more choices and “stretch” consumers’ dollars. However, the multiplier effect diminishes as the economy becomes larger because reuse spending displaces other spending within the same economy. Economic impacts may differ by specific reuse activity and are also influenced by consumers’ current finances, tastes, and basic needs. Additionally, demand for used purchases, repairs and rental services fluctuate over time depending on economic condition and new developments in products and services.
18 USA Today, “Consumers are spending, but on used goods, debt payments,” May 18, 2009, http://www.usatoday.com/money/economy/2009-05-18-consumers-spending-recession_N.htm; The New York Times, “In a Tight Holiday Season, Some Turn to Barter,” December 22, 2010, http://www.nytimes.com/2010/12/23/science/earth/23swap.html?scp=1&sq=%22Secondhand+Items+Gain+Some+Respect%22&st=nyt&pagewanted=print; and Brandweek, “Will Interest in Secondhand Goods Outlive the Recession?, October 31 2009, http://www.adweek.com/news/advertising-branding/will-interest-secondhand-goods-outlive-recession-105925?pn=1. 19 Federal Reserve Board – Divisions of Research & Statistics and Monetary Affairs, “Surveying the Aftermath of the Storm: Changes in Family Finances from 2007 to 2009,” March 2011, page 22. http://www.federalreserve.gov/pubs/feds/2011/201117/201117pap.pdf. 20 Van Beeck, Toon, “Ten Key Industries That Will Decline, Even After the Economy Revives,” Commercial Insights, American Bankers Association – Center for Commercial Lending & Business Banking, May 2011, page 4. http://www.ibisworld.com/Common/MediaCenter/Dying%20Industries.pdf. 21 Brandweek, “Will Interest in Secondhand Goods Outlive the Recession?, October 31 2009, http://www.adweek.com/news/advertising-branding/will-interest-secondhand-goods-outlive-recession-105925?pn=1.
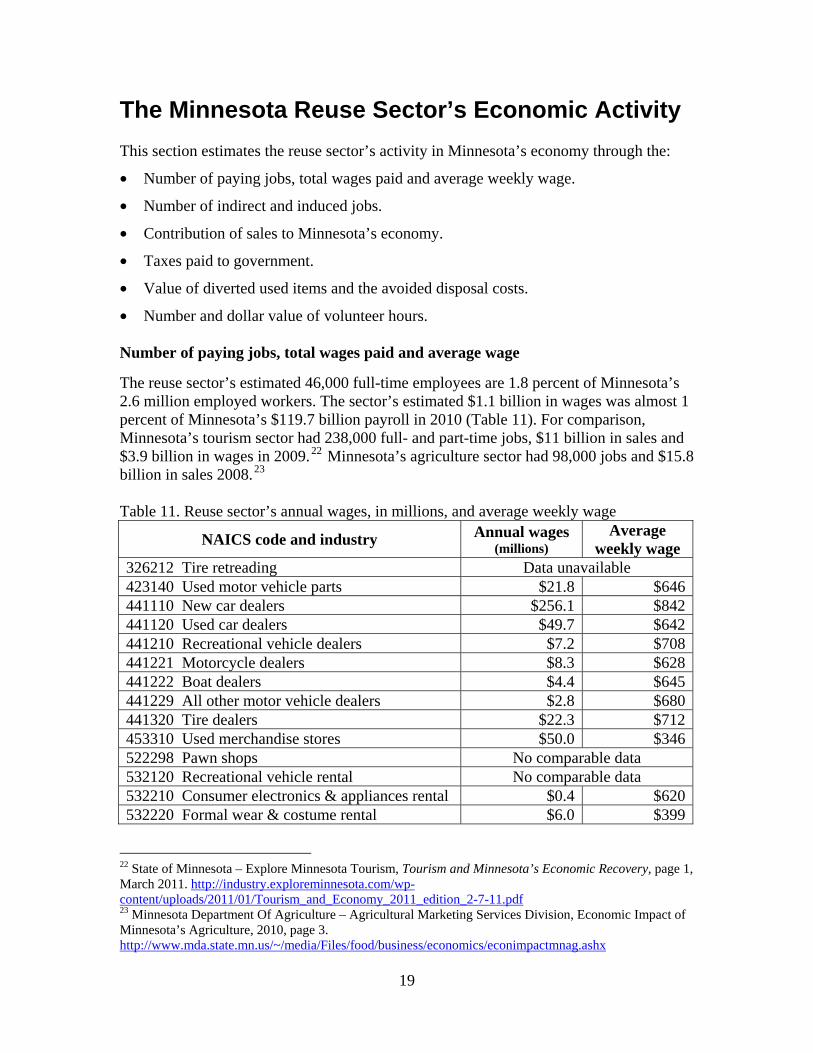
The Minnesota Reuse Sector’s Economic Activity This section estimates the reuse sector’s activity in Minnesota’s economy through the:
• Number of paying jobs, total wages paid and average weekly wage.
• Number of indirect and induced jobs.
• Contribution of sales to Minnesota’s economy.
• Taxes paid to government.
• Value of diverted used items and the avoided disposal costs.
• Number and dollar value of volunteer hours. Number of paying jobs, total wages paid and average wage
The reuse sector’s estimated 46,000 full-time employees are 1.8 percent of Minnesota’s 2.6 million employed workers. The sector’s estimated $1.1 billion in wages was almost 1 percent of Minnesota’s $119.7 billion payroll in 2010 (Table 11). For comparison, Minnesota’s tourism sector had 238,000 full- and part-time jobs, $11 billion in sales and $3.9 billion in wages in 2009.22 Minnesota’s agriculture sector had 98,000 jobs and $15.8 billion in sales 2008.23 Table 11. Reuse sector’s annual wages, in millions, and average weekly wage
NAICS code and industry Annual wages (millions)
Average weekly wage
326212 Tire retreading Data unavailable 423140 Used motor vehicle parts $21.8 $646441110 New car dealers $256.1 $842441120 Used car dealers $49.7 $642441210 Recreational vehicle dealers $7.2 $708441221 Motorcycle dealers $8.3 $628441222 Boat dealers $4.4 $645441229 All other motor vehicle dealers $2.8 $680441320 Tire dealers $22.3 $712453310 Used merchandise stores $50.0 $346522298 Pawn shops No comparable data 532120 Recreational vehicle rental No comparable data 532210 Consumer electronics & appliances rental $0.4 $620532220 Formal wear & costume rental $6.0 $399
22 State of Minnesota – Explore Minnesota Tourism, Tourism and Minnesota’s Economic Recovery, page 1, March 2011. http://industry.exploreminnesota.com/wp-content/uploads/2011/01/Tourism_and_Economy_2011_edition_2-7-11.pdf 23 Minnesota Department Of Agriculture – Agricultural Marketing Services Division, Economic Impact of Minnesota’s Agriculture, 2010, page 3. http://www.mda.state.mn.us/~/media/Files/food/business/economics/econimpactmnag.ashx
19

20
NAICS code and industry Annual wages (millions)
Average weekly wage
532230 Video tape & disc rental $12.8 $266532291 Home health equipment rental No comparable data 532292 Recreational goods rental $4.0 $300532299 All other consumer goods rental $20.9 $718532310 General rental centers $29.7 $658532420 Office machinery & equipment rental No comparable data 532490 Other machinery & equipment rental $23.7 $1,15924
811111 General automotive repair $149.4 $678811112 Automotive exhaust system repair $6.1 $659811113 Automotive transmission repair $11.9 $714811118 Other automotive mech. & elec. repair $14.3 $675811121 Automotive body, paint, & interior repair $156.4 $805811122 Automotive glass replacement shops $27.7 $756811198 All other automotive repair $4.9 $488811211 Consumer electronics repair $2.1 $908811212 Computer & office machine repair $24.3 $984811213 Communication equipment repair $2.6 $788811219 Other electronic & precision equip. repair $30.4 $1,093811310 Commercial machinery repair $128.3 $902811411 Home & garden equipment repair $2.5 $437811412 Appliance repair $7.5 $891811420 Reupholstery & furniture repair $5.3 $593811430 Footwear & leather goods repair $1.0 $436811490 Other personal & household goods repair $18.7 $454Reuse sector total $1,113.5 $674
Source: Minnesota Department of Employment and Economic Development – 2010 Quarterly Census of Employment and Wages (annual data). http://www.positivelyminnesota.com/apps/lmi/qcew/AreaSel.aspx. Eight industries’ annual wages were apportioned by the estimated reuse percentages. DEED does not publish the tire retreading industry’s data because of too few firms (six). Four industries’ DEED data was not directly comparable with the Dun & Bradstreet dataset, and are labeled as “No comparable data.” The reuse sector’s average weekly wage was $674 for part-time and full-time employment, 25 percent less than the statewide average of $899.25 The reuse sector’s 1.8 percent employment proportion is higher than its 1 percent of wages proportion because:
• The wage data excludes sole proprietors, who represent 13 percent of the 46,000 reuse jobs. Their weekly income could raise or lower the average weekly reuse wage.
• The reuse sector’s average weekly wage is less than the statewide average.
24 This weekly average is likely an outlier caused by one or two unique firms. The DEED data shows 75 firms with 390 employees. 25 Minnesota Department of Employment and Economic Development – 2010 Quarterly Census of Employment and Wages (annual data), which covers 97 percent of Minnesota employment, but excludes sole proprietors, self-employed, family farmers and commission-based employment. http://www.positivelyminnesota.com/apps/lmi/qcew/AreaSel.aspx.
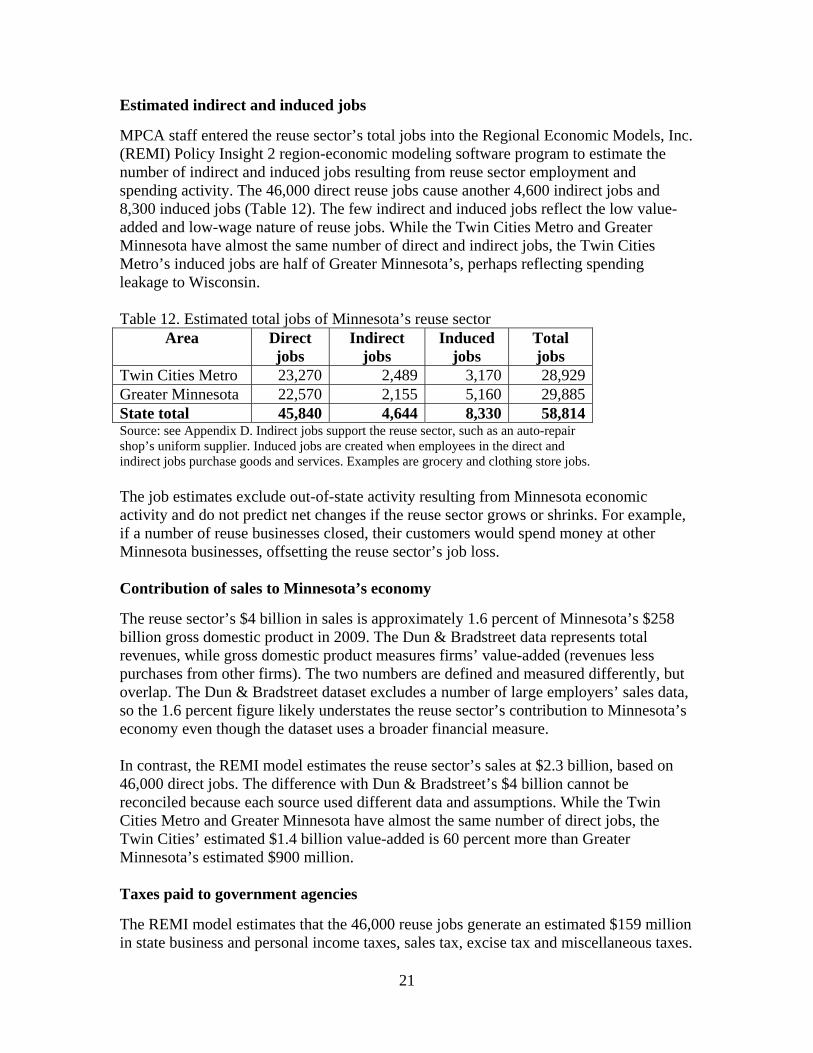
Estimated indirect and induced jobs
MPCA staff entered the reuse sector’s total jobs into the Regional Economic Models, Inc. (REMI) Policy Insight 2 region-economic modeling software program to estimate the number of indirect and induced jobs resulting from reuse sector employment and spending activity. The 46,000 direct reuse jobs cause another 4,600 indirect jobs and 8,300 induced jobs (Table 12). The few indirect and induced jobs reflect the low value-added and low-wage nature of reuse jobs. While the Twin Cities Metro and Greater Minnesota have almost the same number of direct and indirect jobs, the Twin Cities Metro’s induced jobs are half of Greater Minnesota’s, perhaps reflecting spending leakage to Wisconsin. Table 12. Estimated total jobs of Minnesota’s reuse sector
Area Direct jobs
Indirect jobs
Induced jobs
Total jobs
Twin Cities Metro 23,270 2,489 3,170 28,929 Greater Minnesota 22,570 2,155 5,160 29,885 State total 45,840 4,644 8,330 58,814 Source: see Appendix D. Indirect jobs support the reuse sector, such as an auto-repair shop’s uniform supplier. Induced jobs are created when employees in the direct and indirect jobs purchase goods and services. Examples are grocery and clothing store jobs. The job estimates exclude out-of-state activity resulting from Minnesota economic activity and do not predict net changes if the reuse sector grows or shrinks. For example, if a number of reuse businesses closed, their customers would spend money at other Minnesota businesses, offsetting the reuse sector’s job loss. Contribution of sales to Minnesota’s economy
The reuse sector’s $4 billion in sales is approximately 1.6 percent of Minnesota’s $258 billion gross domestic product in 2009. The Dun & Bradstreet data represents total revenues, while gross domestic product measures firms’ value-added (revenues less purchases from other firms). The two numbers are defined and measured differently, but overlap. The Dun & Bradstreet dataset excludes a number of large employers’ sales data, so the 1.6 percent figure likely understates the reuse sector’s contribution to Minnesota’s economy even though the dataset uses a broader financial measure. In contrast, the REMI model estimates the reuse sector’s sales at $2.3 billion, based on 46,000 direct jobs. The difference with Dun & Bradstreet’s $4 billion cannot be reconciled because each source used different data and assumptions. While the Twin Cities Metro and Greater Minnesota have almost the same number of direct jobs, the Twin Cities’ estimated $1.4 billion value-added is 60 percent more than Greater Minnesota’s estimated $900 million. Taxes paid to government agencies
The REMI model estimates that the 46,000 reuse jobs generate an estimated $159 million in state business and personal income taxes, sales tax, excise tax and miscellaneous taxes.
21
22
Value of diverted used items and the avoided disposal costs
Minnesota’s three largest thrift-store operators rely on households and businesses to donate goods for resale. These goods might have been disposed through the solid waste stream, but were donated for charitable reasons. Arc Value Villages, Goodwill Stores and Salvation Army Thrift Stores generate $53 million in Minnesota sales annually and divert at least 11,000 tons of items from landfills.26 The stores mostly accept clothes, books, small electronics and other household items. Furniture is accepted upon manager approval or if not stained, broken or torn. Vehicles are also accepted. Two operation directors described their typical customer:
• “83 percent are female, average age is 49; educated; primarily Caucasian but growing diversity of shoppers; 50 percent of income levels are over $50,000.”
• “85 percent are female, ranging from 25 to 55 years old; persons who live within 10 miles of the store. Thrift stores were once shopped by welfare clients. Today it is those on welfare to the wealthy, incomes from $25,000 to $75,000.”
The directors noted that donated materials are sold through stores or recycled. One stated that, “Clothing is 60% of our business and [all of it] is sold in our stores or to third-world nations. For furniture and household items, about 50 percent is sold off in our stores and the other 50 percent is not fit for the sales floor, so the parts are sold in secondary markets and the rest goes into landfills.” Another said that two-thirds of donated items by weight are sold or recycled, with over half being recycled. At $200 per ton, 11,000 tons of diverted material avoids $2.2 million in gross disposal costs.27 In addition, stores often are able to sell a percentage of their excess materials to recycling markets. These avoided costs and additional revenue are offset by the cost to handle donated items and dispose of unsalable material. Number and dollar value of volunteer hours
Both paid employees and volunteers operate Arc Value Villages and Goodwill Stores, while the Salvation Army’s rehabilitation-program participants assist paid staff, with very little community volunteers. Paid employees are often part-time. Arc Value Villages and Goodwill Stores reported 154,000 annual volunteer hours, which equates to $1.1 million to $1.5 million depending on the value of a volunteer hour.28
26 Data collected from telephone calls, e-mail and Goodwill’s and Salvation Army’s most recent annual reports: http://www.thesalarmy.org/ab/2009NorthernDivAnnualReport.pdf and http://www.goodwilleasterseals.org/site/DocServer/2010_Annual_Report.pdf?docID=2462. 27 Gross cost per ton provided by the Minnesota Pollution Control Agency and includes collection and transportation costs and landfill fees. 28 The low estimate uses the minimum wage ($7.25) and the high estimate uses $10 per hour, which is the median wage for stock clerks and retail salespersons, per the Minnesota Department of Employment and Economic Development’s first quarter 2011 Occupation Employment Statistics. http://www.positivelyminnesota.com/apps/lmi/oes/. The hourly rates exclude fringe benefits.

Conclusions If broadly defined as used sales, repairs and rental services, Minnesota’s reuse sector directly employs almost 46,000 people and generates at least $4 billion in gross sales annually, or 1.8 percent of Minnesota employees and 1.6 percent of the state’s gross domestic product. For comparison, the tourism sector has 238,000 employees and $11 billion in sales. Automotive-related industries represent 75 percent of the reuse sector’s revenues and 60 percent of employees. Vehicles are a significant household purchase and remain in service for eleven years, on average. Car owners have an incentive to maintain their vehicles to avoid breakdowns and preserve resale values. Other large reuse industries are used merchandise sales and durable-good repair, such as commercial machinery, electronic and precision equipment, and household appliances. Reuse industries’ average weekly wages are typically less than Minnesota’s weekly average for all employer-paid wages. The lower average likely reflects the part-time work and lower skills required by many reuse industries. Notable exceptions are the electronic, computer, precision equipment, commercial machinery and appliance repair industries, where the average weekly wages slightly exceed the state average. When the state is examined by centroid, which are large multi-county areas, the reuse jobs and sales are almost proportional to each centroid’s population. At the county level, reuse activity has little relationship to population. However, counties with a high number of reuse jobs also have high total employees per capita, suggesting that a high reuse ratio is not a unique characteristic but related to the county’s overall employment. The economic impacts of reuse activities are mostly local. Businesses benefit through greater money retention and recirculation, and consumers have more choices and greater purchasing power. At the macro-economic level, the reuse sector’s impact is no different than other industries’ impact. In one sense, reuse activity is similar to economic development strategies that move the economic activity’s location but does not increase it. High value-adding repair activities requiring skilled employees have a greater community impact than low-value activities, such as used goods sales and rentals. Consumers’ current finances, tastes, and basic needs affect demand for used items and repair and rental services. During the latest economic downturn, used thrift stores sales and first-time customers increased noticeably. Online trading sites allow people to buy and sell secondhand items more easily than traditional classified ads, perhaps increasing the amount of used goods exchanged.
23

Appendices A: Detailed Methodology 25 B: List of Reuse Industries 33 C: Online-Exchange Research 38 D: Job Projections and Economic Activity 40
24
A: Detailed Methodology Data source
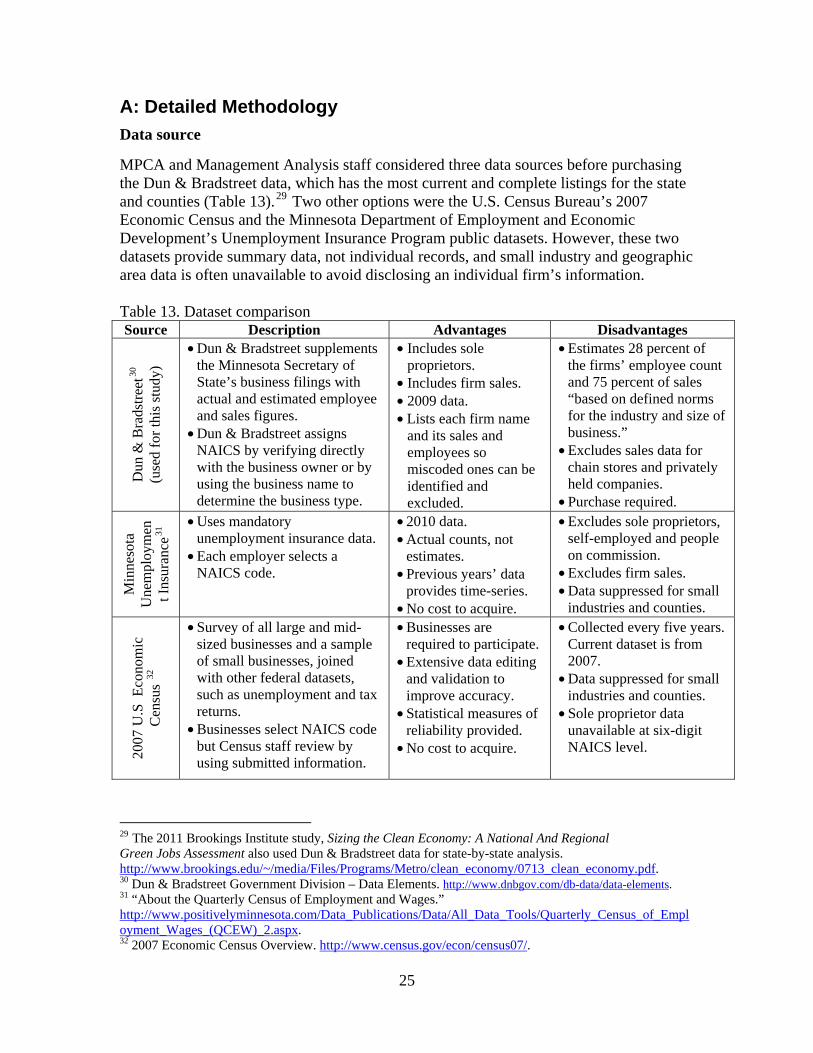
MPCA and Management Analysis staff considered three data sources before purchasing the Dun & Bradstreet data, which has the most current and complete listings for the state and counties (Table 13).29 Two other options were the U.S. Census Bureau’s 2007 Economic Census and the Minnesota Department of Employment and Economic Development’s Unemployment Insurance Program public datasets. However, these two datasets provide summary data, not individual records, and small industry and geographic area data is often unavailable to avoid disclosing an individual firm’s information. Table 13. Dataset comparison Source Description Advantages Disadvantages
Dun
& B
rads
treet
30
(use
d fo
r thi
s stu
dy)
• Dun & Bradstreet supplements the Minnesota Secretary of State’s business filings with actual and estimated employee and sales figures.
• Dun & Bradstreet assigns NAICS by verifying directly with the business owner or by using the business name to determine the business type.
• Includes sole proprietors.
• Includes firm sales. • 2009 data. • Lists each firm name
and its sales and employees so miscoded ones can be identified and excluded.
• Estimates 28 percent of the firms’ employee count and 75 percent of sales “based on defined norms for the industry and size of business.”
• Excludes sales data for chain stores and privately held companies.
• Purchase required.
Min
neso
ta
Une
mpl
oym
ent I
nsur
ance
31 • Uses mandatory
unemployment insurance data. • Each employer selects a
NAICS code.
• 2010 data. • Actual counts, not
estimates. • Previous years’ data
provides time-series. • No cost to acquire.
• Excludes sole proprietors, self-employed and people on commission.
• Excludes firm sales. • Data suppressed for small
industries and counties.
2007
U.S
Eco
nom
ic
Cen
sus
32
• Survey of all large and mid-sized businesses and a sample of small businesses, joined with other federal datasets, such as unemployment and tax returns.
• Businesses select NAICS code but Census staff review by using submitted information.
• Businesses are required to participate.
• Extensive data editing and validation to improve accuracy.
• Statistical measures of reliability provided.
• No cost to acquire.
• Collected every five years. Current dataset is from 2007.
• Data suppressed for small industries and counties.
• Sole proprietor data unavailable at six-digit NAICS level.
29 The 2011 Brookings Institute study, Sizing the Clean Economy: A National And Regional Green Jobs Assessment also used Dun & Bradstreet data for state-by-state analysis. http://www.brookings.edu/~/media/Files/Programs/Metro/clean_economy/0713_clean_economy.pdf. 30 Dun & Bradstreet Government Division – Data Elements. http://www.dnbgov.com/db-data/data-elements. 31 “About the Quarterly Census of Employment and Wages.” http://www.positivelyminnesota.com/Data_Publications/Data/All_Data_Tools/Quarterly_Census_of_Employment_Wages_(QCEW)_2.aspx. 32 2007 Economic Census Overview. http://www.census.gov/econ/census07/.
25
The three datasets also differ because:
• The data-collecting agency assigns the NAICS code or a business self-selects one. As a result, the same establishment may be coded differently in each dataset, and one dataset’s total establishments and employees will not match another’s (Table 14).
• The 2007 Economic Census data predates the latest economic recession and the Unemployment Insurance Program excludes sole proprietors and sales data.
• Dun & Bradstreet counts full-time employees only while the other two datasets count full- and part-time employees.
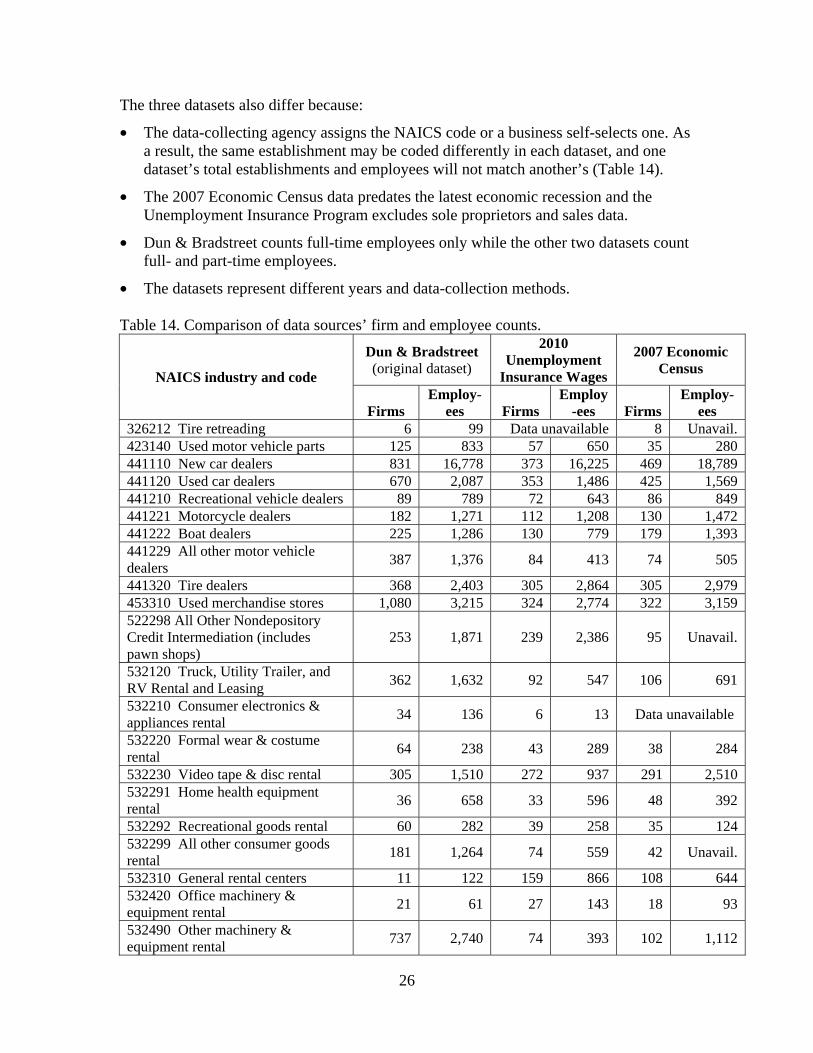
• The datasets represent different years and data-collection methods. Table 14. Comparison of data sources’ firm and employee counts.
NAICS industry and code
Dun & Bradstreet (original dataset)
2010 Unemployment
Insurance Wages
2007 Economic Census
Firms Employ-
ees Firms Employ
-ees Firms Employ-
ees 326212 Tire retreading 6 99 Data unavailable 8 Unavail. 423140 Used motor vehicle parts 125 833 57 650 35 280 441110 New car dealers 831 16,778 373 16,225 469 18,789 441120 Used car dealers 670 2,087 353 1,486 425 1,569 441210 Recreational vehicle dealers 89 789 72 643 86 849 441221 Motorcycle dealers 182 1,271 112 1,208 130 1,472 441222 Boat dealers 225 1,286 130 779 179 1,393 441229 All other motor vehicle dealers 387 1,376 84 413 74 505
441320 Tire dealers 368 2,403 305 2,864 305 2,979 453310 Used merchandise stores 1,080 3,215 324 2,774 322 3,159 522298 All Other Nondepository Credit Intermediation (includes pawn shops)
253 1,871 239 2,386 95 Unavail.
532120 Truck, Utility Trailer, and RV Rental and Leasing 362 1,632 92 547 106 691
532210 Consumer electronics & appliances rental 34 136 6 13 Data unavailable
532220 Formal wear & costume rental 64 238 43 289 38 284
532230 Video tape & disc rental 305 1,510 272 937 291 2,510532291 Home health equipment rental 36 658 33 596 48 392
532292 Recreational goods rental 60 282 39 258 35 124532299 All other consumer goods rental 181 1,264 74 559 42 Unavail.
532310 General rental centers 11 122 159 866 108 644532420 Office machinery & equipment rental 21 61 27 143 18 93
532490 Other machinery & equipment rental 737 2,740 74 393 102 1,112
26
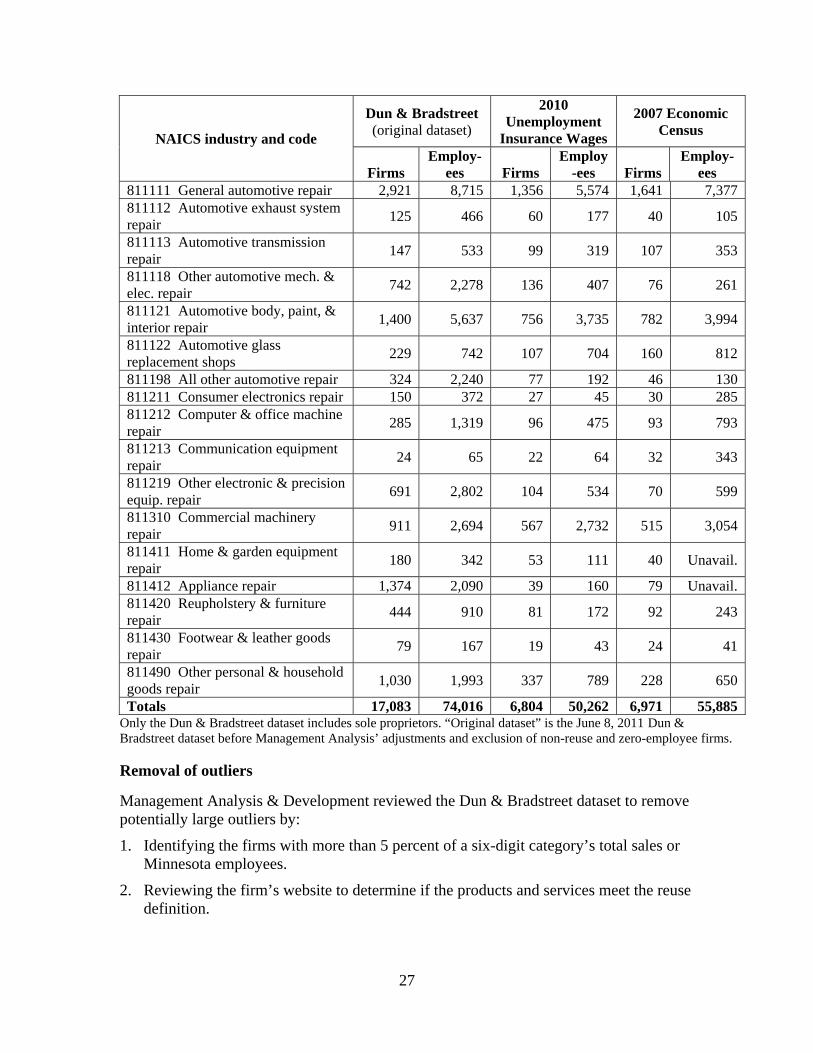
27
NAICS industry and code
Dun & Bradstreet (original dataset)
2010 Unemployment
Insurance Wages
2007 Economic Census
Firms Employ-
ees Firms Employ
-ees Firms Employ-
ees 811111 General automotive repair 2,921 8,715 1,356 5,574 1,641 7,377811112 Automotive exhaust system repair 125 466 60 177 40 105
811113 Automotive transmission repair 147 533 99 319 107 353
811118 Other automotive mech. & elec. repair 742 2,278 136 407 76 261
811121 Automotive body, paint, & interior repair 1,400 5,637 756 3,735 782 3,994
811122 Automotive glass replacement shops 229 742 107 704 160 812
811198 All other automotive repair 324 2,240 77 192 46 130811211 Consumer electronics repair 150 372 27 45 30 285811212 Computer & office machine repair 285 1,319 96 475 93 793
811213 Communication equipment repair 24 65 22 64 32 343
811219 Other electronic & precision equip. repair 691 2,802 104 534 70 599
811310 Commercial machinery repair 911 2,694 567 2,732 515 3,054
811411 Home & garden equipment repair 180 342 53 111 40 Unavail.
811412 Appliance repair 1,374 2,090 39 160 79 Unavail. 811420 Reupholstery & furniture repair 444 910 81 172 92 243
811430 Footwear & leather goods repair 79 167 19 43 24 41
811490 Other personal & household goods repair 1,030 1,993 337 789 228 650
Totals 17,083 74,016 6,804 50,262 6,971 55,885Only the Dun & Bradstreet dataset includes sole proprietors. “Original dataset” is the June 8, 2011 Dun & Bradstreet dataset before Management Analysis’ adjustments and exclusion of non-reuse and zero-employee firms. Removal of outliers
Management Analysis & Development reviewed the Dun & Bradstreet dataset to remove potentially large outliers by:
1. Identifying the firms with more than 5 percent of a six-digit category’s total sales or Minnesota employees.
2. Reviewing the firm’s website to determine if the products and services meet the reuse definition.

3. Excluding any firms not fitting the six-digit category due to NAICS miscoding or the MPCA’s reuse definition.33
Firms were also excluded based on company names. For example, pawn shops are classified with a number of financial entities in All Other Nondepository Credit Intermediation (522298). Firms without “pawn” in its name were excluded. Table 15 describes the 1,248 excluded firms. Another 475 firms without any Minnesota employees were excluded for a total of 1,723 excluded firms (Table 16). Table 15. Number and description of excluded firms
Industry Firms Reason 423140 Used motor vehicle parts 1 A municipal city garage. 441120 Used car dealers 1 A large dealer-to-dealer auto auction firm. 441210 Recreational vehicle dealers 2 One leasing company and a fabrication firm. 441222 Boat dealers 1 A canvas boat-cover fabricator. 441229 All other motor vehicle dealers 2 A manufacturer and an aviation firm.
453310 Used merchandise stores 2 A medical center and a college bookstore. 522298 All Other Nondepository Credit Intermediation 163 Companies without “pawn” in name.
532120 Recreational vehicle rental 338 Firms providing self-moving trailer rental, truck leasing, self-storage and mobile home site rental.
532210 Consumer electronics & appliances rental 5
The top four businesses are a billiards parlor, an electronics assembly equipment manufacturer and two firms whose websites could not be found. The fifth exclusion is a financial services firm.
532230 Video tape & disc rental 1 A miscoded gas station.
532291 Home health equipment rental 5
A medical equipment management firm listed twice, a regional oxygen provider, a medical center, and a highly specialized, mobile medical-equipment company.
532299 All other consumer goods rental 7
A national integrator of audio/video systems, an auto leasing firm, a pizza/video rental parlor, a vending machine rental company, a scaffolding firm, a convention booth designer, and a fabricator.
33 The purchased dataset only had 38 industries. A reuse firm without one of the 38 codes would never be part of the dataset and could not be identified for inclusion.
28
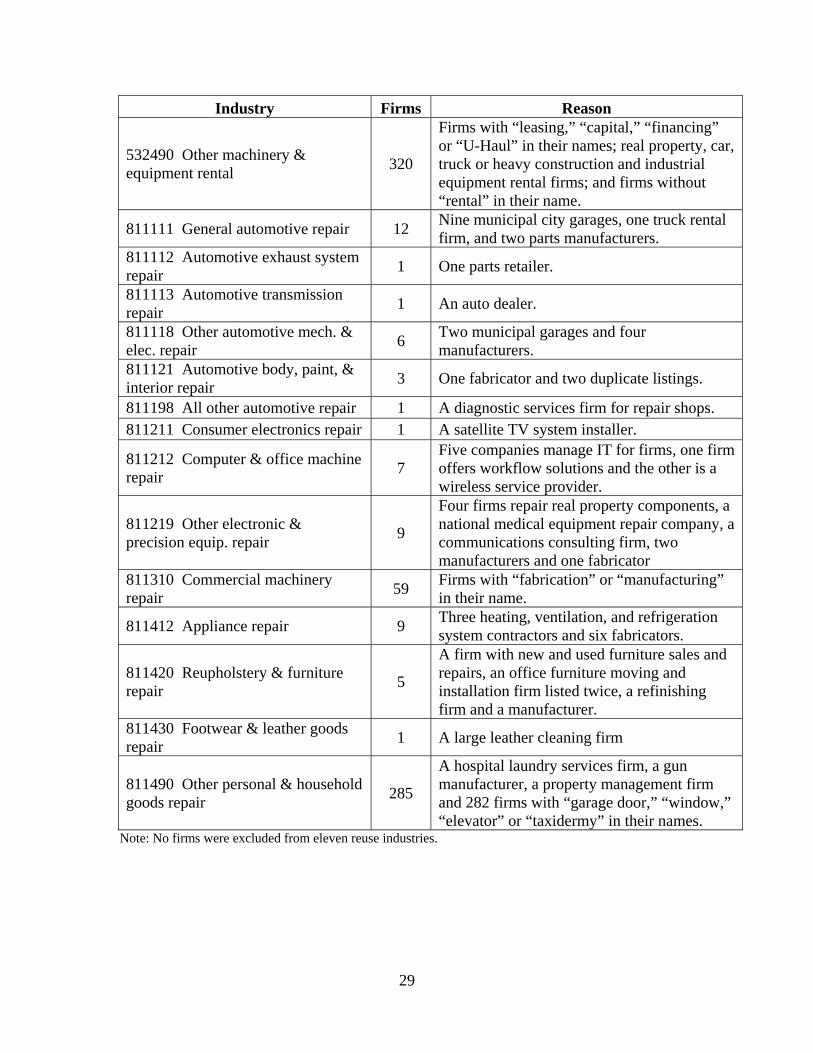
29
Industry Firms Reason
532490 Other machinery & equipment rental 320
Firms with “leasing,” “capital,” “financing” or “U-Haul” in their names; real property, car, truck or heavy construction and industrial equipment rental firms; and firms without “rental” in their name.
811111 General automotive repair 12 Nine municipal city garages, one truck rental firm, and two parts manufacturers.
811112 Automotive exhaust system repair 1 One parts retailer.
811113 Automotive transmission repair 1 An auto dealer.
811118 Other automotive mech. & elec. repair 6 Two municipal garages and four
manufacturers. 811121 Automotive body, paint, & interior repair 3 One fabricator and two duplicate listings.
811198 All other automotive repair 1 A diagnostic services firm for repair shops. 811211 Consumer electronics repair 1 A satellite TV system installer.
811212 Computer & office machine repair 7
Five companies manage IT for firms, one firm offers workflow solutions and the other is a wireless service provider.
811219 Other electronic & precision equip. repair 9
Four firms repair real property components, a national medical equipment repair company, a communications consulting firm, two manufacturers and one fabricator
811310 Commercial machinery repair 59 Firms with “fabrication” or “manufacturing”
in their name.
811412 Appliance repair 9 Three heating, ventilation, and refrigeration system contractors and six fabricators.
811420 Reupholstery & furniture repair 5
A firm with new and used furniture sales and repairs, an office furniture moving and installation firm listed twice, a refinishing firm and a manufacturer.
811430 Footwear & leather goods repair 1 A large leather cleaning firm
811490 Other personal & household goods repair 285
A hospital laundry services firm, a gun manufacturer, a property management firm and 282 firms with “garage door,” “window,” “elevator” or “taxidermy” in their names.
Note: No firms were excluded from eleven reuse industries.
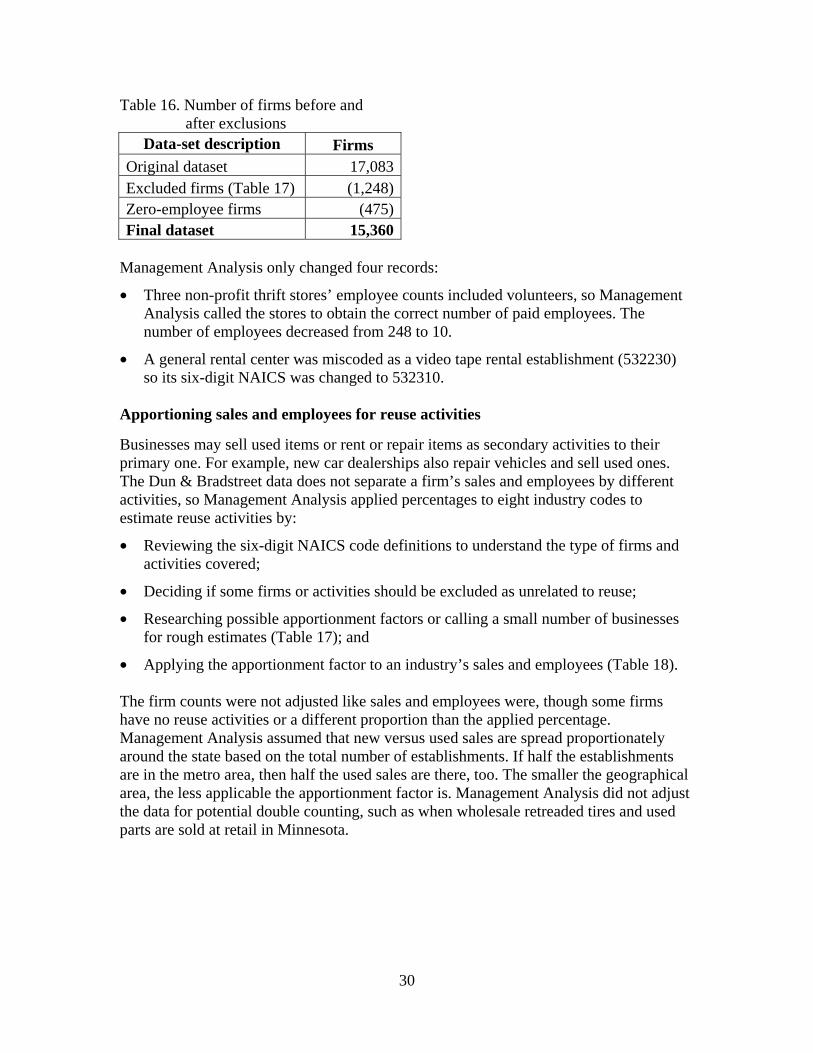
Table 16. Number of firms before and after exclusions
Data-set description Firms Original dataset 17,083Excluded firms (Table 17) (1,248)Zero-employee firms (475)Final dataset 15,360
Management Analysis only changed four records:
• Three non-profit thrift stores’ employee counts included volunteers, so Management Analysis called the stores to obtain the correct number of paid employees. The number of employees decreased from 248 to 10.
• A general rental center was miscoded as a video tape rental establishment (532230) so its six-digit NAICS was changed to 532310.
Apportioning sales and employees for reuse activities
Businesses may sell used items or rent or repair items as secondary activities to their primary one. For example, new car dealerships also repair vehicles and sell used ones. The Dun & Bradstreet data does not separate a firm’s sales and employees by different activities, so Management Analysis applied percentages to eight industry codes to estimate reuse activities by:
• Reviewing the six-digit NAICS code definitions to understand the type of firms and activities covered;
• Deciding if some firms or activities should be excluded as unrelated to reuse;
• Researching possible apportionment factors or calling a small number of businesses for rough estimates (Table 17); and
• Applying the apportionment factor to an industry’s sales and employees (Table 18). The firm counts were not adjusted like sales and employees were, though some firms have no reuse activities or a different proportion than the applied percentage. Management Analysis assumed that new versus used sales are spread proportionately around the state based on the total number of establishments. If half the establishments are in the metro area, then half the used sales are there, too. The smaller the geographical area, the less applicable the apportionment factor is. Management Analysis did not adjust the data for potential double counting, such as when wholesale retreaded tires and used parts are sold at retail in Minnesota.
30

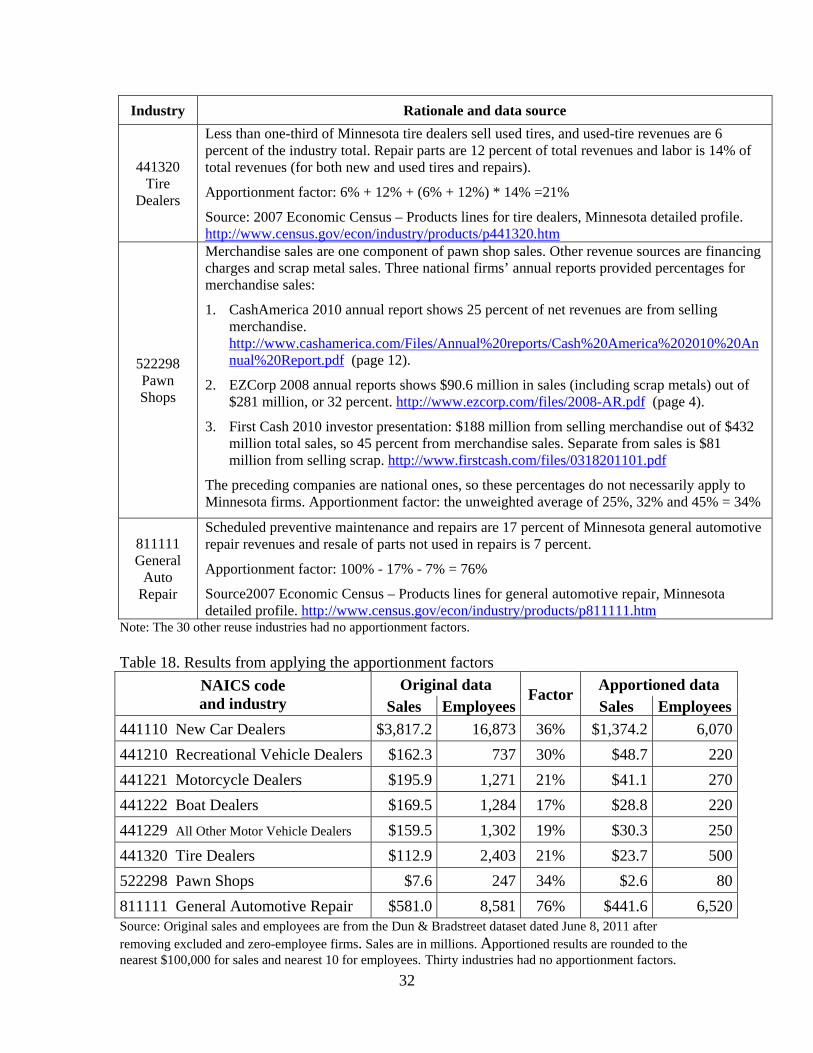
Table 17. Sales and employee apportionment factors for select industries Industry Rationale and data source
441110 New Car Dealers
Most Minnesota auto dealers sell used vehicles, accounting for 29 percent of total revenues. Repair parts and labor are seven percent of total revenues.
Apportionment factor: 36%
Source: 2007 Economic Census – Products lines for new car dealers, Minnesota detailed profile. http://www.census.gov/econ/industry/products/p441110.htm
441210 Recreat-
ional Vehicle Dealers
Most Minnesota RV dealers sell used RVs, accounting for 23 percent of total revenues. Repair parts and labor are seven percent of total revenues, but only one-half of dealers provide this service.
Apportionment factor: 30%
2007 Economic Census – Products lines for RV dealers, Minnesota detailed profile. http://www.census.gov/econ/industry/products/p441210.htm
441221 Motor-cycle
Dealers
Three-quarters of Minnesota motorcycle dealers sell used motorcycles, accounting for 10 percent of total revenues. Repair parts and labor are 11 percent of total revenues.
Apportionment factor: 21%
Source: 2007 Economic Census – Products lines for motorcycle dealers, Minnesota detailed profile. http://www.census.gov/econ/industry/products/p441221.htm
441222 Boat
Dealers
Three-quarters of Minnesota boat dealers sell used boats, accounting for 10 percent of total revenues. Repair parts and labor are 7 percent of total revenues.
Apportionment factor: 17%
Source: 2007 Economic Census – Products lines for boat dealers, Minnesota detailed profile. http://www.census.gov/econ/industry/products/p441222.htm
441229 All Other
Motor Vehicle Dealers
In Minnesota, 43 percent of these dealers sell new and used snowmobiles, ATVs and other sport vehicles (2007 Economic Census). About one-quarter of snowmobiles, jet skis and ATVs sales are used, per five Minnesota businesses contacted by Management Analysis. Total used sales are 43% x 25% = 11%.
Thirty-two percent of revenues are sales of new and used utility trailers, including horse and livestock trailers (2007 Economic Census). About 3 percent of utility trailer sales are used, per four Minnesota businesses contacted by Management Analysis. Total used sales are 32% x 3% = 1%.
Repair parts and labor are 7 percent of total revenues (2007 Economic Census).
Total apportionment factor: (11% + 1% +7%) =19%
Source: 2007 Economic Census – Products lines for all other motor vehicle dealers, Minnesota detailed profile.34 http://www.census.gov/econ/industry/products/p441229.htm
34 The remaining twenty-five percent of revenues are for other types of equipment and merchandise, and are not counted as part of the reuse sector.
31
32
Industry Rationale and data source
441320 Tire
Dealers
Less than one-third of Minnesota tire dealers sell used tires, and used-tire revenues are 6 percent of the industry total. Repair parts are 12 percent of total revenues and labor is 14% of total revenues (for both new and used tires and repairs).
Apportionment factor: 6% + 12% + (6% + 12%) * 14% =21%
Source: 2007 Economic Census – Products lines for tire dealers, Minnesota detailed profile. http://www.census.gov/econ/industry/products/p441320.htm
522298 Pawn Shops
Merchandise sales are one component of pawn shop sales. Other revenue sources are financing charges and scrap metal sales. Three national firms’ annual reports provided percentages for merchandise sales:
1. CashAmerica 2010 annual report shows 25 percent of net revenues are from selling merchandise. http://www.cashamerica.com/Files/Annual%20reports/Cash%20America%202010%20Annual%20Report.pdf (page 12).
2. EZCorp 2008 annual reports shows $90.6 million in sales (including scrap metals) out of $281 million, or 32 percent. http://www.ezcorp.com/files/2008-AR.pdf (page 4).
3. First Cash 2010 investor presentation: $188 million from selling merchandise out of $432 million total sales, so 45 percent from merchandise sales. Separate from sales is $81 million from selling scrap. http://www.firstcash.com/files/0318201101.pdf
The preceding companies are national ones, so these percentages do not necessarily apply to Minnesota firms. Apportionment factor: the unweighted average of 25%, 32% and 45% = 34%
811111 General
Auto Repair
Scheduled preventive maintenance and repairs are 17 percent of Minnesota general automotive repair revenues and resale of parts not used in repairs is 7 percent.
Apportionment factor: 100% - 17% - 7% = 76%
Source2007 Economic Census – Products lines for general automotive repair, Minnesota detailed profile. http://www.census.gov/econ/industry/products/p811111.htm
Note: The 30 other reuse industries had no apportionment factors. Table 18. Results from applying the apportionment factors
NAICS code and industry
Original data Factor Apportioned data Sales Employees Sales Employees
441110 New Car Dealers $3,817.2 16,873 36% $1,374.2 6,070441210 Recreational Vehicle Dealers $162.3 737 30% $48.7 220441221 Motorcycle Dealers $195.9 1,271 21% $41.1 270441222 Boat Dealers $169.5 1,284 17% $28.8 220441229 All Other Motor Vehicle Dealers $159.5 1,302 19% $30.3 250441320 Tire Dealers $112.9 2,403 21% $23.7 500522298 Pawn Shops $7.6 247 34% $2.6 80811111 General Automotive Repair $581.0 8,581 76% $441.6 6,520Source: Original sales and employees are from the Dun & Bradstreet dataset dated June 8, 2011 after removing excluded and zero-employee firms. Sales are in millions. Apportioned results are rounded to the nearest $100,000 for sales and nearest 10 for employees. Thirty industries had no apportionment factors.

B: List of Reuse Industries For the purpose of this study, the reuse sector encompasses three activities: used product sales, rental, and repair. This definition is broader than a National Recycling Coalition study’s, which excluded repair services and explained that reuse businesses “recover products or components that were disposal-bound and sell them back into the stream of commerce [emphasis added].” 35 However, other organizations consider repair a part of reuse:
• “Reuse encompasses a range of activities where whole products (or whole parts of products) are used again in one piece. This includes…Repair – rectifying a fault.” 36
• “Product reuse - retreading tyres, recovery of demolition materials, reuse of plastic bags, second hand clothing, reconditioning and repair of furniture and appliances.”37
• “[The Zero Waste Hierarchy’s second priority is] repair and reuse, extending the service life of materials and products.”38
This study identified reuse industries using the North American Industry Classification System (NAICS), which classifies business establishments for federal statistical purposes. A government agency assigns a code or a business self selects one based on its primary revenue-generating activity. The six-digit code is the most detailed level and the four-digit code combines similar six-digit ones. Selected Industries
Thirty-eight NAICS industries meet the MPCA’s reuse definition (Table 19). Management Analysis assigned each industry to a reuse activity based on the industry description and primary reuse activity. For example, tire dealers’ primary reuse activity is repair because used tires sales are a smaller proportion of the business.
33
35 National Recycling Coalition, “Frequently Asked Questions about the U.S. Recycling Economic Information Study,” October 2001, page 1. http://www.epa.gov/osw/conserve/rrr/rmd/rei-rw/pdf/faq.pdf. 36 The Centre for Remanufacturing & Reuse. http://www.remanufacturing.org.uk/reuse-repair-recycle.lasso. 37 The Municipal Waste Advisory Council of the Western Australian Local Government Association. http://www.wastenet.net.au/information/hierarchy/reuse. 38 Sierra Club, Zero Waste: Cradle-to-Cradle Principles for the 21st Century, February 23, 2008, page 1. http://www.sierraclub.org/policy/conservation/ZeroWasteExtendedProducerResponsibilityPolicy.pdf

Table 19. Description of six-digit NAICS codes and industry NAICS code and
industry Industry description Reuse activity
326212 Tire retreading Retreading or rebuilding tires. Used
sales
423140 Used motor vehicle parts
Merchant wholesale distribution of used motor vehicle parts (except used tires and tubes) and establishments primarily engaged in dismantling motor vehicles for the purpose of selling the parts.
Used sales
441110 New car dealers
Retailing new automobiles and light trucks, such as sport utility vehicles, and passenger and cargo vans, or retailing these new vehicles in combination with activities, such as repair services, retailing used cars, and selling replacement parts and accessories.
Used sales
441120 Used car dealers
Retailing used automobiles and light trucks, such as sport utility vehicles, and passenger and cargo vans.
Used sales
441210 Recreational vehicle dealers
Retailing new and/or used recreational vehicles commonly referred to as RVs or retailing these new vehicles in combination with activities, such as repair services and selling replacement parts and accessories.
Used sales
441221 Motorcycle dealers
Retailing new and/or used motorcycles, motor scooters, motorbikes, mopeds, off-road all-terrain vehicles, and personal watercraft, or retailing these new vehicles in combination with repair services and selling replacement parts and accessories.
Used sales
441222 Boat dealers
(1) Retailing new and/or used boats or retailing new boats in combination with activities, such as repair services and selling replacement parts and accessories, and/or (2) retailing new and/or used outboard motors, boat trailers, marine supplies, parts, and accessories.
Used sales
441229 All other motor vehicle dealers
Retailing new and/or used utility trailers and vehicles (except automobiles, light trucks, recreational vehicles, motorcycles, boats, motor scooters, motorbikes, off-road all-terrain vehicles, and personal watercraft) or retailing these new vehicles in combination with activities, such as Repair services and selling replacement parts and accessories.
Used sales
441320 Tire dealers
Retailing new and/or used tires and tubes or retailing new tires in combination with automotive repair services. Repair
453310 Used merchandise stores
Retailing used merchandise, antiques, and secondhand goods (except motor vehicles, such as automobiles, RVs, motorcycles, and boats; motor vehicle parts; tires; and mobile homes).
Used sales
34
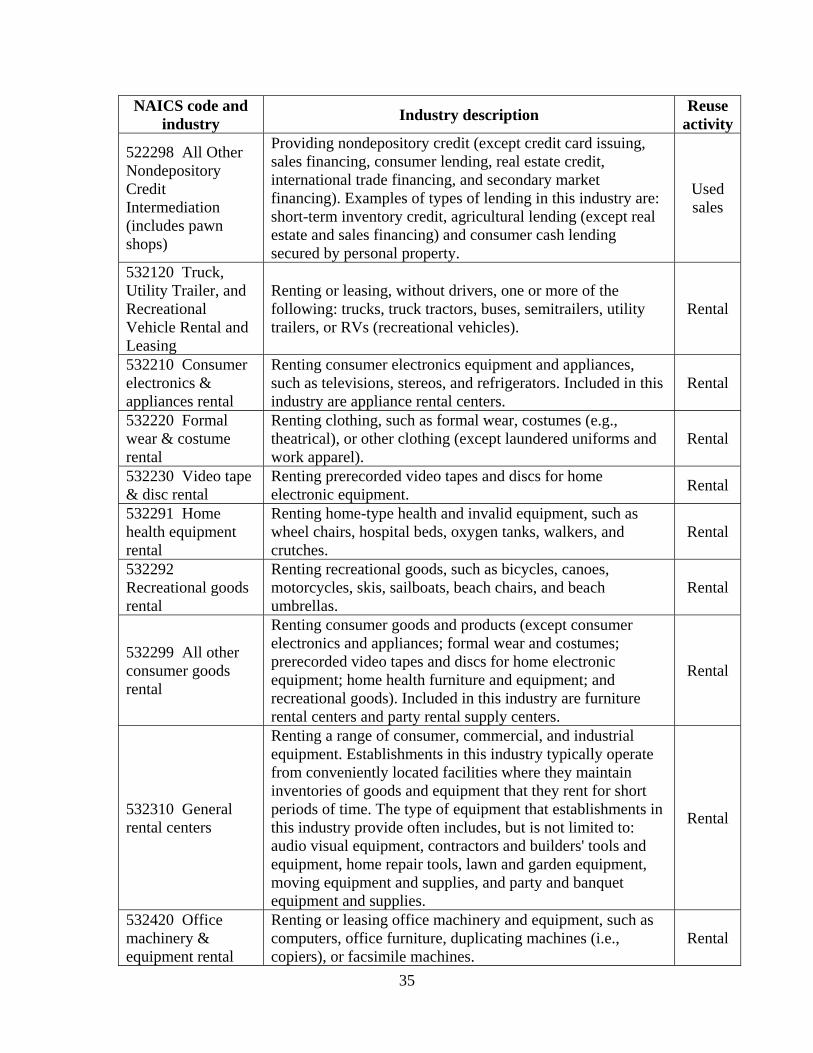
35
NAICS code and industry Industry description Reuse
activity
522298 All Other Nondepository Credit Intermediation (includes pawn shops)
Providing nondepository credit (except credit card issuing, sales financing, consumer lending, real estate credit, international trade financing, and secondary market financing). Examples of types of lending in this industry are: short-term inventory credit, agricultural lending (except real estate and sales financing) and consumer cash lending secured by personal property.
Used sales
532120 Truck, Utility Trailer, and Recreational Vehicle Rental and Leasing
Renting or leasing, without drivers, one or more of the following: trucks, truck tractors, buses, semitrailers, utility trailers, or RVs (recreational vehicles).
Rental
532210 Consumer electronics & appliances rental
Renting consumer electronics equipment and appliances, such as televisions, stereos, and refrigerators. Included in this industry are appliance rental centers.
Rental
532220 Formal wear & costume rental
Renting clothing, such as formal wear, costumes (e.g., theatrical), or other clothing (except laundered uniforms and work apparel).
Rental
532230 Video tape & disc rental
Renting prerecorded video tapes and discs for home electronic equipment. Rental
532291 Home health equipment rental
Renting home-type health and invalid equipment, such as wheel chairs, hospital beds, oxygen tanks, walkers, and crutches.
Rental
532292 Recreational goods rental
Renting recreational goods, such as bicycles, canoes, motorcycles, skis, sailboats, beach chairs, and beach umbrellas.
Rental
532299 All other consumer goods rental
Renting consumer goods and products (except consumer electronics and appliances; formal wear and costumes; prerecorded video tapes and discs for home electronic equipment; home health furniture and equipment; and recreational goods). Included in this industry are furniture rental centers and party rental supply centers.
Rental
532310 General rental centers
Renting a range of consumer, commercial, and industrial equipment. Establishments in this industry typically operate from conveniently located facilities where they maintain inventories of goods and equipment that they rent for short periods of time. The type of equipment that establishments in this industry provide often includes, but is not limited to: audio visual equipment, contractors and builders' tools and equipment, home repair tools, lawn and garden equipment, moving equipment and supplies, and party and banquet equipment and supplies.
Rental
532420 Office machinery & equipment rental
Renting or leasing office machinery and equipment, such as computers, office furniture, duplicating machines (i.e., copiers), or facsimile machines.
Rental

36
NAICS code and industry Industry description Reuse
activity
532490 Other machinery & equipment rental
Renting or leasing nonconsumer-type machinery and equipment (except heavy construction, transportation, mining, and forestry machinery and equipment without operators; and office machinery and equipment). Establishments in this industry rent or lease products, such as manufacturing equipment; metalworking, telecommunications, motion picture, or theatrical machinery and equipment; institutional (i.e., public building) furniture, such as furniture for schools, theaters, or buildings; or agricultural equipment without operators.
Rental
811111 General automotive repair
(1) A wide range of mechanical and electrical repair and maintenance services for automotive vehicles, such as passenger cars, trucks, and vans, and all trailers or (2) engine repair and replacement.
Repair
811112 Automotive exhaust system repair
Replacing or repairing exhaust systems of automotive vehicles, such as passenger cars, trucks, and vans. Repair
811113 Automotive transmission repair
Replacing or repairing transmissions of automotive vehicles, such as passenger cars, trucks, and vans. Repair
811118 Other automotive mech. & elec. repair
Specialized mechanical or electrical repair and maintenance services (except engine repair and replacement, exhaust systems repair, and transmission repair) for automotive vehicles, such as passenger cars, trucks, and vans, and all trailers.
Repair
811121 Automotive body, paint, & interior repair
Repairing or customizing automotive vehicles, such as passenger cars, trucks, and vans, and all trailer bodies and interiors; and/or painting automotive vehicles and trailer bodies.
Repair
811122 Automotive glass replacement shops
Replacing, repairing, and/or tinting automotive vehicle, such as passenger car, truck, and van, glass. Repair
811198 All other automotive repair
Automotive repair and maintenance services (except mechanical and electrical repair and maintenance; body, paint, interior, and glass repair; motor oil change and lubrication; and car washing) for automotive vehicles, such as passenger cars, trucks, and vans, and all trailers.
Repair
811211 Consumer electronics repair
Repairing and maintaining consumer electronics, such as televisions, stereos, speakers, video recorders, CD players, radios, and cameras, without retailing new consumer electronics.
Repair
811212 Computer & office machine repair
Repairing and maintaining computers and office machines without retailing new computers and office machines, such as photocopying machines; computer terminals, storage devices, and printers; and CD-ROM drives.
Repair
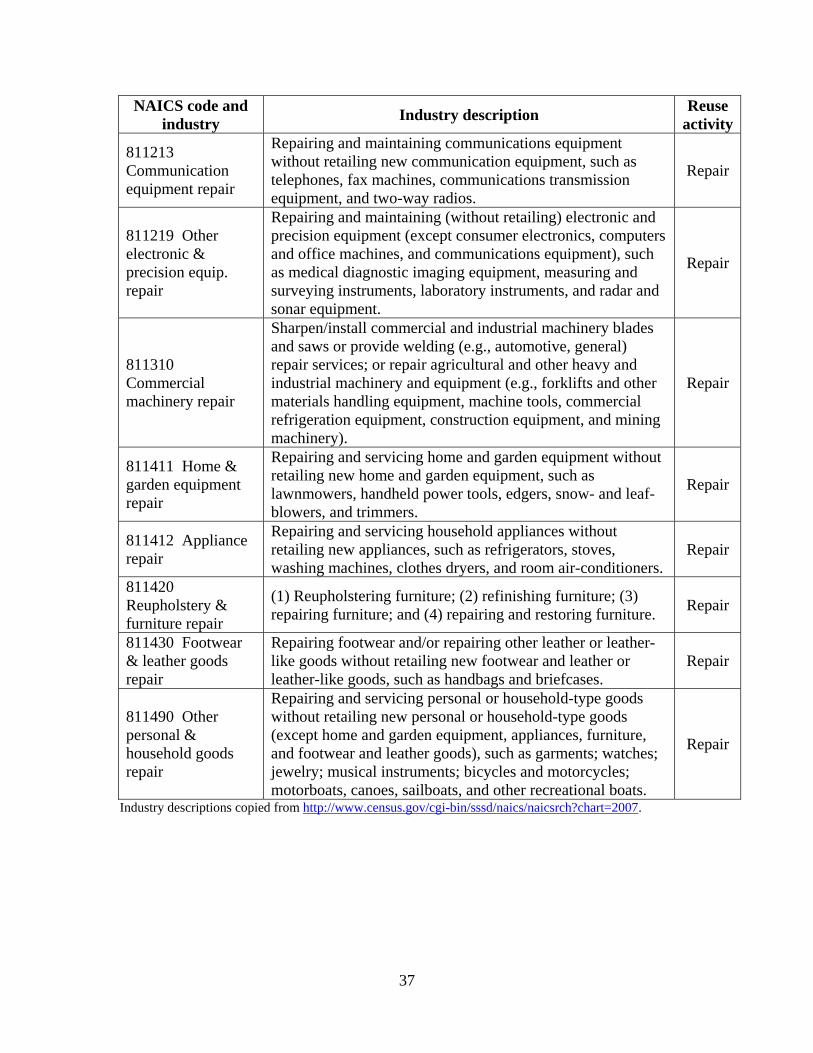
37
NAICS code and industry Industry description Reuse
activity
811213 Communication equipment repair
Repairing and maintaining communications equipment without retailing new communication equipment, such as telephones, fax machines, communications transmission equipment, and two-way radios.
Repair
811219 Other electronic & precision equip. repair
Repairing and maintaining (without retailing) electronic and precision equipment (except consumer electronics, computers and office machines, and communications equipment), such as medical diagnostic imaging equipment, measuring and surveying instruments, laboratory instruments, and radar and sonar equipment.
Repair
811310 Commercial machinery repair
Sharpen/install commercial and industrial machinery blades and saws or provide welding (e.g., automotive, general) repair services; or repair agricultural and other heavy and industrial machinery and equipment (e.g., forklifts and other materials handling equipment, machine tools, commercial refrigeration equipment, construction equipment, and mining machinery).
Repair
811411 Home & garden equipment repair
Repairing and servicing home and garden equipment without retailing new home and garden equipment, such as lawnmowers, handheld power tools, edgers, snow- and leaf-blowers, and trimmers.
Repair
811412 Appliance repair
Repairing and servicing household appliances without retailing new appliances, such as refrigerators, stoves, washing machines, clothes dryers, and room air-conditioners.
Repair
811420 Reupholstery & furniture repair
(1) Reupholstering furniture; (2) refinishing furniture; (3) repairing furniture; and (4) repairing and restoring furniture. Repair
811430 Footwear & leather goods repair
Repairing footwear and/or repairing other leather or leather-like goods without retailing new footwear and leather or leather-like goods, such as handbags and briefcases.
Repair
811490 Other personal & household goods repair
Repairing and servicing personal or household-type goods without retailing new personal or household-type goods (except home and garden equipment, appliances, furniture, and footwear and leather goods), such as garments; watches; jewelry; musical instruments; bicycles and motorcycles; motorboats, canoes, sailboats, and other recreational boats.
Repair
Industry descriptions copied from http://www.census.gov/cgi-bin/sssd/naics/naicsrch?chart=2007.
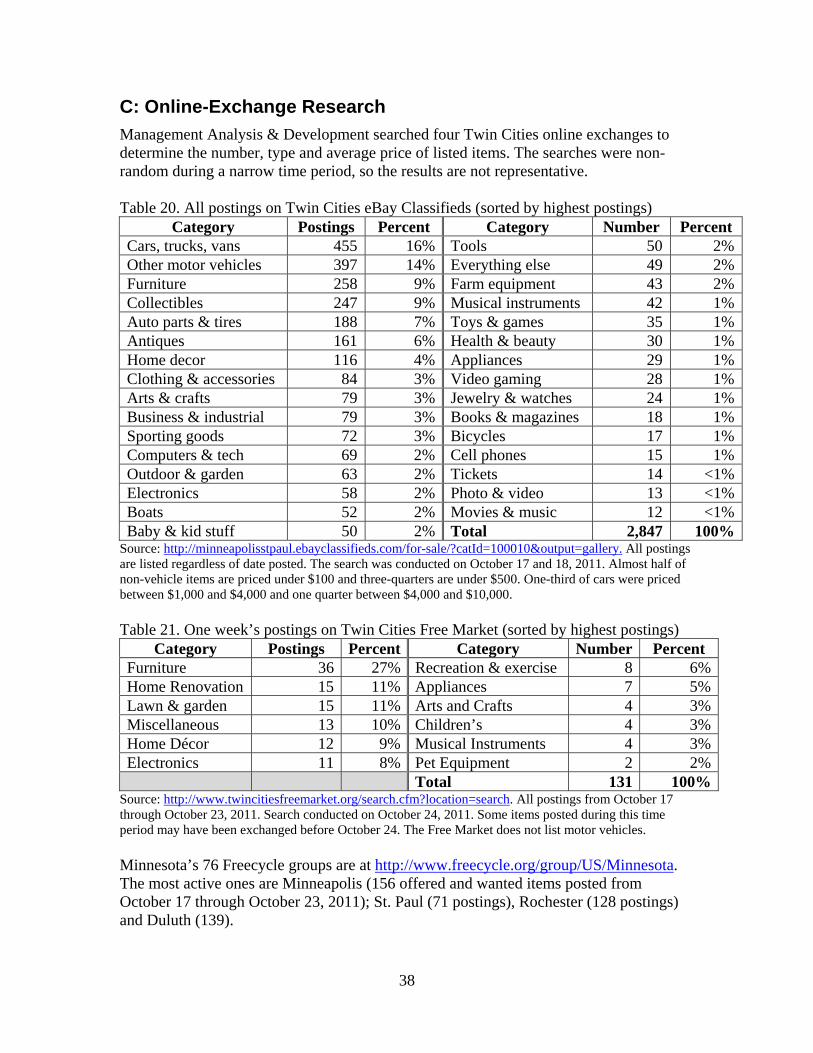
C: Online-Exchange Research Management Analysis & Development searched four Twin Cities online exchanges to determine the number, type and average price of listed items. The searches were non-random during a narrow time period, so the results are not representative. Table 20. All postings on Twin Cities eBay Classifieds (sorted by highest postings)
Category Postings Percent Category Number Percent Cars, trucks, vans 455 16% Tools 50 2%Other motor vehicles 397 14% Everything else 49 2%Furniture 258 9% Farm equipment 43 2%Collectibles 247 9% Musical instruments 42 1%Auto parts & tires 188 7% Toys & games 35 1%Antiques 161 6% Health & beauty 30 1%Home decor 116 4% Appliances 29 1%Clothing & accessories 84 3% Video gaming 28 1%Arts & crafts 79 3% Jewelry & watches 24 1%Business & industrial 79 3% Books & magazines 18 1%Sporting goods 72 3% Bicycles 17 1%Computers & tech 69 2% Cell phones 15 1%Outdoor & garden 63 2% Tickets 14 <1%Electronics 58 2% Photo & video 13 <1%Boats 52 2% Movies & music 12 <1%Baby & kid stuff 50 2% Total 2,847 100%
Source: http://minneapolisstpaul.ebayclassifieds.com/for-sale/?catId=100010&output=gallery. All postings are listed regardless of date posted. The search was conducted on October 17 and 18, 2011. Almost half of non-vehicle items are priced under $100 and three-quarters are under $500. One-third of cars were priced between $1,000 and $4,000 and one quarter between $4,000 and $10,000. Table 21. One week’s postings on Twin Cities Free Market (sorted by highest postings)
Category Postings Percent Category Number Percent Furniture 36 27% Recreation & exercise 8 6%Home Renovation 15 11% Appliances 7 5%Lawn & garden 15 11% Arts and Crafts 4 3%Miscellaneous 13 10% Children’s 4 3%Home Décor 12 9% Musical Instruments 4 3%Electronics 11 8% Pet Equipment 2 2%
Total 131 100%Source: http://www.twincitiesfreemarket.org/search.cfm?location=search. All postings from October 17 through October 23, 2011. Search conducted on October 24, 2011. Some items posted during this time period may have been exchanged before October 24. The Free Market does not list motor vehicles. Minnesota’s 76 Freecycle groups are at http://www.freecycle.org/group/US/Minnesota. The most active ones are Minneapolis (156 offered and wanted items posted from October 17 through October 23, 2011); St. Paul (71 postings), Rochester (128 postings) and Duluth (139).
38
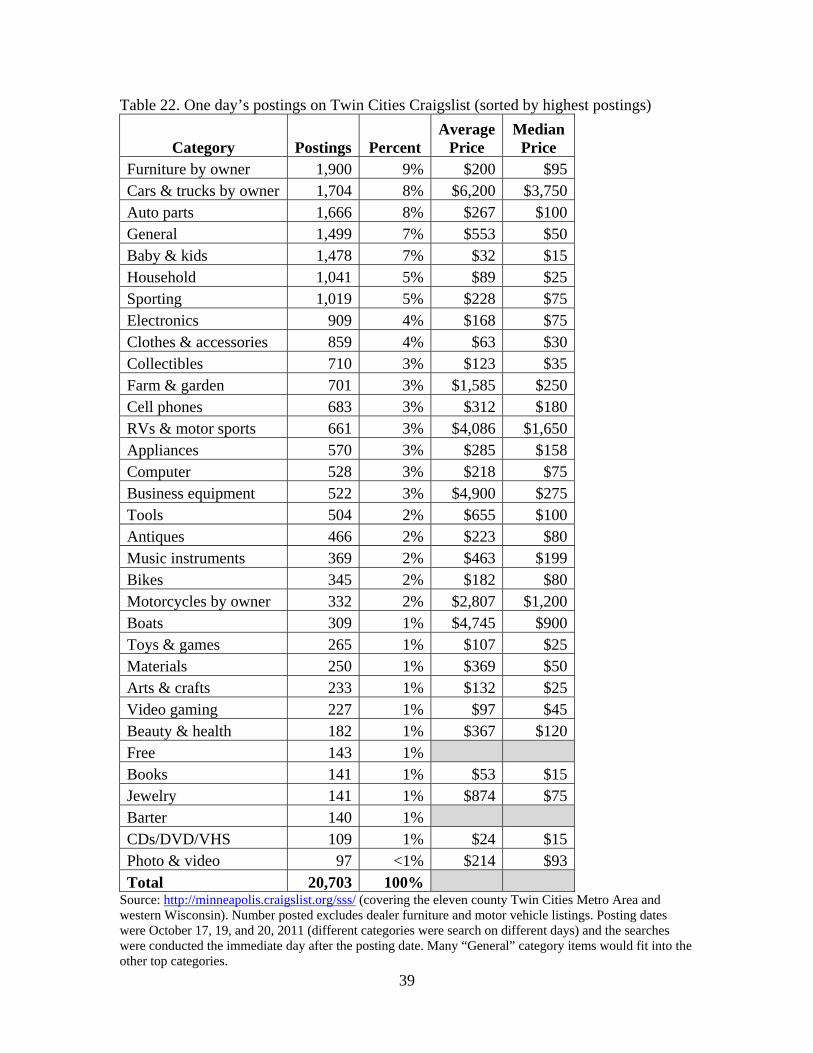
Table 22. One day’s postings on Twin Cities Craigslist (sorted by highest postings)
Category Postings Percent Average
Price Median
Price Furniture by owner 1,900 9% $200 $95Cars & trucks by owner 1,704 8% $6,200 $3,750Auto parts 1,666 8% $267 $100General 1,499 7% $553 $50Baby & kids 1,478 7% $32 $15Household 1,041 5% $89 $25Sporting 1,019 5% $228 $75Electronics 909 4% $168 $75Clothes & accessories 859 4% $63 $30Collectibles 710 3% $123 $35Farm & garden 701 3% $1,585 $250Cell phones 683 3% $312 $180RVs & motor sports 661 3% $4,086 $1,650Appliances 570 3% $285 $158Computer 528 3% $218 $75Business equipment 522 3% $4,900 $275Tools 504 2% $655 $100Antiques 466 2% $223 $80Music instruments 369 2% $463 $199Bikes 345 2% $182 $80Motorcycles by owner 332 2% $2,807 $1,200Boats 309 1% $4,745 $900Toys & games 265 1% $107 $25Materials 250 1% $369 $50Arts & crafts 233 1% $132 $25Video gaming 227 1% $97 $45Beauty & health 182 1% $367 $120Free 143 1% Books 141 1% $53 $15Jewelry 141 1% $874 $75Barter 140 1% CDs/DVD/VHS 109 1% $24 $15Photo & video 97 <1% $214 $93Total 20,703 100%
Source: http://minneapolis.craigslist.org/sss/ (covering the eleven county Twin Cities Metro Area and western Wisconsin). Number posted excludes dealer furniture and motor vehicle listings. Posting dates were October 17, 19, and 20, 2011 (different categories were search on different days) and the searches were conducted the immediate day after the posting date. Many “General” category items would fit into the other top categories.
39
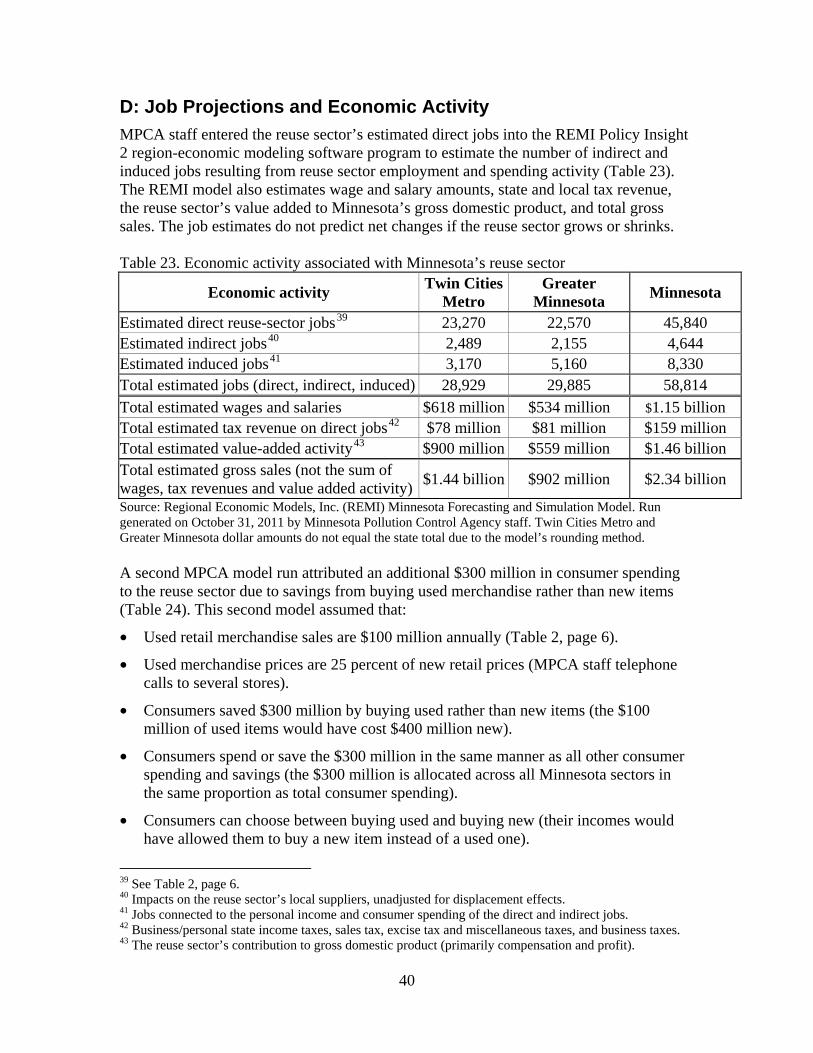
D: Job Projections and Economic Activity MPCA staff entered the reuse sector’s estimated direct jobs into the REMI Policy Insight 2 region-economic modeling software program to estimate the number of indirect and induced jobs resulting from reuse sector employment and spending activity (Table 23). The REMI model also estimates wage and salary amounts, state and local tax revenue, the reuse sector’s value added to Minnesota’s gross domestic product, and total gross sales. The job estimates do not predict net changes if the reuse sector grows or shrinks. Table 23. Economic activity associated with Minnesota’s reuse sector
Source: Regional Economic Models, Inc. (REMI) Minnesota Forecasting and Simulation Model. Run generated on October 31, 2011 by Minnesota Pollution Control Agency staff. Twin Cities Metro and Greater Minnesota dollar amounts do not equal the state total due to the model’s rounding method.
Economic activity Twin Cities Metro
Greater Minnesota Minnesota
Estimated direct reuse-sector jobs39 23,270 22,570 45,840 Estimated indirect jobs40 2,489 2,155 4,644 Estimated induced jobs41 3,170 5,160 8,330 Total estimated jobs (direct, indirect, induced) 28,929 29,885 58,814 Total estimated wages and salaries $618 million $534 million $1.15 billion Total estimated tax revenue on direct jobs42 $78 million $81 million $159 million Total estimated value-added activity43 $900 million $559 million $1.46 billion Total estimated gross sales (not the sum of wages, tax revenues and value added activity) $1.44 billion $902 million $2.34 billion
A second MPCA model run attributed an additional $300 million in consumer spending to the reuse sector due to savings from buying used merchandise rather than new items (Table 24). This second model assumed that:
• Used retail merchandise sales are $100 million annually (Table 2, page 6).
• Used merchandise prices are 25 percent of new retail prices (MPCA staff telephone calls to several stores).
• Consumers saved $300 million by buying used rather than new items (the $100 million of used items would have cost $400 million new).
• Consumers spend or save the $300 million in the same manner as all other consumer spending and savings (the $300 million is allocated across all Minnesota sectors in the same proportion as total consumer spending).
• Consumers can choose between buying used and buying new (their incomes would have allowed them to buy a new item instead of a used one).
40
39 See Table 2, page 6. 40 Impacts on the reuse sector’s local suppliers, unadjusted for displacement effects. 41 Jobs connected to the personal income and consumer spending of the direct and indirect jobs. 42 Business/personal state income taxes, sales tax, excise tax and miscellaneous taxes, and business taxes. 43 The reuse sector’s contribution to gross domestic product (primarily compensation and profit).
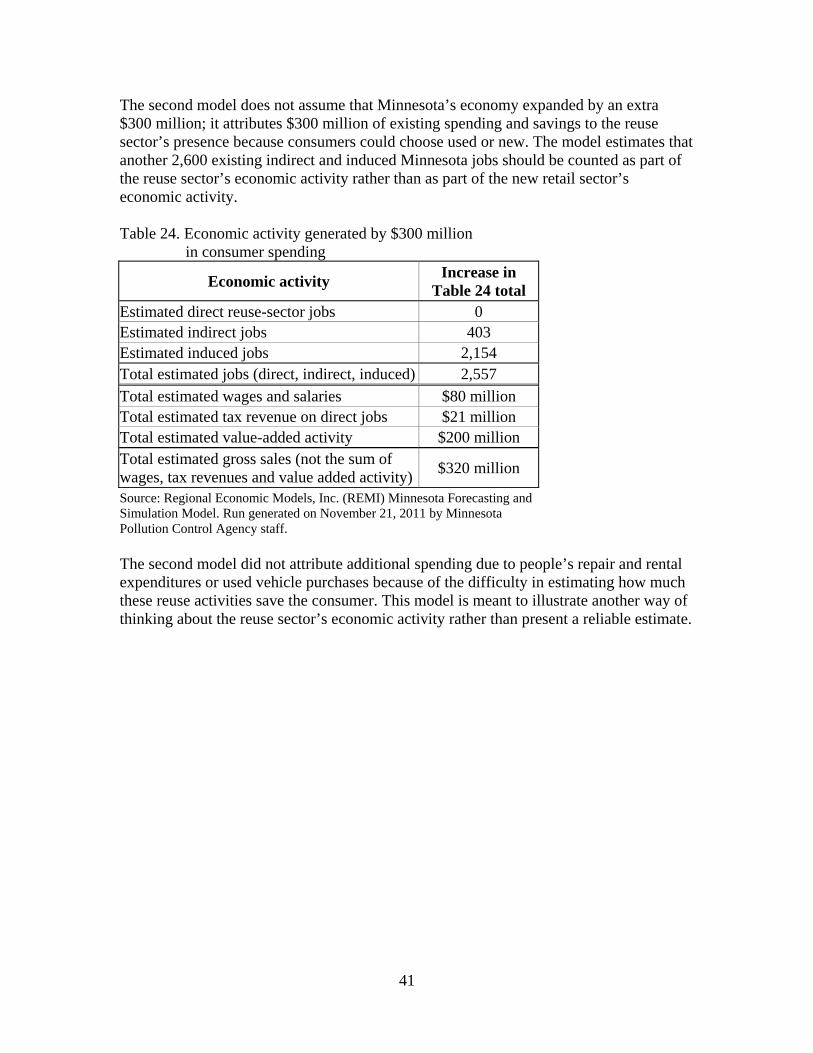
41
The second model does not assume that Minnesota’s economy expanded by an extra $300 million; it attributes $300 million of existing spending and savings to the reuse sector’s presence because consumers could choose used or new. The model estimates that another 2,600 existing indirect and induced Minnesota jobs should be counted as part of the reuse sector’s economic activity rather than as part of the new retail sector’s economic activity. Table 24. Economic activity generated by $300 million in consumer spending
Economic activity Increase in
Table 24 total Estimated direct reuse-sector jobs 0 Estimated indirect jobs 403 Estimated induced jobs 2,154 Total estimated jobs (direct, indirect, induced) 2,557 Total estimated wages and salaries $80 million Total estimated tax revenue on direct jobs $21 million Total estimated value-added activity $200 million Total estimated gross sales (not the sum of wages, tax revenues and value added activity) $320 million
Source: Regional Economic Models, Inc. (REMI) Minnesota Forecasting and Simulation Model. Run generated on November 21, 2011 by Minnesota Pollution Control Agency staff. The second model did not attribute additional spending due to people’s repair and rental expenditures or used vehicle purchases because of the difficulty in estimating how much these reuse activities save the consumer. This model is meant to illustrate another way of thinking about the reuse sector’s economic activity rather than present a reliable estimate.