a study of student achievement, teacher … achievement, teacher perceptions, and ixl math beaverton...
TRANSCRIPT
A Study of Student Achievement, Teacher Perceptions, and IXL Math AN ABSTRACT
Background
IXL Learning partnered with Empirical Education to study the effectiveness of IXL Math in Beaverton
School District in Oregon. During the 2011-2012 year, IXL Math was used to supplement instruction
in two elementary/middle schools. The study focused on 4th and 5th grade students in Title I schools
and examined the relationship between being in an IXL Math classroom and performance on the
Oregon Assessment of Knowledge and Skills (OAKS) math test. As a secondary focus, the study
looked at perceived changes in students’ attitudes towards math since using IXL Math.
Results
1. Students in IXL Math classrooms performed better on the OAKS math test than students not in IXL Math
classrooms.
The mathematics performance for students in IXL Math classrooms versus comparison
students corresponds to a 5-percentile gain on the test.
This gain is equivalent to 6.2 weeks of extra instructional time over the average duration of a
school year. Based on a year containing 170 days of instruction, this translates to 18% more
teaching time.
An increase in the average IXL session duration by just one minute increases the effectiveness
of IXL Math by 6.3% over an average year, as assessed through the OAKS math test.
2. Teachers using IXL Math perceived improved student enjoyment, confidence, and effort since using the
program.
100% of teachers surveyed said that their students’ confidence in learning math increased.
77% of teachers said that their students’ level of effort increased.
3. Teachers using IXL Math in their classrooms reported an overall positive experience with the program.
100% of teachers said that it was likely that they would recommend IXL Math to other
teachers.
93% of teachers were somewhat or very satisfied with the program. No teacher indicated
dissatisfaction with the program.
A Study of Student Achievement, Teacher Perceptions, and IXL Math BEAVERTON SCHOOL DISTRICT
April 15, 2013
IXL Learning contracted with Empirical Education
to study the effectiveness of IXL Math in Beaverton
School District. During the 2011-2012 year, IXL
Math, an interactive, cloud-based practice
environment, was used to supplement instruction
in two elementary/middle schools.
This study focused on 4th and 5th grade students in
Title I schools, and examined the relationship
between being in an IXL Math classroom and
performance on the Oregon Assessment of
Knowledge and Skills (OAKS) math test. We
investigated the following questions.
(1) Do students in IXL Math classrooms perform
better on the OAKS math test than comparable
students who were not in IXL Math
classrooms?
(2) Is the impact of IXL Math different for
students with different characteristics?
(3) Are differences in IXL Math usage associated
with differences in student performance?
We also investigated the following secondary
question.
(4) Do teachers perceive changes in students’
attitudes towards math since using IXL Math?
Results
(1) Do students in IXL Math classrooms perform better
on the OAKS math test than comparable students who
were not in IXL Math classrooms?
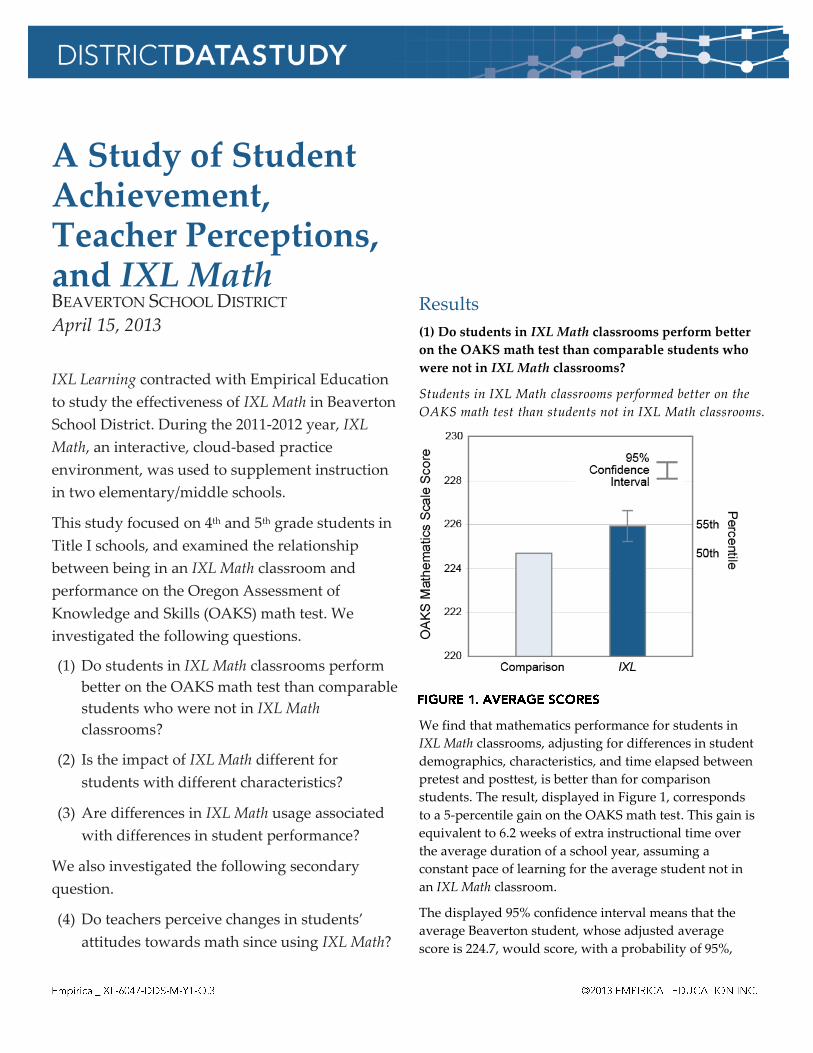
Students in IXL Math classrooms performed better on the
OAKS math test than students not in IXL Math classrooms.
We find that mathematics performance for students in
IXL Math classrooms, adjusting for differences in student
demographics, characteristics, and time elapsed between
pretest and posttest, is better than for comparison
students. The result, displayed in Figure 1, corresponds
to a 5-percentile gain on the OAKS math test. This gain is
equivalent to 6.2 weeks of extra instructional time over
the average duration of a school year, assuming a
constant pace of learning for the average student not in
an IXL Math classroom.
The displayed 95% confidence interval means that the
average Beaverton student, whose adjusted average
score is 224.7, would score, with a probability of 95%,
STUDENT ACHIEVEMENT, TEACHER PERCEPTIONS, AND IXL MATH BEAVERTON SCHOOL DISTRICT
DISTRICTDATASTUDY · AN EMPIRICAL EDUCATION REPORT 2
between 225.2 and 226.7 if they were in an IXL classroom. We have strong confidence in this result (p < .01).
(2) Is the impact of IXL Math different for students with different characteristics?
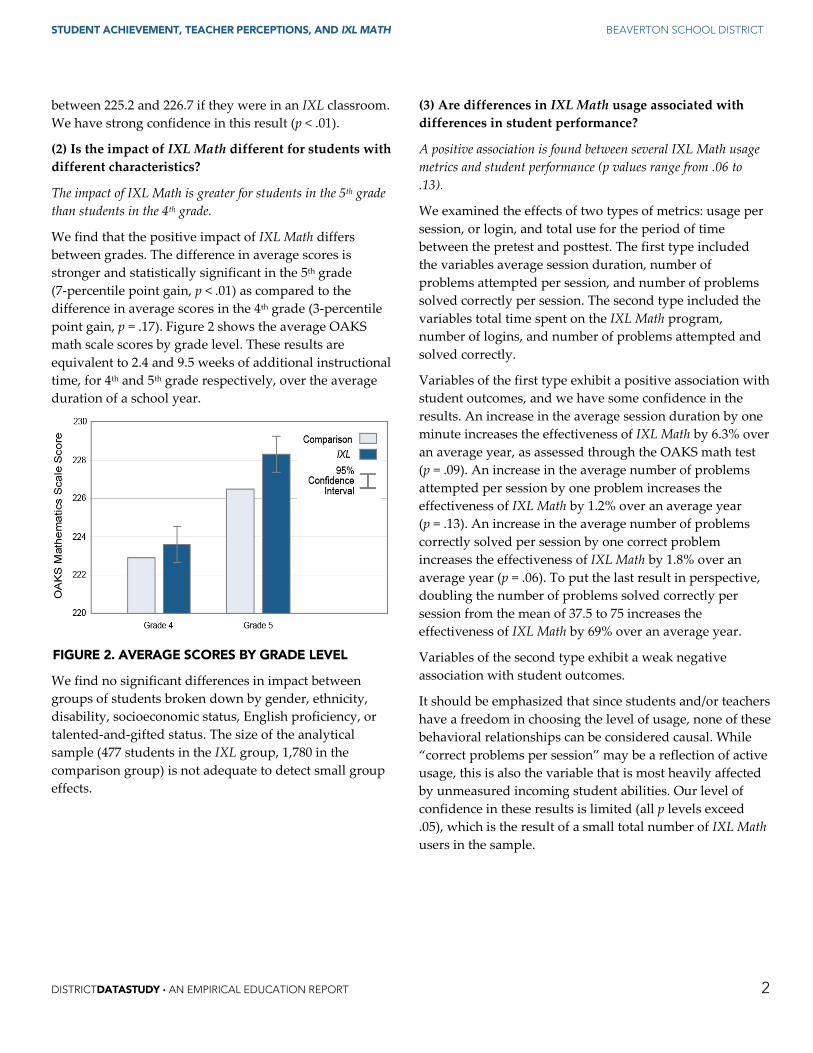
The impact of IXL Math is greater for students in the 5th grade than students in the 4th grade.
We find that the positive impact of IXL Math differs between grades. The difference in average scores is stronger and statistically significant in the 5th grade (7-percentile point gain, p < .01) as compared to the difference in average scores in the 4th grade (3-percentile point gain, p = .17). Figure 2 shows the average OAKS math scale scores by grade level. These results are equivalent to 2.4 and 9.5 weeks of additional instructional time, for 4th and 5th grade respectively, over the average duration of a school year.
We find no significant differences in impact between groups of students broken down by gender, ethnicity, disability, socioeconomic status, English proficiency, or talented-and-gifted status. The size of the analytical sample (477 students in the IXL group, 1,780 in the comparison group) is not adequate to detect small group effects.
(3) Are differences in IXL Math usage associated with differences in student performance?
A positive association is found between several IXL Math usage metrics and student performance (p values range from .06 to .13).
We examined the effects of two types of metrics: usage per session, or login, and total use for the period of time between the pretest and posttest. The first type included the variables average session duration, number of problems attempted per session, and number of problems solved correctly per session. The second type included the variables total time spent on the IXL Math program, number of logins, and number of problems attempted and solved correctly.
Variables of the first type exhibit a positive association with student outcomes, and we have some confidence in the results. An increase in the average session duration by one minute increases the effectiveness of IXL Math by 6.3% over an average year, as assessed through the OAKS math test (p = .09). An increase in the average number of problems attempted per session by one problem increases the effectiveness of IXL Math by 1.2% over an average year (p = .13). An increase in the average number of problems correctly solved per session by one correct problem increases the effectiveness of IXL Math by 1.8% over an average year (p = .06). To put the last result in perspective, doubling the number of problems solved correctly per session from the mean of 37.5 to 75 increases the effectiveness of IXL Math by 69% over an average year.
Variables of the second type exhibit a weak negative association with student outcomes.
It should be emphasized that since students and/or teachers have a freedom in choosing the level of usage, none of these behavioral relationships can be considered causal. While “correct problems per session” may be a reflection of active usage, this is also the variable that is most heavily affected by unmeasured incoming student abilities. Our level of confidence in these results is limited (all p levels exceed .05), which is the result of a small total number of IXL Math users in the sample.
FIGURE 2. AVERAGE SCORES BY GRADE LEVEL
STUDENT ACHIEVEMENT, TEACHER PERCEPTIONS, AND IXL MATH BEAVERTON SCHOOL DISTRICT
DISTRICTDATASTUDY · AN EMPIRICAL EDUCATION REPORT 3
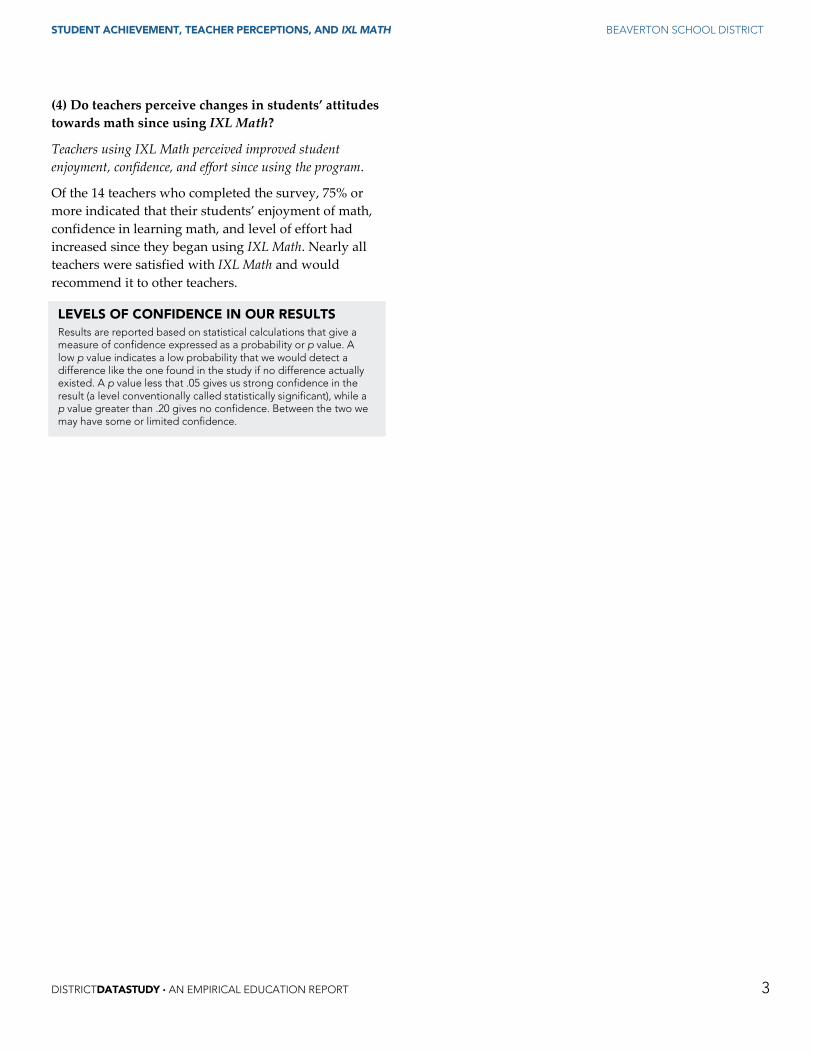
(4) Do teachers perceive changes in students’ attitudes towards math since using IXL Math?
Teachers using IXL Math perceived improved student enjoyment, confidence, and effort since using the program.
Of the 14 teachers who completed the survey, 75% or more indicated that their students’ enjoyment of math, confidence in learning math, and level of effort had increased since they began using IXL Math. Nearly all teachers were satisfied with IXL Math and would recommend it to other teachers.
LEVELS OF CONFIDENCE IN OUR RESULTS Results are reported based on statistical calculations that give a measure of confidence expressed as a probability or p value. A low p value indicates a low probability that we would detect a difference like the one found in the study if no difference actually existed. A p value less that .05 gives us strong confidence in the result (a level conventionally called statistically significant), while a p value greater than .20 gives no confidence. Between the two we may have some or limited confidence.
STUDENT ACHIEVEMENT, TEACHER PERCEPTIONS, AND IXL MATH BEAVERTON SCHOOL DISTRICT
DISTRICTDATASTUDY · AN EMPIRICAL EDUCATION REPORT 4
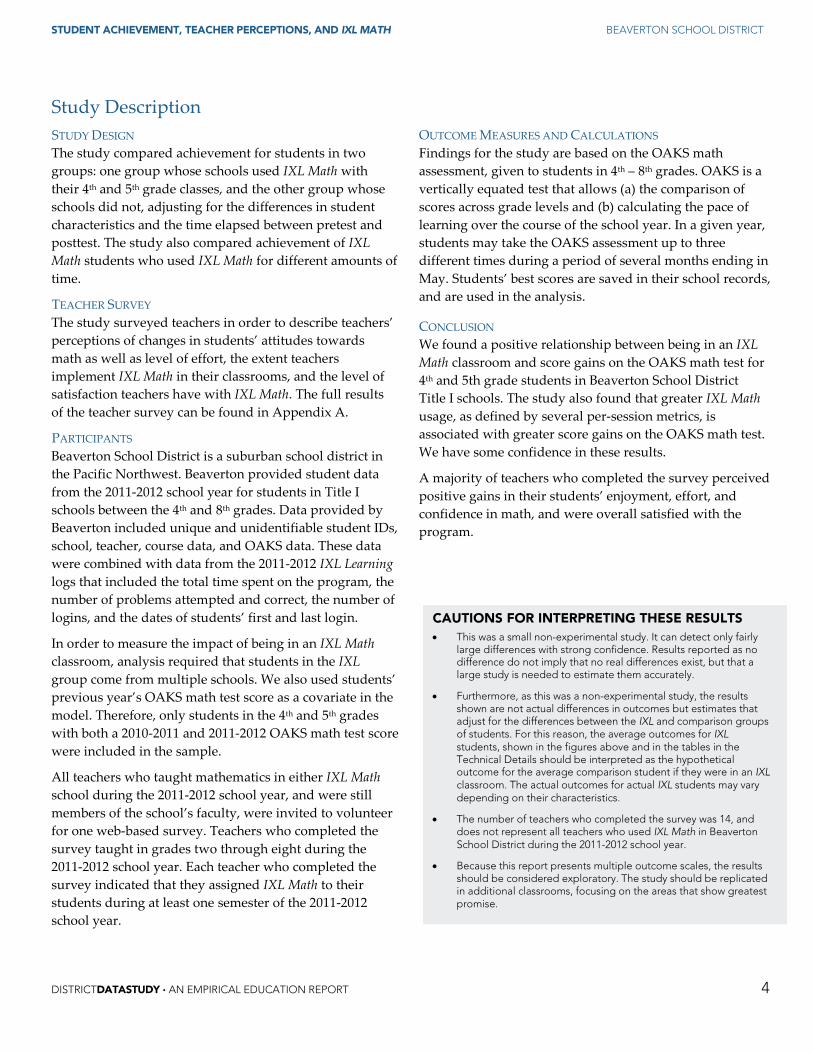
Study Description STUDY DESIGN The study compared achievement for students in two groups: one group whose schools used IXL Math with their 4th and 5th grade classes, and the other group whose schools did not, adjusting for the differences in student characteristics and the time elapsed between pretest and posttest. The study also compared achievement of IXL Math students who used IXL Math for different amounts of time.
TEACHER SURVEY The study surveyed teachers in order to describe teachers’ perceptions of changes in students’ attitudes towards math as well as level of effort, the extent teachers implement IXL Math in their classrooms, and the level of satisfaction teachers have with IXL Math. The full results of the teacher survey can be found in Appendix A.
PARTICIPANTS Beaverton School District is a suburban school district in the Pacific Northwest. Beaverton provided student data from the 2011-2012 school year for students in Title I schools between the 4th and 8th grades. Data provided by Beaverton included unique and unidentifiable student IDs, school, teacher, course data, and OAKS data. These data were combined with data from the 2011-2012 IXL Learning logs that included the total time spent on the program, the number of problems attempted and correct, the number of logins, and the dates of students’ first and last login.
In order to measure the impact of being in an IXL Math classroom, analysis required that students in the IXL group come from multiple schools. We also used students’ previous year’s OAKS math test score as a covariate in the model. Therefore, only students in the 4th and 5th grades with both a 2010-2011 and 2011-2012 OAKS math test score were included in the sample.
All teachers who taught mathematics in either IXL Math school during the 2011-2012 school year, and were still members of the school’s faculty, were invited to volunteer for one web-based survey. Teachers who completed the survey taught in grades two through eight during the 2011-2012 school year. Each teacher who completed the survey indicated that they assigned IXL Math to their students during at least one semester of the 2011-2012 school year.
OUTCOME MEASURES AND CALCULATIONS Findings for the study are based on the OAKS math assessment, given to students in 4th – 8th grades. OAKS is a vertically equated test that allows (a) the comparison of scores across grade levels and (b) calculating the pace of learning over the course of the school year. In a given year, students may take the OAKS assessment up to three different times during a period of several months ending in May. Students’ best scores are saved in their school records, and are used in the analysis.
CONCLUSION We found a positive relationship between being in an IXL Math classroom and score gains on the OAKS math test for 4th and 5th grade students in Beaverton School District Title I schools. The study also found that greater IXL Math usage, as defined by several per-session metrics, is associated with greater score gains on the OAKS math test. We have some confidence in these results.
A majority of teachers who completed the survey perceived positive gains in their students’ enjoyment, effort, and confidence in math, and were overall satisfied with the program.
CAUTIONS FOR INTERPRETING THESE RESULTS • This was a small non-experimental study. It can detect only fairly
large differences with strong confidence. Results reported as no difference do not imply that no real differences exist, but that a large study is needed to estimate them accurately.
• Furthermore, as this was a non-experimental study, the results shown are not actual differences in outcomes but estimates that adjust for the differences between the IXL and comparison groups of students. For this reason, the average outcomes for IXL students, shown in the figures above and in the tables in the Technical Details should be interpreted as the hypothetical outcome for the average comparison student if they were in an IXL classroom. The actual outcomes for actual IXL students may vary depending on their characteristics.
• The number of teachers who completed the survey was 14, and does not represent all teachers who used IXL Math in Beaverton School District during the 2011-2012 school year.
• Because this report presents multiple outcome scales, the results should be considered exploratory. The study should be replicated in additional classrooms, focusing on the areas that show greatest promise.
STUDENT ACHIEVEMENT, TEACHER PERCEPTIONS, AND IXL MATH BEAVERTON SCHOOL DISTRICT
DISTRICTDATASTUDY · AN EMPIRICAL EDUCATION REPORT 5
Technical Details DATA PREPARATION Beaverton School District provided student data for the 2011-2012 school year, for students in Title I schools. These data included unique unidentifiable student IDs, demographics, student course data, school and teacher identifiers, and scores from the 2010-2011 and 2011-2012 OAKS math test. Beaverton School District provided 2,801 unique records for students in the 4th or 5th grades.
IXL Learning provided student log data for the 2011-2012 school year from the IXL Learning system. Log data included the total time spent on the program, the number of problems attempted and correct, the number of logins, and the dates of students’ first and last login. All log data was for the period of time beginning with the first day of school and ending with each student’s OAKS administration date. After student records were received from Beaverton School District, student records from the two IXL schools were stripped of all demographic information, and student IDs alone were given to IXL Learning. These student IDs were matched with student IDs in the IXL Learning system and returned with log data.
Teachers completed the survey through Empirical’s secure web-based survey tool.
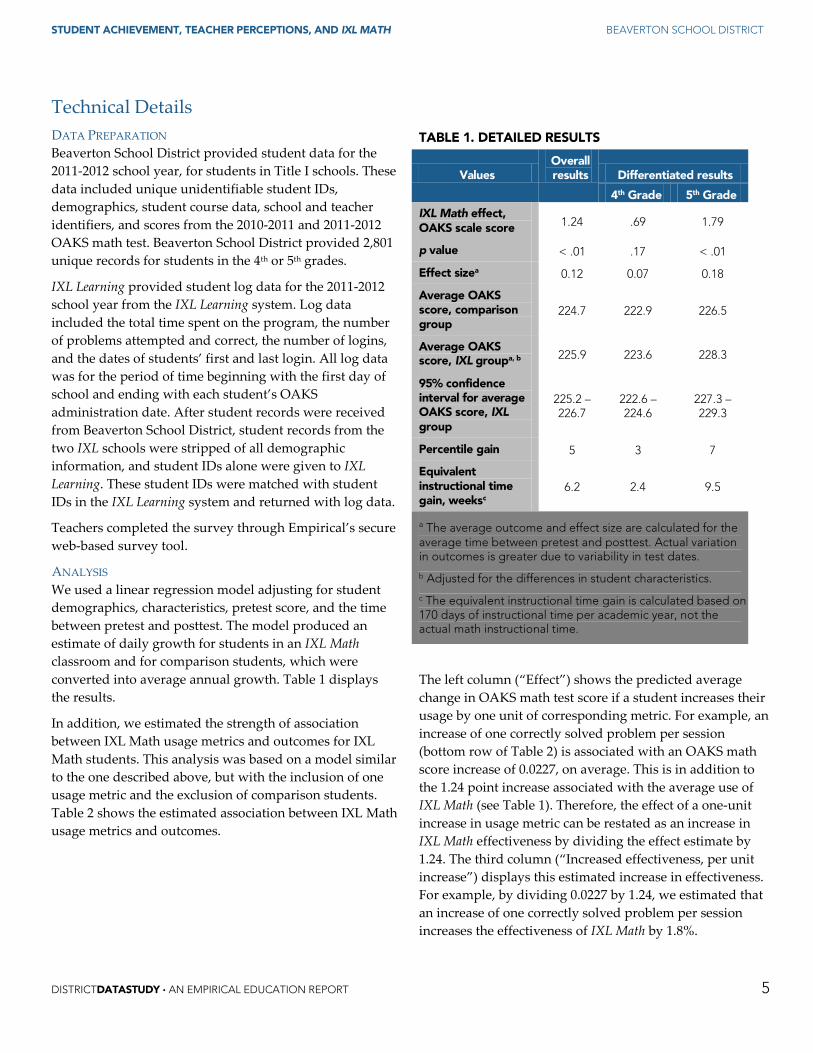
ANALYSIS We used a linear regression model adjusting for student demographics, characteristics, pretest score, and the time between pretest and posttest. The model produced an estimate of daily growth for students in an IXL Math classroom and for comparison students, which were converted into average annual growth. Table 1 displays the results.
In addition, we estimated the strength of association between IXL Math usage metrics and outcomes for IXL Math students. This analysis was based on a model similar to the one described above, but with the inclusion of one usage metric and the exclusion of comparison students. Table 2 shows the estimated association between IXL Math usage metrics and outcomes.
TABLE 1. DETAILED RESULTS
Values Overall results Differentiated results
4th Grade 5th Grade
IXL Math effect, OAKS scale score 1.24 .69 1.79
p value < .01 .17 < .01
Effect sizea 0.12 0.07 0.18
Average OAKS score, comparison group
224.7 222.9 226.5
Average OAKS score, IXL groupa, b 225.9 223.6 228.3
95% confidence interval for average OAKS score, IXL group
225.2 – 226.7
222.6 – 224.6
227.3 – 229.3
Percentile gain 5 3 7
Equivalent instructional time gain, weeksc
6.2 2.4 9.5
a The average outcome and effect size are calculated for the average time between pretest and posttest. Actual variation in outcomes is greater due to variability in test dates.
b Adjusted for the differences in student characteristics.
c The equivalent instructional time gain is calculated based on 170 days of instructional time per academic year, not the actual math instructional time.
The left column (“Effect”) shows the predicted average change in OAKS math test score if a student increases their usage by one unit of corresponding metric. For example, an increase of one correctly solved problem per session (bottom row of Table 2) is associated with an OAKS math score increase of 0.0227, on average. This is in addition to the 1.24 point increase associated with the average use of IXL Math (see Table 1). Therefore, the effect of a one-unit increase in usage metric can be restated as an increase in IXL Math effectiveness by dividing the effect estimate by 1.24. The third column (“Increased effectiveness, per unit increase”) displays this estimated increase in effectiveness. For example, by dividing 0.0227 by 1.24, we estimated that an increase of one correctly solved problem per session increases the effectiveness of IXL Math by 1.8%.
STUDENT ACHIEVEMENT, TEACHER PERCEPTIONS, AND IXL MATH BEAVERTON SCHOOL DISTRICT
DISTRICTDATASTUDY · AN EMPIRICAL EDUCATION REPORT 6
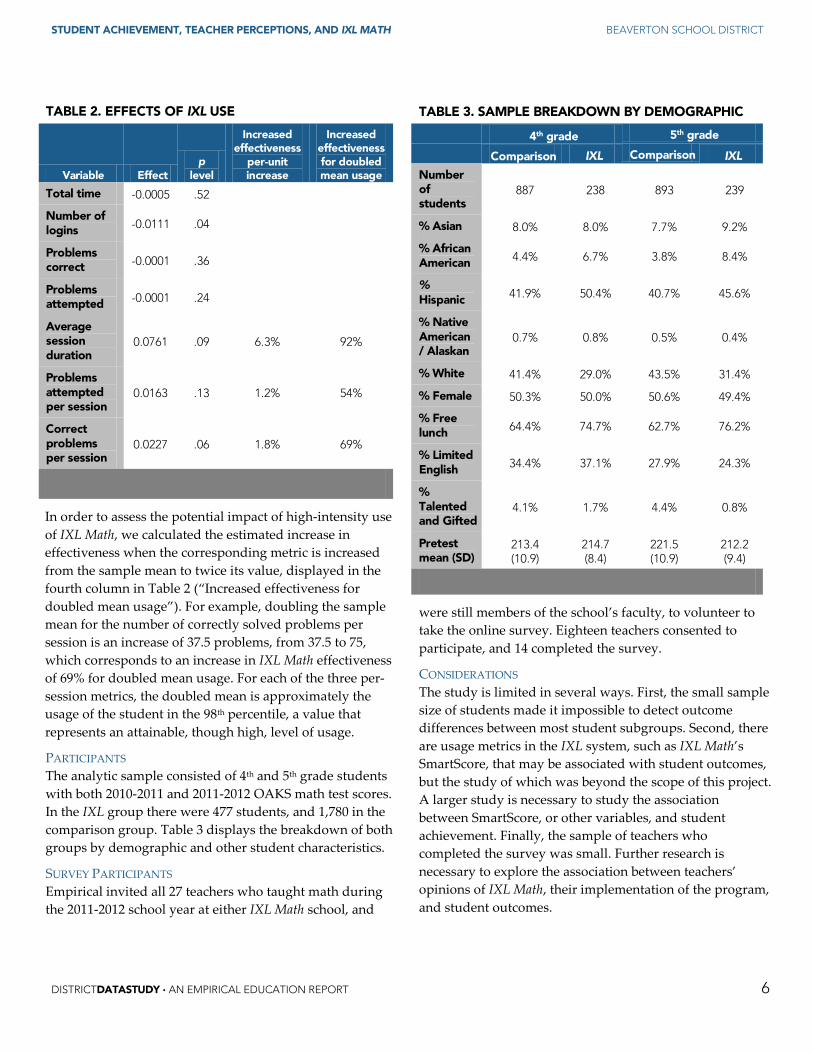
In order to assess the potential impact of high-intensity use of IXL Math, we calculated the estimated increase in effectiveness when the corresponding metric is increased from the sample mean to twice its value, displayed in the fourth column in Table 2 (“Increased effectiveness for doubled mean usage”). For example, doubling the sample mean for the number of correctly solved problems per session is an increase of 37.5 problems, from 37.5 to 75, which corresponds to an increase in IXL Math effectiveness of 69% for doubled mean usage. For each of the three per-session metrics, the doubled mean is approximately the usage of the student in the 98th percentile, a value that represents an attainable, though high, level of usage.
PARTICIPANTS The analytic sample consisted of 4th and 5th grade students with both 2010-2011 and 2011-2012 OAKS math test scores. In the IXL group there were 477 students, and 1,780 in the comparison group. Table 3 displays the breakdown of both groups by demographic and other student characteristics.
SURVEY PARTICIPANTS Empirical invited all 27 teachers who taught math during the 2011-2012 school year at either IXL Math school, and
TABLE 3. SAMPLE BREAKDOWN BY DEMOGRAPHIC
4th grade 5th grade
Comparison IXL Comparison IXL
Number of students
887 238 893 239
% Asian 8.0% 8.0% 7.7% 9.2%
% African American 4.4% 6.7% 3.8% 8.4%
% Hispanic 41.9% 50.4% 40.7% 45.6%
% Native American / Alaskan
0.7% 0.8% 0.5% 0.4%
% White 41.4% 29.0% 43.5% 31.4%
% Female 50.3% 50.0% 50.6% 49.4%
% Free lunch 64.4% 74.7% 62.7% 76.2%
% Limited English 34.4% 37.1% 27.9% 24.3%
% Talented and Gifted
4.1% 1.7% 4.4% 0.8%
Pretest mean (SD)
213.4 (10.9)
214.7 (8.4)
221.5 (10.9)
212.2 (9.4)
were still members of the school’s faculty, to volunteer to take the online survey. Eighteen teachers consented to participate, and 14 completed the survey.
CONSIDERATIONS The study is limited in several ways. First, the small sample size of students made it impossible to detect outcome differences between most student subgroups. Second, there are usage metrics in the IXL system, such as IXL Math’s SmartScore, that may be associated with student outcomes, but the study of which was beyond the scope of this project. A larger study is necessary to study the association between SmartScore, or other variables, and student achievement. Finally, the sample of teachers who completed the survey was small. Further research is necessary to explore the association between teachers’ opinions of IXL Math, their implementation of the program, and student outcomes.
TABLE 2. EFFECTS OF IXL USE
Variable Effect p
level
Increased effectiveness
per-unit increase
Increased effectiveness for doubled mean usage
Total time -0.0005 .52
Number of logins -0.0111 .04
Problems correct -0.0001 .36
Problems attempted -0.0001 .24
Average session duration
0.0761 .09 6.3% 92%
Problems attempted per session
0.0163 .13 1.2% 54%
Correct problems per session
0.0227 .06 1.8% 69%
STUDENT ACHIEVEMENT, TEACHER PERCEPTIONS, AND IXL MATH BEAVERTON SCHOOL DISTRICT
DISTRICTDATASTUDY · AN EMPIRICAL EDUCATION REPORT 7
Appendix A: Teacher Survey Results In this section we discuss 1) teachers’ perceptions of changes in student attitudes and behaviors since they began using IXL Math, 2) teacher implementation of IXL Math, and 3) teacher satisfaction with IXL Math. We obtained data from one online survey, deployed in December 2012.
In the two IXL Math schools, 18 teachers consented to participate in the survey. Of those, 14 teachers (78%) completed the survey.
1) Teacher perceptions of changes in student attitudes and behaviors
We asked teachers who taught math during both the 2010-2011 and 2011-2012 to compare students’ behavior and attitudes in the following areas before and after they began using IXL Math:
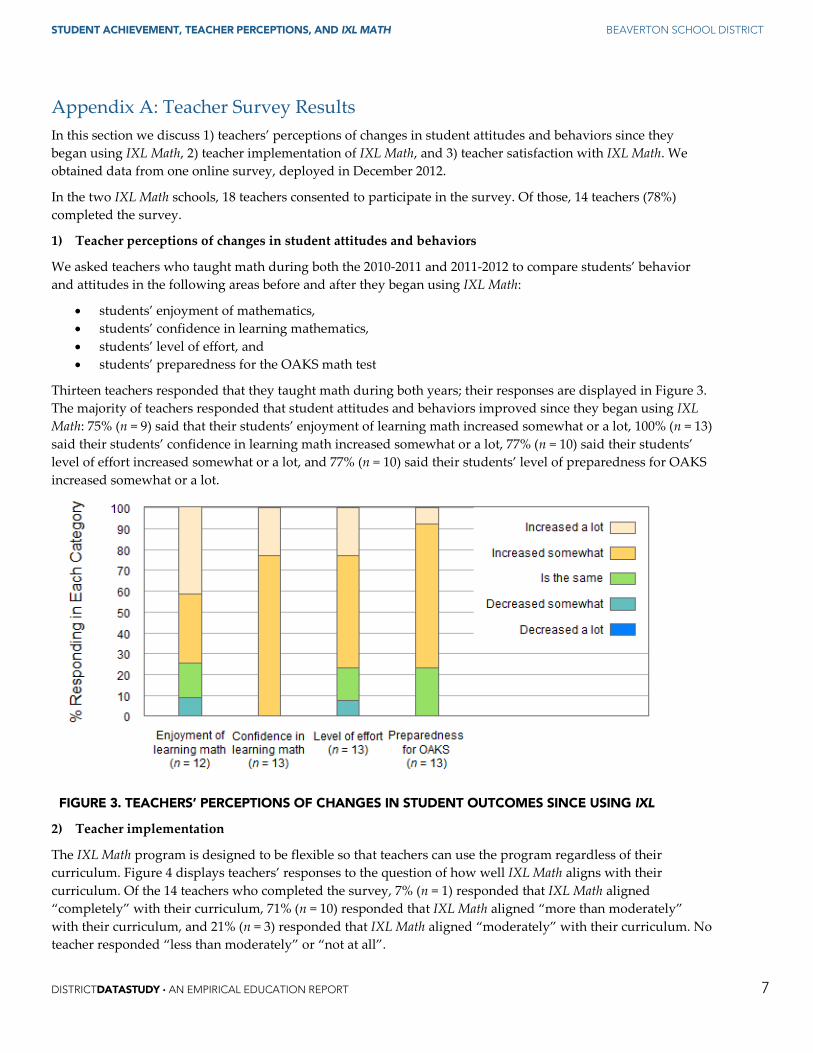
• students’ enjoyment of mathematics, • students’ confidence in learning mathematics, • students’ level of effort, and • students’ preparedness for the OAKS math test
Thirteen teachers responded that they taught math during both years; their responses are displayed in Figure 3. The majority of teachers responded that student attitudes and behaviors improved since they began using IXL Math: 75% (n = 9) said that their students’ enjoyment of learning math increased somewhat or a lot, 100% (n = 13) said their students’ confidence in learning math increased somewhat or a lot, 77% (n = 10) said their students’ level of effort increased somewhat or a lot, and 77% (n = 10) said their students’ level of preparedness for OAKS increased somewhat or a lot.
FIGURE 3. TEACHERS’ PERCEPTIONS OF CHANGES IN STUDENT OUTCOMES SINCE USING IXL
2) Teacher implementation
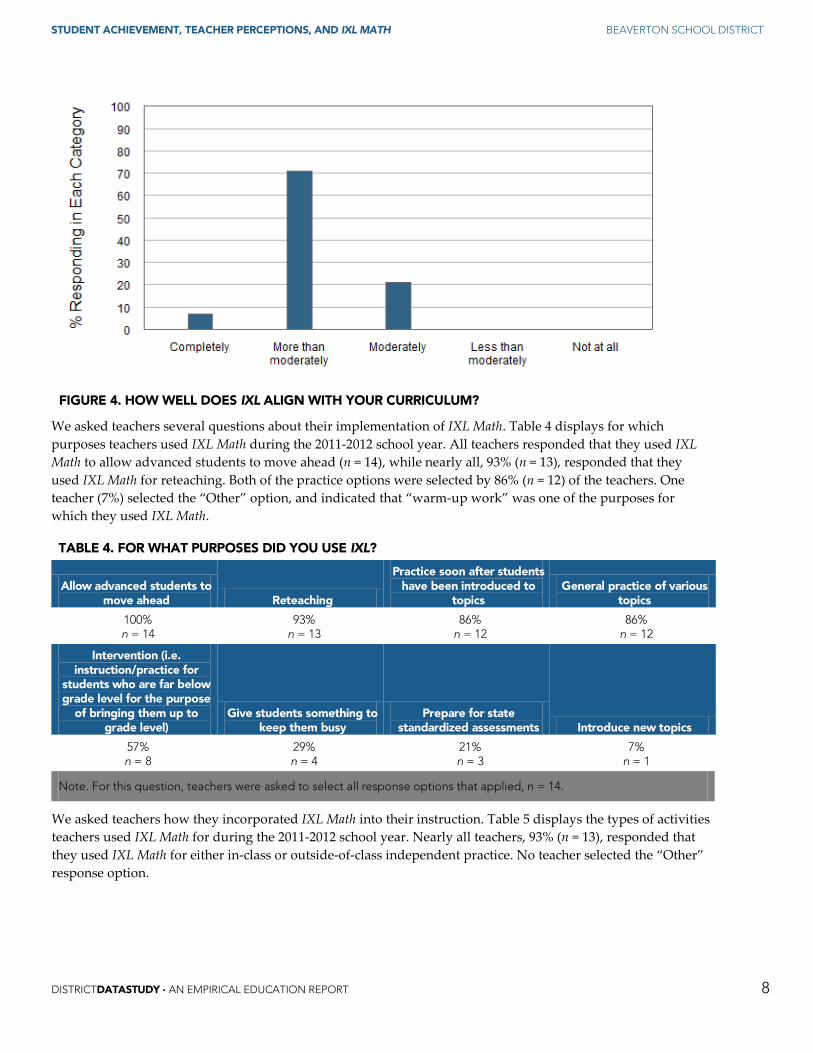
The IXL Math program is designed to be flexible so that teachers can use the program regardless of their curriculum. Figure 4 displays teachers’ responses to the question of how well IXL Math aligns with their curriculum. Of the 14 teachers who completed the survey, 7% (n = 1) responded that IXL Math aligned “completely” with their curriculum, 71% (n = 10) responded that IXL Math aligned “more than moderately” with their curriculum, and 21% (n = 3) responded that IXL Math aligned “moderately” with their curriculum. No teacher responded “less than moderately” or “not at all”.
STUDENT ACHIEVEMENT, TEACHER PERCEPTIONS, AND IXL MATH BEAVERTON SCHOOL DISTRICT
DISTRICTDATASTUDY · AN EMPIRICAL EDUCATION REPORT 8
FIGURE 4. HOW WELL DOES IXL ALIGN WITH YOUR CURRICULUM?
We asked teachers several questions about their implementation of IXL Math. Table 4 displays for which purposes teachers used IXL Math during the 2011-2012 school year. All teachers responded that they used IXL Math to allow advanced students to move ahead (n = 14), while nearly all, 93% (n = 13), responded that they used IXL Math for reteaching. Both of the practice options were selected by 86% (n = 12) of the teachers. One teacher (7%) selected the “Other” option, and indicated that “warm-up work” was one of the purposes for which they used IXL Math.
TABLE 4. FOR WHAT PURPOSES DID YOU USE IXL?
Allow advanced students to move ahead Reteaching
Practice soon after students have been introduced to
topics General practice of various
topics
100% n = 14
93% n = 13
86% n = 12
86% n = 12
Intervention (i.e. instruction/practice for
students who are far below grade level for the purpose
of bringing them up to grade level)
Give students something to keep them busy
Prepare for state standardized assessments Introduce new topics
57% n = 8
29% n = 4
21% n = 3
7% n = 1
Note. For this question, teachers were asked to select all response options that applied, n = 14.
We asked teachers how they incorporated IXL Math into their instruction. Table 5 displays the types of activities teachers used IXL Math for during the 2011-2012 school year. Nearly all teachers, 93% (n = 13), responded that they used IXL Math for either in-class or outside-of-class independent practice. No teacher selected the “Other” response option.
STUDENT ACHIEVEMENT, TEACHER PERCEPTIONS, AND IXL MATH BEAVERTON SCHOOL DISTRICT
DISTRICTDATASTUDY · AN EMPIRICAL EDUCATION REPORT 9
TABLE 5. FOR WHAT ACTIVITIES DID YOU USE IXL?
Independent practice (in class)
Independent practice (outside of class)
Whole class instruction
Teacher-student one-on-one activities Small group activities
93% n = 13
93% n = 13
50% n = 7
36% n = 5
36% n = 5
Note. For this question, teachers were asked to select all response options that applied, n = 14.
In addition to being a practice tool for students, IXL Math can also be a tool for teachers to help monitor students’ use of the program and students’ progress on the skills they practice. Of the 13 teachers who taught math during the 2010-2011 school year, 77% (n = 10) said that they monitor their students’ progress somewhat more closely or a lot more closely since they began using IXL Math, while 23% (n = 3) said they monitor students’ progress about the same.
There is a variety of IXL Math reports designed to help teachers monitor their students’ progress. Eighty-six percent (n = 12) of the teachers responded that they used IXL Math’s reports during the 2011-2012 school year. Teachers who responded that they used the IXL Math reports were also asked how often they referred to the reports. As displayed in Table 6, teachers responded that they referred to the reports on at least a monthly basis, or more often.
TABLE 6. HOW OFTEN DID YOU REFER TO IXL’S REPORTS?
Every other month or less At least once a month Every other week Once a week
More than once a week
0% n = 0
33% n = 4
8% n = 1
33% n = 4
17% n = 2
Note. One teacher who responded that they used IXL Math’s reports did not respond to this question.
Table 7 displays teachers’ responses about how information from IXL Math’s reports was used. At least 75% responded that they used IXL Math’s reports to check whole class performance or individual students’ performance on skills taught in class, and 83% responded they used IXL Math’s reports to reward or recognize students. No teacher selected the “Other” response option.
TABLE 7. HOW DID YOU USE THE INFORMATION FROM IXL’S REPORTS?
To reward / recognize students
To check whole class performance of skills taught
To check individual performance of skills taught
To check state assessment preparation
83% n = 10
83% n = 10
75% n = 9
17% n = 2
Note. For this question, teachers were asked to select all response options that applied, n = 12.
STUDENT ACHIEVEMENT, TEACHER PERCEPTIONS, AND IXL MATH BEAVERTON SCHOOL DISTRICT
DISTRICTDATASTUDY · AN EMPIRICAL EDUCATION REPORT 10
3) Teacher satisfaction
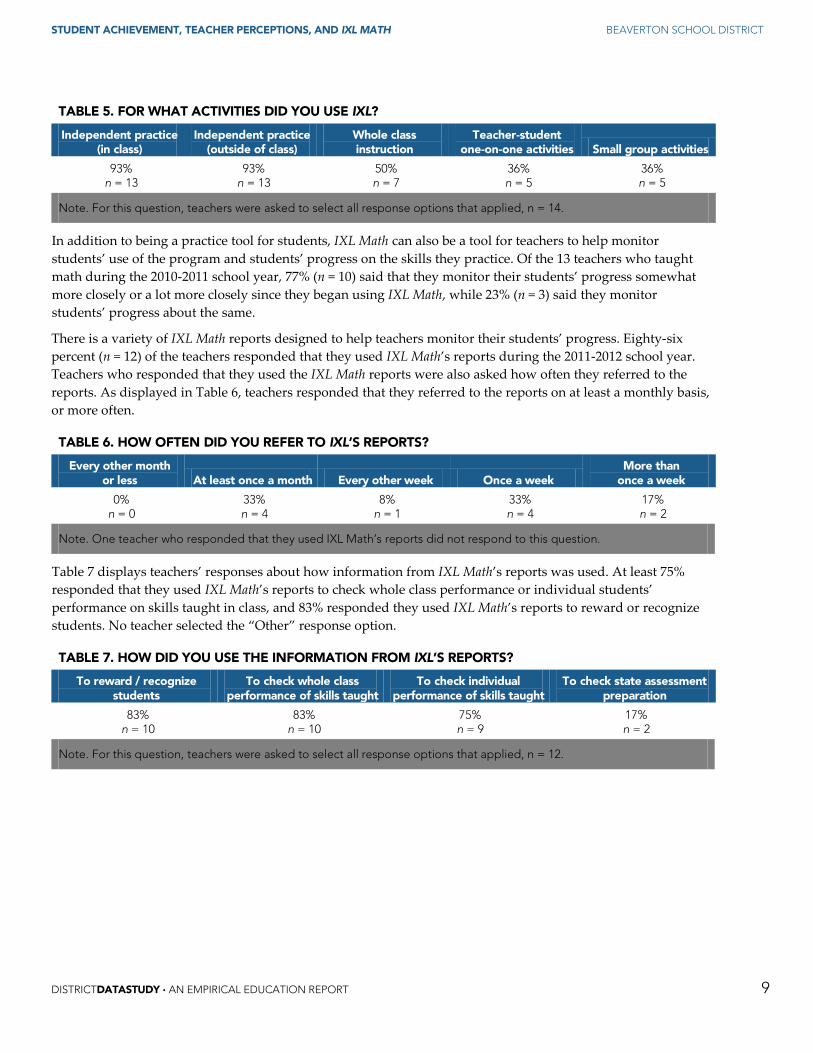
We asked teachers how satisfied they were with IXL Math. Figure 5 shows that 79% (n = 11) of the 14 teachers were very satisfied with the program, while 14% (n = 2) were somewhat satisfied, and 7% (n = 1) was neutral. No teacher selected “somewhat dissatisfied” or “very dissatisfied”.
FIGURE 5. OVERALL, HOW SATISFIED ARE YOU WITH IXL?
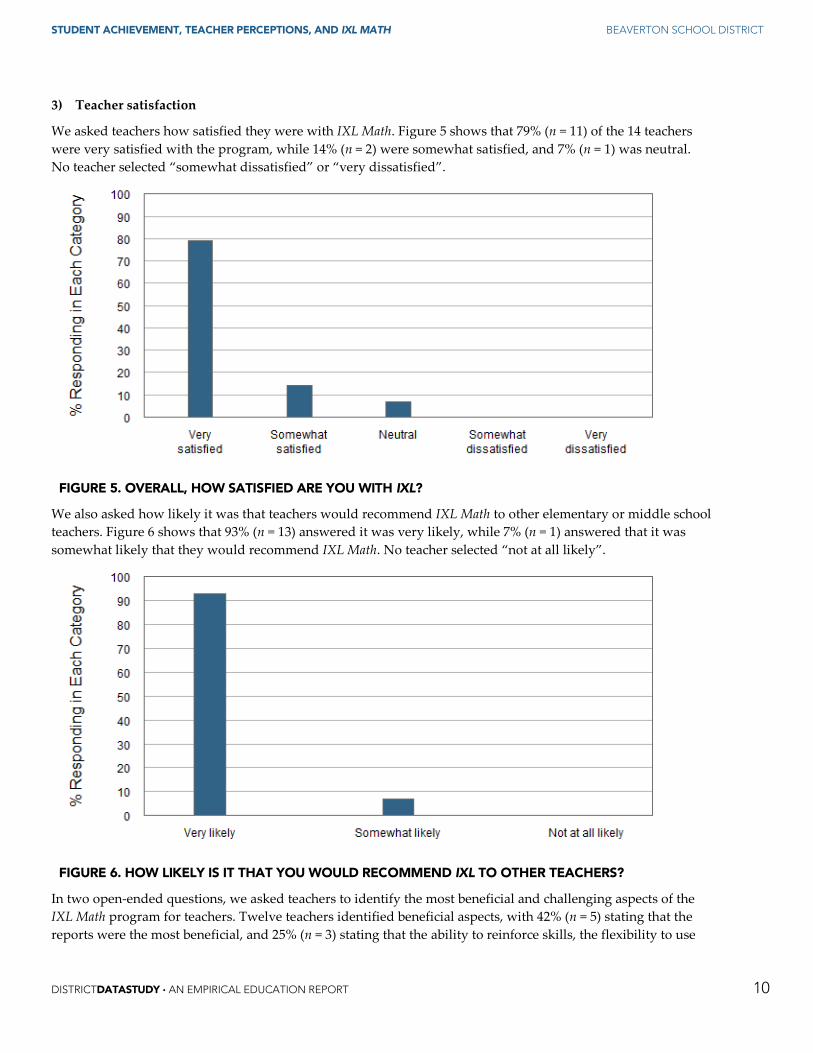
We also asked how likely it was that teachers would recommend IXL Math to other elementary or middle school teachers. Figure 6 shows that 93% (n = 13) answered it was very likely, while 7% (n = 1) answered that it was somewhat likely that they would recommend IXL Math. No teacher selected “not at all likely”.
FIGURE 6. HOW LIKELY IS IT THAT YOU WOULD RECOMMEND IXL TO OTHER TEACHERS?
In two open-ended questions, we asked teachers to identify the most beneficial and challenging aspects of the IXL Math program for teachers. Twelve teachers identified beneficial aspects, with 42% (n = 5) stating that the reports were the most beneficial, and 25% (n = 3) stating that the ability to reinforce skills, the flexibility to use
STUDENT ACHIEVEMENT, TEACHER PERCEPTIONS, AND IXL MATH BEAVERTON SCHOOL DISTRICT
DISTRICTDATASTUDY · AN EMPIRICAL EDUCATION REPORT 11
with students with different skill levels, or the ability to monitor students’ progress, were the most beneficial. Eleven teachers identified challenging aspects, with 55% (n = 6) stating that the reports were the most challenging, and 27% (n = 3) stating that aligning IXL Math with lessons and/or state standards was the most challenging.
In two more open-ended questions, we asked teachers to identify the most beneficial and challenging aspects of the IXL Math program for students. All 14 teachers identified beneficial aspects, with 71% (n = 10) responding that the opportunities for students to practice were the most beneficial, and 29% (n = 4) identified the ability for students to catch up, or the instant feedback and explanations of incorrect answers given to students, as the most beneficial. Twelve teachers identified challenging aspects. Both the lack of computer or internet access, and the need for guidance to use the program well, were mentioned by 25% (n = 4) of the teachers as the most challenging aspects for students.
STUDENT ACHIEVEMENT, TEACHER PERCEPTIONS, AND IXL MATH BEAVERTON SCHOOL DISTRICT
References Oregon Department of Education. (2009). Oregon’s Statewide Assessment System Technical Report: Volume 6, Score
Interpretation Guide. Retrieved on March 18, 2013, from http://www.ode.state.or.us/teachlearn/testing/manuals/2008/asmttechmanualvol6_interpguide.pdf
Oregon Department of Education. (2007). Oregon’s Statewide Assessment System Technical Report: Volume 4, Reliability and Validity. Retrieved on March 18, 2013, from http://www.ode.state.or.us/teachlearn/testing/manuals/2007/asmttechmanualvol4_validity.pdf
Oregon Department of Education. (2012). 2011-2012 Conversion Tables: Scale Score to Percentile Rank. Retrieved on March 18, 2013, from http://www.ode.state.or.us/wma/data/schoolanddistrict/testresults/2012/asmtconvpctiles_1112.xls
Oregon Department of Education. (2011). 2010-2011 Conversion Tables: Scale Score to Percentile Rank. Retrieved on March 18, 2013, from http://www.ode.state.or.us/wma/data/schoolanddistrict/testresults/2011/asmtconvpctiles_1011.xls