“a study of linkages between human resource management
TRANSCRIPT

i
“A STUDY OF LINKAGES BETWEEN
HUMAN RESOURCE MANAGEMENT PRACTICES
AND
SMEs PERFORMANCE IN VADODARA DISTRICT”
A Thesis Submitted to Gujarat Technological University
For the Award of
Doctor of Philosophy
in
Management
By
Ms. RANJITA BANERJEE
(Enrolment No. 119997392045)
Under the Supervision of
Dr. RAJESH KHAJURIA
GUJARAT TECHNOLOGICAL UNIVERSITY
AHMEDABAD
March 2017

ii
© Ranjita Banerjee

iii
Annexure - III
DECLARATION
I, Ranjita Banerjee, declare that the thesis entitled “A Study of Linkages Between
Human Resource Management Practices and SMEs Performance in Vadodara
District” submitted by me for the degree of Doctor of Philosophy is the record work
carried out by me during the period from July 2011 to February 2017, under the
supervision of Dr. Rajesh Khajuria and this has not formed the basis for the award of
any degree, diploma, Associateship, Fellowship, titles in this or any other University or
other institution of higher learning.
I further declare that the material obtained from other sources has been duly
acknowledged in the thesis. I shall be solely responsible for any plagiarism or other
irregularities, if noticed in the thesis.
Signature: _______________ Date: 27th February 2017
Ranjita Banerjee Place: Vadodara
MHRD, MA-Eco., UGC-NET, B.Ed.
Asst. Professor, CKSV Institute of Management
Email: [email protected]
iv
Annexure - IV
CERTIFICATE
I certify that the work incorporated in the thesis entitled “A Study of Linkages
Between Human Resource Management Practices and SMEs Performance in
Vadodara District”, submitted by Ms. Ranjita Banerjee, was carried out by the
candidate under my supervision / guidance.
To the best of my knowledge (i) the candidate has not submitted the same research work
to any other institution for any degree / diploma, Associateship , Fellowship or other
similar titles (ii) the thesis submitted is a record of original research work done by the
Research Scholar during the period of study under my supervision, and (iii) the thesis
represents independent research work on the part of the Research Scholar.
Signature of Supervisor: ______________________ Date: 27.02.17 Name of Supervisor: Dr. Rajesh Khajuria
PhD (Management), MBA (Finance), CMC, FIMC
Director, CKSV Institute of Management, Vadodara
Email: [email protected]

v
Annexure - V
ORIGINALITY REPORT CERTIFICATE
It is certified that PhD Thesis titled “A Study of Linkages Between Human Resource
Management Practices and SMEs Performance in Vadodara District” by Ms.
Ranjita Banerjee, has been examined by us.
We undertake the following:
a. Thesis has significant new work / knowledge as compared to already published or are
under consideration to be published elsewhere. No sentence, equation, diagram, table,
paragraph or section has been copied verbatim from previous work unless it is placed
under quotation marks and duly referenced.
b. The work presented is original and own work of the author (Please refer Plagiarism
report). No ideas, processes, results or words of others have been presented as Author
own work.
c. There is no fabrication of data or results which have been compiled / analyzed.
d. There is no falsification by manipulating research materials, equipment or processes,
or changing or omitting data or results such that the research is not accurately represented
in the research record.
e. The thesis has been checked using <Turnitin> (copy of originality report attached)
and found within limits as per GTU Plagiarism Policy and instructions issued from time
to time (i.e. permitted similarity index <=25%). (0% Similar in Turnitin)
Signature of the Research Scholar: …………………………… Date: 27.2.17
Name of Research Scholar: Ms. Ranjita Banerjee
Place : Vadodara
Signature of Supervisor: ……………………………… Date: 27.2.17
Name of Supervisor : Dr. Rajesh Khajuria
Place : Vadodara

vi
TURNITIN PLAGIARISM REPORT (Part-1: 0% SIMILAR)

vii
TURNITIN PLAGIARISM REPORT (Part-2: 0% SIMILAR)

viii
Annexure - VI
PhD THESIS NON-EXCLUSIVE LICENSE TO GUJARAT TECHNOLOGICAL UNIVERSITY
In consideration of being a PhD Research Scholar at GTU and in the interests of the
facilitation of research at GTU and elsewhere, I, Ranjita Banerjee, (bearing Enrollment
No.119997392045), hereby grant a non-exclusive, royalty free and perpetual license to
GTU on the following terms:
a) GTU is permitted to archive, reproduce and distribute my thesis, in whole or in part,
and/or my abstract, in whole or in part (referred to collectively as the “Work”) anywhere
in the world, for non-commercial purposes, in all forms of media;
b) GTU is permitted to authorize, sub-lease, sub-contract or procure any of the acts
mentioned in paragraph (a);
c) GTU is authorized to submit the Work at any National / International Library, under
the authority of their “Thesis Non-Exclusive License”;
d) The Universal Copyright Notice (©) shall appear on all copies made under the
authority of this license;
e) I undertake to submit my thesis, through my University, to any Library and Archives.
Any abstract submitted with the thesis will be considered to form part of the thesis.
f) I represent that my thesis is my original work, does not infringe any rights of others,
including privacy rights, and that I have the right to make the grant conferred by this non-
exclusive license.
g) If third party copyrighted material was included in my thesis for which, under the
terms of the Copyright Act, written permission from the copyright owners is required, I
have obtained such permission from the copyright owners to do the acts mentioned in
paragraph (a) above for the full term of copyright protection.

ix
h) I retain copyright ownership and moral rights in my thesis, and may deal with the
copyright in my thesis, in any way consistent with rights granted by me to my University
in this non-exclusive license.
i) I further promise to inform any person to whom I may hereafter assign or license my
copyright in my thesis of the rights granted by me to my University in this non-exclusive
license.
j) I am aware of and agree to accept the conditions and regulations of PhD including all
policy matters related to authorship and plagiarism.
Signature of the Research Scholar: __________________
Name of Research Scholar: Ms. Ranjita Banerjee
Date: 27.02.17 Place: Vadodara
Signature of Supervisor: __________________
Name of Supervisor: Dr. Rajesh Khajuria
Date: 27.02.17 Place: Vadodara
Seal:

x
Annexure - VII
THESIS APPROVAL FORM The viva-voce of the PhD Thesis submitted by Ms. Ranjita Banerjee (Enrollment No.
119997392045), entitled “A Study of Linkages between Human Resource
Management Practices and SMEs Performance in Vadodara District”, was
conducted on …………………….………….. (day and date) at Gujarat Technological
University.
(Please tick any one of the following option)
The performance of the candidate was satisfactory. We recommend that he/she
be awarded the PhD degree.
Any further modifications in research work recommended by the panel after 3
months from the date of first viva-voce upon request of the Supervisor or request of
Independent Research Scholar after which viva-voce can be re-conducted by the same
panel again.
The performance of the candidate was unsatisfactory. We recommend that he/she
should not be awarded the PhD degree.
(The panel must give justifications for rejecting the research work)
---------------------------------------------------
Name and Sign of Supervisor with Seal
---------------------------------------------------
1) External Examiner: Name and Sign
---------------------------------------------------
2) External Examiner: Name and Sign
---------------------------------------------------
3) External Examiner: Name and Sign
(briefly specify the modifications suggested by the panel)

xi
Annexure - VIII
ABSTRACT
“A Study of Linkages between Human Resource Management Practices
and SMEs Performance in Vadodara District”
Submitted By: Ms. Ranjita Banerjee, Asst. Professor, CKSV Institute of Management,
Vadodara
Supervised By: Dr. Rajesh Khajura, PhD-Management, Director- CKSV Institute of
Management, Vadodara
Keywords: SME, linkages, HRM practices, performance, employee outcomes,
organizational outcomes
.
Background: Micro, Small and Medium Enterprises (MSMEs) form the backbone of a
developing economy like India, in all spheres of development. It contributes 45% of
industrial output, 40% of exports. The sector produces over 8000 products varying
from traditional to hi-tech items employing about 59 million persons in over 26 million
units throughout the country. Total employment generated by the MSME sector is over
805 lac, representing around 40% of India’s workforce (MSME Annual Report 2014-15).
By promoting SMEs, India can target for inclusive growth by developing rural India
alongwith urban India. Thus, the researcher’s interest in taking up a study on SMEs.
Aim: Theories on Human Resource Management are often developed and tested in large
organizations. However, studies on HRM within SMEs occur less often. Heneman et al’s
(2000) study concludes that ‘the lack of information about human resources in SMEs is
problematic for theory, research and practice.’ Further, there are a number of studies that
conclude that there has been limited work done on HRM practices in the MSME sector
Heneman et al (2000). Vadodara being a manufacturing and industrial hub, is home to
many MSMEs. The lack of prior research in the SME sector motivated the researcher to
undertake a detailed study of the prevailing HRM practices in SMEs of Vadodara district,
and to find if there exists a linkage between HRM practices and performance of SMEs.

xii
Research Methodology: The research design of the study is a combination of
Descriptive as well as Exploratory Research. In the present study, Descriptive Research
design involved a pre-planned and structured design by way of quantitative analysis
through hypothesis testing and using the survey method through a one-to-one approach.
In the present study, a survey had been conducted through primary study of 126 SME
firms across the eight Industrial Estates of Vadodara district, comprising of 215
respondents. The 215 respondents in the study comprised of 83 owners (including
entrepreneurs, Directors, CEOs, Chairman, Proprietor, Partner) and 132 employees who
are Managing Heads like employees from senior management as well as HR Managers/
Supervisors/ Heads of Departments. Mann-Whitney Test, Kruskal-Wallis Test, Structural
Equation Modeling and other techniques have been used to analyze the linkages between
HR practices and SMEs performance. Additional information was gathered about the
real-life related aspects like the problems, challenges or concerns faced by the SME
sector as a part of the Exploratory Research to get into the insights of the problem. The
number of respondents for the open-ended questions was 45 Managing Heads.
Results and Discussion: As an outcome of the present study, linkages were found
between HRM practices and SMEs performance (Employee Outcomes & Organizational
Outcomes) in the Vadodara district. The various major HR practices, as well as problems
and challenges faced by the SMEs in the Vadodara district across the eight industrial
estates were found out.
Conclusion(s): This detailed research across the eight industrial estates of Vadodara
district showed linkages between HRM practices and performance of SMEs. The study
concludes by establishing that HR Practices positively and directly affects Organizational
Performance. It also concludes that Employee Outcomes positively and directly affects
Organizational Performance and that there exists covariance between HR Practices and
Employee Outcomes.
Scope of Future research: There is significant scope to broad-base this study across
SME hubs across the other leading districts of Gujarat as well as other States.

xiii
Annexure - IX
ACKNOWLEDGEMENT
‘Gratitude is the fairest blossom which springs from the soul’- Henry W Beecher
Om Ganpatay Namah…Feeling gratitude and not expressing it is like wrapping a
present and not giving it! In my PhD journey, a lot of people have helped me to
reach the level of PhD Thesis submission…and reach towards the end of the long
tedious journey. It is my privilege and opportunity to express my gratitude towards
each one of them.
Firstly, I express my deepest gratitude to my PhD guide Dr. Rajesh Khajuria,
Director, CKSV Institute of Management, whose continuous inspiring and
motivating words had kept me over the toes throughout the period. Thankyou Sir
for being a rock support during all the DPCs, Research Weeks and throughout the
period by giving various ideas to upgrade my entire PhD experience. I also take the
opportunity to thank Mrs. Bela Khajuria for always inspiring me.
Secondly, my deepest gratitude to my DPC Members, Dr. Satendra Kumar and
Dr. Dalpat Sarupria, for their expert guidance right from freezing the topic to the
final editing of the Thesis. Their constant guidance in the DPC and Research
Week helped me to design a road-map for the process. I salute the spirit of
knowledge-dissemination of respected Dr. Satendra Kumar Sir, who happens to
be my Guide’s guide…my privilege to have him as one of my DPC Members and
guiding so meticulously, throughout.
Next, I would like to say a BIG THANKYOU to my father Sh. Manoranjan
Barari (Banerjee), who accompanied me in each of the SMEs I visited during my
survey period of almost one year, as they were all different and new Industrial
Estates, and I knew no one. Thankyou baba for your patience and encouragement
throughout the period. I would like to thank my dear mother Mrs. Karobi Barari
(Banerjee) who would proudly say everyone that ‘…my daughter is doing

xiv
Docterate!’ Thankyou ma for being even more enthusiastic than me to complete
my PhD!
A BIG THANKYOU to my Big B, my elder brother, Mr. Ranjan Banerjee, for
his very scrupulous observation to improve my study. Thank you so much to teach
me so many things in Excel and Word so that my representation could be more
palatable and logical. A big thankyou to my dear sister-in-law
Ms. Romy Banerjee and my lovely niece Rishika Banerjee, to always enquire
from Mumbai about my progress. It encouraged me a lot!
Next, I express my deepest gratitude to all the SME owners and Managing
Heads who were my respondents and spared their valuable time to fill the five
page questionnaire as well as to interact with me. The study could not have
completed had you all not permitted me to undergo the survey. Hats off to the
attitude shown by the entire fraternity.
I would like to express my special THANKS to Dr. Dhaval Maheta and
Dr. Hitesh Parmar of South Gujarat University, for the Research workshops
conducted by them and the teachings shared by them, which helped to have a great
clarity of the entire Research Methodology, which earlier seemed to be very
complicated. My special THANKS to Dr. Sunita Sharma of M S University, who
had helped me a lot to enhance the HR perspective in my study. Thankyou!
I was privileged to have got the full support of the various industry Associations of
Vadodara…the DIC Office, VCCI Office as well as FSSI. My special thanks to
Sh. Nilesh Shukla and Sh. Antani of VCCI and Sh. Vinod Desai and
Sh. Chandrakant Jagtap of the FSSI Office to have given me the direction of the
various industrial estates to start my pilot-study. I express my deepest gratitude to
Mr. Hemal Vasavda, for converting the Questionnaire for employees in Gujrati
script, during the pilot-study, which was of great help.
I express my gratitude to my PhD batch-mates and peers, who started the PhD
together, and the way we helped and motivated each other…Mrs. Preeti Singhal,
Mrs. Savitha K, Mr. Sameer Rohadia and Mr. Prakash Patel. Thankyou…at

xv
last we all came towards the end of PhD! My gratitude to Dr. Kerav Pandya and
Dr. Kunjal Sinha, for their guidance. My gratitude to especially Mrs. Anjali
Bhadsavle, Mr. Hitesh Thakkar, Mr. Chetan Patel and Mrs. Reshma Mulye
for arranging the DPC Meetings throughout the five year period, as well as
maintaining all my PhD documents so carefully and for all the assistance during
the process. I would also like to thank all my students during the entire process of
PhD, with whom I shared my primary industry experiences.
I express my heartfelt gratitude to my Institute Shree Mahavir Jain Vidyalay
(SMJV) Trust which supported me throughout the process and gave a
Scholarship amount of Rs. 10,000/- to all the Research Scholars, who are
pursuing PhD under the PhD Research Centre, CKSVIM, headed by Dr.
Satendra Kumar. This was a great gesture shown by an educational institute and
Trust to motivate the Research Scholars. I am also deeply indebted to Gujarat
Technological University and the PhD Section in particular, for undergoing a
vigilant process of the PhD Program and for helping us to work with deadline. My
deepest indebtedness to my PhD Examiners for their meticulous evaluation.
Lastly, I thank the Almighty, Goddess Saraswati, Goddess Durga,
Bapa…without whose blessings I could never have completed my Thesis in the
present state. Please always bestow your blessings on me and my family always.
Lastly, I thank all, who have helped me directly or indirectly, and request them to
pardon me for not being able to mention the names separately, but who will always
be remembered and cherished. At the end, I would like to say ‘Micchaami
Dukdamm’, if knowingly or unknowingly I have hurt anyone during the process of
my study, I fervently request them to pardon me. The Acknowledgement pages
may have exceeded a little, but an extensive work like PhD, is not possible without
the help and blessings of many people…and not expressing it is like wrapping a
present and not giving it! I feel lucky to have been a part of this experience!
Thankyou All and Happy Reading! - Ranjita Banerjee

xvi
Annexure – X
List of Abbreviations ________________________________________________________________xxii
List of Tables ______________________________________________________________________ xxiii
List of Figures _____________________________________________________________________ xxix
Chapter – 1 __________________________________________________________________________ 1
Introduction, Definition Of Terms And Structure Of Thesis __________________________________ 1
1.1. Introduction __________________________________________________________________ 1 1.2. The Linkage Between HRM And Performance-Introduction ____________________________ 3 1.3. Significance Of The Study ______________________________________________________ 4 1.4. Definition Of Important Terminologies ____________________________________________ 5 1.5. Micro, Small & Medium Enterprises (MSMEs) ______________________________________ 5 1.6. Human Resource Management Practices ___________________________________________ 6 1.7. Firm’s Performance ___________________________________________________________ 7 1.8. Managing Heads ______________________________________________________________ 8 1.9. Structure Of The Thesis ________________________________________________________ 9
Chapter – 2 _________________________________________________________________________ 11
Micro, Small And Medium Enterprises-For Economic Stability And Inclusive Growth __________ 11
2.1. India’s Economy….The Background _____________________________________________ 11 2.2. MSME-For Economic Stability And Inclusive Growth _______________________________ 12 2.3. Some Important Statistical Inferences Related To SMEs ______________________________ 13 2.3.1. Contribution Of Manufacturing Output Of MSMEs In Gdp _________________________ 13 2.3.2. Trends In MSME Growth ____________________________________________________ 14 2.3.3. Leading Industries In MSME Sector ___________________________________________ 16 2.3.4. Distribution Of Working Enterprises By Area ____________________________________ 16 2.3.5. Nature Of Activity _________________________________________________________ 17 2.3.6. Fixed Assets In MSME Sector ________________________________________________ 18 2.3.7. Contribution Of MSMEs In Employment _______________________________________ 18 2.3.8. Gross Output In MSME Sector _______________________________________________ 19 2.4. MSMEs For Economic Stability And Growth ______________________________________ 20 2.5. Summary Of The Chapter ______________________________________________________ 21
Chapter – 3 _________________________________________________________________________ 22
MSMEs In Gujarat State-With Special Reference To Vadodara District ______________________ 22
3.1. Introduction _________________________________________________________________ 22 3.2. Growth Of MSMEs In Gujarat __________________________________________________ 23 3.2.1. Growth Of MSMEs Registration In Gujarat ______________________________________ 23 3.2.2. Distribution Of Clusters In Major Product Lines In The State ________________________ 25 3.3. MSME And Gujarat State Industrial Policy 2015 ____________________________________ 26
TABLE OF CONTENTS

xvii
3.3.1. MSME Support Through Gujarat Industrial Policy 2015: Thrust Areas ________________ 26 3.3.2. Promotional Schemes For The MSME Sector In Gujarat ___________________________ 28 3.4. Vadodara- The Gateway To The Golden Corridor ___________________________________ 29 3.5. MSMEs In Vadodara District ___________________________________________________ 30 3.5.1. Growth Of MSMEs In Vadodara District- An Analysis _____________________________ 31 3.5.2. Problems In The SME Sector In Vadodara District ________________________________ 32 3.6. Summary Of The Chapter ______________________________________________________ 34
Chapter – 4 _________________________________________________________________________ 35
Functional Areas SMEs With Special Reference To HR Function ____________________________ 35
4.1. Prologue ___________________________________________________________________ 35 4.2. Human Resource Management In Small Businesses _________________________________ 35 4.2.1. HRM As A Multi-Faceted Process In SMEs _____________________________________ 35 4.2.2. HRM Practices In A Small Business ___________________________________________ 36 4.2.3. Industrial Relations And Labour Laws __________________________________________ 37 4.3. Financial Management In Small Business _________________________________________ 38 4.3.1. Sources Of Finance For Small-Scale Sector ______________________________________ 38 4.3.2. Institutional Support Structure ________________________________________________ 39 4.4. Marketing Management In Small Businesses _______________________________________ 40 4.4.1. Common Marketing Problems Faced By Small Businesses __________________________ 40 4.4.2. Institutionalized Marketing For Small Business Entrepreneurs _______________________ 41 4.4.3. E-Marketing For Small Businesses ____________________________________________ 41 4.5. Production And Operations Management In Small Businesses _________________________ 42 4.5.1. Materials Management ______________________________________________________ 42 4.5.2. Inventory Management ______________________________________________________ 42 4.5.3. Total Quality Management (Tqm) _____________________________________________ 43 4.6. Summary Of The Chapter ______________________________________________________ 44
Chapter – 5 _________________________________________________________________________ 45
MSMED Act, 2006 & New Policy Initiatives In The SME Sector _____________________________ 45
5.1. Prologue ___________________________________________________________________ 45 5.2. Objectives Of The MSMEd Act, 2006 ____________________________________________ 45 5.3. MSME Defined Under The Act And Organizational Set-Up ___________________________ 46 5.4. National Board For Micro, Small And Medium Enterprises –NBMSME _________________ 47 5.5. National Institute For Micro, Small And Medium Enterprises (Ni-MSME) _______________ 47 5.6. National Small Industries Corporation (Nsic) Limited ________________________________ 48 5.7. Initiatives Undertaken By The Ministry Of MSME In The Recent Years _________________ 48 5.8. E-Governance Initiatives / Digital Initiatives _______________________________________ 52 5.9. Micro, Small & Medium Enterprises Development (Amendment) Bill, 2015 ______________ 53 5.10. Summary Of The Chapter ______________________________________________________ 53
Chapter – 6 _________________________________________________________________________ 55
Review Of Literature _________________________________________________________________ 55
6.1. Prelude ____________________________________________________________________ 55 6.2. SMEs And The HR Scenario – Literature Review ___________________________________ 56 6.2.1. Literature From Journals ____________________________________________________ 56 6.2.2. Literature From Books / Published Reports ______________________________________ 59 6.2.3. Literature From Thesis ______________________________________________________ 62

xviii
6.3. HRM Practices And SMEs Performance – Literature Review __________________________ 63 6.3.1. Literature From Journals ____________________________________________________ 63 6.3.2. Literature From Books / Published Reports ______________________________________ 69 6.3.3. Literature From Thesis ______________________________________________________ 70 6.4. Summary Of The Chapter- Identifying The Research Gaps ____________________________ 73
Chapter – 7 _________________________________________________________________________ 74
Research Methodology ________________________________________________________________ 74
7.1. State Of The Art Of The Research: A Brief Overview _______________________________ 74 7.2. Rationale Of The Study/ Research Gap ___________________________________________ 75 7.3. Problem Statement ___________________________________________________________ 77 7.4. Research Questions ___________________________________________________________ 77 7.5. Objectives Of The Study _______________________________________________________ 77 7.6. Significance Of The Study _____________________________________________________ 78 7.7. Research Design _____________________________________________________________ 79 7.8. Research Approach ___________________________________________________________ 79 7.9. Sources Of Data _____________________________________________________________ 80 7.10. Method For Selecting/ Approaching The Sample ____________________________________ 80 7.11. Research Instrument – Overview Of The Questionnaire Based Study (Content Validity) _____ 83 7.12. Definition Of Variables________________________________________________________ 83 7.13. Hypothesized Model __________________________________________________________ 85 7.14. Research Hypotheses _________________________________________________________ 86 7.15. Time Period Of The Survey ____________________________________________________ 88 7.16. Scale And Research Techniques _________________________________________________ 89 7.17. Statistical Analysis And Packages _______________________________________________ 89 7.18. Summary Of The Chapter ______________________________________________________ 89
Chapter – 8 _________________________________________________________________________ 91
Quantitative Data Analysis And Interpretation ___________________________________________ 91
8.1. Prelude ____________________________________________________________________ 91 8.2. Descriptive Statistics- Demographic Characteristics _________________________________ 93 8.2.1. Industrial Estate ___________________________________________________________ 93 8.2.2. Size Of The Firm __________________________________________________________ 94 8.2.3. Designation Of Respondents _________________________________________________ 96 8.2.4. Age Of The Respondents ____________________________________________________ 97 8.2.5. Gender Of The Respondents __________________________________________________ 98 8.2.6. Educational Background_____________________________________________________ 99 8.2.7. Specialization Of Managing Heads ___________________________________________ 100 8.3. Descriptive Statistics- Frequency Distribution Of HR Activities _______________________ 105 8.3.1. Our Firm Has Some Written Documentation Of HR Policies _______________________ 105 8.3.2. The Person Who Handles HR Functions _______________________________________ 106 8.3.3. Does Your Firm Take Guidance From HR Consultant? ____________________________ 107 8.3.4. Does Your Firm Take Guidance From Financial Consultant? _______________________ 108 8.3.5. How Often Does The Firm Consult An HR Consultant ____________________________ 109 8.3.6. How Often Does The Firm Consult A Financial Consultant ________________________ 110 8.3.7. Possessing A Quality Or Iso Certification ______________________________________ 111 8.3.8. Registration With Any Trade Union ___________________________________________ 112 8.3.9. Achievement Of Expected Levels Of Growth ___________________________________ 113

xix
8.3.10. Number Of Full Time Employees (Binned) _____________________________________ 113 8.3.11. Number Of Part-Time Employees (Binned) _____________________________________ 114 8.3.12. Number Of Contractual Employees (Binned) ___________________________________ 115 8.3.13. Number Of Women Employees (Binned) ______________________________________ 116 8.4. Descriptive Statistics Of Scale Items ____________________________________________ 117 8.4.1. Cronbach’s Reliability Test _________________________________________________ 117 8.4.2. Mean & Standard Deviation (Of Scale Items) ___________________________________ 118 8.5. Descriptive Statistics For Multiple Response Questions _____________________________ 120 8.5.1. Sources Of Recruitment: Multiple Response Frequencies __________________________ 120 8.5.2. Methods Of Selection: Multiple Response Frequencies ____________________________ 121 8.5.3. Basis Of Pay: Multiple Response Frequencies ___________________________________ 122 8.5.4. Welfare Measures/ Social Security Measures: Multiple Response Frequencies _________ 122 8.5.5. Performance Assessment Method: Multiple Response Frequencies __________________ 123 8.5.6. Use Of Performance Assessment: Multiple Response Frequencies ___________________ 123 8.5.7. Training Method: Multiple Response Frequencies ________________________________ 124 8.6. Cross-Tabulation For Multiple Response Questions ________________________________ 125 8.6.1. Cross-Tabulation: Sources Of Recruitment And Selection Methods (Multiple Responses) 125 8.6.2. Cross-Tabulation: Performance Assessment Method And Use Of Performance Appraisal _ 127 8.6.3. Cross-Tabulation: Age Of The Firm And Documentation Of HR Practice _____________ 128 8.7. Chi-Square Test On Cross-Tabulation ___________________________________________ 129 8.7.1. Cross-Tabulation & Chi-Square Test: Type Of Firm And Documentation Of HR Practice 130 8.7.2. Cross-Tabulation & Chi-Square Test: Size Of Firm And Documentation Of HR Practice _ 132 8.7.3. Cross-Tab And Chi-Square: Quality/ Iso Certification And Documentation ___________ 135 8.7.4. Cross-Tab & Chi-Square: Person Who Handles HR Functions And Documentation Of HR 137 8.7.5. Cross-Tabulation: Person Who Handles HR Functions And Size Of Firm _____________ 139 8.8. Mann-Whitney Test _________________________________________________________ 141 8.8.1. Mann-Whitney Test For Gender Of Respondent And HR Practices __________________ 141 8.8.2. Mann-Whitney Test For Quality/ Iso Certification And HR Practices _________________ 145 8.8.3. Mann-Whitney Test For Quality/ Iso Certification And Organizational Outcomes _______ 148 8.8.4. Mann-Whitney Test For Presence Of An Internal HR Person On HR Practices _________ 151 8.8.5. Mann-Whitney Test For Presence Of An Internal HR Person And Employee Outcomes __ 155 8.8.6. Mann-Whitney For Presence Of An Internal HR Person And Organizational Outcomes __ 157 8.8.7. Mann-Whitney Test For Size Of Firm And HR Practices __________________________ 160 8.8.8. Mann-Whitney Test For Size Of Firm And Employee Outcomes ____________________ 163 8.8.9. Mann-Whitney Test For Size Of Firm And Organizational Outcomes ________________ 165 8.8.10. Mann-Whitney Test For Number Of Women Employees And HR Practices In The SMEs 168 8.9. Kruskal-Wallis Test _________________________________________________________ 172 8.9.1. Kruskal-Wallis Test For Age Of The Respondents And HR Practices ________________ 172 8.9.2. Kruskal-Wallis Test For Age Of The Respondents And Employee Outcomes __________ 176 8.9.3. Kruskal-Wallis Test For Age Of The Respondents And Organizational Outcomes _______ 180 8.9.4. Kruskal-Wallis Test For Number Of Years Of Service In The Firm And HR Practices ___ 183 8.9.5. Kruskal-Wallis For Total Years Of Work-Experience Of Respondents And HR Practices _ 187 8.9.6. Kruskal-Wallis Test For Educational Background Of Respondents And HR Practices ____ 192 8.9.7. Kruskal-Wallis For Educational Background Of Respondents And Org Outcomes ______ 196 8.9.8. Kruskal-Wallis Test For Specialization In Education Of Respondents And HR Practices _ 199 8.9.9. Kruskal-Wallis For Specialization In Education Of Respondents And EO _____________ 205 8.9.10. Kruskal-Wallis For Specialization In Education Of Respondents And Org Outcomes ____ 208 8.9.11. Kruskal-Wallis Test For Type Of Firm And HR Practices __________________________ 211 8.9.12. Kruskal-Wallis Test For Type Of Firm And Employee Outcomes ___________________ 216

xx
8.9.13. Kruskal-Wallis Test For Type Of Firm And Organizational Outcomes ________________ 220 8.9.14. Kruskal-Wallis Test For Age Of The Firm And HR Practices _______________________ 223 8.9.15. Kruskal-Wallis Test For Age Of The Firm And Employee Outcomes _________________ 227 8.9.16. Kruskal-Wallis Test For Age Of The Firm And Organizational Outcomes _____________ 230 8.9.17. Kruskal-Wallis Test For Nature Of The Industry And HR Practices __________________ 233 8.9.18. Kruskal-Wallis Test For Nature Of The Industry And Employee Outcomes ____________ 237 8.9.19. Kruskal-Wallis Test For Nature Of The Industry And Organizational Outcomes ________ 241 8.9.20. Kruskal-Wallis Test For Total Employee Strength And HR Practices _________________ 244 8.9.21. Kruskal-Wallis Test For Total Employee Strength And Employee Outcomes __________ 247 8.9.22. Kruskal-Wallis Test For Total Employee Strength And Organizational Outcomes _______ 250 8.9.23. Kruskal-Wallis Test For Total Number Of Contract Employees And HR Practices ______ 253 8.9.24. Kruskal-Wallis Test For Total Number Of Contract Employees And Employee Outcomes 256 8.9.25. Kruskal-Wallis For Total Number Of Contract Employees And Organizational Outcomes 259 8.9.26. Kruskal-Wallis Test For Total Number Of Women Employees And HR Practices _______ 262 8.9.27. Kruskal-Wallis Test For Industrial Estate And HR Practices ________________________ 265 8.9.28. Kruskal-Wallis Test For Industrial Estate And Employee Outcomes _________________ 271 8.9.29. Kruskal-Wallis Test For Industrial Estate And Organizational Outcomes ______________ 275 8.10. Factor Analysis _____________________________________________________________ 279 8.10.1. Scree Plot _______________________________________________________________ 283 8.10.2. Naming Of Factors ________________________________________________________ 286 8.11. Regression Analysis _________________________________________________________ 288 8.12. Structural Equation Modeling (Sem) ____________________________________________ 291 8.12.1. Base Model ______________________________________________________________ 292 8.12.2. First Modfication [E12<-->E13] _____________________________________________ 316 8.12.2.1. Model Fit Summary _____________________________________________________ 333 8.12.3. Second Modification [E30<->E31] ___________________________________________ 336 8.12.3.1. Parameter Summary _____________________________________________________ 336 8.12.3.2. Model Fit Summary _____________________________________________________ 351 8.12.3.3. Parsimony Adjusted Measures _____________________________________________ 352 8.12.4. Third Modification [E1<-->E2] ______________________________________________ 354 8.12.4.1. Parameter Summary (Third Modification) ____________________________________ 354 8.12.4.2. Model Fit Summary (Third Modification) ____________________________________ 369 8.12.4.3. Parsimony Adjusted Measures _____________________________________________ 370 8.12.5. Summary Of Structural Equation Modeling _____________________________________ 372
Chapter – 9 ________________________________________________________________________ 374
Problems And Challenges Identified Through Interviews & Interactions _____________________ 374
9.1. Prelude ___________________________________________________________________ 374 9.2. The Methodology – Through Semi-Structured Interviews And Open-Ended Questions _____ 374 9.3. Summary Of The Chapter _____________________________________________________ 379
Chapter – 10 _______________________________________________________________________ 381
Findings & Discussions ______________________________________________________________ 381
10.1. Prelude ___________________________________________________________________ 381 10.2. Tabular Presentation Of Major Findings And Discussion ____________________________ 381 10.3. Major Findings And Discussions Of The Study ____________________________________ 392 10.4. Summary Of The Chapter _____________________________________________________ 403

xxi
Chapter – 11 _______________________________________________________________________ 404
Recommendations, Limitations And Conclusions _________________________________________ 404
11.1. Introduction ________________________________________________________________ 404 11.2. Major Recommendations From The Study ________________________________________ 404 11.2.1. Recommendations To SME Owners And Managing Heads _________________________ 404 11.2.2. Recommendations To Government And Industry Associations ______________________ 406 11.2.3. Recommendations To Academia And Industry __________________________________ 407 11.3. Limitations Of The Study _____________________________________________________ 408 11.4. Future Scope For Research ____________________________________________________ 409 11.5. Conclusion ________________________________________________________________ 409
List of References ___________________________________________________________________ 411
List of Publications _________________________________________________________________ 426
Brief Profile of Author ______________________________________________________________ 428

xxii
Annexure - XI
LIST OF ABBREVIATIONS
Abbreviations Full-Forms
MSME Micro, Small & Medium Enterprises MSMED Act Micro, Small & Medium Enterprises Development Act
GDP Gross Domestic Product MoSPI Ministry of Statistics and Programme Implementation SEM Structural Equation Modeling CSO Central Statistics Office EM Entrepreneurs Memorandum
MSEFC MSE-Facilitation Council VCCI Vadodara Chamber of Commerce and Industry GCCI Gujarat Chamber of Commerce and Industry FSSI Federation of Small Scale Industries ERP Enterprise Resource Planning
DMIC Delhi-Mumbai Industrial Corridor PSU Public-Sector Unit MSE Medium Scale entrepreneurs SIDC State Industrial Development Corporations NSIC National Small Industries Corporation SIDO Small Industries Development Organization SIDBI Small Industries Development Bank of India SEZ Special Economic Zones

xxiii
Annexure - XII
Table 1.1 - Micro, Small and Medium Enterprises Defined ______________________________________ 6
Table 2.1- Contribution of MSMEs In Manufacturing Output & GDP ____________________________ 13
Table 3.1 - Growth in registrations of MSMEs ______________________________________________ 23
Table 3.2 - District-wise Number of MSMEs in Gujarat _______________________________________ 24
Table 3.3 - Distribution of Clusters In Major Product Lines in Gujarat ____________________________ 25
Table 3.4 - Number of MSMEs in the Vadodara District as per the FSSI Directory __________________ 30
Table 3.5 - Micro & Small Enterprises And Artisan Units in Vadodara District _____________________ 31
Table 3.6 - Progress & Growth in Registration of MSME in Vadodara District during 2006-2014 ______ 32
Table 5.1 - Micro, Small and Medium Enterprises Defined _____________________________________ 46
Table 7.1 - Sample Distribution & Bifurcation ______________________________________________ 82
Table 7.2 - Distribution of Samples across Industrial Estates ___________________________________ 82
Table 7.3 - Overview of Independent, Dependent and Control Variables __________________________ 84
Table 8.1 - Achievements With Respect To Objectives _______________________________________ 92
Table 8.2 - Frequencies of Industrial Estates _______________________________________________ 93
Table 8.3- Size of the Firm _____________________________________________________________ 94
Table 8.4 - Designation of Respondents ___________________________________________________ 96
Table 8.5- Age of the Respondents ______________________________________________________ 97
Table 8.6- Gender of the Respondents ____________________________________________________ 98
Table 8.7- Educational Background ______________________________________________________ 99
Table 8.8- Specialization of Managing Heads _____________________________________________ 100
Table 8.10 - Years of Service in the Firm _________________________________________________ 101
Table 8.11 - Total Work Experience _____________________________________________________ 102
Table 8.12 - Type of Firm _____________________________________________________________ 103
Table 8.13 - Age of the Firm ___________________________________________________________ 104
Table 8.14: Written Documentation of HR Policies __________________________________________ 105
Table 8.15 - The Person handling HR Functions ____________________________________________ 106
Table 8.16 - Taking Guidance From HR Consultant _________________________________________ 107
Table 8.17 -Taking Guidance from Financial Consultant _____________________________________ 108
Table 8.18: Frequency of Consulting an HR Consultant ______________________________________ 109
Table 8.19 - Frequency of Consulting a Financial Consultant __________________________________ 110
Table 8.20 - Possessing a Quality or ISO Certification _______________________________________ 111
Table 8.21 - Registration with Any Trade Union ____________________________________________ 112
LIST OF TABLES

xxiv
Table 8.22 - Achieved Expected Levels of Growth __________________________________________ 113
Table 8.23 - Number of Full Time Employees (Binned) ______________________________________ 114
Table 8.24 - Number of Part-Time Employees (Binned) ______________________________________ 114
Table 8.25 - Number of Contractual Employees (Binned) _____________________________________ 115
Table 8.26-Number of Women Employees (Binned) _________________________________________ 116
Table 8.27 - Cronbach Alpha Values for Scale Items ________________________________________ 117
Table 8.28 - Mean, Standard Deviation & Cronbach’s Alpha _________________________________ 118
Table 8.29 - Sources of Recruitment _____________________________________________________ 121
Table 8.30 - Methods of Selection _______________________________________________________ 121
Table 8.31 - Basis of Pay ______________________________________________________________ 122
Table 8.32- Welfare Measures/ Social Security Measures _____________________________________ 123
Table 8.33- Performance Assessment Method ______________________________________________ 123
Table 8.34-Use of Performance Assessment _______________________________________________ 124
Table 8.36- Cross-Tabulation: Sources of Recruitment and Selection Methods ____________________ 126
Table 8.37 - Cross-Tabulation: PA Method and Use of Performance Appraisal ____________________ 127
Table 8.38 - Cross-Tabulation: Age of the Firm and Documentation of HR Practice ________________ 128
Table 8.39- Cross-Tabulation: Type of Firm and Documentation of HR Practice ___________________ 130
Table 8.40 - Chi-Square Test (Cross-Tab: Type of Firm and Documentation of HR Practice) ________ 131
Table 8.41: Cross-Tabulation- Size of Firm and Documentation of HR Practice ___________________ 133
Table 8.42- Chi-Square Test (Cross-Tab: Size Of Firm And Documentation Of HR Practice) _________ 134
Table 8.43- Cross-Tabulation: Quality/ ISO Certification and Documentation of HR Practice ________ 135
Table 8.44 - Chi-Square Test: Quality/ ISO Certification and Documentation of HR Practice _________ 136
Table 8.45: Cross-Tabulation - Person handling HR Functions and Documentation of HR Practice ___ 137
Table 8.46 - Chi-Square: Person who Handles HR Functions and Documentation of HR Practice ______ 138
Table 8.47 - Cross-Tabulation: Person Who Handles HR Functions and Size of Firm _______________ 139
Table 8.48-Chi-Square Test: Person Who Handles HR Functions and Size of Firm _________________ 140
Table 8.49 - Ranks- Mann-Whitney Test for Gender of Respondent and HR Practices ______________ 142
Table 8.50 (a, b, c & d) - Test Statistics - Mann-Whitney for Respondent and HR Practices __________ 143
Table 8.51 - Mean-Ranks: Mann-Whitney Test for Quality/ ISO Certification and HR Practices ______ 145
Table 8.52 - Test Statisticsa for Quality/ ISO Certification and HR Practices ______________________ 147
Table 8.53 - Mean-Ranks: Mann-Whitney Test for Quality/ ISO Certification and Org Outcomes _____ 149
Table 8.54 - Test Statistics a: Mann-Whitney for Quality/ ISO Certification and Org Outcomes _______ 150
Table 8.55 -Mean-Ranks: Mann-Whitney for Presence of an Internal HR Person on HR Practices _____ 152
Table 8.56 - Test Statistics a : Mann-Whitney for Presence of an Internal HR Person on HR Practices __ 153
Table 8.57 -Mean-Ranks: Mann-Whitney for Presence of an Internal HR Person and Emp Outcomes __ 155
Table 8.58 - Test Statisticsa: MW Test for Presence of an Internal HR Person and EO_______________ 156
Table 8.59 - Mean-Ranks: MW Test for Presence of an Internal HR Person and Org Outcomes _______ 158

xxv
Table 8.60 - Test Statisticsa: MW Test for Presence of an Internal HR Person and Org Outcomes ______ 159
Table 8.61-Mean- Ranks: Mann-Whitney Test for Size of Firm and HR Practices __________________ 160
Table 8.62 -Test Statisticsa: Mann-Whitney Test for Size of Firm and HR Practices ________________ 162
Table 8.63 - Mean-Ranks: Mann-Whitney Test for Size of Firm on Employee Outcomes ___________ 163
Table 8.64 - Test Statisticsa: Mann-Whitney Test for Size of Firm on Employee Outcomes __________ 164
Table 8.65 - Mean-Ranks: Mann-Whitney Test for Size of Firm and Organizational Outcomes _______ 166
Table 8.66 -Test Statisticsa: Mann-Whitney Test for Size of Firm and Organizational Outcomes ______ 167
Table 8.67 - Mean-Ranks: MWTest for No. of Women Employees and HR Practices in the SMEs ____ 168
Table 8.68 - Test Statisticsa : MW Test for No. of Women Employees and HR Practices in the SMEs __ 169
Table 8.69 Mean-Ranks: Kruskal-Wallis Test for Age of the respondents and HR Practices _________ 172
Table 8.70 - Test Statisticsab: Kruskal-Wallis Test for Age of the respondents and HR Practices ______ 175
Table 8.71 - Mean-Ranks: KW Test for Age of the Respondents and Employee Outcomes __________ 177
Table 8.72 - Test Statisticsab: KW Test for Age of the Respondents and Employee Outcomes ________ 178
Table 8.73 -Mean-Ranks: KW Test for Age of the Respondents and Organizational Outcomes _______ 180
Table 8.74 - Test Statisticsab: KW Test for Age of the Respondents and Organizational Outcomes ____ 182
Table 8.75 - Mean-Ranks: KW Test for Number of Years of Service in the Firm on HR Practices _____ 183
Table 8.76 - - Test Statisticsab: KWTest for Number of Years of Service in the Firm on HR Practices __ 186
Table 8.77 - Mean-Ranks: KW Test for Total Years of Work-Experience and HR Practices _________ 188
Table 8.78 - Test Statisticsab: KW Test for Total Years of Work-Experience and HR Practices _______ 190
Table 8.79 - Mean-Ranks: KW Test for Educational Background of Respondents and HR Practices ___ 192
Table 8.80 - Test Statisticsab: KW Test for Edu. Background of Respondents and HR Practices _______ 195
Table 8.81 - Mean-Ranks: KW Test for Edu. Background of Respondents and Org. Outcomes _______ 196
Table 8.82 - Test Statisticsab: KW Test for Edu. Background of Respondents and Org. Outcomes _____ 198
Table 8.83 - Mean-Ranks: KW Test for Specialization in Edu. of Respondents and HR Practices _____ 199
Table 8.84 - Test Statisticsab: KW Test for Specialization in Edu. of Respondents and HR Practices ___ 202
Table 8.85 - Mean-Ranks: KW Test for Specialization in Education of Respondents and EO _________ 205
Table 8.86- Test Statisticsab: KW Test for Specialization in Education of Respondents and EO _______ 207
Table 8.87 - Mean-Ranks: KW Test for Specialization in Edu. of Respondents and Org. Outcomes____ 208
Table 8.88 - Test Statisticsab: KW Test for Specialization in Edu. of Respondents and Org. Out. ______ 210
Table 8.89 - Mean-Ranks: Kruskal-Wallis Test for Type of Firm and HR Practices ________________ 212
Table 8.90 - Test Statisticsab: Kruskal-Wallis Test for Type of Firm and HR Practices ______________ 214
Table 8.91 - Mean-Ranks: Kruskal-Wallis Test for Type of Firm and Employee Outcomes _________ 216
Table 8.92 - Test Statisticsab: Kruskal-Wallis Test for Type of Firm and Employee Outcomes ________ 218
Table 8.93 - Mean-Ranks: Kruskal-Wallis Test for Type of Firm and Organizational Outcomes ______ 220
Table 8.94 - Test Statisticsab: Kruskal-Wallis Test for Type of Firm and Organizational Outcomes ____ 222
Table 8.95 - Mean-Ranks: K-Wallis Test for Age of the Firm and HR Practices ___________________ 223
Table 8.96 - Test Statisticsab: Kruskal-Wallis Test for Age of the Firm and HR Practices ____________ 226

xxvi
Table 8.97 - Mean-Ranks: Kruskal-Wallis Test for Age of the Firm and Employee Outcomes ________ 228
Table 8.98 - Test Statisticsab: Kruskal-Wallis Test for Age of the Firm and Employee Outcomes ______ 229
Table 8.99 - Mean-Ranks: Kruskal-Wallis Test for Age of the Firm and Organizational Outcomes ____ 230
Table 8.100 - Test Statisticsab: KW Test for Age of the Firm and Organizational Outcomes __________ 232
Table 8.101 - Mean-Ranks: Kruskal-Wallis Test for Nature of the Industry and HR Practices ________ 233
Table 8.102 - Test Statisticsab: Kruskal-Wallis Test for Nature of the Industry and HR Practices ______ 236
Table 8.103 - Mean-Ranks: KW Test for Nature of Industry and Emp. Outcomes _________________ 238
Table 8.104 - Test Statisticsab: KW Test for Nature of the Industry and Employee Outcomes _________ 240
Table 8.105 - Mean-Ranks: KW Test for Nature of the Industry and Organizational Outcomes _______ 241
Table 8.106 - Test Statisticsab: KW Test for Nature of the Industry and Organizational Outcomes _____ 243
Table 8.107 - Mean-Ranks: Kruskal-Wallis Test for Total Employee Strength and HR Practices ______ 244
Table 8.108 - Test Statisticsab: Kruskal-Wallis Test for Total Employee Strength and HR Practices ____ 246
Table 8.109 - Mean-Ranks: KW Test for Total Employee Strength and Employee Outcomes ________ 248
Table 8.110 - Mean-Ranks: KW Test for Total Employee Strength and Employee Outcomes ________ 249
Table 8.111 - Mean-Ranks: KW Test for Total Employee Strength and Organizational Outcomes _____ 251
Table 8.112 - Test Statisticsab: KW Test for Total Employee Strength and Organizational Outcomes __ 252
Table 8.113 - Mean-Ranks: KW Test for Total number of Contractual Employees on HR Practices ___ 253
Table 8-114- Test Statisticsab: KW Test for Total No. of Contractual Employees on HR Practices _____ 255
Table 8.115 - Mean-Ranks: KW Test for Total No.of Contractual Employees onEO _______________ 257
Table 8.116 - Test Statisticsab: KW Test for Total Number of Contractual Employees on EO _________ 258
Table 8.117 - Mean-Ranks: KW Test for Total No. of Contractual Employees on Org. Outcomes 259
Table 8-118 - Test Statisticsab: KW Test for Total No.of Contractual Employees on Org. Outcomes ___ 260
Table 8.119 - Mean-Ranks: KW Test for Total Number of Women Employees and HR Practices _____ 262
Table 8.120- Test Statisticsab: KW Test for Total Number of Women Employees and HR Practices ___ 264
Table 8.121 - Mean-Ranks: K-Wallis Test for Industrial Estate and HR Practices __________________ 266
Table 8.122- Test Statisticsab: Kruskal-Wallis Test for Industrial Estate and HR Practices ___________ 269
a. Kruskal Wallis Test b. Grouping Variable: ESTATE ______________________________________ 269
Table 8.123- Mean-Ranks: Kruskal-Wallis Test for Industrial Estate and Employee Outcomes _______ 271
Table 8.124- Test Statisticsab: Kruskal-Wallis Test for Industrial Estate and Employee Outcomes _____ 273
Table 8.125- Mean-Ranks: Kruskal-Wallis Test for Industrial Estate and Organizational Outcomes ___ 275
Table 8.126- Test Statisticsab: K-W Test for Industrial Estate and Org. Outcomes__________________ 277
Table 8.127- KMO and Bartlett's Test ___________________________________________________ 279
Table 8.128- Communalities ___________________________________________________________ 280
Table 8.129- Total Variance Explained ___________________________________________________ 281
Table 8.130- Total Variance Explained (Rotated) ___________________________________________ 282
Table 8.131- Component Matrixa _______________________________________________________ 284
Table 8.132- Rotated Component Matrixa _________________________________________________ 285

xxvii
Table 8.133- Identification and Naming of the Factors _______________________________________ 286
Table 8.134- Component Transformation Matrix ___________________________________________ 287
Table 8.135- Variables Entered/Removedb ________________________________________________ 288
Variables Removed __________________________________________________________________ 288
Table 8.136- Model Summary __________________________________________________________ 288
Table 8.137-ANOVAb ________________________________________________________________ 289
Table 8.138A - Coefficientsa ___________________________________________________________ 289
Table 8.138B- Coefficientsa ___________________________________________________________ 289
Table 8.139 - Relation between Constructs ________________________________________________ 293
Table 8.140 - Parameter Summary ______________________________________________________ 293
Table 8.141 - SEM Output for Estimates, Standard Errors and P-Value__________________________ 294
Table 8.142 - Standardized Regression Weights: (Group number 1 - Default model) _______________ 295
Table 8.143 - Covariances: (Group number 1 - Default model) ________________________________ 296
Table 8.144 - Correlations: (Group number 1 - Default model) ________________________________ 296
Table 8.145 - Variances: (Group number 1 - Default model) __________________________________ 297
Table 8.146 - Modification Indices (Group number 1 - Default model) __________________________ 298
Table 8.147 - Variances: (Group number 1 - Default model) __________________________________ 302
Table 8.148 - Regression Weights: (Group number 1 - Default model) __________________________ 302
Table 8.149 - Model Fit Summary (CMIN) _______________________________________________ 308
Table 8.150 - Root Mean Square (RMR) and GFI __________________________________________ 309
Table 8.151 - Baseline Comparisons _____________________________________________________ 310
Table 8.152 - Parsimony-Adjusted Measures ______________________________________________ 312
Table 8.153 - Non Centrality Parameter (NCP) ____________________________________________ 312
Table 8.154 - FMIN _________________________________________________________________ 313
Table 8.155 - Root Mean Square Error of Approximation (RMSEA) ___________________________ 313
Table 8.156 - Akaike’s Information Criterion (AIC) ________________________________________ 314
Table 8.157 - Expected Cross-Validation Index (ECVI) _____________________________________ 314
Table 8.158 - HOELTER _____________________________________________________________ 315
Table 8.159 - Parameter Summary (Group number 1) _______________________________________ 316
Table 8.160 - Standard Error, CR and P Table _____________________________________________ 318
Table 8.161 - Standard Error, CR and P Table _____________________________________________ 319
Table 8.162 - Standardized Regression Weights: ___________________________________________ 320
(Group number 1 - Default model) _______________________________________________________ 320
Table 8.163 - Covariances: (Group number 1 - Default model) ________________________________ 321
Table 8.164 - Correlations: (Group number 1 - Default model) ________________________________ 321
Table 8.165 - Variances: (Group number 1 - Default model) _________________________________ 321
Table 8.166 - Modification Indices (Group number 1 - Default model) _________________________ 322

xxviii
Table 8.167 - Variances: (Group number 1 - Default model) _________________________________ 326
Table 8.168 - Regression Weights: (Group number 1 - Default model) _________________________ 326
Table 8.169 - CMIN ________________________________________________________________ 333
Table 8.170 -RMR, GFI ______________________________________________________________ 333
Table 8.171 -Baseline Comparisons _____________________________________________________ 333
Table 8.172 -Parsimony-Adjusted Measures _______________________________________________ 333
Table 8.173 -NCP ___________________________________________________________________ 334
Table 8.174 - FMIN _________________________________________________________________ 334
Table 8.175 - RMSEA ________________________________________________________________ 334
Table 8.176 - AIC ___________________________________________________________________ 334
Table 8.177 - ECVI __________________________________________________________________ 335
Table 8.178 - HOELTER _____________________________________________________________ 335
Table 8.179 - Parameter Summary (Group number 1) _______________________________________ 336
Table 8.180 -Estimates, Standard Error and P-Values _______________________________________ 337
Table 8.181 -Standardized Regression Weights: (Group number 1 - Default model) ________________ 338
Table 8.182 -Covariances: (Group number 1 - Default model) _________________________________ 339
Table 8.183 – Correlations: (Group number 1 - Default model) ________________________________ 339
Table 8.184– Variances: (Group number 1 - Default model) __________________________________ 340
Table 8.185– Modification Indices (Group number 1 - Default model) __________________________ 341
Table 8.186– Variances: (Group number 1 - Default model) __________________________________ 344
Table 8.187 - Regression Weights: (Group number 1 - Default model) __________________________ 345
Table 8.188 - Model Fit Summary ______________________________________________________ 351
Table 8.189 - Parsimony Adjusted Measures ______________________________________________ 352
Table 8.190 - Parameter summary (Group number 1) ________________________________________ 354
Table 8.191 - Estimates, Standard Error & P Value _________________________________________ 355
Table 8.192 - Standardized Regression Weights: (Group number 1 - Default model) _______________ 356
Table 8.193 - Covariances: (Group number 1 - Default model) ________________________________ 357
Table 8.194 - Correlations: (Group number 1 - Default model) ________________________________ 358
Table 8.195 - Variances: (Group number 1 - Default model) __________________________________ 358
Table 8.196- Modification Indices (Group number 1 - Default model) __________________________ 359
Table 8.197- Regression Weights: (Group number 1 - Default model) __________________________ 363
Table 8.198 - Model Fit Summary ______________________________________________________ 369
Table 8.199 - Parsimony-Adjusted Measures ______________________________________________ 370
Table 8.200 – Summary Results of SEM Modifications ______________________________________ 372
Table 9.1 – Major Problems and Challenges faced by the SMEs and the Reasons thereof ____________ 376
Table 10.1 – Summary Sheet of Major Findings ____________________________________________ 381

xxix
Annexure -XIII
LIST OF FIGURES
Figure 1-1 - Model of the Link between HRM and Performance _________________________________ 3 Figure 1-2 Schematic Structure of the Thesis _______________________________________________ 10 Figure 2-1 : India GDP Annual Growth Rate ________________________________________________ 11 Figure 2-2 SME Growth From 2008 To 2013 _______________________________________________ 12 Figure 2.3 - All India Growth Rate of MSMEs (%) ___________________________________________ 14 Figure 2.4- Number of EM-II Filed During 2007-08 To 2014-15 ________________________________ 15 Figure 2.5- Number of Enterprises in MSME Sector (lacs) _____________________________________ 15 Figure 2.6- Leading Industries in MSME Sectors ____________________________________________ 16 Figure 2.7 - Distribution of Working Enterprises by Area _____________________________________ 17 Figure 2.8 - Activity-wise : MSMEs ______________________________________________________ 17 Figure 2.9 - Market value of Fixed Assets _________________________________________________ 18 Figure 2.10 - Contribution of MSMEs in Employment _______________________________________ 19 Figure 2.11 - Gross Output, Rs ‘000 crore __________________________________________________ 19 Figure 4.1 - Sources of Finance __________________________________________________________ 38 Figure 4.2 - Credit Requirements of MSMEs ________________________________________________ 39 Figure 6.1 – Paawe & Richardson Model (1997) _____________________________________________ 64 Figure 6.2 - Guest’s Model (1997) ________________________________________________________ 65 Figure 7.1 - Hypothesized Model : Linkages Between HRM Practices & Outcomes _________________ 85 Figure 8.1 - Frequencies of Industrial Estates _______________________________________________ 94 Figure 8-2 - Size of the Firm ____________________________________________________________ 95 Figure 8.3 Designation of Respondents ____________________________________________________ 96 Figure 8.4 - Age of the Respondents ______________________________________________________ 97 Figure 8.5- Gender of the Respondents ____________________________________________________ 98 Figure 8.6 - Educational Background ______________________________________________________ 99 Figure 8.7: Specialization of Managing Heads _____________________________________________ 100 Figure 8.8 - Years of Service in the Firm __________________________________________________ 101 Figure 8.9 - Total Work Experience ______________________________________________________ 102 Figure 8.10 - Type of Firm _____________________________________________________________ 103 Figure 8.11 - Age of the Firm ___________________________________________________________ 104 Figure 8.12 - Written Documentation of HR Policies ________________________________________ 105 Figure 8.13- The Person handling HR Functions ____________________________________________ 106 Figure 8.14 - Taking Guidance From HR Consultant ________________________________________ 107 Figure 8.15 - Taking Guidance from Financial Consultant ____________________________________ 108 Figure 8.16: Frequency of Consulting an HR Consultant _____________________________________ 109 Figure 8.17 - Frequency of Consulting a Financial Consultant _________________________________ 110 Figure 8.18 - Possessing a Quality or ISO Certification ______________________________________ 111 Figure 8.19 - Registration with Any Trade Union ___________________________________________ 112 Figure 8.20 - Achieved Expected Levels of Growth _________________________________________ 113 Figure 8.21 - Number of Full Time Employees ____________________________________________ 114 Figure 8.22 - Number of Part-Time Employees ____________________________________________ 115
LIST OF FIGURES

xxx
Figure 8.23 - Number of Contractual Employees ___________________________________________ 116 Figure 8.24-Number of Women Employees _______________________________________________ 116 Figure 8.25 - Age of the Firm and Documentation of HR Practice ______________________________ 129 Figure 8.26 - Type of Firm and Documentation of HR Practice ________________________________ 131 Figure 8.27 - Cross-Tab: Size of Firm and Documentation of HR Practice ________________________ 134 Figure 8.28 - Cross-Tabulation: Quality/ ISO Certification and Documentation of HR Practice _______ 136 Figure 8.29 - Cross-Tabulation: Person Handling HR Functions _______________________________ 138 Figure 8.30 - Person Who Handles HR Functions and Size of Firm _____________________________ 140 Figure 8.31 - Scree Plot _______________________________________________________________ 283 Figure 8.32 - SEM Base Model _________________________________________________________ 292 Figure 8.33 - First Modification Model [e12<-->e13] ________________________________________ 316 Figure 8.34 - Second Modification Model [e30<->e31] _____________________________________ 336 Figure 8.35 - Third Modification [e1<-->e2] ______________________________________________ 354

xxxi

CHAPTER – 1
©Ranjita Banerjee 1
CHAPTER – 1
Introduction, Definition of Terms and Structure
of Thesis
1.1. Introduction
Economies worldwide have emphasized on the over-arching role of Small & Medium
Enterprises (SMEs) for achieving economic growth and development…mainly due to the
sector being one of the most ‘vibrant’. Micro, Small and Medium Enterprises (MSME)
sector in India has emerged as a highly vibrant and dynamic sector. Estimated to employ
over 805 lac individuals, this sector provides large employment opportunities at
comparatively lower capital cost as compared to large industries, and helps in
industrialization of rural and backward areas. It thus helps to reduce regional imbalances,
encourages decentralization, assures inclusive growth and equitable distribution of
national income and wealth. In addition, the SMEs are complementary as well as
supplementary to large industries as ancillary units and thus the sector contributes
enormously to the socio-economic development of the country.
The Report of the Committee on India Vision 2020, Planning Commission of India
(2002), affirms that International experience confirms that SMEs are better insulated
from the external shocks, more resistant to the stresses, and more responsive to the
demands of the fast-changing technology adoption, globalization and entrepreneurial
development.
Micro, Small & Medium Enterprises (MSME’s) form the backbone of a developing
economy like India, in all spheres of development viz. economical, technological,
regional, socio-cultural, political and global. The share of MSME sector in total GDP was

Introduction, Definition of Terms and Structure of Thesis
©Ranjita Banerjee 2
about 38% (precisely 37.54%) in 2012-13, according to the MSME Annual Report 2015-
16. SMEs form the genesis of several innovations in manufacturing and service sectors
and also the major link in the supply chain to corporate houses and the PSUs. According
to the MSME Annual Report 2015-16, the share of MSME manufacturing output in total
manufacturing output in 2012-13 was 37.33%.
To exemplify the quantum of opportunities held by this sector, it would be worthwhile to
note that in India, MSMEs contribute 45% of industrial output, 40% of exports. The
sector produces over 8000 products varying from traditional to hi-tech items employing
about 59 million persons in over 26 million units throughout the country (MSME Annual
Report 2014-15). The total cumulative employment in the Khadi and Village Industries
(KVI) sector is estimated to have increased to 15.5 million persons in 2015-16 as against
13.4 million persons in the corresponding period of the previous year, according to the
MSME Annual Report 2015-16. With India on a strong growth path, the MSME sector is
expected to create 100 million jobs over coming years. The Government also envisages
major labour reforms in order to ease manufacturing in India. All this creates significant
incentive and opportunity to examine the prevailing HRM practices and extract
maximum potential from this sector.
Theories on Human Resource Management are often developed and tested in large
organizations. Studies on HRM within SMEs occur less often. The majority of
publications on HRM within small and medium-sized enterprises are based on qualitative
studies. Henemanet al. conclude that ‘the lack of information about human resources in
SMEs is problematic for theory, research and practice’ (Heneman et al.,2000). There is
dearth of information about human resource management practices in MSME’s (Chandler
and McEvoy, 2000; Heneman and Tansky, 2003)…thus, the researcher’s interest in
undertaking the study and finding the linkages between HRM practices and the business
performance of MSME’s with special reference to SME’s in Vadodara district.
In the present study, the samples are selected from eight Industrial Estates out of a total
of 12 Industrial Estates (ie. 67% of Industrial Estates) in Vadodara District. The eight
Industrial Estates comprise of GIDC Makarpura, Sardar Estate, Patel Estate, Gorwa

Introduction, Definition of Terms and Structure of Thesis
©Ranjita Banerjee 3
BIDC Industrial Estate, Chhani Estate, Mujmahuda (Sahjanand), Vadodara City
area and Padra Industrial Estate.
1.2. The Linkage between HRM and Performance-Introduction
The study of Human Resource Management (HRM) is concerned with the choices that
organizations make from among the plethora of policies, practices and structures for
managing employees. Nevertheless, in a more strategic sense, HRM is explained in terms
of carefully designed combinations of practices and policies geared towards improving
organizational effectiveness, resulting into better performance outcomes. As Wright and
McMahan (1992) define HRM as ‘the planned HR deployments and activities intended to
enable an organization to achieve its goals’. They have proposed that it is the pattern of
HR practices that contribute to firm performance and goal attainment.
The present study encircles the strategic linkage between HRM and performance. The
representation of the HRM-performance relationship put forward by Guest et al (2000),
as shown in Figure 1.1, serves as a useful visual representation of this strategic linkage.
(Source: Guest et al, 2000)
Figure 1-1 - Model of the Link between HRM and Performance
Business Strategy
HR Strategy
HR Practices
HR Effectiveness
HR Outcomes:
Employee competence,
Commitment,
Quality of goods & services
Productivity
Financial Performance

Introduction, Definition of Terms and Structure of Thesis
©Ranjita Banerjee 4
1.3. Significance of the Study
The study is significant because the following results have been achieved from the study:
1. To understand the linkages between HRM practices and SME's performance
in Vadodara district. Although a lot of studies have been done in the large
enterprises regarding the linkages between performance and human resource
management practices, there is dearth of such studies in SMEs. The findings in
the study will contribute to theory building in the areas of linkages between HR
practices and performance in the SME sector.
2. Investigate the current state of HR practices in the SMEs in the Vadodara
district. HRM practices in the large-sized firms have been widely studied. But
unlike large-scale firms, research indicates that HRM practices like recruitment,
motivation and retention are one of the biggest problems for small firms
(Gatewood and Field 1987, Hornsby and Kuratko 1990). Thus, the present study
is significant as it tries to find the HRM practices which are practically prevalent
in the SME firms in the Vadodara district.
3. Identify the important HR practices practiced in the SMEs. The HR practices
which are mostly practiced by a majority of the SME firms across the various
estates have been identified. These practices will be seen as important HR
practices in the SMEs. The findings in the study will contribute to theory building
in the areas of HR practices in the SME sector.
4. Identify the problems and challenges faced by the entrepreneurs/ Managing
Heads of the SMEs in general. The SME owners and Managing Heads face a
plethora of problems from various facets of the internal and external environment.
The study will help in understanding such problems of the SME firms through
open discussions and interactions with the SME owners/ Managing heads to get a
real understanding of the sector. This will surely help in a good theoretical
framework as well, opening the doors for future research.

Introduction, Definition of Terms and Structure of Thesis
©Ranjita Banerjee 5
5. Identify the major policies as well as new policy initiatives prevalent in the
SMEs. A detailed study of the Micro, Small and Medium Enterprises
Development (MSMED) Act, 2006, has been done including all the new
initiatives undertaken by the government as well as other bodies, obtained from
various secondary sources of data, to get an understanding of the real scenario.
This is significant as it may help budding entrepreneurs who wish to start a
factory of a small or medium size to get some directions about the policy
initiatives in a single platform.
6. Understand the various Functional areas prevalent in the SME sector, with special
focus on Human Resource Management.
7. Recommendations for improvising the SME sector, being one of the most vibrant
sectors in the economy. The study is significant also from the context as several
recommendations have been given, based on the research undertaken and from the
findings of the study, which can be imbibed by SME owners/ Managing heads/
Chambers of Commerce and Industry as well as industry associations to
improvise the SME sector.
1.4. Definition of Important Terminologies
The definition of the following terminologies have been outlined in this section of the
thesis.
The following terminologies have been defined as under:
1.5. Micro, Small & Medium Enterprises (MSMEs)
Government of India under the Ministry of Micro, Small and Medium Enterprises have in
October 2006 enacted Micro, Small and Medium Enterprises Development (MSMED)
Act 2006.
The concept of ‘Enterprise’ as against ‘Industries’ was elaborated in the way that
‘enterprises’ can be broadly classified into:

Introduction, Definition of Terms and Structure of Thesis
©Ranjita Banerjee 6
• Enterprises engaged in manufacturing production of goods pertaining to any
industry
• Enterprises engaged in rendering of some service
For the Manufacturing Enterprises it was defined in terms of investment in plant and
machinery (excluding land and buildings), whereas for the Service Enterprises it was
defined in terms of their investment in equipment. Under the Act, Micro, Small and
Medium Enterprises are classified as shown in Table1.1 (MSME Annual Report 2009-
10).
TABLE 1.1 - Micro, Small and Medium Enterprises Defined
Enterprises Investment in Plant & Machinery
(Manufacturing)
Investment in Equipment (Services)
Micro Up to Rs. 25 lakhs Up to Rs. 10 lakhs
Small Above Rs. 25 lakhs up to Rs. 5 crore Above Rs. 10 lakhs up to Rs. 2 crore
Medium Above Rs. 5 crore up to Rs. 10 crore Above Rs. 2 crore up to Rs. 5 crore
(Source: MSME Annual Report 2014-15)
The researcher in the present study has focused only on Small and Medium Enterprises
only. Micro enterprises are excluded from the purview of the study.
1.6. Human Resource Management Practices
It is deduced by HR commentators and practitioners that there can be no universal
prescription for HRM practices and policies. It is basically based on the business needs of
the firm within its context (culture, structure, technology and processes) (Armstrong
Michael, 2006). Thus, ‘best fit’ is more important than ‘best practice’. Thus, various ‘best
practice’ ingredients of various successfully running benchmarked organizations can be
picked and mixed to develop an approach that aligns most appropriately to the identified
business needs of the firm. Human Resource Management Practices can thus be said to
be a bundle of such practices which are found to enhance the productivity and efficiency
of the employees.

Introduction, Definition of Terms and Structure of Thesis
©Ranjita Banerjee 7
Good HRM practices leads to effective manpower planning, reducing the selection-
errors; managing people effectively through an open Performance Management System
(PMS); creating good Performance Development Plans (PDPs) for its employees;
developing their staff through proper coaching, mentoring, training and development;
developing an effective Compensation Management System which enables better
retention of its staff as well as has good motivational strategies to keep its staff vibrant
and effective. In small enterprises owner managers are responsible for decisions related
to human resources. Their managerial style has a direct influence on the HRM practices
(Koch de Kok, 1999).
Based on Literature Review (Paauwe & Richardson, 1997; Guest, 1997), the major HR
practices identified in the present study are:
• Recruitment and Selection
• Training and development
• Performance Management System
• Employee participation
• Employee decision-making
• Welfare Measures
1.7. Firm’s Performance
The performance outcomes of a firm can be captured in variety of ways. The distinction
adopted by Dyer and Reeves (1995) proposed that measures of performance could be
broken down into four categories:
• Employee outcomes, which deals with the consequences of the practices on
employees (eg. Attitudes, behaviour, absenteeism and turnover etc).
• Organizational outcomes, focus on more operational measures of performance
(eg. productivity, quality and shrinkage)
• Financial/ Accounting Outcomes, which refers to the actual financial
performance measures (eg. expenses, revenues and profitability) and finally,

Introduction, Definition of Terms and Structure of Thesis
©Ranjita Banerjee 8
• Market-based outcomes, which reflect how the financial markets value a firm,
particularly through its stock price or variations of it.
The Performance dimensions identified in the study based on literature review (Dyer &
Reeves, 1995; Paauwe & Richardson, 1997) are:
Employee Outcomes like Competence, Employee attitudes (commitment, co-
operation); Employee behaviour (Regularity, Punctuality, Discipline); Employee-
involvement.
Organizational Performance Outcomes (like Customer Satisfaction, Supplier
Satisfaction, Product/ Service development, Quality, Utilization of resources,
Reduction of defects, % change in Net Profit Margin, ROI (in % Average
performance of 2 yrs)
1.8. Managing Heads
The respondents in the present study are the owners / entrepreneurs of the SME firms as
well as the employees of the firms including Managing Heads of the SMEs/ heads of any
of the functional areas of the SMEs like HR, Accounting, Finance, Production or simply
the Supervisor. It has been observed in the SMEs that the person designated as
‘Supervisor’ or ‘Manager’ is responsible for all or many of the functional areas of SMEs.
He is the person whom all the labours report about their daily work or problems or issues.
Thus, a person designated as ‘Supervisor’ or ‘Manager’ also is a Managing Head under
the purview of the study.
The present study ascertains the major HRM Practices and performance dimension of the
SMEs in Vadodara district through a survey of 126 SME firms of the 8 Industrial Estates
(out of total of 12 Estates), respondents being 215 Managing Heads.

Introduction, Definition of Terms and Structure of Thesis
©Ranjita Banerjee 9
1.9. Structure of the Thesis
Chapter 1 gives an overview of the general introduction, rationale of the study,
significance of the study and also definition of important terminologies.
Chapter 2 provides a detailed overview of the Micro, Small and Medium Enterprises
(MSMEs) and its inter-play and importance for economic stability and inclusive growth.
The chapter displays various statistical data from the secondary sources regarding the
essence of the MSME sector in the economy. Chapter 3 discusses the MSMEs in Gujarat
State, with special reference to Vadodara district.
Chapter 4 discusses the various functional areas of SMEs with special reference to HRM
function. Chapter 5 does a detailed discussion of the new policy initiatives as well as the
applicability of the Micro, Small and Medium Enterprises Development (MSMED) Act
2006. Chapter 6 does a detailed literature review of the various aspects like HRM
practices, performance as well as the linkages between HRM practices and firm’s
performance, with special reference to small and medium enterprises.
Chapter 7 discusses the Research Methodology including the hypotheses. Chapter 8
discusses on Quantitative data analysis and interpretation. Chapter 9 discusses on the
problems and challenges identified through interviews and interactions. Chapter 10 talks
about the findings and discussions. The last chapter, Chapter 11 contains the conclusions
of the study; it also discusses on the limitations of the study, recommendations as well as
implications for future research in the direction.
Figure 1.2 provides a detailed schematic structure of the thesis.

Introduction, Definition of Terms and Structure of Thesis
©Ranjita Banerjee 10
Figure 1.2 provides a detailed schematic structure of the thesis.
Figure 1-2 Schematic Structure of the Thesis
Chapter 1: Introduction,
Definition of terms and
Structure of Thesis
Chapter 2: MSMEs For
Economic Stability &
Inclusive growth
Chapter 3: MSMEs in
Gujarat State with
special reference to
Vadodara district
Chapter 4: Functional
Areas of SMEs with
special reference to HR
Function
Chapter 5: Micro, Small and Medium Enterprises Development (MSMED) Act, 2006 - Applicability And Measures For Promotion And New Policy Initiatives in the SME sector
Chapter 6: Review of
Literature
Chapter 7: Research
Methodology
Chapter 8: Quantitative
Data Analysis &
Interpretation
Chapter 10: Findings &
Discussions
Chapter 11:
Recommendations,
Limitations &
Conclusion
Chapter 9: Problems
and Challenges
identified through
interviews &
interactions

CHAPTER – 2
©Ranjita Banerjee 11
CHAPTER – 2
Micro, Small And Medium Enterprises-for
Economic Stability and Inclusive Growth
2.1. India’s Economy….The Background
India has a diverse economy encompassing traditional village farming, modern
agriculture, handicrafts, a wide range of modern industries and a multitude of services.
GDP Annual Growth Rate in India averaged 6 percent from 1951 until 2015, reaching an
all time high of 11.40 percent in the first quarter of 2010 and a record low of -5.20
percent in the fourth quarter of 1979. In 2009 it displayed less economic growth mainly
due to the global recession, however, India weathered the 2008 crisis well. Holistic
development in India is possible only with the joint functioning of the Public and Private
sector both, alongwith the combined efforts of the large, medium, small and micro
enterprises, across various sectors. (Figure 2.1 shows India’s GDP Annual Growth Rate).
(Source :World Bank, http://data.worldbank.org/indicator/NY.GDP.PCAP.CD?locations=IN)
Figure 2-1 : India GDP Annual Growth Rate
-5.0
0.0
5.0
10.0
1970
1972
1974
1976
1978
1980
1982
1984
1986
1988
1990
1992
1994
1996
1998
2000
2002
2004
2006
2008
2010
2012
2014

Micro, Small And Medium Enterprises-for Economic Stability and Inclusive Growth
©Ranjita Banerjee 12
2.2. MSME-for Economic Stability and Inclusive Growth
The Micro, Small and Medium Enterprise Sector, better known as MSME, has emerged
as one of the most dynamic and vibrant sectors not only in the Indian economy, but in the
global economy as well. It has been accepted as the engine of economic growth and for
promoting equitable development. The MSME’s constitute over 90% of the total
enterprises in most of the economies and are credited with generating the highest rates of
employment growth and account for a major share of industrial production and exports.
It is worthwhile to note that India’s 1.3 million MSMEs contribute 45% of industrial
output, 40% of exports and 42 million in employment. The sector creates 1 million jobs
every year and produces more than 8000 quality products for the Indian and international
markets. (MSME Annual Report 2014-15). SMEs play a critical role in generating
millions of job opportunities especially at the low-skill level. The concern, however is,
that SMEs in India, due to their low scale and poor adoption of technology, have very
poor productivity.
Although they employ 40% of India's workforce, they only contribute 17% to the Indian
GDP. One of the reason is probably, that too many firms stay small, unregistered and un-
incorporated in the unorganised sector so that they can avoid taxes, regulations and
receive subsidies. "The firms have little incentive to invest in upgrading skills of largely
temporary workers or in investing in capital equipment," says the Economic Survey
2015. Figure 2.2 corroborates this belief.
(Source:http://articles.economictimes.indiatimes.com/2013-06-09/news/39834857_1_SMEs)
Figure 2-2 SME Growth From 2008 To 2013
0
20
40
60
2008 2009 2010 2011 2012 2013 est
Number of MSMEs, millions

Micro, Small And Medium Enterprises-for Economic Stability and Inclusive Growth
©Ranjita Banerjee 13
2.3. Some Important Statistical Inferences Related to SMEs
This Section of the chapter discusses some important statistical facts and inferences of
this vibrant sector MSMEs, gathered from various secondary sources.
2.3.1. Contribution of Manufacturing Output of MSMEs in GDP
The MSME sector is a nursery of entrepreneurship, often driven by individual creativity
and innovation. As per the revised methodology suggested by Central Statistics Office
(CSO), Ministry of Statistics and Programme Implementation (MoSPI), the estimated
contribution of manufacturing sector MSME to GDP, during 2012-13, is 7.04%.
However, taking into account the contribution of services sector MSME, the share of
MSME sector in GDP of the country, during 2012-13, is 37.54%. The labour to capital
ratio in MSMEs and the overall growth in the sector is much higher than in the large
industries. The geographic distribution of the MSMEs is also more even. Table 2.1
shows the contribution of MSMEs in manufacturing output and GDP.
TABLE 2.1- Contribution of MSMEs In Manufacturing Output & GDP
Year Gross Value of Output of MSME Manufacturing Sector (Rs. in ‘000 crore)
Percentage Share of MSME
Total Manufacturing Output in %
Share of MSME Sector in total GDP in %*
2006-07 1198.8 42.02 35.13
2007-08 1322.9 41.98 35.41
2008-09 1375.7 40.79 36.12
2009-10 1488.4 39.63 36.05
2010-11 1655.6 38.48 36.69
2011-12 1790.8 37.52 37.97
2012-13* 1810.0 37.33 37.54
(Source: Compiled from MSME Annual Report 2013-14& * MSME Annual Report 2015-16)

Micro, Small And Medium Enterprises-for Economic Stability and Inclusive Growth
©Ranjita Banerjee 14
2.3.2. Trends in MSME Growth
MSMEs has shown constant growth rate of more than 11% every year till 2010-11. The
highest growth in recent time was recorded during 2011-12 (18.45%), whereas during
year 2012-13 and 2013-14 growth rate was around 14% and 12%, respectively. However,
recent data for 2015 i.e., from April-September, 2015 showed impressive growth of
18.74% (year-on-year growth) (Refer Figure 2.3).
(Source: MSME Annual Report 2015-16, Govt. of India)
Figure 2.3 - All India Growth Rate of MSMEs (%)
Figure 2.4 shows the number of Entrepreneurs Memorandum (EM-II) filed during 2007-
08 to 2014-15, which shows a remarkable increase from 1.73 lakh in 2007-08 to 4.25
lakh in 2014-15.
11.7710.45
11.83
18.45
14.3
12.44
17.18
18.74
0.0
2.0
4.0
6.0
8.0
10.0
12.0
14.0
16.0
18.0
20.0
2007-08 to 2008-09
2008-09 to 2009-10
2009-10 to 2010-11
2010-11 to 2011-12
2011-12 to 2012-13
2012-13to 2013-14
2013-14 to 2014-15
2014-15 to 2015-16

Micro, Small And Medium Enterprises-for Economic Stability and Inclusive Growth
©Ranjita Banerjee 15
(Source: MSME Annual Report 2015-16, Govt. of India)
Figure 2.4- Number of EM-II Filed During 2007-08 To 2014-15 (lacs)
Figure 2.5 depicts the number of working enterprises over the period from 2006-07 to
2011-12, which also shows a remarkable increase in the number of MSME firms.
(Source: MSME Annual Report 2012-13, Govt. of India)
Figure 2.5- Number of Enterprises in MSME Sector (lacs)
1.731.93
2.132.38
2.823.23
3.63
4.25
0.0
0.5
1.0
1.5
2.0
2.5
3.0
3.5
4.0
4.5
2007-08 2008-09 2009-10 2010-11 2011-12 2012-13 2013-14 2014-15
361.76 377.37 393.7 410.82 428.77 447.73
050
100150200250300350400450500
2006-07 2007-08 2008-09 2009-10 2010-11 2011-12

Micro, Small And Medium Enterprises-for Economic Stability and Inclusive Growth
©Ranjita Banerjee 16
2.3.3. Leading Industries in MSME Sector
There are over 6000 products ranging from traditional to high-tech items, which are being
manufactured by the MSME sector in addition to providing wide range of services. The
leading industries across the various sectors with their respective shares are as depicted in
Figure 2.6.
(Source: MSME Annual Report 2014-15)
Figure 2.6- Leading Industries in MSME Sectors
2.3.4. Distribution of Working Enterprises by Area
The distribution of working SME enterprises by area in the latest Census Survey
indicated that rural area with 200.19 lakh of working enterprises accounted for 55.34% of
the total working enterprises in MSME sector whereas urban area located 161.57 lakh
working enterprises (i.e. 44.66% of the working enterprises in MSME sector) were from
urban area (Refer Figure 2.7).

Micro, Small And Medium Enterprises-for Economic Stability and Inclusive Growth
©Ranjita Banerjee 17
(Source: MSME Annual Report 2013-14)
Figure 2.7 - Distribution of Working Enterprises by Area
2.3.5. Nature of Activity
The nature of activity of MSMEs depicts that 31.79% of the enterprises in the MSME
sector were engaged in manufacturing, whereas 68.21% of the enterprises were engaged
in the services. As per the revised methodology suggested by Central Statistics Office
(CSO), Ministry of Statistics and Programme Implementation (MoSPI), the estimated
contribution of manufacturing sector MSME to GDP, during 2012-13, is 7.04%.
However, taking into account the contribution of services sector MSME, the share of
MSME sector in GDP of the country, during 2012-13, was 37.54%. (Refer Figure 2.8)
(Source: MSME Annual Report 2013-14)
Figure 2.8 - Activity-wise : MSMEs

Micro, Small And Medium Enterprises-for Economic Stability and Inclusive Growth
©Ranjita Banerjee 18
2.3.6. Fixed Assets in MSME Sector
The market value of fixed assets of MSMEs from the period 2006-07 to 2011-12 shows a
remarkable increase from Rs. 8,68,543crores to Rs.11,76,939 crores. (See Figure 2.9)
(Source: MSME Annual Report 2012-13)
Figure 2.9 - Market value of Fixed Assets (Rs crores)
2.3.7. Contribution of MSMEs in Employment
The Government monitors the employment in the MSME sector in the country by
conducting All India Census of the sector, periodically. As per the latest Census (Fourth
Census), as well as data extracted from Economic Census 2005 conducted by CSO,
MoSPI, for activities excluded from Fourth Census, namely wholesale/retail trade, legal,
educational & social services, hotel & restaurants, transports and storage & warehousing
(except cold storage), the total employment in the MSME sector is 1012.59 lakh in 2011-
12. Figure 2.10 shows the contribution of MSME’s in employment. The estimated
numbers of enterprises and employment, as per Fourth All India Census of MSME, have
increased at an annual compound growth rate of 28.02%and 26.42% respectively as
compared to third All India Census of SSI, during the period 2001-02 to 2006-07.
868,544 917,437 971,4071,029,331
1,094,8931,176,939
0
200,000
400,000
600,000
800,000
1,000,000
1,200,000
1,400,000
2006-07 2007-08 2008-09 2009-10 2010-11 2011-12

Micro, Small And Medium Enterprises-for Economic Stability and Inclusive Growth
©Ranjita Banerjee 19
(Source: MSME Annual Report 2012-13, Govt. of India)
Figure 2.10 - Contribution of MSMEs in Employment (nos, lacs)
2.3.8. Gross Output in MSME Sector
From Figure 2.11 it can be deduced that the MSME sector holds a very significant
position for the country’s growth and development by virtue of its contribution in Gross
Output. Thus, MSMEs are immensely important for the national objectives of growth
with equity and inclusion.
(Source: MSME Annual Report 2012-13)
Figure 2.11 - Gross Output, Rs ‘000 crore
805.2 842.2 881.1 922.2 956.71,012.6
0
200
400
600
800
1,000
1,200
2006-07 2007-08 2008-09 2009-10 2010-11 2011-12
1,351.4 1,435.2 1,524.3 1,619.41,721.6
1,834.3
0
500
1,000
1,500
2,000
2006-07 2007-08 2008-09 2009-10 2010-11 2011-12

Micro, Small And Medium Enterprises-for Economic Stability and Inclusive Growth
©Ranjita Banerjee 20
2.4. MSMEs for Economic Stability and Growth
You Jong (1995) stated that different countries with different endowments have different
comparative advantages in the production of goods by MSMEs or by Large Enterprise
(LEs). In some countries they can be produced efficiently by LEs while in other countries
they are most economically produced by MSMEs. He concluded that whether a good can
be manufactured most economically in MSMEs or in LE’s (Large Enterprises), would
depend on three things: type of goods produced, kinds of raw materials and other
endowments used, and methods of production adopted.
Castel-Branco, C (May 2003) had however a different opinion in contrast to the general
belief of SME driven development. He criticized standard approaches to SME driven
development, with incidence on LDCs. He opined that for those who think that
promotion of SMEs creates a fairer and more democratic capitalism, they should rather
look at comparable working conditions, trade union organization, ability to implement
(and also oppose) progressive labour legislation.
Eshetu Bekele &Mammo Muchie (2009) on a 6-year follow-up study of a random sample
of 500 small businesses selected from five major cities of Ethiopia, identified key
predictors of viability and long term survival. They deduced that promoting Micro, Small
and Medium Enterprises (MSMEs) is required for sustainable rural livelihood. This study
showed that MSME’s have the potential to fill the gap by alleviating extreme poverty
among the masses, and by generating employment opportunities for the poor.
An article in the leading new-paper Times of India, titled: “SMEs to become partner
vendors of large EPC” (19th June 2016) deduced that EPCs (i.e Engineering, Procurement
and Construction) companies will need the support of credible SMEs which can prove to
be reliable suppliers to them, to achieve a compounded annual growth rate of 20.26%
over the period of 2014-2019.

Micro, Small And Medium Enterprises-for Economic Stability and Inclusive Growth
©Ranjita Banerjee 21
2.5. Summary of the Chapter
The Chapter highlights the essence of MSMEs in an emerging economy like India. The
various reviews suggest that SME’s across the globe plays a very crucial role in the
development, growth as well as for sustainability of the economy.
The private sector including MSME’s, the corporate sector and the government, at large,
all have a critical role to play in achieving the objective of faster and inclusive growth in
the economy. The MSME sector plays a very vital role here in bringing in regional and
balanced growth and economic stability. Thus, it plays a major role in curbing the vicious
circle of poverty, unemployment and illiteracy (as a trickle down benefit, by curbing the
first two problems).

CHAPTER – 3
©Ranjita Banerjee 22
CHAPTER – 3
MSMEs in Gujarat State-With Special Reference
to Vadodara District
3.1. Introduction
Gujarat is India’s one of the most developed states. It is India’s seventh largest state in
terms of geographical area. The State constitutes 6.2% of the size of the country. It
accounts for 4.93% of India’s population, according to the 2011 Census, with over 60
million people. According to the 2011 Census, the sex ratio is 918 and Literacy Rate is
79.3 (Male 87.2, while Female 70.70). The Human Development Index is 0.527, which
makes it in the eleventh rank in the country (Census 2011, HDI Report ).
Since its formation as a separate state, way back in 1960s, Gujarat has always been
known for its industrial development. As per the results of the Annual Survey of Industry
(2009-10), Government of Gujarat , Socio-economic Review (2010-11) carried out by the
Central Statistical Organization (CSO), Gujarat accounts for 18% of fixed capital
investment, 17.22% of gross output and 15.20% of net value added in industrial sector in
India. This Survey further reinforced the position of Gujarat as the most industrially
developed state in India in respect of first ranking in industrial investment and second in
terms of value of production and value addition in industrial sector.
District Industries Centers (DICs) in all the districts of the state and the institutions such
as Gujarat Industrial Development Corporation (GIDC) and Gujarat State Financial
Corporation (GSFC) have been instrumental in accelerating the pace of development of
SSIs. The Small and Medium Enterprises as classified by the MSMED Act 2006, are

MSMEs in Gujarat State-With Special Reference to Vadodara District
©Ranjita Banerjee 23
required to file Entrepreneurs Memorandum (EM) Part-I to District Industries Centre for
starting an industrial project. On completion of the project, the entrepreneur concerned is
required to file Entrepreneurs Memorandum (EM) Part-II. On line submission &
Processing of EM-I & EM-II has been made available in website w.e.f. 01/07/2013.
3.2. Growth of MSMEs in Gujarat
There were only 2169 small industries in 1961 at the time formation of the state. This
number increased to manifold over the years, due to the congenial business environment
and entrepreneurial spirit in the State.
3.2.1. Growth of MSMEs Registration in Gujarat
There are 261760 MSMEs Registered in Gujarat till March 2014. Tables 3.1 and Table
3.2 presents the details of the year wise and district-wise registrations of MSMEs in
Gujarat from 2-10-2006 to 31-3-2014, respectively.
TABLE 3.1 - Growth in registrations of MSMEs
Year wise Registered MSMEs in Gujarat Year No of units
2006-2007 4,131 2007-2008 13,186 2008-2009 17,867 2009-2010 19,993 2010-2011 27,940 2011-2012 51,781 2012-2013 68,235 2013-2014 58,627
Total 261,760 (Source: Industries Commisionerate, Gov of Gujarat; http://ic.gujarat.gov.in/?page_id=414)
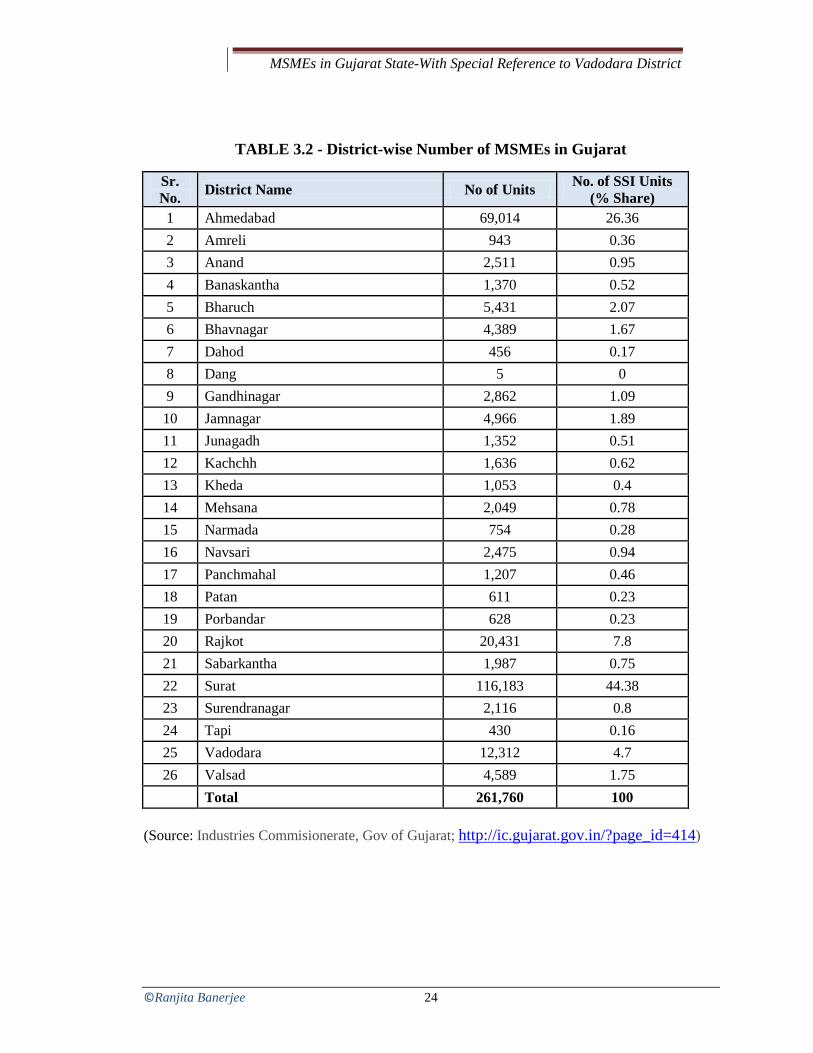
MSMEs in Gujarat State-With Special Reference to Vadodara District
©Ranjita Banerjee 24
TABLE 3.2 - District-wise Number of MSMEs in Gujarat
Sr. No. District Name No of Units No. of SSI Units
(% Share) 1 Ahmedabad 69,014 26.36 2 Amreli 943 0.36 3 Anand 2,511 0.95 4 Banaskantha 1,370 0.52 5 Bharuch 5,431 2.07 6 Bhavnagar 4,389 1.67 7 Dahod 456 0.17 8 Dang 5 0 9 Gandhinagar 2,862 1.09
10 Jamnagar 4,966 1.89 11 Junagadh 1,352 0.51 12 Kachchh 1,636 0.62 13 Kheda 1,053 0.4 14 Mehsana 2,049 0.78 15 Narmada 754 0.28 16 Navsari 2,475 0.94 17 Panchmahal 1,207 0.46 18 Patan 611 0.23 19 Porbandar 628 0.23 20 Rajkot 20,431 7.8 21 Sabarkantha 1,987 0.75 22 Surat 116,183 44.38 23 Surendranagar 2,116 0.8 24 Tapi 430 0.16 25 Vadodara 12,312 4.7 26 Valsad 4,589 1.75
Total 261,760 100 (Source: Industries Commisionerate, Gov of Gujarat; http://ic.gujarat.gov.in/?page_id=414)

MSMEs in Gujarat State-With Special Reference to Vadodara District
©Ranjita Banerjee 25
3.2.2. Distribution of clusters in major product lines in the State
Table 3.3 shows the distribution of clusters in major product lines in the State.
TABLE 3.3 - Distribution of Clusters In Major Product Lines in Gujarat
District Products
Ahmedabad Dyes and Chemicals, Textile Machinery, Pharmaceutical Machinery, Moulded Plastic Products, Readymade Garments, Diamond Processing, Machine Tools, Castings & Forging, Steel Utensils, Wood work and Furniture, Paper Products, Leather Footware, Washing Powder & Soap, Marble Slabs, Power driven Pumps, Autoparts, Electronic goods.
Anand Diary and food Processing Machines
Bharuch Chemicals and Bulk Pharmaceuticals
Bhavnagar Ship-Breaking, Steel Re-rolling, Machine Tools, Plastic Processing, Diamond
Processing,
Gandhinagar Powerloom
Jamnagar Brass articles, parts and components, wooden Furniture
Mahasana Cotton Cloth Weaving
Morvi Ceramic Tiles and Sanitaryware
Rajkot Diesel Engines and parts, Machine Tools, Submergible Pumps, Gold and Silver Jewelry, Salt Processing, Electronic, Watches and Clocks, Oil Mills, Textile Printing, Clay Floor Tiles, Electric Motors, Casting and Forging, Machine Tools and Diamond Processing
Surat Diamond Cutting and Polishing, Textile Machinery, Powerlooms, Zari, Wood Products and Furniture
Surendranagar Textile Machinery, Salt, Sanitary Fittings, Ceramics
Vadodra General Engineering, Pharmaceuticals (Bulk Drugs), Plastic Processing, Wood Work and Furniture
Valsad Dyes and Intermediates, Chemicals and Bulk Pharmaceuticals
Veraval Fish Processing
(Source: ISED Small Enterprise Observatory, 2013)

MSMEs in Gujarat State-With Special Reference to Vadodara District
©Ranjita Banerjee 26
3.3. MSME and Gujarat State Industrial Policy 2015
Two major pieces of legislation to regulate the MSME environment in Gujarat are
the central Act, MSME Development Act 2006, and Gujarat State Industrial Policy
2015 (initially Gujarat State Industrial Policy 2009) supplemented by Notification
of Rules of MSE-Facilitation Council (MSEFC). Gujarat implemented the MSMED
Act w.e.f 2nd October, 2006.
3.3.1. MSME Support through Gujarat Industrial Policy 2015: Thrust Areas
The Gujarat Industrial Policy 2015 aims at promoting Gujarat as a globally competitive
and innovative industrial destination that stimulates sustainable development and
inclusive growth. The primary mission of the New Industrial Policy 2015 of Gujarat is
to provide proactive support for the development of SMEs, value addition on local
primary sources and increasing the share of manufacturing in state GDP (Gujarat
Industrial Policy 2015 Report). Considering SMEs as the backbone of the economy of
the State, it offers venture capital assistance, interest subsidy and quality certification to
the sector, in subsidized rate, with the aim to make it more competitive. The Policy also
recognizes the importance of ‘Cluster Development Method’ and establishment of
Industrial Estates/ Parks to advance MSMEs. MSMEs are enabled to explore new
markets by supporting them through various Trade Fairs, many of which have been
initiated and organized by various Chambers of Commerce, like Gujarat Chamber of
Commerce and Industry (GCCI), Vadodara Chamber of Commerce and Industry
(VCCI), Federation of Small Scale Industries (FSSI) and FICCI, to mention a few. In
order to ensure development of MSMEs, the Government provides monetary assistance
to large industries to support the establishment of ancillary and auxiliary industries, in
line with mega-projects.

MSMEs in Gujarat State-With Special Reference to Vadodara District
©Ranjita Banerjee 27
The major thrust areas and schemes in support of MSMEs are as under (Source:
Compiled from Gujarat Industrial Policy 2015 Report):
• Providing capital investment subsidy, through an application by the MSME
entrepreneur to the concerned DIC.
• Providing assistance for interest subsidy @ 5% with the maximum amount
of Rs. 25 lakhs p.a. for a period of 5 years in Municipal Corporation areas. In
addition to this, interest subsidy for various sections like for enterprises outside
Municipal Corporation areas, SC/ST entrepreneurs, physically challenged
entrepreneur, women entrepreneur, young entrepreneur etc.
• Providing assistance for Venture Capital: The entrepreneur setting up an
MSME with innovative technology will be assisted to raise promoter contribution
in the form of equity or loan through, under certain terms and conditions.
• Assistance for Quality Certification to introduce quality product in competitive
market. The scheme includes subsidy upto 50% of all charges including
consultancy fee upto a maximum amount of Rs. 50,000 for obtaining ISO
Certification. The scheme further includes subsidy to an MSME for installing
Enterprise Resource Planning (ERP) system, as well as for obtaining certification
for ISI/ WHO-GMP/ Hallmark Certification or other national/ international
certifications approved by Quality Council of India.
• Assistance for Technology Acquisition from a recognized institution by an
MSME for its product / process, during the operative period of the scheme, by
way of 50% of the cost payable subject to a maximum of Rs. 50 lakh, including
royalty payment for first two years. Assistance under this scheme is also provided
to set up a New Enterprise with new technology.
• Assistance for Patent Registration: Individual or any legal entity is eligible for
assistance under the scheme, subject to 75% of cost/ expenditure incurred upto a
maximum of Rs. 25 lakhs for obtaining Patent registration of developed product.
• Assistance for saving in consumption of energy and water: This assistance is
given to existing MSMEs as well as new enterprises taking action for saving in
consumption of energy and water; upto 75% cost of energy/ water audit

MSMEs in Gujarat State-With Special Reference to Vadodara District
©Ranjita Banerjee 28
conducted by a recognized institution / consultant subject to a maximum of Rs.
50,000/- during the operative period of the scheme.
• Assistance to SME for raising capital through SME exchange: To encourage
SMEs to raise equity capital through SME exchange, in line with the new
guidelines of SEBI, assistance is provided to SMEs under this scheme.
• Rehabilitation of Sick Enterprises: The Sick Enterprises, after getting a
registration issued by the Industries Commissioner, may be assisted by banks /
financial institutions as per their prevailing policy.
• Scheme for Awards to MSMEs: With the aim to provide public recognition for
outstanding achievements, the scope of awards to MSMEs in both manufacturing
and export awards is expanded, for their productivity, quality, providing
employment, innovation, product development etc. Further, awards for Women
Entrepreneurs, Young Entrepreneur (below 35 years) and SC/ ST entrepreneur
have also been introduced in the New Industrial Policy 2015 for MSMEs.
• Scheme for assistance for Start Ups/ Innovation, to an individual/ group of
individuals having innovative idea/ concept; upto Rs. 10,000 per month to the
innovator as sustenance allowance for one year, after recommendation of the
project.
It feels proud to state that, as per estimates of the ISED Small Enterprise Observatory
(2013), the State has the First Rank of integrated overall performance of MSMEs at the
national level. According to the Fourth Census of MSMEs, Gujarat stands first in terms
of the asset base of the MSME sector.
3.3.2. Promotional Schemes for the MSME Sector in Gujarat
Some of the promotional schemes for the MSME Sector offered in Gujarat are as follows
to foster the Sector (Source: ISED Small Enterprise Observatory, 2013):
State level Schemes
1. Shri Vajpayee Bankable Yojana
2. Jyotigramodyog Vikas Yojana (margin money bankable scheme)

MSMEs in Gujarat State-With Special Reference to Vadodara District
©Ranjita Banerjee 29
3. ManavkalyanYojana
4. Carpet Industries Programme
5. Village tannery and flaying centre
6. Gramodyog Vikas Kendra
7. Promotion of co-operative sector (package yojana)
8. Cluster development scheme
9. Handlooms schemes
10. Cottage industries training centres
11. Intensive Handloom Devlopment Programm
Centrally Sponsored Schemes
1. Prime Minister’s Employment Genration Programme (PMEGP)
2. Centrally Sponsored Schemes for Handloom Weavers
3. Mill Gate Price Subsidy
4. Handlooms Weavers Comprehensive Welfare Scheme
1. Mahatma Gandhi Bunkar BimaYojana (MGBBY)
2. Health Insurance Scheme
3.4. Vadodara- The Gateway to the Golden Corridor
Vadodara, better known as ‘SanskarNagari’(City of Culture), is the heart of Gujarat State.
It is also famous as ‘The Gateway to the Golden Corridor’ as all the rail and roads
connecting to Delhi, Mumbai and Ahmedabad, pass through the city, including the Delhi-
Mumbai Industrial Corridor (DMIC). It is the exclusive producer of Dolomite and
Fluorspar in the State of Gujarat, thus offering tremendous growth and scope for
processing industries. It is one of the four major industrial districts of Gujarat.
The district has 12 tehsils, 15 towns and 1,548 villages of which the major towns are
Vadodara (District Headquarter), Savli, Waghodiya, Padra, Dabhoi, Karjan and
Sankheda. The district has major PSUs (Public-Sector Units) as well as a host of private

MSMEs in Gujarat State-With Special Reference to Vadodara District
©Ranjita Banerjee 30
large, medium, small and micro industrial units. Proximity of the district with key
industrial centers of Gujarat such as Ahmedabad, Bharuch and Surat could be considered
a major driver for growth of the economy.(MSME Development Institute, GOI, ‘Brief
Industrial Profile of Vadodara District’, 2012)
3.5. MSMEs in Vadodara District
Micro, Small and Medium Enterprises (MSMEs) forms the back-bone of the industrial
matrix of the district. The portfolio of the major exportable items manufactured in the
district include Azithromycin, Caprolactum, Ammonia, Fluconazole bulk, , Melamine,
Polybutadiene Rubber, Pharmaceuticals, Chemicals, Tyres for Automotive vehicles and
tractors, Steam\Gas Turbines up to 500 MW, Automotive Radiators, and Fertilisers&
Pesticides. The existing clusters of Micro and Small Enterprises includes
Pharmaceuticals,, Chemicals & Fertilisers, Biotechnology, Cotton Textiles, Machine
tools, Glass, Engineering, Tobacco, Fisheries and Dairy products. Table 3.4 shows the
number of MSMEs in the district as per the FSSI Directory.
TABLE 3.4 - Number of MSMEs in the Vadodara District as per the FSSI Directory
No. Estate Total No. of MSME Units 1 Makarpura GIDC 1403 2 Sardar Estate 126 3 Patel Estate 144 4 GorwaBidc 89 5 Chhani Estate 85 6 Mujmahuda 23 7 Vadodara City 215 8 Padra Ind. Area 27 9⁻ Misc.(Waghodia GIDC, POR-Ramangamdi) 134
(Source: FSSI Directory, 2005; Estate-wise counting by author)
Table 3.5 displays the number of units, investment and employment details of the Micro
and Small Enterprises and artisan units in the district.

MSMEs in Gujarat State-With Special Reference to Vadodara District
©Ranjita Banerjee 31
TABLE 3.5 - Micro & Small Enterprises And Artisan Units in Vadodara District
NIC Code
Type of Industry No. of Investment Employment
Industry Units (Lakh Rs.)
20 Agro based 1,055 2,205 3,611 22 Soda Water -- -- -- 23 Cotton Textile 1,925 1,642 5,184 24 Woolen, silk & artificial Thread based clothes -- -- -- 25 Jute & Jute based -- -- -- 26 Readymade garments & Embroidery -- -- -- 27 Wood/wooden based furniture 601 332 2,659 28 Paper & Paper products 770 3,677 4,901 29 Leather based 173 98 503 30 Rubber, Plastic & Petro products 1,153 5,758 11,936 31 Chemical & Chemical based 1,411 12,269 12,749 32 Mineral based 885 3,076 14,319 33 Metal based(Steel Fabrication) 2,173 8,176 14,958 35 Engineering Units 1,481 10,132 10,446 36 Electrical Machinery & Transport Equipment 861 2,342 7,393 97 Repairing & Servicing & Others 5,718 4,895 12,495 1 Others -- -- --
(Source: District Industries Centre, Vadodara)
3.5.1. Growth of MSMEs in Vadodara District- An Analysis
Bodies like District Industries Center (DIC), Vadodara Chamber of Commerce and
Industry (VCCI), Confederation of Indian Industries (CII), Federation of Small Scale
Industries (FSSI), FICCI , GCCI as well as many nodal agencies are engaged into a
plethora of activities to encourage and develop the small and medium industries as well
as ancillary and auxiliary industries in the district. Assistance from Government
Departments and other Support Wings has resulted into the gradual and steep growth of
MSMEs over the years. Table 3.6 shows the progress and growth in registration of Micro, Small and Medium
Enterprises in the Vadodara district from the period 2006-2014. The table shows a
steady-fast increase in the number of registered units in the district over the period from

MSMEs in Gujarat State-With Special Reference to Vadodara District
©Ranjita Banerjee 32
2006-2014. The credit surely goes to the various facilities given to the sector as well as
the amicable business environment in the district.
TABLE 3.6 - Progress & Growth in Registration of Micro, Small And Medium Enterprises in Vadodara District during 2006-2014
Year No. of Registered Micro Units
No. of Registered Small Units
No. of Registered Medium Units
02/10/06to31/03/07 104 199 4 2007-08 637 267 12 2008-09 862 283 13 2009-10 673 219 14 2010-11 696 179 12 2011-12 2224 172 11 2012-13 2834 242 15 2013-14 3536 359 30
Total 11566 1920 111 (Source: Compiled by author based on statistics from District Industrial Potentiality Survey Report of Vadodara District 2014-15, MSME Development Institute, GOI)
3.5.2. Problems in the SME Sector in Vadodara District
The MSME Development Institute, Govt. of India, prepared a detailed report on ‘District
Industrial Potentiality Survey Report of Vadodara District 2014-15’ (2015), highlighting,
in addition to other details, the problems faced by the SME sector in the district.
Some of the problems, as mentioned in the ‘District Industrial Potentiality Survey Report
of Vadodara District 2014-15’ are as follows:
1. Low awareness in MSMEs about various schemes of Government of India,
Government of Gujarat and other Government Departments, agencies, Institutes
or Stake holders function for the development of MSMEs because of lack in
corporate governance or due to lack of communication.
2. Global recession of 2008 had slowed down the overall growth of the MSMEs.
Due to failure of banking and insurance company globally, the global credit

MSMEs in Gujarat State-With Special Reference to Vadodara District
©Ranjita Banerjee 33
squeeze had reasonably affected the export textile and jewellery goods, which
created temporary shutdown of production in the sector.
3. Lack of skilled human resources has also affected the sector at noticeable level.
Technology intervention is still very low in the sector. Artisans and weavers are
still unaware of latest designs and current market trends. They continue to
manufacture products with old designs which fail to generate consistent demand
in the consumer markets. Information dissemination about availability of recent
technologies, literature on modern machinery etc. can be worked out.
4. Another major problem related to payment durations normally faced by the
MSME entrepreneurs. Mostly they are causing delay in payments and bad
debts, which causes trouble in the working capital ratio. Low credit period
provided by the suppliers and on other side late payment made by the customers
also creates imbalance in the working capital.
5. One of the major concerns is low credit availability to the MSMEs. Though,
credit to MSMEs fall under the category of priority sector lending, but with the
expansion of the priority sector lending to accommodate fast growing areas such
as home loans, education loans; the percentage share of credit to MSMEs have
been fallen down. There is strong need to increase the target of commercial bank
lending to MSMEs from 20 % year on year growth to 30% which will enhance
the credit facilities to MSMEs.
6. Delay payment issue of Medium Scale entrepreneurs (MSEs) about the
payments not received in stipulated time period for the supply of Goods and\or
Services to larger units or Government’s Departments. Most of the MSEs feel
that remedial measures are taken at slower speed, which creates working capital
crunch\problem for the MSEs.

MSMEs in Gujarat State-With Special Reference to Vadodara District
©Ranjita Banerjee 34
3.6. Summary of the Chapter
The chapter tried to throw some light on the present scenario of the MSMEs in the state
of Gujarat, with special reference to Vadodara district. It gave a bird’s eye-view of the
various statistics of the present scenario with respect to the various major industries in the
state as well as the Number of Units, Investment and Employment in the SMES in the
Gujarat State; as also the Distribution of Clusters in Major Product Lines in Gujarat. It
gave an orientation of the various state-level schemes offered in the state towards the
MSME sector vide the latest New Industrial Policy 2015 of Gujarat. The Chapter also
gave an orientation of the growth and development of the MSMEs in the Vadodara
district, with the latest available statistics. It also discussed the various problems faced
by the sector, based on some recent reports and other secondary sources of information.

CHAPTER – 4
©Ranjita Banerjee 35
CHAPTER – 4
Functional Areas of Small And Medium
Enterprises (SMEs) With Special Reference to HR
Function
4.1. Prologue
This chapter focuses on the functional areas of MSME, with special reference to the HR
function, including other functional areas in brief viz. Finance, Banking Institutions,
Taxation liabilities, Marketing mechanisms and promotional strategies, Marketing
Research. The functional overview of the various facets of SMEs helps to get a holistic
view and extract the maximum potentialities of this vibrant sector.
4.2. Human Resource Management in Small Businesses 4.2.1. HRM as a multi-faceted process in SMEs
Human Resource Management is a multi-faceted process involving various strategic
approaches to manage a company’s most valued assets- the ‘human resources’ in the
organization. It includes a plethora of activities across various areas like human resource
planning, recruitment, selection, motivational techniques, performance management
system, training and development and the like. In a small business the role of HR is very
crucial as it requires the management of multi-skilled people due to requirement of
limited number of people who are required to be multi-tasked.
The majority of publications on HRM within small and medium-sized enterprises are
based on qualitative studies. Heneman et al. conclude that ‘the lack of information about
human resources in SMEs is problematic for theory, research and practice’ (Heneman et
al.,2000). Thus, there is dearth of information about human resource management
practices in MSME’s.

Functional Areas of Small And Medium Enterprises (SMEs) With Special Reference to HR Function
©Ranjita Banerjee 36
4.2.2. HRM Practices in a Small Business
For a small business, there is no formal HR Department in majority of the cases,
however; with the help of HRM and OD consultants, small businesses can be
professionally guided.
The following HR practices are assumed to be quite important for small businesses
(Inputs from Desai Vasant, 2011 and other readings):
• Manpower planning: MPP or HRP in a small business is usually a one man
show or a matter of group decision involving the head of the organization as the
number of people is usually less. There is as such no formal way of job analysis,
or job description, job-specification but it is done in line with the strategic
requirements.
• Recruitment, Selection and Placement: Many small businesses go ahead with
the referral as a selection method to keep a check on the loyalty part of the
employees. The selection of employees in small businesses can be through public
or private employment exchanges, training institutes, local colleges, newspaper
advertisements, professional associations etc.
• Performance Appraisal: T V Rao (2005) in his paper approved of designing a
simple and effective PMS (Performance Management System) for the small and
medium organization and to invest in some amount of training. He focused on
creating a learning environment and being sensitive to factors that help to retain
talent. As in small businesses multi-tasked people are required to function
effectively hence an effective PMS has to be designed to motivate the key people
with monetary or non-monetary incentives.
• Training and development: Mostly on-the-job training is followed in small
businesses. In certain businesses off-the-job training and specialized training is
recommended for. On-the-job training helps the organization to cut costs to the
company, alongwith the added advantage of skilling its people in its own work
environment and work-processes.

Functional Areas of Small And Medium Enterprises (SMEs) With Special Reference to HR Function
©Ranjita Banerjee 37
• Employee compensation: Fringe benefits like health plans, pension plans, bonus,
profit sharing as well as other means of rewarding the employees and especially
high performers have to be specially taken care of by the SME entrepreneurs. Few
key people hold multiple responsibilities in the small businesses and they have a
strong local network; hence it is very important for the business house to
compensate these high performers in a commensurate manner.
• Motivation: Attention should be paid by small businesses with regard to factors
for enhancing higher morale and productivity of their employees. Focus of
entrepreneurs towards motivational aspects in SMEs is quite necessary, as it is
managed with few people, as compared to large organizations.
• Communication: Forms of communication, whether oral or written, should have
clarity, flexibility, be more open, and enhance efficiency and productivity.
4.2.3. Industrial Relations and Labour Laws
For industrial peace and worker co-operation, labour laws and legislations have to be
followed. The laws are mostly same as that is applicable to large enterprises. The
legislation can be categorized as:
a) Laws regulating to working conditions
• Factories Act, 1948
• Laws applicable to specific industries like Mines Act 1952, Indian
Merchant Shipping Act, 1923 and Plantation Labour Act 1998
b) Laws regulating wages
• Minimum Wages Act, 1948
• Payment of Wages Act, 1936
c) Laws relating to social security measures
• Workmen’s Compensation Act, 1923
• Employee’s State Insurance Act, 1948
• Employee’s Provident Fund Act and Family Pension Fund Act, 1952
d) Laws relating to worker’s associations and disputes
• Trade Union Act, 1926
• The Industrial Disputes Act, 1947

Functional Areas of Small And Medium Enterprises (SMEs) With Special Reference to HR Function
©Ranjita Banerjee 38
e) Laws relating to women and child workers
f) Laws relating to environment and pollution control
• Water (Prevention and Control of Pollution) Act, 1974
• Air (Prevention and Control of Pollution) Act, 1981
• Environment (Protection) Act, 1986
4.3. Financial Management in Small Business 4.3.1. Sources of Finance for Small-Scale Sector
In SMEs a substantial proportion of total assets comprise of entrepreneurs personal funds.
The sources that provide funding requirements are usually the commercial banks or
agencies like State Financial Corporations (SFCs), National Small Industries Corporation
(NSIC), Gujarat Industrial Investment Corporation (GIIC), State Industrial Development
Corporations (SIDCs), the State Bank of India (SBI) etc. Figure 4.1 displays the various
sources of finance available to SMEs.
(Source: Small Scale Industries and Entrepreneurship, VasantRao) (Note: MFIs:Micro Financial Institutions; VCs: Venture Capitalists)
Figure 4.1 - Sources of Finance
Figure 4.2 displays the various major credit requirements of SMEs.
Sources of Finance
Fixed Working Capital
State Govt. SFCs NSIC SSICs SIDC
Commercial Banks
Indigenous banks MFIs/VC
Co-op. Banks Money lenders

Functional Areas of Small And Medium Enterprises (SMEs) With Special Reference to HR Function
©Ranjita Banerjee 39
(Source: Small Scale Industries and Entrepreneurship, VasantRao)
Figure 4.2 - Credit Requirements of MSMEs
4.3.2. Institutional Support Structure
The Small Scale Industries Board was set up way back in 1954, as an apex advisory body
constituted by the Government of India, to render advice on various issues pertaining to
the MSME Sector. The office of the Development Commissioner (Small Scale
Industries), known as the Small Industries Development Organization (SIDO) was also
set up in 1954 under the recommendations of the Ford Foundation team of the
Government of India (Since 1991 SIDO is working under the Department of SSI &
A&RI).
• Small Industries Development Organization (SIDO): The major functions of
SIDO comprises of evolving policies and programs related to the SME sector, co-
ordinating policies of state governments, liaisoning with different State/ Central
ministries, Planning Commission, RBI and other financial institutions. It also
monitors government sponsored programs.
Credit requirement of MSMEs
Fixed Capital Working capital or short-term capital
Preliminary expenses
Purchase of fixed assets
Establishment
expenses
Fixed working Capital
Others (misc.)
Goods in process
Inventories Raw Material
Land & Building
Machinery

Functional Areas of Small And Medium Enterprises (SMEs) With Special Reference to HR Function
©Ranjita Banerjee 40
• Institutional Credit Framework: The Government has come up to create a
planned credit framework for credit dispensation for the MSME sector. SIDBI,
for example, is one of the primary financial institution for promotion, finance and
development of this sector. At the state-level, SFCs and SIDCs are the main
source of long-term finance for this sector.
• Schemes of assistance: The financial assistance varies from a multitude of
various reasons like establishment of new projects, increasing operational
efficiency through technology upgradation, rehabilitation of various units, import
of assets etc.
• Small Industries Development Bank of India (SIDBI): SIDBI serves for
various functions of the MSME Sector like for promotional and development
activities of the sector, human resources development activities, technology
upgradation, environment and quality management etc.
4.4. Marketing Management in Small Businesses
Marketing can be defined as a process which identifies, anticipates and satisfies customer
needs efficiently and profitably in line with the business and strategic objectives.
4.4.1. Common Marketing problems faced by small businesses
• Lack of brand image : Due to lack of promotion and advertising mechanisms.
• Product quality and standardization issues: Due to shortage of adequate funds
expenses in quality testing and quality management remains a question mark.
• Lack of efficient sales and marketing people: Dearth of qualified people due to
less incentives and benefits.
• Lack of credit facilities: Buyer’s market while marketing its product and a
seller’s market while buying raw materials.
• Market size: The small businesses usually have a local and limited market size.
This is largely due to insufficient fund to create a wider and penetrating market
mechanism and reach.

Functional Areas of Small And Medium Enterprises (SMEs) With Special Reference to HR Function
©Ranjita Banerjee 41
• Lack of bargaining power in pricing: Unlike the large organizations who create
a niche due to their brand image and positioning, small businesses usually lack
bargaining power.
• Lack of research and product development: Mostly the technology may be
obsolete with the same production process going on year after year.
• Lack of after-sales services
• Lack of marketing knowledge
• Lack of liaison and networking
4.4.2. Institutionalized Marketing for Small Business Entrepreneurs
Due to lack of available funds, in most of the cases the small business entrepreneurs are
not able to expend handsome amount towards marketing research activities. Thus, in
order to encourage marketing and production of new products, the government in most of
the countries and their wings, collect and disseminate information and research data
through reliable marketing intelligence and research tools, on a regular basis.
Various market mechanisms like the concept of Special Economic Zones (SEZ), to
encourage exports and industrial parks etc to reduce the operational costs etc are being
suggested and operationalized to boost and encourage the entrepreneurs.
Further, working in consortiums to organize various fairs, exhibitions, export-oriented
production activities and the like can be institutionalized if the small entrepreneurs come
together and join hands with each other.
4.4.3. E-marketing for small businesses
E-marketing as an electronic method of marketing can affect the marketing strategies of
a business house positively if it adds to the consumer base, consumer value, can enhance
after-sales services as well as can result in new business models.
Making on-line marketing more viable for small businesses
• Create and invest in your company’s website and regularly update it. This will
help to increase networking

Functional Areas of Small And Medium Enterprises (SMEs) With Special Reference to HR Function
©Ranjita Banerjee 42
• Make the web-site more user-friendly and in order of the goals for going in for e-
marketing
• Use various search mechanisms to identify one’s target consumers
• Upload the necessary delivery forms, logistic details and other information and
declaration necessary in order to enhance transparency.
4.5. Production and Operations Management in Small Businesses
Production management refers to the application of planning, organizing and directing
the production process. It refers to the production or creation of goods and services. The
Production Planning comprises of various elements like estimating, routing, scheduling
and loading; whereas Production Control comprises of elements like dispatching,
expediting, evaluating and corrective action.
4.5.1. Materials Management
Efficient materials management is the key to success of small businesses, especially
because the stocks are limited in warehouses or shop-floors. The objectives of materials
management can be enumerated as:
• Optimum pricing of purchasing materials
• Reduced transportation cost
• Better supplier relationships and networking
• Better management of inventories
4.5.2. Inventory Management
Inventory management includes the management of raw materials, components, as well
as the inventories related to maintenance, repair and operating supplies, which do not
directly become the part of the product. It also includes the finished-goods inventories in
addition to the in-process inventories which are a part of the semi-finished products.

Functional Areas of Small And Medium Enterprises (SMEs) With Special Reference to HR Function
©Ranjita Banerjee 43
The techniques most commonly used for inventory control are:
• ABC Analysis (Always Better Control): ‘A’ items are of high value, ‘B’ items
of medium value and ‘C’ items of low value, based on the annual consumption of
inventories in monetary value. (Also known as Pareto Analysis).
• High, Medium and Low (HML): This classification is based on the unit value of
the item. It is in line with the ABC Analysis.
• Vital, Essential and Desirable (VED): VED classification is based on the
criticality of inventories and its effect on the production and other services.
• Just in Time (JIT): The JIT concept is very much applicable to the small
businesses. It implies that virtually no inventories are held at any stage of
production and that the exact number of units is brought to production at the right
time.
• Two Bin Systems (TBS): As small businesses are expert in meeting the
contingent requirements of the economy or local people, the TBS is also very
applicable. One bin contains stock just enough to last from the date a new order is
placed and the other bin containing stock enough to satisfy probable demand
during the period of replenishment.
4.5.3. Total Quality Management (TQM)
TQM is a management approach which entails to the concept of fostering ‘continuous
improvement’ in the production process. The five pillars of TQM are product, process,
people, system and leadership. It stresses on the management philosophy of working
systematically, with an integrative and consistent approach and involvement of maximum
people possible. It focuses on a ‘systems’ and ‘process’ approach and team-work. It leads
to incorporating various customer-focused strategies as one of the key quality
management principles. The small businesses, in a bid to compete globally, are stepping
ahead towards preparation and implementation of ISO and other quality assurances and
national/ international quality certifications as well as on Environmental Management
Systems. Government provides subsidies for MSMEs to go through the ISO Certification
process.

Functional Areas of Small And Medium Enterprises (SMEs) With Special Reference to HR Function
©Ranjita Banerjee 44
4.6. Summary of the Chapter
For small businesses, strategic decision making is the key to organizational success.
Changes in customers’ needs, preferences, demand, new moves of competitors, new need
of the economy, tapping the local requirement, handling changes in market fluctuations
and the like are the key to organizational success for small businesses, by effectively
tapping the challenges into opportunities. They can accomplish all these goals only by
incorporating systems approach wherein the various functional areas viz. finance,
production, operations, human resource and marketing, come together and work as a
synergy to meet the strategic goals. Chapter 4 discussed the various functional
departments of the SMEs at length. However, the fact remains, as was observed as well
as told to the author by the owners and Managing Heads, that in SMEs the owners as well
as Managing Heads, including HR Managers and Supervisors, are skilled enough to take
care of all Functional Departments. The senior management becomes multi-skilled over
time due to the nature of the work and knows the functioning of all departments.

CHAPTER – 5
©Ranjita Banerjee 45
CHAPTER – 5
Micro, Small And Medium Enterprises
Development (MSMED) Act, 2006 & New Policy
Initiatives in the SME Sector
5.1. Prologue
The Micro, Small and Medium Enterprises Development Act, 2006 was enacted with the
objective to provide for facilitating the development and promotion of the Micro, Small
and Medium enterprises. The Act is operational since October 2, 2006. As compared to
the SSI Act under the IDRA, the MSMED Act 2006 is far more comprehensive.
5.2. Objectives of the MSMED Act, 2006
Ministry of Micro, Small & Medium Enterprises (M/o MSME) envisions a vibrant
MSME sector by promoting growth and development of the MSME Sector, including
Khadi, Village and Coir Industries (which is India’s legacy hallmark), in cooperation
with various Departments/ Ministries, State as well as Central Government, Industry
Associations and other Stakeholders, by way of providing support to existing enterprises
and encouraging creation of new enterprises. The objectives of the MSMED Act, 2006 are:
• To facilitate the promotion and development of the Micro, Small and Medium
Enterprises (MSMEs).
• To make the MSMEs more competitive, nationally as well as globally

Micro, Small And Medium Enterprises Development (MSMED) Act, 2006 & New Policy Initiatives in the SME Sector
©Ranjita Banerjee 46
• To concentrate on various related matters of MSMEs.
• To extend the scope of benefits from SSI undertakings and ancillary industries to
MSM enterprises.
5.3. MSME Defined under the Act and Organizational Set-up
In India, the MSMED Act 2006 defined the Micro, Small and Medium Enterprises based
on the investment in plant and machinery in the Manufacturing as well as Service
industry. Table 5.1 defines MSMEs according to the MSMED Act, 2006.
TABLE 5.1 - Micro, Small and Medium Enterprises Defined
Enterprises Investment in Plant & Machinery (Manufacturing Industry)
Investment in Equipment (Service Industry)
Micro Up to Rs. 25 lakhs Up to Rs. 10 lakhs
Small Above Rs. 25 lakhs up to Rs. 5 crore Above Rs. 10 lakhs up to Rs. 2 crore
Medium Above Rs. 5 crore up to Rs. 10 crore Above Rs. 2 crore up to Rs. 5 crore (Source: MSME, Annual Report 2014-15)
The Ministry of MSME (M/o MSME) has two main Divisions called Small & Medium
Enterprises (SME) Wing and Agro & Rural Industry (ARI) Wing. The SME Wing is
responsible for the administration, vigilance and administrative supervision of the
National Small Industries Corporation (NSIC) Ltd., a public sector enterprise and
National Institute for Micro, Small and Medium Enterprises (NI-MSME), the
autonomous national level entrepreneurship development/training Organization. The
SME Wing is responsible for the Performance and Credit Rating Assistance.
The Agro & Rural Industry (ARI) Wing is primarily responsible for the two statutory
bodies viz. the Khadi and Village Industries Commission (KVIC), Coir Board and a
Society called Mahatma Gandhi Institute for Rural Industrialization (MGIRI).
The Micro, Small and Medium Enterprises – Development Organization (MSME-DO)
[earlier known as SIDO], headed by the Additional Secretary & Development

Micro, Small And Medium Enterprises Development (MSMED) Act, 2006 & New Policy Initiatives in the SME Sector
©Ranjita Banerjee 47
Commissioner (MSME), is the apex body for formulating as well as implementing the
policies for the MSMEs in the country. (MSME Annual report 2015-16)
5.4. National Board for Micro, Small And Medium Enterprises –NBMSME (Apex Consultative Body)
With the aim to facilitate co-ordination and inter-institutional linkages, and in line with
the MSMED Act, 2006, a National Board for Micro, Small & Medium Enterprises (NB
MSME), has been constituted as an apex advisory body to render advice to the
Government on all issues pertaining to the MSME sector. The Head Office of the Board
is located at Delhi. It is the apex Consultative Body with a wide representation of
stakeholders. Quarterly meetings of National Boards are made compulsory MSME
Annual Report 2015-16. The Minister In-charge of MSME of the Government of India is
the Chairman.
5.5. National Institute for Micro, Small and Medium Enterprises (NI-MSME)
In order to ensure that young entrepreneurs are encouraged and suitably equipped to go
into new ventures, the Ministry has set up a National level Entrepreneurship
Development Institutes namely, National Institute for Micro, Small and Medium
Enterprises (NI-MSME) to undertake the task of entrepreneurship and skill development
training on a regular basis. NI-MSME has been rendering its services for MSMEs since
the last five decades (precisely since the last 53 years). The Institute has identified thrust
areas that need emphasis and exploration. These are: Entrepreneurship Development,
Technology Up-gradation & Transfer, Policy Issues, NGO Networking, Environment
Concerns, Cluster Development, Management Consultancy, Quality Management
Services, Financial Services, and Information Services (Source: MSME Annual Report
2015-16).

Micro, Small And Medium Enterprises Development (MSMED) Act, 2006 & New Policy Initiatives in the SME Sector
©Ranjita Banerjee 48
5.6. National Small Industries Corporation (NSIC) Limited
National Small Industries Corporation (NSIC) Ltd. is an ISO 9001-2008 certified
Government of India Enterprise under Ministry of Micro, Small & Medium Enterprises
(MSME). NSIC has been working to fulfill its mission of promoting, aiding and fostering
the growth of small industries in the country as well as abroad, by promoting
modernization, technology upgradation, fostering quality conformance and
consciousness; developing vertical, horizontal or ancillary linkages with medium / large
enterprises as well as by fostering exports. NSIC operates through countrywide network
of 168 offices and 07 Technical Centres in the country (as of 2015-16).
5.7. Initiatives Undertaken By the Ministry of MSME in the Recent Years
During the year 2015, Ministry of MSME launched various initiatives to improve the
ease of doing business and to make Micro, Small and Medium Enterprises more globally
competitive. Some of the noteworthy initiatives included ease of registration of the
business in the form of Udyog Aadhar Memorandum (UAM), Framework to revive sick
MSMEs, promoting innovation in rural entrepreneurship through ASPIRE scheme, fund
for regenerating traditional industries, financial support in the form of credit guarantee
and credit linked capital subsidy.
The various noteworthy initiatives undertaken by the Ministry of MSME in the recent
years as of 2015-16 are as follows (Source: http://MSME.gov.in/mob/home.aspx, as on
July 2016 and MSME Annual Report 2015-16):
• Ease of Registration Process of MSMEs- Udyog Aadhar Memorandum (UAM):
With the aim to simplify forms to enable ease of registration of MSMEs, the M/o
MSME has notified a simple one-page Registration Form Udyog Aadhar
Memorandum (UAM), to enable easy and smooth registration of MSMEs. The UAM
replaces the cumbersome filing of Entrepreneur’s Memorandum (EM Part I & II), and
is a path-breaking step to promote ‘ease of doing business’ by enabling on-line filing,
and instantly receiving a unique Udyog Aadhar Number (UAN). Under the UAM,
more than 2.30 lakh units have been registered as on 17.02.16 (according to the

Micro, Small And Medium Enterprises Development (MSMED) Act, 2006 & New Policy Initiatives in the SME Sector
©Ranjita Banerjee 49
MSME Annual Report 2015-16).
• An 'Investor Facilitation Portal' (IFP) launched by the Department of Industrial
Policy and Promotion (DIPP), is a single window online platform which acts as the
first point of contact for any probable investor in the State of Gujarat. This portal
reduces contact between the investor and officials of different departments to a nil
thus reducing the steps required in getting an approval. It has the following main
features:
- A comprehensive list of Pre-Establishment as well as Pre-Operation
approvals required for setting up a business
- A customized list of approvals required by the investor specific to their
business by keying in certain details in the form of 19 questions
- Online facility for filling of all required forms and payments
- Online availability of certificates and licenses to view as well as download
- Dashboard to view all the applications and their status
- A unique account for each investor for all communications across
departments via the IFP
- A robust on-line grievance redressal mechanism
- A helpline number for all enquiries as well as an 'Investment Facilitation
Cell'
- Common Application Form across all departments to reduce gestation
period
- Incentives under various policies provided under the single window online
portal
• Prime Minister Employment Generation Program (PMEGP): It is a credit-linked
scheme to facilitate participation of financial institutions for SME funding for higher
credit-flow. The objective is to encourage start-ups in rural as well as urban areas to
generate continuous and sustainable employment opportunities.

Micro, Small And Medium Enterprises Development (MSMED) Act, 2006 & New Policy Initiatives in the SME Sector
©Ranjita Banerjee 50
• National Manufacturing Competitiveness Programme (NMCP): Under the
NMCP, Government encourages various components to improve the processes,
designs, technology and market access of MSMEs through interventions like lean
manufacturing, quality management systems, design clinics, etc.
• ASPIRE (A Scheme for Promotion of Innovation, Rural Industry and
Entrepreneurship): The objective of this scheme is to promote innovation and rural
entrepreneurship by making easy availability of funds, technology business
incubators and the like.
• Scheme of Fund for Regeneration of Traditional Industries (SFURTI): The
objective is to make traditional industries more productive, competitive and
sustainable by organizing the traditional industries and artisans into clusters.
• Performance and Credit Rating System: The idea is to create a rating system for
MSEs to generate an awareness about the strengths and weaknesses of operations and
credit-worthiness of the enterprises. The system helps to create easier/ cheaper access
to credit for the rated enterprises. The scheme thus indirectly helps to create a spirit of
competitiveness, innovation, enterprise and excellence among the SMEs.
• Assistance to Training Institution: With the motto to promote entrepreneurship and
skill-development through capital grant for creating / strengthening of infrastructure
and program support to Training institutions enabling such training and skill
development.
• Marketing Assistance: To encourage MSMEs to organize/ participate in exhibitions
and show-casing their products and services in the local as well as the global market
by organizing Buyer-Seller Meets, Exhibitions, Intensive Campaigns as well as other
marketing promotion events.
• Credit Linked Capital Subsidy Schemes (CLCSS): The scheme enables the
MSMEs to enhance their productivity by adopting various capital-intensive and
technology-intensive production methods through subsidies/ capital flow.
• Credit Guarantee Fund Scheme: To get collateral free credit from financial
institutions/ banks, which can help to enhance the quality and timely delivery of
products / services through easy funding.

Micro, Small And Medium Enterprises Development (MSMED) Act, 2006 & New Policy Initiatives in the SME Sector
©Ranjita Banerjee 51
• Micro & Small Enterprises Cluster Development Program (MSE-CDP): This
scheme helps to enhance and develop cluster infrastructure projects for various utility
services like power distribution, water, drainage, environment management systems,
tele communication etc.
• Tool Rooms: The Technology Development Centres are assisting to train MSMEs
owners and youth to upgrade their technology in order to face the competition.
• International Co-operation: This scheme promotes MSMEs to acquire new
markets oversees as well as their branch offices/ business counterparts here in India.
• Surveys, Studies and Policy Research: The scheme encourages organizations/
institutions to undertake research projects and surveys encompassing various facets of
policy eco-system.
• Other Schemes like Coir UdyamiYojana (CUY), Coir VikasYojana (CVY), Mahila
Coir Yojana (MCY) etc. have further assisted the artisans / small enterprise owners to
focus on marketing strategies, adopting modern technologies, credit-linked subsidies
etc to enhance the particular industry.
• Fiscal benefits: Various tax-rebates, exceptions, subsidies, tax-holidays etc had been
initiated for the MSME sector to enhance and protect it. Taxation benefits like
income-tax, excise-duty, sales tax, electricity duty, octroi and the like helps to
increase investments in various productive activities with relation to small businesses
and ancillary industries.
Small businesses are given preferential treatment while framing taxation policies on
account of the various problems and risks which they face as compared to their larger
counter-parts viz. technology obsolescence, financial and infrastructural bottlenecks,
competitive global environment etc. Concessions in excise duties, sales-tax etc. can
entail to better marketing, raw material and investment support. Fiscal incentives are
provided in the form of exemptions, rebate, refund, postponement of tax levies,
subsidies, tax concessions, tax holidays etc.
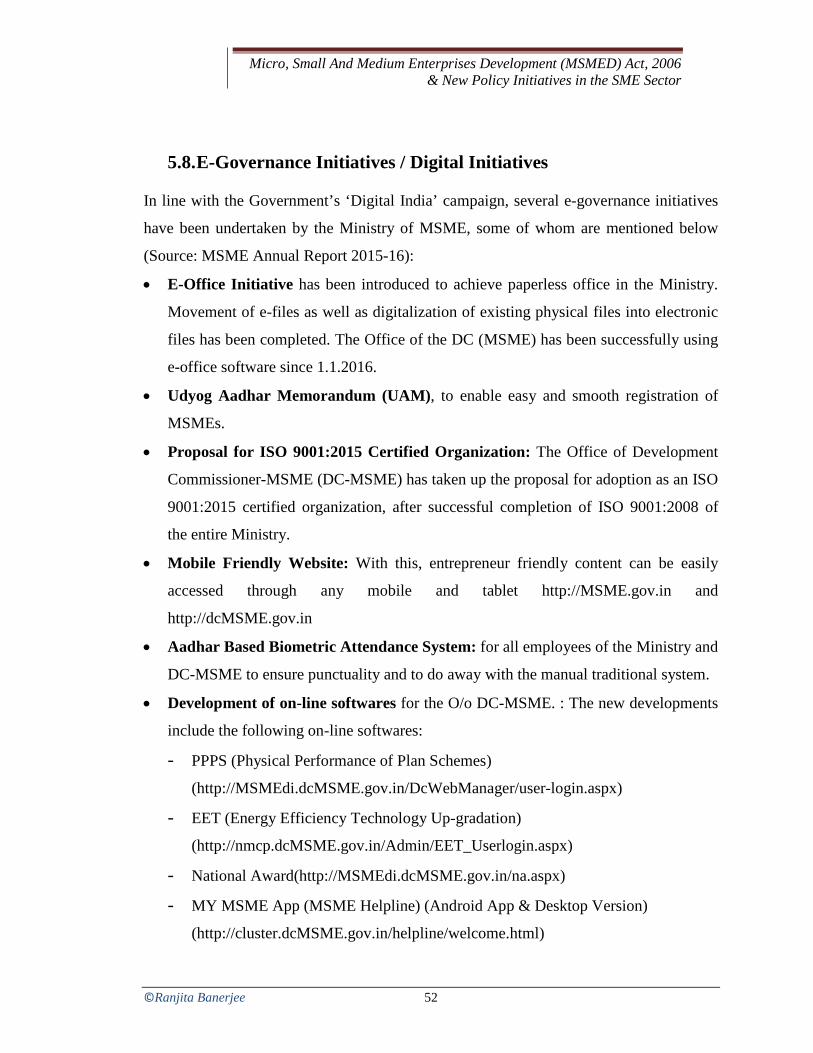
Micro, Small And Medium Enterprises Development (MSMED) Act, 2006 & New Policy Initiatives in the SME Sector
©Ranjita Banerjee 52
5.8. E-Governance Initiatives / Digital Initiatives
In line with the Government’s ‘Digital India’ campaign, several e-governance initiatives
have been undertaken by the Ministry of MSME, some of whom are mentioned below
(Source: MSME Annual Report 2015-16):
• E-Office Initiative has been introduced to achieve paperless office in the Ministry.
Movement of e-files as well as digitalization of existing physical files into electronic
files has been completed. The Office of the DC (MSME) has been successfully using
e-office software since 1.1.2016.
• Udyog Aadhar Memorandum (UAM), to enable easy and smooth registration of
MSMEs.
• Proposal for ISO 9001:2015 Certified Organization: The Office of Development
Commissioner-MSME (DC-MSME) has taken up the proposal for adoption as an ISO
9001:2015 certified organization, after successful completion of ISO 9001:2008 of
the entire Ministry.
• Mobile Friendly Website: With this, entrepreneur friendly content can be easily
accessed through any mobile and tablet http://MSME.gov.in and
http://dcMSME.gov.in
• Aadhar Based Biometric Attendance System: for all employees of the Ministry and
DC-MSME to ensure punctuality and to do away with the manual traditional system.
• Development of on-line softwares for the O/o DC-MSME. : The new developments
include the following on-line softwares:
- PPPS (Physical Performance of Plan Schemes)
(http://MSMEdi.dcMSME.gov.in/DcWebManager/user-login.aspx)
- EET (Energy Efficiency Technology Up-gradation)
(http://nmcp.dcMSME.gov.in/Admin/EET_Userlogin.aspx)
- National Award(http://MSMEdi.dcMSME.gov.in/na.aspx)
- MY MSME App (MSME Helpline) (Android App & Desktop Version)
(http://cluster.dcMSME.gov.in/helpline/welcome.html)

Micro, Small And Medium Enterprises Development (MSMED) Act, 2006 & New Policy Initiatives in the SME Sector
©Ranjita Banerjee 53
- ISO-9000(http://MSMEdi.dcMSME.gov.in/iso9000.aspx )
- Single login online Application Schemes (Desktop Version & Android App)
(http://MSMEdi.dcMSME.gov.in/dcmsmseapp.aspx)
5.9. Micro, Small & Medium Enterprises Development (Amendment) Bill, 2015
After almost nine years of the MSMED Act, 2006, the Micro, Small and Medium
Enterprises Development (Amendment) Bill, 2015 was introduced in the LokSabha on
20.04.2015. The Amendment Bill is intended to move in line with the enormous changes
faced in the economy, nationally as well as internationally. The objectives of the
proposed amendments are to:
i. Enhance the existing limit for investment in plant and machinery considering
changes in price index and cost of inputs consistent with the emerging role of the
MSMEs in various Global Value Chains.
ii. Include medium enterprises apart from small enterprises in section 7(9) to enable
the aforesaid category of enterprises to avail the benefits and become competitive.
iii. Empower the central Government to revise the existing limit for investment by
notification, considering the inflation and dynamic market situation.
5.10. Summary of the Chapter
It can be ascertained from the plethora of new initiatives and policies incorporated
recently as of 2015-16, as well as since the last few years, by the Ministry of MSME, that
a lot has been done to encourage the MSME Sector, realizing its importance in an
emerging economy like that of India. Lots of aid and grants-in-aid for the sector is being
incorporated by both, the Central and State Governments.
Many initiatives are being undertaken by the Ministry to upgrade the technology as well
as human resource aspect in the sector. Various schemes have been initiated at the
District/ State level by various Governments due to sheer encouragement provided from

Micro, Small And Medium Enterprises Development (MSMED) Act, 2006 & New Policy Initiatives in the SME Sector
©Ranjita Banerjee 54
the Centre. The chapter discussed in detail the various intricacies of the MSMED Act,
2006, and various policy initiatives undertaken by the Government.

CHAPTER – 6
©Ranjita Banerjee 55
CHAPTER – 6
Review of Literature
6.1. Prelude
The Review of Literature in the chapter has been arranged chronologically starting from
the year 1984 to the recent developments in the year 2014-15; thus show-casing the
developments related to the study/ sector over the last three decades. The chapter has
been divided into mainly two parts. Firstly, the literature on MSMEs and the HR
scenario has been discussed. Secondly, a detailed literature on the HR practices and
performance of SMEs has been discussed.
The literature has been divided according to the following scheme arranged
chronologically:
• Part- I: SMEs and the HR Scenario – Literature Review
- Articles from Journals
- From Books/ Published Reports
- From Thesis / Dissertation
• Part-II: HRM Practices and SMEs Performance – Literature Review
- Articles from Journals
- From Books/ Published Reports
- From Thesis / Dissertation
In this Chapter alone, over 72 literature has been reviewed at length; which includes 47
articles from national/ international journals, 16 literature from Books/
Government or Institutional Reports and 9 literature from Thesis/ Dissertation,
about the HR scenario and firm’s performance in the SME sector, in the world over and
in India.

Review of Literature
©Ranjita Banerjee 56
In the thesis, all the chapters have been backed generously by literature review, making
the total reference in the thesis to about 200 articles from journals/ books/ thesis.
6.2. SMEs and the HR Scenario – Literature Review
HRM practices in SMEs are either formal or informal. A formal HR system can be said
to be the extent to which HR practices are systematized, documented as well as have
identifiable policies, rules and regulations, and is not dealt in a case-by-case method as is
in the case of informal mechanism (Nguyen & Bryant, 2004). A study in the U.S by
Hodgetts and Kuratko (1998) found that each year the number of business failures in
small businesses have been increasing by thousands, and surprisingly the main reason as
cited by the owners had been ‘managerial incompetence’.
6.2.1. Literature from Journals
Chandler and McEvoy (2000) state that even if it is indicated by published researches that
effective HRM is one of problems that SMEs face, there is lack of research identifying
practices used by SMEs. This implies that more researches concerning HRM in SMEs are
in needed (Heneman & Tansky, 2003).In small enterprises owner managers are
responsible for decisions related to human resources. Their managerial style has a direct
influence on the HRM practices (Koch de Koch, 1999).
It is deduced by HR commentators and practitioners that there can be no universal
prescription for HRM practices and policies. It is basically based on the business needs of
the firm within its context (culture, structure, technology and processes) (Armstrong
Michael, 2006).
McEvoy (1984) studied the personnel practices of 84 small businesses near a large
Midwestern metropolitan area (in the American Midwest, comprising of about 13 states)
came to the conclusion that small businesses lacked creative staffing practices. His study
also deduced that managers of small firms lacked training in formal personnel
management practices and that they did not consider the use of generally accepted HRM
practices as essential for improving productivity. His study further inferred that
functional areas like Production, Finance and Marketing were given more preference in

Review of Literature
©Ranjita Banerjee 57
small businesses, as compared to the Personnel Management functions. His study
concluded deducing that lack of HRM practices was the leading cause of failures in small
firms.
Hornsby J S et.al (1999) tried to understand the HR practices and trends in the U.S small
businesses. HR practices were studied in 341 small businesses in Mid-West and South-
east U.S. The HR practices considered in the study were in the five areas viz. Job analysis
and description, recruitment and selection, training, performance appraisal, benefits and
incentives. The respondents were also asked to rate the frequency of its use as well as
effectiveness of the specific HR practice, which brought out the effectiveness of the HR
practices as well, as an outcome of the study. ‘Job-observation method’ was found out to
be the major job-analysis method; ‘news-paper and walk-ins were found out to be the
most effective recruitment methods; whereas ‘interviews’ was found to be the most used
selection method. Over 72% firms had some sort of incentive plan but offered very little
variety in the type of incentive plans; 61 percent firms appraised their employee’s
performance; 94 percent firms provided some sort of training; coaching was found out to
be the most effective way of training in small businesses in the survey. However, it was
also found out that that there was a disinterest in utilizing some of the modern tools to
develop human resources at the work-place among small businesses.
Budhwar, P.S., and Khatri, N. (2001) in their study on 137 Indian manufacturing firms
deduced that, there existed a number of significant correlations between a set of
contingent variables (i.e. age, size, ownership, life cycle stage and HRM strategies of an
organization, type of industry and union membership) and four HRM functions of
recruitment and selection, training and development, compensation and employee
communication.
Maryse J. Brand & Erik H. Bax (2002)summarized the linkage between Strategic
HRM in general and HRM in smaller firms in particular, in industrialized high growth
countries, it took the Dutch situation as a specific case. They concluded that although
general support exists for the idea that Strategic HRM is relevant for small firms, the
available knowledge is highly descriptive and fragmented and yields no theoretically

Review of Literature
©Ranjita Banerjee 58
supported guidelines for SMEs and/or institutions that are working with SMEs. In order
to provide a theoretical base for such guidelines, they introduced the Strategic Labour
Allocation Process – model (SLAP-model) which links the firm’s internal labour supply
and demand to the firm’s strategy and the significant developments in its environment.
According to Cardon and Stevens (2004), as resources are likely to be scarce in small
firms, hence there may be a very small number of formal HR departments or
professionals, increased difficulty in recruiting and retaining employees due to lack of
financial resources, and an increased reluctance to engage in costly or restrictive
practices.
Pearson, Terry R et al (July 2006) in their research paper ‘Urban vs. rural: Human
Resource Management in SMEs’, focused on the descriptive study of SHRM philosophy
climate and skills development in the selected SMEs in the state of Karnataka. The study
concluded that the development of human resources cannot be left to individual initiative;
it has to be built into planned programs and implemented as a conscious and sustained
effort.
According to Behrands (2007), smaller businesses often abstain from any systematic and
professional approach when selecting new employees. They rarely use any long-term
planning of human resource requirements, job-profiles and other related issues, and usage
of formal selection instruments is normally limited to the conducting of interviews.
Singh M &Vohra N (2009) deduced in their study that the level of formalization of
HRM practices in SMEs in India was low. They also concluded that owner-managers
played a central role in the HR functions of their enterprises. They further deduced that as
compared to small enterprises, the level of formalisation was found to be higher for
medium enterprises.

Review of Literature
©Ranjita Banerjee 59
6.2.2. Literature from Books / Published Reports
Planning Commission, Government of India (Dec 2002), in its ‘Report on the
Committee on India Vision 2020’,envisioned a very high employment potential in textile
and garment production units in the SSI sector. The report concluded that a healthy and
rapidly expanding small sector is needed for vibrant growth of the Indian economy. The
Report concluded that SSIs were found to be more resistant to the stresses as well as are
more responsive to the demands of the fast-changing technologies and entrepreneurial
responses. The Report suggested for a comprehensive package of venture capital, credit,
liberalization of controls & policies coupled with HR related aspects like technical
training, marketing and management measures, to ensure the continuous expansion of
this sector.
Boxall and Purcell (2008) argue that only firms which have grown beyond about 150-
200 employees employ HR specialist. They further found that there is also lack of
researches as to from when the SMEs employ an HR person to take care of HR functions.
Matthias Fink &Sascha Kraus’s(2009) book on ‘The Management of Small and
Medium Enterprises’ investigates the underlying mechanisms and practices of
management within SMEs, based on a large number of conceptual and empirical research
contributions. The book offers various new tools and strategies useful for SME
entrepreneurs as well as new venture managers as well as research scholars and
academicians.
Senyucel Z (2009) in the book titled ‘Managing the human resource in the 21st century’
highlights the changing roles of HR practitioners for today’s organizations. The writer
believes that there are three roles for the HR Practitioners to adopt: Traditional, Assistant
and Campaigner Role; irrespective of the size of the organization. As a campaigner, HR
managers perceive themselves as visionaries who see what needs to be done and try to
influence employee’s decision towards their own desirable direction. The advantage of
this role is its emphasis on communication between management and employees or
between different heads of departments, as the case may be.

Review of Literature
©Ranjita Banerjee 60
MSME Annual Report, 2009-10, GOI, recommended six major thematic areas
including credit, marketing, labor, rehabilitation and exit policy, infrastructure,
technology and skill development and taxation. The implementation of these areas was to
be monitored by the Prime Minister’s Council on Micro and Small Enterprises to be set
up in the Prime Minister’s Office. The Ministry promoted MSMEs through cluster-based
approach and also focused on entrepreneurship and skill development of MSMEs.
However, initiatives regarding HR practices in SMEs in particular, seemed missing in the
report.
Prime Minister’s Task Force Report on MSME, Govt. of India, (Jan 2010),
recommended that simplified labour laws should be practiced in MSMEs as the
transaction costs for complying with these laws is disproportionately high for these units.
Further, the Report also came up with the recommendation that due to the large size of
the unorganized sector within MSMEs, the labour related issues for this sector should be
focused more on welfare rather than legislation by use of the Unorganized Workers
Social Security Act, 2008. The Report also concluded that that the turnover rate is very
high in the sector, although it employs substantial manpower. The Report recommended
on the need to foster linkages between MSMEs and research & development institutes in
the country, in order to enhance the performance of this sector.
MSME Annual Report, 2010-11, GOI,focused on the implementation of Cluster
Development Programs for the MSME Sector (MSE-CDP). The main objective of such
Cluster Programs was to provide extensive support to the MSMEs. Various state-wide
‘soft-interventions’had been initiated like export promotion, marketing development,
technology upgradation, seminars, workshops, study visits etc; as well as ‘hard-
interventions’ like setting Common Facility Centres and infrastructure upgradation
across various states. Various schemes had been initiated by the Government by
providing grants with a ceiling, with the intention to undertake diagnostic study,
feasibility study or to undertake financially viable projects for business development.
Development Commissioner, (MSME) Ministry of MSME, GOI, (2010-11), in its
report on ‘Initiative of the Ministry of MSME’s in recent years’, declared to take up skill
development as a high priority as an HR initiative. Under the Entrepreneurship Skill

Review of Literature
©Ranjita Banerjee 61
Development Programs conducted by various organizations of the Ministry of MSME,
about 3.5 lakh people underwent the training programs during 2009-10. Further, the
Ministry also provided assistance to the Training Institutions established by Partnership
Institutions (PIs) of National Level Entrepreneurship Development Institutes (EDIs) and
franchisees of National Small Industries Development Corporation (NSIC).
Cooper and Burke (2011) in their book deduced that there are significantly more SMEs
than larger organizations, they also employ more people and exist in every country.
Eventually they expand and enter their success time to the next step of larger enterprises
in the future.
‘Effective Human Resources Management in Small and Medium Enterprises: Global
Perspectives’ written by Machado Carolena & Melo Pedro (2013), addresses various
issues like management philosophies, culture and management practices and issues
related to HRM in SMEs. The book provides useful inputs for academics, researchers,
managers as well as SME owners, in both private and public sectors.
Shoaib Nawaz’s (2014) book titled ‘Guideline to develop HR Policies for SME (Case
study of TurkPlast)’ provides new policies for existing HR Departments of SMEs to
increase their firm’s ROI as well as strategies to motivate the employees of the SME
firms. The book discusses in detail a case-study of an organization ‘Turk Plast’ with an
understanding as to how HR policies needs to be tailor-made according to the type and
requirements of SME firms. The book gives useful guidelines for the organizations,
especially SMEs, who yet do not have an HR department and wish to establish one.
MSME Annual Report (2015-16) shows several thrust areas and new initiatives for the
skill development of the labours as well as the executives or entrepreneurs of MSMEs. A
lot of initiative for imparting training as well as for performance measurement of SMEs is
being noticed in the Report. In order to ensure that young entrepreneurs are encouraged
and suitably equipped through skill development training to go into new ventures, the
Ministry of MSME has set up a National level Entrepreneurship Development Institutes
namely, National Institute for Micro, Small and Medium Enterprises (NI-MSME). With
the aim to promote and accelerate entrepreneurship and training infrastructure as well as

Review of Literature
©Ranjita Banerjee 62
training programs, the Ministry has been implementing an important scheme viz.
“Assistance to Training Institutions (ATI)”. As reported by KVIC (Khadi and Village
Industries Commission), 6 workshops, 59 awareness camps and 51 (PMEGP) exhibitions
have been organized during 2015-16 (upto 31.01.2016) and 24811 persons have
undergone EDP training during 2015-16 (upto 31.01.2016). The MSME Annual Report
2015-16 positively shows a remarkable change in the focus and activities, when
compared to the previous Annual Reports, in the areas of skill-development through
training programs and training infrastructure, performance measurement of SMEs
through third-party national/ international bodies, international co-operation as well as
survey research and assessments.
6.2.3. Literature from Thesis
Shaikh M (2011) in his thesis titled ‘A study on the strategic role of HR in IT industry
with special reference to select IT / ITES organizations in Pune city’, aimed to find out
the extent to which strategic role is performed by the human resource function in the IT/
ITES organizations. The study tried to assess the extent to which the different roles are
performed by the HR department across these organizations. It also tried to understand
the differences in the perception about the quality of services provided by the HR
department and the perception differences among the employees as well as the HR staff.
It was found that there existed differences in the perceptions; the employees did not rate
the work of HR staff as that of high quality, while the HR staff perceived to be of high
quality.
Husien W A (2012) in his thesis on ‘Role of strategic human resources management on
SMEs performance in Iraq’ aimed to determine the role of SHRM in Iraq SMEs. 87
respondents were investigated in the research within the SME industries in Baghdad,
Iraq. The findings indicated that SHRM components like alignment, performance
appraisal line manager, training, compensation and employee participation are significant
to SMEs performance, particularly in Iraq.

Review of Literature
©Ranjita Banerjee 63
6.3. HRM Practices and SMEs Performance – Literature Review
It is a matter of great discussion among HR researchers regarding how the overall set of
HR practices is associated or linked with firm performance and competitive advantage
(Ferris et al., 1999). The well-known ‘resource-based view’ with respect to human
resources which provides a unique source of competitive advantage on account of its
inability to be replicated or imitated, is well-established (Barney 1991; Wright et. al
1994; Boxall 1996, Ferris et.al 1999). There is an increasing empirical evidence
suggesting that HR bundles which are mutually reinforcing, synergistic and overlapping
facilitate employee commitment and involvement (MacDuffie, 1995; Guthrie, Spell &
Nyamori, 2002; Camps & Luna-Arocas, 2010).Bundles are superior to any of the
individual human resource activities of which they are composed in enhancing and
facilitating positive changes in productivity (Ichniowski, et al, 1993).
Previous studies identified training efforts as one of the primary factors to improve
organizational performance. High performing organizations tend to spend more time on
training especially on communication and team skills (Lau & Ngo, 2004; Wimbush,
2005). The study by Erdil & Gunsel (2012) further corroborated the strong link between
training in multiple functions and organizational performance.
Thus, the resource-based view has initiated a plethora of research work on how HRM
practices contribute to firm’s performance by leveraging desired attitudes as well as
behaviors (Wright et al 1994; Lado & Wilson, 1994; Becker & Gerhart, 1996)
6.3.1. Literature from Journals
Wright and McMahan (1992) deduce and argue that researchers should examine
‘bundles’ of HR practices and their collective effect, rather than the effect of isolated HR
practices, on firm performance.
Deshpande, S. P. & Golhar, D. Y.’s (1994) study emphasized on the importance of the
role of HRM practices in SMEs. They came to the conclusion that there was a substantial
lack of information in a number of areas in small firms, especially in the areas of: the
extent of the utilization of traditional human resource management functions; the level of
support systems; and the education, experience and expertise of the employee(s)

Review of Literature
©Ranjita Banerjee 64
responsible for human resource actions in SME’s. Their empirical data revealed that
smaller organizations do not have formal HR departments nor do they adopt traditional
HRM practices. Their study revealed that small business owners need to realize that
personnel practices shall be able to reinforce the basic worker characteristics.
Arthur J B (1994) in a cross-sectional study of 30 US steel mini-mills, found that
commitment based HR systems was associated with lower scrap rates and higher labour
efficiency, than the control-based systems. The 10 variables taken in the study were:
decentralization, participation, skilled workers, level of supervision, benefits, wages,
social events, bonus, etc. Some of the outcome variables were labour efficiency, scrap
rate and employee turnover. The analysis was done using Regression methods.
The representation of the HRM-performance linkage is put forward by Paauwe and
Richardson (1997) depicted in Figure 6.1. (Reversed causality)
Figure 6.1 – Paawe & Richardson Model (1997)
Guest’s (1997) model has 6 boxes, intervened with each other, as shown in Figure 6.2:
• Starting with a Porter-like strategy typology– distinguishing
differentiation/innovation, focus/quality and cost reduction oriented business
strategies;
• Which result into HRM practices,
HRM activities • Recruitment/ selection • HR planning, • Rewards • Participation/cnsultation • De-centralization • Training, • Opp. for internal promotion • More autonomy • Formal procedures • Coaching,• Internally consistent HR ‘bundles’
HRM outcomes • Employee satisfaction • Employee motivation • Employee retention (obverse of turnover) • Employee presence (obverse of absenteeism) • ‘Social climate’ between workers and management • Emp. involve. • Trust Loyalty / commitment
Performance • Profit • Market value • Market share • Increase in sales • Productivity • Product/ service quality • Customer satisfaction • Development of products/ services • Future investments
Contingency and/ or control variables: Organizational level: age, size, technology, capital intensity, degree of unionization, industry/ sector, Individual employee level: age, gender, education level, job experience, nationality, etc.(Source: Paauwe and Richardson, 1997)

Review of Literature
©Ranjita Banerjee 65
• Resulting to HRM outcomes including behaviour outcomes;
• The cumulative effect leads to performance outcomes…thus resulting to financial
outcomes.
(Source: International Journal of Human Resource Management, 8:3, 263-276, Guest’s Model,
1997)
Figure 6.2 - Guest’s Model (1997)
Boselie, J. P., Dietz, G. and Boon, C. (2005) studied 104 major articles, to findthe
Commonalities and contradictions in ‘linking mechanisms’ between HRM and
performance, and concluded that the empirical research deduced that HRM in its 'system'
form have been found to ‘matter’ (in a positive sense) for organizational performance.
However, they also concluded that it was not possible to compare results from different
studies due to variety of methods being used as well as disparity of research designs, and
enduring uncertainties for measuring HRM, performance, and the relationship between
these two, across the various studies.
Ijose Olumide (2005) in his study on ‘Strategic human resource management, small and
medium sized enterprises and strategic partnership capability’, laid out a conceptual
framework for studying the relationship between SHRM practice of SMEs businesses and
their performance as corporate strategic partners. The research throws light on how SMEs
can adjust themselves to the requirements of big businesses in times of even changing
Business Strategy Differen-
tiation (innova -tion) Focus
(quality) Cost (cost
reduction)
HRM Practices Selection Training
Appraisal Rewards
Job-design Involve-
ment Status & Security
HRM Outcome Commit-
ment Quality
Flexibility
Behavior outcome
Effort/ motivatio
n Coopera
-tion Involve -ment Organi
-zational Citizen -ship
Performance outcomes
High: Productivity
Quality Innovation-
Low: Absence Labour
-turnover Conflict
Customer -complaints
Financial
Outcomes Profit
ROI (Return on
Investment)

Review of Literature
©Ranjita Banerjee 66
market conditions by adapting SHRM capabilities. The author designed a conceptual
model wherein SMEs can adapt their HRM practices in support of efficient strategy
execution.
Prahlad Kasturi, et al, (2006) in their study on ‘HRM systems architecture and firm
performance: Evidence from SMEs in a developing country’ concluded that the attitude
of the firm’s owner(s)towards its employees is a major determinant of the firm’s
profitability. However, their study also revealed that the effect of HRM philosophy on
productivity is smaller, but still highly significant. This calls upon the need of further
studies in this area.
Erdil O &Günsel A (2006) in their study on ‘Relationship between Human Resource
Management Practices, Business strategy fit and Firm performance’ surveyed about 300
firms, among 1000, which was based on convenience sampling, of SME firms located
around Gebze and Kocaeli (Turkey).They suggested that managers should develop
training-focused HR practices to achieve competitive advantage. The study also
concluded that there was significant relationship between the two traditional HR practices
of selection and firm performance, and training and firm performance.
They concluded that there exists significant links between all five HR practices and HRM
firm strategy fit. The five main HR practices which were included in the study were:
Selective hiring, Use of teams and decentralization, Compensation/ Incentive contingent
on performance, Extensive training and sharing information.
Carlson et.al (2006) in their study on understanding the impact of HR practices on
performance of family-owned SMEs identified few HR practices like employment
security, employee ownership and empowerment, high compensation, incentive pay,
training and skills development as few of the HR practices which have a great impact in
the performance of the organization. The five HRM ‘best practices’ in the study were
training and development, performance appraisal, recruitment package, maintaining
moral and setting competitive compensation levels.

Review of Literature
©Ranjita Banerjee 67
Bowen Michael, Morara Makarius and Mureithi Samuel (2009) in their study on
‘Management of Business challenges among Small and Micro Enterprises in Nairobi-
Kenya’, a total of 200 interviews with business owners and managers or those involved in
the start-up and day to day running of these businesses were interviewed. The study
sought to determine if there is a relationship between business performance and level of
training in the line of business. 51% of the respondents said that they received training
and nearly all of them (49.5%) said that their businesses was doing well, one may
conclude that relevant training can produce positive results in the running of businesses.
Competition, insecurity, debt collection, lack of working capital and power interruptions
were reported as the top five challenges and difficulties faced by micro and small
businesses. 50.5% said that having good communication skills is necessary as most of
the customers of small businesses anticipate to receive personalized services from the
SME owners/ managers. This survey has clearly showed that managers with relevant
training run successful businesses as compared to their untrained counterparts, which thus
reveals the relationship between HRM practices and firm’s performance. 32% of the
respondents considered training and giving incentives as strategies employed to counter
the challenge of competition.
Guest (1997) and Paawe Jaap (2009) deduced in their study that the distance between
some of the performance indicators (e.g. profits, market value) and HR interventions is
simply too large and potentially subject to other business interventions (e.g. research and
development activities, marketing strategies). Thus, the need of identifying performance
indicators that are far more proximal in terms of what HR practices can actually affect,
eg. changes in employee attitudes (motivation, commitment, trust) and behavior
(employee turnover, absence), and subsequent changes in outcomes at organizational
level (e.g. productivity and quality of services and/or products).
Brand, Maryse J. and Croonen, Evelien P. M (Oct 2010) in their study on Franchised
and small units, found a negative relationship between unit size and performance,
surprisingly. Their study investigated HRM behavior and performance using a sample of
171 units within one plural retailing system. They concluded that company-owned units

Review of Literature
©Ranjita Banerjee 68
adopt the HR practices developed and prescribed by headquarters, leading to demonstrate
HRM behavior that is typical for large firms; however, each individual franchised unit
could largely adopt its own HR practices, which are typical for small firms.
Wyatt et al (2010) came up with their study that it is possible to implement selection
tools in SMEs that are designed using a ‘best practice’ methodology. They deduced that
tools such as Role Plays (RPs) and Situational Judgment Test (SJT) can be good
predictors of job performance in smaller organizations. These types of Selection Tools
had been proved to be quite relevant for SMEs in context to performance.
Further, findings of the study done by Rathnaweera R (2010) showed that providing
training for employees is positively related to higher employee satisfaction, employee
commitment and higher employee retention…which are dimensions of employee
outcomes.
Cheng Ling Tan and Aizzat Mohd. Nazurdin (2011), in their study from a sample of
171 large manufacturing firms in Malaysia came to some important conclusions about the
role of HRM practices on knowledge management and organizational innovation. One of
the important findings of their study was that only one of the five HRM practices, namely
‘training’ was found to have both direct and indirect effect on all the three dimensions of
organizational innovation (product innovation, process innovation, and administrative
innovation). The results of the study offered several suggestions to manufacturing firms
in Malaysia to focus on training programs. The study highlighted that when organizations
display higher level of implementation of training programs, it resulted into the
development of requisite skills of employees, in addition to their potential to learn and
implement…which ultimately lead to organizational innovation.
Erdil and Gunsel (2012) studied 63 SME firms located around Kocaeli and Gebze
(Turkey). Their findings suggested, among others, that in terms of communication of
strategy and feedback on performance, which are sub-dimensions of sharing information,
results indicate that there exists no significant relationships between communication of
strategy and firm performance.

Review of Literature
©Ranjita Banerjee 69
Gill P. et al (2014) employed a non-parametric Structural Equation Modeling (SEM)
technique to analyze the impact of compensation on alignment with the organization and
opportunity for development and recognition. It was found that these dimensions shared a
strong relationship and provided preliminary evidence that compensation shares a causal
relationship with alignment with the organization. In other words, the study concluded
that by improving the levels of compensation, the firm could improve the overall level of
employee engagement.
Kanu A. M (2015) in his research sought to investigate the impact of recruitment &
selection practices on the performance of 59 SMEs in the construction industry in Sierra
Leone. The research employed qualitative as well as quantitative research methods. It
employed in-depth interviews of owner managers and a cross-sectional survey of owner
managers and SMEs performance. The SME performance indicators were growth in
profit, sales and increased productivity. The results of the study revealed significant
relationships between recruitment & selection practices and SMEs performance. Thus,
the study was significant in a bid to sensitize SME owner managers to implement
measures regarding effective recruitment & selection practices, which was significant as
the development of SMEs in Sierra Leone was marred by poor recruitment & selection
practices. This research recommended that future research should examine the impact of
recruitment and selection on SMEs performance in the construction industry and weigh
them against the findings of this research, as well as the degree to which findings of this
research may possibly be generalised to SMEs in other countries.
6.3.2. Literature from Books / Published Reports
Armstrong & Baron (2007) in their book mainly discussed how Strategic HRM can
make a significant impact to bottom-line performance, with research evidence and
practical guidance. The research includes interviews with HR Managers and Chief
Executives from a variety of organizations. The book throws light on how HR
practitioners can become business partners engaged in improving bottom-line
performance via strategic HRM.

Review of Literature
©Ranjita Banerjee 70
Robert Carton & Hofer Charle’s (2008) book, ‘Measuring organizational performance
: Metrics for entrepreneurship and Strategic Management Research’ offers a framework
to understand the implications of selecting variables to understand organizational
financial performance. As these measures use accounting data, they can be used by
researchers as well as practitioners and entrepreneurs for assessing increases in
shareholder value for both public as well as private firms, including small and family
businesses.
Van de Vorde (2009),in his book titled ‘HRM, Employee well-being and Organizational
Performance- A Balanced Perspective’, clarified the role of work satisfaction in the
relationship between strategic climate and productivity at the business level. It proved
that satisfied employees result in higher profits through enhanced customer satisfaction. It
also concluded that work satisfaction infact works as an outcome indicator, rather than as
an intermediary. The study emphasizes the need to include employee climate scores in
HR scorecards to manage work satisfaction as well as productivity.
Darwish T (2013), in his book ‘Strategic HRM and Performance: Theory & Practice’
discusses about the transition from HRM to SHRM; thus moving from an employee or
individual performance level to organizational performance level. The book gives a
detailed theoretical perspective on the various approaches and aspects of the linkages
between HRM practices and performance.
6.3.3. Literature from Thesis
Murphy Kevin S (2009), in his thesis on ‘High Performance Work Practice System’,
defined the construct of High Performance Practice System for unit level managers in
theme restaurants. This study differed from its previous counter-parts in a way that it
established a new HPPS construct for unit level managers, as well as the identification of
appropriate evaluation criteria for determining the performance in the US casual
restaurant themed segment/ industry.

Review of Literature
©Ranjita Banerjee 71
Muhammad A R (2007) in his thesis on ‘HRM sophistication and SME performance: A
case of readymade garment manufacturers and exporters in Lahore, Pakistan’ suggested
for more research in the area of the linkages between HRM and SME performance.
Sample category were the firms between 20 and 100 employees in Ready-made Garments
Manufacturers and Exporters (RGME) industry in the area of Lahore Pakistan,; sample
size was 90 SMEs (almost 45% of total population in this area). The study aimed to
examine the level of formalization and factors influencing such formalization, which can
have some effect on the firm’s performance.
Rathnaweerage R (2010) in his study in Sri Lankan public sector banks found that
bundles of HRM practices are positively related to better employee satisfaction. The
hypothesis were empirically tested on a sample of 209 employees working in different
departments and branches of two public sector banks in Sri Lanka, using correlation
analysis and multiple regression analysis. The survey further found that compensation
and social benefits had the strongest effect on employee satisfaction, commitment and
retention of PSB in Sri Lanka. It further revealed that providing training is also
positively related to the three outcome variables.
Alnaqbi W (2011) in his thesis on ‘The relationship between Human Resource Practices
and Employee retention in public Organizations: An exploratory Study conducted in the
United Arab Emirates’, tried to focus the extent to which HRM practices and other
factors such as job satisfaction, organizational commitments and leadership practice in
the UAE affect employee retention in public organizations, in a comparative study of
Sharjah and Dubai. Both quantitative and qualitative research approaches were employed.
The findings, among others were that, lack of empowerment and management style are
factors that influence the retention of employees; which call for a need to provide
employees with job-description.
Mishra A K (2012) in his study on ‘A critical study of Human Resource Development
practices in Durgapur Steel Plant’, surveyed across 93 executives of the Durgapur Steel
Plant, to find HRD Climate and Organizational Diagnosis in the Plant. The questionnaire
related to training effectiveness was given to 47 line managers and 22 HR personnel from

Review of Literature
©Ranjita Banerjee 72
across the departments and hierarchy. Data regarding profit, turnover, labor productivity,
manpower were collected from various secondary sources like Annual Reports etc. While
a direct relation and exact degree of relation between the two variables under study
(Independent HRD practices and Dependence Organizational Outcomes) is not so visible,
however, there is an impact. Significance of the intervening variable HRD climate was
also brought out, which affected various performance outcomes viz. employee outcomes,
organizational outcomes as well as financial outcomes.
White S (2012) undertook a research to examine the relationship between HRM
practices, transformational leadership and firm performance among knowledge workers
employed in a biotechnology company in Canada. While the bundle of HRM practices
was not a predictive influence on operational or financial performance in the model
proposed in this study, it did have a significant influence on employee performance,
which is important in explaining employee commitment and subsequently performance.
Further, analysis of the black-box revealed positive relationships between
transformational leadership and operational performance; as well as between HR
Practices and employee performance. It further came out from the study that HRM
practices play a mediating role in the relationship between leadership and employee
performance as an organizational outcome.
Rojanapuwadol S (2012) in the research on ‘Development of HRM Practices in SMEs :
A Case Study from the Founders and CEOs’ Point of view’ used qualitative research,
case studies and depth interviews in the study. The aim was to study the development of
HRM practices and strategies applied from the start-up phase to the growth-phase of
SMEs. The study showed that during the formative years the SMEs relied more on
various types of networks in recruitment; and also provided formal training during these
formative years. More emphasis was put on psychological rewards rather than financial
rewards, to function more cost-effectively. These activities were mostly carried out by the
owner. However, during the stage of growing, on account of multiplicity of issues, an HR
person was mostly deployed to take care of HR related aspects.

Review of Literature
©Ranjita Banerjee 73
6.4. Summary of the Chapter- Identifying the Research Gaps
The chapter gave a detailed orientation of literature regarding HRM Practices and
linkages with SMEs performance, in India and abroad. The chapter also oriented towards
the HR Practices and other aspects governing SMEs over the last three decades. A 360
degrees literature review was done, across a longitudinal series, across different years,
arranged chronologically, to get an idea about the developments over time. In-depth study
from journals, books, reports as well as thesis and dissertations helped to get a rich
overview of the theoretical, conceptual and empirical evidences of the topic under study.
It was interesting to note that one of the earliest studies done in the year 1984 by McEvoy
concluded that small businesses lacked in HR practices like creative staffing practices,
training in formal personnel management practices and that they did not consider the use
of generally accepted HRM practices as essential for improving productivity.
The research-gap identified in the chapter on Literature Review were mainly:
1. There is lack of research in HRM related practices in SMEs.
2. The linkages between HR practices and SMEs performance needs to be
established.
3. There is dearth of knowledge about the HR practices in SMES.
Thus, the chapter helped in identifying the research-gap in this important area of HRM
practices and its linkage with firms’ performance in the SMEs.

CHAPTER – 7
©Ranjita Banerjee 74
CHAPTER – 7
Research Methodology
7.1. State of The Art of the Research: A Brief Overview
The chapter focuses on the methods used to gather and analyze data. It focuses on the
research design, time period of conducting the survey, method for approaching the
sample and the collection of data. The empirical research in the thesis is comprised of
primarily quantitative data analysis based on a structured questionnaire. In addition to
this, a chapter has also been included in which the information was collected based on
semi-structured interviews through interactions and discussions with the managing
heads, to get an overview of the major problems and challenges faced by the Managing
heads of the SMEs, and also to know the reasons thereof. The results and findings from
the quantitative analysis are discussed in Chapter 8 whereas the outcomes from the
interactions and discussions related to the problems and challenges faced by the SMEs
are discussed in Chapter 9.
It was seen from the responses of the respondents that good HR practices or management
practices in the SME firms have not always resulted in higher financial returns or
increased Return-on-Investment or profit margins, due to some external factors, beyond
the control of the Managing Heads. These reasons could be understood due to the
interactions and discussions with the owners/ Managing Heads through some open-ended
semi-structured questions to know the problems and challenges faced by the firms. Thus,
the interactions with the Managing heads have complemented or supported the findings
to understand the underlying facts about the SME sector in a better way. In the present

Research Methodology
©Ranjita Banerjee 75
chapter, the objectives and the hypotheses for the quantitative study have been discussed
in detail. The rationale for each of the hypothesis is also discussed.
In the present study, a survey has been conducted through primary study of 126 SME
firms across the eight Industrial Estates of Vadodara district. The 215 respondents in the
study comprise of 83 owners (including entrepreneurs, Directors, CEOs, Chairman,
Proprietor, Partner) and 132 employees who are Managing Heads like employees from
senior management as well as HR Managers/ Supervisors/ Heads of Departments.
Structural Equation Modeling and other techniques have been used to analyze the
linkages between HR practices and SMEs performance. On the other hand, only 45
respondents consented willfully to interact and discuss about the problems and challenges
faced by the SMEs.
7.2. Rationale of the Study/ Research Gap
Since MSMEs employ about 59 million persons in over 26 million units throughout the
country (MSME Annual Report 2014-15), their success is critical for the economy. It is a
matter of challenge for the sector to keep its work-force motivated so that they can
perform effectively and efficiently…thus, the need for sound HRM practices becomes
inevitable. Research results support the assumption that with a higher quality of HRM in
the organization a better performance can be reached (Paauwe, 2004; Bowen &Ostroff,
2004; Pfeffer, 1994; Boselie, Dietz & Boon, 2005).
One remarkable study of personnel functions in smaller firms found that the areas of
accounting, finance, production, and marketing all take precedence over personnel
management. (McEvoy 1984). In many cases, the owner of a small business himself
handles the personnel functions. A survey conducted by Hess (1987) showed that small
business owners rank personnel management as the second most important management
activity next to general management/ organizational work.
Deshpande and Golhar (1994) investigated empirically the various HRM issues in 100
large and small manufacturing firms. They concluded that what is perceived as important
by managers may not actually be practiced by them; thus necessitating future research to
investigate this issue.

Research Methodology
©Ranjita Banerjee 76
Bowen and Ostroff (2004) through their research study gave a theoretical framework on
how HRM practices can lead to outcomes which the organization desires, through
conceptual studies. They proposed that HRM will create a strong situation for improving
firm’s performance when the HRM system is perceived as high in distinctiveness,
consistency and consensus.
Boselie, J. P., Dietz, G. and Boon, C. (2005) studied 104 major articles on linkages
between HRM and performance and concluded that the empirical research deduced that
HRM in its 'system' form have been found to ‘matter’ (in a positive sense) for
organizational performance.
However, there is lack of empirical research showing the linkages between HRM
practices and performance of Small & Medium Enterprises (SMEs). Heneman et al,
conclude that ‘the lack of information about human resources in SMEs is problematic for
theory, research and practice’ (Heneman et al, 2000).
Thus, the lack of information of empirical evidences about human resource management
practices in SMEs created interest in the researcher to find the linkages between HRM
practices and the performance of SMEs in the district of Vadodara.
Thus, based on the major outcomes from the literature review, the rationale of the
study are as under:
• There is lack of information about the major HRM Practices implemented in
small firms.
• There is lack of information about the linkages between HRM Practices and
SMEs performance.
• There is lack of empirical evidences to corroborate how HR in its ‘system’ form
or as a single practice affects SMEs performance.

Research Methodology
©Ranjita Banerjee 77
7.3. Problem Statement
“To study the linkages between HRM Practices and SMEs performance in
Vadodara district”
7.4. Research Questions
1. Is there any linkage between HRM practices and performance of SMEs?
2. Is there any linkage between HRM Practices and Employee Outcomes in SMEs?
3. Is there any linkage between Employee Outcomes and Organizational
Performance outcomes of SMEs?
4. What are the major HRM practices being practiced in the SMEs in the Vadodara
district?
5. What is the essence of the SME sector in the economy?
6. What are the various policy initiatives and strategies undertaken in the sector to
improve its performance?
7. What are the various problems and challenges faced by the SMEs?
7.5. Objectives of the Study
The primary objective of the study is to investigate the linkages between HRM practices
and performance of SMEs in the Vadodara district. The objectives of the study are as
under:
Primary Objectives
1. To find the linkages between HRM Practices and Performance of SMEs in the
Vadodara district.
2. To find the linkages between HRM Practices and Employee Outcomes in SMEs.
3. To find the linkages between Employee Outcomes and Organizational
Performance outcomes of SMEs.

Research Methodology
©Ranjita Banerjee 78
Secondary Objectives
4. To identify the state of HR practices and the major HRM practices being
practiced in the SMEs in the Vadodara district.
5. To understand the various aspects of SMEs with respect to its presence in the
present scenario and functional areas of SMEs with special reference to HR
functions.
6. To understand the various policy initiatives and strategies undertaken in the
sector, with special reference to the MSMED Act 2006.
7. To get an overview of the MSMEs in the Gujarat State, with special reference to
Vadodara district.
8. To identify the various problems and challenges faced by the SMEs.
9. To give recommendations and suggestions to improve the SME sector.
7.6. Significance of the Study
The study is significant because the following results are achieved from the study:
1. Understanding the linkages between HRM practices and SMEs performance in
the Vadodara district and contribute to theory building of this important linkage.
2. Investigate the current HR practices which are practically prevalent in the SMEs
in Vadodara district.
3. Identifying the various problems and challenges faced by the entrepreneurs/
Managing Heads of the SMEs in general.
4. Identifying the major policies as well as new policy initiatives prevalent in the
SMEs, through a detailed study of the MSMED Act, 2006 and other policy
initiatives.

Research Methodology
©Ranjita Banerjee 79
5. Give recommendations for improvising the SME sector. which can be imbibed by
SME owners/ Managing heads/ Chambers of Commerce & Industry, industry
associations etc to improvise the SME sector.
7.7. Research Design
The research design of the study is a combination of Descriptive as well as Exploratory
Research. Descriptive Research is a type of conclusive research that has as its major
objective the description of something- usually market characteristics or functions
(Malhotra & Dash, 2011). In the present study, Descriptive Research design involved a
pre-planned and structured design by way of quantitative analysis through hypothesis
testing and using the survey method through a one-to-one approach. Additional
information was gathered about the real-life related aspects like the problems, challenges
or concerns faced by the SME sector as a part of the Exploratory Research to get into the
insights of the problem. It was executed through some open-ended questions in a semi-
structured interview, through discussions and interactions with the entrepreneurs and
Managing Heads. Exploratory Research has as its primary objective the provision of
insights into, and comprehension of, the problem situation confronting the researcher
(Malhotra & Dash, 2011).
7.8. Research Approach
Descriptive and Exploratory research design has been used to carry out this research.
Research approach basically refers to the overall orientation to the research. Quantitative
research techniques gather numerical data and use statistical analysis to arrive at
meaningful conclusions. Whereas qualitative techniques analyze on the basis of words
and concepts quantification. Qualitative aspects allow researchers to understand the
views, attitudes, behaviors and perspectives of the persons/ research subjects concerning
an organization or the behaviors of people in a social or professional setting. Quantitative
approach on the other hand, help in understanding the study through the use of numerical
data and statistical analysis.

Research Methodology
©Ranjita Banerjee 80
This study employs Quantitative approach to ascertain linkages between HRM practices
and the performance of the SMEs. Additionally, open-ended questions were included
around employee related issues, Firm’s success factors, and challenges faced by SMEs in
general.
Thus, the research is both deductive as well as inductive. Deductive research is theory-
testing, which is often linked to the quantitative analysis. Whereas, inductive research is
theory-generating which can be linked to the qualitative interviews gathered from the
respondents to identify the generic problems and challenges faced by the sector.
In the present study by using brain-storming discussion through the open-ended questions
asked to the respondents and detailed interactive sessions held with the Managing Heads
helped to come up with some real challenges/ issues that the SMEs are facing across the
various estates in the Vadodara district.
7.9. Sources of Data
• Primary data are originated by the researcher for the specific purpose of
addressing the problem at hand. In the present study, primary data has been
collected by way of administering a structured questionnaire and getting it filled
by the respondents through one-to-one approach. Further, a few open-ended
questions in the semi-structured interview helped to gain some primary data from
the respondents related to the problems and challenges faced by the sector.
• Secondary data are data which have already been collected for purposes other
than the problem at hand. Secondary sources in the study included information
from journals, books, thesis/ dissertations, website references as well as
Governmental / Institutional Reports, Annual Reports or Publications and
Directories.
7.10. Method for Selecting/ Approaching the Sample
Non-Probability Sampling method of Quota Sampling was administered in the study.
The total territory (Vadodara District) was divided into quota (strata/control category)
of each Industrial Estate, based on the Federation of Small Scale Industries (FSSI) 2006

Research Methodology
©Ranjita Banerjee 81
Directory and 10% firms have been selected from each Industrial Estate based on a mix
of Convenience Sampling as well as Snowball Sampling. As the FSSI Directory’s data-
base was old (published in 2006), hence it could not be adopted as the sampling frame.
Further, some firms mentioned in the Directory had closed down whereas some firms
whose names were not mentioned in the Directory were present in the estate. Hence,
using the Directory as the sampling frame was not viable. Thus, using Non-Probability
Sampling method of Quota Sampling using a mix of Convenience Sampling and Snow-
ball Sampling was found out to be the most appropriate method in the present study.
As we know, Quota sampling is a Non-Probability Sampling technique, which uses a
two-stage restricted judgmental sampling. The first stage consists of developing control
categories, or quotas, of population elements. In the second stage, sample elements are
selected based on convenience or judgment. Convenience sampling attempts to obtain a
sample of convenient elements. Often, respondents are selected because they happen to
be in the right place at the right time. In snowball sampling, an initial group of
respondents is selected, usually at random. After being interviewed, these respondents
are asked to identify others who belong to the target population of interest. Subsequent
respondents are selected based on the referrals (Malhotra & Dash, 2011). In the present
study a combination of Non-Probability Sampling techniques were used.
The sample size comprised of 215 respondents from 126 SME firms across eight
Industrial estates of Vadodara district (out of the twelve estates in the district) for the
quantitative analysis. However, only 45 Managing heads including owners, gave their
consent or willingness to answer and discuss the qualitative aspects like problems,
challenges and issues faced by the SME sector, in general or SMEs in particular .
The eight estates comprised of GIDC Makarpura, Sardar Estate, Patel Estate, Gorwa
BIDC Industrial Estate, Chhani Estate, Mujmahuda, Vadodara City area and
Padra Industrial Estate. Refer Table 7.1 to get an idea of the sample distribution and
bifurcation.

Research Methodology
©Ranjita Banerjee 82
TABLE 7.1 - Sample Distribution & Bifurcation
Samples taken from eight Industrial Estates out of a total of twelve Estates in the district (i.e67% of Industrial Estates)
126 SME Firms 215 Respondents (Managing Heads) Small Enterprises Medium
Enterprises Owners/
Entrepreneurs Employees including Senior/ Middle Level Management
84 (67%) 42 (33%) 82 (38%) 133 (62%) (Source: Primary data)
Refer Table 7.2 to get an idea of the distribution of samples across the eight Industrial Estates.
TABLE 7.2 - Distribution of Samples across Industrial Estates
Samples Taken From Eight Estates Out Of A Total Of Twelve Estates In The District (i.e 67% Of Industrial Estates Included In The Survey)
No. Estate
Total No. Of MSME Units (As Per FSSI
Directory)
Only SMEs
(70% Of MSMEs*)
Target Sample
Size (10% of SMEs)
Samples Accomplishe
d (SME Firms)
No. Of Respondents
(Owners/ Managing
Heads)
1 GIDC Makarpura 1,403 982 64 64 (6.5%) 109
2 Sardar Estate 126 88 9 8 (10%) 13
3 Patel Estate 144 100 10 10 (10%) 10
4 Gorwa BIDC 89 62 6 8 (14%) 16
5 Chhani Estate 85 60 6 9 (15%) 18
6 Mujmahuda 23 16 2# 4 (25%) 8
7 Vadodara City 215 150 15 15 (10%) 24
8 Padra Ind. Area 27 19 2# 2 (100%) 3
9 Others (Waghodia , POR) 134 94 9 6 14
Total: 126 SMEs 215 (Source: Compiled by author based on manual counting from FSSI 2006 Directory; * As per feedback from FSSI Head, VCCI Head & DIC Head)

Research Methodology
©Ranjita Banerjee 83
7.11. Research Instrument – Overview of the questionnaire based study (Content Validity)
Data was collected using a structured questionnaire through the one-to-one approach
as an interactive discussion through personal contact is one of the most suitable methods
to gain insights into a problem. During the pilot-study period, about 8 to 10 SMEs were
visited in the GIDC Makarpura estate, and the basic questionnaire was shown and
discussed with the entrepreneurs/ owners/ supervisors/ HR managers/ managing heads as
well as employees at length. The Preliminary Questionnaire was simultaneously
discussed with the academicians and research experts to check the validity of the
content of the questionnaire. These discussions helped to frame the final questionnaire,
on which the present study was based.
By consulting the experts like the SME owners, HR Managers and other Managing Heads
and research experts, the questionnaire was re-designed which included re-framing of
questions, addition as well as deletion of variables, which have been duly incorporated by
the researcher. Questions related to income of the employees, over-time allowances and
actual profits accrued by the firms were deleted in the final questionnaire, which were
there in the preliminary questionnaire. Finally, a single questionnaire was framed wherein
owners/ entrepreneurs as well as other Managing Heads, who represented the employees,
were identified as the respondents, and the instrument was thus finalized.
7.12. Definition of Variables
Guest (1997) and Paawe Jaap (2009) deduced in their study that the distance between
some of the performance indicators (e.g. profits, market value) and HR interventions is
simply too large and potentially subject to other business interventions (e.g. research and
development activities, marketing strategies). Thus, the need of identifying performance
indicators that is far more proximal in terms of what HR practices can actually affect, eg.
changes in employee attitudes (motivation, commitment, trust) and behavior (employee
turnover, absence), and subsequent changes in outcomes at organizational level (e.g.
productivity and quality of services and/or products).

Research Methodology
©Ranjita Banerjee 84
The present study intended to find the linkages between HRM Practices and SMEs
performance in the Vadodara district. Based on Literature Review (Dyer & Reeves, 1995;
Paawe and Richardson, 1997), SMEs performance was evaluated in two sets, one
measuring the performance through employee-outcome characteristics and the other
through organizational performance characteristics over the last two years for the firm.
The study was prompted on account of lack of previous research in the SME sector
regarding the linkages between HRM practices and performance in the Vadodara district.
In the present study, the independent variables are the HR Practices, whereas the
dependent variables are the Performance dimensions. A control variable is a variable that
is held constant or whose impact is removed in order to analyze the relationship/ linkages
between other variables without interference. Refer Table 7.3 to get an overview of the
Independent, Dependent and Control variables in the present study.
TABLE 7.3 - Overview of Independent, Dependent and Control Variables
Independent Variables Dependent Variables Control Variables (or Contingency
Variables) HR Practices (Inspired by the studies of Paauwe & Richardson, 1997 and Guest, 1997) • Recruitment and Selection • Training and development • Job-rotation • Performance Management
System • Compensation & Reward
System • Employee Feedback
Mechanism • Delegation and Authority • Employee participation in
decision-making • Welfare Measures • Open Communication
‘Performance’ dimensions (Inspired from the study undertaken by Dyer and Reeves, 1995) (a) Employee Outcomes: Competence, Employee attitudes (commitment, co-operation); Employee behavior (Regularity, Punctuality, Discipline); Employee-involvement.
(b)Organizational Performance Outcomes:
Customer Satisfaction, Supplier Satisfaction, Product/ Service development, Quality, Utilization of resources, Reduction of defects,
% change in Net Profit Margin, ROI (in % Average performance of 2
yrs)
(Inspired from the study of Paawe and Richardson, 1997) Organizational level variables like size of the firm (small or medium), age of the firm, industry / sector. Individual employee level variables like age, gender, education level, job experience.
(Source: Author, based on Literature Review)

Research Methodology
©Ranjita Banerjee 85
7.13. Hypothesized Model
Based on Literature Review and inspired by the studies of Paauwe and Richardson
(1997), Guest (1997) andDyer and Reeves (1995) a Hypothesized Model has been
developed by the author as shown in Figure 7.1.
(Source: Author; Inspired from the studies of Paawe& Richardson, 1997; Guest, 1997 andDyer & Reeves, 1995)
Figure 7.1 - Hypothesized Model Showing Linkages Between HRM Practices, employee Outcomes & Organizational Performance Outcomes
HRM Practices • Recruitment &selection • Training &
Development • Performance
Management System • Compensation
&Rewards • Employee
Participation
Employee outcomes • Competence • Co-operation • General behavior • Commitment • Punctuality • Regularity • Sense of
involvement • Discipline
Performance Outcomes • Customer Satisfaction • Supplier Satisfaction • Product/ Service dev. • Quality • Resource Utilization • Reduction of defects • % change in Net Profit
Margin • Return On Investment
(%, 2-yr Avg)

Research Methodology
©Ranjita Banerjee 86
7.14. Research Hypotheses
A hypothesized Technology Acceptance Model was tested using structural equation
modeling using AMOS 18 software.
The major hypotheses in the study and their literature back-drop are as follows:
Linkage 1:
H1: HR Practices positively and directly affects Organizational Performance.
The thesis focuses on the linkages between HRM practices and performance in SMEs.
The representation of the HRM-performance relationship have been put forward by
Guest, 1997; Paauwe and Richardson, 1997; Guest et al, 2000; Boselie, J. P., Dietz, G.
and Boon, C., 2005; PaaweJaap, 2009, in their studies.
Selset al (2003) in their study on Belgian SMEs (organizations with atmost 100
employees) studied the link between HRM and firm performance. The results showed a
strong effect of intensive HRM on the profitability of Small and Medium sized
companies. Their study revealed that HRM intensity has a strong positive effect on
productivity and through this productivity, an effect is seen on the gross margin/
personnel costs. Their study concluded that the total effect of HRM intensity on
profitability is positive and very strong…which was quite different from the earlier
conclusions of the ‘black-box’. HRM practices like, Effective training & development,
selection, rewards and performance appraisal have positive relationship with product
quality, Productivity efficiency and overall perceived performance (Khan, 2010).
The present study has focused on finding these linkages between HRM practices and
performance of SMEs in the Vadodara district. Organizational Outcomes in the present
thesis includes dimensions like Customer Satisfaction, Supplier/ Vendor Satisfaction,
Product/ Service Quality, Less Wastage & Proper utilization of resources and decrease in
the average number of defects of products/ deficiencies in service over the last two years.

Research Methodology
©Ranjita Banerjee 87
Linkage 2:
H2: Employee Outcome positively and directly affects Organizational Performance.
A serious limitation which has been pointed out by recent research is that the link
between HRM practices and organizational performance is somewhat like a ‘black-box’,
due to the lack of clarity regarding ‘what exactly leads to what’ (Gerhart, 2005). The idea
is thus to consider the variables which are mediating or moderating the end-point
variables (Becker &Gerhart, 1996). Paauwe (2004) and Lepaket al (2006) in their study
concluded that the HRM outcomes categorized as ‘employee skills’ like employee
competencies, co-operation etc, ‘employee attitudes’ like motivation, commitment,
satisfaction and ‘employee behavior’ like retention, presence etc, were usually the sets of
mediating variables (leading to ‘organizational performance’ ultimately).
However, Wright et al (2005) pointed out that the studies considering HRM outcomes as
mediating variables also produced mixed results with respect to causation. It is worth
noting that the ‘organizational performance variables’ in the study conducted by Katou A
(2008) included: effectiveness, efficiency, development, satisfaction, innovation and
quality…financial performances were thus not considered in the scope of the study.
The researcher in the present thesis intends to find out the linkages between these
variables viz. employee outcomes leading to organizational outcomes. The researcher
believes that the present thesis shall be a major break-through in this particular study in
the SMEs in Vadodara district.
Linkage 3:
H3: There exists covariance between HR Practices and Employee Outcome.
An increasing body of work contains the argument that the use of good HR practices
including effective Recruitment and Selection practices, Compensation and Incentive
system as well as Performance Management System, Training & involvement activities
can actually improve the knowledge, skills as well as abilities of a firm’s employees. It
can increase their motivation, enhance retention of quality employees as well as
encourage non-performers to leave the firm (Jones & Wright, 1992).

Research Methodology
©Ranjita Banerjee 88
In this thesis, an attempt has been made to find the linkages between HRM Practices and
Employee Outcomes of SMEs. Employee outcomes included in the study are outcomes
reflected through their competence to do their assigned work, co-operation with
Management/ Heads, co-operation among employees, general behavior, commitment to
complete assigned task, punctuality and regularity, sense of involvement and
conformance to general code of conduct.
In addition to the three major hypotheses mentioned above, the study tests many other
hypotheses in Chapter 8 which discusses in detail the quantitative analysis.
7.15. Time Period of the Survey
The questionnaire framing and finalization alongwith pilot study was done within a
period of five months from March to July 2014. During the period of pilot study, a
number of governmental offices were visited to get a Directory/ listing of the SMEs in
the various industrial estates of Vadodara district. Some of the offices which were visited
included the District Industries Centre (DIC), Vadodara Chamber of Commerce &
Industry (VCCI) and Federation of Small Scale Industries (FSSI). The only systematic
directory of small-scale industries, across various industrial estates, was found in the
FSSI 2006 Directory. During the pilot-study period, 10 SMEs were visited in the GIDC
Makarpura estate, and the basic questionnaire was shown and discussed with the
entrepreneurs/ owners/ supervisors/ HR managers/ managing heads as well as employees
at length. This discussion helped to frame the final questionnaire. The field survey was
conducted during the period from August 2014 to July 2015. It took a little long time for
the field survey as the method used to collect data was based on one-to-one interaction
with the respondents for filling the questionnaire, across the eight Industrial Estates, after
fixing an appointment. Further, the respondent was carrying the PhD in a part-time
mode, which involved a long time for priority work related to the job/ work-place.

Research Methodology
©Ranjita Banerjee 89
7.16. Scale and Research Techniques
The data collected regarding the Independent and Dependent variables is in Likert Scale,
which is an ordinal scale (categorical data), hence its normality cannot be tested. As the
basic assumption required for carrying out Parametric Test is violated, which is
‘normality’, hence in the present research only Non-Parametric Tests have been
administered. Non-Parametric tests were used to draw some inference about the HRM
Practices, Employee Outcomes, Firm’s Performance and control variables using various
tests like Chi-square, Mann-Whitney, Kruskal-Wallis, Logistic Regression, Factor
Analysis etc. The linkages between HRM practices and performance dimensions have
been found out using Structural Equation Modeling (SEM).
7.17. Statistical Analysis and Packages
The statistical analysis was done using the tools like Statistical Package for the Social
Sciences (SPSS), AMOS 18 (Analysis of Moment Structures) and Microsoft Excel.
Microsoft Excel was used during the preliminary data-entry stage, which was later
exported to SPSS. SPSS Statistics is a software package used for statistical analysis, like
survey authoring and deployment, data mining, text analytics etc. AMOS enables to
specify, estimate, assess and present models to show hypothesized relationships among
variables. AMOS helps to build models more accurately than with standard multivariate
statistical techniques. It also allows to build attitudinal and behavioral models that
reflects complex relationships. The software provides Structural Equation Modeling
(SEM), which is easy to use as well as enables to easily compare, confirm and refine
models.
7.18. Summary of the Chapter
In the chapter of ‘Research Methodology’ an attempt had been made to give a holistic
information on the aspects related to research design, research approach, definition of
variables, sampling method, sample distribution, time-period and also the major
hypotheses of the study alongwith the literature back-drop. In addition to the major three
hypotheses and linkages mentioned in the chapter, the thesis discusses a number of other

Research Methodology
©Ranjita Banerjee 90
hypotheses to establish the linkages/ association with HR practices, employee outcomes,
organizational outcomes, control variables and the like, which have been tested
judiciously and displayed in Chapter 8. Chapter 9 discusses the problems and challenges
faced by the SME sector in general.

CHAPTER – 8
©Ranjita Banerjee 91
CHAPTER – 8
Quantitative Data Analysis and Interpretation
8.1. Prelude
The present chapter focuses on the detailed results and findings of the study based on
quantitative analysis.
The data analysis in this Chapter is divided in three Sections:
• Section I: Descriptive Statistics (Eg. frequency distribution analysis, including
percentages, mean, standard deviation, Reliability Tests etc).
• Section II: Inferential Statistics (Eg. Using non-parametric tests like Mann Whitney
Test, Kruskal-Wallis Test)
• Section III: Structural Equation Modeling (To find the linkages between HRM
Practices, Employee Outcomes as well as Organizational Outcomes).
A snap-shot of analysis is displayed in Table 8.1 which show-cases the achievements
with respect to objectives and the tools used to achieve each objective.

Quantitative Data Analysis and Interpretation
©Ranjita Banerjee 92
TABLE 8.1 - Achievements With Respect To Objectives
Objectives Analysis/ Tools Achievements
Primary Objectives 1. To find the linkages between HRM
Practices and Performance of SMEs in the Vadodara district.
2. To find the linkages between HRM Practices and Employee Outcomes in SMEs.
3. To find the linkages between Employee Outcomes and Organizational Performance outcomes of SMEs.
Structural Equation Modeling
Regression
Hypothesis testing done.
Null Hypothesis Rejected
Secondary Objectives
4. To identify the state of HR practices and the major HRM practices being practiced in the SMEs in the Vadodara district.
Mean & Std. Deviation Multiple Responses, Cross-Tabulation & Chi-square
Mann-Whitney & Kruskal-Wallis Test
Linkages established across various variables.
Secondary Objectives
5. To understand the various aspects of SMEs with respect to its presence in the present scenario and functional areas of SMEs with special reference to HR functions.
6. To understand the various policy initiatives and strategies undertaken in the sector, with special reference to the MSMED Act 2006.
7. To get an overview of the MSMEs in the Gujarat State, with special reference to Vadodara district.
8. To identify the various problems, challenges or issues faced by the SMEs as a part of the qualitative study.
9. To give recommendations and suggestions to improve the SME sector.
Detailed Literature Review and studies from various Reports which gave an overview of the functional areas, new policy initiatives, scenario of SMEs in Vadodara district.
Qualitative study (content analysis) to understand the problems & challenges faced.
Recommendations & suggestions given based on quantitative and qualitative analysis.
(Source: Author)

Quantitative Data Analysis and Interpretation
©Ranjita Banerjee 93
Section I: Descriptive Statistics
8.2. Descriptive Statistics- Demographic Characteristics
Descriptive Statistics are used to describe the basic features of the data in a study and
provides summaries about the samples. Put in another way, Descriptive Statistics helps
describe, show or summarize data in a meaningful way and presents quantitative
descriptions in a manageable form.
Descriptive Statistics was done to get an overview of the samples selected, using various
frequency distribution analysis, including percentages, mean, standard deviation;
Reliability Tests, Cross-Tabulation etc.
8.2.1. Industrial Estate
10% of firms have been taken from each Industrial Estate. Refer Table 8.3 for the
distribution of samples across the various industrial estates in Vadodara district, with
graphical representation in Figure 8.1.
TABLE 8.2 - Frequencies of Industrial Estates
Estate Frequency Percent
Mujmahuda 8 3.7 Gorwa BIDC 16 7.4 Chhani Estate 18 8.4 Sardar Estate 13 6 Patel Estate 10 4.7 Padra Estate 3 1.4 Vadodara City 23 10.7 Others 15 7 GIDC Makarpura 109 50.7 Total 215 100
(Source: Primary data; SPSS Output)

Quantitative Data Analysis and Interpretation
©Ranjita Banerjee 94
Figure 8.1 - Frequencies of Industrial Estates
8.2.2. Size Of The Firm
It can be seen from Table 8.4 and Figure 8.2 that out of 126 firms, 67% of the firms were
small enterprises (84 Small enterprises) whereas 33% firms were medium enterprises (42
Medium enterprises). The MSMED Act, 2006 defines small enterprises as the
manufacturing units with investments in plant and machinery above Rs. 25 lakhs and
uptoRs. 5 crore and for medium enterprises above Rs. 5 crore and uptoRs. 10
crore(MSMED Act).
TABLE 8.3- Size of the Firm
Size of firm Frequency Percent Small 84 67
Medium 42 33 Total 126 100
(Source: Primary data; SPSS Output)
3.77.4 8.4 6.0 4.7
1.4
10.77.0
50.7
0
10
20
30
40
50
60
Perc
ent F
requ
ency
Estates

Quantitative Data Analysis and Interpretation
©Ranjita Banerjee 95
Figure 8-2 - Size of the Firm
67.0
33.0
01020304050607080
Small Medium
Perc
ent
of t
otal
Size of the Firm

Quantitative Data Analysis and Interpretation
©Ranjita Banerjee 96
8.2.3. Designation of Respondents
It can be seen from Table 8.5 (and Figure 8.3) that about 38% of the respondents were
owners/ entrepreneurs (82 owners/ MD) whereas about 62% of the respondents were
other employees including senior managers (133 other employees including senior
management).
TABLE 8.4 - Designation of Respondents
Designation Frequency Percent Owner/MD 82 38.1 Other employees including Senior Management 133 61.9
Total 215 100 (Source: Primary data; SPSS Output)
Figure 8.3 Designation of Respondents
38.1
61.9
0
10
20
30
40
50
60
70
Owner/MD Other Employees incl Mgt
Perc
ent
of t
otal
Designation

Quantitative Data Analysis and Interpretation
©Ranjita Banerjee 97
8.2.4. Age of the Respondents
Table 8.6 (Figure 8.4) shows that the maximum number of respondents (31%) belonged
to the middle age-group of 36-45 yrs; followed by the younger age-group of 26-35 years
(27.4%) and a higher age-group of 46-55 years (26.5% respondents).
TABLE 8.5- Age of the Respondents
Age group Frequency Percent 18-25 Yrs 6 2.8 26-35 Yrs 59 27.4 36-45 Yrs 66 30.7 46-55 Yrs 57 26.5 Above 55 Yrs 27 12.6 Total 215 100
(Source: Primary data; SPSS Output)
Figure 8.4 - Age of the Respondents
2.8
27.4
30.7
26.5
12.6
0
5
10
15
20
25
30
35
18-25 yr 26-35 yr 36-45 yr 46-55 yr > 55 yr
Perc
ent
of t
otal
Age of Respondents

Quantitative Data Analysis and Interpretation
©Ranjita Banerjee 98
8.2.5. Gender of the Respondents
Table 8.7(Figure 8.5) shows that majority of the respondents (about 91%) are males.
Only about 9% of the respondents are females. As the respondents were either the
owners/ Managing Heads or senior management employees, it is noteworthy to note here
that there is a lot of scope of improvement to enhance the gender diversity and increase
the presence of women in the SMEs.
TABLE 8.6- Gender of the Respondents
(Source: Primary data; SPSS Output)
Figure 8.5- Gender of the Respondents
91.2
8.8
0102030405060708090
100
Male Female
Perc
ent
of t
otal
Gender Distribution
Gender Frequency Percent Male 196 91.2 Female 19 8.8 Total 215 100

Quantitative Data Analysis and Interpretation
©Ranjita Banerjee 99
8.2.6. Educational Background
It is interesting to see from Table 8.8(Figure 8.6) that about 55% of the respondents (119
respondents) were Graduates and only about 28% of the respondents (61 respondents)
possessed a Masters degree. It is also noteworthy to see that about 15.8% of the
respondents (34 respondents) were either below Std. XII or Diploma holders.
TABLE 8.7- Educational Background
(Source: Primary data; SPSS Output)
Figure 8.6 - Educational Background
7.9 7.9
55.3
28.4
0.50
10
20
30
40
50
60
Below Std.XII Diploma Graduate Masters Others
Perc
ent
of t
otal
Educational Background
Educational Background Frequency Percent
Below Std.XII 17 7.9 Diploma 17 7.9 Graduate 119 55.3 Masters 61 28.4 Others 1 0.5 Total 215 100

Quantitative Data Analysis and Interpretation
©Ranjita Banerjee 100
8.2.7. Specialization of Managing Heads
It is interesting to see that majority (about 22%) of the respondents were from the fields
of HR and Finance (47 respondents respectively). However, it was told by the
respondents, that in SMEs the Managing heads/ senior management are multi-skilled and
have a fair knowledge about all areas of work, irrespective of their educational
backgrounds and specialization, due to the nature of work in this unique sector.
TABLE 8.8- Specialization of Managing Heads
Specialization Frequency Percent None 1 0.5 HR 47 21.9 Marketing 38 17.7 Finance 47 21.9 Operations 18 8.4 Engineering 40 18.6 Others 24 11.2 Total 215 100
(Source: Primary data; SPSS Output)
Figure 8.7: Specialization of Managing Heads
0.5
21.9
17.7
21.9
8.4
18.6
11.2
0
5
10
15
20
25
Perc
ent
of t
otal
Specialization

Quantitative Data Analysis and Interpretation
©Ranjita Banerjee 101
8.2.8 Years of Service in the Firm
From Table 8.10 and Figure 8.8 it can be deduced that about 22% of the employees are in
the present firm since about 6 to 15 years. This throws some light on the retention rate in
SMEs, as well as the fact that the respondents are well experienced.
TABLE 8.10 - Years of Service in the Firm
Tenure Frequency Percent < 5 Yrs 42 19.5 6-10 Yrs 47 21.9 11-15 Yrs 47 21.9 16-20 Yrs 37 17.2 > 20 Yrs 42 19.5 Total 215 100
(Source: Primary data; SPSS Output)
Figure 8.8 - Years of Service in the Firm
19.521.9 21.9
17.219.5
0
5
10
15
20
25
< 5 Yrs 6-10 Yrs 11-15 Yrs 16-20 Yrs > 20 Yrs
Perc
ent
of t
otal
Yrs of employment

Quantitative Data Analysis and Interpretation
©Ranjita Banerjee 102
8.2.9 Total Work Experience
About 29% of the respondents (62 respondents) had more than 20 years of experience.
This throws some light that the respondents were well experienced. Only 10% of the
respondents (22 respondents) had less than 5 years of experience (Table 8.11 and Figure
8.9).
TABLE 8.11 - Total Work Experience
Tenure Frequency Percent < 5 Yrs 22 10.2 6-10 Yrs 37 17.2 11-15 Yrs 48 22.3 16-20 Yrs 46 21.4 > 20 Yrs 62 28.8 Total 215 100
(Source: Primary data; SPSS Output)
Figure 8.9 - Total Work Experience
10.2
17.2
22.3 21.4
28.8
0
5
10
15
20
25
30
35
< 5 Yrs 6-10 Yrs 11-15 Yrs 16-20 Yrs > 20 Yrs
Perc
ent
of t
otal
Total Yrs of experience

Quantitative Data Analysis and Interpretation
©Ranjita Banerjee 103
8.2.10 Type Of Firm
Out of the 126 SME firms, the majority i.e38% of the firms (48 firms) were Private
Limited Companies, followed by Private Companies comprising of 21% of the firms (27
firms). Less than 2% of firms were Public Ltd. or Joint-stock companies (Refer Table
8.12, Figure 8.10).
TABLE 8.12 - Type of Firm
Type of Firm Frequency Percent Proprietary 23 18.25 Partnership 24 19.04 Private 27 21.43 Joint-Stock Co 2 1.59 Pvt. Ltd. 48 38.09 Public Ltd. 2 1.59 Total 126 100
(Source: Primary data; SPSS Output)
Figure 8.10 : Type of Firm
18.3 19.021.4
1.6
38.1
1.6
0
5
10
15
20
25
30
35
40
45
Proprietary Partnership Private Joint-Stock Co Pvt. Ltd. Public Ltd.
Perc
ent
of t
otal
Type of Firm

Quantitative Data Analysis and Interpretation
©Ranjita Banerjee 104
8.2.11 Age of the Firm
Out of the 126 SMEs, about 68% of the firms (86 firms) were more than 16 years old,
while only about 3% firms (4 firms) were about 2 to 5 years old. This is a good sign
which shows firm’s sustainability over the years.
TABLE 8.13 - Age of the Firm
Age of the Firm Frequency Percent 2-5 Yrs 4 3.17 6-10 Yrs 15 11.9 11-15 Yrs 21 16.66 16-20 Yrs 34 26.98 > 20 YRS 52 41.26 Total 126 100
(Source: Primary data; SPSS Output)
Figure 8.11: Age of the Firm
3.2
11.916.7
27.0
41.3
0
5
10
15
20
25
30
35
40
45
2-5 Yrs 6-10 Yrs 11-15 Yrs 16-20 Yrs > 20 YRS
Perc
ent
of t
otal
Age of Firm

Quantitative Data Analysis and Interpretation
©Ranjita Banerjee 105
8.3. Descriptive Statistics- Frequency Distribution of HR Activities 8.3.1. Our Firm Has Some Written Documentation of HR Policies
Research shows that well-written business policies and procedures allow employees to
clearly understand their roles and responsibilities within predefined limits, and removes
ambiguity. It was found that 47% of the respondents agreed that their firm had no rules,
regulations or HR policies in written form in the form of Employee Handbook, Rule-
book or HR Manual, as shown in Table 8.14 and Figure 8.12.
TABLE 8.14: Written Documentation of HR Policies
Written documentation Frequency Percent
Emp Handbook 49 22.8 Rule Book 22 10.2 HR Manual 43 20 Nothing Like 101 47 Total 215 100 (Source: Primary data; SPSS Output)
Figure 8.12: Written Documentation of HR Policies
22.8
10.2
20.0
47.0
05
101520253035404550
Emp Handbook Rule Book HR Manual Nothing Like
Perc
ent
of t
otal
HR Policies

Quantitative Data Analysis and Interpretation
©Ranjita Banerjee 106
8.3.2. The Person Who Handles HR Functions
It is also worth mentioning that about 49% of the respondents agreed that their firms had
no internal HR expert designated to undertake the HR functions in the firm, but was
mostly taken care of by the owner/ entrepreneur. The greener side is, that about 51% of
the respondents said that their firms had a designated internal HR expert to take care of
the HR related functions (Table 8.15 and Figure 8.13).
TABLE 8.15 - The Person handling HR Functions
(Source: Primary data; SPSS Output)
Figure 8.13- The Person handling HR Functions
49.3
50.7
49
49
50
50
51
51
No Internal HR expert Presence of Internal HR expert
Perc
ent
of t
otal
Internal HR Expert
Frequency Percent
No Internal HR expert 106 49.3 Presence of Internal HR expert 109 50.7 Total 215 100

Quantitative Data Analysis and Interpretation
©Ranjita Banerjee 107
8.3.3. Does Your Firm Take Guidance From HR Consultant?
It can be seen from Table 8.16 (Figure 8.14) that about 36% of the respondents do not
take consultancy from an HR Consultant. The greener side is that about 64% of the
respondents take guidance from HR Consultants. As could be seen from Table 8.15 that
49% of the firms had no internal HR expert designated to undertake the HR functions in
the firm, so it could be deduced that taking consultancy services from an outside HR
expert could help to improve the functioning of the HR practices.
TABLE 8.16 - Taking Guidance From HR Consultant
Frequency Percent
Does Not Take Consultancy 77 35.8 Takes Consultancy 138 64.2 Total 215 100
(Source: Primary data; SPSS Output)
Figure 8.14 - Taking Guidance From HR Consultant
35.8
64.2
0
10
20
30
40
50
60
70
No Consultancy Takes Consultancy
Perc
ent
of t
otal
HR Consultancy

Quantitative Data Analysis and Interpretation
©Ranjita Banerjee 108
8.3.4. Does Your Firm Take Guidance From Financial Consultant?
It is a healthy gesture to see that about 95% of the respondents take consultancy from
Financial Consultants, which accentuates the fact that experts from outside are consulted
to enhance the functioning with respect to matters related to financial procedures (as
compared to only 64% of respondents who consult an HR Consultant for advice related to
HR functions). Refer Table 15 and Figure 15.
TABLE 8.17 -Taking Guidance from Financial Consultant
Frequency Percent
Does Not Take Consultancy 11 5.1 Takes Consultancy 204 94.9 Total 215 100 (Source: Primary data; SPSS Output)
Figure 8.15 - Taking Guidance from Financial Consultant
5.1
94.9
0102030405060708090
100
No Consultancy Takes Consultancy
Perc
ent
of t
otal
Financial Consultancy

Quantitative Data Analysis and Interpretation
©Ranjita Banerjee 109
8.3.5. How Often Does the Firm Consult an HR Consultant
It can be observed from Table 8.18 and Figure 8.16 that about 36% of the respondents
never consult an HR Consultant. Further, about 25% of the respondents consult an HR
Consultant only need-based, while 20% of the respondents consult an HR Consultant on a
monthly basis.
TABLE 8.18: Frequency of Consulting an HR Consultant
How Frequently Frequency Percent Monthly 43 20 Quarterly 17 7.9 Half-Yearly 8 3.7 Yearly 14 6.5 Once In 2 Yrs 3 1.4 Need-Based 53 24.7 Not At All 77 35.8
Total 215 100 (Source: Primary data; SPSS Output)
Figure 8.16: Frequency of Consulting an HR Consultant
20.0
7.93.7
6.51.4
24.7
35.8
05
10152025303540
Perc
ent
of t
otal
Frequency of HR Consultant
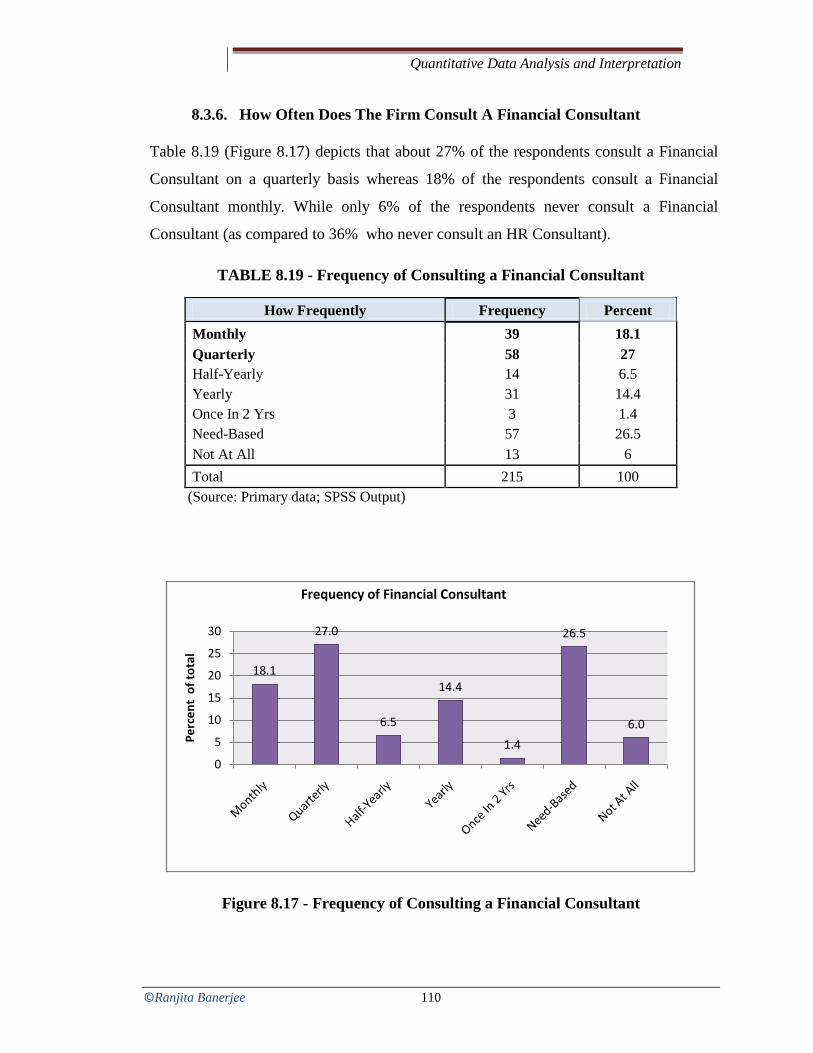
Quantitative Data Analysis and Interpretation
©Ranjita Banerjee 110
8.3.6. How Often Does The Firm Consult A Financial Consultant
Table 8.19 (Figure 8.17) depicts that about 27% of the respondents consult a Financial
Consultant on a quarterly basis whereas 18% of the respondents consult a Financial
Consultant monthly. While only 6% of the respondents never consult a Financial
Consultant (as compared to 36% who never consult an HR Consultant).
TABLE 8.19 - Frequency of Consulting a Financial Consultant
How Frequently Frequency Percent Monthly 39 18.1 Quarterly 58 27 Half-Yearly 14 6.5 Yearly 31 14.4 Once In 2 Yrs 3 1.4 Need-Based 57 26.5 Not At All 13 6 Total 215 100
(Source: Primary data; SPSS Output)
Figure 8.17 - Frequency of Consulting a Financial Consultant
18.1
27.0
6.5
14.4
1.4
26.5
6.0
0
5
10
15
20
25
30
Perc
ent
of t
otal
Frequency of Financial Consultant

Quantitative Data Analysis and Interpretation
©Ranjita Banerjee 111
8.3.7. Possessing a Quality or ISO Certification
It is noteworthy to see (refer Table 8.20 and Figure 8.18) that about 62% of the
respondents have a Quality or ISO Certification in their firms. It can be thus deduced that
SMEs are quite conscious about quality conformance, in order to be competitive. Further,
the subsidies given by the government, surely has encouraged quality consciousness.
TABLE 8.20 - Possessing a Quality or ISO Certification
Possessing Quality Certification Frequency Percent
Yes 133 61.9 No 82 38.1
Total 215 100 (Source: Primary data; SPSS Output)
Figure 8.18 - Possessing a Quality or ISO Certification
61.9
38.1
0
10
20
30
40
50
60
70
Yes No
Perc
ent
of t
otal
Certification

Quantitative Data Analysis and Interpretation
©Ranjita Banerjee 112
8.3.8. Registration With Any Trade Union
It is very pleasing to see that 94% of the respondent firms are not associated with any
Trade Union which shows sound Industrial Relations (IR) across the various industrial
estates in the Vadodara district without any need of Trade Union intervention between
employees and the management (Refer Table 8.21 and Figure 8.19).
TABLE 8.21 - Registration with Any Trade Union
Trade Union Registration Frequency Percent
Yes 13 6 No 202 94
Total 215 100 (Source: Primary data; SPSS Output)
Figure 8.19 - Registration with Any Trade Union
6.0
94.0
0
20
40
60
80
100
Yes No
Perc
ent
of t
otal
Trade Union Registration

Quantitative Data Analysis and Interpretation
©Ranjita Banerjee 113
8.3.9. Achievement of Expected Levels Of Growth
When asked whether the Managing Heads feel that they have achieved the expected
levels of growth or not, it is noteworthy to see that about 54% of the respondents said
‘No’ as their answer (Refer Table 8.22 and Figure 8.20). This shows that the Managing
Heads keep a high expectation of their levels of growth.
TABLE 8.22 - Achieved Expected Levels of Growth
Achieved Expected Frequency Percent
Yes 98 45.6 No 117 54.4
Total 215 100 (Source: Primary data; SPSS Output)
Figure 8.20 - Achieved Expected Levels of Growth
8.3.10. Number of Full Time Employees (Binned)
Table 8.23 and Figure 8.21 shows that 73% of the respondents (157 respondents) were
from firms with less than 50 full-time employees, whereas about 24% of the respondents
were from firms with 51 to 100 employees and only 3% with firms more than 100
employees. Thus, it can be concluded that majority of the firms have less than 50 full-
time employees in their firms.
45.6
54.4
40
42
44
46
48
50
52
54
56
Yes No
Perc
ent
of t
otal
Growth Achievement

Quantitative Data Analysis and Interpretation
©Ranjita Banerjee 114
TABLE 8.23 - Number of Full Time Employees (Binned)
Number of full-time employees Frequency Percent < 50 employees 157 73 51 - 100 employees 51 23.7 > 100 employees 7 3.3 Total 215 100
(Source: Primary data; SPSS Output)
Figure 8.21 - Number of Full Time Employees (Binned)
8.3.11. Number Of Part-Time Employees (Binned)
Table 8.24 and Figure 8.22 shows that 97% of the respondents were from firms with less
than 10 part-time employees, whereas only about 3% of the respondents were from firms
with more than 10 part-time employees. It can be thus, deduced that majority of the SME
firms in Vadodora district do not have the practice of employing part-time employees.
TABLE 8.24 - Number of Part-Time Employees (Binned)
Number of full-time employees Frequency Percent Less than 10 employees 209 97.2 More than 10 employees 6 2.8 Total 215 100
73.0
23.7
3.3
0
10
20
30
40
50
60
70
80
< 50 employees 51 - 100 employees > 100 employees
Perc
ent
of t
otal
No of Employees

Quantitative Data Analysis and Interpretation
©Ranjita Banerjee 115
Figure 8.22 - Number of Part-Time Employees (Binned)
8.3.12. Number of Contractual Employees (Binned)
Table 8.25 (Figure 8.23) shows that about 94% of the respondents were from firms with
less than 50 contractual employees, whereas only about 3% of the respondents were from
firms with 51 to 94 contractual employees and another 3% of the respondents were from
firms with more than 94 contractual employees.
TABLE 8.25 - Number of Contractual Employees (Binned)
Number of Contractual Employees Frequency Percent < 50 employees 201 93.5 51 - 95 employees 7 3.3 > 95 employees 7 3.3 Total 215 100
(Source: Primary data; SPSS Output)
97.2
2.80
20
40
60
80
100
120
< 10 employees >10 employees
Perc
ent
of t
otal
No of Part-time Employees

Quantitative Data Analysis and Interpretation
©Ranjita Banerjee 116
Figure 8.23 - Number of Contractual Employees (Binned)
8.3.13. Number of Women Employees (Binned)
It is surprising to see that that about 90% of the respondents were from firms with less
than 10 women employees, whereas only about 10% of the respondents were from firms
with more than 10 women employees. Thus it can be deduced that there is a lot of scope
of improvement for bringing in gender diversity in SMEs by encouraging more women
employees to join SMEs (Refer Table 8.26, Figure 8.24).
TABLE 8.26-Number of Women Employees (Binned)
Number of women employees Frequency Percent Less than 10 women employees 194 90.2 More than 10 women employees 21 9.8 Total 215 100
(Source: Primary data; SPSS Output)
Figure 8.24-Number of Women Employees (Binned)
93.5
3.3 3.30
20
40
60
80
100
< 50 employees 51 - 95 employees > 95 employees
Perc
ent
of t
otal
Contractual Employees
90.2
9.8
0
20
40
60
80
100
< 10 women employees >10 women employees
Perc
ent
of t
otal
No of women Employees

Quantitative Data Analysis and Interpretation
©Ranjita Banerjee 117
8.4. Descriptive Statistics of Scale Items 8.4.1. Cronbach’s Reliability Test
Reliability is a measure of how a scale can be relied on to produce similar measurements
every time we use the scale. Cronbach’s Alpha was administered to test the reliability of
the scale items. If the alpha value for the scale is 0.7 or more, it is usually considered a
good scale. The Scale was found out to be reliable in the present study.
Cronbach’s Alpha Reliability Test was administered for the below mentioned three
constructs separately as well as taken together (consisting of 31 items) viz.
• HR Practices
• Employee Outcomes (as a ‘Performance Dimension’)
• Organizational Performance Outcomes (as a ‘Performance Dimension’)
TABLE 8.27 - Cronbach Alpha Values for Scale Items
Construct No. of Items Cronbach Alpha HR Practices 14 .802 Employee Outcomes 9 .888 Organizational Performance Outcomes 8 .865 HR Practices & Performance Dimensions 31 .905 (Source: Primary data; SPSS Output)
Table 8.27 shows the Cronbach Alpha values for all the three constructs separately as
well as the combined alpha values for all the 31 scale items of ‘HR Practices’ and
‘Performance’ dimension, which was found out to be 0.905, which is more than 0.7;
hence the data is found to be reliable.

Quantitative Data Analysis and Interpretation
©Ranjita Banerjee 118
8.4.2. Mean & Standard Deviation (Of Scale Items)
Mean is the average of a group of numbers and is computed by summing all numbers and
dividing by the number of numbers. The mean is affected by each and every value, and
each data item influences the mean. It may also be a disadvantage sometime, because
extremely large or small values can cause the mean to be pulled towards the extreme
value. Whereas, Standard Deviation (σ) is a measure of variability. It is the square root of
the variance. The mean and standard deviation are computed in Table 8.28 for the scale
items of HR Practices, Employee Outcomes and Performance Outcomes. The mean of the
items are arranged in ascending order.
TABLE 8.28 - Mean, Standard Deviation & Cronbach’s Alpha (Mean arranged in ascending order)
Criteria Mean Std. Deviation N Cronbach (α)
HR Practices Good performers are given non-financial incentives 2.98 1.127 215
Employees are rotated from one job to another 3.4 0.916 215 Organizes training and skill development programs 3.67 1.04 215
Employees participate in the decision-making process 3.67 1.075 215
Selection is on the basis of merit 3.92 0.75 215 Good performers are given more authority and responsibility 3.93 0.87 215
Employees receive feedback 3.94 0.656 215 Good performers are given financial incentives 3.95 0.985 215 Enough opportunity for career growth 3.98 0.837 215 0.802 Employees are given opportunity to suggest improvement 4.02 0.7 215
Our organization places the right person in the right job 4.05 0.628 215
Appraises the performance of employees at regular intervals 4.1 0.64 215
Compensation is decided on the basis of competence or ability 4.12 0.572 215
Employees can openly communicate with the superiors 4.14 0.574 215
Mean & σ of HR Practices 3.847 0.812

Quantitative Data Analysis and Interpretation
©Ranjita Banerjee 119
Criteria Mean Std. Deviation N Cronbach (α)
Employee Outcomes Employees are punctual and report daily 3.55 0.873 215 Employees are regular 3.56 0.872 215 Employees take up extra duties and responsibilities 3.71 0.87 215
Competence of an Employee 3.75 0.705 215 Employees are committed 3.8 0.866 215 0.888 Employee’s follow general code of conduct and rules 3.83 0.797 215
Employee’s general behavior is good 3.86 0.719 215 Employee’s co-operation with is satisfactory 3.91 0.74 215 Employees co-operate among themselves 3.97 0.761 215
Mean & σ of Employee Outcomes 3.771 0.8
Organizational Outcomes Return on Investment (in %) has increased 3.68 0.887 215 There is an increase in the Net Profit Margin 3.69 0.853 215 Average Number of defects of products / deficiencies in service shows a decrease 4.03 0.742 215
The firm has displayed proper utilization of resources 4.12 0.749 215 0.865
Our suppliers/ vendors are satisfied with us 4.14 0.683 215
Customer satisfaction has increased 4.17 0.683 215
Products/service Quality shows improvement 4.23 0.692 215
Measures have been taken by the firm for product/ service development 4.24 0.688 215
Mean & σ of Organizational Outcomes 4.037 0.747
(Source: Compiled from SPSS Output)
Interpretation
After arranging the items in ascending order of the Means, it can be observed from Table
8.28 that the lowest mean, which is 2.98,is for the statement ‘Good performers are
given non-financial incentives’. The Standard Deviation for the same item is 1.127.
This shows that SME firms do not encourage Non-Financial incentives to a great extent.
It can be also be deduced from Table 8.28 that employees are not much rotated from
one job to another (Mean= 3.40, Std. Dev= 0.916). Job-rotation can help the employees
to get trained in new areas of work, which can help to enhance employee motivation. It

Quantitative Data Analysis and Interpretation
©Ranjita Banerjee 120
can also be observed that Product Development has highest mean of 4.24 with
standard deviation of 0.688, which is a good sign and shows the fact that SMEs undergo
a lot of product development, based on customer needs.
8.5. Descriptive Statistics for Multiple Response Questions Respondents were asked to tick wherever applicable for the various responses related to
various HR practices pertaining to their firms. Multiple responses were received
pertaining to the following HR practices in SMEs:
• Sources of recruitment
• Methods of Selection
• Compensation Management
• Welfare measures offered (mandatory as well as non-mandatory)
• Performance Management
• Training and Development
The respondents were asked to tick one or more methods whichever prevailed in their
firm. The methods were chosen based on the general available practices gathered from
literature review as well as discussions with the owners/ Managing Heads during the
pilot-study stage. The multiple responses helped to know the prevalence of various HR
practices in the SME sector in Vadodara district.
8.5.1. Sources of Recruitment: Multiple Response Frequencies
The major sources of Recruitment were identified and respondents were asked to identify
the sources of recruitment prevalent in their firms. Table 8.29 gives an idea about the
major sources of recruitment in SMEs across the various estates. It was found that
majority of the respondents (26%) marked ‘Employee Referrals’ as the most important
source of recruitment, followed by ‘Walk-ins’ with about 18%. It is also noteworthy to
find that ‘Newspaper advertisements’ comprised of only about 16%.

Quantitative Data Analysis and Interpretation
©Ranjita Banerjee 121
TABLE 8.29 - Sources of Recruitment
Sources of Recruitment N Percent % of cases Government Exchange 40 7.00% 18.60% Consultancy Firms 54 9.50% 25.10% Walk Inns 101 17.80% 47.00% From Company's Website 99 17.40% 46.00% Newspaper Advertisement 93 16.30% 43.30% Employee's Referral 147 25.80% 68.40% Other's 35 6.20% 16.30% Total 569 100.00% 264.70% (Source: Primary data; SPSS Output)
8.5.2. Methods of Selection: Multiple Response Frequencies
The most common methods of Selection were identified as Application blank, written
test, interviews and on-the-job testing, based on pilot-study. Respondents were asked to
identify the prevalent selection methods incorporated in their firms. Table 8.30 gives an
idea about the major selection methods in SMEs across the various estates. ‘Interviews’
has been found to be the most important selection method, with about 41% respondents,
followed by ‘on-the-job-testing’. It is interesting to note that the word ‘on-the-job
testing’ was coined by the researcher as one of the prevalent methods of selection,
in the various industrial estates in Vadodara district, during her pilot-study. In this
method, especially for the selection of skilled, semi-skilled and unskilled workers, who
are looking forward for employment are asked to work for about a week in the firm.
Based on observation by the supervisor/ senior during the one week period, the
candidate is either selected or not selected, based on his performance. This adds a new
selection method to the body of knowledge prevalent in the SMEs.
TABLE 8.30 - Methods of Selection
Methods of Selection N Percent % of cases Application/Detailed CV 107 25.00% 50.20% Written Test 38 8.90% 17.80% Interview 174 40.70% 81.70% On Job Testing 109 25.50% 51.20% Total 428 100.00% 200.90%

Quantitative Data Analysis and Interpretation
©Ranjita Banerjee 122
8.5.3. Basis of Pay: Multiple Response Frequencies
It can be observed from Table 8.31 that majority of the firms have a pay based on
performance of the employees (about 30% of the respondents), followed by pay based on
skills (about 26% of the respondents). It can be deduced that good performance and skill-
based competencies are appreciated in the SMEs as it is linked with pay and compensation.
TABLE 8.31 - Basis of Pay
Firm has a pay based on.... N Percent % of cases Performance 153 29.50% 71.20% Qualification 85 16.40% 39.50% Negotiation 49 9.50% 22.80% Skills 135 26.10% 62.80% Experience 96 18.50% 44.70% Total 518 100.00% 240.90% (Source: Primary data)
8.5.4. Welfare Measures/ Social Security Measures: Multiple Response Frequencies
Research proves that welfare measures helps to enhance employee engagement and also
enhances the feel-good factor of the employees (Gallup Study, 2016). Welfare measures/
Social security measures are divided into few mandatory measures like Employee State
Insurance Corporation (ESIC), Employee’s Provident Fund (EPF), Bonus etc, for firms
with the prescribed minimum number of employees; as well as few non-mandatory
measures like mediclaim etc. ESIC with about 28% scores the highest among the other
welfare/ social security measures, followed by annual Bonus with about 26% of the
respondents agreeing for it. However, ESIC being a mandatory social security measure, it
is surprising to note that its adherence is far less than the minimal expected. (Refer Table
8.32)

Quantitative Data Analysis and Interpretation
©Ranjita Banerjee 123
TABLE 8.32- Welfare Measures/ Social Security Measures
Welfare Measures N Percent % cases Mediclaim 102 15.20% 48.10% Insurance (ESIC etc) 184 27.50% 86.80% Provident Fund 140 20.90% 66.00% Bonus 177 26.40% 83.50% Uniform 51 7.60% 24.10% Canteen 9 1.30% 4.20% Others 7 1.00% 3.30% Toal 670 100.00% 316.00% (Source: Primary data)
8.5.5. Performance Assessment Method: Multiple Response Frequencies
Table 8.33 shows that about 30% of the respondents agree that their firm has a formal
Performance Appraisal Format, which is a good sign in the context of SMEs, which are
believed to be quite informal in nature. About 50% of the respondents agree that
performance is assessed in their firm by the HODs/ owners, based on past
performance of employees, though there is no prescribed format for the same. It is
also to be also noted that about 10% of the respondents say that their firm does not have
any system of performance assessment. It is also interesting to note that a negligible
portion of about 4% of firms have some modern methods of Performance Assessment
like Psychometric Tests, Assessment Centres, Management-by-Objectives, on-line
continuous assessments as well as other well devised assessment tools designed by
outside HR Consultants/ Consultancy firms. Thus, it can be ascertained that there is a
scope of improvement to enhance the performance assessment system in majority SMEs.
TABLE 8.33- Performance Assessment Method
Performance Assessment Method N Percent % of Cases Performance Appraisal Format 82 29.80% 39.40% Essay Method 19 6.90% 9.10% Evaluate Past Performance (informally by HOD/ owner) 136 49.50% 65.40% Others 12 4.40% 5.80% Does Not Exist in Form 26 9.50% 12.50% Total 275 100.00% 132.20%
8.5.6. Use of Performance Assessment: Multiple Response Frequencies

Quantitative Data Analysis and Interpretation
©Ranjita Banerjee 124
It is a good to see that performance assessment is used positively to develop employees,
as about 27% of the respondents opine that their firm uses performance assessment for
developing the employees. It is also good to note that performance assessment is not used
in a negative way to remove employees at the workplace as only about 6% of the
respondents agree to it (Refer Table 8.34).
TABLE 8.34-Use of Performance Assessment
Use of Performance Assessment N Percent % of Cases For Promotion of Employees 115 25.10% 56.40% For Training Employees 81 17.60% 39.70% For Disciplining Employees 74 16.10% 36.30% For Developing Employees 123 26.80% 60.30% For Removing Employees 28 6.10% 13.70% Others 13 2.80% 6.40% Does Not Exist in Form 25 5.40% 12.30% Total 459 100.00% 225.00% (Source: Primary data)
8.5.7. Training Method: Multiple Response Frequencies
As can be observed in Table 8.35, SMEs seems to rely more on On-the-Job Training
(about 44%), followed by mentoring by seniors (31%). It also corroborates the fact that
SMEs try to be more cost-effective in all their aspects, and On-the-Job training is surely
more cost-effective than Off-the-Job Training (19%). Further, both On-the-Job Training
and Mentoring are tailor-made training which best suits the environment and functioning
of the organization. It is also on a positive note that only a negligible amount of about
2.5% of the firms has no training programs devised for employees in any form.
TABLE 8.35- Training Method
Training Method N Percent % of Cases On-the-job Training 189 43.50% 88.70% Mentoring by Seniors 135 31.10% 63.40% Workshop/ Seminar (Off-the-job) 83 19.10% 39.00% Others 16 3.70% 7.50% Does Not Exist in any Form 11 2.50% 5.20% Total 434 100.00% 203.80%

Quantitative Data Analysis and Interpretation
©Ranjita Banerjee 125
8.6. Cross-Tabulation for Multiple Response Questions
A cross-tabulation can be done by combining any two of the questions and tabulating the
data together. It basically describes two or more variables simultaneously. It must be
noted here that the mere existence of a statistically significant association does not
necessarily imply a cause-and-effect relationship between the (presumed) independent
and the (presumed) dependent variable. Cross-tabulation was performed between few
variables, whichever was thought to be important by the researcher to find an association,
if any.
8.6.1. Cross-Tabulation: Sources of Recruitment and Selection Methods (Multiple Responses)
Cross-tabulation was done between ‘Sources of Recruitment’ and ‘Selection Methods’.
‘Employee Referrals’ was found out to be the most important ‘Source of Recruitment’
with the highest count, followed by ‘Walk-inns’ (Refer Table 8.36). Further, the
‘Selection Methods’ most common in the recruitment method of ‘Employee Referrals’ is
found to be through ‘Application Blank/ Detailed CV’ and ‘Interviews’, followed by
‘On-the-Job Testing’.

Quantitative Data Analysis and Interpretation
©Ranjita Banerjee 126
TABLE 8.36- Cross-Tabulation: Sources of Recruitment and Selection Methods
$Percentages and totals are based on respondents; aDichotomy group tabulated at value 1 (Source: SPSS Output, Primary data)
Sources of Recruitment
Selection Methods
Application/Detailed CV
Written Test Interview
On-the-Job
Testing Total
Government Exchange
Count 37 4 37 20 40
% within $Recruitment 92.50% 10.00% 92.50% 50.00%
% within $Selection 21.30% 10.50% 21.30% 18.30%
Consultancy Firms
Count 47 14 47 17 54
% within $Recruitment 87.00% 25.90% 87.00% 31.50%
% within $Selection
27.00% 36.80% 27.00% 15.60%
Walk Inns
Count 84 24 84 66 101 % within $Recruitment 83.20% 23.80% 83.20% 65.30%
% within $Selection 48.30% 63.20% 48.30% 60.60%
From Company's
Website
Count 92 22 92 39 97 % within $Recruitment 94.80% 22.70% 94.80% 40.20%
% within $Selection 52.90% 57.90% 52.90% 35.80%
Newspaper Advertisement
Count 87 18 87 41 93 % within $Recruitment 93.50% 19.40% 93.50% 44.10%
% within $Selection 50.00% 47.40% 50.00% 37.60%
Employee's Referral
Count 127 24 127 76 147 % within $Recruitment 86.40% 16.30% 86.40% 51.70%
% within $Selection 73.00% 63.20% 73.00% 69.70%
Others
Count 21 7 21 25 35 % within $Recruitment 60.00% 20.00% 60.00% 71.40%
% within $Selection 12.10% 18.40% 12.10% 22.90%
Total Count 107 174 174 109 215

Quantitative Data Analysis and Interpretation
©Ranjita Banerjee 127
8.6.2. Cross-Tabulation: Performance Assessment Method and Use of Performance Appraisal (Multiple Responses)
Cross-tabulation was done between ‘Performance Assessment Method’ and ‘Use of
Performance Appraisal’. ‘Evaluating Past Performance’ by the HOD/ owner, though
without a formal appraisal format, was found out to be the most important ‘Performance
Assessment Method’ with the highest count (Refer Table 8.37). Further, the ‘Use of
Performance Assessment’ most commonly found through evaluating past performance is
for ‘Developing Employees’ followed by ‘For Promotion decisions’. It is a positive
gesture to see that past performance evaluation is seldom done to remove employees.
TABLE 8.37 - Cross-Tabulation: Performance Assessment Method and Use of Performance Appraisal
Performance Assessment
Method
Use of Performance Assessment
For Promo--tion
Training Employee
To Discipline
Develop Employe
es
Remove Employe
es Others Total
Performance Appraisal Format
Count 62 54 40 57 15 11 80
% within $Performance 77.5% 67.5% 50.0% 71.3% 18.8% 13.8%
% within $Performance Use 53.9% 66.7% 54.1% 46.7% 53.6% 100.0%
Essay Method
Count 12 14 10 14 7 0 19
% within $Performance 63.2% 73.7% 52.6% 73.7% 36.8% 0.0%
% within $Performance Use 10.4% 17.3% 13.5% 11.5% 25.0% 0.0%
Evaluate Past Performance
Count 76 53 58 94 24 7 132
% within $Performance 57.6% 40.2% 43.9% 71.2% 18.2% 5.3% % within $Performance Use 66.1% 65.4% 78.4% 77.0% 85.7% 63.6%
Others
Count 12 10 8 8 2 0 12
% within $Performance 100.0% 83.3% 66.7% 66.7% 16.7% 0.0%
% within $Performance Use 10.4% 12.3% 10.8% 6.6% 7.1% 0.0%
Does Not Exist in Form
Count 5 2 1 4 0 0 22
% within $Performance 22.7% 9.1% 4.5% 18.2% 0.0% 0.0%
% within $Performance Use 4.3% 2.5% 1.4% 3.3% 0.0% 0.0%
Count 115 81 74 122 28 11 200 Percentages and totals are based on respondents; Dichotomy group tabulated at value 1. (Source: SPSS Output, Primary data)

Quantitative Data Analysis and Interpretation
©Ranjita Banerjee 128
8.6.3. Cross-Tabulation: Age of the Firm and Documentation of HR Practice
Cross-tabulation was done between ‘Age of the firm’ and ‘Documentation of HR
Practice’. It is to be noted here that the ‘Age of the firm’ was captured in five groups (2-5
years, 6-10 years, 11-15 years, 16-20 years and more than 21 years). This cross-
tabulation was done to see if age of the firm has any linkage with the documentation of
HR practices (See Table 8.38 and Figure 8.25).
TABLE 8.38 - Cross-Tabulation: Age of the Firm and Documentation of HR Practice
Documentation of HR Practice Age of the Firm
2-5 Yrs 5-10 Yrs
11-15 Yrs
16-20 Yrs
> 21 Yrs Total
EMP HANDBOOK
Count 2 6 13 10 18 49 % within Our firm has 4.1% 12.2% 26.5% 20.4% 36.7% 100.0% % within Age of the Firm 25.0% 26.1% 35.1% 20.0% 18.6% 22.8%
RULE BOOK Count 0 1 10 9 2 22 % within Our firm has 0.0% 4.5% 45.5% 40.9% 9.1% 100.0% % within Age of the Firm 0.0% 4.3% 27.0% 18.0% 2.1% 10.2%
HR MANUAL
Count 2 2 0 13 26 43
% within Our firm has 4.7% 4.7% 0.0% 30.2% 60.5% 100.0% % within Age of the Firm 25.0% 8.7% 0.0% 26.0% 26.8% 20.0%
NOTHING LIKE
Count 4 14 14 18 51 101 % within Our firm has 4.0% 13.9% 13.9% 17.8% 50.5% 100.0% % within Age of the Firm 50.0% 60.9% 37.8% 36.0% 52.6% 47.0%
Total Count 8 23 37 50 97 215 % within Our firm has 3.7% 10.7% 17.2% 23.3% 45.1% 100.0%
% within Age of the Firm 100.0% 100.0% 100.0% 100.0% 100.0% 100.0% (Source: SPSS Output, Primary data)

Quantitative Data Analysis and Interpretation
©Ranjita Banerjee 129
Figure 8.25 - Age of the Firm and Documentation of HR Practice
It can be seen from Table 8.38 and Figure 8.25 that of the 49 respondents who have
confirmed that they have an Employee Handbook, about 37% (18 respondents) are from
firms which are more than 21 years old. Further, of the 43 respondents who have
confirmed that they have an HR Manual, about 61% (26 respondents) are from firms
which are more than 21 years old.
8.7. Chi-Square Test on Cross-Tabulation
Chi-square test is considered when we are interested in finding the differences in
frequency counts using nominal data. The chi-square statistic (χ2) is used to test the
statistical significance of the observed association in a cross-tabulation. To determine
whether a systematic association exists, the probability of obtaining a value of chi-square
as large or larger than the one calculated from the cross-tabulation is estimated. An
important characteristic of the chi-square statistic is the number of degrees of freedom
(df) associated with it. That is, df = (r - 1) x (c -1). The null hypothesis (H0) of no
association between the two variables will be rejected only when the calculated value of
the test statistic is greater than the critical value of the chi-square distribution with the
appropriate degrees of freedom. Hypotheses testing was done to see if some significant
2.0 0.0 2.0 4.061 2
141310
0
1410 9
131818
2
26
51
0
10
20
30
40
50
60
Handbook Rulebook HR Manual Nothing
Coun
t of R
espo
nden
ts
HR Practice Documentation across age of Firms
Age 2-5 Yrs 5-10 Yrs11-15 Yrs 16-20 Yrs> 21 Yrs

Quantitative Data Analysis and Interpretation
©Ranjita Banerjee 130
association existed or not between few HR practices/ activities and some firm specific
context variables, in the present study.
8.7.1. Cross-Tabulation & Chi-square Test: Type of Firm and Documentation of HR Practice
Cross-tabulation was done between ‘Type of firm’ and ‘Documentation of HR Practice’.
It is to be noted here that the ‘Types of firms’ were Proprietary, Partnerships, Private,
Joint-stock company and Private Limited. It needs to be re-called here that written
documentation of rules/ regulations helps in its adherence in a better manner than
unwritten/ not documented ones. This cross-tabulation was done to see if there is any
association between the firm type and the documentation of HR practices (Refer Table
8.39).
The null and alternate hypothesis is framed herewith as:
H01: There is no significant association between Type of firm and Documentation of
HR practice.
Ha1: There is significant association between Type of firm and Documentation of HR
practice.
TABLE 8.39- Cross-Tabulation: Type of Firm and Documentation of HR Practice
Documentation of HR Practice Firm Type
(Our firm has…) PROPRIETORY
PARTNERSHIP
PRIVATE
JOINT STOC
K
PRIVATE LTD.
PUBLIC
LTD.
TOTAL
EMP HAND-BOOK
Count 12 8 7 2 20 0 49
% within Our firm has 24.5% 16.3% 14.3% 4.1% 40.8% 0.0% 100.0%
% within Firm Type 33.3% 19.0% 14.9% 50.0% 24.4% 0.0% 22.8%
RULE BOOK
Count 4 5 5 0 8 0 22
% within Our firm has 18.2% 22.7% 22.7% 0.0% 36.4% 0.0% 100.0%
% within Firm Type 11.1% 11.9% 10.6% 0.0% 9.8% 0.0% 10.2%
HR MANU
AL
Count 0 3 10 0 26 4 43
% within Our firm has 0.0% 7.0% 23.3% 0.0% 60.5% 9.3% 100.0%
% within Firm Type 0.0% 7.1% 21.3% 0.0% 31.7% 100.0% 20.0%
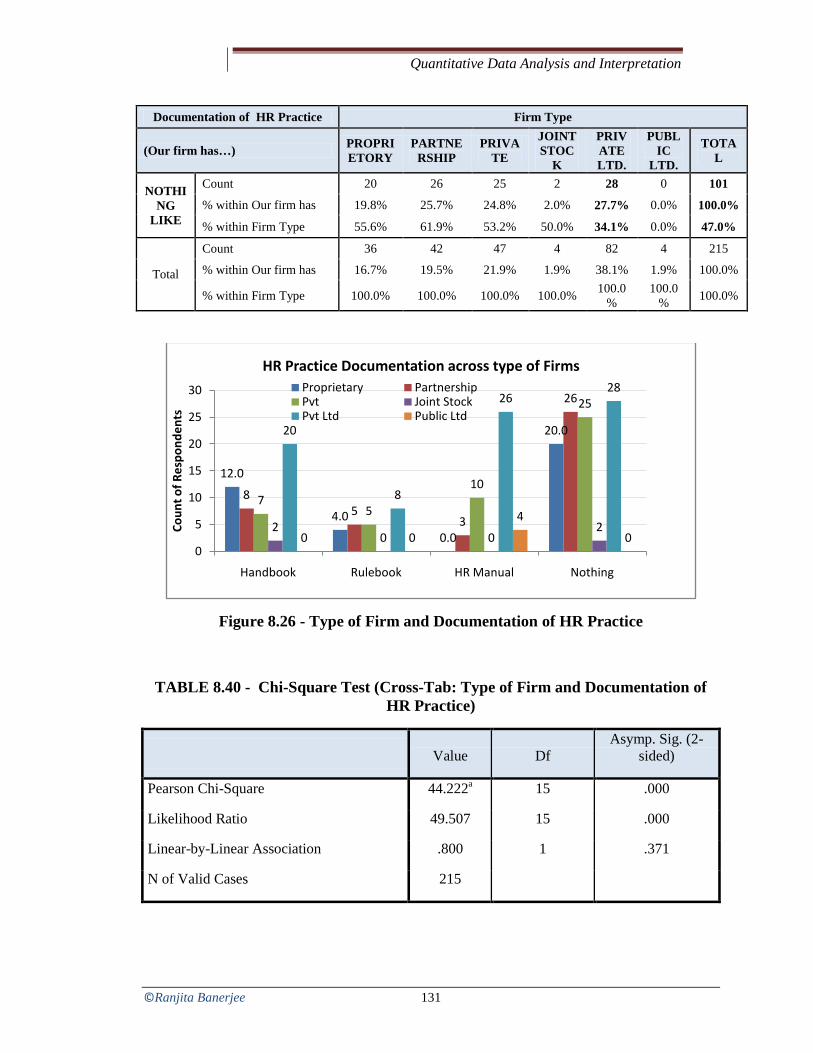
Quantitative Data Analysis and Interpretation
©Ranjita Banerjee 131
Documentation of HR Practice Firm Type
(Our firm has…) PROPRIETORY
PARTNERSHIP
PRIVATE
JOINT STOC
K
PRIVATE LTD.
PUBLIC
LTD.
TOTAL
NOTHING
LIKE
Count 20 26 25 2 28 0 101
% within Our firm has 19.8% 25.7% 24.8% 2.0% 27.7% 0.0% 100.0%
% within Firm Type 55.6% 61.9% 53.2% 50.0% 34.1% 0.0% 47.0%
Total
Count 36 42 47 4 82 4 215
% within Our firm has 16.7% 19.5% 21.9% 1.9% 38.1% 1.9% 100.0%
% within Firm Type 100.0% 100.0% 100.0% 100.0% 100.0%
100.0% 100.0%
Figure 8.26 - Type of Firm and Documentation of HR Practice
TABLE 8.40 - Chi-Square Test (Cross-Tab: Type of Firm and Documentation of HR Practice)
Value Df Asymp. Sig. (2-
sided)
Pearson Chi-Square 44.222a 15 .000
Likelihood Ratio 49.507 15 .000
Linear-by-Linear Association .800 1 .371
N of Valid Cases 215
12.0
4.0
0.0
20.0
85
3
26
75
10
25
20 0
2
20
8
2628
0 0
4
00
5
10
15
20
25
30
Handbook Rulebook HR Manual Nothing
Coun
t of R
espo
nden
ts
HR Practice Documentation across type of FirmsProprietary PartnershipPvt Joint StockPvt Ltd Public Ltd

Quantitative Data Analysis and Interpretation
©Ranjita Banerjee 132
Value Df Asymp. Sig. (2-
sided)
Pearson Chi-Square 44.222a 15 .000
Likelihood Ratio 49.507 15 .000
Linear-by-Linear Association .800 1 .371
N of Valid Cases 215
0 cells (.0%) have expected count less than 5. The minimum expected count is 7.37.
(Source: SPSS Output)
As the p-value is less than 0.05, so we reject null hypothesis and conclude that there
is significant association between type of firm and documentation of HR practice.
From Table 8.39 and Figure 8.26 it can be seen that about 101 respondents (47% of
respondents) have confirmed that their firm does not have anything in documentation
related to HR policies/ Hand-books etc, of whom about 28% are from Private Limited
companies. It is also worth mentioning that about 49 respondents (about 23% of
respondents) have confirmed that their firm has an Employee Hand-book of whom 20
respondents (about 41% respondents) belong to Private Ltd. Companies. Further, it is
also to be noted that 43 respondents (about 20% of respondents) have confirmed that their
firm has an HR Manual of whom 26 respondents (about 60.5% of respondents) are from
Private Limited companies. Further, as can be seen from Table 8.40 (chi-square test), that
the p-value is less than 0.05, so we reject null hypothesis and conclude that there is
significant association between type of firm and documentation of HR practice.
8.7.2. Cross-Tabulation & Chi-square Test: Size of Firm and Documentation of HR Practice
Cross-tabulation was done between ‘Size of firm’ and ‘Documentation of HR Practice’. It
is to recall here that the ‘Size of firms’ were Small or Medium Enterprises only. This
cross-tabulation followed by chi-square test was done to see if size of firm has any
association with the documentation of HR practices (Refer Table 8.41).

Quantitative Data Analysis and Interpretation
©Ranjita Banerjee 133
The null and alternate hypothesis is framed herewith as:
H02: Size of firm has no significant association with Documentation of HR practice.
Ha2: There is significant association between Size of firm and Documentation of HR
practice.
TABLE 8.41: Cross-Tabulation- Size of Firm and Documentation of HR Practice
Documentation of HR Practice Size of the Firm Total
(Our firm has…) SMALL MEDIUM
EMP HANDBOOK
Count 27 22 49 Expected Count 32.6 16.4 49 % within Our firm has 55.1% 44.9% 100.0% % within Size of the Firm 18.9% 30.6% 22.8%
RULE BOOK
Count 13 9 22 Expected Count 14.6 7.4 22 % within Our firm has 59.1% 40.9% 100.0% % within Size of the Firm 9.1% 12.5% 10.2%
HR MANUAL
Count 19 24 43 Expected Count 28.6 14.4 43 % within Our firm has 44.2% 55.8% 100.0% % within Size of the Firm 13.3% 33.3% 20.0%
NOTHING LIKE
Count 84 17 101 Expected Count 67.2 33.8 101 % within Our firm has 83.2% 16.8% 100.0% % within Size of the Firm 58.7% 23.6% 47.0%
Total
Count 143 72 215 Expected Count 143 72 215 % within Our firm has 66.5% 33.5% 100.0% % within Size of the Firm 100.0% 100.0% 100.0%
(Source: SPSS Output, Primary data)

Quantitative Data Analysis and Interpretation
©Ranjita Banerjee 134
Figure 8.27 - Cross-Tab: Size of Firm and Documentation of HR Practice
TABLE 8.42- Chi-Square Test (Cross-Tab: Size Of Firm And Documentation Of HR Practice)
Value Df Asymp. Sig. (2-sided) Pearson Chi-Square 25.611a 3 0 Likelihood Ratio 26.401 3 0 Linear-by-Linear Association 12.37 1 0
N of Valid Cases 215
0 cells (.0%) have expected count less than 5. The minimum expected count is 7.37. (Source: SPSS Output)
As the p-value is less than 0.05, so we reject null hypothesis and conclude that there
is significant association between Size of firm and Documentation of HR practice. It
can be seen from Table 8.41 and Figure 8.27 that about 101 respondents have confirmed
that they have no documentation of HR Practice of which 84 respondents (about 83%
respondents) belong to Small firms. It has also to be noted that 49 of the respondents’
firms have an Employee Handbook of which 27 respondents (55%) are from Small
Enterprises. Further, 43 of the respondents have confirmed that their firm has an HR
Manual of whom 24 respondents (56%) are from Medium Enterprises.
27.0
13.019.0
84.0
22
9
2417
0102030405060708090
Handbook Rulebook HR Manual Nothing
Coun
t of R
espo
nden
ts
HR Practice Documentation across size of Firms
Size-Small Medium

Quantitative Data Analysis and Interpretation
©Ranjita Banerjee 135
8.7.3. Cross-Tabulation and Chi-Square: Quality/ ISO Certification and Documentation of HR Practice
Cross-tabulation was done between firms bearing Quality or ISO Certification and
‘Documentation of HR Practice’. This cross-tabulation was done to see if an accredited
SME firm bearing any Quality/ ISO Certification has an association with the
documentation of HR practices (See Table 8.43 and Figure 8.28).
The null and alternate hypothesis is framed herewith as:
H03: Documentation of HR practice is not associated with the SME firm bearing a
Quality/ ISO Certification.
Ha3: Documentation of HR practice is associated with the SME firm bearing a
Quality/ ISO Certification.
TABLE 8.43- Cross-Tabulation: Quality/ ISO Certification and Documentation of HR Practice
Documentation of HR Practice Quality or ISO Certification Total
(Our firm has….) YES NO
EMP HANDBOOK
Count 26 23 49 % within Our firm has 53.1% 46.9% 100.0% % within Quality or ISO Certification 19.5% 28.0% 22.8%
RULE BOOK Count 8 14 22 % within Our firm has 36.4% 63.6% 100.0% % within Quality or ISO Certification 6.0% 17.1% 10.2%
HR MANUAL
Count 41 2 43 % within Our firm has 95.3% 4.7% 100.0% % within Quality or ISO Certification 30.8% 2.4% 20.0%
NOTHING LIKE
Count 58 43 101 % within Our firm has 57.4% 42.6% 100.0% % within Quality or ISO Certification 43.6% 52.4% 47.0%
Total Count 133 82 215 % within Our firm has 61.9% 38.1% 100.0% % within Quality or ISO Certification 100.0% 100.0% 100.0%
(Source: SPSS Output, Primary data)

Quantitative Data Analysis and Interpretation
©Ranjita Banerjee 136
Figure 8.28 - Cross-Tabulation: Quality/ ISO Certification and Documentation of HR Practice
TABLE 8.44 - Chi-Square Test: Quality/ ISO Certification and Documentation of HR Practice
Value Df Asymp. Sig. (2-sided)
Pearson Chi-Square 28.951a 3 0 Likelihood Ratio 35.296 3 0 Linear-by-Linear Association 1.265 1 0.261
N of Valid Cases 215 0 cells (.0%) have expected count less than 5. The minimum expected count is 8.39 (Source: SPSS Output, Primary data) As the p-value is less than 0.05, so we reject null hypothesis and conclude that
Documentation of HR practice is associated with the SME firm bearing a Quality/
ISO Certification (Refer Table 8.44). It can be seen from Table 8.43 and Figure 8.28
that of the 49 Managing Heads who have confirmed that they have an Employee
Handbook, 53% (26 respondents) have a Quality/ ISO Certification. Further, of the 43
respondents who have said that their firm possesses an HR Manual, about 95% (41
respondents) have a Quality/ ISO Certification in their firm.
26.0
8.0
41.0
58.0
23
14
2
43
0
10
20
30
40
50
60
70
Handbook Rulebook HR Manual Nothing
Coun
t of R
espo
nden
ts
HR Practice Documentation - Quality/ISO Certified Firms
Certification - Yes No
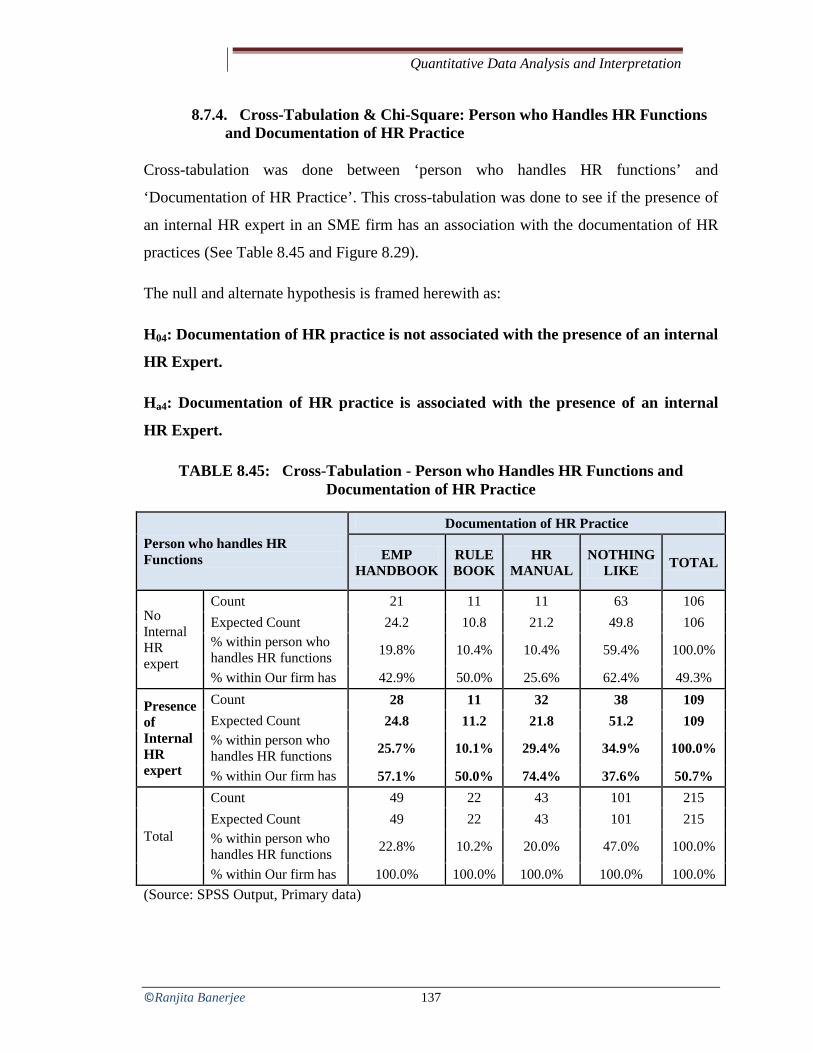
Quantitative Data Analysis and Interpretation
©Ranjita Banerjee 137
8.7.4. Cross-Tabulation & Chi-Square: Person who Handles HR Functions and Documentation of HR Practice
Cross-tabulation was done between ‘person who handles HR functions’ and
‘Documentation of HR Practice’. This cross-tabulation was done to see if the presence of
an internal HR expert in an SME firm has an association with the documentation of HR
practices (See Table 8.45 and Figure 8.29).
The null and alternate hypothesis is framed herewith as:
H04: Documentation of HR practice is not associated with the presence of an internal
HR Expert.
Ha4: Documentation of HR practice is associated with the presence of an internal
HR Expert.
TABLE 8.45: Cross-Tabulation - Person who Handles HR Functions and Documentation of HR Practice
Person who handles HR Functions
Documentation of HR Practice
EMP HANDBOOK
RULE BOOK
HR MANUAL
NOTHING LIKE TOTAL
No Internal HR expert
Count 21 11 11 63 106 Expected Count 24.2 10.8 21.2 49.8 106 % within person who handles HR functions 19.8% 10.4% 10.4% 59.4% 100.0%
% within Our firm has 42.9% 50.0% 25.6% 62.4% 49.3%
Presence of Internal HR expert
Count 28 11 32 38 109 Expected Count 24.8 11.2 21.8 51.2 109 % within person who handles HR functions 25.7% 10.1% 29.4% 34.9% 100.0%
% within Our firm has 57.1% 50.0% 74.4% 37.6% 50.7%
Total
Count 49 22 43 101 215 Expected Count 49 22 43 101 215 % within person who handles HR functions 22.8% 10.2% 20.0% 47.0% 100.0%
% within Our firm has 100.0% 100.0% 100.0% 100.0% 100.0% (Source: SPSS Output, Primary data)

Quantitative Data Analysis and Interpretation
©Ranjita Banerjee 138
Figure 8.29 - Cross-Tabulation: Person who Handles HR Functions and Documentation of HR Practice
TABLE 8.46 - Chi-Square: Person who Handles HR Functions and Documentation of HR Practice
Value Df Asymp. Sig. (2-sided)
Pearson Chi-Square 17.405a 3 0.001 Likelihood Ratio 17.923 3 0 Linear-by-Linear Association 4.707 1 0.03 N of Valid Cases 215
0 cells (.0%) have expected count less than 5. The minimum expected count is 10.85 (Source: SPSS Output, Primary data)
As the p-value is less than 0.05, so we reject null hypothesis and conclude that
Documentation of HR practice is associated with the presence of an internal HR
Expert. It can be seen from Table 8.45 and Figure 8.29 that of the 109 respondents who
have an internal HR person in their firm, 71 respondents (65%) have HR Policies in their
firm in the form of Employee Handbook, Rule-book or HR Manual. However, it is also to
be noted that about 35% firms do not have any kind of documented HR related policies or
rules, even with the presence of an internal HR expert in the firm. This calls in for the
21.028.0
11 1111
32
63
38
0
10
20
30
40
50
60
70
No Internal HR expert Presence of Internal HR expert
Coun
t of R
espo
nden
ts
HR Practice Documentation - Internal HR SpecialistEMP HANDBOOK RULE BOOK NOTHING LIKE

Quantitative Data Analysis and Interpretation
©Ranjita Banerjee 139
scope of improvement to enhance the documentation of HR policies, rules and
regulations in written form.
8.7.5. Cross-Tabulation: Person Who Handles HR Functions and Size of Firm
Cross-tabulation was done between ‘Person who handles HR functions’ and ‘Size of
firm’. This cross-tabulation was done to see if the presence of an internal HR expert in an
SME firm has an association with the Size of firm viz. Small and Medium (See Table
8.47 and Figure 8.30).
The null and alternate hypothesis is framed herewith as:
H05: Presence of an internal HR Expert is not associated with the size of firm.
Ha5: Presence of an internal HR Expert is associated with the size of firm.
TABLE 8.47 - Cross-Tabulation: Person Who Handles HR Functions and Size of Firm
Person who handles HR Functions Size of the Firm
SMALL MEDIUM TOTAL
No Internal HR expert
Count 84 22 106 Expected Count 70.5 35.5 106 % within person who handles HR functions 79.2% 20.8% 100.0% % within Size of the Firm 58.7% 30.6% 49.3%
Presence of Internal HR expert
Count 59 50 109 Expected Count 72.5 36.5 109 % within person who handles HR functions 54.1% 45.9% 100.0% % within Size of the Firm 41.3% 69.4% 50.7%
Total
Count 143 72 215 Expected Count 143 72 215 % within person who handles HR functions 66.5% 33.5% 100.0% % within Size of the Firm 100.0% 100.0% 100.0%
(Source: SPSS Output, Primary data)

Quantitative Data Analysis and Interpretation
©Ranjita Banerjee 140
Figure 8.30 - Person Who Handles HR Functions and Size of Firm
It can be seen from Table 8.47 and Figure 8.30 that of the 109 respondents who have
confirmed about the presence of an Internal HR person in their firm, who have an internal
HR expert, about 59 respondents (54%) are from Small Enterprises and rest 46% are
from Medium Enterprises.
TABLE 8.48-Chi-Square Test: Person Who Handles HR Functions and Size of Firm
Value Df Asymp. Sig.
(2-sided) Exact Sig. (2-
sided) Exact Sig. (1-
sided)
Pearson Chi-Square 15.221a 1 .000
Continuity Correctionb 14.114 1 .000
Likelihood Ratio 15.533 1 .000
Fisher's Exact Test .000 .000
Linear-by-Linear Association
15.150 1 .000
N of Valid Cases 215
a. 0 cells (.0%) have expected count less than 5. The minimum expected count is 35.50. b. Computed only for a 2x2 table As the p-value is less than 0.05 (See Table 8.48), so we reject null hypothesis and
conclude that presence of an internal HR Expert is associated with the size of firm.
84.0
59.0
22
50
0
20
40
60
80
100
No Internal HR expert Presence of Internal HR expert
Coun
t of R
espo
nden
ts
Dedicated HR Expert across size of FirmsSize-Small Medium
Quantitative Data Analysis and Interpretation
©Ranjita Banerjee 141
Section II: Inferential Statistics – Non Parametric Tests
8.8. Mann-Whitney Test
The Mann-Whitney U Test is used for two samples when data is not normally distributed.
It is used for ordinal scores. It is an alternative to the independent t-test which is used
when the data is ordinal and non-parametric. It is appropriate for analyzing the data from
an independent measures design with two conditions. This test works on ranking the data
rather than testing the actual scores (values), and scoring each rank subsequently, ranking
‘1’ with the lowest score.
The logic behind the Mann-Whitney test is to rank the data for each condition, and then
see how different the two rank totals are. If there is a systematic difference between the
two conditions, then most of the high ranks will belong to one condition and most of the
low ranks will belong to the other one. As a result, the rank totals will be quite different
(Graham Hole Research skills; https://statistics.laerd.com/spss-tutorials/mann-whitney-u-
test-using-spss-statistics.php).
8.8.1. Mann-Whitney Test for Gender of Respondent and HR Practices
Mann-Whitney Test was done to see if there is any effect of gender of respondents on the
HR Practices practiced in the SME firms.
The null and alternate hypothesis is framed as under:
H06: There is no significant influence of Gender on HR Practices.
Ha6: There is significant influence of Gender on HR Practices.

Quantitative Data Analysis and Interpretation
©Ranjita Banerjee 142
TABLE 8.49 - Ranks- Mann-Whitney Test for Gender of Respondent and HR Practices
HR PracticesGender of the Respondent N Mean Rank
Sum of Ranks
MALE 196 107.34 21038.5FEMALE 19 114.82 2181.5
Total 215MALE 196 108.39 21244
FEMALE 19 104 1976Total 215
MALE 196 107.59 21088.5FEMALE 19 112.18 2131.5
Total 215MALE 196 107.83 21135.5
FEMALE 19 109.71 2084.5Total 215
MALE 196 107.32 21035.5FEMALE 19 114.97 2184.5
Total 215MALE 196 106.42 20857.5
FEMALE 19 124.34 2362.5Total 215
MALE 196 104.61 20504.5FEMALE 19 142.92 2715.5
Total 215MALE 196 105.84 20744.5
FEMALE 19 130.29 2475.5Total 215
MALE 196 106.08 20791.5FEMALE 19 127.82 2428.5
Total 215MALE 196 108.71 21307.5
FEMALE 19 100.66 1912.5Total 215
MALE 196 107.87 21142.5FEMALE 19 109.34 2077.5
Total 215MALE 196 106.71 20915.5
FEMALE 19 121.29 2304.5Total 215
MALE 196 106.85 20942FEMALE 19 119.89 2278
Total 215MALE 196 108.59 21283.5
FEMALE 19 101.92 1936.5Total 215
Employees receive feedback
Our organization places the right person in the right job
Selection is on the basis of merit
Organizes training and skill development programs
Employees are rotated from one job to another
Appraises the performance of employees at regular intervals.
Employees are given opportunity to suggest improvement
Employees can openly communicate with the superiors
Enough opportunity for career growth
Compensation is decided on the basis of competence or ability
Good performers are given financial incentives
Good performers are given non-financial incentives.
Good performers are given more authority and responsibility.
Employees participate in the decision-making process.
(S((Source: SPSS output; Primary data)

Quantitative Data Analysis and Interpretation
©Ranjita Banerjee 143
TABLE 8.50 (a, b, c & d) - Test Statistics a: Mann-Whitney Test for Gender of Respondent and HR Practices
Our organization
places the right person in the
right job
Selection is on the basis of
merit
Organizes training and
skill development
programs
Employees are rotated from one job to another
Mann-Whitney U 1732.5 1786 1782.5 1829.5 Wilcoxon W 21038.5 1976 21088.5 21135.5 Z -0.622 -0.359 -0.33 -0.136 Asymp. Sig. (2-tailed) 0.534 0.72 0.742 0.892
Test Statisticsb
Appraises the performance of employees at
regular intervals.
Employees receive
feedback
Enough opportunity for career growth
Compensation is decided on the basis of
competence or ability
Mann-Whitney U 1729.5 1551.5 1198.5 1438.5 Wilcoxon W 21035.5 20857.5 20504.5 20744.5 Z -0.623 -1.474 -2.764 -2.039 Asymp. Sig. (2-tailed) 0.533 0.141 0.006 0.041
Good performers are given financial
incentives
Good performers
are given non-financial
incentives.
Good performers are given
more authority and responsibility.
Employees participate in the decision-making
process.
Mann-Whitney U 1485.5 1722.5 1836.5 1609.5 Wilcoxon W 20791.5 1912.5 21142.5 20915.5 Z -1.545 -0.557 -0.111 -1.037 Asymp. Sig. (2-tailed) 0.122 0.577 0.911 0.3
Test Statisticsc
Employees are given
opportunity to suggest improvement
Employees can openly communicate with the superiors
Mann-Whitney U 1636 1746.5 Wilcoxon W 20942 1936.5 Z -1.065 -0.549
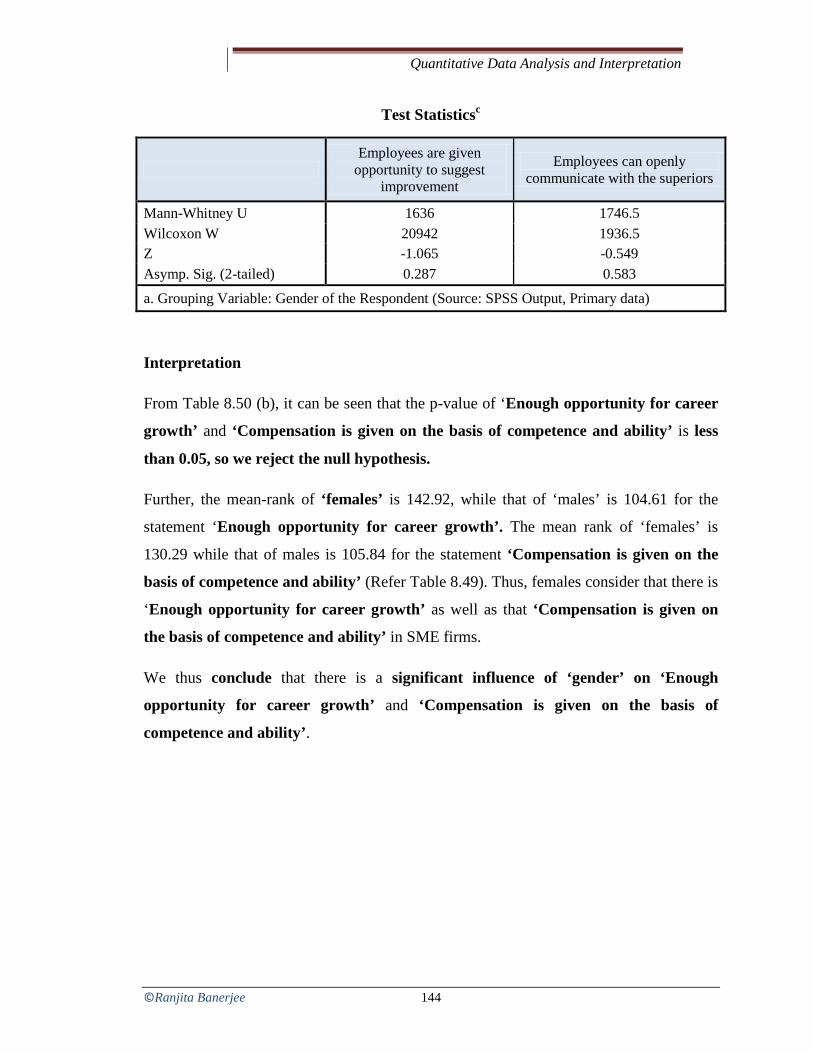
Quantitative Data Analysis and Interpretation
©Ranjita Banerjee 144
Test Statisticsc
Employees are given
opportunity to suggest improvement
Employees can openly communicate with the superiors
Mann-Whitney U 1636 1746.5 Wilcoxon W 20942 1936.5 Z -1.065 -0.549 Asymp. Sig. (2-tailed) 0.287 0.583
a. Grouping Variable: Gender of the Respondent (Source: SPSS Output, Primary data)
Interpretation
From Table 8.50 (b), it can be seen that the p-value of ‘Enough opportunity for career
growth’ and ‘Compensation is given on the basis of competence and ability’ is less
than 0.05, so we reject the null hypothesis.
Further, the mean-rank of ‘females’ is 142.92, while that of ‘males’ is 104.61 for the
statement ‘Enough opportunity for career growth’. The mean rank of ‘females’ is
130.29 while that of males is 105.84 for the statement ‘Compensation is given on the
basis of competence and ability’ (Refer Table 8.49). Thus, females consider that there is
‘Enough opportunity for career growth’ as well as that ‘Compensation is given on
the basis of competence and ability’ in SME firms.
We thus conclude that there is a significant influence of ‘gender’ on ‘Enough
opportunity for career growth’ and ‘Compensation is given on the basis of
competence and ability’.

Quantitative Data Analysis and Interpretation
©Ranjita Banerjee 145
8.8.2. Mann-Whitney Test for Quality/ ISO Certification and HR Practices
Mann-Whitney Test was done to see if there is any influence of Quality/ ISO
Certification on the HR Practices practiced in the SME firms.
The null and alternate hypothesis is framed as under:
H07: There is no significant influence of Quality/ ISO Certification on HR Practices.
Ha7: There is significant influence of Quality/ ISO Certification on HR Practices.
TABLE 8.51 - Mean-Ranks: Mann-Whitney Test for Quality/ ISO Certification and HR Practices
HR Practices Quality or
ISO Certification
N Mean Rank Sum of Ranks
Our organization places the right person in the right job
YES 133 117 15560.5 NO 82 93.41 7659.5
Total 215
Selection is on the basis of merit YES 133 113.66 15117 NO 82 98.82 8103
Total 215
Organizes training and skill development programs
YES 133 118.82 15802.5 NO 82 90.46 7417.5
Total 215
Employees are rotated from one job to another
YES 133 112.35 14942 NO 82 100.95 8278
Total 215
Appraises the performance of employees at regular intervals.
YES 133 115.96 15423 NO 82 95.09 7797
Total 215
Employees receive feedback YES 133 111.99 14895 NO 82 101.52 8325
Total 215
Enough opportunity for career growth
YES 133 110.33 14673.5 NO 82 104.23 8546.5
Total 215 Compensation is decided on the YES 133 109.35 14544

Quantitative Data Analysis and Interpretation
©Ranjita Banerjee 146
HR Practices Quality or
ISO Certification
N Mean Rank Sum of Ranks
basis of competence or ability NO 82 105.8 8676
Good performers are given financial incentives
YES 133 113.1 15042 NO 82 99.73 8178
Total 215
Good performers are given non-financial incentives.
YES 133 107.1 14244 NO 82 109.46 8976
Total 215
Good performers are given more authority and responsibility.
YES 133 115.5 15361 NO 82 95.84 7859
Total 215
Employees participate in the decision-making process.
YES 133 107.92 14354 NO 82 108.12 8866
Total 215
Employees are given opportunity to suggest improvement
YES 133 115.2 15322 NO 82 96.32 7898
Total 215
Employees can openly communicate with the superiors
YES 133 115.05 15301 NO 82 96.57 7919
Total 215
(Source: SPSS Output, Primary data)

Quantitative Data Analysis and Interpretation
©Ranjita Banerjee 147
TABLE 8.52 - Test Statisticsa for Quality/ ISO Certification and HR Practices
HR Practice Mann-
Whitney U
Wilcoxon W Z Asymp. Sig.
(2-tailed)
Our organization places the right person in the right job 4256.5 7659.5 -3.359 0.001
Selection is on the basis of merit 4700 8103 -2.077 0.038 Organizes training and skill development programs 4014.5 7417.5 -3.486 0
Employees are rotated from one job to another 4875 8278 -1.412 0.158
Appraises the performance of employees at regular intervals. 4394 7797 -2.91 0.004
Employees receive feedback 4922 8325 -1.473 0.141 Enough opportunity for career growth 5143.5 8546.5 -0.754 0.451 Compensation is decided on the basis of competence or ability 5273 8676 -0.506 0.613
Good performers are given financial incentives 4775 8178 -1.626 0.104
Good performers are given non-financial incentives. 5333 14244 -0.28 0.779
Good performers are given more authority and responsibility. 4456 7859 -2.545 0.011
Employees participate in the decision-making process. 5443 14354 -0.024 0.981
Employees are given opportunity to suggest improvement 4495 7898 -2.637 0.008
Employees can openly communicate with the superiors 4516 7919 -2.602 0.009
Source: Grouping Variable: Quality or ISO Certification; SPSS Output; Primary data
Interpretation
From Table 8.52, it can be seen that the p-value of the following HR Practices is less
than 0.05:
• Our organization places the right person in the right job
• Selection is on the basis of merit

Quantitative Data Analysis and Interpretation
©Ranjita Banerjee 148
• Organizes training and skill development programs
• Appraises the performance of employees at regular intervals
• Good performers are given more authority and responsibility
• Employees are given opportunity to suggest improvement
• Employees can openly communicate with the superiors
Further, from Table 8.51 it can be seen that the mean-rank of firms with Quality / ISO
Certification is high and is 117, 113.66, 118.82, 115.96, 115.5, 115.2 and 115.05
respectively, for the above statements; while that of firms without the Certification is
93.41, 98.82, 90.46, 95.09, 95.84, 96.32 and 96.57 respectively. So the firms possessing a
Quality/ ISO Certification have an influence especially for the HR practices mentioned
above.
As the p-value of the above statements on HR Practices is less than 0.05, so we reject
the null hypothesis and conclude that there is a significant influence of Quality/ ISO
Certification on the following HR Practices: Recruitment, Selection, Training &
Skill Development, Performance Appraisal, Employee Involvement and Open-
Communication.
8.8.3. Mann-Whitney Test for Quality/ ISO Certification and Organizational Outcomes
Mann-Whitney Test was done to see if there is any influence of Quality/ ISO
Certification on the Organizational Outcomes in the SME firms.
The null and alternate hypothesis is framed as under:
H08: There is no significant influence of Quality/ ISO Certification on
Organizational Outcomes.
Ha8: There is significant influence of Quality/ ISO Certification on Organizational
Outcomes.

Quantitative Data Analysis and Interpretation
©Ranjita Banerjee 149
TABLE 8.53 - Mean-Ranks: Mann-Whitney Test for Quality/ ISO Certification and Organizational Outcomes
Organizational Outcomes Quality or ISO Certification N Mean
Rank Sum of Ranks
Customer satisfaction has increased YES 133 118.26 15728 NO 82 91.37 7492
Total 215
Our suppliers/ vendors are satisfied with us.
YES 133 117.06 15569 NO 82 93.3 7651
Total 215
Measures have been taken by the firm for product/ service development
YES 133 117.59 15640 NO 82 92.44 7580
Total 215
Products/service Quality shows improvement
YES 133 118.42 15749.5 NO 82 91.1 7470.5
Total 215
The firm has displayed proper utilization of resources.
YES 133 115.61 15375.5 NO 82 95.66 7844.5
Total 215
Average Number of defects of products / deficiencies in service shows a decrease
YES 133 119.07 15836 NO 82 90.05 7384
Total 215
There is an increase in the Net Profit Margin.
YES 133 121.61 16173.5 NO 82 85.93 7046.5
Total 215
Return on Investment (in %) has increased
YES 133 116.76 15528.5 NO 82 93.8 7691.5
Total 215
(Source: SPSS Output; Primary data)

Quantitative Data Analysis and Interpretation
©Ranjita Banerjee 150
TABLE 8.54 - Test Statistics a: Mann-Whitney Test for Quality/ ISO Certification and Organizational Outcomes
Organizational Outcomes Mann-Whitney U
Wilcoxon W Z Asymp. Sig. (2-
tailed)
Customer satisfaction has increased 4089 7492 -3.439 0.001
Our suppliers/ vendors are satisfied with us. 4248 7651 -3.007 0.003
Measures have been taken by the firm for product/ service development
4177 7580 -3.163 0.002
Products/service Quality shows improvement 4067.5 7470.5 -3.463 0.001
The firm has displayed proper utilization of resources. 4441.5 7844.5 -2.518 0.012
Average Number of defects of products / deficiencies in service shows a decrease
3981 7384 -3.64 0
There is an increase in the Net Profit Margin. 3643.5 7046.5 -4.418 0
Return on Investment (in %) has increased 4288.5 7691.5 -2.836 0.005
(Source: SPSS Output, Primary data)
Interpretation
From Table 8.54, it can be seen that the p-value of the following statements on
Organizational Outcomes is less than 0.05:
• Customer satisfaction has increased
• Our suppliers/ vendors are satisfied with us
• Measures have been taken by the firm for product/ service development
• Products/service Quality shows improvement
• The firm has displayed proper utilization of resources.
• Average Number of defects of products / deficiencies in service shows a decrease
• There is an increase in the Net Profit Margin
• Return on Investment (in %) has increased over the last two years

Quantitative Data Analysis and Interpretation
©Ranjita Banerjee 151
Table 8.53 shows that the mean-rank of firms with Quality / ISO Certification is high and
is 118.26, 117.06, 117.59, 118.42, 115.61, 119.07, 121.61 and 116.76 respectively; while
that of firms without the Certification is 91.37, 93.3, 92.44, 91.1, 95.66, 90.05, 85.93 and
93.80 respectively, for the statements on ‘Organizational outcomes’. So the firms
possessing a Quality/ ISO Certification have an influence on all the above mentioned
statements of Organizational outcomes (Refer Table 8.53).
As the p-value of the above statements on Organizational Outcomes is less than 0.05, so
we reject the null hypothesis and conclude that there is a significant influence of
Quality/ ISO Certification on the following Organizational Outcomes: Customer
Satisfaction, Supplier Satisfaction, Product/ Service development, Quality,
Optimum utilization of resources, Defects or deficiencies in Product or Service, Net
Profit Margin, Return on Investment.
8.8.4. Mann-Whitney Test for Presence of an Internal HR Person on HR Practices
Mann-Whitney Test was done to see if there is any influence of presence of an internal
HR person on the HR Practices in the SME firms.
The null and alternate hypothesis is framed as under:
H0: There is no significant influence of Presence of an Internal HR Person on HR
Practices.
H9: There is significant influence of Presence of an Internal HR Person on HR
Practices.

Quantitative Data Analysis and Interpretation
©Ranjita Banerjee 152
TABLE 8.55 -Mean-Ranks: Mann-Whitney Test for Presence of an Internal HR Person on HR Practices
HR Practices The person who handles HR functions N Mean Rank
Sum of Ranks
Our organization places the right person in the right job
No Internal HR expert 106 102.71 10887 Presence of Internal HR expert 109 113.15 12333 Total 215
Selection is on the basis of merit
No Internal HR expert 106 96.9 10271.5 Presence of Internal HR expert 109 118.79 12948.5 Total 215
Organizes training and skill development programs
No Internal HR expert 106 92.37 9791 Presence of Internal HR expert 109 123.2 13429 Total 215
Employees are rotated from one job to another
No Internal HR expert 106 101.24 10731.5 Presence of Internal HR expert 109 114.57 12488.5 Total 215
Appraises the performance of employees at regular intervals.
No Internal HR expert 106 101.33 10741.5 Presence of Internal HR expert 109 114.48 12478.5 Total 215
Employees receive feedback
No Internal HR expert 106 98.02 10390 Presence of Internal HR expert 109 117.71 12830 Total 215
Enough opportunity for career growth
No Internal HR expert 106 93.43 9903.5 Presence of Internal HR expert 109 122.17 13316.5 Total 215
Compensation is decided on the basis of competence or ability
No Internal HR expert 106 96.43 10221.5 Presence of Internal HR expert 109 119.25 12998.5 Total 215
Good performers are given financial incentives
No Internal HR expert 106 98.64 10456 Presence of Internal HR expert 109 117.1 12764 Total 215
Good performers are given non-financial incentives.
No Internal HR expert 106 118.05 12513.5 Presence of Internal HR expert 109 98.22 10706.5 Total 215
Good performers are given more authority and responsibility.
No Internal HR expert 106 100.07 10607 Presence of Internal HR expert 109 115.72 12613 Total 215

Quantitative Data Analysis and Interpretation
©Ranjita Banerjee 153
HR Practices The person who handles HR functions N Mean Rank
Sum of Ranks
Employees participate in the decision-making process.
No Internal HR expert 106 103.87 11010.5
Presence of Internal HR expert 109 112.01 12209.5
Employees are given opportunity to suggest improvement
No Internal HR expert 106 102.87 10904.5
Presence of Internal HR expert 109 112.99 12315.5
Employees can openly communicate with the superiors
No Internal HR expert 106 102.52 10867.5 Presence of Internal HR expert 109 113.33 12352.5 Total 215
(Source: SPSS Output; Primary data)
TABLE 8.56 - Test Statistics a : Mann-Whitney Test for Presence of an Internal HR Person on HR Practices
HR Practices Mann-
Whitney U
Wilcoxon W Z Asymp. Sig.
(2-tailed)
Our organization places the right person in the right job 5216 10887 -1.53 0.126
Selection is on the basis of merit 4600.5 10271.5 -3.153 0.002 Organizes training and skill development programs 4120 9791 -3.901 0
Employees are rotated from one job to another 5060.5 10731.5 -1.7 0.089
Appraises the performance of employees at regular intervals. 5070.5 10741.5 -1.886 0.059
Employees receive feedback 4719 10390 -2.851 0.004 Enough opportunity for career growth 4232.5 9903.5 -3.653 0 Compensation is decided on the basis of competence or ability 4550.5 10221.5 -3.353 0.001
Good performers are given financial incentives 4785 10456 -2.311 0.021
Good performers are given non-financial incentives. 4711.5 10706.5 -2.416 0.016
Good performers are given more authority and responsibility. 4936 10607 -2.086 0.037
Employees participate in the decision-making process. 5339.5 11010.5 -1.02 0.308
Employees are given opportunity to suggest improvement 5233.5 10904.5 -1.453 0.146
Employees can openly communicate with the superiors 5196.5 10867.5 -1.566 0.117

Quantitative Data Analysis and Interpretation
©Ranjita Banerjee 154
Interpretation
Table 8.56 shows that the p-value of the following statements on HR Practices is less
than 0.05:
• Selection is on the basis of merit
• Organizes training and skill development programs
• Employees receive feedback
• Enough opportunity for career growth
• Compensation is decided on the basis of competence or ability
• Good performers are given financial incentives
• Good performers are given non-financial incentives
• Good performers are given more authority and responsibility
Further, Table 8.55 shows that the mean-rank of firms with Presence of an Internal
HR person is 118.79, 123.20, 114.57, 122.17, 119.25, 117.1, 98.22 and 115.72
respectively, for the above statements, while that of firms without the presence of an
internal HR person is 96.9, 92.37, 101.24, 93.43, 96.43, 98.64, 118.05and 100.07,
respectively. So the firms having an internal HR person have an influence especially
for the HR Practices mentioned above, except for the statement ‘Good performers are
given financial incentives’.
As the p-value of the above statements on HR Practices is less than 0.05, so we
reject the null hypothesis and conclude that there is a significant influence of
presence of an internal HR person on the following HR Practices: Selection,
Training & Skill Development, Feedback mechanism, career-growth,
Compensation, non-financial incentives and Authority & responsibility
(Delegation of power).

Quantitative Data Analysis and Interpretation
©Ranjita Banerjee 155
8.8.5. Mann-Whitney Test for Presence of an Internal HR Person and Employee Outcomes
Mann-Whitney Test was done to see if there is any influence of presence of an internal
HR person and Employee Outcomes in the SME firms.
The null and alternate hypothesis is framed as under:
H010: There is no significant influence of Presence of an Internal HR Person and
Employee Outcomes.
Ha10: There is significant influence of Presence of an Internal HR Person and
Employee Outcomes.
TABLE 8.57 -Mean-Ranks: Mann-Whitney Test for Presence of an Internal HR Person and Employee Outcomes
Employee Outcomes
The person who handles HR functions N Mean
Rank Sum of Ranks
Competence of an Employee
No Internal HR expert 106 106.12 11249 Presence of Internal HR expert 109 109.83 11971 Total 215
Employee’s co-operation with is satisfactory.
No Internal HR expert 106 101.54 10763.5 Presence of Internal HR expert 109 114.28 12456.5 Total 215
Employees co-operate among themselves
No Internal HR expert 106 105.97 11232.5 Presence of Internal HR expert 109 109.98 11987.5 Total 215
Employee’s general behavior is good
No Internal HR expert 106 106.93 11334.5 Presence of Internal HR expert 109 109.04 11885.5 Total 215
Employees are committed
No Internal HR expert 106 103.21 10940 Presence of Internal HR expert 109 112.66 12280 Total 215
Employees are punctual and report daily
No Internal HR expert 106 111.49 11817.5 Presence of Internal HR expert 109 104.61 11402.5 Total 215
Employees are regular
No Internal HR expert 106 107.72 11418 Presence of Internal HR expert 109 108.28 11802

Quantitative Data Analysis and Interpretation
©Ranjita Banerjee 156
Employee Outcomes
The person who handles HR functions N Mean
Rank Sum of Ranks
Total 215
Employees take up extra duties and responsibilities
No Internal HR expert 106 99 10494.5 Presence of Internal HR expert 109 116.75 12725.5 Total 215
Employee’s follow general code of conduct and rules
No Internal HR expert 106 100.2 10621.5 Presence of Internal HR expert 109 115.58 12598.5 Total 215
(Source: SPSS Output; Primary data)
TABLE 8.58 - Test Statisticsa: Mann-Whitney Test for Presence of an Internal HR Person and Employee Outcomes
Employee Outcomes Mann-Whitney U
Wilcoxon W Z
Asymp. Sig. (2-tailed)
Competence of an Employee 5578 11249 -0.55 0.582 Employee’s co-operation with is satisfactory. 5092.5 10763.5 -1.809 0.07
Employees co-operate among themselves 5561.5 11232.5 -0.527 0.599
Employee’s general behavior is good 5663.5 11334.5 -0.282 0.778 Employees are committed 5269 10940 -1.206 0.228 Employees are punctual and report daily 5407.5 11402.5 -0.865 0.387 Employees are regular 5747 11418 -0.072 0.943 Employees take up extra duties and responsibilities 4823.5 10494.5 -2.276 0.023
Employee’s follow general code of conduct and rules 4950.5 10621.5 -2.015 0.044
Grouping Variable: The person who handles HR functions (Source: SPSS Output; Primary data)
Interpretation
It can be deduced from Table 8.58, that the p-value of the following statements on HR
Practices is less than 0.05:

Quantitative Data Analysis and Interpretation
©Ranjita Banerjee 157
• Employees take up extra duties and responsibilities when need arises (sense of
involvement).
• Employee’s follow general code of conduct and rules.
Table 8.57 shows that the mean-rank of firms with Presence of an Internal HR person is
116.75 and 115.58 respectively, for the above two statements; while that of firms without
the presence of an internal HR person is 99 and 100.20 respectively. So the firms having
an internal HR person have an influence especially for the above two Employee
Outcomes.
As the p-value of the above statements on Employee Outcomes is less than 0.05, so we
reject the null hypothesis and conclude that there is a significant influence of
presence of an internal HR person on the Employee Outcomes related to taking
extra duties and responsibilities (employee involvement) and adherence to code of
conduct and rules.
8.8.6. Mann-Whitney Test for Presence of an Internal HR Person and Organizational Outcomes
Mann-Whitney Test was done to see if there is any influence of presence of an internal
HR person and Employee Outcomes in the SME firms (Tabl8e: 8.59) .
The null and alternate hypothesis is framed as under:
H011: There is no significant influence of Presence of an Internal HR Person and
Organizational Outcomes.
Ha11: There is significant influence of Presence of an Internal HR Person and
Organizational Outcomes.

Quantitative Data Analysis and Interpretation
©Ranjita Banerjee 158
TABLE 8.59 - Mean-Ranks: Mann-Whitney Test for Presence of an Internal HR Person and Organizational Outcomes
Organizational Outcomes The person who handles HR functions N Mean
Rank Sum of Ranks
Customer satisfaction has increased
No Internal HR expert 106 100.63 10666.5 Presence of Internal HR expert 109 115.17 12553.5 Total 215
Our suppliers/ vendors are satisfied with us.
No Internal HR expert 106 102 10811.5 Presence of Internal HR expert 109 113.84 12408.5 Total 215
Measures have been taken by the firm for product/ service development
No Internal HR expert 106 94.86 10055.5 Presence of Internal HR expert 109 120.78 13164.5 Total 215
Products/service Quality shows improvement
No Internal HR expert 106 96.08 10184.5 Presence of Internal HR expert 109 119.59 13035.5 Total 215
The firm has displayed proper utilization of resources.
No Internal HR expert 106 95.89 10164 Presence of Internal HR expert 109 119.78 13056 Total 215
Average Number of defects of products / deficiencies in service shows a decrease
No Internal HR expert 106 99.68 10566.5 Presence of Internal HR expert 109 116.09 12653.5 Total 215
There is an increase in the Net Profit Margin.
No Internal HR expert 106 97.28 10312 Presence of Internal HR expert 109 118.42 12908 Total 215
Return on Investment (in %) has increased
No Internal HR expert 106 93.46 9907 Presence of Internal HR expert 109 122.14 13313 Total 215
(Source: SPSS Output; Primary data)
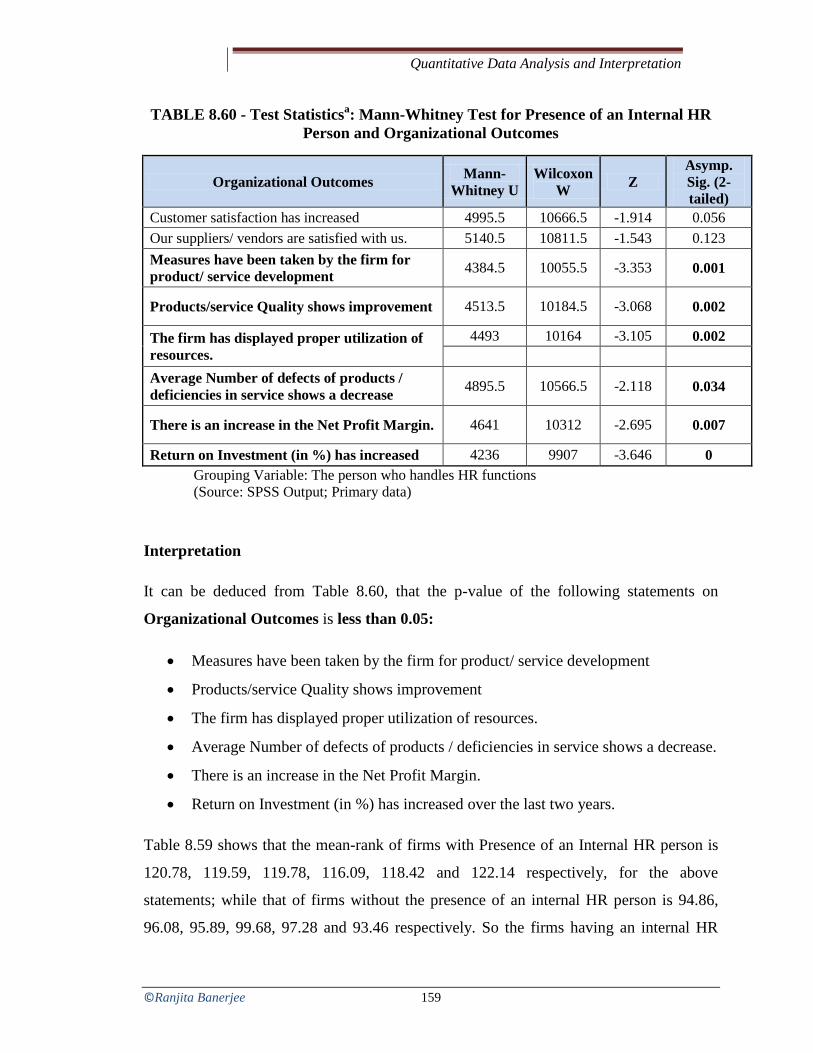
Quantitative Data Analysis and Interpretation
©Ranjita Banerjee 159
TABLE 8.60 - Test Statisticsa: Mann-Whitney Test for Presence of an Internal HR Person and Organizational Outcomes
Organizational Outcomes Mann-Whitney U
Wilcoxon W Z
Asymp. Sig. (2-tailed)
Customer satisfaction has increased 4995.5 10666.5 -1.914 0.056 Our suppliers/ vendors are satisfied with us. 5140.5 10811.5 -1.543 0.123 Measures have been taken by the firm for product/ service development 4384.5 10055.5 -3.353 0.001
Products/service Quality shows improvement 4513.5 10184.5 -3.068 0.002
The firm has displayed proper utilization of resources.
4493 10164 -3.105 0.002
Average Number of defects of products / deficiencies in service shows a decrease 4895.5 10566.5 -2.118 0.034
There is an increase in the Net Profit Margin. 4641 10312 -2.695 0.007
Return on Investment (in %) has increased 4236 9907 -3.646 0 Grouping Variable: The person who handles HR functions (Source: SPSS Output; Primary data)
Interpretation
It can be deduced from Table 8.60, that the p-value of the following statements on
Organizational Outcomes is less than 0.05:
• Measures have been taken by the firm for product/ service development
• Products/service Quality shows improvement
• The firm has displayed proper utilization of resources.
• Average Number of defects of products / deficiencies in service shows a decrease.
• There is an increase in the Net Profit Margin.
• Return on Investment (in %) has increased over the last two years.
Table 8.59 shows that the mean-rank of firms with Presence of an Internal HR person is
120.78, 119.59, 119.78, 116.09, 118.42 and 122.14 respectively, for the above
statements; while that of firms without the presence of an internal HR person is 94.86,
96.08, 95.89, 99.68, 97.28 and 93.46 respectively. So the firms having an internal HR
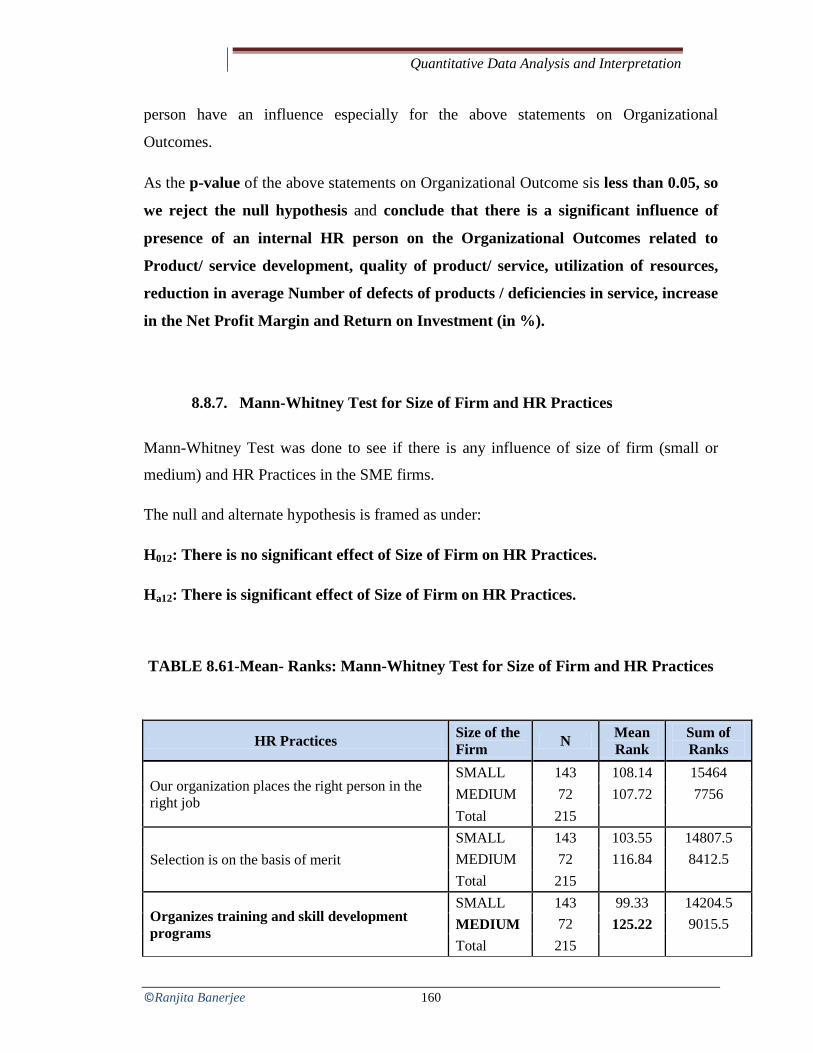
Quantitative Data Analysis and Interpretation
©Ranjita Banerjee 160
person have an influence especially for the above statements on Organizational
Outcomes.
As the p-value of the above statements on Organizational Outcome sis less than 0.05, so
we reject the null hypothesis and conclude that there is a significant influence of
presence of an internal HR person on the Organizational Outcomes related to
Product/ service development, quality of product/ service, utilization of resources,
reduction in average Number of defects of products / deficiencies in service, increase
in the Net Profit Margin and Return on Investment (in %).
8.8.7. Mann-Whitney Test for Size of Firm and HR Practices
Mann-Whitney Test was done to see if there is any influence of size of firm (small or
medium) and HR Practices in the SME firms.
The null and alternate hypothesis is framed as under:
H012: There is no significant effect of Size of Firm on HR Practices.
Ha12: There is significant effect of Size of Firm on HR Practices.
TABLE 8.61-Mean- Ranks: Mann-Whitney Test for Size of Firm and HR Practices
HR Practices Size of the Firm N Mean
Rank Sum of Ranks
Our organization places the right person in the right job
SMALL 143 108.14 15464 MEDIUM 72 107.72 7756 Total 215
Selection is on the basis of merit SMALL 143 103.55 14807.5 MEDIUM 72 116.84 8412.5 Total 215
Organizes training and skill development programs
SMALL 143 99.33 14204.5 MEDIUM 72 125.22 9015.5 Total 215

Quantitative Data Analysis and Interpretation
©Ranjita Banerjee 161
HR Practices Size of the Firm N Mean
Rank Sum of Ranks
Employees are rotated from one job to another
SMALL 143 101.66 14537 MEDIUM 72 120.6 8683
Appraises the performance of employees at regular intervals.
SMALL 143 106.62 15246 MEDIUM 72 110.75 7974 Total 215
Employees receive feedback SMALL 143 103.22 14760 MEDIUM 72 117.5 8460 Total 215
Enough opportunity for career growth SMALL 143 107.34 15349.5 MEDIUM 72 109.31 7870.5 Total 215
Compensation is decided on the basis of competence or ability
SMALL 143 109.9 15716 MEDIUM 72 104.22 7504 Total 215
Good performers are given financial incentives SMALL 143 107.25 15337 MEDIUM 72 109.49 7883 Total 215
Good performers are given non-financial incentives.
SMALL 143 113.47 16226 MEDIUM 72 97.14 6994 Total 215
Good performers are given more authority and responsibility.
SMALL 143 106.92 15290 MEDIUM 72 110.14 7930 Total 215
Employees participate in the decision-making process.
SMALL 143 106.97 15296.5 MEDIUM 72 110.05 7923.5 Total 215
Employees are given opportunity to suggest improvement
SMALL 143 106.44 15220.5 MEDIUM 72 111.1 7999.5 Total 215
Employees can openly communicate with the superiors
SMALL 143 111.66 15967 MEDIUM 72 100.74 7253 Total 215
(Source: SPSS Output; Primary data)

Quantitative Data Analysis and Interpretation
©Ranjita Banerjee 162
TABLE 8.62 -Test Statisticsa: Mann-Whitney Test for Size of Firm and HR Practices
HR Practices Mann-
Whitney U
Wilcoxon W Z
Asymp. Sig. (2-tailed)
Our organization places the right person in the right job 5128 7756 -0.058 0.954
Selection is on the basis of merit 4511.5 14807.5 -1.807 0.071 Organizes training and skill development programs 3908.5 14204.5 -3.091 0.002
Employees are rotated from one job to another 4241 14537 -2.28 0.023 Appraises the performance of employees at regular intervals. 4950 15246 -0.56 0.576
Employees receive feedback 4464 14760 -1.952 0.051 Enough opportunity for career growth 5053.5 15349.5 -0.237 0.813 Compensation is decided on the basis of competence or ability 4876 7504 -0.788 0.431
Good performers are given financial incentives 5041 15337 -0.264 0.792 Good performers are given non-financial incentives. 4366 6994 -1.879 0.06
Good performers are given more authority and responsibility. 4994 15290 -0.405 0.686
Employees participate in the decision-making process. 5000.5 15296.5 -0.364 0.716
Employees are given opportunity to suggest improvement 4924.5 15220.5 -0.633 0.527
Employees can openly communicate with the superiors 4625 7253 -1.494 0.135
Grouping Variable: Size of the Firm (Source: SPSS Output; Primary data)
Interpretation
It can be deduced from Table 8.62, that the p-value of the following statements on HR
Practices is less than 0.05:
• Organizes training and skill development programs
• Employees are rotated from one job to another
Table 8.61 shows that the mean-rank of Medium-sized firms is 125.22 and 120.60
respectively, for the above statements; while that of small-sized firms is 99.33 and 101.66

Quantitative Data Analysis and Interpretation
©Ranjita Banerjee 163
respectively. So the size of the firm does have an effect on the HR practice of T&D and
job-rotation.
As the p-value of the above statements on HR Practices is less than 0.05, so we reject
the null hypothesis and conclude that size of firm has a significant effect on the HR
practices related to Training & Skill-development as well as job-rotation. In the
present survey, medium sized firms have shown to have a significant effect on the
HR practices related to T&D and job-rotation.
8.8.8. Mann-Whitney Test for Size of Firm and Employee Outcomes
Mann-Whitney Test was done to see if there is any influence of size of firm (small or
medium) on Employee Outcomes in the SME firms.
The null and alternate hypothesis is framed as under:
H013:The size of the firm does not significantly influence the Employee Outcomes.
Ha13: The size of the firm significantly influences the Employee Outcomes.
TABLE 8.63 - Mean-Ranks: Mann-Whitney Test for Size of Firm on Employee Outcomes
Employee Outcomes Size of the Firm N Mean Rank
Sum of Ranks
Competence of an Employee SMALL 143 102.69 14684 MEDIUM 72 118.56 8536 Total 215
Employee’s co-operation with Mgt. is satisfactory.
SMALL 143 100.55 14378.5 MEDIUM 72 122.8 8841.5 Total 215
Employees co-operate among themselves
SMALL 143 107.63 15391 MEDIUM 72 108.74 7829 Total 215
Employee’s general behavior is good SMALL 143 108.19 15470.5 MEDIUM 72 107.63 7749.5

Quantitative Data Analysis and Interpretation
©Ranjita Banerjee 164
Employee Outcomes Size of the Firm N Mean Rank
Sum of Ranks
Employees are committed SMALL 143 101.06 14452 MEDIUM 72 121.78 8768 Total 215
Employees are punctual and report daily
SMALL 143 100.68 14397.5 MEDIUM 72 122.53 8822.5 Total 215
Employees are regular SMALL 143 103.1 14743 MEDIUM 72 117.74 8477 Total 215
Employees take up extra duties and responsibilities
SMALL 143 97.64 13962.5 MEDIUM 72 128.58 9257.5 Total 215
Employee’s follow general code of conduct and rules
SMALL 143 101.32 14489 MEDIUM 72 121.26 8731 Total 215
(Source: SPSS Output; Primary data)
TABLE 8.64 - Test Statisticsa: Mann-Whitney Test for Size of Firm on Employee Outcomes
Employee Outcomes Mann-Whitney U
Wilcoxon W Z Asymp. Sig.
(2-tailed)
Competence of an Employee 4388 14684 -2.226 0.026 Employee’s co-operation with Mgt.is satisfactory. 4082.5 14378.5 -2.984 0.003
Employees co-operate among themselves 5095 15391 -0.137 0.891
Employee’s general behavior is good 5121.5 7749.5 -0.07 0.944
Employees are committed 4156 14452 -2.495 0.013 Employees are punctual and report daily 4101.5 14397.5 -2.597 0.009
Employees are regular 4447 14743 -1.78 0.075 Employees take up extra duties and responsibilities 3666.5 13962.5 -3.746 0
Employee’s follow general code of conduct and rules 4193 14489 -2.466 0.014
a. Grouping Variable: Size of the Firm (Source: SPSS Output; Primary data)

Quantitative Data Analysis and Interpretation
©Ranjita Banerjee 165
Interpretation
It can be deduced from Table 8.64 that the p-value of the following statements on
Employee Outcomes is less than 0.05:
• Competence of the employees to do their assigned work is satisfactory.
• Employee’s co-operation with Management/ Head is satisfactory.
• Employees are committed to complete their assigned task.
• Employees are punctual and report daily for work on time.
• Employees take up extra duties and responsibilities when need arises (sense of
involvement).
• Employee’s follow general code of conduct and rules.
Table 8.63 shows that the mean-rank of Medium-sized firms is high and is 118.56,
122.80, 121.78, 122.53, 128.58 and 121.26 respectively, for the above statements; while
that of small-sized firms is 102.69, 100.55, 101.06, 100.68, 97.64 and 101.32
respectively. So the size of the firm does have an effect on the Employee Outcomes
mentioned above.
As the p-value of the above statements on Employee Outcomes is less than 0.05, so we
reject the null hypothesis and conclude that size of firm has a significant influence on
the Employee Outcomes related to Employee Competence, Employee’s co-operation
with Management, Employee’s commitment to complete assigned tasks, Punctuality,
Sense of involvement as well as adherence to general code of conduct. In the present
survey, medium sized firms have shown to have a significant effect on the mentioned
Employee Outcomes.
8.8.9. Mann-Whitney Test for Size of Firm and Organizational Outcomes
Mann-Whitney Test was done to see if there is any influence of size of firm (small or
medium) on Organizational Outcomes in the SME firms.
The null and alternate hypothesis is framed as under:

Quantitative Data Analysis and Interpretation
©Ranjita Banerjee 166
H014: Size of firm does not significantly influence Organizational Outcomes.
Ha14: Size of firm has a significant influence on Organizational Outcomes.
TABLE 8.65 - Mean-Ranks: Mann-Whitney Test for Size of Firm and Organizational Outcomes
Organizational Outcomes Size of the Firm N Mean Rank Sum of Ranks
Customer satisfaction has increased
SMALL 143 101.62 14532 MEDIUM 72 120.67 8688
Total 215
Our suppliers/ vendors are satisfied with us.
SMALL 143 105.36 15066 MEDIUM 72 113.25 8154
Total 215
Measures have been taken by the firm for product/ service development
SMALL 143 104.22 14904 MEDIUM 72 115.5 8316
Total 215
Products/service Quality shows improvement
SMALL 143 104.69 14970 MEDIUM 72 114.58 8250
Total 215
The firm has displayed proper utilization of resources.
SMALL 143 104.49 14941.5 MEDIUM 72 114.98 8278.5
Total 215
Average Number of defects of products / deficiencies in service shows a decrease
SMALL 143 112.34 16064 MEDIUM 72 99.39 7156
Total 215
There is an increase in the Net Profit Margin.
SMALL 143 107.42 15361 MEDIUM 72 109.15 7859
Total 215
Return on Investment (in %) has increased
SMALL 143 104.47 14939.5 MEDIUM 72 115.01 8280.5
Total 215
(Source: SPSS Output; Primary data)

Quantitative Data Analysis and Interpretation
©Ranjita Banerjee 167
TABLE 8.66 -Test Statisticsa: Mann-Whitney Test for Size of Firm and Organizational Outcomes
Organizational Outcomes Mann-
Whitney U
Wilcoxon W Z
Asymp. Sig. (2-tailed)
Customer satisfaction has increased 4236 14532 -2.367 0.018 Our suppliers/ vendors are satisfied with us. 4770 15066 -0.971 0.332 Measures have been taken by the firm for product/ service development 4608 14904 -1.378 0.168
Products/service Quality shows improvement 4674 14970 -1.219 0.223 The firm has displayed proper utilization of resources. 4645.5 14941.5 -1.287 0.198
Average Number of defects of products / deficiencies in service shows a decrease 4528 7156 -1.578 0.115
There is an increase in the Net Profit Margin. 5065 15361 -0.209 0.835 Return on Investment (in %) has increased 4643.5 14939.5 -1.265 0.206
Grouping Variable: Size of the Firm (Source: SPSS Output; Primary data)
Interpretation
It can be seen from Table 2 that the p-value of the following statement on
Organizational Outcome is less than 0.05: ‘Customer satisfaction has increased
over the last two years’
Table 1 further shows that the mean-rank of Medium-sized firms is high and is 120.67
for the above statement; while that of small-sized firms is 101.62. So the size of the firm
does have an effect on the Organizational Outcome related to ‘Customer Satisfaction’.
As the p-value of the above statement on Organizational Outcomes is less than 0.05, so
we reject the null hypothesis and conclude that size of firm has a significant effect on
the Organizational Outcome related to Customer Satisfaction. In the present survey,
medium sized firms have shown to have a significant effect on the Customer
Satisfaction.

Quantitative Data Analysis and Interpretation
©Ranjita Banerjee 168
8.8.10. Mann-Whitney Test for Number of Women Employees and HR Practices in the SMEs
Mann-Whitney Test was done to see if there is any influence of number of women
employees in the SME firms.
The null and alternate hypothesis is framed as under:
H015: There is no significant effect of Number of Women Employees on HR
Practices in the SMEs.
Ha15: There is a significant effect ofNumber of Women Employees on HR Practices
in the SMEs
TABLE 8.67 - Mean-Ranks: Mann-Whitney Test for Number of Women Employees and HR Practices in the SMEs
HR Practices No. of women N Mean Rank
Sum of Ranks
Our organization places the right person in the right job
< 10 women employees 194 105.51 20469 > 10 women employees 21 131 2751 Total 215
Selection is on the basis of merit < 10 women employees 194 103.37 20054.5 > 10 women employees 21 150.74 3165.5 Total 215
Organizes training and skill development programs
< 10 women employees 194 106.36 20633.5 > 10 women employees 21 123.17 2586.5 Total 215
Employees are rotated from one job to another
< 10 women employees 194 108.54 21056 > 10 women employees 21 103.05 2164 Total 215
Appraises the performance of employees at regular intervals.
< 10 women employees 194 105.55 20476.5 > 10 women employees 21 130.64 2743.5 Total 215
Employees receive feedback < 10 women employees 194 107.73 20900 > 10 women employees 21 110.48 2320 Total 215
Enough opportunity for career growth
< 10 women employees 194 102.99 19980.5 > 10 women employees 21 154.26 3239.5
Total 215

Quantitative Data Analysis and Interpretation
©Ranjita Banerjee 169
HR Practices No. of women N Mean Rank
Sum of Ranks
Compensation is decided on the basis of competence or ability
< 10 women employees 194 105.45 20458 > 10 women employees 21 131.52 2762 Total 215
Good performers are given financial incentives
< 10 women employees 194 104.2 20215 > 10 women employees 21 143.1 3005 Total 215
Good performers are given non-financial incentives.
< 10 women employees 194 105.58 20482 > 10 women employees 21 130.38 2738 Total 215
Good performers are given more authority and responsibility.
< 10 women employees 194 105.98 20561 > 10 women employees 21 126.62 2659 Total 215
Employees participate in the decision-making process.
< 10 women employees 194 107.52 20859.5 > 10 women employees 21 112.4 2360.5 Total 215
Employees are given opportunity to suggest improvement
< 10 women employees 194 105.94 20552 > 10 women employees 21 127.05 2668 Total 215
Employees can openly communicate with the superiors
< 10 women employees 194 103.66 20110.5 > 10 women employees 21 148.07 3109.5 Total 215
(Source: SPSS Output; Primary data)
TABLE 8.68 - Test Statisticsa : Mann-Whitney Test for Number of Women Employees and HR Practices in the SMEs
HR Practices Mann-Whitney U
Wilcoxon W Z
Asymp. Sig. (2-tailed)
Our organization places the right person in the right job 1554 20469 -2.219 0.027
Selection is on the basis of merit 1139.5 20054.5 -4.051 0 Organizes training and skill development programs 1718.5 20633.5 -1.263 0.207
Employees are rotated from one job to another 1933 2164 -0.416 0.678
Appraises the performance of employees at regular intervals. 1561.5 20476.5 -2.138 0.033

Quantitative Data Analysis and Interpretation
©Ranjita Banerjee 170
HR Practices Mann-Whitney U
Wilcoxon W Z
Asymp. Sig. (2-tailed)
Employees receive feedback 1985 20900 -0.236 0.813 Enough opportunity for career growth 1065.5 19980.5 -3.87 0
Compensation is decided on the basis of competence or ability 1543 20458 -2.274 0.023
Good performers are given financial incentives 1300 20215 -2.892 0.004
Good performers are given non-financial incentives. 1567 20482 -1.795 0.073
Good performers are given more authority and responsibility. 1646 20561 -1.633 0.102
Employees participate in the decision-making process. 1944.5 20859.5 -0.363 0.716
Employees are given opportunity to suggest improvement 1637 20552 -1.801 0.072
Employees can openly communicate with the superiors 1195.5 20110.5 -3.823 0
Grouping Variable: b. No. of women employees (Source: SPSS Output; Primary data)
Interpretation
It can be seen from Table 8.68 that the p-value of the following statements on HR
Practices is less than 0.05:
• Our organization places the right person in the right job
• Selection is on the basis of merit
• Appraises the performance of employees at regular intervals.
• Enough opportunity for career growth
• Compensation is decided on the basis of competence or ability
• Good performers are given financial incentives
• Employees can openly communicate with the superiors
Table 8.67 further shows that the mean-rank of firms with more than 10 women
employees is high and is 131, 150.74, 130.64, 154.26, 131.52, 143.10 and 148.07

Quantitative Data Analysis and Interpretation
©Ranjita Banerjee 171
respectively, for the above statements. So the number of women employees in the SME
firms does have an effect on the HR Practices related to placing the right person in
the right job; merit-based selection methods; regular performance appraisal
system; opportunities for career growth; competency-based Compensation
Management System; Reward Management with respect to giving financial
incentives; Open communication.
As the p-value of the above statements on HR Practices is less than 0.05, so we reject
the null hypothesis and conclude that number of women employees has a significant
effect on the HR Practices related to Recruitment & Selection, regular
implementation of Performance Appraisal System, Career growth & Management,
competency-based Compensation Management System, Reward Management with
respect to giving financial incentives and Open communication. In the present
survey, the firms with more than 10 women employees have shown to have a
significant effect on the specific mentioned HR Practices.

Quantitative Data Analysis and Interpretation
©Ranjita Banerjee 172
8.9. Kruskal-Wallis Test
Kruskal-Wallis Test in very simple terms can be said to be the non-parametric equivalent
for the parametric test ANOVA. It is similar to the Mann-Whitney test, except that in
enables to compare three or more groups, rather than just two, as in Mann-Whitney.
Different objects/ subjects are used for each group.
This test is appropriate for use under the following circumstances:
• there are three or more conditions that we want to compare;
• each condition is performed by a different group of participants; i.e. there is an
independent-measure design with three or more conditions.
• the data do not meet the requirements for a parametric test. (i.e. use it if the data
are not normally distributed; if the variances for the different conditions are markedly
different; or if the data are measurements on an ordinal scale).
8.9.1. Kruskal-Wallis Test for Age of the Respondents and HR Practices
Kruskal-Wallis Test was done to see if there is any influence of age of the respondents on
HR practices in the SME firms.
The null and alternate hypothesis is framed as under:
H016: There is no significant influence of age of the respondents on HR Practices.
Ha16: There is significant influence of age of the respondents on HR Practices.
TABLE 8.69 Mean-Ranks: Kruskal-Wallis Test for Age of the respondents and HR Practices
HR Practices Age of the Respondent N Mean
Rank
Our organization places the right person in the right job
18-25 YRS 6 117.08 26-35 YRS 59 111.06 36-45 YRS 66 101.24 46-55 YRS 57 112.96
ABOVE 55 YRS 27 105.33 Total 215

Quantitative Data Analysis and Interpretation
©Ranjita Banerjee 173
HR Practices Age of the Respondent N Mean
Rank
Selection is on the basis of merit
18-25 YRS 6 79.17 26-35 YRS 59 109.89 36-45 YRS 66 107.11 46-55 YRS 57 109.54
ABOVE 55 YRS 27 109.2 Total 215
Organizes training and skill development programs
18-25 YRS 6 105.83 26-35 YRS 59 112.49 36-45 YRS 66 103.11 46-55 YRS 57 110.65
ABOVE 55 YRS 27 105.04 Total 215
Employees are rotated from one job to another
18-25 YRS 6 111.75 26-35 YRS 59 107.54 36-45 YRS 66 101.21 46-55 YRS 57 118.7
ABOVE 55 YRS 27 102.17 Total 215
Appraises the performance of employees at regular intervals.
18-25 YRS 6 129 26-35 YRS 59 124.13 36-45 YRS 66 95.11 46-55 YRS 57 101.71
ABOVE 55 YRS 27 112.89 Total 215
Employees receive feedback
18-25 YRS 6 107.5 26-35 YRS 59 114.66 36-45 YRS 66 101.74 46-55 YRS 57 104.17
ABOVE 55 YRS 27 116.94 Total 215
Enough opportunity for career growth
18-25 YRS 6 65.58 26-35 YRS 59 125.85 36-45 YRS 66 102.52 46-55 YRS 57 103.19
ABOVE 55 YRS 27 101.96 Total 215
Compensation is decided on the basis of competence or ability
18-25 YRS 6 99.17 26-35 YRS 59 127.03

Quantitative Data Analysis and Interpretation
©Ranjita Banerjee 174
HR Practices Age of the Respondent N Mean
Rank 36-45 YRS 66 98.02 46-55 YRS 57 101.68
ABOVE 55 YRS 27 106.09 Total 215
Good performers are given financial incentives
18-25 YRS 6 116.67 26-35 YRS 59 128.16 36-45 YRS 66 103.82 46-55 YRS 57 91.94
ABOVE 55 YRS 27 106.15 Total 215
Good performers are given non-financial incentives.
18-25 YRS 6 112.08 26-35 YRS 59 98.33 36-45 YRS 66 119.02 46-55 YRS 57 99.46
ABOVE 55 YRS 27 119.31 Total 215
Good performers are given more authority and responsibility.
18-25 YRS 6 90.25 26-35 YRS 59 106.17 36-45 YRS 66 116.23 46-55 YRS 57 100.39
ABOVE 55 YRS 27 111.87 Total 215
Employees participate in the decision-making process.
18-25 YRS 6 83 26-35 YRS 59 113.38 36-45 YRS 66 115.35 46-55 YRS 57 103.88
ABOVE 55 YRS 27 92.54 Total 215
Employees are given opportunity to suggest improvement
18-25 YRS 6 90.5 26-35 YRS 59 112.45 36-45 YRS 66 107.86 46-55 YRS 57 105.64
ABOVE 55 YRS 27 107.48 Total 215
Employees can openly communicate with the superiors
18-25 YRS 6 127.33 26-35 YRS 59 115.86 36-45 YRS 66 106.29 46-55 YRS 57 105

Quantitative Data Analysis and Interpretation
©Ranjita Banerjee 175
HR Practices Age of the Respondent N Mean
Rank ABOVE 55 YRS 27 97.06
Total 215
(Source: SPSS Output; Primary data)
TABLE 8.70 - Test Statisticsab: Kruskal-Wallis Test for Age of the respondents and HR Practices
HR Practices Chi-Square Df Asymp. Sig.
Our organization places the right person in the right job 2.263 4 0.688 Selection is on the basis of merit 2.094 4 0.718 Organizes training and skill development programs 1.024 4 0.906 Employees are rotated from one job to another 3.204 4 0.524 Appraises the performance of employees at regular intervals. 12.202 4 0.016
Employees receive feedback 3.2 4 0.525 Enough opportunity for career growth 10.184 4 0.037 Compensation is decided on the basis of competence or ability 12.363 4 0.015
Good performers are given financial incentives 11.779 4 0.019 Good performers are given non-financial incentives. 5.869 4 0.209 Good performers are given more authority and responsibility. 3.394 4 0.494
Employees participate in the decision-making process. 4.806 4 0.308
Employees are given opportunity to suggest improvement 1.28 4 0.865
Employees can openly communicate with the superiors 3.842 4 0.428 a. Kruskal Wallis Test b. Grouping Variable: Age of the Respondent (Source: SPSS Output; Primary Data)
Interpretation
It can be seen from Table 8.70 that the p-value of the following statements on HR
Practices is less than 0.05:
• Our firm Appraises the performance of employees at regular intervals
• There is enough opportunity for career growth for good performers
• Compensation is decided on the basis of competence or ability

Quantitative Data Analysis and Interpretation
©Ranjita Banerjee 176
• Good performers are given financial incentives
Table 8.69 further shows that the mean-rank of the respondents for the statement ‘Our
firm appraises the performance of employees at regular intervals’ in the age-group of 18-
25 years is 129 which is higher than the other age-groups. Thus, the owners/Managing
heads in the age-group 18-25 years believes that the SME firms appraises the
performance of employees at regular intervals.
The mean-rank of the respondents in the middle age-group 26-35 years is 125.85, 127.03
and 128.16 respectively, which is higher than the other age-groups for the statements
‘There is enough opportunity for career growth for good performers’, ‘Compensation is
decided on the basis of competence or ability’ and ‘Good performers are given financial
incentives’. Thus, the owners/Managing heads in the middle age-group 26-35 years
believes that there is enough opportunity for career growth for good performers in
the SMEs, as well as that compensation is decided on the basis of competence or
ability. They also believe that good performers are rewarded well by giving financial
incentives in SME firms.
Thus, as the p-value of the above statements on HR Practices is less than 0.05, so we
reject the null hypothesis and conclude that age of the respondents have a
significant influence on the HR Practices related to Performance Management and
Opportunities for career growth, Compensation and Reward Management with
respect to giving financial incentives.
All those statements whose p-value is more than 0.05, the age of the respondents does not
influence the HR practices in the SMEs in Vadodara district.
8.9.2. Kruskal-Wallis Test for Age of the Respondents and Employee Outcomes
Kruskal-Wallis Test was done to see if there is any influence of age of the respondents on
Employee Outcomes in the SME firms.

Quantitative Data Analysis and Interpretation
©Ranjita Banerjee 177
The null and alternate hypothesis is framed as under:
H017: There is no significant influence of age of the respondents on Employee
Outcomes.
Ha17: There is significant influence of age of the respondents on Employee Outcomes.
TABLE 8.71 - Mean-Ranks: Kruskal-Wallis Test for Age of the Respondents and Employee Outcomes
Employee Outcomes Age of the Respondent N Mean Rank
Competence of an Employee
18-25 YRS 6 110.17 26-35 YRS 59 109.69 36-45 YRS 66 119.58 46-55 YRS 57 105.12
ABOVE 55 YRS 27 81.59 Total 215
Employee’s co-operation with is satisfactory.
18-25 YRS 6 125.58 26-35 YRS 59 104.91 36-45 YRS 66 115.02 46-55 YRS 57 109.94
ABOVE 55 YRS 27 89.61 Total 215
Employees co-operate among themselves
18-25 YRS 6 108.33 26-35 YRS 59 104.78 36-45 YRS 66 116.79 46-55 YRS 57 107.29
ABOVE 55 YRS 27 94.98 Total 215
Employee’s general behavior is good
18-25 YRS 6 104.58 26-35 YRS 59 105.14 36-45 YRS 66 114.27 46-55 YRS 57 112.67
ABOVE 55 YRS 27 89.83 Total 215
Employees are committed 18-25 YRS 6 113.5 26-35 YRS 59 107.93 36-45 YRS 66 107.25

Quantitative Data Analysis and Interpretation
©Ranjita Banerjee 178
Employee Outcomes Age of the Respondent N Mean Rank
46-55 YRS 57 113.22 ABOVE 55 YRS 27 97.74
Total 215
Employees are punctual and report daily
18-25 YRS 6 93.83 26-35 YRS 59 103.84 36-45 YRS 66 118.21 46-55 YRS 57 108.87
ABOVE 55 YRS 27 93.44 Total 215
Employees are regular
18-25 YRS 6 139 26-35 YRS 59 116.85 36-45 YRS 66 112.81 46-55 YRS 57 100.52
ABOVE 55 YRS 27 85.81 Total 215
Employees take up extra duties and responsibilities
18-25 YRS 6 126.5 26-35 YRS 59 121.77 36-45 YRS 66 110.17 46-55 YRS 57 97.75
ABOVE 55 YRS 27 90.13 Total 215
Employee’s follow general code of conduct and rules
18-25 YRS 6 86.25 26-35 YRS 59 119.34 36-45 YRS 66 111.36 46-55 YRS 57 103.82
ABOVE 55 YRS 27 88.67 Total 215
(Source: SPSS Output; Primary data)
TABLE 8.72 - Test Statisticsab: Kruskal-Wallis Test for Age of the Respondents and Employee Outcomes
Employee Outcomes Chi-Square Df Asymp. Sig. Competence of an Employee 11.641 4 0.02 Employee’s co-operation with is satisfactory. 5.637 4 0.228 Employees co-operate among themselves 3.309 4 0.508 Employee’s general behavior is good 4.402 4 0.354 Employees are committed 1.397 4 0.845

Quantitative Data Analysis and Interpretation
©Ranjita Banerjee 179
Employee Outcomes Chi-Square Df Asymp. Sig. Employees are punctual and report daily 4.385 4 0.356 Employees are regular 8.762 4 0.067 Employees take up extra duties and responsibilities 8.621 4 0.071
Employee’s follow general code of conduct and rules 7.107 4 0.13
a. Kruskal Wallis Test b. Grouping Variable: Age of the Respondent (Source: SPSS Output; Primary data)
Interpretation
It can be seen from Table 8.72 that the p-value of the statement ‘The competence of the
employees to do their assigned work is satisfactory’ is less than 0.05.
Table 8.71 further shows that the mean-rank of the respondents for the above statement
in the age-group of 36-45 years is 119.58 which is higher than the other age-groups.
Thus, the owners/Managing heads in the age-group 36-45 years believes that the
competence of the employees to do their assigned work is satisfactory in the SME
firms.
Thus, as the p-value of the above statements on Employee Outcome is less than 0.05, so
we reject the null hypothesis and conclude that age of the respondents has a
significant influence on the Employee Outcome related to competence of the
employees to do their assigned work in the SME firms.
All the other statements related to Employee Outcomes, whose p-value is more than 0.05,
the age of the respondents does not influence the Employee Outcomes in the SMEs in
Vadodara district.

Quantitative Data Analysis and Interpretation
©Ranjita Banerjee 180
8.9.3. Kruskal-Wallis Test for Age of the Respondents and Organizational Outcomes
Kruskal-Wallis Test was done to see if there is any influence of age of the respondents on
Organizational Outcomes in the SME firms.
The null and alternate hypothesis is framed as under:
H018: There is no significant influence of age of the respondents on Organizational
Outcomes.
Ha18: There is significant influence of age of the respondents on Organizational Outcomes.
TABLE 8.73 -Mean-Ranks: Kruskal-Wallis Test for Age of the Respondents and Organizational Outcomes
Organizational Outcomes Age of the Respondent N Mean Rank
Customer satisfaction has increased
18-25 YRS 6 150.5 26-35 YRS 59 121.81 36-45 YRS 66 111.23 46-55 YRS 57 93.15
ABOVE 55 YRS 27 91.85 Total 215
Our suppliers/ vendors are satisfied with us.
18-25 YRS 6 137.5 26-35 YRS 59 112.97 36-45 YRS 66 112.41 46-55 YRS 57 100.61
ABOVE 55 YRS 27 95.41 Total 215
Measures have been taken by the firm for product/ service development
18-25 YRS 6 101.5 26-35 YRS 59 119.84 36-45 YRS 66 103.91 46-55 YRS 57 106.5
ABOVE 55 YRS 27 96.74
Total 215
Products/service Quality shows improvement
18-25 YRS 6 128.75 26-35 YRS 59 111.61

Quantitative Data Analysis and Interpretation
©Ranjita Banerjee 181
Organizational Outcomes Age of the Respondent N Mean Rank
36-45 YRS 66 112.1 46-55 YRS 57 107.66
ABOVE 55 YRS 27 86.2 Total 215
The firm has displayed proper utilization of resources.
18-25 YRS 6 107 26-35 YRS 59 105.15 36-45 YRS 66 110.52 46-55 YRS 57 112.73
ABOVE 55 YRS 27 98.3 Total 215
Average Number of defects of products / deficiencies in service shows a decrease
18-25 YRS 6 64.25 26-35 YRS 59 111.29 36-45 YRS 66 113.5 46-55 YRS 57 109.31
ABOVE 55 YRS 27 94.33 Total 215
There is an increase in the Net Profit Margin.
18-25 YRS 6 126.17 26-35 YRS 59 124.03 36-45 YRS 66 94.31 46-55 YRS 57 98.97
ABOVE 55 YRS 27 121.44 Total 215
Return on Investment (in %) has increased
18-25 YRS 6 150.83 26-35 YRS 59 121.25 36-45 YRS 66 93.14 46-55 YRS 57 103
ABOVE 55 YRS 27 116.41 Total 215
(Source: SPSS Output; Primary data)

Quantitative Data Analysis and Interpretation
©Ranjita Banerjee 182
TABLE 8.74 - Test Statisticsab: Kruskal-Wallis Test for Age of the Respondents and Organizational Outcomes
Organizational Outcomes Chi-Square df Asymp. Sig.
Customer satisfaction has increased 13.667 4 0.008
Our suppliers/ vendors are satisfied with us. 4.853 4 0.303
Measures have been taken by the firm for product/ service development 4.107 4 0.392
Products/service Quality shows improvement 5.482 4 0.241
The firm has displayed proper utilization of resources. 1.483 4 0.83
Average Number of defects of products / deficiencies in service shows a decrease 5.974 4 0.201
There is an increase in the Net Profit Margin. 11.805 4 0.019
Return on Investment (in %) has increased 11.814 4 0.019 a. Kruskal Wallis Testb. Grouping Variable: Age of the Respondent (Source: SPSS Output; Primary data)
Interpretation
It can be seen from Table 8.74 that the p-value of the following statements on
Organizational Outcomes is less than 0.05:
• Customer satisfaction has increased
• There is an increase in the Net Profit Margin.
• Return on Investment (in %) has increased
Table 8.73 further shows that the mean-rank of the respondents for the above three
statements in the age-group of 18-25 years is high and is 150.50, 126.17 and 150.83
respectively, which is higher than the other age-groups. Thus, the owners/Managing
heads in the age-group 18-25 years believes that the customer satisfaction has
increased as well as the Net Profit Margin and Return on Investment (ROI) in the
last two years has increased in the SMEs.

Quantitative Data Analysis and Interpretation
©Ranjita Banerjee 183
Thus, as the p-value of the above statements on Organizational Outcomes is less than
0.05, so we reject the null hypothesis and conclude that age of the respondents has a
significant influence on the Organizational Outcomes related to Customer
satisfaction, Net Profit Margin and Return on Investment.
All those statements whose p-value is more than 0.05, the age of the respondents does not
influence the Organizational Outcomes in the SMEs in Vadodara district.
8.9.4. Kruskal-Wallis Test for Number of Years of Service in the Firm and HR Practices
Kruskal-Wallis Test was done to see if there is any influence of number of years of
service in the firm on HR Practices.
The null and alternate hypothesis is framed as under:
H019: There is no significant influence of number of years of service in the firm on
HR Practices.
Ha19: There is significant influence of number of years of service in the firm on HR Practices.
TABLE 8.75 - Mean-Ranks: Kruskal-Wallis Test for Number of Years of Service in the Firm on HR Practices
HR Practices I am in this firm since N Mean Rank
Our organization places the right person in the right job
LESS THAN 5YRS 42 105.08 6-10 YRS 47 107.74
11-15 YRS 47 108.26 16-20 YRS 37 89.72
MORE THAN 20 YRS 42 127.02
Selection is on the basis of merit
LESS THAN 5YRS 42 107.13 6-10 YRS 47 104.47
11-15 YRS 47 105.9 16-20 YRS 37 93.42
MORE THAN 20 YRS 42 128.01 Total 215

Quantitative Data Analysis and Interpretation
©Ranjita Banerjee 184
HR Practices I am in this firm since N Mean Rank
Organizes training and skill development programs
LESS THAN 5YRS 42 113.87 6-10 YRS 47 101.62
11-15 YRS 47 111.93 16-20 YRS 37 91.45
MORE THAN 20 YRS 42 119.46 Total 215
Employees are rotated from one job to another
LESS THAN 5YRS 42 106.21 6-10 YRS 47 103.63
11-15 YRS 47 114.19 16-20 YRS 37 109.77
MORE THAN 20 YRS 42 106.19
Total 215
Appraises the performance of employees at regular intervals.
LESS THAN 5YRS 42 123.07 6-10 YRS 47 98.93
11-15 YRS 47 105.19 16-20 YRS 37 87.7
MORE THAN 20 YRS 42 124.11 Total 215
Employees receive feedback
LESS THAN 5YRS 42 105.77 6-10 YRS 47 106.28
11-15 YRS 47 109.57 16-20 YRS 37 101.76
MORE THAN 20 YRS 42 115.89 Total 215
Enough opportunity for career growth
LESS THAN 5YRS 42 112.02 6-10 YRS 47 106.47
11-15 YRS 47 114.83 16-20 YRS 37 90.62
MORE THAN 20 YRS 42 113.36 Total 215
Compensation is decided on the basis of competence or ability
LESS THAN 5YRS 42 118.56 6-10 YRS 47 109.66
11-15 YRS 47 101.94 16-20 YRS 37 85.14
MORE THAN 20 YRS 42 122.51
Good performers are given financial incentives
LESS THAN 5YRS 42 114.93 6-10 YRS 47 107.12
11-15 YRS 47 109.17 16-20 YRS 37 96.62

Quantitative Data Analysis and Interpretation
©Ranjita Banerjee 185
HR Practices I am in this firm since N Mean Rank MORE THAN 20 YRS 42 110.77
Total 215
Good performers are given non-financial incentives.
LESS THAN 5YRS 42 98.94 6-10 YRS 47 119.37
11-15 YRS 47 100.07 16-20 YRS 37 105.93
MORE THAN 20 YRS 42 115.02 Total 215
Good performers are given more authority and responsibility.
LESS THAN 5YRS 42 101.3 6-10 YRS 47 89.79
11-15 YRS 47 123.81 16-20 YRS 37 103.89
MORE THAN 20 YRS 42 121.01 Total 215
Employees participate in the decision-making process.
LESS THAN 5YRS 42 95.08 6-10 YRS 47 107.47
11-15 YRS 47 120.71 16-20 YRS 37 118.88
MORE THAN 20 YRS 42 97.7
Total 215
Employees are given opportunity to suggest improvement
LESS THAN 5YRS 42 104.25 6-10 YRS 47 103.3
11-15 YRS 47 114.34 16-20 YRS 37 98.47
MORE THAN 20 YRS 42 118.31
Employees can openly communicate with the superiors
LESS THAN 5YRS 42 105.31 6-10 YRS 47 115.39
11-15 YRS 47 101.73 16-20 YRS 37 108.47
MORE THAN 20 YRS 42 109.01
Total 215
(Source: SPSS Output; Primary data)

Quantitative Data Analysis and Interpretation
©Ranjita Banerjee 186
TABLE 8.76 - - Test Statisticsab: Kruskal-Wallis Test for Number of Years of Service in the Firm on HR Practices
HR Practices Chi-Square df Asymp. Sig.
Our organization places the right person in the right job 11.169 4 0.025
Selection is on the basis of merit 9.849 4 0.043 Organizes training and skill development programs 5.881 4 0.208
Employees are rotated from one job to another 0.935 4 0.92 Appraises the performance of employees at regular intervals. 15.287 4 0.004
Employees receive feedback 1.765 4 0.779 Enough opportunity for career growth 4.619 4 0.329 Compensation is decided on the basis of competence or ability 13.947 4 0.007
Good performers are given financial incentives 2.109 4 0.716 Good performers are given non-financial incentives. 4.065 4 0.397
Good performers are given more authority and responsibility. 12.22 4 0.016
Employees participate in the decision-making process. 6.852 4 0.144
Employees are given opportunity to suggest improvement 4.358 4 0.36
Employees can openly communicate with the superiors 1.865 4 0.761
a. Kruskal Wallis Test b. Grouping Variable: I am in this firm since (Source: SPSS Output; Primary data)
Interpretation
It can be seen from Table 8.76 that the p-value of the following statements on HR
Practices is less than 0.05:
• Our organization places the right person in the right job
• Selection is on the basis of merit
• Appraises the performance of employees at regular intervals
• Compensation is decided on the basis of competence or ability

Quantitative Data Analysis and Interpretation
©Ranjita Banerjee 187
• Good performers are given more authority and responsibility.
Table 8.75 further shows that the mean-rank of the respondents for the first four
statements for the respondents who had been working in the same organization for more
than 20 years is high and is 127.02, 128.01, 124.11 and 122.51 respectively, which is
higher than the others. Thus, the owners/Managing heads who had been working in
the organization for more than 20 years in the same firms believes that the SMEs
places the right person in the right job; Selection is on the basis of merit; their firms
appraises the performance of employees at regular intervals and that compensation
is decided on the basis of competence or ability in their firms.
Thus, as the p-value of the above statements on HR Practices is less than 0.05, so we
reject the null hypothesis and conclude that there is a significant influence of number
of years of service in the firm on HR Practices related to Recruitment & Selection,
implementation of regular Performance Appraisal System and a fair Compensation
Management System in the SMEs.
All those statements whose p-value is more than 0.05, the number of years of service in
the SME firms does not influence the HR practices.
8.9.5. Kruskal-Wallis Test for Total Years of Work-Experience of Respondents and HR Practices
Kruskal-Wallis Test was done to see if there is any influence of total years of work-
experience on HR Practices.
The null and alternate hypothesis is framed as under:
H020: There is no significant influence of total years of work-experience of
respondents on HR Practices.
Ha20: There is significant influence of total years of work-experience of respondents
on HR Practices.

Quantitative Data Analysis and Interpretation
©Ranjita Banerjee 188
TABLE 8.77 - Mean-Ranks: Kruskal-Wallis Test for Total Years of Work-Experience and HR Practices
HR Practices Work Experience N Mean Rank
Our organization places the right person in the right job
Less than 5 years 22 105.11 6 - 10 years 37 104.55
11 - 15 years 48 109.8 16 - 20 years 46 85.84
More than 20 years 62 126.13 Total 215
Selection is on the basis of merit
Less than 5 years 22 97.02 6 - 10 years 37 105.26
11 - 15 years 48 108.33 16 - 20 years 46 92.23
More than 20 years 62 124.98 Total 215
Organizes training and skill development programs
Less than 5 years 22 104.07 6 - 10 years 37 101.12
11 - 15 years 48 113.34 16 - 20 years 46 90.53
More than 20 years 62 122.32
Employees are rotated from one job to another
Less than 5 years 22 109.91 6 - 10 years 37 95.19
11 - 15 years 48 110.38 16 - 20 years 46 109.2
More than 20 years 62 112.24 Total 215
Appraises the performance of employees at regular intervals.
Less than 5 years 22 118.11 6 - 10 years 37 104.74
11 - 15 years 48 110.83 16 - 20 years 46 89.79
More than 20 years 62 117.67 Total 215
Employees receive feedback
Less than 5 years 22 89.55 6 - 10 years 37 112.23
11 - 15 years 48 108.18 16 - 20 years 46 101.25
More than 20 years 62 116.9 Enough opportunity for career growth
Less than 5 years 22 95.41 6 - 10 years 37 123.61

Quantitative Data Analysis and Interpretation
©Ranjita Banerjee 189
HR Practices Work Experience N Mean Rank
11 - 15 years 48 115.05 16 - 20 years 46 91.84
More than 20 years 62 109.69 Total 215
Compensation is decided on the basis of competence or ability
Less than 5 years 22 109.55 6 - 10 years 37 118.8
11 - 15 years 48 113.44 16 - 20 years 46 87.54
More than 20 years 62 111.98 Total 215
Good performers are given financial incentives
Less than 5 years 22 110.32 6 - 10 years 37 119.72
11 - 15 years 48 111.4 16 - 20 years 46 93.17
More than 20 years 62 108.56 Total 215
Good performers are given non-financial incentives.
Less than 5 years 22 110.66 6 - 10 years 37 105.55
11 - 15 years 48 106.32 16 - 20 years 46 108.64
More than 20 years 62 109.34 Total 215
Good performers are given more authority and responsibility.
Less than 5 years 22 77.68 6 - 10 years 37 100.73
11 - 15 years 48 109.59 16 - 20 years 46 106.33
More than 20 years 62 123.1 Total 215
Employees participate in the decision-making process.
Less than 5 years 22 81.64 6 - 10 years 37 102.05
11 - 15 years 48 123.63 16 - 20 years 46 126.32
More than 20 years 62 95.22 Total 215
Employees are given opportunity to suggest improvement
Less than 5 years 22 98.39 6 - 10 years 37 96.62
11 - 15 years 48 115.94 16 - 20 years 46 110.55

Quantitative Data Analysis and Interpretation
©Ranjita Banerjee 190
HR Practices Work Experience N Mean Rank
More than 20 years 62 110.16 Total 215
Employees can openly communicate with the superiors
Less than 5 years 22 94.59 6 - 10 years 37 108.01
11 - 15 years 48 113.19 16 - 20 years 46 110.2
More than 20 years 62 107.1 Total 215
(Source: SPSS output; Primary data)
TABLE 8.78 - Test Statisticsab: Kruskal-Wallis Test for Total Years of Work-Experience and HR Practices
HR Practices Chi-Square df Asymp. Sig. Our organization places the right person in the right job 17.495 4 0.002
Selection is on the basis of merit 12.449 4 0.014 Organizes training and skill development programs 9 4 0.061
Employees are rotated from one job to another 2.302 4 0.68 Appraises the performance of employees at regular intervals. 9.218 4 0.056
Employees receive feedback 5.914 4 0.206 Enough opportunity for career growth 8.143 4 0.086 Compensation is decided on the basis of competence or ability 10.447 4 0.034
Good performers are given financial incentives 4.632 4 0.327 Good performers are given non-financial incentives. 0.177 4 0.996
Good performers are given more authority and responsibility. 12.093 4 0.017
Employees participate in the decision-making process. 15.745 4 0.003
Employees are given opportunity to suggest improvement 4.011 4 0.405
Employees can openly communicate with the superiors 2.158 4 0.707
a. Kruskal Wallis Test b. Grouping Variable: Work Exp.(Source: SPSS output; Primary data) Interpretation

Quantitative Data Analysis and Interpretation
©Ranjita Banerjee 191
It can be seen from Table 8.78 that the p-value of the following statements on HR
Practices is less than 0.05:
• Our organization places the right person in the right job
• Selection is on the basis of merit
• Compensation is decided on the basis of competence or ability
• Good performers are given more authority and responsibility.
• Employees participate in the decision-making process.
Table 8.77 further shows that the mean-rank of the respondents for the first four
statements for the respondents whose total work experience was more than 20 yearsis
high and is 126.13, 124.98, 111.98 and 123.10 respectively, which is higher than the
others. Thus, the owners/Managing heads whose total work experience was more
than 20 years believes that the SMEs places the right person in the right job;
Selection is on the basis of merit; compensation is decided on the basis of
competence or ability and that good performers are given more authority and
responsibility in their SME firm. The owner/ Managers whose work experience was
16-20 years believed that employees participated in the decision-making process.
Thus, as the p-value of the above statements on HR Practices is less than 0.05, so we
reject the null hypothesis and conclude that there is a significant influence of total
years of work experience on HR Practices related to Recruitment & Selection, fair
Compensation Management System and Employee Participation in the SMEs.
All those statements whose p-value is more than 0.05, the total work experience of
respondents in the SME firms does not influence the HR practices.

Quantitative Data Analysis and Interpretation
©Ranjita Banerjee 192
8.9.6. Kruskal-Wallis Test for Educational Background of Respondents and HR Practices
Kruskal-Wallis Test was done to see if there is any influence of educational background
of the respondents on HR Practices.
The null and alternate hypothesis is framed as under:
H021: There is no significant influence of Educational Background of respondents on
HR Practices.
Ha21: There is a significant influence of Educational Background of respondents on HR
Practices.
TABLE 8.79 - Mean-Ranks: Kruskal-Wallis Test for Educational Background of Respondents and HR Practices
HR Practices Educational Background N Mean Rank
Our organization places the right person in the right job
BELOW STD.XII 17 94.26 DIPLOMA 17 85.06
GRADUATE 119 111.14 MASTERS 61 112.24 OTHERS 1 99
Total 215
Selection is on the basis of merit
BELOW STD.XII 17 81.09 DIPLOMA 17 93.65
GRADUATE 119 109.12 MASTERS 61 117.3 OTHERS 1 108.5
Total 215
Organizes training and skill development programs
BELOW STD.XII 17 69 DIPLOMA 17 89.65
GRADUATE 119 110.39 MASTERS 61 119.11 OTHERS 1 118.5
Total 215 Employees are rotated from one job to another
BELOW STD.XII 17 77.18 DIPLOMA 17 99.06

Quantitative Data Analysis and Interpretation
©Ranjita Banerjee 193
HR Practices Educational Background N Mean Rank
GRADUATE 119 115.91 MASTERS 61 102.99 OTHERS 1 148.5
Total 215
Appraises the performance of employees at regular intervals.
BELOW STD.XII 17 90.24 DIPLOMA 17 90.35
GRADUATE 119 108.62 MASTERS 61 116.89 OTHERS 1 93.5
Total 215
Employees receive feedback
BELOW STD.XII 17 96.91 DIPLOMA 17 93.82
GRADUATE 119 108.26 MASTERS 61 114.51 OTHERS 1 110
Total 215
Enough opportunity for career growth
BELOW STD.XII 17 98.91 DIPLOMA 17 77.38
GRADUATE 119 110.31 MASTERS 61 114.63 OTHERS 1 103.5
Total 215
Compensation is decided on the basis of competence or ability
BELOW STD.XII 17 95.68 DIPLOMA 17 91.32
GRADUATE 119 108.42 MASTERS 61 115.5 OTHERS 1 94
Total 215
Good performers are given financial incentives
BELOW STD.XII 17 96.62 DIPLOMA 17 106.32
GRADUATE 119 105.45 MASTERS 61 116.74 OTHERS 1 100
Total 215
Good performers are given non-financial incentives.
BELOW STD.XII 17 128.5 DIPLOMA 17 121.68
GRADUATE 119 106.96 MASTERS 61 99.53

Quantitative Data Analysis and Interpretation
©Ranjita Banerjee 194
HR Practices Educational Background N Mean Rank
OTHERS 1 167 Total 215
Good performers are given more authority and responsibility.
BELOW STD.XII 17 93.74 DIPLOMA 17 110.53
GRADUATE 119 111.14 MASTERS 61 105.21 OTHERS 1 104
Total 215
Employees participate in the decision-making process.
BELOW STD.XII 17 86.53 DIPLOMA 17 117.71
GRADUATE 119 114.85 MASTERS 61 97.71 OTHERS 1 120.5
Total 215
Employees are given opportunity to suggest improvement
BELOW STD.XII 17 85.59 DIPLOMA 17 117.41
GRADUATE 119 109.68 MASTERS 61 108.47 OTHERS 1 100
Total 215
Employees can openly communicate with the superiors
BELOW STD.XII 17 120.62 DIPLOMA 17 110.97
GRADUATE 119 107.76 MASTERS 61 104.39 OTHERS 1 91.5
Total 215 (Source: SPSS Output; Primary data)

Quantitative Data Analysis and Interpretation
©Ranjita Banerjee 195
TABLE 8.80 - Test Statisticsab: Kruskal-Wallis Test for Educational Background of Respondents and HR Practices
HR Practices Chi-Square df Asymp. Sig. Our organization places the right person in the right job 5.801 4 0.215
Selection is on the basis of merit 8.202 4 0.084 Organizes training and skill development programs 11.905 4 0.018
Employees are rotated from one job to another 8.511 4 0.075
Appraises the performance of employees at regular intervals. 6.027 4 0.197
Employees receive feedback 3.161 4 0.531
Enough opportunity for career growth 6.218 4 0.183
Compensation is decided on the basis of competence or ability 4.4 4 0.355
Good performers are given financial incentives 2.259 4 0.688
Good performers are given non-financial incentives. 5.06 4 0.281
Good performers are given more authority and responsibility. 1.729 4 0.785
Employees participate in the decision-making process. 6.321 4 0.176
Employees are given opportunity to suggest improvement 4.02 4 0.403
Employees can openly communicate with the superiors 1.536 4 0.82
a. Kruskal Wallis Test b. Grouping Variable: Educational Background (Source: SPSS Output; Primary data) Interpretation
It can be seen from Table 8.80 that the p-value of the statement ‘Organizes training and
skill development programs’ is less than 0.05:
Table 8.79 further shows that the mean-rank of the respondents possessing Masters
degree is high for the statement ‘Organizes training and skill development
programs’ and is 119.11, which is higher than the others. Thus, the owners/Managing
heads who possess a Masters degree as their educational qualification believe that

Quantitative Data Analysis and Interpretation
©Ranjita Banerjee 196
the SMEs Organizes training and skill development programs for employees (need-
based).
Thus, as the p-value of the above statement on HR Practice is less than 0.05, so we
reject the null hypothesis and conclude that there is a significant influence of
educational qualification on HR Practice related to organizing Training and Skill
development programs in the SMEs.
For all the other statements whose p-value is more than 0.05, the educational background
of the respondents does not influence the HR practices in the SME firms.
8.9.7. Kruskal-Wallis Test for Educational Background of Respondents and Organizational Outcomes
Kruskal-Wallis Test was done to see if there is any influence of educational background
of the respondents on Organizational Outcomes.
The null and alternate hypothesis is framed as under:
H022: There is no significant influence of Educational Background of respondents on
Organizational Outcomes.
Ha22: There is a significant influence of Educational Background of respondents on
Organizational Outcomes.
TABLE 8.81 - Mean-Ranks: Kruskal-Wallis Test for Educational Background of Respondents and Organizational Outcomes
Organizational Outcomes Educational Background N Mean Rank
Customer satisfaction has increased
BELOW STD.XII 17 87.5 DIPLOMA 17 97.68
GRADUATE 119 109.18 MASTERS 61 114.61 OTHERS 1 88.5
Total 215

Quantitative Data Analysis and Interpretation
©Ranjita Banerjee 197
Organizational Outcomes Educational Background N Mean Rank
Our suppliers/ vendors are satisfied with us.
BELOW STD.XII 17 91.91 DIPLOMA 17 104.97
GRADUATE 119 110.03 MASTERS 61 109.61 OTHERS 1 92.5
Total 215
Measures have been taken by the firm for product/ service development
BELOW STD.XII 17 76.21 DIPLOMA 17 87.85
GRADUATE 119 112.24 MASTERS 61 114.65 OTHERS 1 81.5
Total 215
Products/service Quality shows improvement
BELOW STD.XII 17 84.18 DIPLOMA 17 101.47
GRADUATE 119 112.24 MASTERS 61 108.61 OTHERS 1 81.5
Total 215
The firm has displayed proper utilization of resources.
BELOW STD.XII 17 85.09 DIPLOMA 17 91.29
GRADUATE 119 112.02 MASTERS 61 111.46 OTHERS 1 92
Total 215
Average Number of defects of products / deficiencies in service shows a decrease
BELOW STD.XII 17 94.91 DIPLOMA 17 108.88
GRADUATE 119 109.61 MASTERS 61 108.36 OTHERS 1 102.5
Total 215
There is an increase in the Net Profit Margin.
BELOW STD.XII 17 93.76 DIPLOMA 17 107.88
GRADUATE 119 109.69 MASTERS 61 110.28 OTHERS 1 12
Total 215 Return on Investment (in %) has increased
BELOW STD.XII 17 86.47 DIPLOMA 17 98.09

Quantitative Data Analysis and Interpretation
©Ranjita Banerjee 198
Organizational Outcomes Educational Background N Mean Rank
GRADUATE 119 108.03 MASTERS 61 118.26 OTHERS 1 13.5
Total 215
(Source: SPSS Output; Primary data)
TABLE 8.82 - Test Statisticsab: Kruskal-Wallis Test for Educational Background of Respondents and Organizational Outcomes
Organizational Outcomes Chi-Square Df Asymp. Sig. Customer satisfaction has increased 3.925 4 0.416 Our suppliers/ vendors are satisfied with us. 1.721 4 0.787 Measures have been taken by the firm for product/ service development 9.23 4 0.056
Products/service Quality shows improvement 4.197 4 0.38 The firm has displayed proper utilization of resources. 5.209 4 0.266
Average Number of defects of products / deficiencies in service shows a decrease 1.014 4 0.908
There is an increase in the Net Profit Margin. 4.027 4 0.402 Return on Investment (in %) has increased 7.494 4 0.112 a. Kruskal Wallis Test b. Grouping Variable: Educational Background
(Source: SPSS Output; Primary data) Interpretation
It can be seen from Table 8.82 that the p-value of none of the statements is less than
0.05. Thus, as the p-value of none of the statements on Organizational Outcomes is less
than 0.05, so we fail to reject the null hypothesis and conclude that there no
significant influence of educational qualification on Organizational Outcomes in the
SMEs.

Quantitative Data Analysis and Interpretation
©Ranjita Banerjee 199
8.9.8. Kruskal-Wallis Test for Specialization in Education of Respondents and HR Practices
Kruskal-Wallis Test was done to see if there is any influence of Specialization in
educational background of the respondents on HR Practices.
The null and alternate hypothesis is framed as under:
H023: There is no significant influence of Specialization in education of respondents
on HR Practices.
Ha23: There is a significant influence of Specialization in education of respondents on
HR Practices.
TABLE 8.83 - Mean-Ranks: Kruskal-Wallis Test for Specialization in Education of Respondents and HR Practices
HR Practices Specialization N Mean Rank
Our organization places the right person in the right job
HR 47 116.03 MARKETING 38 113.16
FINANCE 47 105.87 OPERATIONS 18 110.28
ENGINEERING 40 111.24 OTHERS 25 76.71
Total 215
Selection is on the basis of merit
HR 47 124.03 MARKETING 38 95.22
FINANCE 47 108.59 OPERATIONS 18 109.22
ENGINEERING 40 113.49 OTHERS 25 81.17
Organizes training and skill development programs
HR 47 125.98 MARKETING 38 110.21
FINANCE 47 107.52 OPERATIONS 18 117
ENGINEERING 40 105.4 OTHERS 25 63.35
Employees are rotated from one job to another
HR 47 117.99 MARKETING 38 117.3

Quantitative Data Analysis and Interpretation
©Ranjita Banerjee 200
HR Practices Specialization N Mean Rank FINANCE 47 109.81
OPERATIONS 18 135.25 ENGINEERING 40 92.49
OTHERS 25 71.13 Total 215
Appraises the performance of employees at regular intervals.
HR 47 127.05 MARKETING 38 117.13
FINANCE 47 101.34 OPERATIONS 18 111.61
ENGINEERING 40 99.23 OTHERS 25 76.73
Total 215
Employees receive feedback
HR 47 121.6 MARKETING 38 114.05
FINANCE 47 106.57 OPERATIONS 18 105.47
ENGINEERING 40 100.04 OTHERS 25 85.29
Enough opportunity for career growth
HR 47 129.67 MARKETING 38 112.3
FINANCE 47 100.77 OPERATIONS 18 122.19
ENGINEERING 40 92.1 OTHERS 25 84.31
Compensation is decided on the basis of competence or ability
HR 47 123.83 MARKETING 38 123.55
FINANCE 47 103.3 OPERATIONS 18 111.17
ENGINEERING 40 92.68 OTHERS 25 80.29
Total 215
Good performers are given financial incentives
HR 47 123.89 MARKETING 38 123.97
FINANCE 47 111.41 OPERATIONS 18 109.72
ENGINEERING 40 78.81 OTHERS 25 87.79
Good performers are given non-financial incentives.
HR 47 98.93 MARKETING 38 123.13

Quantitative Data Analysis and Interpretation
©Ranjita Banerjee 201
HR Practices Specialization N Mean Rank FINANCE 47 112.72
OPERATIONS 18 96.17 ENGINEERING 40 96.4
OTHERS 25 116.31 Total 215
Good performers are given more authority and responsibility.
HR 47 121.31 MARKETING 38 126.95
FINANCE 47 89.43 OPERATIONS 18 114.14
ENGINEERING 40 103.39 OTHERS 25 86.94
Total 215
Employees participate in the decision-making process.
HR 47 110.95 MARKETING 38 133.16
FINANCE 47 101.24 OPERATIONS 18 108.36
ENGINEERING 40 91.9 OTHERS 25 97.73
Total 215
Employees are given opportunity to suggest improvement
HR 47 122.16 MARKETING 38 108.37
FINANCE 47 105.18 OPERATIONS 18 107.22
ENGINEERING 40 105.3 OTHERS 25 85.83
Total 215
Employees can openly communicate with the superiors
HR 47 113.16 MARKETING 38 111.38
FINANCE 47 113.68 OPERATIONS 18 99.72
ENGINEERING 40 97.25 OTHERS 25 101.08
Total 215
(Source: SPSS Output; Primary data)

Quantitative Data Analysis and Interpretation
©Ranjita Banerjee 202
TABLE 8.84 - Test Statisticsab: Kruskal-Wallis Test for Specialization in Education of Respondents and HR Practices
HR Practices Chi-Square Df Asymp. Sig. Our organization places the right person in the right job 11.467 5 0.043
Selection is on the basis of merit 14.417 5 0.013 Organizes training and skill development programs 19.543 5 0.002
Employees are rotated from one job to another 19.492 5 0.002
Appraises the performance of employees at regular intervals. 19.066 5 0.002
Employees receive feedback 9.97 5 0.076 Enough opportunity for career growth 15.916 5 0.007 Compensation is decided on the basis of competence or ability 20.388 5 0.001
Good performers are given financial incentives 19.432 5 0.002
Good performers are given non-financial incentives. 6.458 5 0.264
Good performers are given more authority and responsibility. 16.84 5 0.005
Employees participate in the decision-making process. 11.654 5 0.04
Employees are given opportunity to suggest improvement 8.524 5 0.13
Employees can openly communicate with the superiors 4.032 5 0.545
a. Kruskal Wallis Test b. Grouping Variable: Specialization (Source: SPSS Output; Primary data)
Interpretation
It can be seen from Table 8.84 that the p-value of the following statements of HR
Practices are less than 0.05:
• Our organization places the right person in the right job.
• Selection is on the basis of merit.
• Organizes training and skill development programs.
• Employees are rotated from one job to another.

Quantitative Data Analysis and Interpretation
©Ranjita Banerjee 203
• Appraises the performance of employees at regular intervals.
• Enough opportunity for career growth.
• Compensation is decided on the basis of competence or ability.
• Good performers are given financial incentives.
• Good performers are given more authority and responsibility.
• Employees participate in the decision-making process.
Table 8.83 further shows that the mean-ranks of the respondents possessing HR
Specialization is high and is 116.03, 124.03, 125.98, 127.05, 129.67 and 123.83
respectively for the statements:
• Our organization places the right person in the right job.
• Selection is on the basis of merit.
• Organizes training and skill development programs.
• Appraises the performance of employees at regular intervals.
• Enough opportunity for career growth.
• Compensation is decided on the basis of competence or ability.
Whereas, the mean-ranks of the respondents possessing Marketing Specialization is
high and is 123.97, 126.95 and 133.16 respectively for the statements:
• Good performers are given financial incentives.
• Good performers are given more authority and responsibility.
• Employees participate in the decision-making process.
The mean-ranks of the respondents possessing Operations Specialization is high and is
135.25 for the statement ‘Employees are rotated from one job to another’.
Thus, the owners/Managing heads who possess HR Specialization as their
educational background believes that the SMEs have sound Recruitment &
Selection methods, Organizes training and skill development programs for
employees (need-based), performance appraisal is done at regular intervals, there is
enough opportunity for career growth in SMEs as well as that compensation is
decided on the basis of competence/ ability.

Quantitative Data Analysis and Interpretation
©Ranjita Banerjee 204
The owners/Managing heads who possess Marketing Specialization as their
educational background believes that the SMEs have sound Motivational systems
related to giving financial incentives as well as authority and responsibility as well
as Employee Participation in the decision-making process.
The owners/Managing heads who possess Operations Specialization as their
educational background believes that the SMEs practice job-rotation of the
employees.
Thus, as the p-value of the above statements on HR Practice is less than 0.05, so we
reject the null hypothesis and conclude that there is a significant influence of
Specialization of educational qualification on HR Practice related to Recruitment &
Selection, Training & Skill development, Performance Appraisal, Career growth,
Compensation Management, job-rotation, Employee participation as well as
motivational aspects related to financial incentives and authority & responsibility.
For all the other statements whose p-value is more than 0.05, the specialization in
educational background of the respondents does not influence the HR practices in the
SME firms.

Quantitative Data Analysis and Interpretation
©Ranjita Banerjee 205
8.9.9. Kruskal-Wallis Test for Specialization in Education of Respondents and Employee Outcomes
Kruskal-Wallis Test was done to see if there is any influence of Specialization in
educational background of the respondents on Employee Outcomes.
The null and alternate hypothesis is framed as under:
H024: There is no significant influence of Specialization in education of respondents
on Employee Outcomes.
Ha24: There is a significant influence of Specialization in education of respondents on
Employee Outcomes.
TABLE 8.85 - Mean-Ranks: Kruskal-Wallis Test for Specialization in Education of Respondents and Employee Outcomes
Employee Outcomes Specialization N Mean Rank
Competence of an Employee
HR 47 110.28 MARKETING 38 116.93
FINANCE 47 113.26 OPERATIONS 18 88.94
ENGINEERING 40 100.09 OTHERS 25 102.13
Total 215
Employee’s co-operation with is satisfactory.
HR 47 109.61 MARKETING 38 113.83
FINANCE 47 112.54 OPERATIONS 18 110
ENGINEERING 40 103 OTHERS 25 89.1
Employees co-operate among themselves
HR 47 112.36 MARKETING 38 129.26
FINANCE 47 98.69 OPERATIONS 18 96.28
ENGINEERING 40 105.85 OTHERS 25 91.94
Employee’s general behavior is good HR 47 113.43
MARKETING 38 124.09

Quantitative Data Analysis and Interpretation
©Ranjita Banerjee 206
Employee Outcomes Specialization N Mean Rank FINANCE 47 100.03
OPERATIONS 18 101.56 ENGINEERING 40 102.4
OTHERS 25 97.21 Total 215
Employees are committed
HR 47 116.57 MARKETING 38 114.21
FINANCE 47 104.51 OPERATIONS 18 116.94
ENGINEERING 40 100.5 OTHERS 25 89.54
Employees are punctual and report daily
HR 47 104.59 MARKETING 38 109.76
FINANCE 47 99.01 OPERATIONS 18 121.08
ENGINEERING 40 113.11 OTHERS 25 106.71
Employees are regular
HR 47 114.07 MARKETING 38 107.36
FINANCE 47 107.63 OPERATIONS 18 118.53
ENGINEERING 40 93.94 OTHERS 25 108.94
Employees take up extra duties and responsibilities
HR 47 114.65 MARKETING 38 111
FINANCE 47 107.12 OPERATIONS 18 114.25
ENGINEERING 40 100.01 OTHERS 25 96.13
Employee’s follow general code of conduct and rules
HR 47 108.01 MARKETING 38 113.72
FINANCE 47 113.27 OPERATIONS 18 130.67
ENGINEERING 40 91.79 OTHERS 25 94.17
Total 215
(Source: SPSS Output; Primary data)

Quantitative Data Analysis and Interpretation
©Ranjita Banerjee 207
TABLE 8.86- Test Statisticsab: Kruskal-Wallis Test for Specialization in Education of Respondents and Employee Outcomes
Employee Outcomes Chi-Square df Asymp.
Sig. Competence of an Employee 5.947 5 0.311 Employee’s co-operation with is satisfactory. 4.524 5 0.477 Employees co-operate among themselves 10.044 5 0.074 Employee’s general behavior is good 6.319 5 0.276 Employees are committed 5.299 5 0.38 Employees are punctual and report daily 2.55 5 0.769 Employees are regular 3.616 5 0.606 Employees take up extra duties and responsibilities 2.8 5 0.731
Employee’s follow general code of conduct and rules 8.677 5 0.123
a. Kruskal Wallis Test b. Grouping Variable: Specialization (Source: SPSS Output; Primary data)
Interpretation
It can be seen from Table 8.86 that the p-value of none of the statements is less than
0.05. Thus, as the p-value of none of the statements on Employee Outcomes is less than
0.05, so we fail to reject the null hypothesis and conclude that there no significant
influence of Specialization in education of respondents on Employee Outcomes in
the SMEs.

Quantitative Data Analysis and Interpretation
©Ranjita Banerjee 208
8.9.10. Kruskal-Wallis Test for Specialization in Education of Respondents and Organizational Outcomes
Kruskal-Wallis Test was done to see if there is any influence of Specialization in
educational background of the respondents on Organizational Outcomes.
The null and alternate hypothesis is framed as under:
H025: There is no significant influence of Specialization in education of respondents
on Organizational Outcomes.
Ha25: There is a significant influence of Specialization in education of respondents on
Organizational Outcomes.
TABLE 8.87 - Mean-Ranks: Kruskal-Wallis Test for Specialization in Education of Respondents and Organizational Outcomes
Organizational Outcomes Specialization N Mean Rank
Customer satisfaction has increased
HR 47 113.43 MARKETING 39 108.78
FINANCE 47 116.27 OPERATIONS 18 126.75 ENGINEERING 40 97.64
OTHERS 24 78.71
Our suppliers/ vendors are satisfied with us.
HR 47 106.56 MARKETING 39 119.63
FINANCE 47 110.7 OPERATIONS 18 125.78
ENGINEERING 40 96.24 OTHERS 24 88.92
Measures have been taken by the firm for product/ service development
HR 47 118.62 MARKETING 39 127.41
FINANCE 47 106.26 OPERATIONS 18 129.22 ENGINEERING 40 92.38
OTHERS 24 65.56 Products/service Quality shows improvement
HR 47 116.39 MARKETING 39 114.8

Quantitative Data Analysis and Interpretation
©Ranjita Banerjee 209
Organizational Outcomes Specialization N Mean Rank
FINANCE 47 112.73 OPERATIONS 18 131.56 ENGINEERING 40 94.3
OTHERS 24 72.23 Total 215
The firm has displayed proper utilization of resources.
HR 47 120.31 MARKETING 39 107.71
FINANCE 47 110.5 OPERATIONS 18 142.78 ENGINEERING 40 92.18
OTHERS 24 75.29 Total 215
Average Number of defects of products / deficiencies in service shows a decrease
HR 47 117.27 MARKETING 39 100.45
FINANCE 47 98.06 OPERATIONS 18 136.42 ENGINEERING 40 112.8
OTHERS 24 87.5 Total 215
There is an increase in the Net Profit Margin.
HR 47 120.67 MARKETING 39 118.43
FINANCE 47 99.55 OPERATIONS 18 130.14 ENGINEERING 40 90.54
OTHERS 24 91.25 Total 215
Return on Investment (in %) has increased
HR 47 118.83 MARKETING 39 109.43
FINANCE 47 102.9 OPERATIONS 18 135.92
ENGINEERING 40 95.55 OTHERS 24 89.85
Total 215
(Source: SPSS Output; Primary data)

Quantitative Data Analysis and Interpretation
©Ranjita Banerjee 210
TABLE 8.88 - Test Statisticsab: Kruskal-Wallis Test for Specialization in Education of Respondents and Organizational Outcomes
Organizational Outcomes Chi-Square df Asymp. Sig. Customer satisfaction has increased 11.666 5 0.04 Our suppliers/ vendors are satisfied with us. 8.139 5 0.149 Measures have been taken by the firm for product/ service development 25.426 5 0
Products/service Quality shows improvement 17.378 5 0.004
The firm has displayed proper utilization of resources. 20.59 5 0.001
Average Number of defects of products / deficiencies in service shows a decrease 11.393 5 0.044
There is an increase in the Net Profit Margin. 13.069 5 0.023
Return on Investment (in %) has increased 10.617 5 0.06 a. Kruskal Wallis Test b. Grouping Variable: Specialization (Source: SPSS Output; Primary data)
Interpretation
It can be seen from Table 8.88 that the p-value of the following statements on
Organizational Outcomes are less than 0.05:
• Customer satisfaction has increased.
• Measures have been taken by the firm for product/ service development
• Products/service Quality shows improvement
• The firm has displayed proper utilization of resources.
• Average Number of defects of products / deficiencies in service shows a decrease
• There is an increase in the Net Profit Margin.
Table 8.87 further shows that the mean-ranks of the respondents possessing Operations
as their Specialization area is high and is 126.75, 129.22, 131.56, 142.78, 136.42 and
130.14 respectively for all the above statements.
Thus, the owners/Managing heads who possess Operations Specialization as their
educational background believes that the SMEs Customer satisfaction has
increased; Measures have been taken by the firm for product/ service development;

Quantitative Data Analysis and Interpretation
©Ranjita Banerjee 211
Products/service Quality shows improvement; the SMEs have displayed proper
utilization of resources; the average Number of defects of products / deficiencies in
services have decreased and that there is an increase in the Net Profit Margin, over
the last two years.
Thus, as the p-value of the above statements on Organizational Outcomes is less than
0.05, so we reject the null hypothesis and conclude that there is a significant
influence of Specialization of educational qualification on Organizational Outcomes
related to Customer satisfaction, Product/ service development, Products/service
Quality improvement; proper utilization of resources; reduction in the average
Number of defects of products / deficiencies in services and Net Profit Margin, over
the last two years.
For all the other statements whose p-value is more than 0.05, the specialization in
educational background of the respondents does not influence the Organizational
Outcomes in the SME firms.
8.9.11. Kruskal-Wallis Test for Type of Firm and HR Practices
Kruskal-Wallis Test was done to see if there is any effect of Type of Firm (i.e
Proprietary, Partnership firm, Private, Joint Stock Company, Private Ltd. or Public Ltd.)
on HR Practices.
The null and alternate hypothesis is framed as under:
H026: There is no significant effect of Type of Firm on HR Practices.
Ha26: There is a significant effect of Type of Firm on HR Practices.

Quantitative Data Analysis and Interpretation
©Ranjita Banerjee 212
TABLE 8.89 - Mean-Ranks: Kruskal-Wallis Test for Type of Firm and HR Practices
HR Practices Firm Type N Mean Rank
Our organization places the right person in the right job
PROPRIETORY 36 91.75 PARTNERSHIP 42 101.93
PRIVATE 47 106.74 JOINT-STOCK CO 4 99.5
PVT. LTD. 82 117.48 PUBLIC LTD. 4 147
Total 215
Selection is on the basis of merit
PROPRIETORY 36 90.07 PARTNERSHIP 42 108.9
PRIVATE 47 102.74 JOINT-STOCK CO 4 25
PVT. LTD. 82 120.24 PUBLIC LTD. 4 153.75
Total 215
Organizes training and skill development programs
PROPRIETORY 36 86.99 PARTNERSHIP 42 115.75
PRIVATE 47 83.85 JOINT-STOCK CO 4 121.5
PVT. LTD. 82 123.99 PUBLIC LTD. 4 158.25
Total 215
Employees are rotated from one job to another
PROPRIETORY 36 107.24 PARTNERSHIP 42 103.76
PRIVATE 47 105.02 JOINT-STOCK CO 4 47.25
PVT. LTD. 82 115.12 PUBLIC LTD. 4 109.25
Total 215
Appraises the performance of employees at regular intervals.
PROPRIETORY 36 96.65 PARTNERSHIP 42 98.73
PRIVATE 47 102.19 JOINT-STOCK CO 4 191
PVT. LTD. 82 115.34
PUBLIC LTD. 4
142.25

Quantitative Data Analysis and Interpretation
©Ranjita Banerjee 213
HR Practices Firm Type N Mean Rank
Employees receive feedback
PROPRIETORY 36 93.96 PARTNERSHIP 42 106.85
PRIVATE 47 96.81 JOINT-STOCK CO 4 66.25
PVT. LTD. 82 120.91 PUBLIC LTD. 4 155
Total 215
Enough opportunity for career growth
PROPRIETORY 36 82.36 PARTNERSHIP 42 110.76
PRIVATE 47 105.88 JOINT-STOCK CO 4 19.75
PVT. LTD. 82 121.58 PUBLIC LTD. 4 144.5
Total 215
Compensation is decided on the basis of competence or ability
PROPRIETORY 36 94.86 PARTNERSHIP 42 87.14
PRIVATE 47 105.94 JOINT-STOCK CO 4 143.25
PVT. LTD. 82 122.2 PUBLIC LTD. 4 143.25
Total 215
Good performers are given financial incentives
PROPRIETORY 36 85.57 PARTNERSHIP 42 105.17
PRIVATE 47 103.35 JOINT-STOCK CO 4 100
PVT. LTD. 82 120.78 PUBLIC LTD. 4 140.25
Total 215
Good performers are given non-financial incentives.
PROPRIETORY 36 116.61 PARTNERSHIP 42 101.5
PRIVATE 47 105.98 JOINT-STOCK CO 4 109
PVT. LTD. 82 107.65 PUBLIC LTD. 4 128.75
Total 215
Good performers are given more authority and responsibility.
PROPRIETORY 36 88.69 PARTNERSHIP 42 116.43
PRIVATE 47 87.17

Quantitative Data Analysis and Interpretation
©Ranjita Banerjee 214
HR Practices Firm Type N Mean Rank JOINT-STOCK CO 4 58
PVT. LTD. 82 124.6 PUBLIC LTD. 4 147.75
Total 215
Employees participate in the decision-making process.
PROPRIETORY 36 95.64 PARTNERSHIP 42 124.67
PRIVATE 47 109.38 JOINT-STOCK CO 4 5.5
PVT. LTD. 82 110.13 PUBLIC LTD. 4 86.75
Total 215
Employees are given opportunity to suggest improvement
PROPRIETORY 36 87.94 PARTNERSHIP 42 136.89
PRIVATE 47 97.33 JOINT-STOCK CO 4 9.75
PVT. LTD. 82 111 PUBLIC LTD. 4 147.25
Total 215
Employees can openly communicate with the superiors
PROPRIETORY 36 85.61 PARTNERSHIP 42 127.87
PRIVATE 47 95.41 JOINT-STOCK CO 4 141
PVT. LTD. 82 111.65 PUBLIC LTD. 4 141
Total 215
(Source: SPSS output; Primary data)
TABLE 8.90 - Test Statisticsab: Kruskal-Wallis Test for Type of Firm and HR Practices
HR Practices Chi-Square df Asymp. Sig.
Our organization places the right person in the right job 9.942 5 0.077
Selection is on the basis of merit 23.595 5 0
Organizes training and skill development programs 23.12 5 0
Employees are rotated from one job to another 6.087 5 0.298

Quantitative Data Analysis and Interpretation
©Ranjita Banerjee 215
HR Practices Chi-Square df Asymp. Sig. Appraises the performance of employees at regular intervals. 17.807 5 0.003
Employees receive feedback 16.591 5 0.005 Enough opportunity for career growth 22.791 5 0 Compensation is decided on the basis of competence or ability 20.541 5 0.001
Good performers are given financial incentives 10.873 5 0.054 Good performers are given non-financial incentives. 1.761 5 0.881 Good performers are given more authority and responsibility. 25.031 5 0
Employees participate in the decision-making process. 17.961 5 0.003
Employees are given opportunity to suggest improvement 38.584 5 0
Employees can openly communicate with the superiors 20.283 5 0.001
a. Kruskal Wallis Test b. Grouping Variable: Firm Type
Interpretation
It can be seen from Table 8.90 that the p-value of the following statements on HR
Practices are less than 0.05: ‘Selection is on the basis of merit’, ‘Organizes training and
skill development programs’, ‘Appraises the performance of employees at regular
intervals’, ‘Employees receive feedback’, ‘There is enough opportunity for career
growth’, ‘Compensation is decided on the basis of competence or ability’, ‘Good
performers are given more authority and responsibility’, ‘Employees participate in the
decision-making process’, ‘Employees are given opportunity to suggest improvement’
and ‘Employees can openly communicate with the superiors’.
Table 8.89 shows that the mean-ranks of Public Ltd. Companies is high and is 153.75,
158.25, 155, 144.5, 147.75 and 147.25 respectively for the HR Practices related to
Selection Method, Training & Skill development Program, Feedback mechanism,
Opportunities for career growth, Delegation of power as well as opportunities for
giving suggestions for improvement.

Quantitative Data Analysis and Interpretation
©Ranjita Banerjee 216
Table 8.89 further shows that the mean-ranks of Joint-stock Companies is high and is
191 and 144.5 respectively for the HR Practices related to Performance Appraisal
and Compensation decision based on competence and ability; whereas the mean-
rank is high and is 124.67 for the Partnership firms for the HR practice related to
employee participation in the decision-making process. The mean-rank is high and
is 141 for the HR practice related to open-communication with superiors for the
Public Ltd. Companies as well as the joint-stock companies.
Thus, as the p-value of all the above statements on HR Practices is less than 0.05, so we
reject the null hypothesis and conclude that there is a significant influence of type of
firm on HR Practices.
For all the other statements whose p-value is more than 0.05, the type of firm does not
influence the HR Practices in the SME firms.
8.9.12. Kruskal-Wallis Test for Type of Firm and Employee Outcomes
Kruskal-Wallis Test was done to see if there is any effect of Type of Firm (i.e
Proprietary, Partnership firm, Private, Joint Stock Company, Private Ltd. or Public Ltd.)
on Employee Outcomes.
The null and alternate hypothesis is framed as under:
H027: There is no significant effect of Type of Firm on Employee Outcomes.
Ha27: There is a significant effect of Type of Firm on Employee Outcomes.
TABLE 8.91 - Mean-Ranks: Kruskal-Wallis Test for Type of Firm and Employee Outcomes
Employee Outcomes Firm Type N Mean Rank
Competence of an Employee
PROPRIETORY 36 103.75 PARTNERSHIP 42 105.64
PRIVATE 47 102.41 JOINT-STOCK CO 4 79.5

Quantitative Data Analysis and Interpretation
©Ranjita Banerjee 217
Employee Outcomes Firm Type N Mean Rank PVT. LTD. 82 112.77
PUBLIC LTD. 4 167.25
Total 215
Employee’s co-operation with is satisfactory.
PROPRIETORY 36 92.9 PARTNERSHIP 42 99.63
PRIVATE 47 113.62 JOINT-STOCK CO 4 154.5
PVT. LTD. 82 111.16 PUBLIC LTD. 4 154.5
Total 215
Employees co-operate among themselves
PROPRIETORY 36 97.25 PARTNERSHIP 42 114.76
PRIVATE 47 102.8 JOINT-STOCK CO 4 109.5
PVT. LTD. 82 108.12 PUBLIC LTD. 4 191
Total 215
Employee’s general behavior is good
PROPRIETORY 36 93.42 PARTNERSHIP 42 115.36
PRIVATE 47 101.74 JOINT-STOCK CO 4 119
PVT. LTD. 82 111.2 PUBLIC LTD. 4 159
Total 215
Employees are committed
PROPRIETORY 36 86.19 PARTNERSHIP 42 109.68
PRIVATE 47 102.06 JOINT-STOCK CO 4 194.5
PVT. LTD. 82 111.68 PUBLIC LTD. 4 194.5
Total 215
Employees are punctual and report daily
PROPRIETORY 36 84.17 PARTNERSHIP 42 109.77
PRIVATE 47 112.69 JOINT-STOCK CO 4 101.5
PVT. LTD. 82 112.02 PUBLIC LTD. 4 172.75
Total 215

Quantitative Data Analysis and Interpretation
©Ranjita Banerjee 218
Employee Outcomes Firm Type N Mean Rank
Employees are regular
PROPRIETORY 36 79.9 PARTNERSHIP 42 121.27
PRIVATE 47 97.63 JOINT-STOCK CO 4 139
PVT. LTD. 82 114.84 PUBLIC LTD. 4 172.25
Total 215
Employees take up extra duties and responsibilities
PROPRIETORY 36 78.97 PARTNERSHIP 42 103.15
PRIVATE 47 104.7 JOINT-STOCK CO 4 126.5
PVT. LTD. 82 119.77 PUBLIC LTD. 4 199
Total 215
Employee’s follow general code of conduct and rules
PROPRIETORY 36 71.17 PARTNERSHIP 42 102.65
PRIVATE 47 109.04 JOINT-STOCK CO 4 118
PVT. LTD. 82 121.48 PUBLIC LTD. 4 197
Total 215
(Source: SPSS output; Primary data)
TABLE 8.92 - Test Statisticsab: Kruskal-Wallis Test for Type of Firm and Employee Outcomes
Employee Outcomes Chi-Square Df Asymp. Sig. Competence of an Employee 8.835 5 0.116
Employee’s co-operation with Mgt. is satisfactory. 11.546 5 0.042
Employees co-operate among themselves 11.201 5 0.048 Employee’s general behavior is good 7.779 5 0.169 Employees are committed 24.182 5 0 Employees are punctual and report daily 11.759 5 0.038 Employees are regular 20.08 5 0.001
Employees take up extra duties and responsibilities 23.786 5 0
Employee’s follow general code of conduct and rules 30.996 5 0
a. Kruskal Wallis Testb. Grouping Variable: Firm Type; (Source: SPSS output; Primary data)

Quantitative Data Analysis and Interpretation
©Ranjita Banerjee 219
Interpretation
It can be seen from Table 8.92 that the p-value of the following statements on Employee
Outcomes are less than 0.05: ‘Employee’s co-operation with Management/Head is
satisfactory’, ‘Employees co-operate among themselves’, ‘Employees are committed’,
‘Employees are punctual and report daily for work on time’, ‘Employees are regular’,
‘Employees take up extra duties and responsibilities when need arises’ and ‘Employee’s
follow general code of conduct and rules’.
Table 8.91 shows that the mean-ranks of Public Ltd. Companies is high and is 191,
194.5, 172.25, 199 and 197 respectively, for the Employee Outcomes related to
Employee’s co-operation among themselves, Employee Commitment, Regularity of
employees, Employee involvement as well as Conformance to rules and regulations.
Table 1 further shows that the mean-ranks of both, Public Ltd. as well as Joint-stock
Companies is high and is 154.5 and 172.75 respectively, for the Employee Outcomes
related to Employee’s co-operation with Management/Head as well as Punctuality of
employees.
Thus, as the p-value of all the above statements on Employee Outcomes is less than
0.05, so we reject the null hypothesis and conclude that there is a significant
influence of type of firm on Employee Outcomes.
For all the other statements whose p-value is more than 0.05, the type of firm does not
influence the Employee Outcomes in the SME firms.

Quantitative Data Analysis and Interpretation
©Ranjita Banerjee 220
8.9.13. Kruskal-Wallis Test for Type of Firm and Organizational Outcomes
Kruskal-Wallis Test was done to see if there is any effect of Type of Firm (i.e
Proprietary, Partnership firm, Private, Joint Stock Company, Private Ltd. or Public Ltd.)
on Organizational Outcomes.
The null and alternate hypothesis is framed as under:
H028: There is no significant effect of Type of Firm on Organizational Outcomes.
Ha28: There is a significant effect of Type of Firm on Organizational Outcomes.
TABLE 8.93 - Mean-Ranks: Kruskal-Wallis Test for Type of Firm and Organizational Outcomes
Organizational Outcomes Firm Type N Mean Rank
Customer satisfaction has increased
PROPRIETORY 36 80.83 PARTNERSHIP 42 101.88
PRIVATE 47 118.88 JOINT-STOCK CO 4 181.5
PVT. LTD. 82 109.65 PUBLIC LTD. 4 181.5
Total 215
Our suppliers/ vendors are satisfied with us.
PROPRIETORY 36 91.06 PARTNERSHIP 42 98.45
PRIVATE 47 111.22 JOINT-STOCK CO 4 137.5
PVT. LTD. 82 113.41 PUBLIC LTD. 4 182.5
Total 215
Measures have been taken by the firm for product/ service development
PROPRIETORY 36 68 PARTNERSHIP 42 85.07
PRIVATE 47 110.67 JOINT-STOCK CO 4 128
PVT. LTD. 82 131.55
PUBLIC LTD. 4 174.5
Products/service Quality shows improvement
PROPRIETORY 36 73.53 PARTNERSHIP 42 104.42

Quantitative Data Analysis and Interpretation
©Ranjita Banerjee 221
Organizational Outcomes Firm Type N Mean Rank PRIVATE 47 107.23
JOINT-STOCK CO 4 176 PVT. LTD. 82 118.77
PUBLIC LTD. 4 176 Total 215
The firm has displayed proper utilization of resources.
PROPRIETORY 36 78.4 PARTNERSHIP 42 80.62
PRIVATE 47 122.8 JOINT-STOCK CO 4 137
PVT. LTD. 82 121.51 PUBLIC LTD. 4 182
Average Number of defects of products / deficiencies in service shows a decrease
PROPRIETORY 36 82.54 PARTNERSHIP 42 98.56
PRIVATE 47 121.84 JOINT-STOCK CO 4 64.25
PVT. LTD. 82 114.36 PUBLIC LTD. 4 187
Total 215
There is an increase in the Net Profit Margin.
PROPRIETORY 36 96.79 PARTNERSHIP 42 100.87
PRIVATE 47 99.5 JOINT-STOCK CO 4 199.5
PVT. LTD. 82 116.18 PUBLIC LTD. 4 124.5
Total 215
Return on Investment (in %) has increased
PROPRIETORY 36 99.29 PARTNERSHIP 42 105.43
PRIVATE 47 99.53 JOINT-STOCK CO 4 199
PVT. LTD. 82 112.75 PUBLIC LTD. 4 124.5
Total 215

Quantitative Data Analysis and Interpretation
©Ranjita Banerjee 222
TABLE 8.94 - Test Statisticsab: Kruskal-Wallis Test for Type of Firm and Organizational Outcomes
Organizational Outcomes Chi-Square Df Asymp. Sig. Customer satisfaction has increased 24.879 5 0 Our suppliers/ vendors are satisfied with us. 13.498 5 0.019 Measures have been taken by the firm for product/ service development 45.126 5 0
Products/service Quality shows improvement 28.481 5 0
The firm has displayed proper utilization of resources. 35.682 5 0
Average Number of defects of products / deficiencies in service shows a decrease 22.337 5 0
There is an increase in the Net Profit Margin. 15.153 5 0.01
Return on Investment (in %) has increased 12.771 5 0.026 a. Kruskal Wallis Testb. Grouping Variable: Firm Type
Interpretation
It can be seen from Table 8.94 that the p-value of all the statements on Organizational
Outcomes are less than 0.05:
• Customer satisfaction has increased.
• Our suppliers/ vendors are satisfied with us.
• Measures have been taken by the firm for product/ service development
• Products/service Quality shows improvement
• The firm has displayed proper utilization of resources.
• Average Number of defects of products / deficiencies in service shows a decrease
• There is an increase in the Net Profit Margin.
• Return on Investment (in %) has increased
Table 8.93 shows that the mean-ranks of the Public Limited Companies is high and is
182.5, 174.5, 182 and 187 respectively for the Organizational Outcomes related to
Suppliers/ vendors satisfaction, Product/ service development, Proper utilization of
resources and decrease in the average Number of defects of products / deficiencies

Quantitative Data Analysis and Interpretation
©Ranjita Banerjee 223
in service. Thus, the owners/Managing heads in Public Ltd. SMEs believes that the
above mentioned outcomes have improved in their firms.
Table 8.93 further shows that the mean-ranks of the Joint-Stock SME firms is high and
is 199.5 and 199 respectively for the Organizational Outcomes related to Net Profit
Margin and Organizational Outcomes. It is to also note that the mean-ranks of both,
the Public Ltd. as well as Joint-stock SME firms is high and is 181.5 and 176 for the
Organizational Outcomes related to Customer Satisfaction and Product/ Service
Quality improvement.
Thus, as the p-value of the all the statements on Organizational Outcomes is less than
0.05, so we reject the null hypothesis and conclude that there is a significant
influence of Type of firm on all the Organizational Outcomes. The Public Ltd. as well
as Joint-stock SME firms have a significant influence on the Organizational
Outcomes.
8.9.14. Kruskal-Wallis Test for Age of the Firm and HR Practices
Kruskal-Wallis Test was done to see if there is any effect of Age of the Firm (i.e Age of
the firm was captured in 2-5 years, 6-10 years, 11-15 years, 16-20 years or more than 20)
on HR Practices.
The null and alternate hypothesis is framed as under:
H029: There is no significant effect of Age of Firm on HR Practices.
Ha29: There is a significant effect of Age of Firm on HR Practices.
TABLE 8.95 - Mean-Ranks: K-Wallis Test for Age of the Firm and HR Practices
HR Practices Age of the Firm N Mean Rank Our organization places the right person in the right job
2-5 YRS 8 99 6-10 YRS 23 92.87
11-15 YRS 37 85.23 16-20 YRS 50 128.3
MORE THAN 20 YRS 97 110.55

Quantitative Data Analysis and Interpretation
©Ranjita Banerjee 224
HR Practices Age of the Firm N Mean Rank Selection is on the basis of merit
2-5 YRS 8 108.5 6-10 YRS 23 82.39
11-15 YRS 37 79.28 16-20 YRS 50 116.61
MORE THAN 20 YRS 97 120.55 Total 215
Organizes training and skill development programs
2-5 YRS 8 79.63 6-10 YRS 23 115.63
11-15 YRS 37 94.55 16-20 YRS 50 112.86
MORE THAN 20 YRS 97 111.15 Total 215
Employees are rotated from one job to another
2-5 YRS 8 117.5 6-10 YRS 23 112.37
11-15 YRS 37 89.81 16-20 YRS 50 111.64
MORE THAN 20 YRS 97 111.24 Appraises the performance of employees at regular intervals.
2-5 YRS 8 117.88 6-10 YRS 23 92.74
11-15 YRS 37 93.73 16-20 YRS 50 105.92
MORE THAN 20 YRS 97 117.32 Total 215
Employees receive feedback 2-5 YRS 8 132.5 6-10 YRS 23 94.24
11-15 YRS 37 85.07 16-20 YRS 50 104.55
MORE THAN 20 YRS 97 119.77 Total 215
Enough opportunity for career growth
2-5 YRS 8 165 6-10 YRS 23 73.83
11-15 YRS 37 102.58 16-20 YRS 50 103.63
MORE THAN 20 YRS 97 115.72 Compensation is decided on the basis of competence or ability
2-5 YRS 8 118.63 6-10 YRS 23 91.35
11-15 YRS 37 109.41 16-20 YRS 50 104.16
MORE THAN 20 YRS 97 112.52

Quantitative Data Analysis and Interpretation
©Ranjita Banerjee 225
HR Practices Age of the Firm N Mean Rank Good performers are given financial incentives
2-5 YRS 8 140.25 6-10 YRS 23 87.33
11-15 YRS 37 108.36 16-20 YRS 50 103.49
MORE THAN 20 YRS 97 112.43 Total 215
Good performers are given non-financial incentives.
2-5 YRS 8 94.63 6-10 YRS 23 134.37
11-15 YRS 37 100.14 16-20 YRS 50 112.49
MORE THAN 20 YRS 97 103.54 Good performers are given more authority and responsibility.
2-5 YRS 8 125.88 6-10 YRS 23 71.43
11-15 YRS 37 109.62 16-20 YRS 50 98.92
MORE THAN 20 YRS 97 119.26 Total 215
Employees participate in the decision-making process.
2-5 YRS 8 139.88 6-10 YRS 23 103.65
11-15 YRS 37 104.69 16-20 YRS 50 111.2
MORE THAN 20 YRS 97 106.02 Total 215
Employees are given opportunity to suggest improvement
2-5 YRS 8 147.25 6-10 YRS 23 114.5
11-15 YRS 37 88.05 16-20 YRS 50 90.19
MORE THAN 20 YRS 97 120.01 Total 215
Employees can openly communicate with the superiors
2-5 YRS 8 141 6-10 YRS 23 103.07
11-15 YRS 37 95.55 16-20 YRS 50 95.35
MORE THAN 20 YRS 97 117.72 Total 215
(Source: SPSS output; Primary data)

Quantitative Data Analysis and Interpretation
©Ranjita Banerjee 226
TABLE 8.96 - Test Statisticsab: Kruskal-Wallis Test for Age of the Firm and HR Practices
HR Practices Chi-Square Df Asymp. Sig. Our organization places the right person in the right job 18.527 4 0.001
Selection is on the basis of merit 24.93 4 0 Organizes training and skill development programs 4.949 4 0.293
Employees are rotated from one job to another 4.566 4 0.335
Appraises the performance of employees at regular intervals. 8.544 4 0.074
Employees receive feedback 16.637 4 0.002 Enough opportunity for career growth 18.245 4 0.001 Compensation is decided on the basis of competence or ability 4.044 4 0.4
Good performers are given financial incentives 6.147 4 0.188
Good performers are given non-financial incentives. 6.261 4 0.18
Good performers are given more authority and responsibility. 16.473 4 0.002
Employees participate in the decision-making process. 2.882 4 0.578
Employees are given opportunity to suggest improvement 22.238 4 0
Employees can openly communicate with the superiors 12.576 4 0.014
a. Kruskal Wallis Testb. Grouping Variable: Age of the Firm
Interpretation
It can be seen from Table 8.96 that the p-value of the following statements on HR
Practices are less than 0.05: ‘Our organization places the right person in the right job’,
‘Selection is on the basis of merit’, ‘Employees receive feedback’, ‘There is enough
opportunity for career growth’, ‘Good performers are given more authority and
responsibility’, ‘Employees are given opportunity to suggest improvement’ and
‘Employees can openly communicate with the superiors’.

Quantitative Data Analysis and Interpretation
©Ranjita Banerjee 227
Table 8.95 shows that the mean-ranks of SME firms which are 2-5 years old is high
and is 132.5, 165, 125.88, 147.25 and 141 respectively, for the HR Practices related
to Feedback mechanism, Opportunities for career growth, Delegation of power wr.t
authority and responsibility, opportunities for giving suggestions for improvement
as well as for an Open-Communication system.
Table 8.95 further shows that the mean-ranks of SME firms which are 16-20 years old
is high and is 128.3 for the HR Practice related to Human Resource Planning i.e
placing the right person in the right job. Whereas the mean-rank is high and is
120.55 for the firms which are more than 20 years old for the HR practice related to
Selection Method i.e Selection on the basis of merit.
Thus, as the p-value of all the above statements on HR Practices is less than 0.05, so we
reject the null hypothesis and conclude that there is a significant influence of age of
the firm on HR Practices.
For all the other statements whose p-value is more than 0.05, the age of firm does not
influence the HR Practices in the SME firms.
8.9.15. Kruskal-Wallis Test for Age of the Firm and Employee Outcomes
Kruskal-Wallis Test was done to see if there is any effect of Age of the Firm (i.e Age of
the firm was captured in 2-5 years, 6-10 years, 11-15 years, 16-20 years or more than 20)
on Employee Outcomes.
The null and alternate hypothesis is framed as under:
H030: There is no significant effect of Age of Firm on Employee Outcomes.
Ha30: There is a significant effect of Age of Firm on Employee Outcomes.

Quantitative Data Analysis and Interpretation
©Ranjita Banerjee 228
TABLE 8.97 - Mean-Ranks: Kruskal-Wallis Test for Age of the Firm and Employee Outcomes
Employee Outcomes Age of the Firm N Mean Rank
Competence of an Employee
2-5 YRS 8 79.5 6-10 YRS 23 102.43
11-15 YRS 37 100 16-20 YRS 50 111.38
MORE THAN 20 YRS 97 112.98 Total 215
Employee’s co-operation with is satisfactory.
2-5 YRS 8 67.75 6-10 YRS 23 98.04
11-15 YRS 37 105.73 16-20 YRS 50 109.5
MORE THAN 20 YRS 97 113.77
Total 215
Employees co-operate among themselves
2-5 YRS 8 86.5 6-10 YRS 23 107.52
11-15 YRS 37 114.59 16-20 YRS 50 99.88
MORE THAN 20 YRS 97 111.56
Employee’s general behavior is good
2-5 YRS 8 97.38 6-10 YRS 23 102.48
11-15 YRS 37 104.27 16-20 YRS 50 97.83
MORE THAN 20 YRS 97 116.85
Employees are committed
2-5 YRS 8 99.88 6-10 YRS 23 112.83
11-15 YRS 37 92.89 16-20 YRS 50 109.2
MORE THAN 20 YRS 97 112.67
Employees are punctual and report daily
2-5 YRS 8 101.5 6-10 YRS 23 89.28
11-15 YRS 37 89.39 16-20 YRS 50 104.25
MORE THAN 20 YRS 97 122.01 Total 215
Employees are regular 2-5 YRS 8 97.5 6-10 YRS 23 99.65

Quantitative Data Analysis and Interpretation
©Ranjita Banerjee 229
Employee Outcomes Age of the Firm N Mean Rank 11-15 YRS 37 112.76 16-20 YRS 50 101.35
MORE THAN 20 YRS 97 112.46 Total 215
Employees take up extra duties and responsibilities
2-5 YRS 8 124.88 6-10 YRS 23 114.13
11-15 YRS 37 106.95 16-20 YRS 50 104.89
MORE THAN 20 YRS 97 107.16 Total 215
Employee’s follow general code of conduct and rules
2-5 YRS 8 117.5 6-10 YRS 23 100.39
11-15 YRS 37 96.36 16-20 YRS 50 108.15
MORE THAN 20 YRS 97 113.38 Total 215
(Source: SPSS output; Primary data)
TABLE 8.98 - Test Statisticsab: Kruskal-Wallis Test for Age of the Firm and Employee Outcomes
Employee Outcomes Chi-Square Df Asymp. Sig.
Competence of an Employee 5.157 4 0.272 Employee’s co-operation with is satisfactory. 7.051 4 0.133 Employees co-operate among themselves 3.155 4 0.532 Employee’s general behavior is good 4.93 4 0.295 Employees are committed 3.542 4 0.472 Employees are punctual and report daily 12.07 4 0.017 Employees are regular 2.303 4 0.68 Employees take up extra duties and responsibilities 1.144 4 0.887 Employee’s follow general code of conduct and rules 3.152 4 0.533 a. Kruskal Wallis Test b. Grouping Variable: Age of the Firm
Interpretation
It can be seen from Table 8.98 that the p-value of the following statement on Employee
Outcomes is less than 0.05: ‘Employees are punctual and report daily for work on
time’. Table 8.97 shows that the mean-rank of firms which are more than 20 years

Quantitative Data Analysis and Interpretation
©Ranjita Banerjee 230
old is high and is 122.01 for the Employee Outcome related to Punctuality of
employees. Thus, as the p-value of the statement on Employee Outcome is less than
0.05, so we reject the null hypothesis and conclude that there is a significant
influence of type of firm on Employee Outcome related to Punctuality of employees.
For all the other statements whose p-value is more than 0.05, the type of firm does not
influence the Employee Outcomes in the SME firms.
8.9.16. Kruskal-Wallis Test for Age of the Firm and Organizational Outcomes
Kruskal-Wallis Test was done to see if there is any effect of Age of the Firm (i.e Age of
the firm was captured in 2-5 years, 6-10 years, 11-15 years, 16-20 years or more than 20)
on Organizational Outcomes.
The null and alternate hypothesis is framed as under:
H031: There is no significant effect of Age of Firm on Organizational Outcomes.
Ha31: There is a significant effect of Age of Firm on Organizational Outcomes.
TABLE 8.99 - Mean-Ranks: Kruskal-Wallis Test for Age of the Firm and Organizational Outcomes
Organizational Outcomes Age of the Firm N Mean Rank
Customer satisfaction has increased
2-5 YRS 8 135 6-10 YRS 23 99.33 11-15 YRS 37 93.04 16-20 YRS 50 109.02
MORE THAN 20 YRS 97 113.01 Total 215
Our suppliers/ vendors are satisfied with us.
2-5 YRS 8 119 6-10 YRS 23 87.02 11-15 YRS 37 97.96 16-20 YRS 50 112.1
MORE THAN 20 YRS 97 113.78 Total 215
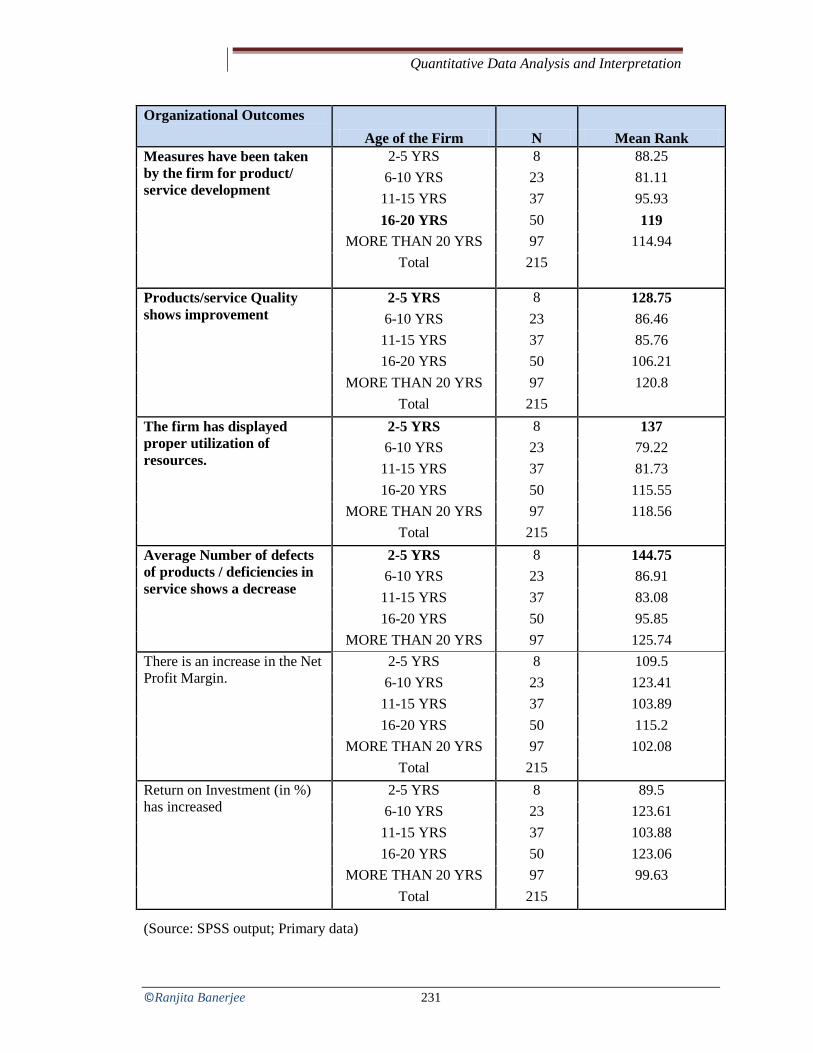
Quantitative Data Analysis and Interpretation
©Ranjita Banerjee 231
Organizational Outcomes Age of the Firm N Mean Rank
Measures have been taken by the firm for product/ service development
2-5 YRS 8 88.25 6-10 YRS 23 81.11 11-15 YRS 37 95.93 16-20 YRS 50 119
MORE THAN 20 YRS 97 114.94 Total 215
Products/service Quality shows improvement
2-5 YRS 8 128.75 6-10 YRS 23 86.46 11-15 YRS 37 85.76 16-20 YRS 50 106.21
MORE THAN 20 YRS 97 120.8 Total 215
The firm has displayed proper utilization of resources.
2-5 YRS 8 137 6-10 YRS 23 79.22 11-15 YRS 37 81.73 16-20 YRS 50 115.55
MORE THAN 20 YRS 97 118.56 Total 215
Average Number of defects of products / deficiencies in service shows a decrease
2-5 YRS 8 144.75 6-10 YRS 23 86.91 11-15 YRS 37 83.08 16-20 YRS 50 95.85
MORE THAN 20 YRS 97 125.74 There is an increase in the Net Profit Margin.
2-5 YRS 8 109.5 6-10 YRS 23 123.41 11-15 YRS 37 103.89 16-20 YRS 50 115.2
MORE THAN 20 YRS 97 102.08 Total 215
Return on Investment (in %) has increased
2-5 YRS 8 89.5 6-10 YRS 23 123.61 11-15 YRS 37 103.88 16-20 YRS 50 123.06
MORE THAN 20 YRS 97 99.63 Total 215
(Source: SPSS output; Primary data)

Quantitative Data Analysis and Interpretation
©Ranjita Banerjee 232
TABLE 8.100 - Test Statisticsab: Kruskal-Wallis Test for Age of the Firm and Organizational Outcomes
a. Kruskal Wallis Test b. Grouping Variable: Age of the Firm
Interpretation
It can be seen from Table 8.100 that the p-value of the following statements on
Organizational Outcomes are less than 0.05:
• Measures have been taken by the firm for product/ service development
• Products/service Quality shows improvement
• The firm has displayed proper utilization of resources.
• Average Number of defects of products / deficiencies in service shows a decrease
Table 8.99 shows that the mean-ranks of the firms which are 2-5 years old is high and
is 128.75, 137 and 144.75 respectively, for the Organizational Outcomes related to
Product/ Service Quality improvement, Proper utilization of resources and decrease
in the average Number of defects of products / deficiencies in service. Thus, the
owners/Managing heads in the SME firms which are 2-5 years old believes that the
above mentioned outcomes have improved in their firms.
Organizational Outcomes Chi-Square df Asymp. Sig. Customer satisfaction has increased 5.911 4 0.206 Our suppliers/ vendors are satisfied with us. 5.971 4 0.201 Measures have been taken by the firm for product/ service development 11.176 4 0.025
Products/service Quality shows improvement 15.369 4 0.004 The firm has displayed proper utilization of resources. 20.421 4 0
Average Number of defects of products / deficiencies in service shows a decrease 25.405 4 0
There is an increase in the Net Profit Margin. 3.659 4 0.454 Return on Investment (in %) has increased 8.154 4 0.086

Quantitative Data Analysis and Interpretation
©Ranjita Banerjee 233
Table 1 further shows that the mean-rank of the SME firms which are 16-20 years old
is high and is 119 for the Organizational Outcome related to Product/ service
development.
Thus, as the p-value of the above mentioned statements on Organizational Outcomes is
less than 0.05, so we reject the null hypothesis and conclude that there is a significant
influence of Age of firm on the Organizational Outcomes related to Product/ Service
Development, Product/ service Quality improvement, Proper utilization of resources
and decrease in the average Number of defects of products / deficiencies in service.
For all the other statements whose p value is more than 0.05, the age of the firm does not
affect the Organizational Outcomes.
8.9.17. Kruskal-Wallis Test for Nature of the Industry and HR Practices
Kruskal-Wallis Test was done to see if there is any effect of Nature of the industry (i.e
Engineering, Chemicals, Pharmaceuticals, Locomotives, Electricals, Others) on HR
Practices.
The null and alternate hypothesis is framed as under:
H032: There is no significant effect of Nature of the Industry on HR Practices.
Ha32: There is a significant effect of Nature of the Industry on HR Practices.
TABLE 8.101 - Mean-Ranks: Kruskal-Wallis Test for Nature of the Industry and HR Practices
HR Practices Nature of Industry N Mean Rank Our organization places the right person in the right job
ENGINEERING 121 107.01 CHEMICALS 1 15.5
PHARMACEUTICALS 7 141.93 LOCOMOTIVES 2 99 ELECTRICAL 7 167.57
OTHERS 77 102.49 Total 215
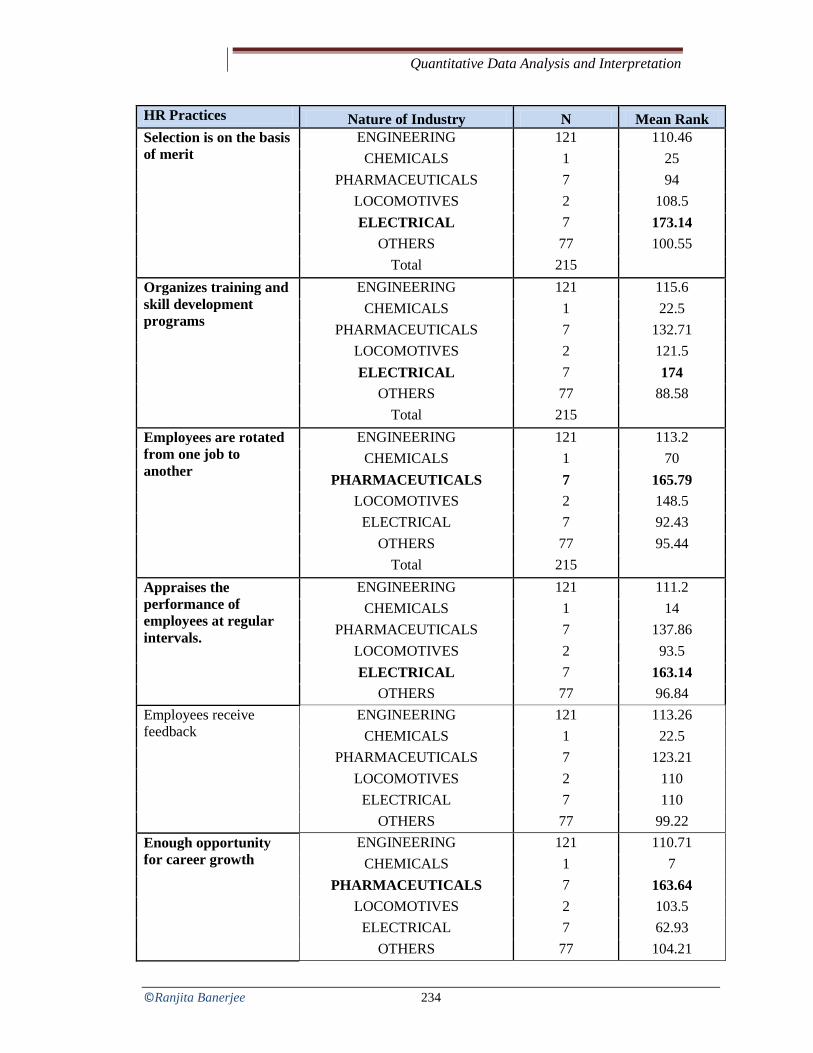
Quantitative Data Analysis and Interpretation
©Ranjita Banerjee 234
HR Practices Nature of Industry N Mean Rank Selection is on the basis of merit
ENGINEERING 121 110.46 CHEMICALS 1 25
PHARMACEUTICALS 7 94 LOCOMOTIVES 2 108.5 ELECTRICAL 7 173.14
OTHERS 77 100.55 Total 215
Organizes training and skill development programs
ENGINEERING 121 115.6 CHEMICALS 1 22.5
PHARMACEUTICALS 7 132.71 LOCOMOTIVES 2 121.5 ELECTRICAL 7 174
OTHERS 77 88.58 Total 215
Employees are rotated from one job to another
ENGINEERING 121 113.2 CHEMICALS 1 70
PHARMACEUTICALS 7 165.79 LOCOMOTIVES 2 148.5
ELECTRICAL 7 92.43 OTHERS 77 95.44
Total 215 Appraises the performance of employees at regular intervals.
ENGINEERING 121 111.2 CHEMICALS 1 14
PHARMACEUTICALS 7 137.86 LOCOMOTIVES 2 93.5 ELECTRICAL 7 163.14
OTHERS 77 96.84 Employees receive feedback
ENGINEERING 121 113.26 CHEMICALS 1 22.5
PHARMACEUTICALS 7 123.21 LOCOMOTIVES 2 110
ELECTRICAL 7 110 OTHERS 77 99.22
Enough opportunity for career growth
ENGINEERING 121 110.71 CHEMICALS 1 7
PHARMACEUTICALS 7 163.64 LOCOMOTIVES 2 103.5
ELECTRICAL 7 62.93 OTHERS 77 104.21

Quantitative Data Analysis and Interpretation
©Ranjita Banerjee 235
HR Practices Nature of Industry N Mean Rank Compensation is decided on the basis of competence or ability
ENGINEERING 121 108.77 CHEMICALS 1 11
PHARMACEUTICALS 7 138.43 LOCOMOTIVES 2 94
ELECTRICAL 7 94 OTHERS 77 106.92
Total 215 Good performers are given financial incentives
ENGINEERING 121 109.99 CHEMICALS 1 100
PHARMACEUTICALS 7 137.29 LOCOMOTIVES 2 180.5
ELECTRICAL 7 56.43 OTHERS 77 105.12
Total 215 Good performers are given non-financial incentives.
ENGINEERING 121 103.02 CHEMICALS 1 109.5
PHARMACEUTICALS 7 128.57 LOCOMOTIVES 2 109.5
ELECTRICAL 7 125.93 OTHERS 77 112.27
Total 215 Good performers are given more authority and responsibility.
ENGINEERING 121 117.13 CHEMICALS 1 30.5
PHARMACEUTICALS 7 143.5 LOCOMOTIVES 2 104 ELECTRICAL 7 143.5
OTHERS 77 88.31 Employees participate in the decision-making process.
ENGINEERING 121 119.53 CHEMICALS 1 23
PHARMACEUTICALS 7 122.64 LOCOMOTIVES 2 120.5
ELECTRICAL 7 72.29 OTHERS 77 92.58
Employees are given opportunity to suggest improvement
ENGINEERING 121 111.3 CHEMICALS 1 100
PHARMACEUTICALS 7 142.29 LOCOMOTIVES 2 134.5
ELECTRICAL 7 100 OTHERS 77 98.28

Quantitative Data Analysis and Interpretation
©Ranjita Banerjee 236
HR Practices Nature of Industry N Mean Rank Employees can openly communicate with the superiors
ENGINEERING 121 116.07 CHEMICALS 1 91.5
PHARMACEUTICALS 7 136.36 LOCOMOTIVES 2 91.5
ELECTRICAL 7 105.64 OTHERS 77 93.6
Total 215
(Source: SPSS output; Primary data)
TABLE 8.102 - Test Statisticsab: Kruskal-Wallis Test for Nature of the Industry and HR Practices
HR Practices Chi-Square df Asymp.
Sig. Our organization places the right person in the right job 17.623 5 0.003 Selection is on the basis of merit 16.593 5 0.005 Organizes training and skill development programs 23.373 5 0 Employees are rotated from one job to another 13.687 5 0.018 Appraises the performance of employees at regular intervals. 18.229 5 0.003
Employees receive feedback 7.122 5 0.212 Enough opportunity for career growth 14.472 5 0.013 Compensation is decided on the basis of competence or ability 7.154 5 0.209
Good performers are given financial incentives 10.592 5 0.06 Good performers are given non-financial incentives. 2.662 5 0.752 Good performers are given more authority and responsibility. 21.033 5 0.001
Employees participate in the decision-making process. 15.302 5 0.009 Employees are given opportunity to suggest improvement 12.413 5 0.03 Employees can openly communicate with the superiors 11.863 5 0.037 (a. Kruskal Wallis Testb. Grouping Variable: Nature of Industry; Primary data)
Interpretation
It can be seen from Table 8.102 that the p-value of the following statements on HR
Practices are less than 0.05: ‘Our organization places the right person in the right job’,
‘Selection is on the basis of merit’, ‘Organizes training and skill development programs’,
‘Employees are rotated from one job to another’, ‘Appraises the performance of
employees at regular intervals’, ‘There is enough opportunity for career growth’, ‘Good

Quantitative Data Analysis and Interpretation
©Ranjita Banerjee 237
performers are given more authority and responsibility’, ‘Employees participate in the
decision-making process ‘, ‘Employees are given opportunity to suggest improvement’
and ‘Employees can openly communicate with the superiors’.
Table 8.101 shows that the mean-ranks of the Electrical firms is high and is 167.57,
173.14, 174 and 163.14 respectively, for the HR Practices related to Human
Resource Planning i.e placing the right person in the right job, Selection practices,
Training & Skill Development Programs and Performance Appraisal.
Table 8.101 further shows that the mean-ranks of the Pharmaceutical SME firms is
high and is 165.79, 163.64, 122.64, 142.29 and 136.36 respectively, for the HR
Practices related to Job-rotation, Opportunities for career growth, Participation in
the decision-making process, opportunities for giving suggestions for improvement
as well as for an Open-Communication system.
Whereas, the mean-ranks of both, the Electrical as well as Pharmaceutical firms is
high and is 143.5 for the HR Practice related to Delegation of power wr.t authority
and responsibility.
Thus, as the p-value of all the above statements on HR Practices is less than 0.05, so we
reject the null hypothesis and conclude that there is a significant influence of Nature
of the industry on HR Practices; with maximum influence of firms from the
Pharmaceutical and Electrical industry.
For all the other statements whose p-value is more than 0.05, the Nature of the Industry
does not influence the HR Practices in the SME firms.
8.9.18. Kruskal-Wallis Test for Nature of the Industry and Employee Outcomes
Kruskal-Wallis Test was done to see if there is any effect of Nature of the industry (i.e
Engineering, Chemicals, Pharmaceuticals, Locomotives, Electricals, Others) on
Employee Outcomes.

Quantitative Data Analysis and Interpretation
©Ranjita Banerjee 238
The null and alternate hypothesis is framed as under:
H033: There is no significant effect of Nature of the Industry on Employee Outcomes.
Ha33: There is a significant effect of Nature of the Industry on Employee Outcomes.
TABLE 8.103 - Mean-Ranks: KW Test for Nature of Industry and Emp. Outcomes
Employee Outcomes Nature of Industry N Mean Rank Competence of an Employee ENGINEERING 121 107.29
CHEMICALS 1 1 PHARMACEUTICALS 7 112.36
LOCOMOTIVES 2 125.5 ELECTRICAL 7 109
OTHERS 77 109.56 Employee’s co-operation with is satisfactory.
ENGINEERING 121 109.4 CHEMICALS 1 8
PHARMACEUTICALS 7 135.43 LOCOMOTIVES 2 110
ELECTRICAL 7 110 OTHERS 77 104.36
Employees co-operate among themselves
ENGINEERING 121 105.03 CHEMICALS 1 5.5
PHARMACEUTICALS 7 130.29 LOCOMOTIVES 2 28
ELECTRICAL 7 106 OTHERS 77 114.23
Employee’s general behavior is good
ENGINEERING 121 111.85 CHEMICALS 1 32.5
PHARMACEUTICALS 7 141.86
LOCOMOTIVES 2 119 ELECTRICAL 7 44.86
OTHERS 77 105.31 Employees are committed ENGINEERING 121 104
CHEMICALS 1 11 PHARMACEUTICALS 7 162.14
LOCOMOTIVES 2 119 ELECTRICAL 7 119
OTHERS 77 109.34

Quantitative Data Analysis and Interpretation
©Ranjita Banerjee 239
Employee Outcomes Nature of Industry N Mean Rank
Employees are punctual and report daily
ENGINEERING 121 101.34 CHEMICALS 1 14.5
PHARMACEUTICALS 7 177.07 LOCOMOTIVES 2 60.5
ELECTRICAL 7 83.93 OTHERS 77 116.82
Total 215 Employees are regular ENGINEERING 121 101.39
CHEMICALS 1 16.5 PHARMACEUTICALS 7 167.5
LOCOMOTIVES 2 139 ELECTRICAL 7 56
OTHERS 77 118.09 Total 215
Employees take up extra duties and responsibilities
ENGINEERING 121 101.97 CHEMICALS 1 13
PHARMACEUTICALS 7 167.93
LOCOMOTIVES 2 126.5 ELECTRICAL 7 70.07
OTHERS 77 116.23 Total 215
Employee’s follow general code of conduct and rules
ENGINEERING 121 107.48 CHEMICALS 1 37
PHARMACEUTICALS 7 163.14
LOCOMOTIVES 2 118 ELECTRICAL 7 60.14
OTHERS 77 108.82 Total 215
(Source: SPSS output; Primary data)

Quantitative Data Analysis and Interpretation
©Ranjita Banerjee 240
TABLE 8.104 - Test Statisticsab: Kruskal-Wallis Test for Nature of the Industry and Employee Outcomes
Employee Outcomes
Competence of an
Employee
Employee’s co-operation
with is satisfactory.
Employees co-operate
among themselves
Employee’s general
behavior is good
Employees are committed
Chi-Square 5.113 6.218 9.903 14.644 10.021
df 5 5 5 5 5
Asymp. Sig. .402 .286 .078 .012 .075
Test Statistics Table (Continued)
Employee Outcomes
Employees are punctual and report daily
Employees are regular
Employees take up extra duties
and responsibilities
Employee’s follow general code of
conduct and rules
Chi-Square 18.297 20.719 16.699 13.615
df 5 5 5 5
Asymp. Sig. .003 .001 .005 .018
a. Kruskal Wallis Test b. Grouping Variable: Nature of Industry
Interpretation
It can be seen from Table 8.104 that the p-value of the following statements on Employee
Outcomes are less than 0.05:‘Employee’s general behavior is good’, ‘Employees are
punctual and report daily for work on time’, ‘Employees are regular’, ‘Employees take up
extra duties and responsibilities’ and ‘Employees follow general code of conduct and
rules’.
Table 8.103 shows that the mean-rank of firms belonging to the Pharmaceutical
industry is high and is 141.86, 177.07, 167.5, 167.5 and 163.14 respectively for the
above mentioned statements on Employee Outcomes.
Thus, as the p-value of the statements on Employee Outcome is less than 0.05, so we
reject the null hypothesis and conclude that there is a significant influence of Nature

Quantitative Data Analysis and Interpretation
©Ranjita Banerjee 241
of Industry on Employee Outcome related to Employee’s general behavior,
Punctuality and Regularity of employees, Sense of Involvement and Conformance to
rules and regulations. For all the other statements whose p-value is more than 0.05, the
nature of industry does not influence the Employee Outcomes in the SME firms.
8.9.19. Kruskal-Wallis Test for Nature of the Industry and Organizational Outcomes
Kruskal-Wallis Test was done to see if there is any effect of Nature of the industry (i.e
Engineering, Chemicals, Pharmaceuticals, Locomotives, Electricals, Others) on
Organizational Outcomes.
The null and alternate hypothesis is framed as under:
H034: There is no significant effect of Nature of the Industry on Organizational Outcomes.
Ha34: There is a significant effect of Nature of the Industry on Organizational
Outcomes.
TABLE 8.105 - Mean-Ranks: Kruskal-Wallis Test for Nature of the Industry and Organizational Outcomes
Organizational Outcomes Nature of Industry N Mean Rank
Customer satisfaction has increased
ENGINEERING 121 104.55 CHEMICALS 1 88.5
PHARMACEUTICALS 7 168.21 LOCOMOTIVES 2 161.5
ELECTRICAL 7 88.5 OTHERS 77 108.06
Our suppliers/ vendors are satisfied with us.
ENGINEERING 121 109.89 CHEMICALS 1 18.5
PHARMACEUTICALS 7 159.07 LOCOMOTIVES 2 152.5
ELECTRICAL 7 92.5 OTHERS 77 101.03

Quantitative Data Analysis and Interpretation
©Ranjita Banerjee 242
Organizational Outcomes Nature of Industry N Mean Rank
Measures have been taken by the firm for product/ service development
ENGINEERING 121 113.16 CHEMICALS 1 81.5
PHARMACEUTICALS 7 161.21 LOCOMOTIVES 2 15.5
ELECTRICAL 7 81.5 OTHERS 77 100.21
Total 215 Products/service Quality shows improvement
ENGINEERING 121 110.11 CHEMICALS 1 81.5
PHARMACEUTICALS 7 135.5 LOCOMOTIVES 2 176
ELECTRICAL 7 81.5 OTHERS 77 103.18
The firm has displayed proper utilization of resources.
ENGINEERING 121 110.72 CHEMICALS 1 92
PHARMACEUTICALS 7 156.29 LOCOMOTIVES 2 152
ELECTRICAL 7 92 OTHERS 77 99.08
Average Number of defects of products / deficiencies in service shows a decrease
ENGINEERING 121 108.86 CHEMICALS 1 26
PHARMACEUTICALS 7 122.36 LOCOMOTIVES 2 26
ELECTRICAL 7 102.5 OTHERS 77 109.04
There is an increase in the Net Profit Margin.
ENGINEERING 121 108.8 CHEMICALS 1 129.5
PHARMACEUTICALS 7 118.07 LOCOMOTIVES 2 49.5
ELECTRICAL 7 95.93 OTHERS 77 108.17
Total 215 Return on Investment (in %) has increased
ENGINEERING 121 110.74 CHEMICALS 1 129
PHARMACEUTICALS 7 58.71 LOCOMOTIVES 2 199
ELECTRICAL 7 96 OTHERS 77 106.64

Quantitative Data Analysis and Interpretation
©Ranjita Banerjee 243
TABLE 8.106 - Test Statisticsab: Kruskal-Wallis Test for Nature of the Industry and Organizational Outcomes
Organizational Outcomes Chi-Square Df Asymp.
Sig. Customer satisfaction has increased 13.114 5 0.022 Our suppliers/ vendors are satisfied with us. 13.654 5 0.018 Measures have been taken by the firm for product/ service development 15.723 5 0.008
Products/service Quality shows improvement 7.128 5 0.211 The firm has displayed proper utilization of resources. 11.42 5 0.044 Average Number of defects of products / deficiencies in service shows a decrease 6.824 5 0.234
There is an increase in the Net Profit Margin. 2.756 5 0.737 Return on Investment (in %) has increased 10.852 5 0.054
a. Kruskal Wallis Test b. Grouping Variable: Nature of Industry
Interpretation
It can be seen from Table 8.106 that the p-value of the following statements on
Organizational Outcomes are less than 0.05:
• Customer Satisfaction has increased.
• Our suppliers/ vendors are satisfied with us.
• Measures have been taken by the firm for product/ service development
• The firm has displayed proper utilization of resources.
Table 8.105 shows that the mean-ranks of the SME firms belonging to the
Pharmaceutical industry is high for all the above mentioned statements and is
168.21, 159.07, 161.21 and 156.29 respectively, for Organizational Outcomes related
to Customer Satisfaction, Supplier/ Vendor Satisfaction, Product/ Service
Development and Proper utilization of resources. Thus, the owners/Managing heads
in the SME firms belonging to the Pharmaceutical industry believes that the above
mentioned outcomes have improved in their firms.

Quantitative Data Analysis and Interpretation
©Ranjita Banerjee 244
Thus, as the p-value of the above mentioned statements on Organizational Outcomes is
less than 0.05, so we reject the null hypothesis and conclude that there is a significant
influence of Nature of the industry on the Organizational Outcomes related to
Customer Satisfaction, Supplier/ Vendor Satisfaction, Product/ Service
Development and Proper utilization of resources.
For all the other statements whose p-value is more than 0.05, the nature of industry does
not influence the Organizational Outcomes in the SME firms.
8.9.20. Kruskal-Wallis Test for Total Employee Strength and HR Practices
Kruskal-Wallis Test was done to see if there is any effect of total number of employees
on HR Practices. The total employee strength was captured under three headings, firms
with less than 50 employees, between 51 to 100 employees and more than 100
employees.
The null and alternate hypothesis is framed as under:
H035: There is no significant influence of Total Employee Strength on HR Practices
Ha35: There is a significant influence of Total Employee Strength on HR Practices
TABLE 8.107 - Mean-Ranks: Kruskal-Wallis Test for Total Employee Strength and HR Practices
HR Practices Total Number of Employees N Mean Rank
Our organization places the right person in the right job
Less than 50 employees 157 103.14 Between 51 and 100 employees 51 124.21
More than 100 employees 7 99 Total 215
Selection is on the basis of merit
Less than 50 employees 157 99.15 Between 51 and 100 employees 51 129.85
More than 100 employees 7 147.29 Total 215

Quantitative Data Analysis and Interpretation
©Ranjita Banerjee 245
HR Practices Total Number of Employees N Mean Rank
Organizes training and skill development programs
Less than 50 employees 157 100.79 Between 51 and 100 employees 51 129.49
More than 100 employees 7 113.14 Employees are rotated from one job to another
Less than 50 employees 157 103.49 Between 51 and 100 employees 51 124.03
More than 100 employees 7 92.43 Total 215
Appraises the performance of employees at regular intervals.
Less than 50 employees 157 103.31 Between 51 and 100 employees 51 120.62
More than 100 employees 7 121.36 Total 215
Employees receive feedback
Less than 50 employees 157 100.91 Between 51 and 100 employees 51 126.03
More than 100 employees 7 135.71 Total 215
Enough opportunity for career growth
Less than 50 employees 157 101.9 Between 51 and 100 employees 51 123.13
More than 100 employees 7 134.5 Total 215
Compensation is decided on the basis of competence or ability
Less than 50 employees 157 105.35 Between 51 and 100 employees 51 118.09
More than 100 employees 7 94 Total 215
Good performers are given financial incentives
Less than 50 employees 157 104.07 Between 51 and 100 employees 51 116.45
More than 100 employees 7 134.5 Total 215
Good performers are given non-financial incentives.
Less than 50 employees 157 116.19 Between 51 and 100 employees 51 80.31
More than 100 employees 7 125.93 Total 215
Good performers are given more authority and responsibility.
Less than 50 employees 157 98.62 Between 51 and 100 employees 51 128.84
More than 100 employees 7 166.5 Total 215
Employees participate in the decision-making process.
Less than 50 employees 157 106.07 Between 51 and 100 employees 51 113.2
More than 100 employees 7 113.36

Quantitative Data Analysis and Interpretation
©Ranjita Banerjee 246
HR Practices Total Number of Employees N Mean Rank
Employees are given opportunity to suggest improvement
Less than 50 employees 157 103.05 Between 51 and 100 employees 51 116.92
More than 100 employees 7 154 Total 215
Employees can openly communicate with the superiors
Less than 50 employees 157 104.31 Between 51 and 100 employees 51 115.79
More than 100 employees 7 133.93
(Source: SPSS output; Primary data)
TABLE 8.108 - Test Statisticsab: Kruskal-Wallis Test for Total Employee Strength and HR Practices
HR Practices Chi-Square Df Asymp.
Sig. Our organization places the right person in the right job 7.067 2 0.029
Selection is on the basis of merit 18.322 2 0 Organizes training and skill development programs 9.502 2 0.009 Employees are rotated from one job to another 5.448 2 0.066 Appraises the performance of employees at regular intervals. 4.912 2 0.086
Employees receive feedback 11.646 2 0.003 Enough opportunity for career growth 6.741 2 0.034 Compensation is decided on the basis of competence or ability 3.079 2 0.214
Good performers are given financial incentives 3.202 2 0.202 Good performers are given non-financial incentives. 14.341 2 0.001 Good performers are given more authority and responsibility. 19.814 2 0
Employees participate in the decision-making process. 0.631 2 0.729 Employees are given opportunity to suggest improvement 8.73 2 0.013
Employees can openly communicate with the superiors 3.887 2 0.143
(Source: SPSS output; Primary data)

Quantitative Data Analysis and Interpretation
©Ranjita Banerjee 247
Interpretation
It can be seen from Table 8.108 that the p-value of the following statements on HR
Practices are less than 0.05: ‘Our organization places the right person in the right job’,
‘Selection is on the basis of merit’, ‘Organizes training and skill development programs’,
‘Employees receive feedback’, ‘There is enough opportunity for career growth’, ‘Good
performers are given non-financial incentives’, ‘Good performers are given more
authority and responsibility’ and ‘Employees are given opportunity to suggest
improvement’.
Table 8.107 shows that the mean-ranks of the SME firms whose employee strength is
between 51 to 100 employees is high and is 124.21 and 129.49 respectively, for the
HR Practices related to Human Resource Planning i.eplacing the right person in the
right job and Training & Skill Development Programs.
Table 8.107 further shows that the mean-ranks of the SME firms with more than 100
employees is high and is 147.29, 135.71, 134.5, 125.93, 166.5 and 154 respectively, for
the HR Practices related to Selection Methods i.e Merit-based Selection, Feedback
Mechanism, Opportunities for career growth, Motivational activities related to
giving non-financial incentives, Delegation of Power related to authority and
responsibility and opportunities for giving suggestions for improvement.
Thus, as the p-value of all the above statements on HR Practices is less than 0.05, so we
reject the null hypothesis and conclude that there is a significant influence of Number
of employees (or employee strength) on HR Practices; with maximum influence of
firms with more than 50 employees.
For all the other statements whose p-value is more than 0.05, the total employee strength
does not influence the HR Practices in the SME firms.
8.9.21. Kruskal-Wallis Test for Total Employee Strength and Employee Outcomes

Quantitative Data Analysis and Interpretation
©Ranjita Banerjee 248
Kruskal-Wallis Test was done to see if there is any effect of total number of employees
onEmployee Outcomes. The total employee strength was captured under three headings,
‘firms with less than 50 employees’, ‘between 51 to 100 employees’ and ‘more than 100
employees’.
The null and alternate hypothesis is framed as under:
H036: There is no significant influence of Total Employee Strength onEmployee
Outcomes
Ha36: There is a significant influence of Total Employee Strength onEmployee
Outcomes
TABLE 8.109 - Mean-Ranks: Kruskal-Wallis Test for Total Employee Strength and Employee Outcomes
Employee Outcomes Total Employee Strength N Mean Rank
Competence of an Employee
Less than 50 employees 157 101.6 Between 51 and 100 employees 51 122.03
More than 100 employees 7 149.36 Total 215
Employee’s co-operation with is satisfactory.
Less than 50 employees 157 104.45 Between 51 and 100 employees 51 121.97
More than 100 employees 7 85.86 Total 215
Employees co-operate among themselves
Less than 50 employees 157 108.09 Between 51 and 100 employees 51 111.05
More than 100 employees 7 83.71 Total 215
Employee’s general behavior is good
Less than 50 employees 157 104.47 Between 51 and 100 employees 51 117.34
More than 100 employees 7 119 Total 215
Employees are committed
Less than 50 employees 157 102.92 Between 51 and 100 employees 51 125.1
More than 100 employees 7 97.29 Total 215
Employees are punctual and report
Less than 50 employees 157 105.54 Between 51 and 100 employees 51 114.05

Quantitative Data Analysis and Interpretation
©Ranjita Banerjee 249
Employee Outcomes Total Employee Strength N Mean Rank
daily More than 100 employees 7 119.07 Employees are regular Less than 50 employees 157 107.42
Between 51 and 100 employees 51 106.41 More than 100 employees 7 132.5
Total 215 Employees take up extra duties and responsibilities
Less than 50 employees 157 102.08 Between 51 and 100 employees 51 126.77
More than 100 employees 7 103.93 Total 215
Employee’s follow general code of conduct and rules
Less than 50 employees 157 103.58 Between 51 and 100 employees 51 123.4
More than 100 employees 7 94.86 Total 215
(Source: SPSS output; Primary data)
TABLE 8.110 - Mean-Ranks: Kruskal-Wallis Test for Total Employee Strength and Employee Outcomes
Employee Outcomes Chi-Square df Asymp. Sig. Competence of an Employee 11.683 2 0.003 Employee’s co-operation with is satisfactory. 5.77 2 0.056 Employees co-operate among themselves 1.477 2 0.478 Employee’s general behavior is good 2.401 2 0.301 Employees are committed 5.983 2 0.05 Employees are punctual and report daily 1.083 2 0.582 Employees are regular 1.353 2 0.509 Employees take up extra duties and responsibilities 7.222 2 0.027
Employee’s follow general code of conduct and rules 5.227 2 0.073 a. Kruskal Wallis Test b. Grouping Variable: Total Employee Strength
Interpretation
It can be seen from Table 8.110 that the p-value of the following statements on
Employee Outcomes are less than 0.05: ‘Competence of an Employee to do their
assigned task’ and ‘Employees take up extra duties and responsibilities’.

Quantitative Data Analysis and Interpretation
©Ranjita Banerjee 250
Table 8.109 shows that the mean-rank of the SME firms whose employee strength is
more than 100 employees is high and is 149.36 for the HR Practice related to
Employee Competence (i.e ‘Competence of an Employee to do their assigned task’).
Table 8.109 further shows that the mean-rank of the SME firms with 51 to 100
employees is high and is 126.77 for the Employee Outcome related to Employees
taking up extra duties and responsibilities i.e a Sense of Involvement.
Thus, as the p-value of the two above statements on Employee Outcomes is less than
0.05, so we reject the null hypothesis and conclude that there is a significant
influence of Number of employees (or employee strength) on Employee Outcomes;
with maximum influence of firms with more than 50 employees for the outcomes
related to employee competence and sense of involvement.
For all the other statements whose p-value is more than 0.05, the total employee strength
does not influence the Employee Outcomes in the SME firms.
8.9.22. Kruskal-Wallis Test for Total Employee Strength and Organizational Outcomes
Kruskal-Wallis Test was done to see if there is any effect of total number of employees
on Organizational Outcomes. The total employee strength was captured under three
headings, ‘firms with less than 50 employees’, ‘between 51 to 100 employees’ and ‘more
than 100 employees’.
The null and alternate hypothesis is framed as under:
H037: There is no significant influence of Total Employee Strength on
Organizational Outcomes
Ha37: There is a significant influence of Total Employee Strength on Organizational
Outcomes

Quantitative Data Analysis and Interpretation
©Ranjita Banerjee 251
TABLE 8.111 - Mean-Ranks: Kruskal-Wallis Test for Total Employee Strength and Organizational Outcomes
Organizational Employees Total Employee Strength N Mean Rank
Customer satisfaction has increased
Less than 50 employees 157 105.38 Between 51 and 100 employees 51 118.74
More than 100 employees 7 88.5 Total 215
Our suppliers/ vendors are satisfied with us.
Less than 50 employees 157 102.69 Between 51 and 100 employees 51 129.36
More than 100 employees 7 71.36 Total 215
Measures have been taken by the firm for product/ service development
Less than 50 employees 157 99.43 Between 51 and 100 employees 51 138.03
More than 100 employees 7 81.5 Total 215
Products/service Quality shows improvement
Less than 50 employees 157 101.61 Between 51 and 100 employees 51 131.32
More than 100 employees 7 81.5 The firm has displayed proper utilization of resources.
Less than 50 employees 157 99.78 Between 51 and 100 employees 51 139.65
More than 100 employees 7 61.79 Total 215
Average Number of defects of products / deficiencies in service shows a decrease
Less than 50 employees 157 102.38 Between 51 and 100 employees 51 126.05
More than 100 employees 7 102.5 Total 215
There is an increase in the Net Profit Margin.
Less than 50 employees 157 104.29 Between 51 and 100 employees 51 119.6
More than 100 employees 7 106.64 Total 215
Return on Investment (in %) has increased
Less than 50 employees 157 106.58 Between 51 and 100 employees 51 122.47
More than 100 employees 7 34.36 Total 215
(Source: SPSS output; Primary data)

Quantitative Data Analysis and Interpretation
©Ranjita Banerjee 252
TABLE 8.112 - Test Statisticsab: Kruskal-Wallis Test for Total Employee Strength and Organizational Outcomes
Organizational Outcomes Chi-Square Df Asymp.
Sig. Customer satisfaction has increased 3.101 2 0.212 Our suppliers/ vendors are satisfied with us. 11.717 2 0.003 Measures have been taken by the firm for product/ service development 19.461 2 0
Products/service Quality shows improvement 12.386 2 0.002 The firm has displayed proper utilization of resources. 24.081 2 0 Avg No of defects of products / deficiencies in service shows decrease 6.756 2 0.034
There is an increase in the Net Profit Margin. 2.731 2 0.255 Return on Investment (in %) has increased 14.732 2 0.001 a. Kruskal Wallis Test b. Grouping Variable: Total Employee Strength
Interpretation
It can be seen from Table 8.112 that the p-value of the following statements on
Organizational Outcomes are less than 0.05: Supplier Satisfaction has increased,
Measures have been taken by the firm for product/ service development, Products/service
Quality shows improvement, The firm has displayed proper utilization of resources,
Average Number of defects of products / deficiencies in service shows a decrease and
Return on Investment (in %) has increased.
Table 8.111 shows that the mean-ranks of the SME firms with total employee strength
‘between 51 to 100 employees’ is high for all the above mentioned statements and is
129.36, 138.03, 131.32, 139.69, 126.05 and 122.47 respectively.
Thus, the owners/Managing heads in the SME firms with total employee strength
‘between 51 to 100 employees’ believes that the above mentioned organizational
outcomes have improved in their firms. Thus, as the p-value of the above mentioned
statements on Organizational Outcomes is less than 0.05, so we reject the null
hypothesis and conclude that there is a significant influence of total number of
employees on the Organizational Outcomes related to Supplier/ Vendor Satisfaction,
Product/ Service Development, Product/ Service quality improvement, Proper

Quantitative Data Analysis and Interpretation
©Ranjita Banerjee 253
utilization of resources, decrease in defects of products / deficiencies in service and
Return on Investment (ROI); with highest influence of firms whose total employee
strength is between 51 to 100 employees. For all the other statements whose p-value is
more than 0.05, the total number of employees or employee strength does not influence
the Organizational Outcomes in the SME firms.
8.9.23. Kruskal-Wallis Test for Total Number of Contract Employees and HR Practices
Kruskal-Wallis Test was done to see if there is any effect of total number of Contractual
employees on HR Practices. The total employee strength was captured under three
headings, ‘firms with less than 50 contractual employees’, ‘firms with 50 to 94
contractual employees’ and ‘firms with more than 94 contractual employees’.
The null and alternate hypothesis is framed as under:
H038: There is no significant influence of Total number of Contractual Employees on
HR Practices
Ha38: There is a significant influence of Total number of Contractual Employees on
HR Practices
TABLE 8.113 - Mean-Ranks: Kruskal-Wallis Test for Total number of Contractual Employees on HR Practices
HR Practices Number of contractual employment (Binned) N Mean Rank
Our organization places the right person in the right job
Less than 50 employees 201 105.76 50 to 94 Employees 7 153.86
More than 94 employees 7 120.15 Selection is on the basis of merit
Less than 50 employees 201 103.91 50 to 94 employees 7 73.14
More than 94 employees 7 173.14 Organizes training and skill development programs
Less than 50 employees 201 108.32 50 to 94 employees 7 134.14
More than 94 employees 7 123.15 Total 215

Quantitative Data Analysis and Interpretation
©Ranjita Banerjee 254
HR Practices Number of contractual employment (Binned) N Mean Rank
Employees are rotated from one job to another
Less than 50 employees 201 109.15 50 to 94 employees 7 103.64
More than 94 employees 7 112.13 Appraises the performance of employees at regular intervals.
Less than 50 employees 201 107.07 50 to 94 employees 7 149.21
More than 94 employees 7 90.15 Employees receive feedback Less than 50 employees 201 108.73
50 to 94 employees 7 67 More than 94 employees 7 120
Total 215 Enough opportunity for career growth
Less than 50 employees 201 107.69 50 to 94 employees 7 105.07
More than 94 employees 7 162.07 Total 215
Compensation is decided on the basis of competence or ability
Less than 50 employees 201 108 50 to 94 employees 7 122.14
More than 94 employees 7 111.15 Total 215
Good performers are given financial incentives
Less than 50 employees 201 107.77 50 to 94 employees 7 110.06
More than 94 employees 7 157.5 Total 215
Good performers are given non-financial incentives.
Less than 50 employees 201 107.51 50 to 94 employees 7 110.14
More than 94 employees 7 109.5 Good performers are given more authority and responsibility.
Less than 50 employees 201 105.23 50 to 94 employees 7 154
More than 94 employees 7 111.36 Employees participate in the decision-making process.
Less than 50 employees 201 107.75 50 to 94 employees 7 141.21
More than 94 employees 7 121.33 Employees are given opportunity to suggest improvement
Less than 50 employees 201 107.62 50 to 94 employees 7 100
More than 94 employees 7 122 Employees can openly communicate with the superiors
Less than 50 employees 201 106.69 50 to 94 employees 7 122.23
More than 94 employees 7 162.21
(Source: SPSS output; Primary data)

Quantitative Data Analysis and Interpretation
©Ranjita Banerjee 255
TABLE 8-114- Test Statisticsab: Kruskal-Wallis Test for Total Number of Contractual Employees on HR Practices
HR Practices Chi-Square Df Asymp.
Sig. Our organization places the right person in the right job 7.24 2 0.027 Selection is on the basis of merit 20.133 2 0 Organizes training and skill development programs 4.048 2 0.132 Employees are rotated from one job to another 1.85 2 0.397 Appraises the performance of employees at regular intervals. 5.183 2 0.075 Employees receive feedback 1.498 2 0.473 Enough opportunity for career growth 10.436 2 0.005 Compensation is decided on the basis of competence or ability 1.113 2 0.573
Good performers are given financial incentives 8.756 2 0.013 Good performers are given non-financial incentives. 0.32 2 0.852 Good performers are given more authority and responsibility 8.005 2 0.018
Employees participate in the decision-making process. 3.651 2 0.161 Employees are given opportunity to suggest improvement 1.155 2 0.561 Employees can openly communicate with the superiors 8.926 2 0.012 a. Kruskal Wallis Test b. Grouping Variable: Total No. of contract employees
Interpretation
It can be seen from Table 8.114 that the p-value of the following statements on HR
Practices are less than 0.05: ‘Our organization places the right person in the right job’,
‘Selection is on the basis of merit’, ‘There is enough opportunity for career growth’,
‘Good performers are given financial incentives’, ‘Good performers are given more
authority and responsibility’ and ‘Employees can openly communicate with the
superiors’.
Table 8.113 shows that the mean-ranks of the SME firms whose number of Contract
employees are between 51 to 94, is high and is 153.86 and 154 respectively, for the
HR Practices related to Human Resource Planning i.e placing the right person in
the right job and Delegation of Power i.e. Good performers are given more
authority and responsibility. Table 8.113 further shows that the mean-ranks of the

Quantitative Data Analysis and Interpretation
©Ranjita Banerjee 256
SME firms with more than 94 Contractual employees is high and is 173.14, 162.07,
157.5 and 154 respectively, for the HR Practices related to Selection Methods i.e
Merit-based Selection, Opportunities for career growth, Motivational activities
related to giving financial incentives, Delegation of Power related to authority and
responsibility and open communication with the superiors.
Thus, as the p-value of all the above statements on HR Practices is less than 0.05, so we
reject the null hypothesis and conclude that there is a significant influence of
Number of contractual employees on HR Practices; with maximum influence of
firms with more than 50 contractual employees. For all the other statements whose p-
value is more than 0.05, the total number of contract employees does not influence the
HR Practices in the SME firms.
8.9.24. Kruskal-Wallis Test for Total Number of Contract Employees and Employee Outcomes
Kruskal-Wallis Test was done to see if there is any effect of total number of Contractual
employees on Employee Outcomes. The total employee strength was captured under
three headings, ‘firms with less than 50 contractual employees’, ‘firms with 50 to 94
contractual employees’ and ‘firms with more than 94 contractual employees’.
The null and alternate hypothesis is framed as under:
H039: There is no significant influence of Total number of Contractual Employees on
Employee Outcomes
Ha39: There is a significant influence of Total number of Contractual Employees on
Employee Outcomes

Quantitative Data Analysis and Interpretation
©Ranjita Banerjee 257
TABLE 8.115 - Mean-Ranks: Kruskal-Wallis Test for Total number of Contractual Employees on Employee Outcomes
Employee Outcomes Number of contractual employment (Binned) N Mean
Rank Competence of an Employee Less than 50 employees 201 107.56
Between 51 and 94 employees 7 79.36 More than 94 employees 7 149.36
Employee’s co-operation with is satisfactory.
Less than 50 employees 201 107.9 Between 51 and 94 employees 7 83.36
More than 94 employees 7 135.43 Total 215
Employees co-operate among themselves
Less than 50 employees 201 107.95 Between 51 and 94 employees 7 62.93
More than 94 employees 7 154.57 Total 215
Employee’s general behavior is good
Less than 50 employees 201 108.65 Between 51 and 94 employees 7 32.5
More than 94 employees 7 164.71 Total 215
Employees are committed Less than 50 employees 201 107.18 Between 51 and 94 employees 7 77.29
More than 94 employees 7 162.14 Employees are punctual and report daily
Less than 50 employees 201 109.12 Between 51 and 94 employees 7 47.36
More than 94 employees 7 136.36 Total 215
Employees are regular Less than 50 employees 201 107.67 Between 51 and 94 employees 7 39.07
More than 94 employees 7 186.5 Total 215
Employees take up extra duties and responsibilities
Less than 50 employees 201 108.74 Between 51 and 94 employees 7 47.5
More than 94 employees 7 147.21 Total 215
Employee’s follow general code of conduct and rules
Less than 50 employees 201 108.28 Between 51 and 94 employees 7 67.36
More than 94 employees 7 140.57 Total 215
(Source: SPSS Output; Primary data)

Quantitative Data Analysis and Interpretation
©Ranjita Banerjee 258
TABLE 8.116 - Test Statisticsab: Kruskal Wallis Test for Total Number of Contractual Employees on Employee Outcomes
Employee Outcomes Chi-Square df Asymp. Sig.
Competence of an Employee 7.293 2 0.026 Employee’s co-operation with Mgt. is satisfactory. 3.575 2 0.167 Employees co-operate among themselves 9.432 2 0.009 Employee’s general behavior is good 20.695 2 0 Employees are committed 8.254 2 0.016 Employees are punctual and report daily 9.325 2 0.009 Employees are regular 23.583 2 0 Employees take up extra duties and responsibilities 11.173 2 0.004 Employee’s follow general code of conduct and rules 6.068 2 0.048
a. Kruskal Wallis Test b. Grouping Variable: Number of contractual employment (Binned)
Interpretation
It can be seen from Table 8.116 that the p-value of all the following statements on
Employee Outcomes are less than 0.05:‘Competence of an Employee to do their
assigned task’, ‘Employees co-operate among themselves ‘, ‘Employee’s general
behavior is good ‘, ‘Employees are committed ‘, ‘Employees are punctual and report
daily’, ‘Employees are regular ‘, ‘Employees take up extra duties and responsibilities’
and ‘Employee’s follow general code of conduct and rules’.
Table 8.115 shows that the mean-rank of the SME firms whose employee strength is
more than 94 employees is high and is 149.36, 154.57, 164.71, 162.14, 136.36, 186.5,
147.21 and 140.57 for all the above mentioned statements related to Employee
Outcomes.
Thus, as the p-value of all the above statements on Employee Outcomes is less than
0.05, so we reject the null hypothesis and conclude that there is a significant
influence of Number of employees (or employee strength) on Employee Outcomes;
with maximum influence of firms with more than 94 Contract employees for the
Employee Outcomes related to Competence of employees, Co-operate among
employees, General behavior of employees, Employee Commitment, Punctuality

Quantitative Data Analysis and Interpretation
©Ranjita Banerjee 259
and Regularity of employees, Taking up extra duties and responsibilities showing a
sense of Involvement & Participation and Conformance to rules & regulations.
For the other statement whose p-value is more than 0.05, the total number of contract
employees does not influence the Employee Outcomes in the SME firms.
8.9.25. Kruskal-Wallis Test for Total Number of Contract Employees and Organizational Outcomes
Kruskal-Wallis Test was done to see if there is any effect of total number of Contractual
employees on Organizational Outcomes. The total employee strength was captured under
three headings, ‘firms with less than 50 contractual employees’, ‘firms with 50 to 94
contractual employees’ and ‘firms with more than 94 contractual employees’.
The null and alternate hypothesis is framed as under:
H040: There is no significant influence of Total number of Contractual Employees on
Organizational Outcomes
Ha40: There is a significant influence of Total number of Contractual Employees on
Organizational Outcomes
TABLE 8.117 - Mean-Ranks: Kruskal-Wallis Test for Total number of Contractual Employees on Organizational Outcomes
Organizational Outcomes Number of contractual employment (Binned) N
Mean Rank
Customer satisfaction has increased
Less than 50 employees 201 110.22 Between 51 and 94 employees 7 57.64
More than 94 employees 7 94.5 Total 215
Our suppliers/ vendors are satisfied with us.
Less than 50 employees 201 108.92 Between 51 and 94 employees 7 92.5
More than 94 employees 7 97.07 Total 215
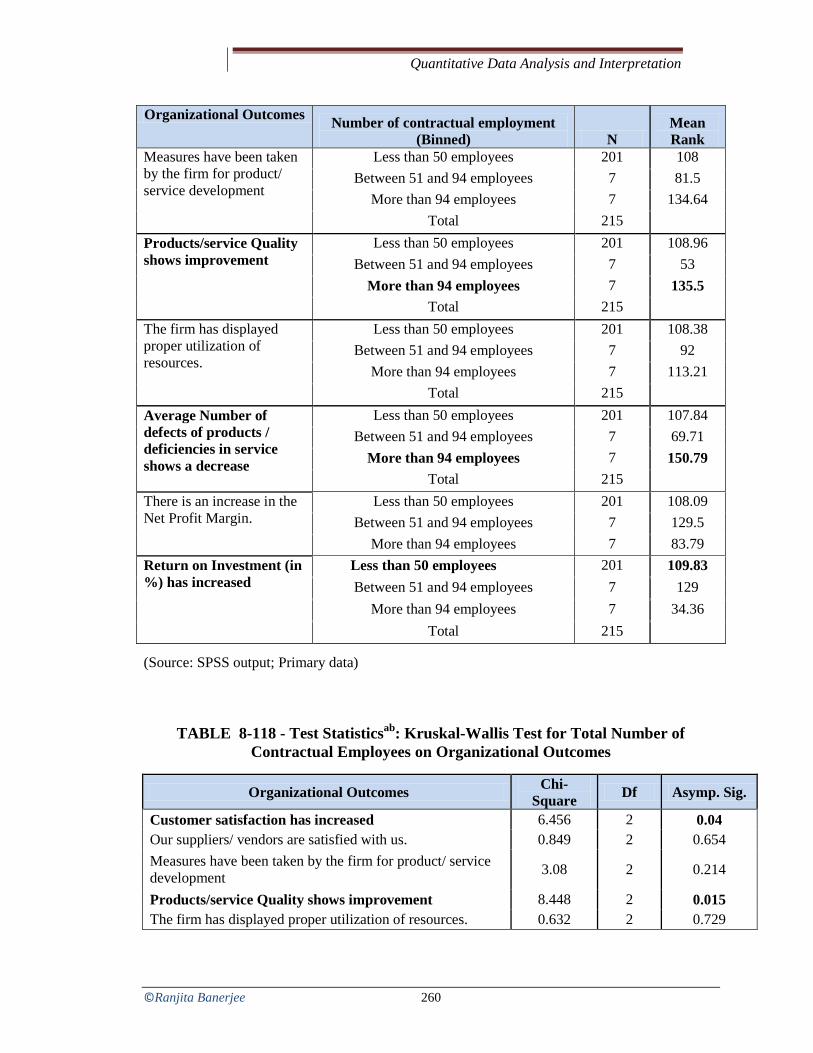
Quantitative Data Analysis and Interpretation
©Ranjita Banerjee 260
Organizational Outcomes Number of contractual employment (Binned) N
Mean Rank
Measures have been taken by the firm for product/ service development
Less than 50 employees 201 108 Between 51 and 94 employees 7 81.5
More than 94 employees 7 134.64 Total 215
Products/service Quality shows improvement
Less than 50 employees 201 108.96 Between 51 and 94 employees 7 53
More than 94 employees 7 135.5 Total 215
The firm has displayed proper utilization of resources.
Less than 50 employees 201 108.38 Between 51 and 94 employees 7 92
More than 94 employees 7 113.21 Total 215
Average Number of defects of products / deficiencies in service shows a decrease
Less than 50 employees 201 107.84 Between 51 and 94 employees 7 69.71
More than 94 employees 7 150.79 Total 215
There is an increase in the Net Profit Margin.
Less than 50 employees 201 108.09 Between 51 and 94 employees 7 129.5
More than 94 employees 7 83.79 Return on Investment (in %) has increased
Less than 50 employees 201 109.83 Between 51 and 94 employees 7 129
More than 94 employees 7 34.36 Total 215
(Source: SPSS output; Primary data)
TABLE 8-118 - Test Statisticsab: Kruskal-Wallis Test for Total Number of Contractual Employees on Organizational Outcomes
Organizational Outcomes Chi-Square Df Asymp. Sig.
Customer satisfaction has increased 6.456 2 0.04 Our suppliers/ vendors are satisfied with us. 0.849 2 0.654 Measures have been taken by the firm for product/ service development 3.08 2 0.214
Products/service Quality shows improvement 8.448 2 0.015 The firm has displayed proper utilization of resources. 0.632 2 0.729

Quantitative Data Analysis and Interpretation
©Ranjita Banerjee 261
Average Number of defects of products / deficiencies in service shows a decrease 7.159 2 0.028
There is an increase in the Net Profit Margin. 2.22 2 0.33 Return on Investment (in %) has increased 12.556 2 0.002
a. Kruskal Wallis b. Grouping Variables: Number of contractual employment (Binned)
Interpretation
It can be seen from Table 8.118 that the p-value of the following statements on
Organizational Outcomes are less than 0.05: Customer Satisfaction has increased,
Products/service Quality shows improvement, Average Number of defects of products /
deficiencies in service shows a decrease and Return on Investment (in %) has increased.
Table 8.117 shows that the mean-ranks of the SME firms with less than 50 Contract
employees is high for the statements ‘Customer Satisfaction has increased’ and ‘Return
on Investment (in %) has increased’. Thus, the owners/Managing heads in the SME
firms with less than 50 contractual employees believes that the organizational
outcomes related to customer satisfaction and Return on Investment has improved
in their firms. Further, Table 8.117 shows that the mean-ranks of the SME firms with
more than 94 Contract employees is high for the statements ‘Products/service
Quality shows improvement’ and ‘Average Number of defects of products / deficiencies
in service shows a decrease’. Thus, as the p-value of the above mentioned statements on
Organizational Outcomes is less than 0.05, so we reject the null hypothesis and
conclude that there is a significant influence of total number of Contractual
employees on the Organizational Outcomes related to Customer Satisfaction,
Product/ Service quality improvement, decrease in defects of products / deficiencies
in service and Return on Investment (ROI); with highest influence of firms whose
total number of contractual employees is less than 50 or more than 94 employees.
For all the other statements whose p-value is more than 0.05, the total number of
contractual employees does not influence the Organizational Outcomes in the SME firms.

Quantitative Data Analysis and Interpretation
©Ranjita Banerjee 262
8.9.26. Kruskal-Wallis Test for Total Number of Women Employees and HR Practices
Kruskal-Wallis Test was done to see if there is any effect of total number of women
employees on HR Practices. The total strength of women employees was captured under
three headings, ‘firms with less than 20 women employees’, ‘firms with 20 to 40 women
employees’ and ‘firms with more than 40 women employees’.
The null and alternate hypothesis is framed as under:
H041: There is no significant influence of Total number of Women Employees on HR
Practices
Ha41: There is a significant influence of Total number of Women Employees on HR
Practices
TABLE 8.119 - Mean-Ranks: Kruskal-Wallis Test for Total Number of Women Employees and HR Practices
HR Practices Number of women employees (Binned) N
Mean Rank
Our organization places the right person in the right job
Less than 20 employees 210 107.3 Between 20 and 40 employees 2 195
More than 40 employees 3 99 Total 215
Selection is on the basis of merit
Less than 20 employees 210 105.83 Between 20 and 40 employees 2 199
More than 40 employees 3 199 Total 215
Organizes training and skill development programs
Less than 20 employees 210 109.31 Between 20 and 40 employees 2 53
More than 40 employees 3 53 Total 215
Employees are rotated from one job to another
Less than 20 employees 210 109.34 Between 20 and 40 employees 2 24.5
More than 40 employees 3 70 Total 215

Quantitative Data Analysis and Interpretation
©Ranjita Banerjee 263
HR Practices Number of women employees (Binned) N
Mean Rank
Appraises the performance of employees at regular intervals.
Less than 20 employees 210 108.35 Between 20 and 40 employees 2 93.5
More than 40 employees 3 93.5 Total 215
Employees receive feedback Less than 20 employees 210 108.79 Between 20 and 40 employees 2 22.5
More than 40 employees 3 110 Total 215
Enough opportunity for career growth
Less than 20 employees 210 106.15 Between 20 and 40 employees 2 185.5
More than 40 employees 3 185.5 Total 215
Compensation is decided on the basis of competence or ability
Less than 20 employees 210 107.4 Between 20 and 40 employees 2 192.5
More than 40 employees 3 94 Total 215
Good performers are given financial incentives
Less than 20 employees 210 106.27 Between 20 and 40 employees 2 180.5
More than 40 employees 3 180.5 Good performers are given non-financial incentives.
Less than 20 employees 210 107.04 Between 20 and 40 employees 2 206.5
More than 40 employees 3 109.5 Good performers are given more authority and responsibility.
Less than 20 employees 210 106.85 Between 20 and 40 employees 2 104
More than 40 employees 3 191.5 Employees participate in the decision-making process.
Less than 20 employees 210 107.01 Between 20 and 40 employees 2 193
More than 40 employees 3 120.5 Total 215
Employees are given opportunity to suggest improvement
Less than 20 employees 210 107.29 Between 20 and 40 employees 2 194.5
More than 40 employees 3 100 Employees can openly communicate with the superiors
Less than 20 employees 210 106.04 Between 20 and 40 employees 2 190.5
More than 40 employees 3 190.5
(Source: SPSS output; Primary data)

Quantitative Data Analysis and Interpretation
©Ranjita Banerjee 264
TABLE 8.120- Test Statisticsab: Kruskal-Wallis Test for Total Number of Women Employees and HR Practices
HR Practices Chi-Square df Asymp.
Sig. Our organization places the right person in the right job 6.192 2 0.045
Selection is on the basis of merit 16.366 2 0 Organizes training and skill development programs 4.613 2 0.1 Employees are rotated from one job to another 5.645 2 0.059 Appraises the performance of employees at regular intervals. 0.412 2 0.814
Employees receive feedback 5.759 2 0.056 Enough opportunity for career growth 9.245 2 0.01 Compensation is decided on the basis of competence or ability 6.002 2 0.05
Good performers are given financial incentives 7.848 2 0.02 Good performers are given non-financial incentives. 5.419 2 0.067 Good performers are given more authority and responsibility. 7.019 2 0.03
Employees participate in the decision-making process. 4.42 2 0.11 Employees are given opportunity to suggest improvement 5.865 2 0.053 Employees can openly communicate with the superiors 13.624 2 0.001
a. Kruskal Wallis Test b. Grouping Variable: Number of women employees (Binned)
Interpretation
It can be seen from Table 8.120 that the p-value of the following statements on HR
Practices are less than 0.05: ‘Our organization places the right person in the right job’,
‘Selection is on the basis of merit’, ‘There is enough opportunity for career growth’,
‘Compensation is decided on the basis of competence or ability’,
‘Good performers are given financial incentives’, ‘Good performers are given more
authority and responsibility’ and ‘Employees can openly communicate with the
superiors’.
Table 8.119 shows that the mean-ranks of the SME firms whose number of Women
employees is between 20 to 40 is high and is 195 and 192.5, respectively, for the HR
Practices related to Human Resource Planning i.e placing the right person in the

Quantitative Data Analysis and Interpretation
©Ranjita Banerjee 265
right job and Compensation w.r.t compensation based on one’s ability and
competence.
Table 8.119 further shows that the mean-ranks of the SME firms with women
employees more than 20 (including between 20-40 and above 40), is high and is 199,
185.5, 180.5, 191.5 and 190.5 respectively, for the HR Practices related to Selection
Methods i.e Merit-based Selection, Opportunities for career growth, Motivational
activities related to giving financial incentives, Delegation of Power related to
authority and responsibility and open communication with the superiors.
Thus, as the p-value of all the above statements on HR Practices is less than 0.05, so we
reject the null hypothesis and conclude that there is a significant influence of
Number of women employees on HR Practices; with maximum influence of firms
with more than 20 women employees. For all the other statements whose p-value is
more than 0.05, the total number of women employees does not influence the HR
Practices in the SME firms.
8.9.27. Kruskal-Wallis Test for Industrial Estate and HR Practices
Kruskal-Wallis Test was done to see if there is any effect of Industrial Estate on HR
Practices. The Industrial Estates in the study were the eight estates of Vadodara district,
including GIDC Makarpura, BIDC Gorwa, Chhani Estate, Sardar Estate, Patel Estate,
Padra Estate, Mujmahuda Estate, Vadodara City area and others (including Waghodia
Estate, POR Ramangamdi and Savli).
The null and alternate hypothesis is framed as under:
H042: There is no significant influence of Industrial Estate on HR Practices
Ha42: There is a significant influence of Industrial Estate on HR Practices
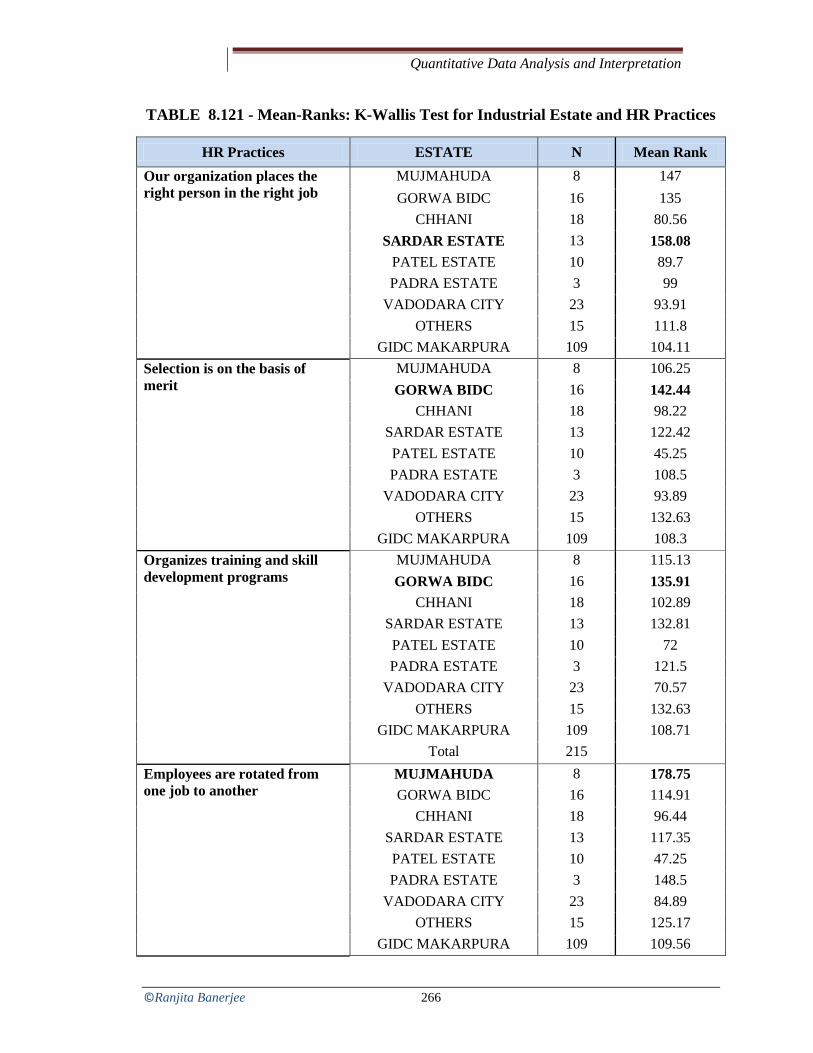
Quantitative Data Analysis and Interpretation
©Ranjita Banerjee 266
TABLE 8.121 - Mean-Ranks: K-Wallis Test for Industrial Estate and HR Practices
HR Practices ESTATE N Mean Rank Our organization places the right person in the right job
MUJMAHUDA 8 147 GORWA BIDC 16 135
CHHANI 18 80.56 SARDAR ESTATE 13 158.08
PATEL ESTATE 10 89.7 PADRA ESTATE 3 99
VADODARA CITY 23 93.91 OTHERS 15 111.8
GIDC MAKARPURA 109 104.11 Selection is on the basis of merit
MUJMAHUDA 8 106.25 GORWA BIDC 16 142.44
CHHANI 18 98.22 SARDAR ESTATE 13 122.42 PATEL ESTATE 10 45.25 PADRA ESTATE 3 108.5
VADODARA CITY 23 93.89 OTHERS 15 132.63
GIDC MAKARPURA 109 108.3 Organizes training and skill development programs
MUJMAHUDA 8 115.13 GORWA BIDC 16 135.91
CHHANI 18 102.89 SARDAR ESTATE 13 132.81 PATEL ESTATE 10 72 PADRA ESTATE 3 121.5
VADODARA CITY 23 70.57 OTHERS 15 132.63
GIDC MAKARPURA 109 108.71 Total 215
Employees are rotated from one job to another
MUJMAHUDA 8 178.75 GORWA BIDC 16 114.91
CHHANI 18 96.44 SARDAR ESTATE 13 117.35 PATEL ESTATE 10 47.25 PADRA ESTATE 3 148.5
VADODARA CITY 23 84.89 OTHERS 15 125.17
GIDC MAKARPURA 109 109.56

Quantitative Data Analysis and Interpretation
©Ranjita Banerjee 267
HR Practices ESTATE N Mean Rank Appraises the performance of employees at regular intervals.
MUJMAHUDA 8 166.63 GORWA BIDC 16 123.97
CHHANI 18 131.42 SARDAR ESTATE 13 153.5 PATEL ESTATE 10 115.4 PADRA ESTATE 3 93.5
VADODARA CITY 23 77 OTHERS 15 119.5
GIDC MAKARPURA 109 96.74 Employees receive feedback MUJMAHUDA 8 155
GORWA BIDC 16 138.44 CHHANI 18 100.56
SARDAR ESTATE 13 123.85 PATEL ESTATE 10 78.5 PADRA ESTATE 3 110
VADODARA CITY 23 94.24 OTHERS 15 122
GIDC MAKARPURA 109 103.05 Enough opportunity for career growth
MUJMAHUDA 8 165 GORWA BIDC 16 159.88
CHHANI 18 120.11 SARDAR ESTATE 13 153.96 PATEL ESTATE 10 46.15 PADRA ESTATE 3 103.5
VADODARA CITY 23 101.07 OTHERS 15 85.43
GIDC MAKARPURA 109 99.09 Compensation is decided on the basis of competence or ability
MUJMAHUDA 8 143.25 GORWA BIDC 16 155.56
CHHANI 18 148.72 SARDAR ESTATE 13 154.62 PATEL ESTATE 10 105.8 PADRA ESTATE 3 94
VADODARA CITY 23 84.52 OTHERS 15 82.93
GIDC MAKARPURA 109 95.14 Good performers are given financial incentives
MUJMAHUDA 8 118.63 GORWA BIDC 16 160.38
CHHANI 18 131.17

Quantitative Data Analysis and Interpretation
©Ranjita Banerjee 268
HR Practices ESTATE N Mean Rank SARDAR ESTATE 13 135.46 PATEL ESTATE 10 69.9 PADRA ESTATE 3 79.67
VADODARA CITY 23 104.24 OTHERS 15 90.4
GIDC MAKARPURA 109 99.92 Good performers are given non-financial incentives
MUJMAHUDA 8 118.88 GORWA BIDC 16 122.59
CHHANI 18 105.06 SARDAR ESTATE 13 87.35 PATEL ESTATE 10 120.7 PADRA ESTATE 3 90
VADODARA CITY 23 134.41 GIDC MAKARPURA 109 101.06
OTHERS 15 113.13
Good performers are given more authority and responsibility.
MUJMAHUDA 8 147.75 GORWA BIDC 16 111.22
CHHANI 18 123.44 SARDAR ESTATE 13 117.46 PATEL ESTATE 10 30.4 PADRA ESTATE 3 55
VADODARA CITY 23 82.41 OTHERS 15 127.67
GIDC MAKARPURA 109 112.2 Employees participate in the decision-making process.
MUJMAHUDA 8 130.81 GORWA BIDC 16 148.31
CHHANI 18 96.89 SARDAR ESTATE 13 95.12 PATEL ESTATE 10 74.5 PADRA ESTATE 3 120.5
VADODARA CITY 23 79.09 OTHERS 15 86.17
GIDC MAKARPURA 109 115.61 Employees are given opportunity to suggest improvement
MUJMAHUDA 8 147.25 GORWA BIDC 16 159.06
CHHANI 18 89.06 SARDAR ESTATE 13 114.54 PATEL ESTATE 10 67.2

Quantitative Data Analysis and Interpretation
©Ranjita Banerjee 269
HR Practices ESTATE N Mean Rank PADRA ESTATE 3 100
VADODARA CITY 23 75.09 OTHERS 15 126.87
GIDC MAKARPURA 109 108.28 Employees can openly communicate with the superiors
MUJMAHUDA 8 165.75 GORWA BIDC 16 153.38
CHHANI 18 91.5 SARDAR ESTATE 13 106.73 PATEL ESTATE 10 160.8 PADRA ESTATE 3 91.5
VADODARA CITY 23 89.04 OTHERS 15 89.43
GIDC MAKARPURA 109 102.14
(Source: SPSS output; Primary data)
TABLE 8.122- Test Statisticsab: Kruskal-Wallis Test for Industrial Estate and HR Practices
a. Kruskal Wallis Test b. Grouping Variable: ESTATE
HR Practices Chi-Square Df Asymp.
Sig. Our organization places the right person in the right job 31.994 8 0 Selection is on the basis of merit 29.531 8 0 Organizes training and skill development programs 22.707 8 0.004 Employees are rotated from one job to another 31.217 8 0 Appraises the performance of employees at regular intervals. 41.146 8 0
Employees receive feedback 21.628 8 0.006 Enough opportunity for career growth 46.567 8 0 Compensation is decided on the basis of competence or ability 58.232 8 0
Good performers are given financial incentives 27.205 8 0.001 Good performers are given non-financial incentives. 9.489 8 0.303 Good performers are given more authority and responsibility. 36.27 8 0
Employees participate in the decision-making process. 23.067 8 0.003 Employees are given opportunity to suggest improvement 41.565 8 0 Employees can openly communicate with the superiors 43.174 8 0

Quantitative Data Analysis and Interpretation
©Ranjita Banerjee 270
Interpretation
It can be seen from Table 8.122 that the p-value of the following statements on HR
Practices are less than 0.05:‘Our organization places the right person in the right job’,
‘Selection is on the basis of merit’, ‘Organizes training and skill development programs’,
‘Employees are rotated from one job to another’, ‘Appraises the performance of
employees at regular intervals’, ‘Employees receive feedback’, ‘There is enough
opportunity for career growth’, ‘Compensation is decided on the basis of competence or
ability’, ‘Good performers are given financial incentives’, ‘Good performers are given
more authority and responsibility’, ‘Employees participate in the decision-making
process’, ‘Employees are given opportunity to suggest improvement’ and ‘Employees
can openly communicate with the superiors’.
Table 8.121 shows that the mean-ranks of the SME firms in BIDC Gorwa Industrial
Estate is high and is 142.44, 135.91, 155.56, 160.38, 148.31 and 159.06 respectively,
for the HR Practices related to Selection Method i.e Merit-based Selection, Training
and Skill development, Compensation w.r.t compensation based on one’s ability and
competence, Motivational aspects related to receiving financial incentives, Employee
Participation by way of participation in the decision-making process and
opportunity to suggest improvements.
Table 8.121 shows that the mean-rank of the SME firms in the Sardar Estate is high
and is 158.08 for the statement related to Manpower Planning i.e placing the right
person in the right job. Table 1 further shows that the mean-ranks of the SME firms
in Mujmahuda Industrial Estate is high and is 178.75, 166.63, 155, 165, 147.75 and
165.75 respectively, for the HR Practices related to Job-rotation, a regular
Performance Appraisal system, Feedback mechanism, Opportunities for career
growth, Delegation of Power related to authority and responsibility and open
communication with the superiors.
Thus, as the p-value of all the above statements on HR Practices is less than 0.05, so we
reject the null hypothesis and conclude that there is a significant influence of
Industrial Estate on HR Practices; with maximum influence of firms in the BIDC
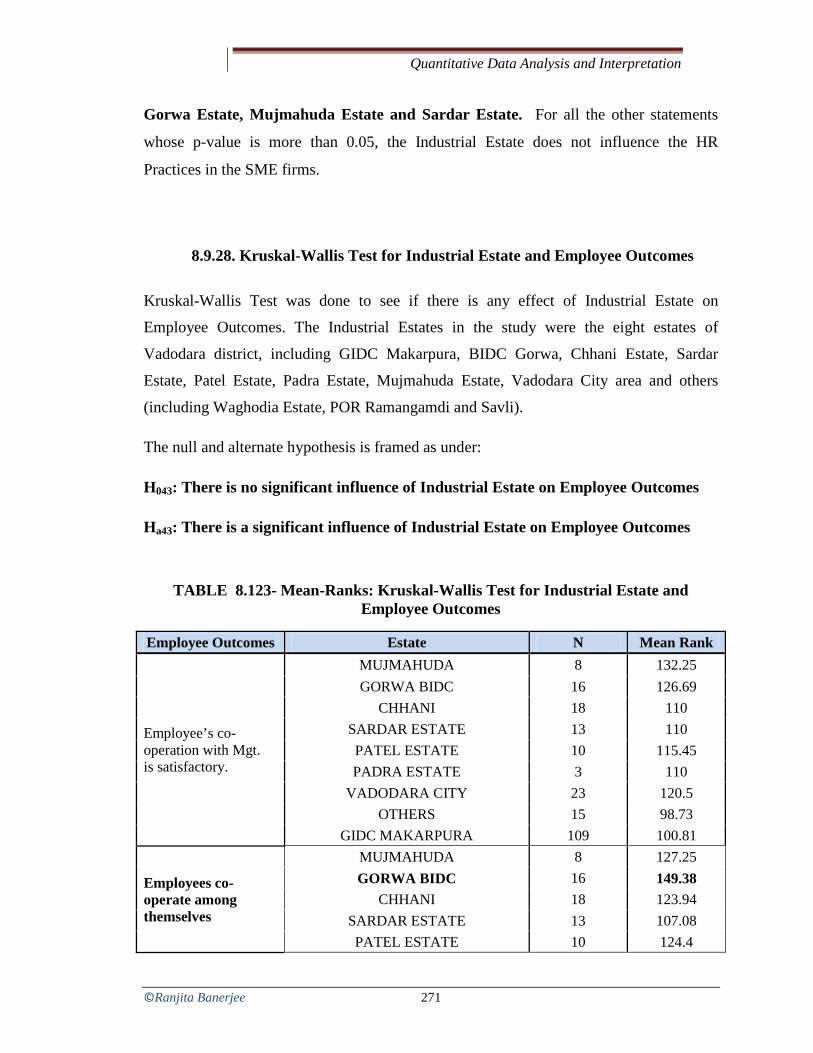
Quantitative Data Analysis and Interpretation
©Ranjita Banerjee 271
Gorwa Estate, Mujmahuda Estate and Sardar Estate. For all the other statements
whose p-value is more than 0.05, the Industrial Estate does not influence the HR
Practices in the SME firms.
8.9.28. Kruskal-Wallis Test for Industrial Estate and Employee Outcomes
Kruskal-Wallis Test was done to see if there is any effect of Industrial Estate on
Employee Outcomes. The Industrial Estates in the study were the eight estates of
Vadodara district, including GIDC Makarpura, BIDC Gorwa, Chhani Estate, Sardar
Estate, Patel Estate, Padra Estate, Mujmahuda Estate, Vadodara City area and others
(including Waghodia Estate, POR Ramangamdi and Savli).
The null and alternate hypothesis is framed as under:
H043: There is no significant influence of Industrial Estate on Employee Outcomes
Ha43: There is a significant influence of Industrial Estate on Employee Outcomes
TABLE 8.123- Mean-Ranks: Kruskal-Wallis Test for Industrial Estate and Employee Outcomes
Employee Outcomes Estate N Mean Rank
Employee’s co-operation with Mgt. is satisfactory.
MUJMAHUDA 8 132.25 GORWA BIDC 16 126.69
CHHANI 18 110 SARDAR ESTATE 13 110 PATEL ESTATE 10 115.45 PADRA ESTATE 3 110
VADODARA CITY 23 120.5 OTHERS 15 98.73
GIDC MAKARPURA 109 100.81
Employees co-operate among themselves
MUJMAHUDA 8 127.25 GORWA BIDC 16 149.38
CHHANI 18 123.94 SARDAR ESTATE 13 107.08 PATEL ESTATE 10 124.4

Quantitative Data Analysis and Interpretation
©Ranjita Banerjee 272
Employee Outcomes Estate N Mean Rank PADRA ESTATE 3 106
VADODARA CITY 23 103.15 OTHERS 15 95.6
GIDC MAKARPURA 109 99.27 Total 215
Employee’s general behavior is good
MUJMAHUDA 8 139 GORWA BIDC 16 139
CHHANI 18 124.11 SARDAR ESTATE 13 79.08 PATEL ESTATE 10 92.4 PADRA ESTATE 3 119
VADODARA CITY 23 116.67 OTHERS 15 113.23
GIDC MAKARPURA 109 100.54
Employees are committed
MUJMAHUDA 8 156.75 GORWA BIDC 16 142.59
CHHANI 18 123.72 SARDAR ESTATE 13 118.92 PATEL ESTATE 10 118.8 PADRA ESTATE 3 119
VADODARA CITY 23 117.96 OTHERS 15 113.9
GIDC MAKARPURA 109 91.24 Total 215
Employees are punctual and report daily
MUJMAHUDA 8 172.75 GORWA BIDC 16 123.09
CHHANI 18 121.11 SARDAR ESTATE 13 104.65 PATEL ESTATE 10 96.9 PADRA ESTATE 3 57.17
VADODARA CITY 23 122.07 OTHERS 15 124.67
GIDC MAKARPURA 109 96.42
Employees are regular
MUJMAHUDA 8 133.31 GORWA BIDC 16 143.16
CHHANI 18 130.94 SARDAR ESTATE 13 113.46 PATEL ESTATE 10 97.5 PADRA ESTATE 3 57.33

Quantitative Data Analysis and Interpretation
©Ranjita Banerjee 273
Employee Outcomes Estate N Mean Rank VADODARA CITY 23 123.76
OTHERS 15 124.9 GIDC MAKARPURA 109 93.25
Employees take up extra duties and responsibilities
MUJMAHUDA 8 134.38 GORWA BIDC 16 144.63
CHHANI 18 117.56 SARDAR ESTATE 13 125.5 PATEL ESTATE 10 94.9 PADRA ESTATE 3 126.5
VADODARA CITY 23 119.22 OTHERS 15 110.27
GIDC MAKARPURA 109 95.04
Employee’s follow general code of conduct and rules
MUJMAHUDA 8 157.5 GORWA BIDC 16 147.63
CHHANI 18 122.28 SARDAR ESTATE 13 130.15 PATEL ESTATE 10 101.8 PADRA ESTATE 3 144.33
VADODARA CITY 23 103.39 OTHERS 15 101.67
GIDC MAKARPURA 109 94.96 Total 215
(Source: SPSS output; Primary data)
TABLE 8.124- Test Statisticsab: Kruskal-Wallis Test for Industrial Estate and Employee Outcomes
Employee Outcomes Chi-Square Df Asymp.
Sig. Employee’s co-operation with Mgt. is satisfactory. 8.075 8 0.426 Employees co-operate among themselves 15.653 8 0.048 Employee’s general behavior is good 16.427 8 0.037 Employees are committed 23.957 8 0.002 Employees are punctual and report daily 21.446 8 0.006 Employees are regular 23.852 8 0.002 Employees take up extra duties and responsibilities 17.354 8 0.027 Employee’s follow general code of conduct and rules 25.138 8 0.001
a. Kruskal Wallis Test b. Grouping Variable: Estate

Quantitative Data Analysis and Interpretation
©Ranjita Banerjee 274
Interpretation
It can be seen from Table 8.124 that the p-value of all the following statements on
Employee Outcomes are less than 0.05:‘Employees co-operate among themselves’,
‘Employee’s general behavior is good ‘, ‘Employees are committed ‘, ‘Employees are
punctual and report daily’, ‘Employees are regular ‘, ‘Employees take up extra duties
and responsibilities’ and ‘Employee’s follow general code of conduct and rules’.
Table 8.123 shows that the mean-rank of the SME firms belonging to Mujmahuda
Estate is high and is 139, 156.75, 172.75 and 157.5 respectively for the statements on
Employee Outcomes related to Employee’s general behavior, Employee
Commitment, Punctuality and Employee’s conformance to rules and regulations.
Table 8.123 also shows that the mean rank is high and is 149.38, 139, 143.16 and
144.63 for the SME firms belonging to Gorwa Estate for the statements on
Employee Outcomes related to Employee’s co-operation among themselves,
Employee’s general behavior, Employee’s regularity and taking up extra duties and
responsibilities.
Thus, as the p-value of all the above statements on Employee Outcomes is less than
0.05, so we reject the null hypothesis and conclude that there is a significant
influence of the Industrial Estate on Employee Outcomes; with maximum influence
of SME firms belonging to Gorwa BIDC and Mujmahuda Indistrial Estate for the
Employee Outcomes related to Co-operation among employees, General behavior of
employees, Employee Commitment, Punctuality and Regularity of employees,
Taking up extra duties and responsibilities showing a sense of Involvement &
Participation and Conformance to rules & regulations.
For the other statement whose p-value is more than 0.05, the Industrial Estate does not
influence the Employee Outcomes in the SME firms.

Quantitative Data Analysis and Interpretation
©Ranjita Banerjee 275
8.9.29. Kruskal-Wallis Test for Industrial Estate and Organizational Outcomes
Kruskal-Wallis Test was done to see if there is any effect of Industrial Estate on
Organizational Outcomes. The Industrial Estates in the study were the eight estates of
Vadodara district, including GIDC Makarpura, BIDC Gorwa, Chhani Estate, Sardar
Estate, Patel Estate, Padra Estate, Mujmahuda Estate, Vadodara City area and others
(including Waghodia Estate, POR Ramangamdi and Savli).
The null and alternate hypothesis is framed as under:
H044: There is no significant influence of Industrial Estate on Organizational
Outcomes
Ha44: There is a significant influence of Industrial Estate on Organizational
Outcomes
TABLE 8.125- Mean-Ranks: Kruskal-Wallis Test for Industrial Estate and Organizational Outcomes
Organizational Outcomes Estate N Mean Rank
Customer satisfaction has increased
MUJMAHUDA 8 181.5 GORWA BIDC 16 137.63
CHHANI 18 129.83 SARDAR ESTATE 13 181.5 PATEL ESTATE 10 94 PADRA ESTATE 3 88.5
VADODARA CITY 23 116.8 OTHERS 15 85.1
GIDC MAKARPURA 109 89 Our suppliers/ vendors are satisfied with us.
MUJMAHUDA 8 182.5 GORWA BIDC 16 150.75
CHHANI 18 112.5 SARDAR ESTATE 13 182.5 PATEL ESTATE 10 98.9 PADRA ESTATE 3 73.17
VADODARA CITY 23 107.02

Quantitative Data Analysis and Interpretation
©Ranjita Banerjee 276
Organizational Outcomes Estate N Mean Rank
OTHERS 15 78.77 GIDC MAKARPURA 109 92.65
Measures have been taken by the firm for product/ service development
MUJMAHUDA 8 174.5 GORWA BIDC 16 154.63
CHHANI 18 133.17 SARDAR ESTATE 13 174.5
PATEL ESTATE 10 85.7 PADRA ESTATE 3 68.5
VADODARA CITY 23 92.59 OTHERS 15 78.9
GIDC MAKARPURA 109 94.58
Products/service Quality shows improvement
MUJMAHUDA 8 152.38 GORWA BIDC 16 144.06
CHHANI 18 144.5 SARDAR ESTATE 13 176 PATEL ESTATE 10 86.05 PADRA ESTATE 3 113
VADODARA CITY 23 115.59 OTHERS 15 77.2
GIDC MAKARPURA 109 89.83 The firm has displayed proper utilization of resources.
MUJMAHUDA 8 170.75 GORWA BIDC 16 170.75
CHHANI 18 152 SARDAR ESTATE 13 182 PATEL ESTATE 10 53.25 PADRA ESTATE 3 122
VADODARA CITY 23 117.17 OTHERS 15 79.2
GIDC MAKARPURA 109 84.76 Average Number of defects of products / deficiencies in service shows a decrease
MUJMAHUDA 8 141 GORWA BIDC 16 156.31
CHHANI 18 113.67 SARDAR ESTATE 13 187 PATEL ESTATE 10 64.25 PADRA ESTATE 3 130.67
VADODARA CITY 23 118.59 OTHERS 15 97.93
GIDC MAKARPURA 109 90.67

Quantitative Data Analysis and Interpretation
©Ranjita Banerjee 277
Organizational Outcomes Estate N Mean Rank
There is an increase in the Net Profit Margin.
MUJMAHUDA 8 109.5 GORWA BIDC 16 111.06
CHHANI 18 152.83 SARDAR ESTATE 13 170.65
PATEL ESTATE 10 109.5 PADRA ESTATE 3 99.5
VADODARA CITY 23 98.2 OTHERS 15 123.5
GIDC MAKARPURA 109 92.6 Return on Investment (in %) has increased
MUJMAHUDA 8 57.63 GORWA BIDC 16 134.38
CHHANI 18 152.33 SARDAR ESTATE 13 176.08
PATEL ESTATE 10 95 PADRA ESTATE 3 99.67
VADODARA CITY 23 101.52 OTHERS 15 97.2
GIDC MAKARPURA 109 96.66 Total 215
(Source: SPSS output; Primary data)
TABLE 8.126- Test Statisticsab: K-W Test for Industrial Estate and Org. Outcomes
Organizational Outcomes Chi-Square Df Asymp. Sig. Customer satisfaction has increased 60.68 8 0 Our suppliers/ vendors are satisfied with us. 59.745 8 0 Measures have been taken by the firm for product/ service development 58.123 8 0
Products/service Quality shows improvement 56.134 8 0 The firm has displayed proper utilization of resources. 95.64 8 0
Average Number of defects of products / deficiencies in service shows a decrease 57.471 8 0
There is an increase in the Net Profit Margin. 36.071 8 0 Return on Investment (in %) has increased 43.839 8 0

Quantitative Data Analysis and Interpretation
©Ranjita Banerjee 278
Interpretation
It can be seen from Table 8.126 that the p-value of all the statements on Organizational
Outcomes are less than 0.05: ‘Customer Satisfaction has increased’, ‘Supplier/ Vendor
Satisfaction has increased’, ‘Measures have been taken by the firm for product/ service
development’, ‘Products/service Quality shows improvement’, ‘The firm has displayed
proper utilization of resources’, ‘Average Number of defects of products / deficiencies in
service shows a decrease’, ‘There is an increase in the Net Profit Margin’ and ‘Return on
Investment (in %) has increased’.
Table 8.125 shows that the mean-ranks of the SME firms in Mujmahuda Estate is high
for the statements ‘Customer Satisfaction has increased’, ‘Supplier/ Vendor
Satisfaction has increased’, ‘Measures have been taken by the firm for product/
service development’, ‘Products/service Quality shows improvement’, ‘The firm has displayed proper utilization of resources’. Further, Table 8.125 shows that the mean-
ranks of the SME firms of Gorwa BIDC Estate is high and is 170.75 and 156.3 for the
statements ‘The firm has displayed proper utilization of resources’ and ‘Average Number of defects of products / deficiencies in service shows a decrease’. Table 8.125
also shows that the mean-ranks of the SME firms of Sardar Estate is high and is 174.5,
170.65 and 176.08 for the statements ‘Measures have been taken by the firm for
product/ service development’, ‘There is an increase in the Net Profit Margin’ and ‘Return on Investment (in %) has increased’. Thus, as the p-value of all the above
mentioned statements on Organizational Outcomes is less than 0.05, so we reject the
null hypothesis and conclude that there is a significant influence of Industrial Estate
on the Organizational Outcomes related to Customer Satisfaction, Supplier
Satisfaction, Product/ Service development, Product/ Service quality improvement,
Proper utilization of resources, decrease in defects of products / deficiencies in
service, increase in Net Profit Margin and Return on Investment (ROI); with
highest influence of firms belonging to the Mujmahuda Estate, Sardar Estate and
Gorwa GIDC.

Quantitative Data Analysis and Interpretation
©Ranjita Banerjee 279
8.10. Factor Analysis
Factor Analysis is a statistical technique used to estimate factors or to reduce the
dimensionality of a large number of variables to a fewer number of factors. Thus, the
main applications of factor analytic techniques can be summarized as (a) to reduce the
number of variables and (b) to detect the structure in the relationships between variables,
that is to classify variables. Therefore, factor analysis is applied as a data reduction or
structure detection method (the term factor analysis was first introduced by Thurstone
(1931).
TABLE 8.127- KMO and Bartlett's Test
Kaiser-Meyer-Olkin Measure of Sampling Adequacy. 0.826
Bartlett's Test of Sphericity Approx. Chi-Square 4118.558 Df 465 Sig. 0
(Source: SPSS output; Primary data)
Kaiser-Meyer-Olkin Measure of Sampling Adequacy should be greater than 0.70
indicating sufficient items for each factor. Table 8.127 shows that the results of the KMO
is 0.826 which is greater than 0.7. Bartlett’s Test of Sphericity should be significant (less
than .05), indicating that the correlation matrix is significantly different from an identity
matrix, in which correlations between variables are all zero. Table 8.127 also shows that
Bartlett’s Test of Sphericity (Significance: 0.000) indicates that factor analysis is
significant.

Quantitative Data Analysis and Interpretation
©Ranjita Banerjee 280
TABLE 8.128- Communalities
Variables Initial Extraction Our organization places the right person in the right job 1 0.494 Selection is on the basis of merit 1 0.553 Organizes training and skill development programs 1 0.323 Employees are rotated from one job to another 1 0.145 Appraises the performance of employees at regular intervals. 1 0.65 Employees receive feedback 1 0.574 Enough opportunity for career growth 1 0.539 Compensation is decided on the basis of competence or ability 1 0.507 Good performers are given financial incentives 1 0.333 Good performers are given non-financial incentives. 1 0.016 Good performers are given more authority and responsibility. 1 0.414 Employees participate in the decision-making process. 1 0.53 Employees are given opportunity to suggest improvement 1 0.546 Employees can openly communicate with the superiors 1 0.27 Competence of an Employee 1 0.378 Employee’s co-operation with is satisfactory. 1 0.453 Employees co-operate among themselves 1 0.443 Employee’s general behavior is good 1 0.484 Employees are committed 1 0.615 Employees are punctual and report daily 1 0.611 Employees are regular 1 0.566 Employees take up extra duties and responsibilities 1 0.588 Employee’s follow general code of conduct and rules 1 0.514 Customer satisfaction has increased 1 0.637 Our suppliers/ vendors are satisfied with us. 1 0.553 Measures have been taken by the firm for product/ service development 1 0.605
Products/service Quality shows improvement 1 0.639 The firm has displayed proper utilization of resources. 1 0.606 Average Number of defects of products / deficiencies in service shows a decrease 1 0.469
There is an increase in the Net Profit Margin. 1 0.462 Return on Investment (in %) has increased 1 0.542
Extraction Method: Principal Component Analysis; (Source: SPSS output; Primary data)

Quantitative Data Analysis and Interpretation
©Ranjita Banerjee 281
TABLE 8.129- Total Variance Explained
Component
Initial Eigenvalues Extraction Sums of Squared Loadings
Total % of Variance Cumulative
% Total 1 9.607 30.991 30.991 9.607 2 2.949 9.513 40.504 2.949 3 2.504 8.076 48.581 2.504 4 1.729 5.578 54.158 5 1.667 5.378 59.536 6 1.372 4.427 63.963 7 1.158 3.734 67.697 8 0.959 3.093 70.79 9 0.921 2.971 73.761
10 0.825 2.661 76.423 11 0.798 2.575 78.998 12 0.721 2.326 81.324 13 0.62 1.998 83.323 14 0.565 1.822 85.144 15 0.527 1.699 86.843 16 0.451 1.454 88.297 17 0.432 1.395 89.692 18 0.396 1.276 90.968 19 0.342 1.105 92.073 20 0.33 1.063 93.136 21 0.307 0.989 94.125 22 0.286 0.922 95.047 23 0.266 0.858 95.905 24 0.23 0.741 96.646 25 0.204 0.659 97.305 26 0.179 0.577 97.882 27 0.162 0.523 98.404 28 0.147 0.475 98.879 29 0.137 0.443 99.321 30 0.119 0.384 99.705 31 0.091 0.295 100
(Source: SPSS output; Primary data)

Quantitative Data Analysis and Interpretation
©Ranjita Banerjee 282
TABLE 8.130- Total Variance Explained (Rotated)
Component
Extraction Sums of Squared Loadings Rotation Sums of Squared Loadings
% of Variance Cumulative % Total
% of Variance Cumulative %
1 30.991 30.991 6.295 20.308 20.308 2 9.513 40.504 4.466 14.407 34.715 3 8.076 48.581 4.298 13.866 48.581 4 5 6 7 8 9 10 11 12 13 14 15 16 17 18 19 20 21 22 23 24 25 26 27 28 29 30 31
Extraction Method: Principal Component Analysis; (Source: SPSS output; Primary data)

Quantitative Data Analysis and Interpretation
©Ranjita Banerjee 283
Table 8.130 of Total Variance Explained (Rotated) shows how the variance is divided
among the 31 possible factors. Note that three factors have eigenvalues (a measure of
explained variance) greater than 1.0, which is a common criterion for a factor to be
useful. When the eigenvalue is less than 1.0, this means that the factor explains less
information than a single item would have explained. Most researchers would not
consider the information gained from such a factor to be sufficient to justify keeping that
factor. Thus, if not specified otherwise, the computer would have looked for the best
four-factor solution by "rotating" four factors. As the researcher specified that only three
factors to be rotated, only three were rotated. It can be concluded that these three factors
extracted from the 31 variables are explaining about 48.58% variance of total variance.
8.10.1. Scree Plot
Scree Plot is a graphical method for determining the number of factors. The eigenvalues
are plotted in the sequence of the principal factors. The number of factors is chosen
where the plot levels off to a linear decreasing pattern (Shows 3 factors).
(Source: SPSS output; Primary data)
Figure 8.31 - Scree Plot

Quantitative Data Analysis and Interpretation
©Ranjita Banerjee 284
TABLE 8.131- Component Matrixa
Variables Component
1 2 3 Products/service Quality shows improvement 0.76 Measures have been taken by the firm for product/ service development 0.739 The firm has displayed proper utilization of resources. 0.729 Our suppliers/ vendors are satisfied with us. 0.715 Customer satisfaction has increased 0.702 Average Number of defects of products / deficiencies in service shows a decrease 0.68 Compensation is decided on the basis of competence or ability 0.667 Employees are committed 0.66 Employees are punctual and report daily 0.631 Appraises the performance of employees at regular intervals. 0.631 Employees take up extra duties and responsibilities 0.63 Enough opportunity for career growth 0.614 Employees receive feedback 0.607 Employee’s co-operation with is satisfactory. 0.604 Employee’s follow general code of conduct and rules 0.589 Employee’s general behavior is good 0.571 Employees are regular 0.57 Our organization places the right person in the right job 0.53 Employees co-operate among themselves 0.524 Competence of an Employee Good performers are given financial incentives Organizes training and skill development programs Employees can openly communicate with the superiors Employees are rotated from one job to another Selection is on the basis of merit 0.529 Good performers are given more authority and responsibility. Good performers are given non-financial incentives. Return on Investment (in %) has increased -0.692 Employees participate in the decision-making process. 0.649 There is an increase in the Net Profit Margin. -0.578 Employees are given opportunity to suggest improvement 0.566
Extraction Method: Principal Component Analysis; a. 3 components extracted; (Source: SPSS
output; Primary data)

Quantitative Data Analysis and Interpretation
©Ranjita Banerjee 285
TABLE 8.132- Rotated Component Matrixa
Variables Component
1 2 3 Employees are punctual and report daily 0.766 Employees are committed 0.756 Employees take up extra duties and responsibilities 0.755 Employees are regular 0.744 Employee’s follow general code of conduct and rules 0.705 Employee’s general behavior is good 0.678 Employees co-operate among themselves 0.654 Employee’s co-operation with Mgt. is satisfactory. 0.638 Competence of an Employee 0.552 Products/service Quality shows improvement 0.551 0.547 Average Number of defects of products / deficiencies in service shows a decrease Employees can openly communicate with the superiors Selection is on the basis of merit 0.704 Employees are given opportunity to suggest improvement 0.686 Enough opportunity for career growth 0.651 Employees receive feedback 0.651 Good performers are given more authority and responsibility. 0.635 Employees participate in the decision-making process. 0.591 Our organization places the right person in the right job 0.581 Good performers are given financial incentives Organizes training and skill development programs Employees are rotated from one job to another Good performers are given non-financial incentives. Return on Investment (in %) has increased 0.717 There is an increase in the Net Profit Margin. 0.679 Customer satisfaction has increased 0.629 Appraises the performance of employees at regular intervals. 0.522 0.607 The firm has displayed proper utilization of resources. 0.59 Measures have been taken by the firm for product/ service development 0.57
Our suppliers/ vendors are satisfied with us. 0.524 Compensation is decided on the basis of competence or ability Extraction Method: Principal Component Analysis; Rotation Method: Varimax with Kaiser Normalization; a. Rotation converged in 6 iterations; (Source: SPSS output; Primary data)

Quantitative Data Analysis and Interpretation
©Ranjita Banerjee 286
8.10.2. Naming of Factors
It can be corroborated here that through Factor Analysis also the three distinguished
factors identified were same as that identified by the researcher in the questionnaire.
Table 8.133 shows the different variables under the same factor as well as the naming of
factors. The three Components (Factors) were identified and named as: Component 1:
Employee related Outcomes; Component 2: HR Practices and Component 3:
Organizational related Outcomes.
TABLE 8.133- Identification and Naming of the Factors
Component 1 (Employee-related Outcomes) Component 2 (HR Practices)
Component 3 (Organizational related
Outcomes) Employees are punctual and report daily
Selection is on the basis of merit
Product / Service Quality Employees are committed Employees are given
opportunity to suggest improvement
Return on Investment (in %) has increased
Employees take up extra duties and responsibilities
Enough opportunity for career growth
There is an increase in the Net Profit Margin.
Employees are regular Employees receive feedback Customer satisfaction has increased
Employee’s follow general code of conduct and rules
Good performers are given more authority and responsibility.
The firm has displayed proper utilization of resources.
Employee’s general behavior is good
Employees participate in the decision-making process.
Measures have been taken by the firm for product/ service development
Employees co-operate among themselves
Our organization places the right person in the right job
Our suppliers/ vendors are satisfied with us.
Employee’s co-operation with Mgt. is satisfactory. Appraises the performance of
employees at regular intervals.
Competence of an Employee
(Source: Author, Input from Primary data)

Quantitative Data Analysis and Interpretation
©Ranjita Banerjee 287
TABLE 8.134- Component Transformation Matrix
Component 1 2 3
1 .712 .494 .500
2 -.656 .722 .221
3 .252 .485 -.838
Extraction Method: Principal Component Analysis; Rotation Method: Varimax with Kaiser
Normalization; (Source: SPSS output; Primary data)

Quantitative Data Analysis and Interpretation
©Ranjita Banerjee 288
8.11. Regression Analysis
Simple regression is used to examine the relationship between one dependent and one
independent variable. After performing an analysis, the regression statistics can be used
to predict the dependent variable when the independent variable is known. The
regression line (known as the least squares line) is a plot of the expected value of the
dependent variable for all values of the independent variable. Technically, it is the line
that "minimizes the squared residuals". The regression line is the one that best fits the
data on a scatterplot (Malhotra N & Dash S, 2011). Regression Analysis is carried out on
summated scale of HR Practices, Employee Outcomes and Organizational Performances.
TABLE 8.135- Variables Entered/Removedb
Model Variables Entered Variables Removed Method
1 Summated Employee Outcome, Summated HR Practice
- Enter
a. All requested variables entered .b. Dep. Variable: Summ. Org. Perf.
TABLE 8.136- Model Summary
Model R R Square Adjusted R
Square Std. Error of the
Estimate
1 .452a .205 .197 .51437
a. Predictors: (Constant), Summated Employee Outcome, Summated HR Practice
The Adjusted R Square value is quite low but as the regression analysis is carried out on
ordinal scale it is bound to happen.
The null and alternate hypothesis are framed as under:
H0: There is no joint influence of HR Practice and Employee Outcome on
Organizational Performance.
H1a: There is joint influence of HR Practice and Employee Outcome on
Organizational Performance.

Quantitative Data Analysis and Interpretation
©Ranjita Banerjee 289
TABLE 8.137-ANOVAb
Model Sum of Squares df
Mean Square F Sig.
1 Regression 14.439 2 7.22 27.287 .000a
Residual 56.091 212 0.265 Total 70.53 214
a. Predictors: (Constant), Summated Employee Outcome, Summated HR Practice b. Dependent Variable: Summated Organizational Performance
As the p-value of ANOVA is 0.000 < 0.05 so we can conclude that HR Practice and
Employee Outcome jointly influences Organizational Performance.
TABLE 8.138A - Coefficientsa
Model Unstandardized Coefficients
B Std. Error 1 (Constant) 2.007 0.323
Summated HR Practice 0.213 0.075 Summated Employee Outcome 0.341 0.058
(Source: SPSS output; Primary data)
TABLE 8.138B- Coefficientsa
Model
Standardized Coefficients
T Sig. Beta 1 (Constant)
6.207 0
Summated HR Practice 0.18 2.853 0.005 Summated Employee Outcome
0.373 5.894 0
a. Dependent Variable: Summated Organizational Performance
Table 8.138B shows that the p-value of Summated HR Practice and Summated
Employee Outcome is 0.005 and 0.000 respectively which is less than 0.05 so the

Quantitative Data Analysis and Interpretation
©Ranjita Banerjee 290
coefficients of Summated HR Practice and Summated Employee Outcome are significantly affecting Organizational Performance. The unstandardized coefficients
of Summated HR Practice and Summated Employee Outcome are 0.213 and 0.341.
The model which is created using summated scale is (Refer Table 8.138B):
Summated Organizational Outcome = 0.180*Summated HR Practice +
0.373*Summated Employee
As the p-value of Summated HR Practice and Summated Employee Outcome is
0.005 and 0.000 respectively which is less than 0.05 so we reject the null hypothesis
and conclude that there is a joint influence of HR Practice and Employee Outcome
on Organizational Performance.
However, it is to be also noted here that the Adjusted R Square value is quite low but as
the regression analysis is carried out on ordinal scale it is bound to happen this way. To
overcome the limitation, Structural Equation Modeling was incorporated to better
understand the linkages between HR Practices, Employee Outcomes and Organizational
Outcomes.

Quantitative Data Analysis and Interpretation
©Ranjita Banerjee 291
8.12. Structural Equation Modeling (SEM)
Structural Equation Modeling is a family of statistical models which seeks to explain the
relationships among multiple variables. To put it simply, it is a combination of Multiple
Regression Analysis and Factor Analysis. It is also known as ‘causal modeling’ or
‘analysis of co-variance structures’. Structural Models basically shows how constructs
are associated with each other. It shows how measured variables together represent
construct. The various types of variables in SEM include the Exogenous variables which
are independent variables, Endogenous variables which are the dependent variables,
Observed variables which are measured and Latent variables which are unobserved. Two
special types of SEM include Path Analysis and Confirmatory Factor Analysis (CFA). It
surpasses over Multiple Regression, Factor Analysis, Discriminant Analysis etc. in a way
that each of these techniques can examine single relationship at a time; whereas SEM
expands the researcher’s explanatory ability and enhances statistical efficiency.
Major Properties of SEM
• It is not a null-hypothesis oriented method, but a ‘model-oriented method’.
• It is a system of linear equations that describes a network of relations among
variables.
• It can be applied in both, confirmatory (testing) or exploratory (model-building)
mode.
In the present study three modifications have been done in the Base Model with the
motive to come up with the ‘Best-Fit Model’ by doing certain modifications. The main
objective of the SEM Model was to establish the linkages between HR Practices,
Employee Outcomes and Organizational Outcomes. (Source: SAS/STAT User’s Guide
Version 8)

Quantitative Data Analysis and Interpretation
©Ranjita Banerjee 292
8.12.1. Base Model
(Source: AMOS Output; Primary data)
Figure 8.32 - SEM BASE MODEL
A hypothesized Technology Acceptance Model was tested using Structural Equation
Modeling using AMOS 18 software.
Hypotheses are as follows
Linkage 1:
H1. HR Practices positively and directly affects Organizational Performance.
Linkage 2:
H2. Employee Outcome positively and directly affects Organizational Performance.
Linkage 3: H3. There exists covariance between HR Practices and Employee Outcome.

Quantitative Data Analysis and Interpretation
©Ranjita Banerjee 293
TABLE 8.139 - Relation between Constructs
Relation Between Constructs Estimate P Value Null Hypothesis HR PracticesOrganizational Performance 0.879 0 Reject Employee Outcome Organizational Performance 0.702 0 Reject
HR Practices Employee Outcome 0.096 0 Reject (Interpretation based on AMOS Output)
Examination of the path coefficients and the significance level between the constructs in
the model were used to test the hypotheses. The analysis in Table 8.139 shows that HR
Practices has a positive significant relationship with Organizational Performance.
Employee Outcome has a positive significant relationship with Organizational
Performance; and that there exists a covariance between HR Practices and Employee
Outcome.
TABLE 8.140 - Parameter Summary
Weights Covariances Variances Means Intercepts Total Fixed 36 0 1 0 0 37 Labeled 0 0 0 0 0 0 Unlabeled 29 1 33 0 0 63 Total 65 1 34 0 0 100
(Source: AMOS Output; Primary data)
H0: Relationships does not exist between this constructs.
H1: Relationships exist between this constructs.
Notes for Model (Default model)
Computation of degrees of freedom (Default model)
Number of distinct sample moments: 496
Number of distinct parameters to be estimated: 63
Degrees of freedom (496 - 63): 433
Result (Default model)
Minimum was achieved
Chi-square = 2224.358

Quantitative Data Analysis and Interpretation
©Ranjita Banerjee 294
Degrees of freedom = 433
Probability level = .000
As the p-value of Chi-Square is less than 0.05, so null hypothesis is rejected and we
conclude that relationship exists between this constructs.
Estimates (Group number 1 - Default model)
Scalar Estimates (Group number 1 - Default model)
Maximum Likelihood Estimates
Regression Weights: (Group number 1 - Default model)
TABLE 8.141 - SEM Output for Estimates, Standard Errors and P-Value
Estimate S.E. C.R. P
Org_Performance <--- Employee Outcome 0.702 0.186 3.767 ***
Org_Performance <--- HR PRACTICES 0.879 0.228 3.847 *** RIGHT <--- HR PRACTICES 1
SELEC <--- HR PRACTICES 1.223 0.141 8.704 *** TRAIN <--- HR PRACTICES 1.315 0.189 6.946 *** ROTA <--- HR PRACTICES 0.698 0.162 4.307 *** PERF <--- HR PRACTICES 1.16 0.122 9.504 *** FEED <--- HR PRACTICES 1.183 0.125 9.467 *** CAREER <--- HR PRACTICES 1.373 0.157 8.75 *** COMP <--- HR PRACTICES 0.941 0.107 8.767 *** FININC <--- HR PRACTICES 1.346 0.181 7.454 *** NOFIN <--- HR PRACTICES -0.089 0.196 -0.452 0.651 AUTH <--- HR PRACTICES 1.013 0.157 6.438 *** DECI <--- HR PRACTICES 0.721 0.189 3.806 *** IMPRV <--- HR PRACTICES 0.689 0.125 5.504 *** OPEN <--- HR PRACTICES 0.521 0.102 5.095 ***
RULES <--- Employee Outcome 1
INVLV <--- Employee Outcome 1.291 0.14 9.232 ***

Quantitative Data Analysis and Interpretation
©Ranjita Banerjee 295
Estimate S.E. C.R. P
REGLR <--- Employee Outcome 1.249 0.139 8.982 ***
COMMT <--- Employee Outcome 1.346 0.141 9.564 ***
BEHVR <--- Employee Outcome 0.946 0.113 8.398 ***
COOPM <--- Employee Outcome 0.975 0.119 8.217 ***
COOPE <--- Employee Outcome 0.924 0.115 8.037 ***
COMP1 <--- Employee Outcome 0.744 0.107 6.97 ***
CUSTSATIS <--- Org_Performance 0.617 0.033 18.424 *** SUPPLSATI <--- Org_Performance 0.601 0.034 17.75 *** PRODDEV <--- Org_Performance 0.577 0.035 16.563 *** QUALITY <--- Org_Performance 0
UTI <--- Org_Performance 0.64 0.038 17.028 *** DEFECTS <--- Org_Performance 0.501 0.04 12.503 *** PROFIT <--- Org_Performance 0.38 0.049 7.757 *** ROI <--- Org_Performance 1 (Source: AMOS Output; Primary data)
TABLE 8.142 - Standardized Regression Weights: (Group number 1 - Default model)
Estimate
Organization_Performance <--- Employee Outcome 0.304 Organization_Performance <--- HR PRACTICES 0.311 RIGHT <--- HR PRACTICES 0.663 SELEC <--- HR PRACTICES 0.679 TRAIN <--- HR PRACTICES 0.526 ROTA <--- HR PRACTICES 0.317 PERF <--- HR PRACTICES 0.754 FEED <--- HR PRACTICES 0.75 CAREER <--- HR PRACTICES 0.683 COMP <--- HR PRACTICES 0.685 FININC <--- HR PRACTICES 0.569

Quantitative Data Analysis and Interpretation
©Ranjita Banerjee 296
Estimate
NOFIN <--- HR PRACTICES -0.033 AUTH <--- HR PRACTICES 0.485 DECI <--- HR PRACTICES 0.279 IMPRV <--- HR PRACTICES 0.41 OPEN <--- HR PRACTICES 0.378 RULES <--- Employee Outcome 0.639 INVLV <--- Employee Outcome 0.756 REGLR <--- Employee Outcome 0.729 PUNC <--- Employee Outcome 0.734 COMMT <--- Employee Outcome 0.792 BEHVR <--- Employee Outcome 0.67 COOPM <--- Employee Outcome 0.652 COOPE <--- Employee Outcome 0.635 COMP1 <--- Employee Outcome 0.537 CUSTSATIS <--- Organization_Performance 0.887 SUPPLSATI <--- Organization_Performance 0.871 PRODDEV <--- Organization_Performance 0.841 QUALITY <--- Organization_Performance 0 UTI <--- Organization_Performance 0.853 DEFECTS <--- Organization_Performance 0.713 PROFIT <--- Organization_Performance 0.499 ROI <--- Organization_Performance 0.764 (Source: AMOS Output; Primary data)
TABLE 8.143 - Covariances: (Group number 1 - Default model)
Estimate S.E. C.R. P Label
HR PRACTICES <--> Employee Outcome 0.096 0.021 4.633 *** par_30
TABLE 8.144 - Correlations: (Group number 1 - Default model)
Estimate
HR PRACTICES <--> Employee Outcome .453
(Source: AMOS Output; Primary data)

Quantitative Data Analysis and Interpretation
©Ranjita Banerjee 297
TABLE 8.145 - Variances: (Group number 1 - Default model)
Estimate S.E. C.R. P Label
HR PRACTICES 0.173 0.033 5.223 *** par_31 Employee Outcome 0.258 0.052 5.008 *** par_32 e32 1
e1 0.22 0.024 9.337 *** par_33 e2 0.302 0.033 9.245 *** par_34 e3 0.778 0.079 9.853 *** par_35 e4 0.751 0.074 10.201 *** par_36 e5 0.176 0.02 8.645 *** par_37 e6 0.187 0.022 8.683 *** par_38 e7 0.372 0.04 9.219 *** par_39 e8 0.173 0.019 9.21 *** par_40 e9 0.653 0.067 9.73 *** par_41 e10 1.263 0.122 10.343 *** par_42 e11 0.576 0.058 9.951 *** par_43 e12 1.06 0.104 10.236 *** par_44 e13 0.406 0.04 10.086 *** par_45 e14 0.281 0.028 10.131 *** par_46 e15 0.374 0.039 9.547 *** par_47 e16 0.324 0.037 8.799 *** par_48 e17 0.355 0.039 9.027 *** par_49 e18 0.35 0.039 8.988 *** par_50 e19 0.278 0.033 8.387 *** par_51 e20 0.283 0.03 9.401 *** par_52 e21 0.331 0.035 9.487 *** par_53 e22 0.326 0.034 9.562 *** par_54 e23 0.352 0.036 9.876 *** par_55 e24 0.143 0.018 7.747 *** par_56 e25 0.159 0.02 8.129 *** par_57 e26 0.19 0.022 8.648 *** par_58 e27 0.476 0.046 10.344 *** par_59 e28 0.212 0.025 8.465 *** par_60 e29 0.335 0.035 9.626 *** par_61 e30 0.602 0.06 10.115 *** par_62 e31 0.982 0.104 9.401 *** par_63 (Source: AMOS Output; Primary data)
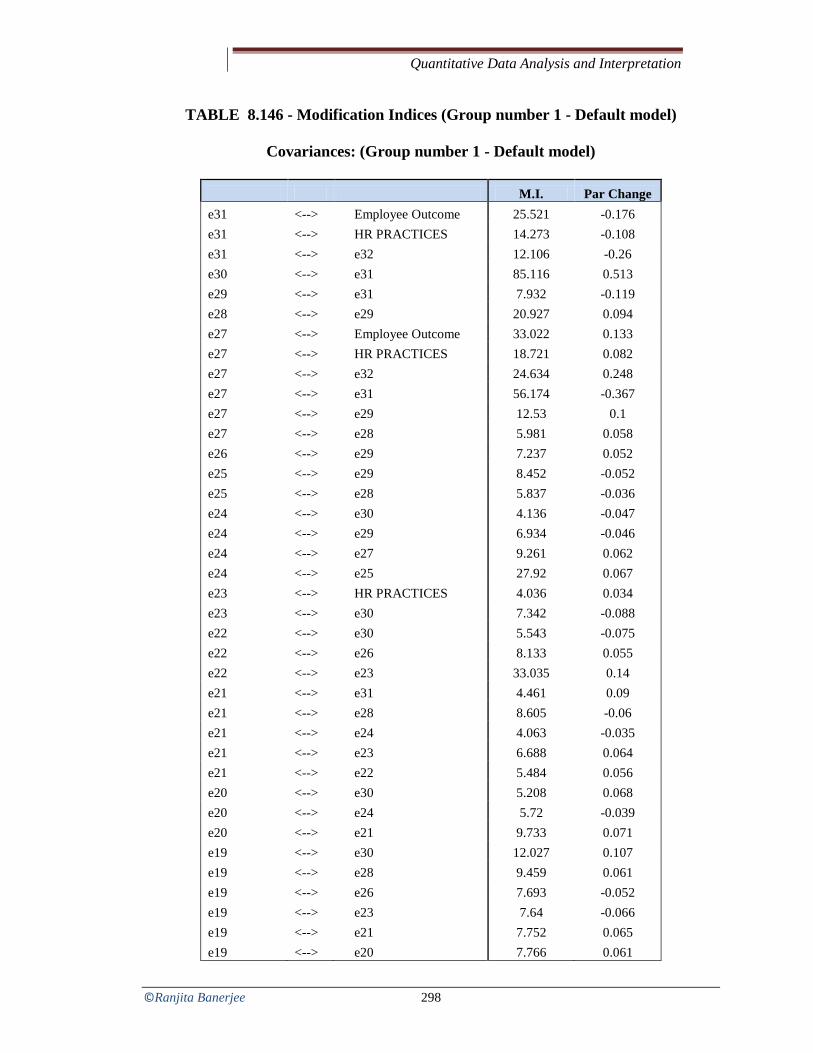
Quantitative Data Analysis and Interpretation
©Ranjita Banerjee 298
TABLE 8.146 - Modification Indices (Group number 1 - Default model)
Covariances: (Group number 1 - Default model)
M.I. Par Change e31 <--> Employee Outcome 25.521 -0.176 e31 <--> HR PRACTICES 14.273 -0.108 e31 <--> e32 12.106 -0.26 e30 <--> e31 85.116 0.513 e29 <--> e31 7.932 -0.119 e28 <--> e29 20.927 0.094 e27 <--> Employee Outcome 33.022 0.133 e27 <--> HR PRACTICES 18.721 0.082 e27 <--> e32 24.634 0.248 e27 <--> e31 56.174 -0.367 e27 <--> e29 12.53 0.1 e27 <--> e28 5.981 0.058 e26 <--> e29 7.237 0.052 e25 <--> e29 8.452 -0.052 e25 <--> e28 5.837 -0.036 e24 <--> e30 4.136 -0.047 e24 <--> e29 6.934 -0.046 e24 <--> e27 9.261 0.062 e24 <--> e25 27.92 0.067 e23 <--> HR PRACTICES 4.036 0.034 e23 <--> e30 7.342 -0.088 e22 <--> e30 5.543 -0.075 e22 <--> e26 8.133 0.055 e22 <--> e23 33.035 0.14 e21 <--> e31 4.461 0.09 e21 <--> e28 8.605 -0.06 e21 <--> e24 4.063 -0.035 e21 <--> e23 6.688 0.064 e21 <--> e22 5.484 0.056 e20 <--> e30 5.208 0.068 e20 <--> e24 5.72 -0.039 e20 <--> e21 9.733 0.071 e19 <--> e30 12.027 0.107 e19 <--> e28 9.459 0.061 e19 <--> e26 7.693 -0.052 e19 <--> e23 7.64 -0.066 e19 <--> e21 7.752 0.065 e19 <--> e20 7.766 0.061
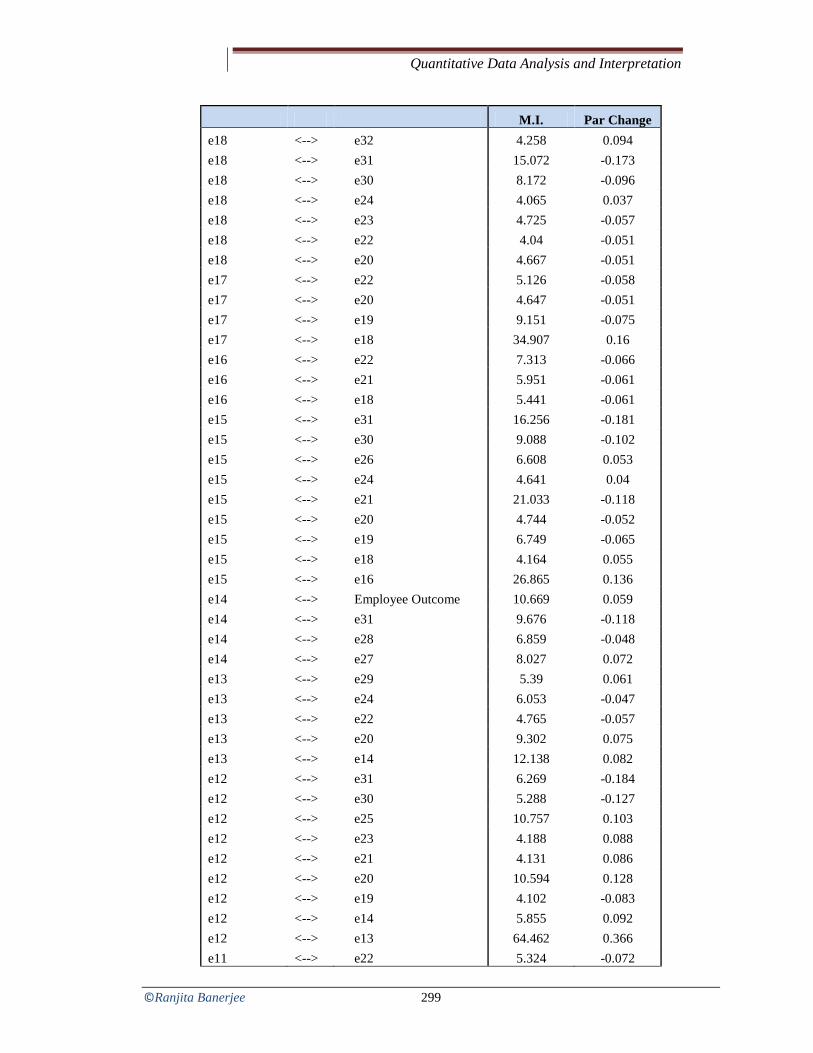
Quantitative Data Analysis and Interpretation
©Ranjita Banerjee 299
M.I. Par Change e18 <--> e32 4.258 0.094 e18 <--> e31 15.072 -0.173 e18 <--> e30 8.172 -0.096 e18 <--> e24 4.065 0.037 e18 <--> e23 4.725 -0.057 e18 <--> e22 4.04 -0.051 e18 <--> e20 4.667 -0.051 e17 <--> e22 5.126 -0.058 e17 <--> e20 4.647 -0.051 e17 <--> e19 9.151 -0.075 e17 <--> e18 34.907 0.16 e16 <--> e22 7.313 -0.066 e16 <--> e21 5.951 -0.061 e16 <--> e18 5.441 -0.061 e15 <--> e31 16.256 -0.181 e15 <--> e30 9.088 -0.102 e15 <--> e26 6.608 0.053 e15 <--> e24 4.641 0.04 e15 <--> e21 21.033 -0.118 e15 <--> e20 4.744 -0.052 e15 <--> e19 6.749 -0.065 e15 <--> e18 4.164 0.055 e15 <--> e16 26.865 0.136 e14 <--> Employee Outcome 10.669 0.059 e14 <--> e31 9.676 -0.118 e14 <--> e28 6.859 -0.048 e14 <--> e27 8.027 0.072 e13 <--> e29 5.39 0.061 e13 <--> e24 6.053 -0.047 e13 <--> e22 4.765 -0.057 e13 <--> e20 9.302 0.075 e13 <--> e14 12.138 0.082 e12 <--> e31 6.269 -0.184 e12 <--> e30 5.288 -0.127 e12 <--> e25 10.757 0.103 e12 <--> e23 4.188 0.088 e12 <--> e21 4.131 0.086 e12 <--> e20 10.594 0.128 e12 <--> e19 4.102 -0.083 e12 <--> e14 5.855 0.092 e12 <--> e13 64.462 0.366 e11 <--> e22 5.324 -0.072

Quantitative Data Analysis and Interpretation
©Ranjita Banerjee 300
M.I. Par Change e11 <--> e20 16.995 0.121 e11 <--> e15 10.225 -0.107 e11 <--> e13 18.156 0.145 e11 <--> e12 22.247 0.258 e10 <--> e30 8.82 0.179 e10 <--> e29 4.012 0.092 e10 <--> e26 4.649 -0.078 e10 <--> e23 4.452 -0.098 e10 <--> e21 11.92 0.159 e9 <--> e31 4.04 0.118 e9 <--> e30 5.785 0.107 e9 <--> e29 8.048 -0.096 e9 <--> e18 13.831 -0.133 e9 <--> e17 7.148 0.096 e9 <--> e13 9.282 -0.111 e8 <--> Employee Outcome 7.725 0.041 e8 <--> e27 7.317 0.056 e8 <--> e26 7.46 0.039 e8 <--> e25 6.893 -0.035 e8 <--> e19 5.253 0.04 e8 <--> e15 4.209 0.039 e8 <--> e13 8.432 -0.056 e8 <--> e12 8.171 -0.088 e8 <--> e11 16.413 -0.094 e7 <--> e31 7.944 -0.128 e7 <--> e30 8.405 -0.1 e7 <--> e16 13.848 0.1 e7 <--> e12 16.006 0.181 e7 <--> e8 6.331 0.048 e6 <--> e29 4.247 -0.039 e6 <--> e25 11.3 0.048 e6 <--> e21 4.634 -0.041 e6 <--> e19 18.516 -0.079 e6 <--> e18 5.923 0.049 e6 <--> e15 7.154 0.054 e5 <--> e32 7.156 0.088 e5 <--> e30 8.031 0.069 e5 <--> e14 4.829 -0.036 e5 <--> e13 22.753 -0.095 e5 <--> e12 26.072 -0.164 e5 <--> e8 9.35 0.041 e5 <--> e7 8.399 -0.057

Quantitative Data Analysis and Interpretation
©Ranjita Banerjee 301
M.I. Par Change e5 <--> e6 20.237 0.064 e4 <--> e29 4.336 -0.074 e4 <--> e26 6.407 -0.071 e4 <--> e25 5.113 0.06 e4 <--> e23 4.762 -0.079 e4 <--> e17 5.957 -0.092 e4 <--> e16 11.602 0.124 e4 <--> e13 7.028 0.102 e4 <--> e12 15.041 0.239 e4 <--> e10 5.412 -0.156 e4 <--> e6 21.481 0.129 e3 <--> e31 4.79 0.14 e3 <--> e29 5.104 -0.083 e3 <--> e22 15.384 0.143 e3 <--> e19 5.032 0.08 e3 <--> e18 5.047 -0.087 e3 <--> e9 9.025 0.153 e3 <--> e7 13.726 -0.146 e2 <--> Employee Outcome 4.548 -0.041 e2 <--> e29 35.866 0.142 e2 <--> e25 12.11 -0.061 e2 <--> e24 11.985 -0.059 e2 <--> e16 6.633 -0.062 e2 <--> e13 6.255 0.064 e2 <--> e11 7.535 0.084 e2 <--> e8 9.883 -0.054 e2 <--> e4 17.199 -0.143 e1 <--> e23 6.96 0.054 e1 <--> e22 6.867 0.052 e1 <--> e20 7.269 -0.05 e1 <--> e16 9.729 -0.064 e1 <--> e14 5.219 -0.041 e1 <--> e12 4.397 -0.073 e1 <--> e6 5.454 -0.036 e1 <--> e4 16.814 -0.12 e1 <--> e3 4.307 0.063 e1 <--> e2 42.263 0.125
(Source: AMOS Output; Primary data)

Quantitative Data Analysis and Interpretation
©Ranjita Banerjee 302
TABLE 8.147 - Variances: (Group number 1 - Default model)
M.I. Par Change
e32
38.218 -.671
TABLE 8.148 - Regression Weights: (Group number 1 - Default model)
M.I. Par Change
ROI <--- Employee Outcome 54.306 -1.084 ROI <--- HR PRACTICES 43.992 -1.2 ROI <--- Organization_Performance 50.125 -0.44 ROI <--- PROFIT 20.178 0.356 ROI <--- DEFECTS 46.484 -0.586 ROI <--- UTI 38.006 -0.496 ROI <--- QUALITY 56.174 -0.77 ROI <--- PRODDEV 41.876 -0.57 ROI <--- SUPPLSATI 40.641 -0.558 ROI <--- CUSTSATIS 43.417 -0.572 ROI <--- COMP1 26.032 -0.514 ROI <--- COOPE 24.425 -0.475 ROI <--- COOPM 9.125 -0.282 ROI <--- BEHVR 14.683 -0.379 ROI <--- COMMT 19.604 -0.364 ROI <--- PUNC 57.902 -0.619 ROI <--- REGLR 29.001 -0.439 ROI <--- INVLV 28.044 -0.433 ROI <--- RULES 55.638 -0.665 ROI <--- OPEN 27.235 -0.646 ROI <--- IMPRV 8.876 -0.303 ROI <--- DECI 17.15 -0.274 ROI <--- AUTH 11.374 -0.276 ROI <--- COMP 25.468 -0.627 ROI <--- CAREER 38.832 -0.529 ROI <--- FEED 29.294 -0.586 ROI <--- PERF 20.89 -0.507 ROI <--- SELEC 9.653 -0.294 ROI <--- RIGHT 17.365 -0.472 PROFIT <--- ROI 32.368 0.198

Quantitative Data Analysis and Interpretation
©Ranjita Banerjee 303
M.I. Par Change
PROFIT <--- COMP1 7.925 -0.214 PROFIT <--- COOPE 5.943 -0.177 PROFIT <--- PUNC 6.824 -0.161 PROFIT <--- RULES 8.548 -0.197 PROFIT <--- DECI 4.6 -0.107 PROFIT <--- NOFIN 8.773 0.141 PROFIT <--- FININC 4.132 0.111 DEFECTS <--- Employee Outcome 7.779 0.237 DEFECTS <--- HR PRACTICES 6.197 0.26 DEFECTS <--- UTI 4.823 0.102 DEFECTS <--- QUALITY 12.53 0.21 DEFECTS <--- BEHVR 4.557 0.122 DEFECTS <--- COMMT 9.843 0.149 DEFECTS <--- PUNC 8.033 0.133 DEFECTS <--- RULES 6.628 0.133 DEFECTS <--- IMPRV 9.344 0.179 DEFECTS <--- COMP 8.546 0.21 DEFECTS <--- SELEC 33.41 0.316 DEFECTS <--- RIGHT 8.718 0.193 UTI <--- DEFECTS 9.768 0.13 UTI <--- QUALITY 5.981 0.122 UTI <--- COMMT 7.968 0.113 UTI <--- SELEC 5.367 0.107 QUALITY <--- Employee Outcome 70.51 0.822 QUALITY <--- HR PRACTICES 57.406 0.912 QUALITY <--- Organization_Performance 79.448 0.37 QUALITY <--- PROFIT 11.176 0.176 QUALITY <--- DEFECTS 73.133 0.489 QUALITY <--- UTI 72.681 0.456 QUALITY <--- PRODDEV 67.102 0.48 QUALITY <--- SUPPLSATI 55.173 0.433 QUALITY <--- CUSTSATIS 78.971 0.513 QUALITY <--- COMP1 16.018 0.268 QUALITY <--- COOPE 38.392 0.396 QUALITY <--- COOPM 14.587 0.237 QUALITY <--- BEHVR 42.151 0.427 QUALITY <--- COMMT 48.494 0.38 QUALITY <--- PUNC 48.527 0.377 QUALITY <--- REGLR 25.825 0.275

Quantitative Data Analysis and Interpretation
©Ranjita Banerjee 304
M.I. Par Change
QUALITY <--- INVLV 35.429 0.323 QUALITY <--- RULES 42.168 0.385 QUALITY <--- OPEN 28.099 0.437 QUALITY <--- AUTH 14.475 0.207 QUALITY <--- FININC 13.291 0.175 QUALITY <--- COMP 45.795 0.559 QUALITY <--- CAREER 30.709 0.313 QUALITY <--- FEED 26.241 0.369 QUALITY <--- PERF 41.791 0.477 QUALITY <--- TRAIN 14.094 0.171 QUALITY <--- SELEC 14.778 0.242 QUALITY <--- RIGHT 18.643 0.325 PRODDEV <--- HR PRACTICES 4.669 0.178 PRODDEV <--- COOPE 8.835 0.13 PRODDEV <--- RULES 7.61 0.112 PRODDEV <--- NOFIN 4.935 -0.064 PRODDEV <--- COMP 10.808 0.186 PRODDEV <--- CAREER 7.227 0.104 PRODDEV <--- TRAIN 5.825 0.075 PRODDEV <--- RIGHT 6.168 0.128 SUPPLSATI <--- CUSTSATIS 4.938 0.083 SUPPLSATI <--- OPEN 4.273 0.11 SUPPLSATI <--- IMPRV 4.042 0.087 SUPPLSATI <--- DECI 11.356 0.095 SUPPLSATI <--- FEED 7.239 0.125 SUPPLSATI <--- ROTA 5.752 0.08 CUSTSATIS <--- QUALITY 9.261 0.13 CUSTSATIS <--- SUPPLSATI 5.826 0.088 CUSTSATIS <--- IMPRV 7.037 -0.112 CUSTSATIS <--- AUTH 4.523 -0.072 CUSTSATIS <--- SELEC 9.847 -0.123 COMP1 <--- PROFIT 6.258 -0.116 COMP1 <--- COOPE 18.432 0.241 COMP1 <--- DECI 5.833 0.093 COMP1 <--- NOFIN 4.677 -0.08 COMP1 <--- FININC 5.314 0.097 COMP1 <--- RIGHT 8.868 0.197 COOPE <--- PRODDEV 4.974 0.112 COOPE <--- COMP1 22.612 0.273

Quantitative Data Analysis and Interpretation
©Ranjita Banerjee 305
M.I. Par Change
COOPE <--- NOFIN 4.027 -0.072 COOPE <--- TRAIN 16.1 0.156 COOPE <--- RIGHT 7.944 0.182 COOPM <--- UTI 5.077 -0.104 COOPM <--- COMP1 4.58 0.124 COOPM <--- BEHVR 4.96 0.127 COOPM <--- RULES 11.659 -0.175 COOPM <--- NOFIN 11.963 0.126 BEHVR <--- COOPM 5.212 0.114 BEHVR <--- IMPRV 7.301 0.147 BEHVR <--- DECI 9.471 0.109 BEHVR <--- AUTH 12.159 0.153 BEHVR <--- RIGHT 4.034 -0.122 COMMT <--- PROFIT 9.89 0.139 COMMT <--- COMP1 5.258 -0.129 COMMT <--- COOPM 4.189 0.107 COMMT <--- BEHVR 4.001 0.11 COMMT <--- DECI 4.384 -0.077 COMMT <--- FEED 9.363 -0.185 PUNC <--- DEFECTS 4.184 0.107 PUNC <--- SUPPLSATI 4.415 0.112 PUNC <--- CUSTSATIS 4.768 0.115 PUNC <--- REGLR 14.738 0.19 PUNC <--- FININC 10.215 -0.14 PUNC <--- TRAIN 4.296 -0.086 REGLR <--- PUNC 14.457 0.189 REGLR <--- DECI 4.431 -0.085 REGLR <--- ROTA 7.194 -0.127 INVLV <--- COOPE 4.113 -0.115 INVLV <--- RULES 14.972 0.203 INVLV <--- CAREER 7.29 0.135 INVLV <--- ROTA 10.655 0.149 INVLV <--- RIGHT 4.495 -0.141 RULES <--- DEFECTS 4.022 0.105 RULES <--- PRODDEV 7.265 0.145 RULES <--- SUPPLSATI 4.425 0.113 RULES <--- CUSTSATIS 5.59 0.125 RULES <--- COOPM 11.252 -0.192 RULES <--- INVLV 10.108 0.159

Quantitative Data Analysis and Interpretation
©Ranjita Banerjee 306
M.I. Par Change
RULES <--- AUTH 6.767 -0.13 OPEN <--- Employee Outcome 8.024 0.215 OPEN <--- QUALITY 8.027 0.15 OPEN <--- SUPPLSATI 4.313 0.094 OPEN <--- CUSTSATIS 4.119 0.091 OPEN <--- COOPE 6.328 0.125 OPEN <--- BEHVR 5.12 0.115 OPEN <--- COMMT 6.222 0.106 OPEN <--- INVLV 6.287 0.106 OPEN <--- RULES 9.473 0.142 OPEN <--- IMPRV 9.878 0.165 OPEN <--- DECI 5.348 0.079 IMPRV <--- CUSTSATIS 5.27 -0.124 IMPRV <--- BEHVR 4.179 0.126 IMPRV <--- OPEN 10.218 0.246 IMPRV <--- DECI 58.889 0.315 IMPRV <--- AUTH 13.433 0.186 IMPRV <--- FININC 5.953 -0.109 IMPRV <--- COMP 4.056 -0.155 IMPRV <--- PERF 8.427 -0.2 IMPRV <--- ROTA 6.244 0.12 DECI <--- ROI 4.666 -0.099 DECI <--- PROFIT 5.643 -0.188 DECI <--- BEHVR 7.285 0.266 DECI <--- OPEN 4.927 0.274 DECI <--- IMPRV 52.446 0.733 DECI <--- AUTH 16.451 0.33 DECI <--- CAREER 7.724 0.235 DECI <--- PERF 9.634 -0.344 DECI <--- ROTA 13.362 0.283 AUTH <--- COOPE 4.613 -0.154 AUTH <--- BEHVR 6.161 0.183 AUTH <--- RULES 7.858 -0.186 AUTH <--- IMPRV 14.78 0.291 AUTH <--- DECI 20.326 0.222 AUTH <--- COMP 7.906 -0.26 NOFIN <--- PROFIT 6.072 0.212 NOFIN <--- COOPM 9.972 0.32 NOFIN <--- ROTA 4.807 -0.184

Quantitative Data Analysis and Interpretation
©Ranjita Banerjee 307
M.I. Par Change
FININC <--- DEFECTS 4.076 -0.139 FININC <--- REGLR 4.61 0.14 FININC <--- IMPRV 7.56 -0.223 FININC <--- TRAIN 6.264 0.137 COMP <--- Employee Outcome 5.823 0.15 COMP <--- DEFECTS 6.854 0.095 COMP <--- QUALITY 7.317 0.117 COMP <--- PRODDEV 8.593 0.109 COMP <--- COMMT 9.543 0.107 COMP <--- RULES 8.913 0.112 COMP <--- IMPRV 6.875 -0.112 COMP <--- DECI 7.471 -0.076 COMP <--- AUTH 12.179 -0.12 COMP <--- SELEC 4.882 -0.088 CAREER <--- PROFIT 5.572 -0.116 CAREER <--- INVLV 11.074 0.168 CAREER <--- DECI 14.634 0.156 CAREER <--- TRAIN 9.548 -0.131 FEED <--- COOPM 5.054 -0.095 FEED <--- COMMT 10.364 -0.119 FEED <--- PERF 7.675 0.139 FEED <--- ROTA 19.12 0.153 PERF <--- PROFIT 11.068 0.115 PERF <--- UTI 4.085 0.071 PERF <--- CUSTSATIS 4.748 0.083 PERF <--- OPEN 4.076 -0.109 PERF <--- IMPRV 18.58 -0.191 PERF <--- DECI 23.851 -0.141 PERF <--- COMP 4.568 0.116 PERF <--- CAREER 4.122 -0.075 PERF <--- FEED 7.801 0.132 ROTA <--- INVLV 6.43 0.174 ROTA <--- IMPRV 5.718 0.204 ROTA <--- DECI 13.74 0.206 ROTA <--- NOFIN 5.406 -0.123 ROTA <--- FEED 8.072 0.259 ROTA <--- SELEC 8.413 -0.231 ROTA <--- RIGHT 8.625 -0.279 TRAIN <--- COOPE 11.258 0.28

Quantitative Data Analysis and Interpretation
©Ranjita Banerjee 308
M.I. Par Change
TRAIN <--- FININC 5.795 0.151 TRAIN <--- CAREER 6.648 -0.19 SELEC <--- Organization_Performance 4.185 -0.071 SELEC <--- DEFECTS 7.033 0.127 SELEC <--- PRODDEV 4.373 -0.102 SELEC <--- SUPPLSATI 10.624 -0.159 SELEC <--- CUSTSATIS 9.997 -0.153 SELEC <--- INVLV 8.399 -0.132 SELEC <--- RULES 4.19 -0.102 SELEC <--- IMPRV 5.1 0.128 SELEC <--- AUTH 5.59 0.108 SELEC <--- COMP 4.795 -0.151 SELEC <--- ROTA 15.297 -0.169 SELEC <--- RIGHT 21.867 0.295 RIGHT <--- BEHVR 8.143 -0.134 RIGHT <--- INVLV 8.747 -0.114 RIGHT <--- OPEN 4.399 -0.123 RIGHT <--- DECI 4.02 -0.063 RIGHT <--- ROTA 14.952 -0.142 RIGHT <--- SELEC 20.847 0.205
(Source: AMOS Output; Primary data)
TABLE 8.149 - Model Fit Summary (CMIN)
Model NPAR CMIN DF P CMIN/DF Default model 63 2224.358 433 0 5.137 Saturated model 496 0 0
Independence model 31 4345.298 465 0 9.345 (Source: AMOS Output; Primary data)
Refer Table 8.149 of Model Fit Summary. Focusing on the first set of fit statistics, we see
the labels NPAR (number of parameters), CMIN (minimum discrepancy), DF (degrees of
freedom),P (probability value), and CMIN/DF. The value of 2224.35, under CMIN,
represents the discrepancy between the unrestricted sample covariance matrix S, and the
restricted covariance matrix Σ(θ), and, in essence, represents the Likelihood Ratio Test
statistic, most commonly expressed as a χ2 statistic. In general, H0:Σ = Σ(θ) is equivalent
to the hypothesis that Σ – Σ(θ) = 0; the χ2 test, then, simultaneously tests the extent to

Quantitative Data Analysis and Interpretation
©Ranjita Banerjee 309
which all residuals in Σ – Σ(θ) are zero. (Bollen, 1989a).The test of our H0, Technology
Acceptance Model fits the data, yielded a χ2 value of 2224.35, with 433 degrees of
freedom and a probability of less than .000 (p < .0001), thereby suggesting that the fit of
the data to the hypothesized model is not entirely adequate. Because the χ2 statistic
equals (N–1) Fmin, this value tends to be substantial when the model does not hold and
when sample size is large (Joreskog & Sorbom, 1993). Yet, the analysis of covariance
structures is grounded in large sample theory. As such, large samples are critical to the
obtaining of precise parameter estimates, as well as to the tenability of asymptotic
distributional approximations (MacCallum et al., 1996). Thus, findings of well-fitting
hypothesized models ,where the χ2 value approximates the degrees of freedom, have
proven to be unrealistic in most SEM empirical research. One of the first fit statistics to
address this problem was the χ2/degrees of freedom ratio (Wheaton, Muthen, Alwin, &
Summers, 1977), which appears as CMIN/DF, and is presented in the first cluster of
statistics which is 5.137 (Standard Recommended Value <= 5)
TABLE 8.150 - Root Mean Square (RMR) and GFI
Model RMR GFI AGFI PGFI Default model 0.137 0.62 0.564 0.541 Saturated model 0 1
Independence model 0.179 0.254 0.204 0.238 (Source: AMOS Output; Primary data)
Turning now to the next group of statistics in Table 8.150, we see the labels RMR,GFI,
AGFI, and PGFI. The root mean square residual (RMR) represents the average residual
value derived from the fitting of the variance–covariance matrix for the hypothesized
model Σ(θ) to the variance–covariance matrix of the sample data (S). However, because
these residuals are relative to the sizes of the observed variances and covariances they are
difficult to interpret. Thus, they are best interpreted in the metric of the correlation matrix
(Hu & Bentler, 1995; Joreskog & Sorbom,1989). The standardized RMR, then, represents
the average value across all standardized residuals, and ranges from zero to 1.00; in a
well-fitting model, this value will be small (say, .05 or less). The value of 0.137 shown in
Table 8.150 represents the unstandardized residual value.

Quantitative Data Analysis and Interpretation
©Ranjita Banerjee 310
The Goodness-of-Fit Index (GFI) is a measure of the relative amount of variance and
covariance in S that is jointly explained by Σ. The Adjusted Goodness-of-Fit Index
(AGFI) differs from the GFI only in the fact that it adjusts for the number of degrees of
freedom in the specified model. As such, it also addresses the issue of parsimony by
incorporating a penalty for the inclusion of additional parameters. The GFI and AGFI can
be classified as absolute indices of fit because they basically compare the hypothesized
model with no model at all (see Hu & Bentler,1995). Although both indices range from
zero to 1.00, with values close to 1.00 being indicative of good fit. In our model GFI =
0.620 and AGFI = 0.564 which is considered to be moderate fit.
TABLE 8.151 - Baseline Comparisons
Model NFI RFI IFI TLI
CFI Delta1 rho1 Delta2 rho2
Default model 0.488 0.45 0.542 0.504 0.538 Saturated model 1
1
1
Independence model 0 0 0 0 0 (Source: AMOS Output; Primary data)
We turn now to the next set of goodness-of-fit statistics (baseline comparisons, shown in
Table 8.151), which can be classified as incremental or comparative indices of fit (Hu &
Bentler, 1995; Marsh et al., 1988). As with the GFI and AGFI incremental indices of fit
are based on a comparison of the hypothesized model against some standard. However,
whereas this standard represents no model at all for the GFI and AGFI, it represents a
baseline model (typically, the independence or null model noted above for the
incremental indices).We now review these incremental indices. For the better part of a
decade, Bentler and Bonett’s (1980) Normed Fit Index (NFI) has been the practical
criterion of choice, as evidenced in large part by the current “classic” status of its original
paper (see Bentler, 1992; Bentler & Bonett, 1987). However, addressing evidence that the
NFI has shown a tendency to underestimate fit in small samples, Bentler (1990) revised
the NFI to take sample size into account and proposed the Comparative Fit Index (CFI;
see last column in Table 8.151). Values for both the NFI and CFI range from zero to 1.00

Quantitative Data Analysis and Interpretation
©Ranjita Banerjee 311
and are derived from the comparison of a hypothesized model with the independence (or
null) model, as described earlier. As such, each provides a measure of complete
covariation in the data. Although a value > .90 was originally considered representative
of a well-fitting model (see Bentler, 1992), a revised cutoff value close to .95 has recently
been advised (Hu & Bentler, 1999). Based on the NFI and CFI values reported in Table
8.151 (0.488 and 0.538, respectively), we can once again conclude that our hypothesized
model fits the sample data moderately.
The Relative Fit Index (RFI; Bollen, 1986) represents a derivative of the NFI; as with
both the NFI and CFI, the RFI coefficient values range from zero to 1.00, with values
close to .95 indicating superior fit (see Hu & Bentler, 1999). The Incremental Index of Fit
(IFI) was developed by Bollen (1989b) to address the issues of parsimony and sample
size which were known to be associated with the NFI. As such, its computation is
basically the same as that of the NFI, with the exception that degrees of freedom are
taken into account. Thus, it is not surprising that our finding of IFI of .583 is consistent
with that of the CFI in reflecting a well-fitting model. Finally ,the Tucker-Lewis Index
(TLI; Tucker & Lewis, 1973), consistent with the other indices noted here, yields values
ranging from zero to 1.00, with values close to .95 (for large samples) being indicative of
good fit (see Hu & Bentler, 1999). Our model has RFI = 0.450, IFI = 0.542 and TLI =
0.504 which again shows that our model fits moderately.

Quantitative Data Analysis and Interpretation
©Ranjita Banerjee 312
TABLE 8.152 - Parsimony-Adjusted Measures
Model PRATIO PNFI PCFI
Default model .931 .455 .501
Saturated model .000 .000 .000
Independence model 1.000 .000 .000
(Source: AMOS Output; Primary data)
The next cluster of fit indices relates to the issue of model parsimony (Refer Table
8.152). The first fit index (PRATIO) relates to the initial parsimony ratio proposed by
James et al. (1982). More appropriately, however, the index has subsequently been tied to
other goodness-of-fit indices (see, e.g., the PGFI noted earlier). Here, it is computed
relative to the NFI and CFI. In both cases, as was true for PGFI, the complexity of the
model is taken into account in the assessment of model fit (see James et al.; Mulaik et al.,
1989). Again, a PNFI of 0.455 and PCFI of 0.501 fall in the range of expected values.
TABLE 8.153 - Non Centrality Parameter (NCP)
Model NCP LO 90 HI 90 Default model 1791.358 1647.64 1942.55 Saturated model 0 0 0 Independence model 3880.298 3672.9 4095.01
(Source: AMOS Output; Primary data)
The next set of fit statistics provides us with the non-centrality parameter (NCP) estimate
as shown in Table 8.153. In our initial discussion of the χ2 statistic, we focused on the
extent to which the model was tenable and could not be rejected. Now, however, let’s
look a little more closely at what happens when the hypothesized model is incorrect [i.e.,
Σ ≠ Σ(θ)]. In this circumstance, the χ2 statistic has a non -central χ2 distribution, with a
non-centrality parameter, λ, that is a fixed parameter with associated degrees of freedom,
and can be denoted as χ2 (df,λ) (Bollen, 1989a; Hu & Bentler, 1995; Satorra &
Saris,1985). Turning to Table 8.153, we find that our hypothesized model yielded a non-

Quantitative Data Analysis and Interpretation
©Ranjita Banerjee 313
centrality parameter of 1791.358. This value represents the χ2 value minus its degrees of
freedom (2224.358 – 433). The confidence interval indicates that we can be 90%
confident that the population value of the non-centrality parameter (λ) lies between
3672.904 and 4095.010.
TABLE 8.154 - FMIN
Model FMIN F0 LO 90 HI 90 Default model 10.394 8.371 7.699 9.077 Saturated model 0 0 0 0 Independence model 20.305 18.132 17.163 19.136
(Source: AMOS Output; Primary data)
TABLE 8.155 - Root Mean Square Error of Approximation (RMSEA)
Model RMSEA LO 90 HI 90 PCLOSE
Default model 0.139 0.133 0.145 0 Independence model 0.197 0.192 0.203 0
(Source: AMOS Output; Primary data)
The next set of fit statistics focuses on the root mean square error of approximation
(RMSEA) (Refer Table 8.155) also called Badness of Fit Index. Although this index, and
the conceptual framework within which it is embedded, was first proposed by Steiger and
Lind in 1980, it has only recently been recognized as one of the most informative criteria
in covariance structure modeling. This discrepancy, as measured by the RMSEA, is
expressed per degree of freedom, thus making it sensitive to the number of estimated
parameters in the model (i.e., the complexity of the model); values less than .05 indicate
good fit, and values as high as .08 represent reasonable errors of approximation in the
population (Browne & Cudeck, 1993). MacCallum et al. (1996) have recently elaborated
on these cutpoints and noted that RMSEA values ranging from .08 to .10 indicate
mediocre fit, and those greater than .10 indicate poor fit. Although Hu and Bentler (1999)
have suggested a value of .06 to be indicative of good fit between the hypothesized model
and the observed data. Our model is having RMSEA is 0.139 which suggests not good fit.

Quantitative Data Analysis and Interpretation
©Ranjita Banerjee 314
The 90 percent confidence interval for the RMSEA is between a LO of 0.133 and a
HI of 0.145. Thus, even the upper bound is close to .08. In addition to reporting a
confidence interval around the RMSEA value, AMOS tests for the closeness of fit
(PCLOSE). That is, it tests the hypothesis that the RMSEA is “good” in the population
(specifically, that it is < .05). Joreskog and Sorbom (1996a) have suggested that the p-
value for this test should be > .50. In our case it is 0.000< 0.05 which is not good.
However, the fact remains that it is difficult to have a Model which contains all the
values within the prescribed ideal limits.
TABLE 8.156 - Akaike’s Information Criterion (AIC)
Model AIC BCC BIC CAIC Default model 2350.358 2372.51 2562.71 2625.71 Saturated model 992 1166.42 2663.84 3159.84 Independence model 4407.298 4418.2 4511.79 4542.79
(Source: AMOS Output; Primary data)
The first of these is Akaike’s (1987) Information Criterion (AIC), with Bozdogan’s
(1987) consistent version of the AIC (CAIC) shown at the end of the row in Table 8.156.
Both criteria address the issue of parsimony in the assessment of model fit; as such,
statistical goodness-of-fit as well as the number of estimated parameters are taken into
account.
TABLE 8.157 - Expected Cross-Validation Index (ECVI)
Model ECVI LO 90 HI 90 MECVI Default model 10.983 10.311 11.689 11.087 Saturated model 4.636 4.636 4.636 5.451 Independence model 20.595 19.626 21.598 20.646
(Source: AMOS Output; Primary data)
The Expected Cross-Validation Index (ECVI) (Refer Table 8.157) is central to the next
cluster of fit statistics. The ECVI was proposed, initially, as a means of assessing, in a

Quantitative Data Analysis and Interpretation
©Ranjita Banerjee 315
single sample, the likelihood that the model cross-validates across similar-sized samples
from the same population (Browne & Cudeck, 1989).
TABLE 8.158 - HOELTER
Model HOELTER HOELTER
0.05 0.01 Default model 47 49 Independence model 26 27
(Source: AMOS Output; Primary data)

Quantitative Data Analysis and Interpretation
©Ranjita Banerjee 316
8.12.2. FIRST MODFICATION [e12<-->e13]
(Source: AMOS Output; Primary data)
Figure 8.33 - First Modification Model [e12<-->e13]
TABLE 8.159 - Parameter Summary (Group number 1)
Weights Covariances Variances Means Inter -cepts Total
Fixed 36 0 1 0 0 37 Labeled 0 0 0 0 0 0 Unlabeled 29 2 33 0 0 64 Total 65 2 34 0 0 101 (Source: AMOS Output; Primary data)
Notes for Model (Default model)
Computation of degrees of freedom (Default model)

Quantitative Data Analysis and Interpretation
©Ranjita Banerjee 317
Number of distinct sample moments: 496
Number of distinct parameters to be estimated: 64
Degrees of freedom (496 - 64): 432
Result (Default model)
Minimum was achieved
Chi-square = 2148.439
Degrees of freedom = 432
Probability level = .000
Estimates (Group number 1 - Default model)
Scalar Estimates (Group number 1 - Default model)
Maximum Likelihood Estimates
Regression Weights: (Group number 1 - Default model)

Quantitative Data Analysis and Interpretation
©Ranjita Banerjee 318
TABLE 8.160 - Standard Error, CR and P Table
Estimate S.E. C.R. P Label
Org_Perf <--- Emp Outcme 0.7 0.186 3.766 *** par_28 Org_Perf <--- HR PRACT 0.89 0.227 3.923 *** par_29 RIGHT <--- HR PRACT 1 SELEC <--- HR PRACT 1.213 0.139 8.743 *** par_1 TRAIN <--- HR PRACT 1.314 0.187 7.009 *** par_2 ROTA <--- HR PRACT 0.672 0.161 4.184 *** par_3 PERF <--- HR PRACT 1.173 0.121 9.721 *** par_4 FEED <--- HR PRACT 1.178 0.123 9.559 *** par_5 CAREER <--- HR PRACT 1.343 0.155 8.687 *** par_6 COMP <--- HR PRACT 0.945 0.106 8.91 *** par_7 FININC <--- HR PRACT 1.34 0.179 7.506 *** par_8 NOFIN <--- HR PRACT -0.081 0.195 -0.414 0.679 par_9 AUTH <--- HR PRACT 0.977 0.155 6.288 *** par_10 DECI <--- HR PRACT 0.621 0.188 3.309 *** par_11 IMPRV <--- HR PRACT 0.644 0.124 5.201 *** par_12 OPEN <--- HR PRACT 0.505 0.101 4.989 *** par_13 RULES <--- Emp Outcme 1 INVLV <--- Emp Outcme 1.291 0.14 9.229 *** par_14 REGLR <--- Emp Outcme 1.25 0.139 8.984 *** par_15 PUNC <--- Emp Outcme 1.26 0.139 9.032 *** par_16 COMMT <--- Emp Outcme 1.347 0.141 9.564 *** par_17 BEHVR <--- Emp Outcme 0.945 0.113 8.393 *** par_18 COOPM <--- Emp Outcme 0.974 0.119 8.213 *** par_19 COOPE <--- Emp Outcme 0.924 0.115 8.036 *** par_20 COMP1 <--- Emp Outcme 0.744 0.107 6.965 *** par_21 CUSTSATIS <--- Org_Perf 0.616 0.033 18.42 *** par_22
SUPPLSATI <--- Org_Perf 0.599 0.034 17.737 *** par_23
PRODDEV <--- Org_Perf 0.575 0.035 16.563 *** par_24 QUALITY <--- Org_Perf 0 UTI <--- Org_Perf 0.639 0.038 17.03 *** par_25 DEFECTS <--- Org_Perf 0.5 0.04 12.503 *** par_26 PROFIT <--- Org_Perf 0.38 0.049 7.762 *** par_27 ROI <--- Org_Perf 1
(Source: AMOS Output; Primary data)

Quantitative Data Analysis and Interpretation
©Ranjita Banerjee 319
TABLE 8.161 - Standard Error, CR and P Table
Estimate S.E. C.R. P Label
Org_Perf <--- Emp Outcome 0.7 0.186 3.766 *** par_28 Org_Perf <--- HR PRACT 0.89 0.227 3.923 *** par_29 RIGHT <--- HR PRACT 1 SELEC <--- HR PRACT 1.213 0.139 8.743 *** par_1 TRAIN <--- HR PRACT 1.314 0.187 7.009 *** par_2 ROTA <--- HR PRACT 0.672 0.161 4.184 *** par_3 PERF <--- HR PRACT 1.173 0.121 9.721 *** par_4 FEED <--- HR PRACT 1.178 0.123 9.559 *** par_5 CAREER <--- HR PRACT 1.343 0.155 8.687 *** par_6 COMP <--- HR PRACT 0.945 0.106 8.91 *** par_7 FININC <--- HR PRACT 1.34 0.179 7.506 *** par_8 NOFIN <--- HR PRACT -0.081 0.195 -0.414 0.679 par_9 AUTH <--- HR PRACT 0.977 0.155 6.288 *** par_10 DECI <--- HR PRACT 0.621 0.188 3.309 *** par_11 IMPRV <--- HR PRACT 0.644 0.124 5.201 *** par_12 OPEN <--- HR PRACT 0.505 0.101 4.989 *** par_13 RULES <--- Emp Outcome 1 INVLV <--- Emp Outcome 1.291 0.14 9.229 *** par_14 REGLR <--- Emp Outcome 1.25 0.139 8.984 *** par_15 PUNC <--- Emp Outcome 1.26 0.139 9.032 *** par_16 COMMT <--- Emp Outcome 1.347 0.141 9.564 *** par_17 BEHVR <--- Emp Outcome 0.945 0.113 8.393 *** par_18 COOPM <--- Emp Outcome 0.974 0.119 8.213 *** par_19 COOPE <--- Emp Outcome 0.924 0.115 8.036 *** par_20 COMP1 <--- Emp Outcome 0.744 0.107 6.965 *** par_21 CUSTSATIS <--- Org_Perf 0.616 0.033 18.42 *** par_22 SUPPLSATI <--- Org_Perf 0.599 0.034 17.737 *** par_23 PRODDEV <--- Org_Perf 0.575 0.035 16.563 *** par_24 QUALITY <--- Org_Perf 0 UTI <--- Org_Perf 0.639 0.038 17.03 *** par_25 DEFECTS <--- Org_Perf 0.5 0.04 12.503 *** par_26 PROFIT <--- Org_Perf 0.38 0.049 7.762 *** par_27 ROI <--- Org_Perf 1
(Source: AMOS Output; Primary data)

Quantitative Data Analysis and Interpretation
©Ranjita Banerjee 320
TABLE 8.162 - Standardized Regression Weights:
(Group number 1 - Default model)
Estimate Organization_Performance <--- Employee Outcome 0.302 Organization_Performance <--- HR PRACTICES 0.316 RIGHT <--- HR PRACTICES 0.667 SELEC <--- HR PRACTICES 0.677 TRAIN <--- HR PRACTICES 0.529 ROTA <--- HR PRACTICES 0.308 PERF <--- HR PRACTICES 0.768 FEED <--- HR PRACTICES 0.753 CAREER <--- HR PRACTICES 0.672 COMP <--- HR PRACTICES 0.693 FININC <--- HR PRACTICES 0.571 NOFIN <--- HR PRACTICES -0.03 AUTH <--- HR PRACTICES 0.471 DECI <--- HR PRACTICES 0.242 IMPRV <--- HR PRACTICES 0.385 OPEN <--- HR PRACTICES 0.369 RULES <--- Employee Outcome 0.639 INVLV <--- Employee Outcome 0.755 REGLR <--- Employee Outcome 0.729 PUNC <--- Employee Outcome 0.734 COMMT <--- Employee Outcome 0.792 BEHVR <--- Employee Outcome 0.67 COOPM <--- Employee Outcome 0.652 COOPE <--- Employee Outcome 0.635 COMP1 <--- Employee Outcome 0.537 CUSTSATIS <--- Organization_Performance 0.886 SUPPLSATI <--- Organization_Performance 0.87 PRODDEV <--- Organization_Performance 0.841 QUALITY <--- Organization_Performance 0 UTI <--- Organization_Performance 0.853 DEFECTS <--- Organization_Performance 0.713 PROFIT <--- Organization_Performance 0.499
(Source: AMOS Output; Primary data)

Quantitative Data Analysis and Interpretation
©Ranjita Banerjee 321
TABLE 8.163 - Covariances: (Group number 1 - Default model)
Est S.E.
C.R. P Label
HR PRACTICES <--> Employee
Outcome 0.096 0.021 4.62 *** par_30
e12 <--> e13 0.37 0.053 6.953 *** par_31
TABLE 8.164 - Correlations: (Group number 1 - Default model)
Estimate HR PRACTICES <--> Employee Outcome 0.45 e12 <--> e13 0.552
(Source: AMOS Output; Primary data)
TABLE 8.165 - Variances: (Group number 1 - Default model)
Estimate S.E. C.R. P Label HR PRACTICES 0.175 0.033 5.27 *** par_32 Employee Outcome 0.258 0.052 5.007 *** par_33
e32 1 e1 0.218 0.023 9.311 *** par_34 e2 0.303 0.033 9.253 *** par_35 e3 0.775 0.079 9.845 *** par_36 e4 0.756 0.074 10.211 *** par_37 e5 0.167 0.02 8.488 *** par_38 e6 0.186 0.021 8.66 *** par_39 e7 0.382 0.041 9.282 *** par_40 e8 0.17 0.019 9.158 *** par_41 e9 0.651 0.067 9.725 *** par_42 e10 1.264 0.122 10.343 *** par_43 e11 0.586 0.059 9.979 *** par_44 e12 1.082 0.105 10.263 *** par_45 e13 0.415 0.041 10.121 *** par_46 e14 0.283 0.028 10.143 *** par_47 e15 0.374 0.039 9.547 *** par_48 e16 0.324 0.037 8.8 *** par_49 e17 0.354 0.039 9.024 *** par_50 e18 0.35 0.039 8.985 *** par_51

Quantitative Data Analysis and Interpretation
©Ranjita Banerjee 322
Estimate S.E. C.R. P Label e19 0.278 0.033 8.384 *** par_52 e20 0.284 0.03 9.403 *** par_53 e21 0.331 0.035 9.488 *** par_54 e22 0.326 0.034 9.562 *** par_55 e23 0.352 0.036 9.876 *** par_56 e24 0.143 0.018 7.748 *** par_57 e25 0.159 0.02 8.136 *** par_58 e26 0.19 0.022 8.648 *** par_59 e27 0.476 0.046 10.344 *** par_60 e28 0.212 0.025 8.464 *** par_61 e29 0.335 0.035 9.626 *** par_62 e30 0.602 0.059 10.115 *** par_63 e31 0.984 0.105 9.399 *** par_64
(Source: AMOS Output; Primary data)
TABLE 8.166 - Modification Indices (Group number 1 - Default model)
Covariances: (Group number 1 - Default model)
M.I. Par Change e31 <--> Employee Outcome 26.15 -0.178 e31 <--> HR PRACTICES 13.692 -0.107 e31 <--> e32 12.302 -0.263 e30 <--> e31 84.935 0.512 e29 <--> e31 7.946 -0.119 e28 <--> e29 20.895 0.094 e27 <--> Employee Outcome 32.956 0.133 e27 <--> HR PRACTICES 19.314 0.084 e27 <--> e32 24.295 0.247 e27 <--> e31 56.45 -0.368 e27 <--> e29 12.521 0.1 e27 <--> e28 5.969 0.058 e26 <--> e29 7.22 0.052 e25 <--> e29 8.405 -0.052 e25 <--> e28 5.792 -0.036 e24 <--> e30 4.17 -0.047 e24 <--> e29 6.947 -0.046 e24 <--> e27 9.258 0.062 e24 <--> e25 28.033 0.067 e23 <--> e30 7.351 -0.088

Quantitative Data Analysis and Interpretation
©Ranjita Banerjee 323
M.I. Par Change e22 <--> e30 5.567 -0.075 e22 <--> e26 8.13 0.055 e22 <--> e23 33.074 0.141 e21 <--> e31 4.445 0.089 e21 <--> e28 8.582 -0.06 e21 <--> e24 4.055 -0.035 e21 <--> e23 6.725 0.064 e21 <--> e22 5.5 0.056 e20 <--> e30 5.194 0.068 e20 <--> e24 5.699 -0.039 e20 <--> e21 9.792 0.071 e19 <--> e30 12.002 0.107 e19 <--> e28 9.437 0.061 e19 <--> e26 7.712 -0.052 e19 <--> e23 7.617 -0.066 e19 <--> e21 7.77 0.065 e19 <--> e20 7.806 0.061 e18 <--> e32 4.153 0.093 e18 <--> e31 15.126 -0.174 e18 <--> e30 8.213 -0.097 e18 <--> e24 4.041 0.037 e18 <--> e23 4.722 -0.056 e18 <--> e22 4.075 -0.051 e18 <--> e20 4.659 -0.051 e17 <--> e22 5.164 -0.058 e17 <--> e20 4.638 -0.051 e17 <--> e19 9.274 -0.075 e17 <--> e18 34.79 0.159 e16 <--> e22 7.29 -0.066 e16 <--> e21 5.893 -0.06 e16 <--> e18 5.467 -0.061 e15 <--> e31 16.285 -0.182 e15 <--> e30 9.106 -0.103 e15 <--> e26 6.636 0.053 e15 <--> e24 4.642 0.04 e15 <--> e21 20.965 -0.118 e15 <--> e20 4.701 -0.052 e15 <--> e19 6.768 -0.065 e15 <--> e18 4.147 0.055

Quantitative Data Analysis and Interpretation
©Ranjita Banerjee 324
M.I. Par Change e15 <--> e16 26.897 0.137 e14 <--> Employee Outcome 11.129 0.06 e14 <--> e31 10.185 -0.122 e14 <--> e28 6.721 -0.048 e14 <--> e27 8.27 0.073 e13 <--> e29 7.107 0.059 e13 <--> e24 4.123 -0.032 e13 <--> e14 6.755 0.052 e12 <--> e31 7.976 -0.174 e12 <--> e30 4.148 -0.095 e12 <--> e25 7.443 0.072 e12 <--> e23 7.172 0.096 e12 <--> e19 5.172 -0.078 e11 <--> e22 5.198 -0.072 e11 <--> e20 17.334 0.123 e11 <--> e15 9.827 -0.106 e11 <--> e13 4.181 0.059 e11 <--> e12 9.145 0.139 e10 <--> e30 8.832 0.179 e10 <--> e26 4.686 -0.079 e10 <--> e23 4.482 -0.099 e10 <--> e21 11.881 0.158 e9 <--> e30 5.442 0.104 e9 <--> e29 7.958 -0.096 e9 <--> e18 14.28 -0.135 e9 <--> e17 6.917 0.094 e9 <--> e16 4.203 0.071 e9 <--> e13 11.283 -0.103 e8 <--> Employee Outcome 7.696 0.04 e8 <--> e27 6.856 0.054 e8 <--> e26 7.526 0.039 e8 <--> e25 6.503 -0.034 e8 <--> e19 5.045 0.039 e8 <--> e15 4.403 0.04 e8 <--> e11 15.398 -0.091 e7 <--> e31 8.692 -0.136 e7 <--> e30 8.684 -0.102 e7 <--> e16 14.03 0.101 e7 <--> e12 17.918 0.163

Quantitative Data Analysis and Interpretation
©Ranjita Banerjee 325
M.I. Par Change e7 <--> e8 6.58 0.049 e6 <--> e30 4.12 -0.051 e6 <--> e29 4.141 -0.039 e6 <--> e25 12.396 0.05 e6 <--> e21 4.213 -0.039 e6 <--> e19 19.45 -0.081 e6 <--> e18 5.561 0.047 e6 <--> e15 7.417 0.055 e5 <--> e32 6.455 0.082 e5 <--> e30 7.737 0.066 e5 <--> e29 4.222 -0.037 e5 <--> e14 4.914 -0.036 e5 <--> e13 5.529 -0.039 e5 <--> e12 6.336 -0.067 e5 <--> e8 6.923 0.034 e5 <--> e7 8.982 -0.059 e5 <--> e6 17.432 0.058 e4 <--> e29 4.135 -0.073 e4 <--> e26 6.2 -0.07 e4 <--> e25 5.328 0.061 e4 <--> e23 4.541 -0.077 e4 <--> e17 6.057 -0.093 e4 <--> e16 11.74 0.125 e4 <--> e12 8.989 0.156 e4 <--> e10 5.455 -0.157 e4 <--> e6 23.131 0.134 e3 <--> e31 4.626 0.137 e3 <--> e29 5.072 -0.083 e3 <--> e22 15.155 0.142 e3 <--> e19 4.86 0.078 e3 <--> e18 5.299 -0.089 e3 <--> e9 8.774 0.151 e3 <--> e7 12.704 -0.142 e2 <--> Employee Outcome 4.262 -0.04 e2 <--> e29 36.182 0.142 e2 <--> e25 11.247 -0.059 e2 <--> e24 12.47 -0.06 e2 <--> e16 6.227 -0.06 e2 <--> e13 12.347 0.075

Quantitative Data Analysis and Interpretation
©Ranjita Banerjee 326
M.I. Par Change e2 <--> e12 4.206 -0.07 e2 <--> e11 8.719 0.091 e2 <--> e8 10.968 -0.057 e2 <--> e5 5.207 -0.04 e2 <--> e4 15.734 -0.137 e1 <--> e23 7.298 0.055 e1 <--> e22 6.651 0.051 e1 <--> e20 6.687 -0.048 e1 <--> e16 9.457 -0.063 e1 <--> e14 4.811 -0.039 e1 <--> e6 6.371 -0.039 e1 <--> e4 16.011 -0.117 e1 <--> e2 41.806 0.124
(Source: AMOS Output; Primary data)
TABLE 8.167 - Variances: (Group number 1 - Default model)
M.I. Par Change e32 38.552 -0.675
TABLE 8.168 - Regression Weights: (Group number 1 - Default model)
M.I. Par Change ROI <--- Employee Outcome 54.396 -1.087 ROI <--- HR PRACTICES 42.92 -1.179 ROI <--- Organization_Performance 50.374 -0.441 ROI <--- PROFIT 19.996 0.355 ROI <--- DEFECTS 46.674 -0.588 ROI <--- UTI 38.236 -0.498 ROI <--- QUALITY 56.45 -0.773 ROI <--- PRODDEV 42.102 -0.572 ROI <--- SUPPLSATI 40.823 -0.56 ROI <--- CUSTSATIS 43.65 -0.574 ROI <--- COMP1 26.061 -0.515 ROI <--- COOPE 24.526 -0.476 ROI <--- COOPM 9.151 -0.283 ROI <--- BEHVR 14.717 -0.38 ROI <--- COMMT 19.708 -0.365 ROI <--- PUNC 58.044 -0.621

Quantitative Data Analysis and Interpretation
©Ranjita Banerjee 327
M.I. Par Change ROI <--- REGLR 29.094 -0.44 ROI <--- INVLV 28.114 -0.434 ROI <--- RULES 55.729 -0.666 ROI <--- OPEN 27.256 -0.647 ROI <--- IMPRV 8.825 -0.302 ROI <--- DECI 16.996 -0.273 ROI <--- AUTH 11.381 -0.276 ROI <--- COMP 25.666 -0.63 ROI <--- CAREER 38.904 -0.53 ROI <--- FEED 29.451 -0.588 ROI <--- PERF 21.108 -0.511 ROI <--- SELEC 9.72 -0.296 ROI <--- RIGHT 17.493 -0.474 PROFIT <--- ROI 32.249 0.198 PROFIT <--- COMP1 7.93 -0.214 PROFIT <--- COOPE 5.957 -0.177 PROFIT <--- PUNC 6.838 -0.161 PROFIT <--- RULES 8.556 -0.197 PROFIT <--- DECI 4.567 -0.107 PROFIT <--- NOFIN 8.772 0.141 PROFIT <--- FININC 4.119 0.111 DEFECTS <--- Employee Outcome 7.772 0.237 DEFECTS <--- HR PRACTICES 5.981 0.254 DEFECTS <--- UTI 4.814 0.102 DEFECTS <--- QUALITY 12.521 0.21 DEFECTS <--- BEHVR 4.569 0.122 DEFECTS <--- COMMT 9.837 0.149 DEFECTS <--- PUNC 8.033 0.133 DEFECTS <--- RULES 6.638 0.133 DEFECTS <--- IMPRV 9.397 0.18 DEFECTS <--- COMP 8.505 0.209 DEFECTS <--- SELEC 33.364 0.316 DEFECTS <--- RIGHT 8.686 0.193 UTI <--- DEFECTS 9.753 0.13 UTI <--- QUALITY 5.969 0.122 UTI <--- COMMT 7.961 0.113 UTI <--- SELEC 5.334 0.106 QUALITY <--- Employee Outcome 70.51 0.822 QUALITY <--- HR PRACTICES 58.016 0.911

Quantitative Data Analysis and Interpretation
©Ranjita Banerjee 328
M.I. Par Change QUALITY <--- Organization_Performance 79.483 0.369 QUALITY <--- PROFIT 11.176 0.176 QUALITY <--- DEFECTS 73.143 0.489 QUALITY <--- UTI 72.693 0.456 QUALITY <--- PRODDEV 67.116 0.48 QUALITY <--- SUPPLSATI 55.202 0.433 QUALITY <--- CUSTSATIS 78.996 0.513 QUALITY <--- COMP1 16.018 0.268 QUALITY <--- COOPE 38.392 0.396 QUALITY <--- COOPM 14.587 0.237 QUALITY <--- BEHVR 42.151 0.427 QUALITY <--- COMMT 48.494 0.38 QUALITY <--- PUNC 48.527 0.377 QUALITY <--- REGLR 25.825 0.275 QUALITY <--- INVLV 35.429 0.323 QUALITY <--- RULES 42.168 0.385 QUALITY <--- OPEN 28.099 0.437 QUALITY <--- AUTH 14.475 0.207 QUALITY <--- FININC 13.291 0.175 QUALITY <--- COMP 45.795 0.559 QUALITY <--- CAREER 30.709 0.313 QUALITY <--- FEED 26.241 0.369 QUALITY <--- PERF 41.791 0.477 QUALITY <--- TRAIN 14.094 0.171 QUALITY <--- SELEC 14.778 0.242 QUALITY <--- RIGHT 18.643 0.325 PRODDEV <--- HR PRACTICES 4.596 0.176 PRODDEV <--- COOPE 8.829 0.13 PRODDEV <--- RULES 7.63 0.112 PRODDEV <--- NOFIN 4.947 -0.064 PRODDEV <--- COMP 10.738 0.186 PRODDEV <--- CAREER 7.241 0.104 PRODDEV <--- TRAIN 5.794 0.075 PRODDEV <--- RIGHT 6.126 0.128 SUPPLSATI <--- CUSTSATIS 4.959 0.083 SUPPLSATI <--- OPEN 4.305 0.11 SUPPLSATI <--- IMPRV 4.102 0.088 SUPPLSATI <--- DECI 11.532 0.096 SUPPLSATI <--- FEED 7.21 0.125

Quantitative Data Analysis and Interpretation
©Ranjita Banerjee 329
M.I. Par Change SUPPLSATI <--- ROTA 5.78 0.08 CUSTSATIS <--- QUALITY 9.258 0.13 CUSTSATIS <--- SUPPLSATI 5.865 0.088 CUSTSATIS <--- IMPRV 6.941 -0.111 CUSTSATIS <--- AUTH 4.488 -0.072 CUSTSATIS <--- SELEC 9.896 -0.124 COMP1 <--- PROFIT 6.26 -0.116 COMP1 <--- COOPE 18.452 0.241 COMP1 <--- DECI 5.923 0.094 COMP1 <--- NOFIN 4.682 -0.08 COMP1 <--- FININC 5.333 0.097 COMP1 <--- RIGHT 8.885 0.197 COOPE <--- PRODDEV 4.978 0.112 COOPE <--- COMP1 22.651 0.273 COOPE <--- NOFIN 4.039 -0.072 COOPE <--- TRAIN 16.118 0.156 COOPE <--- RIGHT 7.961 0.182 COOPM <--- UTI 5.069 -0.104 COOPM <--- COMP1 4.607 0.125 COOPM <--- BEHVR 4.996 0.127 COOPM <--- RULES 11.623 -0.175 COOPM <--- NOFIN 11.938 0.126 BEHVR <--- COOPM 5.248 0.115 BEHVR <--- IMPRV 7.406 0.148 BEHVR <--- DECI 9.632 0.11 BEHVR <--- AUTH 12.248 0.153 BEHVR <--- RIGHT 4.009 -0.121 COMMT <--- PROFIT 9.867 0.139 COMMT <--- COMP1 5.245 -0.129 COMMT <--- COOPM 4.202 0.107 COMMT <--- BEHVR 4.026 0.111 COMMT <--- DECI 4.226 -0.076 COMMT <--- FEED 9.333 -0.184 PUNC <--- DEFECTS 4.181 0.107 PUNC <--- SUPPLSATI 4.421 0.112 PUNC <--- CUSTSATIS 4.751 0.115 PUNC <--- REGLR 14.67 0.189 PUNC <--- FININC 10.21 -0.14 PUNC <--- TRAIN 4.299 -0.086

Quantitative Data Analysis and Interpretation
©Ranjita Banerjee 330
M.I. Par Change REGLR <--- PUNC 14.389 0.188 REGLR <--- DECI 4.309 -0.084 REGLR <--- ROTA 7.155 -0.127 INVLV <--- COOPE 4.1 -0.115 INVLV <--- RULES 14.992 0.203 INVLV <--- CAREER 7.381 0.136 INVLV <--- ROTA 10.727 0.15 INVLV <--- RIGHT 4.468 -0.141 RULES <--- DEFECTS 4.028 0.105 RULES <--- PRODDEV 7.273 0.145 RULES <--- SUPPLSATI 4.437 0.113 RULES <--- CUSTSATIS 5.584 0.125 RULES <--- COOPM 11.222 -0.191 RULES <--- INVLV 10.128 0.159 RULES <--- AUTH 6.702 -0.129 OPEN <--- Employee Outcome 8.408 0.221 OPEN <--- QUALITY 8.27 0.153 OPEN <--- SUPPLSATI 4.547 0.097 OPEN <--- CUSTSATIS 4.18 0.092 OPEN <--- COOPE 6.509 0.127 OPEN <--- BEHVR 5.501 0.12 OPEN <--- COMMT 6.395 0.107 OPEN <--- INVLV 6.638 0.109 OPEN <--- RULES 9.78 0.144 OPEN <--- IMPRV 11.104 0.175 OPEN <--- DECI 6.559 0.088 IMPRV <--- OPEN 5.736 0.155 IMPRV <--- FININC 7.21 -0.101 IMPRV <--- SELEC 6.065 0.122 DECI <--- COMP1 7.466 0.23 DECI <--- AUTH 6.894 0.179 DECI <--- CAREER 8.924 0.212 DECI <--- ROTA 8.045 0.184 AUTH <--- COOPE 4.204 -0.148 AUTH <--- BEHVR 6.732 0.192 AUTH <--- RULES 7.178 -0.179 AUTH <--- IMPRV 16.792 0.312 AUTH <--- DECI 23.284 0.239 AUTH <--- COMP 7.228 -0.25

Quantitative Data Analysis and Interpretation
©Ranjita Banerjee 331
M.I. Par Change AUTH <--- SELEC 4.291 0.147 NOFIN <--- PROFIT 6.041 0.211 NOFIN <--- COOPM 9.881 0.318 NOFIN <--- ROTA 4.882 -0.186 FININC <--- DEFECTS 4.166 -0.14 FININC <--- REGLR 4.538 0.139 FININC <--- IMPRV 6.286 -0.203 FININC <--- TRAIN 6.06 0.134 COMP <--- Employee Outcome 5.829 0.149 COMP <--- DEFECTS 6.597 0.092 COMP <--- QUALITY 6.856 0.113 COMP <--- PRODDEV 8.156 0.105 COMP <--- COMMT 9.39 0.105 COMP <--- RULES 9.125 0.113 COMP <--- IMPRV 5.571 -0.1 COMP <--- DECI 5.122 -0.063 COMP <--- AUTH 11.651 -0.117 COMP <--- SELEC 5.443 -0.093 CAREER <--- PROFIT 5.666 -0.118 CAREER <--- COOPM 4.233 0.12 CAREER <--- INVLV 11.709 0.175 CAREER <--- DECI 18.881 0.18 CAREER <--- TRAIN 8.791 -0.127 FEED <--- COOPM 4.672 -0.091 FEED <--- COMMT 10.634 -0.12 FEED <--- PERF 6.208 0.124 FEED <--- ROTA 20.744 0.159 PERF <--- PROFIT 10.283 0.109 PERF <--- CUSTSATIS 4.112 0.076 PERF <--- COOPE 4.055 -0.083 PERF <--- COOPM 4.169 -0.082 PERF <--- OPEN 4.185 -0.109 PERF <--- IMPRV 17.038 -0.18 PERF <--- DECI 19.649 -0.126 PERF <--- CAREER 4.557 -0.078 PERF <--- FEED 6.679 0.12 ROTA <--- INVLV 6.777 0.179 ROTA <--- IMPRV 6.562 0.219 ROTA <--- DECI 15.307 0.218

Quantitative Data Analysis and Interpretation
©Ranjita Banerjee 332
M.I. Par Change ROTA <--- NOFIN 5.449 -0.124 ROTA <--- FEED 8.609 0.268 ROTA <--- SELEC 7.728 -0.222 ROTA <--- RIGHT 8.105 -0.272 TRAIN <--- COOPE 11.136 0.278 TRAIN <--- FININC 5.617 0.148 TRAIN <--- CAREER 6.355 -0.186 SELEC <--- Organization_Performance 4.311 -0.072 SELEC <--- DEFECTS 7.016 0.127 SELEC <--- PRODDEV 4.453 -0.104 SELEC <--- SUPPLSATI 10.439 -0.158 SELEC <--- CUSTSATIS 10.345 -0.156 SELEC <--- INVLV 7.896 -0.128 SELEC <--- IMPRV 6.834 0.148 SELEC <--- AUTH 6.595 0.117 SELEC <--- COMP 5.19 -0.158 SELEC <--- ROTA 14.1 -0.162 SELEC <--- RIGHT 21.349 0.291 RIGHT <--- BEHVR 7.75 -0.13 RIGHT <--- INVLV 8.645 -0.113 RIGHT <--- OPEN 4.091 -0.118 RIGHT <--- ROTA 14.346 -0.138 RIGHT <--- SELEC 20.713 0.203
(Source: AMOS Output; Primary data)

Quantitative Data Analysis and Interpretation
©Ranjita Banerjee 333
8.12.2.1. Model Fit Summary
TABLE 8.169 - CMIN
Model NPAR CMIN DF P CMIN/DF
Default model 64 2148.439 432 0 4.973 Saturated model 496 0 0
Independence model 31 4345.298 465 0 9.345
(Source: AMOS Output; Primary data)
TABLE 8.170 -RMR, GFI
Model RMR GFI AGFI PGFI
Default model .137 .633 .579 .551
Saturated model .000 1.000
Independence model .179 .254 .204 .238
(Source: AMOS Output; Primary data)
TABLE 8.171 -Baseline Comparisons
Model NFI Delta1
RFI rho1
IFI Delta2
TLI rho2 CFI
Default model .506 .468 .561 .524 .558
Saturated model 1.000
1.000
1.000
Independence model .000 .000 .000 .000 .000
(Source: AMOS Output; Primary data)
TABLE 8.172 -Parsimony-Adjusted Measures
Model PRATIO PNFI PCFI
Default model .929 .470 .518
Saturated model .000 .000 .000
Independence model 1.000 .000 .000
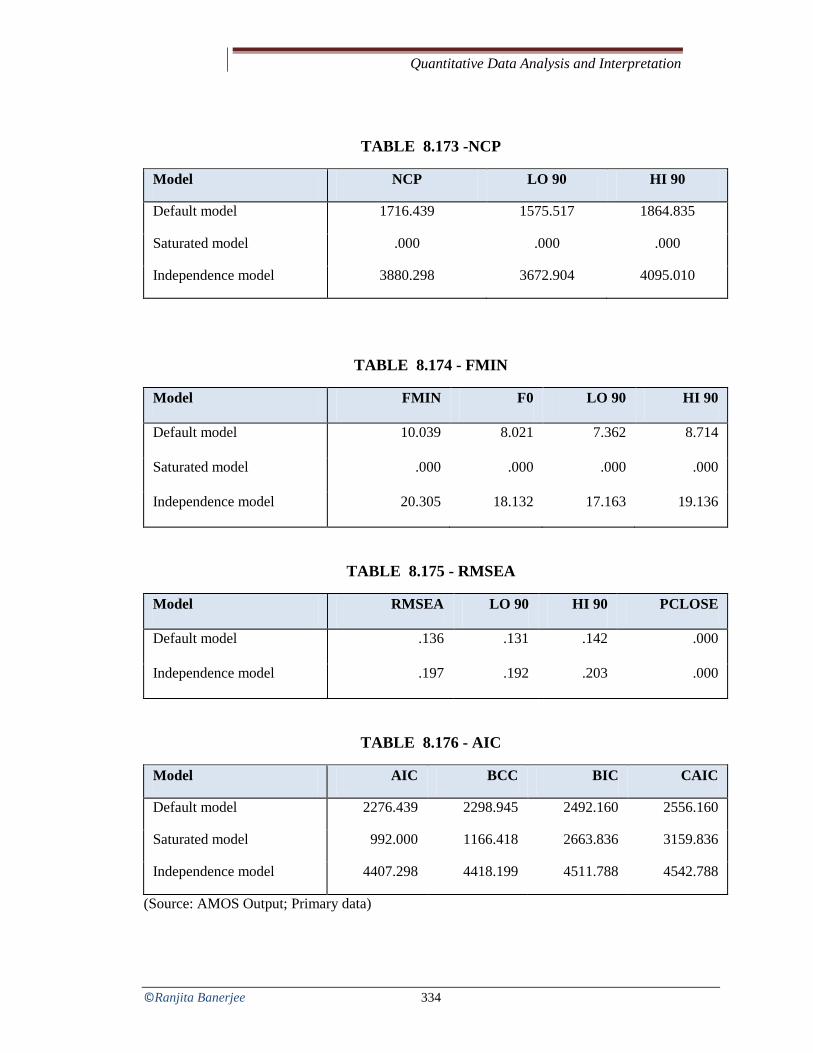
Quantitative Data Analysis and Interpretation
©Ranjita Banerjee 334
TABLE 8.173 -NCP
Model NCP LO 90 HI 90
Default model 1716.439 1575.517 1864.835
Saturated model .000 .000 .000
Independence model 3880.298 3672.904 4095.010
TABLE 8.174 - FMIN
Model FMIN F0 LO 90 HI 90
Default model 10.039 8.021 7.362 8.714
Saturated model .000 .000 .000 .000
Independence model 20.305 18.132 17.163 19.136
TABLE 8.175 - RMSEA
Model RMSEA LO 90 HI 90 PCLOSE
Default model .136 .131 .142 .000
Independence model .197 .192 .203 .000
TABLE 8.176 - AIC
Model AIC BCC BIC CAIC
Default model 2276.439 2298.945 2492.160 2556.160
Saturated model 992.000 1166.418 2663.836 3159.836
Independence model 4407.298 4418.199 4511.788 4542.788
(Source: AMOS Output; Primary data)
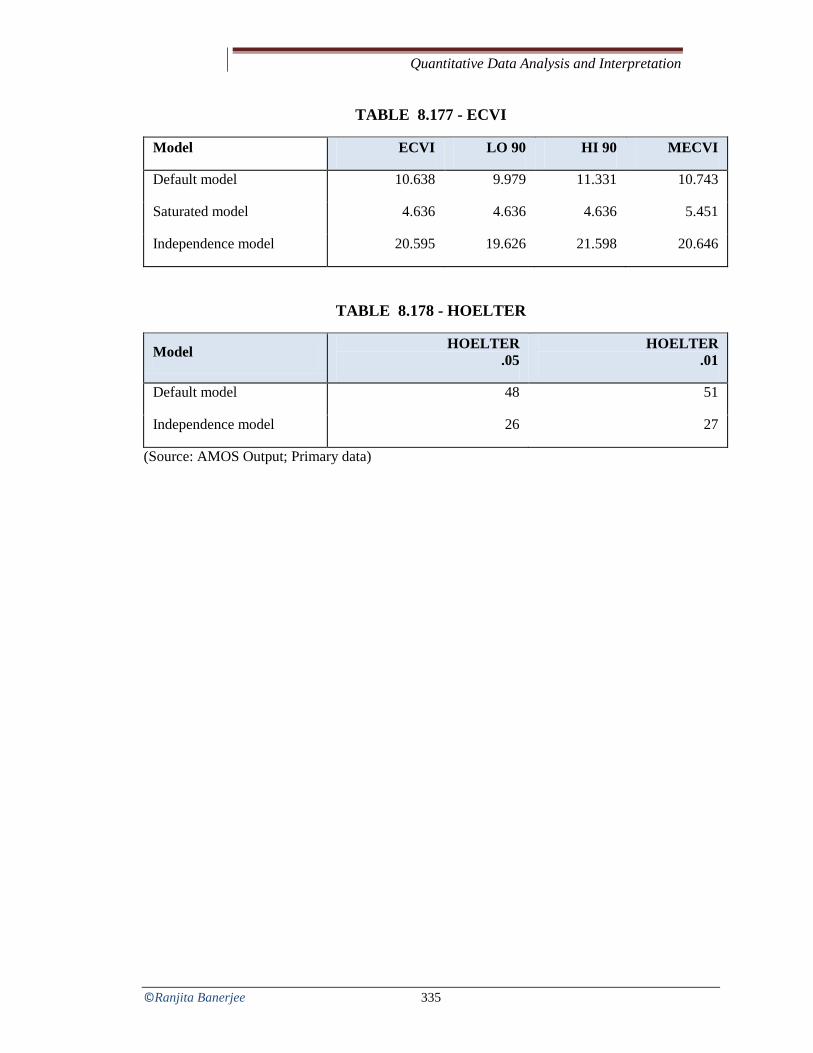
Quantitative Data Analysis and Interpretation
©Ranjita Banerjee 335
TABLE 8.177 - ECVI
Model ECVI LO 90 HI 90 MECVI
Default model 10.638 9.979 11.331 10.743
Saturated model 4.636 4.636 4.636 5.451
Independence model 20.595 19.626 21.598 20.646
TABLE 8.178 - HOELTER
Model HOELTER .05
HOELTER .01
Default model 48 51
Independence model 26 27
(Source: AMOS Output; Primary data)

Quantitative Data Analysis and Interpretation
©Ranjita Banerjee 336
8.12.3. SECOND MODIFICATION [e30<->e31]
The second modification was done by grouping e30 and e31, to improve the values of the
various indicators.
(Source: AMOS Output; Primary data)
Figure 8.34 - Second Modification Model [e30<->e31]
8.12.3.1. Parameter Summary
TABLE 8.179 - Parameter Summary (Group number 1)
Weights Covariances
Variances Means Interce
pts Total
Fixed 36 0 1 0 0 37 Labeled 0 0 0 0 0 0
Unlabeled 29 3 33 0 0 65
Total 65 3 34 0 0 102
Notes for Model (Default model)

Quantitative Data Analysis and Interpretation
©Ranjita Banerjee 337
Computation of degrees of freedom (Default model)
Number of distinct sample moments: 496
Number of distinct parameters to be estimated: 65
Degrees of freedom (496 - 65): 431
Result (Default model)
Minimum was achieved
Chi-square = 1983.768
Degrees of freedom = 431
Probability level = .000
Estimates (Group number 1 - Default model)
Scalar Estimates (Group number 1 - Default model)
Maximum Likelihood Estimates
Regression Weights: (Group number 1 - Default model)
TABLE 8.180 -Estimates, Standard Error and P-Values
Estimate S.E. C.R. P Label
Org_Performance <--- Emp Outcome 0.716 0.186 3.838 *** par_28 Org_Performance <--- HR PRACTICES 0.891 0.227 3.922 *** par_29 RIGHT <--- HR PRACTICES 1 SELEC <--- HR PRACTICES 1.213 0.139 8.743 *** par_1 TRAIN <--- HR PRACTICES 1.313 0.187 7.005 *** par_2 ROTA <--- HR PRACTICES 0.672 0.161 4.183 *** par_3 PERF <--- HR PRACTICES 1.173 0.121 9.719 *** par_4 FEED <--- HR PRACTICES 1.179 0.123 9.561 *** par_5 CAREER <--- HR PRACTICES 1.343 0.155 8.691 *** par_6 COMP <--- HR PRACTICES 0.945 0.106 8.909 *** par_7 FININC <--- HR PRACTICES 1.34 0.179 7.502 *** par_8 NOFIN <--- HR PRACTICES -0.081 0.195 -0.418 0.676 par_9 AUTH <--- HR PRACTICES 0.977 0.155 6.288 *** par_10 DECI <--- HR PRACTICES 0.622 0.188 3.316 *** par_11 IMPRV <--- HR PRACTICES 0.644 0.124 5.204 *** par_12
OPEN <--- HR PRACTICES 0.506 0.101 4.992 ***
par_13

Quantitative Data Analysis and Interpretation
©Ranjita Banerjee 338
Estimate S.E. C.R. P Label
RULES <--- Emp Outcome 1 INVLV <--- Emp Outcome 1.29 0.14 9.239 *** par_14 REGLR <--- Emp Outcome 1.249 0.139 8.996 *** par_15 PUNC <--- Emp Outcome 1.259 0.139 9.046 *** par_16 COMMT <--- Emp Outcome 1.345 0.141 9.571 *** par_17 BEHVR <--- Emp Outcome 0.944 0.112 8.396 *** par_18 COOPM <--- Emp Outcome 0.973 0.118 8.216 *** par_19 COOPE <--- Emp Outcome 0.923 0.115 8.043 *** par_20 COMP1 <--- Emp Outcome 0.743 0.107 6.972 *** par_21 CUSTSATIS <--- Org_Performance 0.616 0.033 18.434 *** par_22 SUPPLSATI <--- Org_Performance 0.599 0.034 17.718 *** par_23 PRODDEV <--- Org_Performance 0.575 0.035 16.532 *** par_24 QUALITY <--- Org_Performance 0 UTI <--- Org_Performance 0.638 0.038 16.996 *** par_25 DEFECTS <--- Org_Performance 0.502 0.04 12.589 *** par_26 PROFIT <--- Org_Performance 0.806 0.032 24.992 *** par_27 ROI <--- Org_Performance 1 (Source: AMOS Output; Primary data)
TABLE 8.181 -Standardized Regression Weights: (Group number 1 - Default model)
Estimate Org_Performance <--- Employee Outcome 0.308 Org_Performance <--- HR PRACTICES 0.316 RIGHT <--- HR PRACTICES 0.667 SELEC <--- HR PRACTICES 0.677 TRAIN <--- HR PRACTICES 0.529 ROTA <--- HR PRACTICES 0.307 PERF <--- HR PRACTICES 0.768 FEED <--- HR PRACTICES 0.753 CAREER <--- HR PRACTICES 0.673 COMP <--- HR PRACTICES 0.692 FININC <--- HR PRACTICES 0.57 NOFIN <--- HR PRACTICES -0.03 AUTH <--- HR PRACTICES 0.471 DECI <--- HR PRACTICES 0.243 IMPRV <--- HR PRACTICES 0.386 OPEN <--- HR PRACTICES 0.369

Quantitative Data Analysis and Interpretation
©Ranjita Banerjee 339
Estimate
RULES <--- Employee Outcome 0.639 INVLV <--- Employee Outcome 0.755 REGLR <--- Employee Outcome 0.73 PUNC <--- Employee Outcome 0.735 COMMT <--- Employee Outcome 0.792 BEHVR <--- Employee Outcome 0.669 COOPM <--- Employee Outcome 0.652 COOPE <--- Employee Outcome 0.635 COMP1 <--- Employee Outcome 0.537 CUSTSATIS <--- Org_Performance 0.89 SUPPLSATI <--- Org_Performance 0.873 PRODDEV <--- Org_Performance 0.842 QUALITY <--- Org_Performance 0 UTI <--- Org_Performance 0.854 DEFECTS <--- Org_Performance 0.717 PROFIT <--- Org_Performance 0.728 ROI <--- Org_Performance 0.755 (Source: AMOS Output; Primary data)
TABLE 8.182 -Covariances: (Group number 1 - Default model)
Estimate S.E. C.R. P Label
HR PRACTICES <--> Employee Outcome .096 .021 4.622 *** par_30
e12 <--> e13 .370 .053 6.951 *** par_31
e30 <--> e31 .738 .088 8.358 *** par_32
TABLE 8.183 – Correlations: (Group number 1 - Default model)
Estimate
HR PRACTICES <--> Employee Outcome .450
e12 <--> e13 .552
e30 <--> e31 .804
(Source: AMOS Output; Primary data)

Quantitative Data Analysis and Interpretation
©Ranjita Banerjee 340
TABLE 8.184– Variances: (Group number 1 - Default model)
Estimate S.E. C.R. P Label HR PRACTICES 0.175 0.033 5.27 *** par_33 Employee Outcome 0.259 0.052 5.013 *** par_34 e32 1 e1 0.218 0.023 9.311 *** par_35 e2 0.303 0.033 9.253 *** par_36 e3 0.776 0.079 9.846 *** par_37 e4 0.756 0.074 10.211 *** par_38 e5 0.168 0.02 8.491 *** par_39 e6 0.186 0.021 8.658 *** par_40 e7 0.382 0.041 9.28 *** par_41 e8 0.17 0.019 9.159 *** par_42 e9 0.651 0.067 9.726 *** par_43 e10 1.264 0.122 10.343 *** par_44 e11 0.586 0.059 9.979 *** par_45 e12 1.082 0.105 10.263 *** par_46 e13 0.415 0.041 10.121 *** par_47 e14 0.283 0.028 10.142 *** par_48 e15 0.374 0.039 9.545 *** par_49 e16 0.324 0.037 8.801 *** par_50 e17 0.354 0.039 9.023 *** par_51 e18 0.349 0.039 8.981 *** par_52 e19 0.278 0.033 8.391 *** par_53 e20 0.284 0.03 9.405 *** par_54 e21 0.331 0.035 9.49 *** par_55 e22 0.326 0.034 9.562 *** par_56 e23 0.352 0.036 9.876 *** par_57 e24 0.139 0.018 7.64 *** par_58 e25 0.157 0.019 8.074 *** par_59 e26 0.188 0.022 8.617 *** par_60 e27 0.476 0.046 10.344 *** par_61 e28 0.21 0.025 8.426 *** par_62 e29 0.332 0.035 9.603 *** par_63 e30 0.804 0.084 9.563 *** par_64 e31 1.049 0.111 9.445 *** par_65
(Source: AMOS Output; Primary data)

Quantitative Data Analysis and Interpretation
©Ranjita Banerjee 341
TABLE 8.185– Modification Indices (Group number 1 - Default model)
Covariances: (Group number 1 - Default model)
M.I. Par Change
e31 <--> Employee Outcome 9.635 -0.064 e31 <--> HR PRACTICES 12.064 -0.059 e29 <--> e31 10.752 -0.082 e29 <--> e30 5.582 0.051 e28 <--> e29 19.604 0.09 e27 <--> Employee Outcome 33.016 0.133 e27 <--> HR PRACTICES 19.305 0.084 e27 <--> e32 24.68 0.249 e27 <--> e31 15.451 -0.114 e27 <--> e29 11.75 0.096 e27 <--> e28 5.387 0.055 e26 <--> e29 6.396 0.048 e25 <--> e29 10.194 -0.057 e25 <--> e28 7.15 -0.04 e24 <--> e29 9.032 -0.052 e24 <--> e27 8.296 0.058 e24 <--> e25 25.675 0.063 e22 <--> e31 5.76 0.06 e22 <--> e30 11.942 -0.075 e22 <--> e26 7.835 0.053 e22 <--> e23 33.049 0.14 e21 <--> e28 8.104 -0.058 e21 <--> e23 6.732 0.064 e21 <--> e22 5.523 0.057 e20 <--> e30 4.793 0.044 e20 <--> e24 5.268 -0.037 e20 <--> e21 9.862 0.071 e19 <--> e30 4.957 0.047 e19 <--> e28 10.782 0.065 e19 <--> e26 6.808 -0.049 e19 <--> e23 7.582 -0.066 e19 <--> e21 7.864 0.066 e19 <--> e20 7.901 0.061 e18 <--> e32 4.748 0.099 e18 <--> e23 4.782 -0.057

Quantitative Data Analysis and Interpretation
©Ranjita Banerjee 342
M.I. Par Change
e18 <--> e22 4.127 -0.051 e18 <--> e20 4.671 -0.051 e17 <--> e22 5.194 -0.058 e17 <--> e20 4.621 -0.051 e17 <--> e19 9.227 -0.075 e17 <--> e18 34.655 0.159 e16 <--> e22 7.292 -0.066 e16 <--> e21 5.835 -0.06 e16 <--> e18 5.543 -0.061 e15 <--> e32 4.526 0.098 e15 <--> e26 5.684 0.049 e15 <--> e21 21.005 -0.118 e15 <--> e20 4.721 -0.052 e15 <--> e19 6.796 -0.065 e15 <--> e18 4.065 0.055 e15 <--> e16 26.785 0.136 e14 <--> Employee Outcome 11.14 0.06 e14 <--> e31 6.182 -0.056 e14 <--> e28 7.582 -0.051 e14 <--> e27 8.256 0.073 e13 <--> e29 7.316 0.06 e13 <--> e24 4.134 -0.032 e13 <--> e14 6.751 0.052 e12 <--> e25 6.589 0.067 e12 <--> e23 7.156 0.096 e12 <--> e19 5.178 -0.078 e11 <--> e31 9.401 -0.1 e11 <--> e30 11.861 0.098 e11 <--> e22 5.194 -0.072 e11 <--> e20 17.343 0.123 e11 <--> e15 9.853 -0.106 e11 <--> e13 4.185 0.059 e11 <--> e12 9.13 0.139 e10 <--> e31 5.526 -0.111 e10 <--> e30 12.196 0.143 e10 <--> e29 4.304 0.095 e10 <--> e26 4.297 -0.075 e10 <--> e23 4.47 -0.098 e10 <--> e21 11.897 0.159

Quantitative Data Analysis and Interpretation
©Ranjita Banerjee 343
M.I. Par Change
e9 <--> e29 7.592 -0.093 e9 <--> e18 14.297 -0.135 e9 <--> e17 6.94 0.094 e9 <--> e16 4.223 0.071 e9 <--> e13 11.262 -0.103 e8 <--> Employee Outcome 7.696 0.04 e8 <--> e27 6.849 0.054 e8 <--> e26 7.655 0.039 e8 <--> e25 6.63 -0.034 e8 <--> e19 5.072 0.039 e8 <--> e15 4.37 0.039 e8 <--> e11 15.386 -0.09 e7 <--> e16 14.002 0.101 e7 <--> e12 17.891 0.162 e7 <--> e8 6.553 0.049 e6 <--> e29 4.491 -0.04 e6 <--> e25 11.824 0.048 e6 <--> e21 4.22 -0.039 e6 <--> e19 19.423 -0.081 e6 <--> e18 5.511 0.047 e6 <--> e15 7.362 0.055 e5 <--> e32 6.098 0.08 e5 <--> e30 4.667 0.035 e5 <--> e29 4.022 -0.036 e5 <--> e14 4.925 -0.036 e5 <--> e13 5.517 -0.039 e5 <--> e12 6.373 -0.067 e5 <--> e8 6.957 0.035 e5 <--> e7 9.012 -0.059 e5 <--> e6 17.433 0.058 e4 <--> e29 4.088 -0.072 e4 <--> e26 6.052 -0.069 e4 <--> e25 5.688 0.063 e4 <--> e23 4.542 -0.077 e4 <--> e17 6.053 -0.093 e4 <--> e16 11.755 0.125 e4 <--> e12 8.979 0.155 e4 <--> e10 5.448 -0.157 e4 <--> e6 23.145 0.134

Quantitative Data Analysis and Interpretation
©Ranjita Banerjee 344
M.I. Par Change
e3 <--> e31 4.977 0.084 e3 <--> e29 4.824 -0.081 e3 <--> e22 15.177 0.142 e3 <--> e19 4.898 0.079 e3 <--> e18 5.301 -0.089 e3 <--> e9 8.811 0.151 e3 <--> e7 12.709 -0.142 e2 <--> Employee Outcome 4.277 -0.04 e2 <--> e29 36.95 0.143 e2 <--> e25 11.324 -0.059 e2 <--> e24 12.693 -0.06 e2 <--> e16 6.211 -0.06 e2 <--> e13 12.347 0.075 e2 <--> e12 4.228 -0.071 e2 <--> e11 8.719 0.091 e2 <--> e8 10.951 -0.057 e2 <--> e5 5.175 -0.04 e2 <--> e4 15.727 -0.137 e1 <--> e23 7.278 0.055 e1 <--> e22 6.64 0.051 e1 <--> e20 6.671 -0.048 e1 <--> e16 9.464 -0.063 e1 <--> e14 4.831 -0.039 e1 <--> e6 6.402 -0.039 e1 <--> e4 16.005 -0.117 e1 <--> e2 41.806 0.124 (Source: AMOS Output; Primary data)
TABLE 8.186– Variances: (Group number 1 - Default model)
M.I. Par Change
e32
38.896 -.679
(Source: AMOS Output; Primary data)

Quantitative Data Analysis and Interpretation
©Ranjita Banerjee 345
TABLE 8.187 - Regression Weights: (Group number 1 - Default model)
M.I. Par Change ROI <--- Employee Outcome 25.758 -0.442 ROI <--- HR PRACTICES 28.236 -0.565 ROI <--- Organization_Performance 17.685 -0.154 ROI <--- PROFIT 8.789 -0.095 ROI <--- DEFECTS 26.323 -0.261 ROI <--- UTI 8.207 -0.136 ROI <--- QUALITY 15.451 -0.239 ROI <--- PRODDEV 16.478 -0.212 ROI <--- SUPPLSATI 11.559 -0.176 ROI <--- CUSTSATIS 11.23 -0.172 ROI <--- COMP1 5.479 -0.14 ROI <--- COOPM 5.314 -0.127 ROI <--- BEHVR 15.802 -0.233 ROI <--- COMMT 17.261 -0.202 ROI <--- PUNC 20.981 -0.221 ROI <--- REGLR 13.901 -0.18 ROI <--- INVLV 17.214 -0.201 ROI <--- RULES 18.086 -0.224 ROI <--- OPEN 17.151 -0.303 ROI <--- IMPRV 7.047 -0.16 ROI <--- DECI 10.436 -0.126 ROI <--- AUTH 25.231 -0.243 ROI <--- NOFIN 4.83 -0.082 ROI <--- FININC 7.082 -0.114 ROI <--- COMP 16.653 -0.3 ROI <--- CAREER 16.693 -0.205 ROI <--- FEED 11.287 -0.215 ROI <--- PERF 22.622 -0.312 ROI <--- ROTA 4.776 -0.1 ROI <--- SELEC 7.529 -0.154 ROI <--- RIGHT 9.576 -0.207 PROFIT <--- HR PRACTICES 4.062 0.186 PROFIT <--- BEHVR 5.13 0.115 PROFIT <--- COMMT 4.307 0.088 PROFIT <--- AUTH 15.099 0.163 PROFIT <--- NOFIN 11.785 0.111 PROFIT <--- PERF 7.453 0.156 DEFECTS <--- Employee Outcome 7.096 0.225

Quantitative Data Analysis and Interpretation
©Ranjita Banerjee 346
M.I. Par Change DEFECTS <--- HR PRACTICES 5.64 0.245 DEFECTS <--- UTI 4.456 0.098 DEFECTS <--- QUALITY 11.75 0.202 DEFECTS <--- BEHVR 4.451 0.12 DEFECTS <--- COMMT 9.684 0.147 DEFECTS <--- PUNC 7.108 0.125 DEFECTS <--- RULES 5.771 0.123 DEFECTS <--- IMPRV 9.087 0.176 DEFECTS <--- NOFIN 4.023 0.073 DEFECTS <--- COMP 8.256 0.205 DEFECTS <--- SELEC 33.357 0.314 DEFECTS <--- RIGHT 8.449 0.189 UTI <--- DEFECTS 9.013 0.125 UTI <--- QUALITY 5.387 0.116 UTI <--- COMMT 7.945 0.112 UTI <--- OPEN 4.055 -0.121 UTI <--- SELEC 5.244 0.105 QUALITY <--- Employee Outcome 70.603 0.822 QUALITY <--- HR PRACTICES 58.047 0.911 QUALITY <--- Organization_Performance 80.614 0.371 QUALITY <--- PROFIT 5.239 0.083 QUALITY <--- DEFECTS 72.975 0.488 QUALITY <--- UTI 72.688 0.456 QUALITY <--- PRODDEV 67.115 0.48 QUALITY <--- SUPPLSATI 55.169 0.432 QUALITY <--- CUSTSATIS 78.872 0.512 QUALITY <--- COMP1 16.018 0.268 QUALITY <--- COOPE 38.392 0.396 QUALITY <--- COOPM 14.587 0.237 QUALITY <--- BEHVR 42.151 0.427 QUALITY <--- COMMT 48.494 0.38 QUALITY <--- PUNC 48.527 0.377 QUALITY <--- REGLR 25.825 0.275 QUALITY <--- INVLV 35.429 0.323 QUALITY <--- RULES 42.168 0.385 QUALITY <--- OPEN 28.099 0.437 QUALITY <--- AUTH 14.475 0.207 QUALITY <--- FININC 13.291 0.175 QUALITY <--- COMP 45.795 0.559

Quantitative Data Analysis and Interpretation
©Ranjita Banerjee 347
M.I. Par Change QUALITY <--- CAREER 30.709 0.313 QUALITY <--- FEED 26.241 0.369 QUALITY <--- PERF 41.791 0.477 QUALITY <--- TRAIN 14.094 0.171 QUALITY <--- SELEC 14.778 0.242 QUALITY <--- RIGHT 18.643 0.325 PRODDEV <--- HR PRACTICES 4.339 0.17 PRODDEV <--- COOPE 8.069 0.124 PRODDEV <--- RULES 6.384 0.102 PRODDEV <--- NOFIN 4.543 -0.061 PRODDEV <--- COMP 10.585 0.184 PRODDEV <--- CAREER 6.391 0.098 PRODDEV <--- TRAIN 6.149 0.077 PRODDEV <--- RIGHT 5.945 0.125 SUPPLSATI <--- DEFECTS 4.702 -0.079 SUPPLSATI <--- CUSTSATIS 4.394 0.078 SUPPLSATI <--- DECI 10.28 0.09 SUPPLSATI <--- FEED 6.606 0.119 SUPPLSATI <--- ROTA 6.005 0.081 CUSTSATIS <--- DEFECTS 4.184 -0.072 CUSTSATIS <--- QUALITY 8.296 0.122 CUSTSATIS <--- SUPPLSATI 5.282 0.083 CUSTSATIS <--- IMPRV 7.977 -0.118 CUSTSATIS <--- AUTH 4.806 -0.074 CUSTSATIS <--- SELEC 10.668 -0.128 COMP1 <--- COOPE 18.438 0.241 COMP1 <--- DECI 5.912 0.094 COMP1 <--- NOFIN 4.671 -0.08 COMP1 <--- FININC 5.341 0.097 COMP1 <--- RIGHT 8.88 0.197 COOPE <--- PRODDEV 4.957 0.112 COOPE <--- COMP1 22.629 0.273 COOPE <--- NOFIN 4.024 -0.072 COOPE <--- TRAIN 16.145 0.156 COOPE <--- RIGHT 7.956 0.182 COOPM <--- UTI 5.065 -0.104 COOPM <--- COMP1 4.611 0.125 COOPM <--- BEHVR 5.038 0.128 COOPM <--- RULES 11.628 -0.175

Quantitative Data Analysis and Interpretation
©Ranjita Banerjee 348
M.I. Par Change COOPM <--- NOFIN 11.955 0.126 BEHVR <--- COOPM 5.291 0.115 BEHVR <--- IMPRV 7.404 0.148 BEHVR <--- DECI 9.61 0.11 BEHVR <--- AUTH 12.253 0.153 BEHVR <--- RIGHT 4 -0.121 COMMT <--- PROFIT 4.689 0.065 COMMT <--- COMP1 5.219 -0.128 COMMT <--- COOPM 4.257 0.107 COMMT <--- BEHVR 4.079 0.111 COMMT <--- DECI 4.226 -0.076 COMMT <--- FEED 9.323 -0.184 PUNC <--- DEFECTS 4.137 0.106 PUNC <--- SUPPLSATI 4.377 0.111 PUNC <--- CUSTSATIS 4.695 0.114 PUNC <--- REGLR 14.601 0.189 PUNC <--- FININC 10.226 -0.14 PUNC <--- TRAIN 4.302 -0.086 REGLR <--- PUNC 14.306 0.188 REGLR <--- DECI 4.332 -0.084 REGLR <--- ROTA 7.156 -0.126 INVLV <--- COOPE 4.101 -0.115 INVLV <--- RULES 14.908 0.203 INVLV <--- CAREER 7.359 0.136 INVLV <--- ROTA 10.741 0.15 INVLV <--- RIGHT 4.472 -0.141 RULES <--- PRODDEV 7.233 0.145 RULES <--- SUPPLSATI 4.398 0.112 RULES <--- CUSTSATIS 5.531 0.125 RULES <--- COOPM 11.256 -0.192 RULES <--- INVLV 10.087 0.158 RULES <--- AUTH 6.716 -0.129 OPEN <--- Employee Outcome 8.416 0.221 OPEN <--- QUALITY 8.256 0.153 OPEN <--- SUPPLSATI 4.535 0.096 OPEN <--- CUSTSATIS 4.164 0.092 OPEN <--- COOPE 6.5 0.127 OPEN <--- BEHVR 5.501 0.12 OPEN <--- COMMT 6.397 0.107

Quantitative Data Analysis and Interpretation
©Ranjita Banerjee 349
M.I. Par Change OPEN <--- INVLV 6.631 0.109 OPEN <--- RULES 9.761 0.144 OPEN <--- IMPRV 11.086 0.175 OPEN <--- DECI 6.541 0.088 IMPRV <--- OPEN 5.731 0.154 IMPRV <--- FININC 7.202 -0.101 IMPRV <--- SELEC 6.065 0.122 DECI <--- COMP1 7.454 0.23 DECI <--- AUTH 6.883 0.179 DECI <--- CAREER 8.9 0.212 DECI <--- ROTA 8.037 0.184 AUTH <--- COOPE 4.207 -0.148 AUTH <--- BEHVR 6.738 0.193 AUTH <--- RULES 7.194 -0.179 AUTH <--- IMPRV 16.775 0.312 AUTH <--- DECI 23.246 0.239 AUTH <--- COMP 7.225 -0.25 AUTH <--- SELEC 4.292 0.147 NOFIN <--- COOPM 9.889 0.318 NOFIN <--- ROTA 4.876 -0.186 FININC <--- DEFECTS 4.15 -0.14 FININC <--- REGLR 4.54 0.139 FININC <--- IMPRV 6.284 -0.203 FININC <--- TRAIN 6.089 0.135 COMP <--- Employee Outcome 5.829 0.149 COMP <--- DEFECTS 6.572 0.092 COMP <--- QUALITY 6.849 0.113 COMP <--- PRODDEV 8.152 0.105 COMP <--- COMMT 9.414 0.106 COMP <--- RULES 9.092 0.113 COMP <--- IMPRV 5.584 -0.101 COMP <--- DECI 5.152 -0.063 COMP <--- AUTH 11.641 -0.117 COMP <--- SELEC 5.435 -0.093 CAREER <--- COOPM 4.237 0.12 CAREER <--- INVLV 11.7 0.174 CAREER <--- DECI 18.826 0.179 CAREER <--- TRAIN 8.8 -0.127 FEED <--- COOPM 4.671 -0.091

Quantitative Data Analysis and Interpretation
©Ranjita Banerjee 350
M.I. Par Change FEED <--- COMMT 10.625 -0.12 FEED <--- PERF 6.215 0.124 FEED <--- ROTA 20.757 0.159 PERF <--- PROFIT 4.9 0.052 PERF <--- CUSTSATIS 4.099 0.076 PERF <--- COOPE 4.049 -0.083 PERF <--- COOPM 4.146 -0.082 PERF <--- OPEN 4.193 -0.109 PERF <--- IMPRV 17.041 -0.18 PERF <--- DECI 19.697 -0.126 PERF <--- CAREER 4.567 -0.078 PERF <--- FEED 6.673 0.12 ROTA <--- INVLV 6.777 0.179 ROTA <--- IMPRV 6.557 0.219 ROTA <--- DECI 15.289 0.218 ROTA <--- NOFIN 5.442 -0.124 ROTA <--- FEED 8.606 0.268 ROTA <--- SELEC 7.724 -0.222 ROTA <--- RIGHT 8.102 -0.272 TRAIN <--- COOPE 11.137 0.278 TRAIN <--- FININC 5.644 0.149 TRAIN <--- CAREER 6.351 -0.186 SELEC <--- Organization_Performance 4.35 -0.072 SELEC <--- DEFECTS 6.988 0.126 SELEC <--- PRODDEV 4.456 -0.104 SELEC <--- SUPPLSATI 10.444 -0.158 SELEC <--- CUSTSATIS 10.341 -0.155 SELEC <--- INVLV 7.898 -0.128 SELEC <--- IMPRV 6.815 0.148 SELEC <--- AUTH 6.595 0.117 SELEC <--- COMP 5.183 -0.158 SELEC <--- ROTA 14.094 -0.162 SELEC <--- RIGHT 21.349 0.291 RIGHT <--- BEHVR 7.738 -0.13 RIGHT <--- INVLV 8.648 -0.113 RIGHT <--- OPEN 4.107 -0.118 RIGHT <--- ROTA 14.342 -0.138 RIGHT <--- SELEC 20.713 0.203 (Source: AMOS Output; Primary data)

Quantitative Data Analysis and Interpretation
©Ranjita Banerjee 351
8.12.3.2. Model Fit Summary
TABLE 8.188 - Model Fit Summary
CMIN
Model NPAR CMIN DF P CMIN/DF
Default model 65 1983.768 431 .000 4.603
Saturated model 496 .000 0
Independence model 31 4345.298 465 .000 9.345
RMR, GFI
Model RMR GFI AGFI PGFI
Default model .166 .648 .594 .563
Saturated model .000 1.000
Independence model .179 .254 .204 .238
Baseline Comparisons
Model NFI
Delta1 RFI
rho1 IFI
Delta2 TLI
rho2 CFI
Default model .543 .507 .603 .568 .600
Saturated model 1.000
1.000
1.000
Independence model .000 .000 .000 .000 .000
(Source: AMOS Output; Primary data)

Quantitative Data Analysis and Interpretation
©Ranjita Banerjee 352
8.12.3.3. Parsimony Adjusted Measures
TABLE 8.189 - Parsimony Adjusted Measures
Model PRATIO PNFI PCFI
Default model .927 .504 .556
Saturated model .000 .000 .000
Independence model 1.000 .000 .000
NCP
Model NCP LO 90 HI 90
Default model 1552.768 1418.135 1694.891
Saturated model .000 .000 .000
Independence model 3880.298 3672.904 4095.010
FMIN
Model FMIN F0 LO 90 HI 90
Default model 9.270 7.256 6.627 7.920
Saturated model .000 .000 .000 .000
Independence model 20.305 18.132 17.163 19.136
RMSEA
Model RMSEA LO 90 HI 90 PCLOSE
Default model .130 .124 .136 .000
Independence model .197 .192 .203 .000
(Source: AMOS Output; Primary data)

Quantitative Data Analysis and Interpretation
©Ranjita Banerjee 353
AIC
Model AIC BCC BIC CAIC
Default model 2113.768 2136.625 2332.859 2397.859
Saturated model 992.000 1166.418 2663.836 3159.836
Independence model 4407.298 4418.199 4511.788 4542.788
ECVI
Model ECVI LO 90 HI 90 MECVI
Default model 9.877 9.248 10.542 9.984
Saturated model 4.636 4.636 4.636 5.451
Independence model 20.595 19.626 21.598 20.646
HOELTER
Model HOELTER
.05 HOELTER
.01
Default model 52 55
Independence model 26 27
(Source: AMOS Output; Primary data)

Quantitative Data Analysis and Interpretation
©Ranjita Banerjee 354
8.12.4. THIRD MODIFICATION [e1<-->e2]
The third modification to improve the SEM model was done by grouping e1 and e2. The
Model Fit Summary with the third modification showed improved indices as compared to
the Base Model.
(Source: AMOS Output; Primary data)
Figure 8.35 - Third Modification [e1<-->e2]
8.12.4.1. Parameter summary (Third Modification)
TABLE 8.190 - Parameter summary (Group number 1)
Weights Covariances Variances Means Intercepts Total
Fixed 36 0 1 0 0 37
Labeled 0 0 0 0 0 0
Unlabeled 29 4 33 0 0 66
Total 65 4 34 0 0 103
(Source: AMOS Output; Primary data)

Quantitative Data Analysis and Interpretation
©Ranjita Banerjee 355
Notes for Model (Default model)
Computation of degrees of freedom (Default model)
Number of distinct sample moments: 496
Number of distinct parameters to be estimated: 66
Degrees of freedom (496 - 66): 430
Result (Default model)
Minimum was achieved
Chi-square = 1937.965
Degrees of freedom = 430
Probability level = .000
Estimates (Group number 1 - Default model)
Scalar Estimates (Group number 1 - Default model)
Maximum Likelihood Estimates
Regression Weights: (Group number 1 - Default model)
TABLE 8.191 - Estimates, Standard Error & P Value
Estimate S.E. C.R. P Label
Org_Perf <--- Emp Outcme 0.699 0.188 3.726 *** par_28 Org_Perf <--- HR PRACT 0.994 0.255 3.903 *** par_29 RIGHT <--- HR PRACT 1 SELEC <--- HR PRACT 1.214 0.116 10.481 *** par_1 TRAIN <--- HR PRACT 1.391 0.214 6.515 *** par_2 ROTA <--- HR PRACT 0.798 0.179 4.457 *** par_3 PERF <--- HR PRACT 1.289 0.145 8.903 *** par_4 FEED <--- HR PRACT 1.299 0.148 8.803 *** par_5 CAREER <--- HR PRACT 1.457 0.181 8.036 *** par_6 COMP <--- HR PRACT 1.042 0.125 8.302 *** par_7 FININC <--- HR PRACT 1.47 0.206 7.131 *** par_8 NOFIN <--- HR PRACT -0.13 0.212 -0.615 0.539 par_9 AUTH <--- HR PRACT 1.048 0.176 5.959 *** par_10

Quantitative Data Analysis and Interpretation
©Ranjita Banerjee 356
Estimate S.E. C.R. P Label
DECI <--- HR PRACT 0.685 0.207 3.317 *** par_11 IMPRV <--- HR PRACT 0.676 0.138 4.894 *** par_12 OPEN <--- HR PRACT 0.554 0.113 4.89 *** par_13 RULES <--- Emp Outcme 1 INVLV <--- Emp Outcme 1.291 0.139 9.256 *** par_14 REGLR <--- Emp Outcme 1.249 0.139 9.006 *** par_15 PUNC <--- Emp Outcme 1.259 0.139 9.054 *** par_16 COMMT <--- Emp Outcme 1.343 0.14 9.576 *** par_17 BEHVR <--- Emp Outcme 0.943 0.112 8.403 *** par_18 COOPM <--- Emp Outcme 0.971 0.118 8.216 *** par_19 COOPE <--- Emp Outcme 0.921 0.115 8.042 *** par_20 COMP1 <--- Emp Outcme 0.742 0.106 6.972 *** par_21 CUSTSATIS <--- Org_Perf 0.615 0.033 18.448 *** par_22 SUPPLSATI <--- Org_Perf 0.598 0.034 17.737 *** par_23 PRODDEV <--- Org_Perf 0.573 0.035 16.513 *** par_24 QUALITY <--- Org_Perf 0 UTI <--- Org_Perf 0.636 0.037 16.971 *** par_25 DEFECTS <--- Org_Perf 0.5 0.04 12.548 *** par_26 PROFIT <--- Org_Perf 0.806 0.032 25.046 *** par_27 ROI <--- Org_Perf 1
(Source: AMOS Output; Primary data)
TABLE 8.192 - Standardized Regression Weights: (Group number 1 - Default model)
Estimate Organization_Performance <--- Employee Outcome 0.301 Organization_Performance <--- HR PRACTICES 0.324 RIGHT <--- HR PRACTICES 0.616 SELEC <--- HR PRACTICES 0.626 TRAIN <--- HR PRACTICES 0.517 ROTA <--- HR PRACTICES 0.337 PERF <--- HR PRACTICES 0.778 FEED <--- HR PRACTICES 0.765 CAREER <--- HR PRACTICES 0.673 COMP <--- HR PRACTICES 0.704 FININC <--- HR PRACTICES 0.577 NOFIN <--- HR PRACTICES -0.045 AUTH <--- HR PRACTICES 0.466
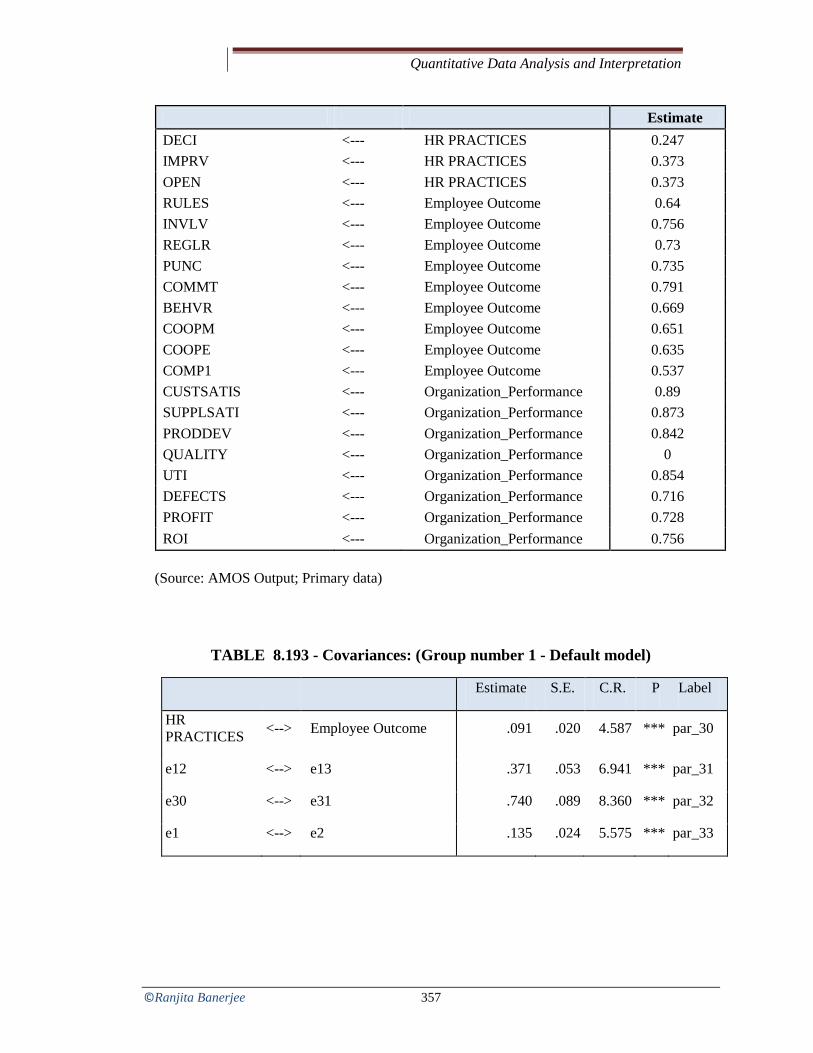
Quantitative Data Analysis and Interpretation
©Ranjita Banerjee 357
Estimate DECI <--- HR PRACTICES 0.247 IMPRV <--- HR PRACTICES 0.373 OPEN <--- HR PRACTICES 0.373 RULES <--- Employee Outcome 0.64 INVLV <--- Employee Outcome 0.756 REGLR <--- Employee Outcome 0.73 PUNC <--- Employee Outcome 0.735 COMMT <--- Employee Outcome 0.791 BEHVR <--- Employee Outcome 0.669 COOPM <--- Employee Outcome 0.651 COOPE <--- Employee Outcome 0.635 COMP1 <--- Employee Outcome 0.537 CUSTSATIS <--- Organization_Performance 0.89 SUPPLSATI <--- Organization_Performance 0.873 PRODDEV <--- Organization_Performance 0.842 QUALITY <--- Organization_Performance 0 UTI <--- Organization_Performance 0.854 DEFECTS <--- Organization_Performance 0.716 PROFIT <--- Organization_Performance 0.728 ROI <--- Organization_Performance 0.756
(Source: AMOS Output; Primary data)
TABLE 8.193 - Covariances: (Group number 1 - Default model)
Estimate S.E. C.R. P Label
HR PRACTICES <--> Employee Outcome .091 .020 4.587 *** par_30
e12 <--> e13 .371 .053 6.941 *** par_31
e30 <--> e31 .740 .089 8.360 *** par_32
e1 <--> e2 .135 .024 5.575 *** par_33

Quantitative Data Analysis and Interpretation
©Ranjita Banerjee 358
TABLE 8.194 - Correlations: (Group number 1 - Default model)
Estimate
HR PRACTICES <--> Employee Outcome .463
e12 <--> e13 .551
e30 <--> e31 .804
e1 <--> e2 .469
TABLE 8.195 - Variances: (Group number 1 - Default model)
Estimate S.E. C.R. P Label HR PRACTICES 0.149 0.031 4.727 *** par_34 Employee Outcome 0.259 0.052 5.019 *** par_35 e32 1
e1 0.244 0.026 9.479 *** par_36 e2 0.341 0.036 9.437 *** par_37 e3 0.789 0.08 9.845 *** par_38 e4 0.74 0.073 10.169 *** par_39 e5 0.161 0.02 8.224 *** par_40 e6 0.178 0.021 8.394 *** par_41 e7 0.381 0.041 9.204 *** par_42 e8 0.164 0.018 8.992 *** par_43 e9 0.643 0.067 9.659 *** par_44 e10 1.262 0.122 10.341 *** par_45 e11 0.59 0.059 9.966 *** par_46 e12 1.08 0.105 10.255 *** par_47 e13 0.42 0.041 10.123 *** par_48 e14 0.282 0.028 10.124 *** par_49 e15 0.373 0.039 9.543 *** par_50 e16 0.323 0.037 8.794 *** par_51 e17 0.354 0.039 9.022 *** par_52 e18 0.349 0.039 8.982 *** par_53 e19 0.279 0.033 8.4 *** par_54 e20 0.284 0.03 9.406 *** par_55 e21 0.332 0.035 9.494 *** par_56

Quantitative Data Analysis and Interpretation
©Ranjita Banerjee 359
Estimate S.E. C.R. P Label e22 0.326 0.034 9.566 *** par_57 e23 0.352 0.036 9.878 *** par_58 e24 0.139 0.018 7.629 *** par_59 e25 0.156 0.019 8.063 *** par_60 e26 0.189 0.022 8.624 *** par_61 e27 0.476 0.046 10.344 *** par_62 e28 0.21 0.025 8.437 *** par_63 e29 0.333 0.035 9.61 *** par_64 e30 0.805 0.084 9.562 *** par_65 e31 1.052 0.111 9.445 *** par_66
(Source: AMOS Output; Primary data)
TABLE 8.196- Modification Indices (Group number 1 - Default model)
Covariances: (Group number 1 - Default model)
M.I. Par Change e31 <--> Emp Outcme 9.107 -0.062 e31 <--> HR PRACTICES 12.584 -0.056 e29 <--> Emp Outcme 4.155 0.041 e29 <--> e31 10.688 -0.082 e29 <--> e30 5.582 0.051 e28 <--> e29 19.929 0.091 e27 <--> Emp Outcme 31.565 0.13 e27 <--> HR PRACTICES 20.223 0.08 e27 <--> e32 24.268 0.247 e27 <--> e31 15.491 -0.114 e27 <--> e29 11.864 0.097 e27 <--> e28 5.431 0.055 e26 <--> e29 6.589 0.049 e25 <--> e29 10.074 -0.057 e25 <--> e28 7.239 -0.04 e24 <--> e29 8.867 -0.051 e24 <--> e27 8.259 0.058 e24 <--> e25 25.141 0.062 e22 <--> e31 5.776 0.06 e22 <--> e30 11.936 -0.075
e22 <--> e26 7.867 0.053

Quantitative Data Analysis and Interpretation
©Ranjita Banerjee 360
M.I. Par Change e22 <--> e23 33.128 0.141 e21 <--> e28 8.02 -0.058 e21 <--> e23 6.787 0.064 e21 <--> e22 5.608 0.057 e20 <--> e30 4.774 0.044 e20 <--> e24 5.324 -0.037 e20 <--> e21 9.915 0.071 e19 <--> e30 4.923 0.047 e19 <--> e29 4.096 0.048 e19 <--> e28 10.831 0.065 e19 <--> e26 6.698 -0.048 e19 <--> e23 7.452 -0.065 e19 <--> e21 7.997 0.066 e19 <--> e20 7.948 0.061 e18 <--> e32 4.667 0.099 e18 <--> e23 4.751 -0.057 e18 <--> e22 4.066 -0.051 e18 <--> e20 4.68 -0.051 e17 <--> e22 5.145 -0.058 e17 <--> e20 4.649 -0.051 e17 <--> e19 9.151 -0.075 e17 <--> e18 34.597 0.158 e16 <--> e22 7.325 -0.066 e16 <--> e21 5.87 -0.06 e16 <--> e18 5.693 -0.062 e15 <--> e32 4.387 0.096 e15 <--> e26 5.656 0.049 e15 <--> e21 20.978 -0.118 e15 <--> e20 4.769 -0.052 e15 <--> e19 6.79 -0.065 e15 <--> e18 4.02 0.054 e15 <--> e16 26.598 0.136 e14 <--> Emp Outcme 10.632 0.059 e14 <--> e31 5.947 -0.055 e14 <--> e28 7.508 -0.051 e14 <--> e27 7.81 0.071 e13 <--> e29 8.145 0.063 e13 <--> e24 4.349 -0.033 e13 <--> e14 7.133 0.053

Quantitative Data Analysis and Interpretation
©Ranjita Banerjee 361
M.I. Par Change e12 <--> e25 6.517 0.067 e12 <--> e23 7.039 0.095 e12 <--> e19 5.174 -0.078 e11 <--> e31 9.26 -0.1 e11 <--> e30 11.777 0.098 e11 <--> e24 4.075 -0.046 e11 <--> e22 4.66 -0.068 e11 <--> e20 16.86 0.122 e11 <--> e15 10.105 -0.107 e11 <--> e13 4.78 0.063 e11 <--> e12 8.6 0.136 e10 <--> e31 5.89 -0.115 e10 <--> e30 12.425 0.145 e10 <--> e29 4.387 0.096 e10 <--> e26 4.133 -0.074 e10 <--> e23 4.37 -0.097 e10 <--> e21 11.906 0.159 e9 <--> e29 6.329 -0.085 e9 <--> e18 15.035 -0.138 e9 <--> e17 6.741 0.093 e9 <--> e13 10.282 -0.098 e8 <--> Emp Outcme 6.333 0.036 e8 <--> e29 5.521 0.041 e8 <--> e27 5.795 0.049 e8 <--> e26 8.015 0.039 e8 <--> e25 8.45 -0.038 e8 <--> e19 5.816 0.041 e8 <--> e15 4.109 0.038 e8 <--> e11 16.395 -0.093 e7 <--> e16 12.132 0.094 e7 <--> e12 16.505 0.156 e7 <--> e8 5.641 0.045 e6 <--> e25 10.4 0.045 e6 <--> e19 19.681 -0.081 e6 <--> e18 5.349 0.046 e6 <--> e15 7.095 0.053 e6 <--> e8 4.798 -0.029 e5 <--> Emp Outcme 4.232 -0.03 e5 <--> e32 5.353 0.074

Quantitative Data Analysis and Interpretation
©Ranjita Banerjee 362
M.I. Par Change e5 <--> e30 4.649 0.035 e5 <--> e14 6.17 -0.04 e5 <--> e13 4.435 -0.035 e5 <--> e12 8.505 -0.077 e5 <--> e8 4.688 0.028 e5 <--> e7 11.377 -0.066 e5 <--> e6 13.618 0.05 e4 <--> e26 6.571 -0.072 e4 <--> e25 5.223 0.06 e4 <--> e23 4.686 -0.078 e4 <--> e17 6.311 -0.094 e4 <--> e16 11.178 0.121 e4 <--> e12 8.794 0.152 e4 <--> e10 5.172 -0.151 e4 <--> e6 18.809 0.118 e3 <--> e31 4.802 0.084 e3 <--> e22 16.064 0.147 e3 <--> e19 5.139 0.081 e3 <--> e18 5.388 -0.091 e3 <--> e9 9.214 0.155 e3 <--> e7 11.27 -0.135 e2 <--> e32 4.517 -0.081 e2 <--> e29 31.347 0.12 e2 <--> e28 5.395 0.042 e2 <--> e25 9.026 -0.047 e2 <--> e24 12.663 -0.054 e2 <--> e13 11.259 0.065 e2 <--> e11 18.397 0.12 e2 <--> e8 9.268 -0.047 e2 <--> e4 4.872 -0.068 e1 <--> e26 4.659 0.031 e1 <--> e23 7.429 0.05 e1 <--> e22 4.886 0.039 e1 <--> e21 5.127 0.041 e1 <--> e20 8.031 -0.048 e1 <--> e16 4.322 -0.038 e1 <--> e14 5.649 -0.038 e1 <--> e11 8.693 -0.069 e1 <--> e8 4.8 0.028

Quantitative Data Analysis and Interpretation
©Ranjita Banerjee 363
M.I. Par Change e1 <--> e5 4.52 0.028 e1 <--> e4 5.19 -0.06
(Source: AMOS Output; Primary data)
Variances: (Group number 1 - Default model)
M.I. Par Change
e32
39.335 -.684
TABLE 8.197- Regression Weights: (Group number 1 - Default model)
M.I. Par Change
ROI <--- Employee Outcome 25.853 -0.442 ROI <--- HR PRACTICES 29.434 -0.628 ROI <--- Organization_Performance 17.755 -0.154 ROI <--- PROFIT 8.835 -0.095 ROI <--- DEFECTS 26.311 -0.261 ROI <--- UTI 8.229 -0.137 ROI <--- QUALITY 15.491 -0.239 ROI <--- PRODDEV 16.519 -0.212 ROI <--- SUPPLSATI 11.627 -0.177 ROI <--- CUSTSATIS 11.291 -0.173 ROI <--- COMP1 5.463 -0.139 ROI <--- COOPM 5.317 -0.128 ROI <--- BEHVR 15.819 -0.233 ROI <--- COMMT 17.273 -0.202 ROI <--- PUNC 20.981 -0.221 ROI <--- REGLR 13.91 -0.18 ROI <--- INVLV 17.253 -0.201 ROI <--- RULES 18.088 -0.225 ROI <--- OPEN 17.166 -0.304 ROI <--- IMPRV 7.031 -0.159 ROI <--- DECI 10.427 -0.126 ROI <--- AUTH 25.249 -0.243 ROI <--- NOFIN 4.822 -0.082

Quantitative Data Analysis and Interpretation
©Ranjita Banerjee 364
M.I. Par Change
ROI <--- FININC 7.124 -0.114 ROI <--- COMP 16.704 -0.301 ROI <--- CAREER 16.703 -0.205 ROI <--- FEED 11.339 -0.216 ROI <--- PERF 22.717 -0.313 ROI <--- ROTA 4.823 -0.101 ROI <--- SELEC 7.477 -0.153 ROI <--- RIGHT 9.53 -0.207 PROFIT <--- HR PRACTICES 4.209 0.207 PROFIT <--- BEHVR 5.131 0.115 PROFIT <--- COMMT 4.312 0.088 PROFIT <--- AUTH 15.099 0.163 PROFIT <--- NOFIN 11.797 0.112 PROFIT <--- PERF 7.442 0.156 DEFECTS <--- Employee Outcome 7.076 0.225 DEFECTS <--- UTI 4.549 0.099 DEFECTS <--- QUALITY 11.864 0.204 DEFECTS <--- BEHVR 4.487 0.121 DEFECTS <--- COMMT 9.774 0.148 DEFECTS <--- PUNC 7.166 0.125 DEFECTS <--- RULES 5.814 0.124 DEFECTS <--- IMPRV 9.101 0.176 DEFECTS <--- NOFIN 4.036 0.073 DEFECTS <--- COMP 8.288 0.206 DEFECTS <--- SELEC 33.603 0.316 DEFECTS <--- RIGHT 8.614 0.191 UTI <--- DEFECTS 9.205 0.126 UTI <--- QUALITY 5.431 0.116 UTI <--- COMMT 8.022 0.113 UTI <--- OPEN 4.037 -0.121 UTI <--- SELEC 5.434 0.107 QUALITY <--- Employee Outcome 70.697 0.822 QUALITY <--- HR PRACTICES 60.757 1.014 QUALITY <--- Organization_Performance 80.627 0.37 QUALITY <--- PROFIT 5.223 0.082 QUALITY <--- DEFECTS 73.063 0.488 QUALITY <--- UTI 72.747 0.457 QUALITY <--- PRODDEV 67.159 0.48

Quantitative Data Analysis and Interpretation
©Ranjita Banerjee 365
M.I. Par Change
QUALITY <--- SUPPLSATI 55.156 0.432 QUALITY <--- CUSTSATIS 78.865 0.512 QUALITY <--- COMP1 16.018 0.268 QUALITY <--- COOPE 38.392 0.396 QUALITY <--- COOPM 14.587 0.237 QUALITY <--- BEHVR 42.151 0.427 QUALITY <--- COMMT 48.494 0.38 QUALITY <--- PUNC 48.527 0.377 QUALITY <--- REGLR 25.825 0.275 QUALITY <--- INVLV 35.429 0.323 QUALITY <--- RULES 42.168 0.385 QUALITY <--- OPEN 28.099 0.437 QUALITY <--- AUTH 14.475 0.207 QUALITY <--- FININC 13.291 0.175 QUALITY <--- COMP 45.795 0.559 QUALITY <--- CAREER 30.709 0.313 QUALITY <--- FEED 26.241 0.369 QUALITY <--- PERF 41.791 0.477 QUALITY <--- TRAIN 14.094 0.171 QUALITY <--- SELEC 14.778 0.242 QUALITY <--- RIGHT 18.643 0.325 PRODDEV <--- HR PRACTICES 4.201 0.182 PRODDEV <--- COOPE 8.131 0.125 PRODDEV <--- RULES 6.389 0.103 PRODDEV <--- NOFIN 4.481 -0.061 PRODDEV <--- COMP 10.555 0.184 PRODDEV <--- CAREER 6.384 0.098 PRODDEV <--- TRAIN 6.177 0.077 PRODDEV <--- RIGHT 6.124 0.127 SUPPLSATI <--- DEFECTS 4.669 -0.079 SUPPLSATI <--- CUSTSATIS 4.282 0.076 SUPPLSATI <--- DECI 10.278 0.09 SUPPLSATI <--- FEED 6.478 0.117 SUPPLSATI <--- ROTA 5.86 0.08 CUSTSATIS <--- DEFECTS 4.127 -0.072 CUSTSATIS <--- QUALITY 8.259 0.122 CUSTSATIS <--- SUPPLSATI 5.146 0.082 CUSTSATIS <--- IMPRV 7.986 -0.118

Quantitative Data Analysis and Interpretation
©Ranjita Banerjee 366
M.I. Par Change
CUSTSATIS <--- AUTH 4.847 -0.074 CUSTSATIS <--- SELEC 10.433 -0.126 COMP1 <--- COOPE 18.513 0.241 COMP1 <--- DECI 5.887 0.094 COMP1 <--- NOFIN 4.63 -0.079 COMP1 <--- FININC 5.293 0.097 COMP1 <--- RIGHT 8.967 0.198 COOPE <--- PRODDEV 4.956 0.112 COOPE <--- COMP1 22.697 0.274 COOPE <--- TRAIN 16.145 0.156 COOPE <--- RIGHT 8.064 0.183 COOPM <--- UTI 5.053 -0.104 COOPM <--- COMP1 4.651 0.125 COOPM <--- BEHVR 5.065 0.128 COOPM <--- RULES 11.598 -0.175 COOPM <--- NOFIN 12.019 0.126 BEHVR <--- COOPM 5.329 0.116 BEHVR <--- IMPRV 7.398 0.148 BEHVR <--- DECI 9.561 0.11 BEHVR <--- AUTH 12.211 0.153 COMMT <--- PROFIT 4.647 0.065 COMMT <--- COMP1 5.133 -0.127 COMMT <--- COOPM 4.336 0.109 COMMT <--- BEHVR 4.103 0.112 COMMT <--- DECI 4.251 -0.076 COMMT <--- FEED 9.5 -0.186 PUNC <--- DEFECTS 4.177 0.106 PUNC <--- SUPPLSATI 4.322 0.11 PUNC <--- CUSTSATIS 4.648 0.113 PUNC <--- REGLR 14.565 0.188 PUNC <--- FININC 10.36 -0.141 PUNC <--- TRAIN 4.305 -0.086 REGLR <--- PUNC 14.28 0.187 REGLR <--- DECI 4.378 -0.084 REGLR <--- ROTA 7.331 -0.128 INVLV <--- COOPE 4.126 -0.115 INVLV <--- RULES 14.787 0.202 INVLV <--- CAREER 7.246 0.134

Quantitative Data Analysis and Interpretation
©Ranjita Banerjee 367
M.I. Par Change
INVLV <--- ROTA 10.539 0.148 INVLV <--- RIGHT 4.398 -0.14 RULES <--- DEFECTS 4.007 0.105 RULES <--- PRODDEV 7.199 0.144 RULES <--- SUPPLSATI 4.347 0.111 RULES <--- CUSTSATIS 5.482 0.124 RULES <--- COOPM 11.261 -0.191 RULES <--- INVLV 9.978 0.158 RULES <--- AUTH 6.762 -0.13 OPEN <--- Employee Outcome 7.868 0.213 OPEN <--- QUALITY 7.81 0.149 OPEN <--- SUPPLSATI 4.093 0.092 OPEN <--- COOPE 6.489 0.126 OPEN <--- BEHVR 5.11 0.116 OPEN <--- COMMT 6.171 0.105 OPEN <--- INVLV 5.939 0.103 OPEN <--- RULES 9.245 0.14 OPEN <--- IMPRV 11.481 0.178 OPEN <--- DECI 6.378 0.086 IMPRV <--- OPEN 6.027 0.159 IMPRV <--- FININC 6.46 -0.096 IMPRV <--- SELEC 8.258 0.143 DECI <--- COMP1 7.103 0.225 DECI <--- AUTH 6.517 0.174 DECI <--- CAREER 8.151 0.203 DECI <--- ROTA 7.679 0.18 AUTH <--- BEHVR 6.335 0.187 AUTH <--- RULES 7.542 -0.184 AUTH <--- IMPRV 17.769 0.322 AUTH <--- DECI 23.024 0.239 AUTH <--- COMP 7.357 -0.254 AUTH <--- SELEC 6.4 0.18 NOFIN <--- COOPM 10.283 0.325 NOFIN <--- ROTA 4.516 -0.179 FININC <--- PUNC 4.655 -0.14 FININC <--- IMPRV 5.989 -0.198 FININC <--- TRAIN 6.479 0.139 COMP <--- Employee Outcome 4.702 0.132

Quantitative Data Analysis and Interpretation
©Ranjita Banerjee 368
M.I. Par Change
COMP <--- DEFECTS 7.28 0.096 COMP <--- QUALITY 5.795 0.103 COMP <--- PRODDEV 7.37 0.099 COMP <--- COMMT 8.843 0.101 COMP <--- RULES 7.948 0.104 COMP <--- IMPRV 5.401 -0.098 COMP <--- DECI 5.981 -0.067 COMP <--- AUTH 12.476 -0.12 CAREER <--- COOPM 4.125 0.119 CAREER <--- INVLV 9.842 0.16 CAREER <--- DECI 18.457 0.178 CAREER <--- TRAIN 7.941 -0.121 FEED <--- COOPM 5.601 -0.098 FEED <--- COMMT 12.807 -0.131 FEED <--- PERF 4.6 0.106 FEED <--- ROTA 16.473 0.14 PERF <--- PROFIT 4.703 0.05 PERF <--- COOPE 4.54 -0.087 PERF <--- COOPM 4.943 -0.089 PERF <--- INVLV 5.183 -0.079 PERF <--- RULES 5.59 -0.09 PERF <--- OPEN 5.234 -0.121 PERF <--- IMPRV 16.965 -0.178 PERF <--- DECI 22.37 -0.133 PERF <--- CAREER 5.749 -0.087 PERF <--- FEED 4.918 0.102 ROTA <--- INVLV 5.599 0.162 ROTA <--- IMPRV 6.149 0.21 ROTA <--- DECI 14.634 0.211 ROTA <--- NOFIN 5.16 -0.12 ROTA <--- FEED 6.534 0.231 ROTA <--- SELEC 8.144 -0.226 ROTA <--- RIGHT 8.513 -0.276 TRAIN <--- COOPE 11.581 0.286 TRAIN <--- FININC 5.8 0.152 TRAIN <--- CAREER 5.592 -0.176 TRAIN <--- RIGHT 4.045 0.199 SELEC <--- Organization_Performance 4.128 -0.063

Quantitative Data Analysis and Interpretation
©Ranjita Banerjee 369
M.I. Par Change
SELEC <--- DEFECTS 5.617 0.103 SELEC <--- PRODDEV 5.738 -0.106 SELEC <--- SUPPLSATI 9.157 -0.134 SELEC <--- CUSTSATIS 10.015 -0.138 SELEC <--- IMPRV 8.75 0.152 SELEC <--- AUTH 13.954 0.154 SELEC <--- COMP 4.157 -0.128 SELEC <--- ROTA 4.256 -0.081 RIGHT <--- PRODDEV 4.749 0.082 RIGHT <--- BEHVR 5.473 -0.099 RIGHT <--- OPEN 4.775 -0.115 RIGHT <--- AUTH 6.592 -0.089 RIGHT <--- ROTA 4.534 -0.07
(Source: AMOS Output; Primary data)
8.12.4.2. Model Fit Summary (Third Modification)
TABLE 8.198 - Model Fit Summary
CMIN
Model NPAR CMIN DF P CMIN/DF
Default model 66 1937.965 430 0 4.507 Saturated model 496 0 0
Independence model 31 4345.298 465 0 9.345
RMR, GFI
Model RMR GFI AGFI PGFI Default model 0.166 0.655 0.602 0.568 Saturated model 0 1
Independence model 0.179 0.254 0.204 0.238
(Source: AMOS Output; Primary data)
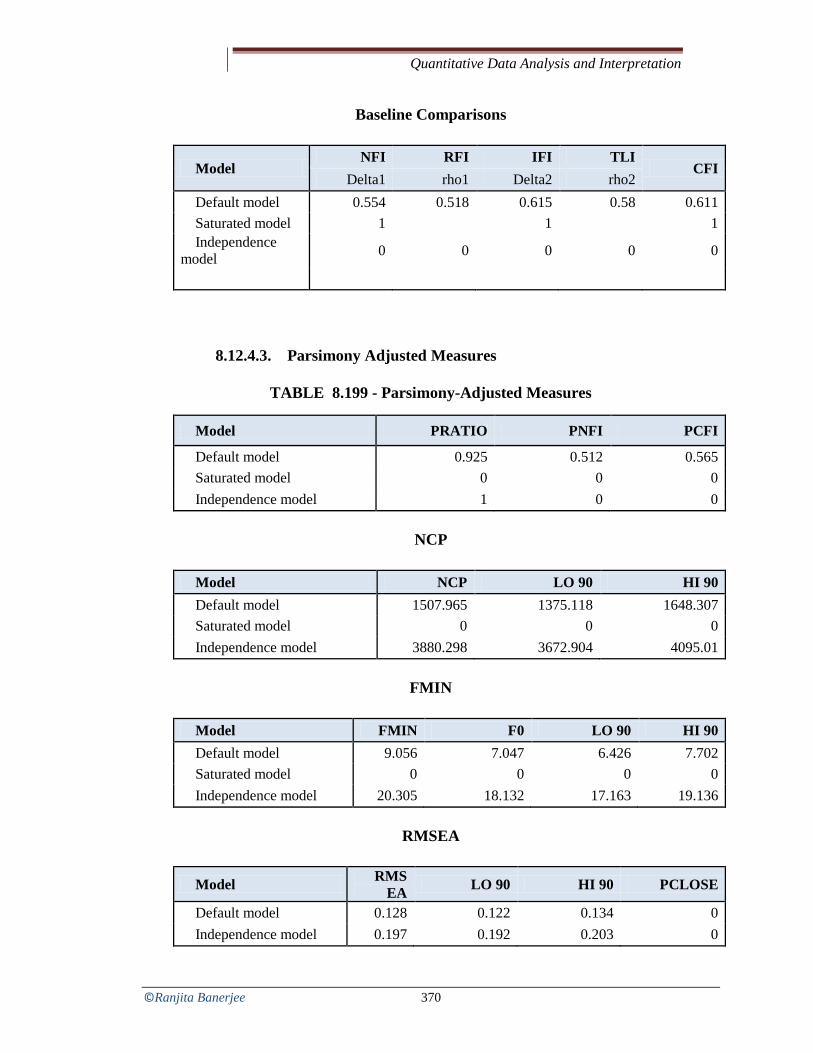
Quantitative Data Analysis and Interpretation
©Ranjita Banerjee 370
Baseline Comparisons
Model NFI RFI IFI TLI
CFI Delta1 rho1 Delta2 rho2
Default model 0.554 0.518 0.615 0.58 0.611 Saturated model 1
1
1
Independence model 0 0 0 0 0
8.12.4.3. Parsimony Adjusted Measures
TABLE 8.199 - Parsimony-Adjusted Measures
Model PRATIO PNFI PCFI
Default model 0.925 0.512 0.565 Saturated model 0 0 0 Independence model 1 0 0
NCP
Model NCP LO 90 HI 90 Default model 1507.965 1375.118 1648.307 Saturated model 0 0 0 Independence model 3880.298 3672.904 4095.01
FMIN
Model FMIN F0 LO 90 HI 90 Default model 9.056 7.047 6.426 7.702 Saturated model 0 0 0 0 Independence model 20.305 18.132 17.163 19.136
RMSEA
Model RMSEA LO 90 HI 90 PCLOSE
Default model 0.128 0.122 0.134 0 Independence model 0.197 0.192 0.203 0

Quantitative Data Analysis and Interpretation
©Ranjita Banerjee 371
AIC
Model AIC BCC BIC CAIC
Default model 2069.965 2093.174 2292.427 2358.427
Saturated model 992.000 1166.418 2663.836 3159.836
Independence model 4407.298 4418.199 4511.788 4542.788
ECVI
Model ECVI LO 90 HI 90 MECVI
Default model 9.673 9.052 10.329 9.781
Saturated model 4.636 4.636 4.636 5.451
Independence model 20.595 19.626 21.598 20.646
HOELTER
Model HOELTER
.05 HOELTER
.01
Default model 53 56
Independence model 26 27
(Source: AMOS Output; Primary data)

Quantitative Data Analysis and Interpretation
©Ranjita Banerjee 372
8.12.5. Summary of Structural Equation Modeling
TABLE 8.200 – Summary Results of SEM Modifications
Base Model Modification 1 Modification 2 Modification 3
e12e13 e30e31 e1e2
Chi-Square 2224.35 2148.43 1983.76 1937.96
(p=0.000) (p=0.000) (p=0.000) (p=0.000) HRPracticesOrganizational Performance
0.879 0.89 0.891 0.994
(p=0.000) (p=0.000) (p=0.000) (p=0.000)
Employee Outcome Organizational Performance
0.702 0.7 0.716 0.699 (p=0.000) (p=0.000) (p=0.000) (p=0.000)
HR Practices Employee Outcome
0.096 0.096 0.096 0.091 (p=0.000) (p=0.000) (p=0.000) (p=0.000)
CMIN 2224.35 2148.439 1983.768 1937.965 CMIN/DF 5.137 4.973 4.603 4.507 Root Mean Square Residual (RMR) 0.137 0.137 0.166 0.166
Goodness of Fit Index (GFI) 0.62 0.633 0.648 0.655 Adjusted Goodness of Fit Index (AGFI) 0.564 0.579 0.594 0.602
Normed Fit Index (NFI) 0.488 0.506 0.543 0.554 Relative Fit Index (RFI) 0.45 0.468 0.507 0.518 Incremental Fit Index(IFI) 0.542 0.561 0.603 0.615 Tucker Lewis Index (TLI) 0.504 0.524 0.568 0.58 PRATIO 0.931 0.929 0.927 0.925 PNFI 0.455 0.47 0.504 0.512 PCFI 0.501 0.518 0.556 0.565 Non Centrality Parameter (NCP) 1791.358 1716.439 1552.768 1507.965
Root Mean Square of Approximation (RMSEA) 0.139 0.136 0.13 0.128
Akaike’s Information Criterion (AIC) 2350.358 2276.439 2113.768 2069.965
Expected Cross-Validation Index (ECVI) 10.983 10.638 9.877 9.673
(Source: Compiled by Author based on inputs from AMOS Output)

Quantitative Data Analysis and Interpretation
©Ranjita Banerjee 373
Thus, the summary results of the SEM Modifications as shown in Table 8.200 shows that
the third modification indices shows a marked improvement over the base model. The
hypothesized Technology Acceptance Model which was tested using Structural Equation
Modeling using AMOS 18 software, tested the following hypotheses:
Linkage 1:
H1. HR Practices positively and directly affects Organizational Performance.
Linkage 2:
H2. Employee Outcome positively and directly affects Organizational Performance.
Linkage 3:
H3. There exists covariance between HR Practices and Employee Outcome.
The final results of the relation between the constructs rejected the null hypotheses (as the
p value was less than 0.05) and concluded that:
• HR Practices positively and directly affects Organizational Performance
• Employee Outcome positively and directly affects Organizational Performance
• There exists covariance between HR Practices and Employee Outcome
CHAPTER – 9
©Ranjita Banerjee 374
CHAPTER – 9
Problems and Challenges Identified through
Interviews & Interactions
9.1. Prelude
One of the objectives of the study was: ‘To identify the various problems and challenges
faced by the SMEs’. (Objective No. 8; Refer Page 78).
In the present study data obtained through interviews and interactive discussions with the
Managing Heads (owners, entrepreneurs, HR Managers as well as Supervisors or
Departmental Heads) were noted down and transcribed. A total of 45 Managing Heads
in the SME firms were ready for the interactive discussion to share about the major
problems and challenges faced by the SMEs in general, or their firm, in particular.
The interviews and interactive discussions through open-ended questions on the problems
and challenges faced by the SMEs with the Managing Heads helped to gain some real
insights into some basic issues which the sector is facing.
9.2. The Methodology – Through Semi-structured Interviews and Open-ended Questions
The methodology to gather information on the problems and challenges faced by the
SMEs included asking a few open-ended questions through semi-structured interview
with the Managing Heads. A total of 45 Managing Heads were interviewed who agreed
and were willing to go forward with the interactive session and who were eager to
communicate and express some problems, challenges or concerns faced by the sector.

Problems and Challenges Identified through Interviews & Interactions
©Ranjita Banerjee 375
The following steps were taken to identify the major problems and challenges faced
by the SME sector:
Step 1: Identifying the problems, challenges or concerns faced by the SMEs by
asking specific open-ended questions
It was observed during the pilot study and shared by the respondents that the SME firms
experienced decreasing or no change in the Returns on Investment (ROI) as well as Net
Profit Margin in the last two fiscal years, though the HR practices as well as
management practices were good in the organization. Based on the observation,
following three open-ended questions were asked to the entrepreneurs through a semi-
structured open-ended questionnaire:
1. What are the major employee related problems or challenges faced by the SME
firm?
2. What have been the major reasons which have helped the firm to accomplish its
goals?
3. What are the major problems or challenges faced by the firm or SMEs in general
which acts as hindrance to achieve desired goals?
Step 2: Transcript of the raw data received as feedback from the respondents
It is important to record the interview and interactions to confirm the exact content
(Punch, 2005; Schilling, 2006). The interviews were conducted in a conducive
environment at the Managing heads workplace, and the researcher assured the
respondents that the feedback and interactions captured during the interactive session
shall be used for academic purpose only. Further, the researcher assured the respondents
that their names as well as their firm’s names would be kept confidential and would not
be required to be mentioned. This was done to get a real scenario of the situation from
the respondents. The answers received from the respondents were transcribed and
recorded in the questionnaire.
Step 3: Grouping the raw data in various major heads to identify the major
problems and challenges faced by the SMEs, alongwith their reasons

Problems and Challenges Identified through Interviews & Interactions
©Ranjita Banerjee 376
According to Chadwick et al., (1984), ‘categories must be mutually exclusive so that a
word, a paragraph or a theme belongs in one and only one category. Also, the categories
must be exhaustive so that all units examined fit in an appropriate category’.
Researcher in the present study developed some major groups to identify the major
problems and challenges faced by the SME sector, in general, keeping in mind that the
groups made were mutually exclusive as well as exhaustive. These are classified into
main heads below :
• Decreasing or no change in the Return on Investment (ROI) and Net Profit Margin
(NPM) of the SMEs over current and the previous year
• Lack of availability of skilled manpower
• Low retention of the employees
• High absenteeism and irregularity of labour
• Regulatory hurdles and legal obligations to be fulfilled by owners / Supervisors
Table 9.1 summarizes the major problems and challenges and detailed reasons.
TABLE 9.1 – Major Problems and Challenges faced by the SMEs and the Reasons thereof
Srl. Major problems and challenges faced by the SMEs
Reasons/ issues shared by the respondents for the problem/ challenge
1. Decreasing or no change in the Return on Investment (ROI) as well as the Net Profit Margin of the SMEs over the current year as well as the previous year
High level of competition from domestic & international market, especially from China.
Easy availability of low cost China-made substitute products for suppliers.
Overall increase in price of raw-materials and other substances.
Employee’s demand for high wages, especially trained staff; at par with that of large enterprises; causing the wage-bill to increase, ultimately leading to lower profits (Net Profit Margin).
Rapid technological changes vis-à-vis lack of funds for technological upgradation...thus. vicious cycle continues.
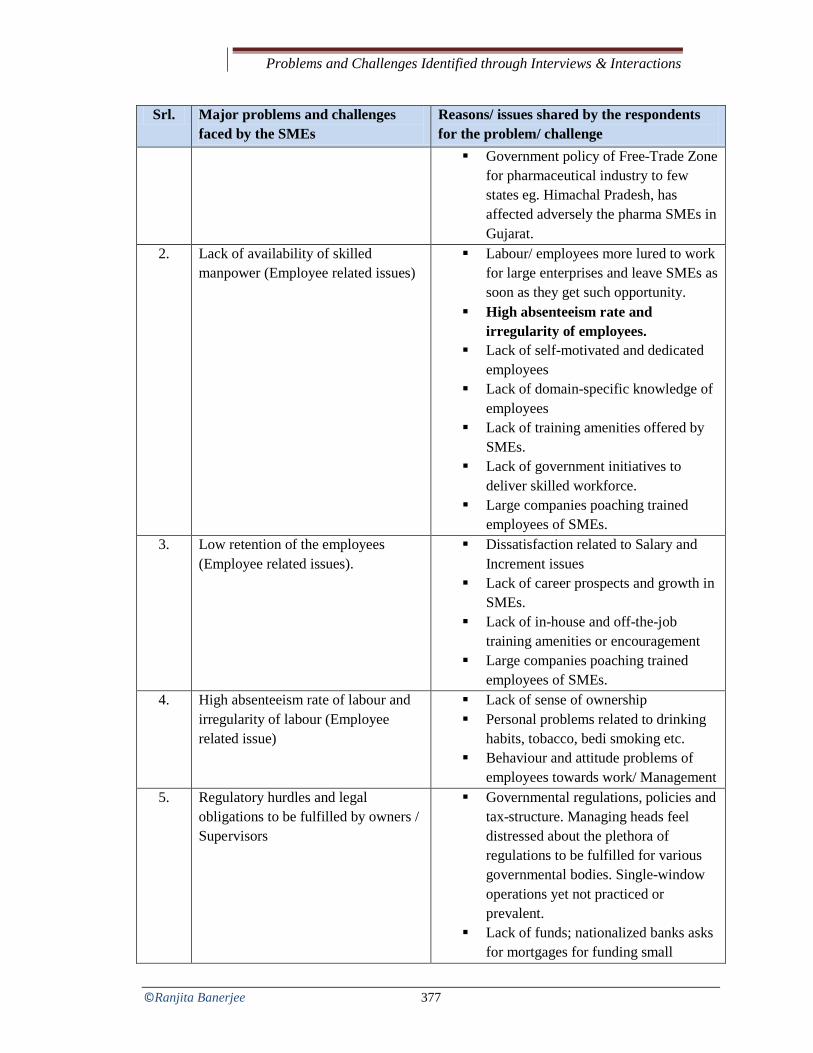
Problems and Challenges Identified through Interviews & Interactions
©Ranjita Banerjee 377
Srl. Major problems and challenges faced by the SMEs
Reasons/ issues shared by the respondents for the problem/ challenge Government policy of Free-Trade Zone
for pharmaceutical industry to few states eg. Himachal Pradesh, has affected adversely the pharma SMEs in Gujarat.
2. Lack of availability of skilled manpower (Employee related issues)
Labour/ employees more lured to work for large enterprises and leave SMEs as soon as they get such opportunity.
High absenteeism rate and irregularity of employees.
Lack of self-motivated and dedicated employees
Lack of domain-specific knowledge of employees
Lack of training amenities offered by SMEs.
Lack of government initiatives to deliver skilled workforce.
Large companies poaching trained employees of SMEs.
3. Low retention of the employees (Employee related issues).
Dissatisfaction related to Salary and Increment issues
Lack of career prospects and growth in SMEs.
Lack of in-house and off-the-job training amenities or encouragement
Large companies poaching trained employees of SMEs.
4. High absenteeism rate of labour and irregularity of labour (Employee related issue)
Lack of sense of ownership Personal problems related to drinking
habits, tobacco, bedi smoking etc. Behaviour and attitude problems of
employees towards work/ Management 5. Regulatory hurdles and legal
obligations to be fulfilled by owners / Supervisors
Governmental regulations, policies and tax-structure. Managing heads feel distressed about the plethora of regulations to be fulfilled for various governmental bodies. Single-window operations yet not practiced or prevalent.
Lack of funds; nationalized banks asks for mortgages for funding small

Problems and Challenges Identified through Interviews & Interactions
©Ranjita Banerjee 378
Srl. Major problems and challenges faced by the SMEs
Reasons/ issues shared by the respondents for the problem/ challenge
industries, due to high risks involved in funding SMEs; whereas venture capitalists charge very high ROI.
Stringent and plethora of labour laws. (Source: Developed by author, based on interactions with Respondents)
9.2 Reasons which have helped the SME firms/ Managing heads to achieve desired
organizational goals despite various problems/ challenges
Some reasons were also shared by the SME Managing Heads who believed that their
firms could achieve desired goals, despite some problems and challenges faced by the
sector. Some of the reasons enumerated by them are as follows:
• High level of commitment towards work by employees and Management; Hard-
work of employees: Few of the entrepreneurs believed that some key personnel of
their firms were greatly responsible for the achievement of goals of their firms.
However, they shared that the blue-collar workers (labours) though are unreliable
most of the times.
• Team-work and team-spirit of staff: They believed that there is good team-work
and team-spirit among the workers.
• Honesty, integrity and ethical work practices: Few entrepreneurs shared that they
believed in trust and ethical work practices which had been primarily responsible
for having trusted customers with them over many years.
• Good quality products at comparatively low costs, by achieving economies of
scale: Some entrepreneurs shared that ‘quality’ is their bench-mark. They shared
that they could have never attained the present status had they not have
guaranteed good quality products and services. They shared that it is only
‘quality’ per se which can beat foreign competition.
• Experienced employees and old staff, some of whom have spent more than 25
years: Some entrepreneurs shared that they value their human resources, and
have maintained a ‘family-like culture’ at their work-place, which has resulted
into good retention of their valued staff.

Problems and Challenges Identified through Interviews & Interactions
©Ranjita Banerjee 379
• Proactive improvement in engineering technology, product designing and services
innovation: Some entrepreneurs shared that it is only ‘innovation’ which can beat
tough competition. They shared that they focused significantly on upgrading
technology to achieve product and engineering innovation from time to time.
They added that they would import machinery and technology to be continuously
ahead of the curve compared to their competitors, and in order to be sustainable.
• Good in-house training: Managing heads of almost all firms agreed that they
believed a lot on cost-effectiveness; hence sending employees for outside training
was not much encouraged by the Management. However, the key people and
owners themselves take keen interest to mentor and train their employees. Their
focus on staff skill development through in-house training and mentoring has
helped their firm achieve desired goals to a great extent.
• Solving employee-related issues on time, so that they do not become big and
unmanageable issues: The owners are highly involved at the work-place. They are
of the belief that timely solution to these issues and problems was instrumental in
solving problems at a preliminary stage, rather than letting it become
unmanageable with passage of time.
• Strong leadership and Management’s commitment and vision: Few of the
entrepreneurs strongly felt that it was the strong management leadership which
has helped their firm to achieve their goals.
• Goodwill created by first generation owner of the firm and maintained by the
present generation, which has helped to retain customers over 20 years old.
• Timely deliveries: The managers believed that their commitment to deliver on
time has helped them to retain good customers and trusted suppliers over a long
period of time.
9.3. Summary of the Chapter
The interactions and discussion with the Managing heads helped to get real insights about
problems and challenges, which could not be gathered by the Quantitative analysis. The
interactions with the SME owners, who were willing to share their experience of the

Problems and Challenges Identified through Interviews & Interactions
©Ranjita Banerjee 380
SME sector, helped to get a bird’s eye-view of the sector. The interactive discussion also
helped to create a good rapport with the SME owners/ managing heads. Various aspects
about the sector emerged from the detailed discussions with the Managing heads of the
SMEs, which otherwise would not have been possible through only a stand-alone
quantitative data analysis.

CHAPTER – 10
©Ranjita Banerjee 381
CHAPTER – 10
Findings & Discussions
10.1. Prelude
The chapter mainly discusses the major findings of the quantitative and qualitative
analysis. In order to get a more comprehensible view of the analysis, the hypotheses
testing and its results are presented in a tabular form. It is followed by a discussion of the
major findings derived from the analysis.
10.2. Tabular Presentation of Major Findings and Discussion
The major findings of the study are presented herewith in a tabular manner (Refer Table
10.1), to get a bird’s eye-view of the hypotheses testing and the results.
TABLE 10.1 – Summary Sheet of Major Findings
Hyp Hypotheses
Test P Value
Null Hyp. Findings/ Discussion
H01
There is no significant association between Type of firm and Documentation of HR practice.
Chi-Square Test
(Cross-Tabulation)
0 Reject
Significant Association
H02
Size of firm has no significant association with Documentation of HR practice
Chi-Square Test
(Cross-Tabulation)
0 Reject
Significant Association
(Continued…)

Findings & Discussions
©Ranjita Banerjee 382
Hyp Hypotheses
Test P Value
Null Hyp. Findings/ Discussion
H03
Documentation of HR practice is not associated with the SME firm bearing a Quality/ ISO Certification
Chi-Square Test
(Cross-Tabulation)
0 Reject
Significant Association
H04
Documentation of HR practice is not associated with the presence of an internal HR Expert
Chi-Square Test
(Cross-Tabulation)
0.001 Reject
Significant Association
H05
Presence of an internal HR Expert is not associated with the size of firm
Chi-Square Test
(Cross-Tabulation)
0 Reject
Significant Association
H06
There is no significant influence of Gender on HR Practices
Mann-Whitney
Less Than 0.05
Reject
Significant influence of ‘females’ on Career growth & Compensation
H07
There is no significant influence of Quality/ ISO Certification on HR Practices
Mann-Whitney
Less Than 0.05
Reject
Significant influence of Quality/ISO Certif. on Recruitment, Selection, T&D, Perf. App., Employee Involvement, Open-Communication.
H08
There is no significant influence of Quality/ ISO Certification on Organizational Outcomes
Mann-Whitney
Less Than 0.05
Reject
Significant influence of Quality/ ISO Cert. on Customer & Supplier Satisfaction, Product/ Service dev. , Quality, Optimum utilization of resources, Defects or deficiencies in Product/ Service, Net Profit Margin, Return on Investment.
H09
There is no significant influence of Presence of an Internal HR Person on HR Practices
Mann-Whitney
Less Than 0.05
Reject
Significant influence of presence of an internal HR person on Selection, T&D, Feedback mechanism, career-growth, Compensation, non-financial incentives and Authority & responsibility
(Continued…)

Findings & Discussions
©Ranjita Banerjee 383
Hyp Hypotheses
Test P Value
Null Hyp. Findings/ Discussion
H10
There is no significant influence of Presence of an Internal HR Person and Employee Outcomes
Mann-Whitney
Less Than 0.05
Reject
Significant influence of presence of an internal HR person on employee involvement and adherence to code of conduct and rules.
H11
There is no significant influence of Presence of an Internal HR Person and Organizational Outcomes
Mann-Whitney
Less Than 0.05
Reject
Significant influence of presence of an internal HR person on Product/ service dev., quality, utilization of resources, reduction in average Number of defects of products / deficiencies in service, increase in the Net Profit Margin and Return on Investment (in %)
H12
There is no significant effect of Size of Firm on HR Practices
Mann-Whitney
Less Than 0.05
Reject
Significant effect of size of firm on T&D & job-rotation. Medium sized firms have shown to have a significant effect on the two HR practices.
H13
The size of the firm does not significantly influence the Employee Outcomes Mann-
Whitney
Less Than 0.05
Reject
Significant influence of size of firms on Employee Competence, Employee’s co-operation with Management, Employee’s commitment to complete assigned tasks, Punctuality, Sense of involvement as well as adherence to general code of conduct. In the present survey, medium sized firms have shown to have a significant effect on the mentioned Employee Outcomes.
H14
Size of firm does not significantly influence Organizational Outcomes
Mann-Whitney
Less Than 0.05
Reject
Size of firm has a significant effect on the Org. Outcome related to Customer Satisfaction. In the present survey, medium sized firms have shown to have a significant effect on the Customer Satisfaction.
(Continued…)

Findings & Discussions
©Ranjita Banerjee 384
Hyp Hypotheses
Test P Value
Null Hyp. Findings/ Discussion
H015
There is no significant effect of Number of Women Employees on HR Practices in the SMEs
Mann-Whitney
Less Than 0.05
Reject
No. of women employees has a significant effect on the HR Practices related to Recruitment & Selection, regular implementation of Performance Appraisal System, Career growth & Management, competency-based Compensation Management System, Reward Management with respect to giving financial incentives and Open communication. Firms with more than 10 women employees have a significant effect on the mentioned HR Practices
H016
There is no significant influence of age of the respondents on HR Practices
Kruskal Wallis Test
Less Than 0.05
Reject
Age of the respondents have a significant influence on the HR Practices related to Performance Management, Opportunities for career growth, Compensation and Reward Management with respect to giving financial incentives. Owners/Managing heads in the middle age-group 26-35 years believe the same.
H017
There is no significant influence of age of the respondents on Employee Outcomes.
Kruskal Wallis Test
Less Than 0.05
Reject
Age of the respondents has a significant influence on the Employee Outcome related to competence of the employees to do their assigned work. The owners/Managing heads in the age-group 36-45 years believes the same.
H018
There is no significant influence of age of the respondents on Organizational Outcomes.
Kruskal Wallis Test
Less Than 0.05
Reject
Age of the respondents has a significant influence on the Organizational Outcomes related to Customer satisfaction, Net Profit Margin and Return on Investment.
H019
There is no significant influence of number of years of service in the firm on HR Practices
Kruskal Wallis Test
Less Than 0.05
Reject
Significant influence of number of years of service in the firm on HR Practices related to Recruitment & Selection, implementation of regular Performance Appraisal System and a fair Compensation Management System in the SMEs.
(Continued…)

Findings & Discussions
©Ranjita Banerjee 385
Hyp Hypotheses
Test P Value
Null Hyp. Findings/ Discussion
H020
There is no significant influence of total years of work-experience of respondents on HR Practices
Kruskal Wallis Test
Less Than 0.05
Reject
There is a significant influence of total years of work experience on HR Practices related to Recruitment & Selection, fair Compensation Management System and Employee Participation in the SMEs
H021
There is no significant influence of Educational Background of respondents on HR Practices.
Kruskal Wallis Test
Less Than 0.05
Reject
There is a significant influence of educational qualification on HR Practice related to organizing Training and Skill development programs in the SMEs.
H022
There is no significant influence of Educational Background of respondents on Organizational Outcomes.
Kruskal Wallis Test
More Than 0.05
FAIL To Reject
There is no significant influence of educational qualification on Organizational Outcomes in the SMEs.
H023
There is no significant influence of Specialization in education of respondents on HR Practices.
Kruskal Wallis Test
Less Than 0.05
Reject
There is a significant influence of Specialization of educational qualification on HR Practice related to Recruitment & Selection, Training & Skill development, Performance Appraisal, Career growth, Compensation Management, job-rotation, Employee participation as well as motivational aspects related to financial incentives and authority & responsibility.
H024
There is no significant influence of Specialization in education of respondents on Employee Outcomes.
Kruskal Wallis Test
More Than 0.05
FAIL To Reject
There no significant influence of Specialization in education of respondents on Employee Outcomes in the SMEs.
(Continued…)

Findings & Discussions
©Ranjita Banerjee 386
Hyp Hypotheses
Test P Value
Null Hyp. Findings/ Discussion
H025
There is no significant influence of Specialization in education of respondents on Organizational Outcomes.
Kruskal Wallis Test
Less Than 0.05
Reject
There is a significant influence of Specialization of educational qualification on Organizational Outcomes related to Customer satisfaction, Product/ service development, Products/service Quality improvement; proper utilization of resources; reduction in the average Number of defects of products / deficiencies in services and Net Profit Margin, over the last two years.
H026
There is no significant effect of Type of Firm on HR Practices
Kruskal Wallis Test
Less Than 0.05
Reject
There is a significant influence of type of firm on HR Practices related to Performance Appraisal and Compensation decision based on competence and ability, employee participation and Open Commucication.
H027
There is no significant effect of Type of Firm on Employee Outcomes.
Kruskal Wallis Test
Less Than 0.05
Reject
There is a significant influence of type of firm on Employee Outcomes related to Employee’s co-operation among themselves, Employee Commitment, Regularity of employees, Employee involvement as well as Conformance to rules and regulations, for Public Ltd. Companies. Whereas, for Public Ltd. as well as joint-stock it is related to Employee’s co-operation with Management/Head as well as Punctuality of employees.
H028
There is no significant effect of Type of Firm on Organizational Outcomes
Kruskal Wallis Test
Less Than 0.05
Reject
There is a significant influence of Type of firm on all the Organizational Outcomes. The Public Ltd. as well as Joint-stock SME firms have a significant influence on the Organizational Outcomes.
(Continued…)

Findings & Discussions
©Ranjita Banerjee 387
Hyp Hypotheses
Test P Value
Null Hyp. Findings/ Discussion
H029
There is no significant effect of Age of Firm on HR Practices
Kruskal Wallis Test
Less Than 0.05
Reject
There is a significant influence of age of the firm on HR Practices; for the firms which are 16-20 years old, for the HR Practice related to Human Resource Planning; whereas firms which are more than 20 years old for the HR practice related to Selection Method .
H030
There is no significant effect of Age of Firm on Employee Outcomes
Kruskal Wallis Test
Less Than 0.05
Reject
There is a significant influence of type of firm on Employee Outcome related to Punctuality of employees.
H031
There is no significant effect of Age of Firm on Organizational Outcomes.
Kruskal Wallis Test
Less Than 0.05
Reject
There is a significant influence of Age of firm on the Organizational Outcomes related to Product/ Service Development, Product/ service Quality improvement, Proper utilization of resources and decrease in the average Number of defects of products / deficiencies in service.
H032
There is no significant effect of Nature of the Industry on HR Practices.
Kruskal Wallis Test
Less Than 0.05
Reject
There is a significant influence of Nature of the industry on HR Practices; with maximum influence of firms from the Pharmaceutical and Electrical industry.
H033
There is no significant effect of Nature of the Industry on Employee Outcomes
Kruskal Wallis Test
Less Than 0.05
Reject
There is a significant influence of Nature of Industry on Employee Outcome related to Employee’s general behavior, Punctuality and Regularity of employees, Sense of Involvement and Conformance to rules and regulations.
H034
There is no significant effect of Nature of the Industry on Organizational Outcomes
Kruskal Wallis Test
Less Than 0.05
Reject
There is a significant influence of Nature of the industry on the Organizational Outcomes related to Customer Satisfaction, Supplier/ Vendor Satisfaction, Product/ Service Development and Proper utilization of resources.
(Continued…)

Findings & Discussions
©Ranjita Banerjee 388
Hyp Hypotheses
Test P Value
Null Hyp. Findings/ Discussion
H035
There is no significant influence of Total Employee Strength on HR Practices
Kruskal Wallis Test
Less Than 0.05
Reject
There is a significant influence of Number of employees (or employee strength) on HR Practices; with maximum influence of firms with more than 50 employees.
H036
There is no significant influence of Total Employee Strength onEmployee Outcomes
Kruskal Wallis Test
Less Than 0.05
Reject
There is a significant influence of Number of employees (or employee strength) on Employee Outcomes; with maximum influence of firms with more than 50 employees for the outcomes related to employee competence and sense of involvement.
H037
There is no significant influence of Total Employee Strength on Organizational Outcomes Kruskal
Wallis Test
Less Than 0.05
Reject
There is a significant influence of total number of employees on the Organizational Outcomes related to Supplier/ Vendor Satisfaction, Product/ Service Development, Product/ Service quality improvement, Proper utilization of resources, decrease in defects of products / deficiencies in service and Return on Investment (ROI); with highest influence of firms whose total employee strength is between 51 to 100 employees.
H038
There is no significant influence of Total number of Contractual Employees on HR Practices
Kruskal Wallis Test
Less Than 0.05
Reject
There is a significant influence of Number of contractual employees on HR Practices; with maximum influence of firms with more than 50 contractual employees.
(Continued…)
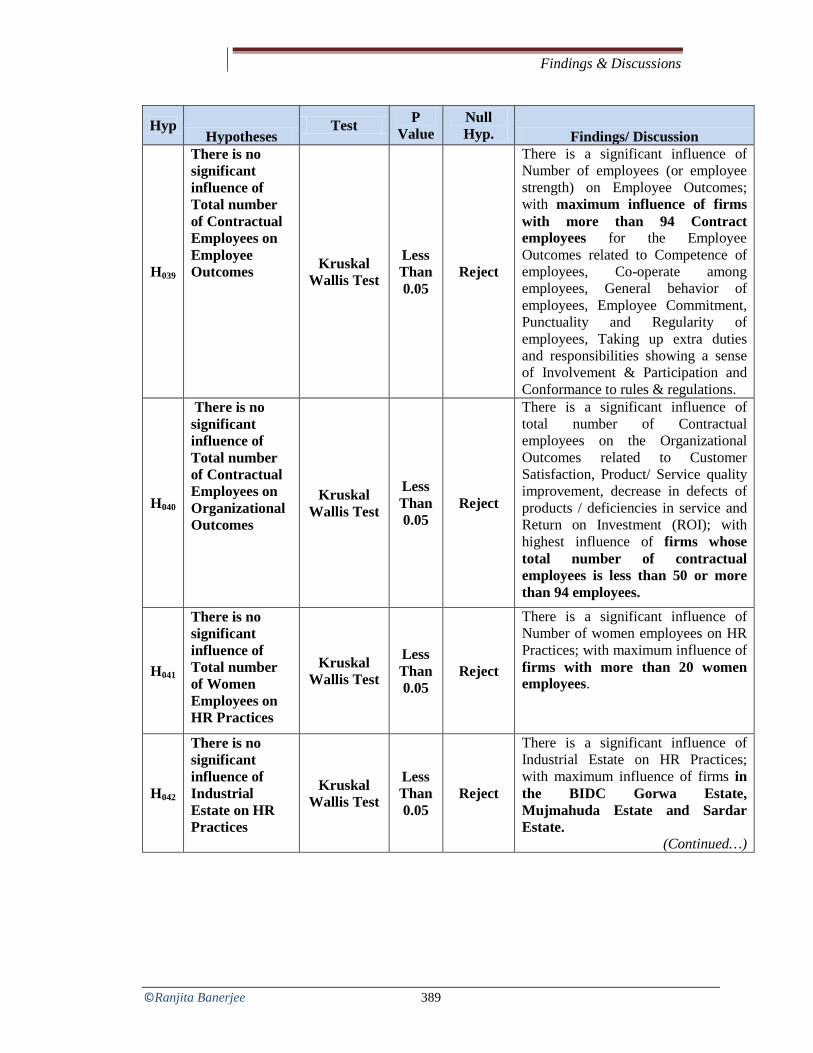
Findings & Discussions
©Ranjita Banerjee 389
Hyp Hypotheses
Test P Value
Null Hyp. Findings/ Discussion
H039
There is no significant influence of Total number of Contractual Employees on Employee Outcomes Kruskal
Wallis Test
Less Than 0.05
Reject
There is a significant influence of Number of employees (or employee strength) on Employee Outcomes; with maximum influence of firms with more than 94 Contract employees for the Employee Outcomes related to Competence of employees, Co-operate among employees, General behavior of employees, Employee Commitment, Punctuality and Regularity of employees, Taking up extra duties and responsibilities showing a sense of Involvement & Participation and Conformance to rules & regulations.
H040
There is no significant influence of Total number of Contractual Employees on Organizational Outcomes
Kruskal Wallis Test
Less Than 0.05
Reject
There is a significant influence of total number of Contractual employees on the Organizational Outcomes related to Customer Satisfaction, Product/ Service quality improvement, decrease in defects of products / deficiencies in service and Return on Investment (ROI); with highest influence of firms whose total number of contractual employees is less than 50 or more than 94 employees.
H041
There is no significant influence of Total number of Women Employees on HR Practices
Kruskal Wallis Test
Less Than 0.05
Reject
There is a significant influence of Number of women employees on HR Practices; with maximum influence of firms with more than 20 women employees.
H042
There is no significant influence of Industrial Estate on HR Practices
Kruskal Wallis Test
Less Than 0.05
Reject
There is a significant influence of Industrial Estate on HR Practices; with maximum influence of firms in the BIDC Gorwa Estate, Mujmahuda Estate and Sardar Estate.
(Continued…)

Findings & Discussions
©Ranjita Banerjee 390
Hyp Hypotheses
Test P Value
Null Hyp. Findings/ Discussion
H043
There is no significant influence of Industrial Estate on Employee Outcomes Kruskal
Wallis Test
Less Than 0.05
Reject
There is a significant influence of the Industrial Estate on Employee Outcomes; with maximum influence of SME firms belonging to Gorwa BIDC and Mujmahuda Indistrial Estate for the Employee Outcomes related to Co-operation among employees, General behavior of employees, Employee Commitment, Punctuality and Regularity of employees, Taking up extra duties and responsibilities showing a sense of Involvement & Participation and Conformance to rules & regulations.
H044
There is no significant influence of Industrial Estate on Organizational Outcomes Kruskal
Wallis Test
Less Than 0.05
Reject
There is a significant influence of Industrial Estate on the Organizational Outcomes related to Customer Satisfaction, Supplier Satisfaction, Product/ Service development, Product/ Service quality improvement, Proper utilization of resources, decrease in defects of products / deficiencies in service, increase in Net Profit Margin and Return on Investment (ROI); with highest influence of firms belonging to the Mujmahuda Estate, Sardar Estate and Gorwa GIDC.
H01
There is no joint influence of HR Practice and Employee Outcome on Organizational Performance.
Regression 0 Reject
HR Practice and Employee Outcome jointly influences Organizational Performance.
H01
HR Practices does not positively and directly affect Organizational Performance
Structural Equation Modeling
Less Than 0.05
Reject
HR Practices has a positive significant relationship with Organizational Performance.
(Continued…)

Findings & Discussions
©Ranjita Banerjee 391
Hyp Hypotheses
Test P Value
Null Hyp. Findings/ Discussion
H02
Employee Outcome does not positively and directly affect Organizational Performance.
Structural Equation Modeling
Less Than 0.05
Reject
Employee Outcome has a positive significant relationship with Organizational Performance
H03
There exists covariance between HR Practices and Employee Outcome
Structural Equation Modeling
Less Than 0.05
Reject
There exists a covariance between HR Practices and Employee Outcome.
(Source: Compiled by Author, based on Primary Data)

Findings & Discussions
©Ranjita Banerjee 392
10.3. Major Findings and Discussions of the Study
The major findings of the study are summarized herewith in the section below. This
includes the findings from the quantitative analysis, which is followed by the major
findings from the qualitative analysis as well as from a comprehensive study of the SME
sector through the secondary data inputs.
10.3.1 The major findings from Quantitative data analysis are:
1. 51% of the respondents said that their firms had a designated internal HR expert to
take care of the HR related functions; while 49% of the firms had no internal HR
expert designated to undertake the HR functions in the firm
2. 47% of the respondents agreed that their firm had no rules, regulations or HR
policies in written form in the form of Employee Handbook, Rule-book or HR
Manual.
3. About 36% of the respondents do not take consultancy from an HR Consultant.
The greener side is that about 64% of the respondents take guidance from HR
Consultants.
4. 95% of the respondents take consultancy from Financial Consultants, which
accentuates the fact that experts from outside are consulted to enhance the functioning
with respect to matters related to financial procedures.
5. About 62% of the respondents have a Quality or ISO Certification in their firms.
SMEs are quite conscious about quality conformance, in order to be competitive.
6. 94% of the respondent firms are not associated with any Trade Union which shows
sound Industrial Relations (IR) across the various industrial estates in the Vadodara
district without any need of Trade Union intervention between employees and the
management.
7. About 54% of the respondents do not feel that they have achieved the expected
levels of growth (Refer Table 8.22 and Figure 8.20). This shows that the Managing
Heads keep a high expectation of their levels of growth.
8. 94% of the respondents were from firms with less than 50 contractual employees.
9. 90% of the respondents were from firms with less than 10 women employees,
whereas only about 10% of the respondents were from firms with more than 10

Findings & Discussions
©Ranjita Banerjee 393
women employees. Thus it can be deduced that there is a lot of scope of improvement
for bringing in gender diversity in SMEs by encouraging more women employees to
join SMEs.
10. Employees are not much rotated from one job to another (Mean= 3.40, Std. Dev=
0.916).
11. Product Development has highest mean of 4.24 with standard deviation of 0.688,
which is a good sign and shows the fact that SMEs undergo a lot of product
development, based on customer needs.
12. ‘Interviews’ has been found to be the most important selection method, with about
41% respondents, followed by ‘on-the-job-testing’.
13. ‘On-the-job testing’ was coined by the researcher as one of the prevalent methods
of selection, especially for the selection of skilled, semi-skilled and unskilled
workers, in the various industrial estates in Vadodara district, during pilot-study.
This adds a new selection method to the body of knowledge prevalent in the SMEs
14. Majority of the firms have a pay based on performance of the employees (about
30% of the respondents), followed by pay based on skills (about 26% of the
respondents).
15. ESIC with about 28% scores the highest among the other welfare/ social security
measures, followed by annual Bonus with about 26% of the respondents agreeing for
it.
16. About 50% of the respondents agree that performance is assessed in their firm by
the HODs/ owners, based on past performance of employees, though there is no
prescribed format for the same.
17. It is encouraging to see that a negligible portion of about 4% of firms have some
modern methods of Performance Assessment like Psychometric Tests, Assessment
Centres, Management-by-Objectives, on-line continuous assessments as well as other
well devised assessment tools designed by outside HR Consultants/ Consultancy
firms.
18. It is a good to see that performance assessment is used positively to develop
employees, as about 27% of the respondents opine that their firm uses performance

Findings & Discussions
©Ranjita Banerjee 394
assessment for developing the employees (only about 6% of respondents agree to use
it for removing employees).
19. SMEs seems to rely more on On-the-Job Training (about 44%), followed by
mentoring by seniors (31%). It also corroborates the fact that SMEs try to be more
cost-effective in all their aspects. A negligible amount of about 2.5% of the firms has
no training programs devised for employees in any form.
20. The ‘Use of Performance Assessment’ most commonly found through evaluating
past performance is for ‘Developing Employees’ followed by ‘For Promotion
decisions’. (Cross-tabulation)
21. Cross-tabulation shows that the ‘Selection Methods’ most common in the recruitment
method of ‘Employee Referrals’ is found to be through ‘Application Blank/
Detailed CV’ and ‘Interviews’, followed by ‘On-the-Job Testing’.
22. Of the 49 respondents who have confirmed that they have an Employee Handbook,
about 37% (18 respondents) are from firms which are more than 21 years old.
Further, of the 43 respondents who have confirmed that they have an HR Manual,
about 61% (26 respondents) are from firms which are more than 21 years old. Thus,
age of the firm has some association with the documentation of HR policies.
23. In chi-square testing, as the p-value is less than 0.05, so null hypothesis is rejected
and it can be concluded that there is significant association between type of firm and
documentation of HR practice. 49 respondents (about 23% of respondents) have
confirmed that their firm has an Employee Hand-book of whom 20 respondents
(about 41% respondents) belong to Private Ltd. Companies. Further, it is also to be
noted that 43 respondents (about 20% of respondents) have confirmed that their firm
has an HR Manual of whom 26 respondents (about 60.5% of respondents) are from
Private Limited companies.
24. In chi-square testing, as the p-value is less than 0.05, so we reject null hypothesis and
conclude that there is significant association between Size of firm and
Documentation of HR practice. About 101 respondents have confirmed that they
have no documentation of HR Practice of which 84 respondents (about 83%
respondents) belong to Small firms. Further, 43 of the respondents have confirmed

Findings & Discussions
©Ranjita Banerjee 395
that their firm has an HR Manual of whom 24 respondents (56%) are from Medium
Enterprises.
25. In chi-square testing, as the p-value is less than 0.05, so we reject null hypothesis and
conclude that Documentation of HR practice is associated with the SME firm
bearing a Quality/ ISO Certification. 49 Managing Heads who have confirmed that
they have an Employee Handbook, 53% (26 respondents) have a Quality/ ISO
Certification. Further, of the 43 respondents who have said that their firm possesses
an HR Manual, about 95% (41 respondents) have a Quality/ ISO Certification in their
firm.
26. In chi-square testing, as the p-value is less than 0.05, so we reject null hypothesis and
conclude that Documentation of HR practice is associated with the presence of an
internal HR Expert. Of the 109 respondents who have an internal HR person in their
firm, 71 respondents (65%) have HR Policies in their firm in the form of Employee
Handbook, Rule-book or HR Manual.
27. In Mann-Whitney test, females consider that there is ‘Enough opportunity for career
growth’ as well as that ‘Compensation is given on the basis of competence and
ability’ in SME firms. Thus, there is a significant influence of ‘gender’ on ‘Enough
opportunity for career growth’ and ‘Compensation is given on the basis of
competence and ability’.
28. Mann-Whitney Test proves that there is a significant influence of Quality/ ISO
Certification on the following HR Practices: Recruitment, Selection, Training &
Skill Development, Performance Appraisal, Employee Involvement and Open-
Communication.
29. Mann-Whitney Test shows that there is a significant influence of Quality/ ISO
Certification on the following Organizational Outcomes: Customer Satisfaction,
Supplier Satisfaction, Product/ Service development, Quality, Optimum utilization of
resources, Defects or deficiencies in Product or Service, Net Profit Margin, Return on
Investment.
30. There is a significant influence of presence of an internal HR person on the
following HR Practices: Selection, Training & Skill Development, Feedback

Findings & Discussions
©Ranjita Banerjee 396
mechanism, career-growth, Compensation, non-financial incentives and Authority &
responsibility (Delegation of power). (Mann-Whitney test)
31. There is a significant influence of presence of an internal HR person on the
Employee Outcomes related to taking extra duties and responsibilities (employee
involvement) and adherence to code of conduct and rules. (Mann-Whitney test)
32. There is a significant influence of presence of an internal HR person on the
Organizational Outcomes related to Product/ service development, quality of
product/ service, utilization of resources, reduction in average Number of defects of
products / deficiencies in service, increase in the Net Profit Margin and Return on
Investment (in %). (Mann-Whitney test)
33. Size of firm has a significant effect on the HR practices related to Training & Skill-
development as well as job-rotation. In the present survey, medium sized firms have
shown to have a significant effect on the HR practices related to T&D and job-
rotation. (Mann-Whitney test)
34. Size of firm has a significant influence on the Employee Outcomes related to
Employee Competence, Employee’s co-operation with Management, Employee’s
commitment to complete assigned tasks, Punctuality, Sense of involvement as well as
adherence to general code of conduct. In the present survey, medium sized firms
have shown to have a significant effect on the mentioned Employee Outcomes.
(Mann-Whitney test)
35. Size of firm has a significant effect on the Organizational Outcome related to
Customer Satisfaction. In the present survey, medium sized firms have shown to have
a significant effect on the Customer Satisfaction. (Mann-Whitney test)
36. Number of women employees has a significant effect on the HR Practices related to
Recruitment & Selection, regular implementation of Performance Appraisal System,
Career growth & Management, competency-based Compensation Management
System, Reward Management with respect to giving financial incentives and Open
communication. In the present survey, the firms with more than 10 women employees
have shown to have a significant effect on the specific mentioned HR Practices.
(Mann-Whitney test)

Findings & Discussions
©Ranjita Banerjee 397
37. The owners/Managing heads in the middle age-group 26-35 years believes that
there is enough opportunity for career growth for good performers in the SMEs,
as well as that compensation is decided on the basis of competence or ability. They
also believe that good performers are rewarded well by giving financial incentives in
SME firms. (Kruskal-Wallis test)
38. The owners/Managing heads in the age-group 18-25 years believes that the SME
firms appraises the performance of employees at regular intervals. Whereas, the
owners/Managing heads in the middle age-group 26-35 years believes that there is
enough opportunity for career growth for good performers in the SMEs, as well
as that compensation is decided on the basis of competence or ability. They also
believe that good performers are rewarded well by giving financial incentives in SME
firms. (Kruskal-Wallis test)
39. The owners/Managing heads in the age-group 36-45 years believes that the
competence of the employees to do their assigned work is satisfactory in the SME
firms. Thus, age of the respondents has a significant influence on the Employee
Outcome related to competence of the employees to do their assigned work in the
SME firms. (Kruskal-Wallis test)
40. The owners/Managing heads in the age-group 18-25 years believes that the customer
satisfaction has increased as well as the Net Profit Margin and Return on Investment
(ROI) in the last two years has increased in the SMEs. (K-Wallis test)
41. The owners/Managing heads who had been working in the organization for more
than 20 years in the same firms believes that the SMEs places the right person in the
right job; Selection is on the basis of merit; their firms appraises the performance of
employees at regular intervals and that compensation is decided on the basis of
competence or ability in their firms. Thus, that there is a significant influence of
number of years of service in the firm on HR Practices related to Recruitment &
Selection, implementation of regular Performance Appraisal System and a fair
Compensation Management System in the SMEs. (Kruskal-Wallis test)
42. The owners/Managing heads whose total work experience was more than 20 years
believes that the SMEs places the right person in the right job; Selection is on the
basis of merit; compensation is decided on the basis of competence or ability and that

Findings & Discussions
©Ranjita Banerjee 398
good performers are given more authority and responsibility in their SME firm. The
owner/ Managers whose work experience was 16-20 years believed that employees
participated in the decision-making process. (Kruskal-Wallis test)
43. The owners/Managing heads who possess a Masters degree as their educational
qualification believe that the SMEs Organizes training and skill development
programs for employees (need-based). Thus, there is a significant influence of
educational qualification on HR Practice related to organizing Training and Skill
development programs in the SMEs.
44. The owners/Managing heads who possess HR Specialization as their educational
background believes that the SMEs have sound HR Practices related to Recruitment
& Selection methods, Organizes training and skill development programs for
employees (need-based), performance appraisal is done at regular intervals, there is
enough opportunity for career growth in SMEs as well as that compensation is
decided on the basis of competence/ ability. Whereas, the owners/Managing heads
who possess Marketing Specialization as their educational background believes that
the SMEs have sound Motivational systems related to giving financial incentives as
well as authority and responsibility as well as Employee Participation in the decision-
making process. Thus, there is a significant influence of Specialization of educational
qualification on the mentioned HR Practices. (KW Test)
45. There no significant influence of Specialization in education of respondents on
Employee Outcomes in the SMEs.
46. The owners/Managing heads who possess Operations Specialization as their
educational background believes that the SMEs Customer satisfaction has increased;
Measures have been taken by the firm for product/ service development;
Products/service Quality shows improvement; the SMEs have displayed proper
utilization of resources; the average Number of defects of products / deficiencies in
services have decreased and that there is an increase in the Net Profit Margin, over
the last two years.
47. There is a significant influence of type of firm on HR Practices related to Selection
Method, Training & Skill development Program, Feedback mechanism, Opportunities
for career growth, Delegation of power as well as opportunities for giving suggestions
Findings & Discussions
©Ranjita Banerjee 399
for improvement, Performance Appraisal & Open-communication for the Public Ltd.
and Joint-stock companies. (KW Test)
48. There is a significant influence of type of firm on Employee Outcomes related to
Employee’s co-operation among themselves, Employee Commitment, Regularity of
employees, Employee involvement as well as Conformance to rules and regulations,
with maximum influence of respondents who are in Public Ltd. or Joint-stock
companies.
49. There is a significant influence of age of the firm on HR Practices. For firms which
are 2-5 years old shows maximum influence for the HR Practices related to Feedback
mechanism, Opportunities for career growth, Delegation of power wr.t authority and
responsibility, opportunities for giving suggestions for improvement as well as for an
Open-Communication system. Whereas, SME firms which are 16-20 years old is high
for the HR Practice related to Human Resource Planning i.e placing the right person
in the right job. Whereas the mean-rank is high for the firms which are more than 20
years old for the HR practice related to Selection Method i.e Selection on the basis of
merit. (KW Test)
50. Firms which are 2-5 years old shows maximum influence for the Organizational
Outcomes related to Product/ Service Quality improvement, Proper utilization of
resources and decrease in the average Number of defects of products / deficiencies in
service. Thus, the owners/Managing heads in the SME firms which are 2-5 years old
believes that the above mentioned outcomes have improved in their firms. Whereas,
SME firms which are 16-20 years old is high for the Organizational Outcome
related to Product/ service development.
51. There is a significant influence of Nature of the industry on HR Practices; with
maximum influence of firms from the Pharmaceutical and Electrical industry.
52. There is a significant influence of Nature of Industry on Employee Outcome
related to Employee’s general behavior, Punctuality and Regularity of employees,
Sense of Involvement and Conformance to rules and regulations. In the present study,
Pharmaceutical industry shows maximum influence.
53. The owners/Managing heads in the SME firms belonging to the Pharmaceutical
industry believes that the Organizational Outcomes related to Customer Satisfaction,

Findings & Discussions
©Ranjita Banerjee 400
Supplier/ Vendor Satisfaction, Product/ Service Development and Proper utilization
of resources. have improved in their firms. (KW Test)
54. There is a significant influence of Number of employees (or employee strength) on
HR Practices; with maximum influence of firms with more than 50 employees.
55. There is a significant influence of Number of employees (or employee strength) on
Employee Outcomes; with maximum influence of firms with more than 50
employees for the outcomes related to employee competence and sense of
involvement.
56. There is a significant influence of total number of employees on the
Organizational Outcomes, with highest influence of firms whose total employee
strength is between 51 to 100 employees.
57. There is a significant influence of Industrial Estate on HR Practices; with
maximum influence of firms in the BIDC Gorwa Estate, Mujmahuda Estate and
Sardar Estate.
58. That there is a significant influence of the Industrial Estate on Employee
Outcomes; with maximum influence of SME firms belonging to Gorwa BIDC and
Mujmahuda Industrial Estate for the Employee Outcomes related to Co-operation
among employees, General behavior of employees, Employee Commitment,
Punctuality and Regularity of employees, Taking up extra duties and responsibilities
showing a sense of Involvement & Participation and Conformance to rules &
regulations.
59. Factor Analysis came up with three Components (Factors) which were identified
and named as: Component 1: Employee related Outcomes; Component 2: HR
Practices and Component 3: Organizational related Outcomes.
60. In Regression Analysis, as the p-value of Summated HR Practice and Summated
Employee Outcome is 0.005 and 0.000 respectively which is less than 0.05 so we
reject the null hypothesis and conclude that there is a joint influence of HR Practice
and Employee Outcome on Organizational Performance. However, it is to be also
noted here that the Adjusted R Square value is quite low but as the regression
analysis is carried out on ordinal scale it is bound to happen this way. Thus, SEM.

Findings & Discussions
©Ranjita Banerjee 401
61. In Structural Equation Modeling (SEM), as the p-value is less than 0.05, so it has
been deduced that HR Practices has a positive significant relationship with
Organizational Performance. Employee Outcome has a positive significant
relationship with Organizational Performance; and that there exists a covariance
between HR Practices and Employee Outcome. Further, the base Model in SEM has
been improved through three Modifications to get improved results.
10.3.2 The major findings from interactions and discussions with the Managing heads
Chapter 9 talks about the various findings from the interactions and discussions with the
Managing Heads. The major problems and challenges identified by the Managing heads
are as follows:
1. Decreasing or no change in the Return on Investment (ROI) as well as the Net
Profit Margin of the SMEs over the current year as well as the previous year: The
major reason for has been because of high level of competition from domestic &
international market, especially from China. Easy availability of low cost China-
made substitute products for suppliers.
2. The major employee related problems faced by the sector is High Employee
Turnover and low retention rate as well as high absenteeism rate. Lack of
domain-specific knowledge of employees was also identified as a major challenge.
3. Few of the major challenges faced by the sector is rapid technological changes
vis-à-vis lack of funds for technological upgradation, as well as Governmental
regulations, policies and tax-structure. SME Managing Heads feel quite over-
burdened by the plethora of governmental regulations to be fulfilled from time to
time. Stringent and plethora of labour laws formalities.
4. High level of commitment towards work by employees and Management, team-work
and availability of good quality products in comparatively low costs have helped few
SME firms to have accomplished their goals, inspite of various problems and
challenges faced.

Findings & Discussions
©Ranjita Banerjee 402
10.3.3 The major findings from Secondary data inputs
1. There are 261760 MSMEs Registered in Gujarat till March 2014. The MSME
registrations are increasing manifold.
2. The Gujarat Industrial Policy 2015 aims at promoting Gujarat as a globally
competitive and innovative industrial destination that stimulates sustainable
development and inclusive growth.
3. Plethora of assistance/ subsidies are being given by the State and Central
government for the assistance and upliftment of SMEs, however, due to lack of
information or other reasons, most of the SME owners/ Managing Heads are not
aware of it (eg. Interest subsidy, venture capital assistance, investment subsidy,
quality certification subsidy, assistance for start-ups, technological assistance etc).
4. A lot of promotional schemes are also available for the SMEs. (Eg. Cluster
development scheme, promotion of co-operative sector etc)
5. In SMEs the owners as well as Managing Heads, including HR Managers and
Supervisors, are skilled enough to take care of all Functional Departments. The
senior management becomes multi-skilled over time due to the nature of the
work and knows the functioning of all departments (supported by Literature
review as well as researchers’ interactions with the owners/ Managing Heads).
6. Ministry of Micro, Small & Medium Enterprises (M/o MSME) envisions a
vibrant MSME sector by promoting growth and development of the MSME
Sector, including Khadi, Village and Coir Industries (which is India’s legacy
hallmark), in cooperation with various Departments/ Ministries, State as well as
Central Government, Industry Associations and other Stakeholders.
7. In order to ensure that young entrepreneurs are encouraged and suitably equipped
to go into new ventures, the Ministry has set up a National level
Entrepreneurship Development Institutes namely, National Institute for
Micro, Small and Medium Enterprises (NI-MSME) to undertake the task of
entrepreneurship and skill development training on a regular basis.
8. With the aim to simplify forms to enable ease of registration of MSMEs, based on
Hon. Prime Minister Shri Narendra Modi’s suggestion, the M/o MSME has

Findings & Discussions
©Ranjita Banerjee 403
notified a simple one-page Registration Form Udyog Aadhar Memorandum
(UAM), to enable easy and smooth registration of MSMEs.
9. Numerous Schemes and Initiatives by the present Government to initiate ease-of-
doing-business like tool-rooms, cluster development programs etc.
10. Development of new on-line softwares for the o/o MSME.
11. After almost nine years of the MSMED Act, 2006, the Micro, Small and
Medium Enterprises Development (Amendment) Bill, 2015 has been
introduced in the LokSabha on 20.04.2015. The Amendment Bill is intended to
move in line with the enormous changes faced in the economy, nationally as well
as internationally.
10.4. Summary of the Chapter
The Chapter focused on an understanding of the findings and discussions of the research.
For making it more understandable, a tabular lay-out of the various hypotheses and its
results were laid out. This was followed by a detailed findings and discussion of the
quantitative analysis, qualitative analysis as well as the studies done from the secondary
sources. The Chapter gave an overview of the entire analysis in a summarized manner.
The objectives of the study were fulfilled successfully by getting an overall analytical and
qualitative understanding of the entire context.

CHAPTER – 11
©Ranjita Banerjee 404
CHAPTER – 11
Recommendations, Limitations and Conclusions
11.1. Introduction
This being the last Chapter of the thesis gives value-added recommendations, based on
the outcomes of the study. The Chapter also discusses the limitations as well as the future
scope of research and conclusions. Recommendations hold a very important aspect of a
research as it forms the inputs to the body of knowledge from the outcomes of the study.
It also adds to the managerial implications and helps in implementation of theoretical
knowledge into practice.
11.2. Major Recommendations From the Study
Recommendations adds to the body of knowledge if they are being implemented
judiciously.
11.2.1. Recommendations to SME owners and Managing Heads
1. As could be seen from Table 8.15 that 49% of the firms had no internal HR expert
designated to undertake the HR functions in the firm. A significant influence of
presence of an internal HR person in the SMEs on HR Practices related to
Selection, Training & Skill Development, Feedback mechanism, career-growth,
Compensation, non-financial incentives and Authority & responsibility (Delegation
of power) surfaced from the study. Thus, SME owners should necessarily hire an able
internal HR expert, who can handle the HR related functions effectively and help
improve performance of the firm. (The present study shows that there is a significant

Recommendations, Limitations and Conclusions
©Ranjita Banerjee 405
influence of presence of an internal HR expert on Employee Outcomes as well as
Organizational Outcomes; from Mann-Whitney Test).
2. Taking consultancy services from an outside HR expert could also help to improve
the functioning of the HR practices and bring innovation in managing resources. In
the study, about 36% of the respondents do not take consultancy from an HR
Consultant.
3. Owners need to be more vigilant in terms of getting all their employees covered under
Employee State Insurance Corporation (ESIC). This will also enable them to
reduce their liability in times of exigency. ESIC being a mandatory social security
measure, it is surprising to note that its adherence is far less than the minimal
expected (only about 28% respondents agreed that they have ESIC).
4. Motivational activities needs to be encouraged to enhance employee engagement,
as it emerged in the qualitative study, during interactions with the Managing Heads/
owners, that a major challenge to handle is problems related to absenteeism and high
turnover rate of employees.
5. Non-Financial Incentive schemes needs to be incorporated. This will help to
enhance engagement and motivational aspects of the employees cost-effectively. In
the study, non-financial incentives had the lowest mean of 2.98 with Standard
Deviation 1.127. This shows that SME firms presently do not encourage Non-
Financial incentives to a great extent.
6. Further, job-rotation is also encouraged as a good HR practice. Job-rotation can
help the employees to get trained in new areas of work, which can help to enhance
employee motivation, as well as indirectly help owners/ Managing heads to manage
work effectively, as frequent absenteeism is a major problem of the employees. (It
came up in the present study that at employees are not much rotated from one job to
another [Mean= 3.40, Std. Dev= 0.916] ).
7. An effective Performance Management System needs to be practiced in majority of
the SMEs. This will help Managing Heads to identify good and efficient line
managers and workers from ineffective employees. This will also be a foundation
work to initiate Performance-based incentives to enhance motivation and
effectiveness of employees and a spirit of competitiveness. (In the present study about

Recommendations, Limitations and Conclusions
©Ranjita Banerjee 406
50% of the respondents agreed that performance is assessed in their firm by the
HODs/ owners, based on past performance of employees, though there is no
prescribed format for the same. 10% of the respondents said that their firm did not
have any system of performance assessment.)
11.2.2. Recommendations to Government and Industry Associations
Based on the studies, especially the policy initiatives and the interactions had with the
owners/ Managing Heads and understanding the underlying issues in this vibrant sector,
some recommendations have been laid down by the researcher:
1. The limit of investment needs to be increased and not limiting it to the present
investment limit as defined by Micro, Small and Medium Enterprises Development
(MSMED) Act 2006. This investment limit somehow discourages the SME
entrepreneurs to expand further and grow, as they want to continually avail the
benefits of being an infant industry, eventhough their firms’ capabilities might have
increased.
2. The visibility, clarity and marketing of government-aided schemes and subsidies
should be enhanced via various means like TV media, social media, mobile apps,
newspapers etc, as many entrepreneurs are unaware of such initiatives.
3. Government organizations/ Ministry should engage non-government agencies,
including NGO’s and export promotion centres, to exhibit the products of the
SME, ancillary and subsidiary industries, preferably biannually, through industrial
exhibitions etc. For example the way VCCI (Vadodara Chamber of Commerce and
Industry) and GCCI (Gujarat Chamber of Commerce and Industry) takes the initiative
to exhibit the talents of this sector through Vibrant Gujarat initiatives.
4. Mandatory Quality Control Mechanisms for each and every produce of the SME
sector will ensure a better market for the SME and also enhance their competitiveness
to compete with China products.
5. Supervision of Environmental Control Mechanisms should be regulated, in line
with national and global standards. This will also ensure export avenues for the
sector.

Recommendations, Limitations and Conclusions
©Ranjita Banerjee 407
6. Banks, whether Private, Nationalized or MNCs, should offer a fixed percentage of
their assets for services to SME sector in subsidized rates, as a part of their CSR
activities and community development activities. This strategy and initiative by the
Central bank’s directive will ensure easy loan and credit facilities for budding
entrepreneurs as well as encourage MSME entrepreneurs for expansion programs..
7. Social Accountability Audits should be initiated. For example, SA 8000 can be
made a compulsory regulation to check the health, safety, working conditions and
minimal welfare facilities of the employees of the SME sector. This is in context to
the not-so-amicable working conditions in few of the shades of the SMEs observed
by the researcher. (SA 8000 is an international standard for social accountability
initiated by Council on Economic Priority Accreditation Agency (CEPAA).
11.2.3. Recommendations to Academia and Industry
1. Training and Development Institutes should be established in collaboration with
academia, corporate trainers, Counselors, industrialists, as well as economic analysts,
to train the staff of the SME’s.
2. Large enterprises need to give their support services related to infrastructure or
finance or some other ways, to impart training to SME employees.
3. Large enterprises can also dedicate to get part of their services through inputs from
ancillary industries like SMEs. This can lead to inclusive growth as well as a
decentralized system of functioning.
4. Colleges and Universities can extend their support towards the SMEs by rendering
Training as well as Learning and Development initiatives for the SME employees.
This can positively help in enhancing effectiveness of employees.

Recommendations, Limitations and Conclusions
©Ranjita Banerjee 408
11.3. Limitations of the Study
As diligently quoted by Sir Henry Ford: ‘As we advance in life, we learn the limits
of our abilities’. No study or research can be devoid of limitations…it speaks the
doors for future opportunities as well. The limitations of the present study are as
follows:
• The study is limited to the eight (out of twelve) industrial estates of Vadodara
district. The study could have been extended to some other districts of Gujarat as
well.
• The sample size is minimum 10% of each industrial estate, except for the GIDC
Makarpura Industrial estate, where the sample size is 6.5% (64 SME firms) due to
the large size of the estate. (It is the largest industrial estate in Vadodara district
with about 1000 SMEs, as mentioned in the FSSI Directory). Further, due to the
researcher’s limitations of time and resources, the sample size, to the best of the
ability of the researcher, was restricted to 126 SME firms and 215 respondents,
who were the owners/ Managing heads in SMEs.
• Few indicators related to ‘Type of firm’ in the Kruskal-Wallis Test showed the
highest mean ranks for Public Ltd. Companies and Joint-stock companies.
However, it is to be noted that of the 215 respondents, only seven Managing
Heads belonged to Public Ltd. Company and Joint-stock company, respectively.
• Similarly, few indicators related to ‘Nature of industry’ in the Kruskal-Wallis Test
showed the highest mean ranks for Electrical and Pharmaceutical industry.
However, it is to be noted that of the 215 respondents, only seven Managing
Heads belonged to Electrical and Pharmaceutical industry, respectively.
• Indicator related to ‘Total number of contractual employees’ in the Kruskal-
Wallis Test showed the highest mean ranks for ‘Firms with No. of Contract
employees between 50 to 94’ and ‘More than 94’. However, it is to be noted
that of the 215 respondents, only seven Managing Heads belonged to firms in
each of these two categories.

Recommendations, Limitations and Conclusions
©Ranjita Banerjee 409
• In Regression Analysis, the Adjusted R Square value is quite low but as the
regression analysis is carried out on ordinal scale it is bound to happen this way.
To overcome the limitation, Structural Equation Modeling was incorporated to
better understand the linkages between HR Practices, Employee Outcomes and
Organizational Outcomes.
11.4. Future Scope for Research
• Significant scope to broad-base this study across SME hubs – not only in the
larger manufacturing hubs in Gujarat, but also across the other leading
manufacturing states.
• Future research may be done to broad-base the study using more performance
indicators as well as by using absolute figures of Return on Investment and Net
Profit Margin.
• Future research may be administered to cover more number of SMEs and increase
the sample size, by involving enumerators or a team of research scholars to cover
a larger part of the population.
11.5. Conclusion
The success, survival and growth of the economy lies in a competitive based market,
whereby regulations and practices are transparent, ethical, effective and appropriate; and
whereby, the big corporate houses, government and the small industries work in a
collaborative manner. Though a lot of initiatives have been taken up by the Government,
through its various policies and plans, and also by the Private Sector, yet a lot more can
be done to make this sector even more vibrant. Policy induced restrictions, high-costs of
infrastructure and raw materials, licensing controls, restrictive trade practices,
bureaucratic controls, discretionary approvals etc have to be removed from the system.
Lot many system-wide initiatives need to be incorporated. Still a lot more needs to be
done, to flourish entrepreneurship at all levels.

Recommendations, Limitations and Conclusions
©Ranjita Banerjee 410
This detailed research in 126 SME firms with 215 SME owners/ Managing Heads as
respondents, across the eight industrial estates in the manufacturing cluster of Vadodara
district, showed that HR Practices has a positive significant relationship with
Organizational Performance. Employee Outcome has a positive significant relationship
with Organizational Performance; and that there exists a covariance between HR
Practices and Employee Outcome. Further, a lot of aspects related to the various HR
practices across the eight estates came to surface. The most important HR practices came
up to be interviews.
A significant influence of presence of an internal HR person in the SMEs on HR
Practices related to Selection, Training & Skill Development, Feedback mechanism,
career-growth, Compensation, non-financial incentives and Authority & responsibility
(Delegation of power) surfaced from the study. Thus, SME owners need to understand
the importance of an internal HR person in the organization. As well as taking HR
Consultancy from time to time also plays an important part for development of the firms.
The semi-structured interviews helped to find out various intricate issues and major
problems and challenges faced by the sector, as well as the reasons thereof. For example,
the major reason for decreasing ROI and Net Profit Margin over the last two years has
been because of high level of competition from domestic and international market,
especially from China. Easy availability of low cost China-made substitute products for
suppliers have come up as a big challenge for the sector.
In view of the significant share of MSMEs in our nation’s future growth, and given the
fact that more than 100 million jobs will be created at MSMEs over the next five years
(Report of the Working Group on MSMEs, 2012-17 Plan), there is significant scope to
broad-base this study across MSME hubs – not only in the larger manufacturing hubs in
Gujarat, but also across the other leading manufacturing states, so as to help come up
with a policy framework that may help MSMEs achieve better economic outcomes.
Major changes to the existing Labour and Employment Laws are anticipated over the
coming year to enhance ease of doing business, and assessing and introducing HRM best
practices will be key to sustain business performance in this important segment for
maintaining the competitive advantage of our country.

LIST OF REFERENCES
©Ranjita Banerjee 411
LIST OF REFERENCES
Annexure- XIV
ARTICLES FROM JOURNALS
1. Akaike, H. (1974), "A New Look at the Statistical Model Identification," IEE
Transactions on Automatic Control, 19 (6), 716-23.
2. Arthur, J .B. (1994), Effects of Human Resource System on Manufacturing
3. Barney, J. 1991. Firm resources and competitive advantage. Journal of
Management, 17: 99–120
4. Becker B E & Gerhart B (1996), ‘The impact of Human Resource
Management on Organizational Performance: Progress and Prospects’,
Academy of Management Journal, 39, 779-801.
5. Behrands T (2007), ‘Recruitment practices in small and medium size
enterprises: An empirical study among knowledge-intensive professional
service firms, Management Review, 18(1), 55-74.
6. Bentler, P.M. (1990), "Comparative Fit Indexes in Structural Models,"
Psychological Bulletin, 107 (2), 238-46.
7. Bentler, P.M. and Bonnet, D.C. (1980), "Significance Tests and Goodness of
Fit in the Analysis of Covariance Structures," Psychological Bulletin, 88 (3),
588-606.
8. Bentler, Peter M, ‘On the fit of covariances and Methodology’, Psychological
Bulletin, Vol 112(3), Nov 1992, 400-404.
9. Bollen, K.A. (1986), “Sample Size and Bentler and Bonett’s Nonnormed Fit
Index,” Psychometrika, 51, 375–377.

LIST OF REFERENCES
©Ranjita Banerjee 412
10. Bollen, K. A. (1989). A new incremental fit index for general structural
equation models. Sociological Research and Methods, 17, 303-316.
11. Bollen, K.A. (1989), Structural Equations with Latent Variables, New York:
John Wiley & Sons, Inc.
12. Boselie, J. P. and Dietz, G. and Boon, C. (2005), ‘Commonalities and
contradictions in research on Human Resource Management and
performance’, Human Resource Management Journal, 15 (3). pp. 67-94.
13. Bowen Michael, Morara Makarius and Mureithi Samuel (2009), Management
of Business challenges among Small and Micro Enterprises in Nairobi-Kenya,
KCA Journal of Business Management: Vol. 2, Issue 1
14. Bowen, D.E. and Ostroff, C. (2004), ‘Understanding HRM-Firm Performance
linkages: The role of the “strength” of the HRM system’, Academy of
Management Review, 29(2): 203-221.
15. Boxall, P. 1996. The strategic HRM debate and the resource based view of the
firm. Human Resource Management Journal, 6: 59–75.
16. Bozdogan, H. (1987). Model selection and Akaike's information criterion
(AIC): The general theory and its analytical extensions. Psychometrika, 52,
345–370.
17. Brand, Maryse J. and Croonen, Evelien P. M (Oct 2010), ‘Franchised & small,
the beautiful of all: HRM and performance in plural systems’, Journal of
Small Business Management.
18. Browne, M.W. & Cudeck, R. (1989). Single sample cross-validation indices
for covariance structures. Multivariate Behavioral Research, 24, 445–455.
19. Browne, M.W. & Cudeck, R. (1993). Alternative ways of assessing model fit.
In Bollen, K.A. & Long, J.S. [Eds.] Testing structural equation models.
Newbury Park, CA: Sage, 136–162.
20. Budhwar, P.S., and Khatri, N. (2001), ‘A Comparative Study of HR Practices
in Britain and India,’International Journal of Human Resource Management,
12, 5, 800–826.
21. Camps, J. & Luna-Arocas, R. (2010). A Matter of Learning: How Human
Resources Affect Organizational Performance. British Journal of

LIST OF REFERENCES
©Ranjita Banerjee 413
Management, http://onlinelibrary.wiley.com/doi/10.1111/j.1467-
8551.2010.00714.x/pdf
22. Camps, J. & Luna-Arocas, R. (2010). A Matter of Learning: How Human
Resources Affect Organizational Performance. British Journal of
Management, http://onlinelibrary.wiley.com/doi/10.1111/j.1467-
8551.2010.00714.x/pdf
23. Cardon, M. S. and Stevens, C. E. (2004). Managing human resources in small
organizations: What do we know? Human Resource Management Review,
14(3), 295-323.
24. Carlson, D.S., Upton, N. & Seaman, S. (2006), ‘The impact of human
resource practices and compensation design on performance: an analysis of
family-owned SMEs’, Journal of Small Business Management, 44 (4), 531-
543.
25. Castel-Branco C. (May 2003), ‘A Critique of SME-led Approaches to
Economic Development’, Research Report for SMEs Task Force seminar of
the Islamic Chamber of Trade and Industry.
26. Caves, Richard E., Michael E. Porter, and Michael A. Spence. (1980),
Competition in the Open Economy: A Model Applied to Canada, Cambridge,
MA: Harvard University Press
27. Chandler, G. N., & McEvoy, G. M. (2000). Human Resource Management,
TQM, and Firm Performance in Small and Medium Sized Enterprises.
Entrepreneurship Theory and Practice, 43–57.
28. Charantimath Poornima, Entrepreneurship Development Small Business
Enterprises, Pearson Education, 2012 (ISBN 978-81-7758-260-4)
29. Cheng Ling Tan and Aizzat Mohd Nazurdin (2011), ‘Human Resource
Management Practices and Organizational Innovation: Assessing the
mediating role of knowledge management effectiveness’, Electronic Journal
of Knowledge Management, Volume 9 Issue 2 (2011).
30. Cronbach, L. J. (1951). Coefficient alpha and the internal structure of tests.
Psychometrika, 16: 297-334
LIST OF REFERENCES
©Ranjita Banerjee 414
31. Desai Vasant, Small Scale Industries and Entrepreneurship in the 21st Century,
Himalaya Publishing House, 2011
32. Deshpande & Golhar (1994), HRM practices in large and small manufacturing
firms: a comparative study, Journal of Small Business Management, April,
1994.
33. Dyer, L. and Reeves, T. (1995), ‘Human resource strategies and firm
performance: what do we know, where do we need to go?’ International
Journal of Human Resource Management, 6:3, 657-667.
34. Erdil O & Günsel A (2006), ‘Relationship between Human Resource
Management Practices, Business strategy fit and Firm performance’, Gebze
Institute of Technology, Turkey (2006), Journal of Global Strategic Mgt.,
Vol:1, Issue: 1, June 2007.
35. Erdil O and Günsel A (2012), ‘Relationships between Human Resource
Management Practices, Business Strategy Fit and Firm Performance’, Gebze
Institute of Technology, Turkey 97 – 106.
36. Eshetu Bekele & Mammo Muchie (2009), ‘Promoting micro, small and
medium Enterprises (MSMEs) for sustainable rural Livelihood’,
Development, Innovation and International Political Economy Research
(DIIPER) & Department of History, International and Social Studies, Aalborg
University, Denmark, DIIPER Research Series Working Paper No. 11, ISSN
1902-8679.
37. Ferris, G. R., Hochwarter, W. A., Buckley, M. R., Harrell-Cook, G., & Frink,
D. D. 1999. Human resource management: Some new directions. Journal of
Management, 25: 385–415
38. Gatewood, Robert D., and Hubert S. Field (1987), “A Personnel Selection
Program for Small Business,” Journal of Small Business Management
(October), 16-24.
39. Gerhart, B. (2005), ‘Human resources and business performance: Findings,
40. Gill Preetinder, Dugger J and Norton F (2014), ‘The relationship between
compensation and selected dimensions of employee engagement in a mid-

LIST OF REFERENCES
©Ranjita Banerjee 415
sized engineering services firm’, The Journal of Technology, Management
and Applied Engineering, Vol. 30, No.1, Jan-March 2014.
41. Guest, D.E. (1997). ‘Human resource management and performance: a review
and research agenda’. International Journal of Human Resource Management,
8:3, 263-276.
42. Guthrie, J.P., Spell, C.S. & Nyamori, R.O. (2002), ‘Correlates and
consequences of high involvement work practices’, International Journal of
Human Resource Management, 2002, 13, 183-197
43. Heneman R L & J W Tansky (2003), ‘Introduction to the Special Issue on
Human Resource Management in SMEs: A call for more research’, Human
Resource Management,42 (4), 299-302
44. Heneman, R.L; J.W Tansky and S M Camp (2000), Entrepreneurship: Theory
& Practice, ‘Human Resource Management practices in small & medium
sized enterprises: Unanswered questions and future research perspectives’
45. Hess, D. W., 1987, 'Relevance of small business courses to management
needs', Journal of Small Business Management (Januari), 26-34
46. Hodgetts, R. M. and Kuratko, D. F. (1998), Effective Small Business
Management (6th Ed). Fort Worth, Texas: Dryden Press.
47. Hornsby J S, Kuratko D F, LaFollette W R, Hodgetts R and Cox Larry (1999),
‘A study of Human Resource practices and trends in U.S small businesses’,
Proceedings: U.S Association of Small Businesses and Entrepreneurship,
January (1999), Pg. 210-219.
48. Hornsby, Jeffrey S., and Donald K. Kuratko (1990), “Human Resource
Management in Small Business: Critical Issues for the 1990s,” Journal of
Small Business Management (July), 9-18.
49. Hu, L., & Bentler, P. M. (1995). Evaluating model fit. In R. H. Hoyle (Ed.),
Structural equation modeling: Issues, concepts, and applications (pp. 76-99).
Newbury Park, CA: Sage.
50. Hu, L.T. and Bentler, P.M. (1999), "Cutoff Criteria for Fit Indexes in
Covariance Structure Analysis: Conventional Criteria Versus New
Alternatives," Structural Equation Modeling, 6 (1), 1-55.

LIST OF REFERENCES
©Ranjita Banerjee 416
51. Ichniowski, Casey, Shaw, Kathryn, and Prennushi, Giovanna. "The Effects of
Human Resource Management Practices on Productivity". Unpublished paper
presented at the ILR School, Cornell University, September 13, 1993.
52. Ijose, Olumide (2005), ‘Strategic human resource management, small and
medium sized enterprises and strategic partnership capability’, Journal of
Management and Marketing Research, Volume 5, June 2010.
53. James, L.R., Mulaik, S.A., and Brett, J.M. (1982), Causal Analysis, Beverly
Hills: Sage Publications.
54. Jones G and Wright P (1992), ‘An economic approach to conceptualizing the
utility of human resource management practices in K. Rowland & G Ferris
(Eds.), Research in Personnel and Human Resource Management, 10, 271-
299.
55. Jöreskog, K. and Sörbom, D. (1993), LISREL 8: Structural Equation
Modeling with the SIMPLIS Command Language, Chicago, IL: Scientific
Software International Inc.
56. Jöreskog, K. and Sörbom, D. (1996), LISREL 8: User’s Reference Guide.
Chicago, IL: Scientific Software International Inc.
57. Kanu A. M (2015), ‘How do recruitment & Selection practices impact Small
& Medium Enterprises performance in the construction industry in Sierra
Leone?’, Journal of Economics & Sustainable Development, Vol 6, No. 5,
2015 (ISSN No. 2222-1700).
58. Katou A. (2008), ‘Measuring the impact of HRM on organizational
performance’, Journal of Industrial Engineering and Management (JIEM),
2008 – 01(02):119-142 - ISSN: 2013-0953.
59. Khan A. (2010), “Effects of Human Resource Management Practices on
Organizational Performance – An Empirical Study of Oil and Gas Industry in
Pakistan”, European Journal of Economics, Finance and Administrative
Sciences, ISSN 1450-2275 Issue 24.
60. Koch, C. L. Y. and J. M. P. De Kok (1999), ‘A human resource based theory
of the small firm’, RIBES nr. 9940, Rotterdam: Erasmus University
Rotterdam

LIST OF REFERENCES
©Ranjita Banerjee 417
61. Kuratko Donald, ‘HRM in small business: Critical issues for the 1990’s’,
Journal of small Business Mngt., Oct 2010 (Available at:
http://www.allbusiness.com/human-resources/124788-
1.html#ixzz1mScql9HR on 15.2.13)
62. Lado, A. A.& M. C. Wilson (1994), ‘Human resource systems and sustained
competitive advantage: competence-based perspective’, Academy of
Management Review, 1994, Vol. 19, No. 4, p. 699–727.
63. Lau, C.M., & Ngo, H.Y., (2004), The HR system, organizational culture, and
product innovation, International Business Review, 13(6), 685-703.
64. Lepak, D.P., Liao, H., Chung, Y., & Harden, E.E. (2006), ‘A conceptual
review of
65. MacCallum, R.C., Browne, M.W., and Sugawara, H., M. (1996), "Power
Analysis and Determination of Sample Size for Covariance Structure
Modeling," Psychological Methods, 1 (2), 130-49.
66. MacDuffie, J.P. (1995). Human resource bundles and manufacturing
performance: organizational logic and flexible production systems in the
world auto industry. Industrial and Labour Relations Review, 48(2) 197-221,
Management Journal, 43(6), 1248-1264.
67. Marsh, H. W., Balla, J. R., & McDonald, R. P. (1988). Goodness-of-fit indices
in confirmatory factor analysis: Effects of sample size. Psychological Bulletin,
103, 391- 411.
68. Maryse J. Brand & Erik H. Bax (December 2002), ‘Strategic HRM for
SME’s: Implications for firms and policy’, Education & Training Journal,
Groningen University, Faculty of Management and Organization,
Netherlands, Vol 44, Number 8, pp. 451-463.
69. McEvoy, G. M., 1984, 'Small business personnel practices', Journal of Small
Business Management 22 (4), 1-8
70. Mulaik, S.A., James, L.R., Van Alstine, J., Bennet, N., Lind, S., and Stilwell,
C.D. (1989), "Evaluation of Goodness-of-Fit Indices for Structural Equation
Models," Psychological Bulletin, 105 (3), 430-45.

LIST OF REFERENCES
©Ranjita Banerjee 418
71. Nguyen, T. V., &. Bryant S. E. (2004). A study of the formality of human
resources Management practices in small and medium size enterprise in
Vietnam. International Small Business Journal, 22, 595-618.
72. Paauwe, J. (2004), ‘HRM and Performance: unique approaches for achieving
long term viability’, Oxford: Oxford University Press
73. Paauwe, J. and Richardson, R. (1997). ‘Introduction special issue on HRM
and Performance’, International Journal of Human Resource Management,
8:3, 257-262
74. Paawe Jaap (2009), ‘HRM and Performance: Achievements, Methodological
Issues and Prospects’, Journal of Management Studies, Blackwell Publishing
Ltd., 46:1 January 2009, ISSN: 0022-2380.
75. Paul Boselie, Graham Dietz and Corine Boon, C. (2005), ‘Commonalities and
Contradictions in HRM and Performance Research’, Human Resource
Management Journal, Vol. 15, No. 3, 6794.
76. Pearson, Terry R.; Stringer, Donna Y.; Mills, LaVelle H.; Summers, David F
(July 2006) , ‘Urban vs. rural: Human Resource Management in SMEs’,
Academy of Entrepreneurship Journal , Publisher: The Dream
Catchers Group, ISSN: 1087-9595
77. Pfeffer, J., (1994), ‘Competitive advantage through people’, Boston:Harvard
Business School Press.
78. Prahlad Kasturi, Alexei G. Orlov, John Roufagalas, (2006) "HRM systems
architecture and firm performance: Evidence from SMEs in a developing
country", International Journal of Commerce and Management, Vol. 16 Iss:
3/4, pp.178 – 196.
79. Rao T V, ‘Making SMEs successful: Lessons from success’, T V Rao
Learning Systems, 2005
80. Saleem Shaikh, Cavusgil, Tamer S, Tietenberg Tom, Chandhoke Neera and
Hollensen Svend, ‘Environment for Business’, (Pearson Education, 2011), Pg.
1.10
81. Satorra, A., & Saris, W. E. (1985). Power of the likelihood ratio test in
covariance structure analysis. Psychometrika, 50, 83-90.

LIST OF REFERENCES
©Ranjita Banerjee 419
82. Scandura, T., & Williams, E. (2000). Research methodology in management:
Current
83. Sels L., Winne D.S, Maes J., Faems D., Delmotte J. & Forrier A (2003), ‘Hoe
HRM affects corporate financial performance: Evidence from Belgian SMEs’,
Working Paper Steunpunt OOI: 2003, Vleriek Leuven Gent Management
School, Belgium.
84. Singh M & Vohra N (2009) ,“Level of Formalization of Human Resource
Management in Small and Medium Enterprises in India” Journal of
Entrepreneurship March 2009 vol. 18 no. 1 95-116.
85. Steiger, J.H. & Lind, J.C. (1980, May 30, 1980). Statistically-based tests for
the number of common factors. Paper presented at the Annual Spring Meeting
of the Psychometric Society, Iowa City.
86. Tucker, L. R., & Lewis, C. (1973). A reliability coefficient for maximum
likelihood factor analysis. Psychometrika, 38, 1-10.
87. Tulus Tambunan (October 2006), Micro, Small and Medium Enterprises and
economic growth, Working Paper Series no. 14, Center for Industry and
SME Studies, Faculty of Economics, University of Trisakti.
88. Wheaton, B., Muthen, B., Alwin, D., F., and Summers, G. (1977), "Assessing
Reliability and Stability in Panel Models," Sociological Methodology, 8 (1),
84-136.
89. Wimbush J C (2005), ‘Spotlight on Human Resource Management’, Human
Resource Management, 48: 463-67.
90. Wright, P. M., McMahan, G. C., & McWilliams, A. 1994. Human resources
and sustained competitive advantage: A resource-based perspective.
International Journal of Human Resource Management, 5: 301–326.
91. Wright, P.M. and McMahan, G.C. (1992). ‘Theoretical perspectives for
strategic human resource management’, Journal of Management, 18:2, 295-
320.
92. Wright, P.M., Gardner, T., Moyniham, L.M., & Allen, M. (2005), ‘The HR
performance relationship: Examining causal direction’, Personnel Psychology,
58,409-446.

LIST OF REFERENCES
©Ranjita Banerjee 420
93. Wyatt M, Pathak S & Zibarras L (2010), ‘Advancing selection in an SME: Is
best practice methodology applicable?’, International Small Business Journal,
28 (3) 258-273, SAGE Publications.
94. You, Jong-Il. (1995),“Small Firms in Economic Theory,” Cambridge Journal
of Economics.
THESIS REFERENCE
1. Alnaqbi W (2011), The relationship between Human Resource Practices and
Employee retention in public Organizations: An exploratory Study conducted
in the United Arab Emirates, Edith Cowan University
2. Husien W A (2012), Role of strategic human resources management on
SMEs’ performance in Iraq, University Utara Malaysia.
3. Mishra A K (2012), A critical study of Human Resource Development
practices in Durgapur Steel Plant, University of Burdwan, West Bengal.
4. Muhammad A R (2007), HRM sophistication and SME performance: A case
of readymade garment manufacturers and exporters in Lahore, Pakistan,
University of Twente.
5. Murphy Kevin S (2009), High Performance Work Practice System’,
University of Central Florida.
6. Rathnaweerage .R (2010), Do HRM practices impact Employee satisfaction,
Commitment or retention? (empirical studies of Sri Lankan public sector
Banks), University of Agder.
7. Rojanapuwadol S (2012), Development of HRM Practices in SMEs : A Case
Study from the Founders and CEOs’ Point of view, University of
Gothenburg.
8. Shaikh M (2011), A study on the strategic role of HR in IT industry with
special reference to select IT / ITES organizations in Pune city, University of
Pune, Pune.
9. White S (2012), ‘Examining the Relationship amongst Human Resource
Management, Leadership, and Firm Performance Outcomes with Knowledge

LIST OF REFERENCES
©Ranjita Banerjee 421
Workers: Preliminary Evidence from a Biotechnology Company’, The
University of Prince Edward Island, Charlottetown, Prince Edward Island.
BOOKS AND REPORTS
1. Annual Survey of Industries (ASI), 2009-10, Government of Gujarat ,
Socio-economic Review
2. Armstrong Michael (2006, 10th edition), ‘A handbook of Human Resource
Management Practice’, Kogan Page Ltd., ISBN: 0 7494 4631 5
3. Armstrong Michael & Angela Baron (2007), Handbook of Strategic HRM,
PaperBack Edition, ISBN13 : 9788179925683
4. Armstrong Michael (9th edition), A Handbook of Human Resource
Management Practice, Kogan Page Ltd. ISBN : 0749441054
5. Armstrong, M. A Handbook of Human Resource Management Practice.
Kogan Page, London, 2009.
6. Boxall, P. & Purcell, J. Strategy and Human Resource Management.
Palgrace Macmillan, Hamshire, 2008.
7. Carton Robert & Hofer Charles (2008), ‘Measuring organizational
performance : Metrics for entrepreneurship and Strategic Management
Research’, Edward Elgar Publishing Ltd.
8. CBC, EICC, CII & Govt. of Gujarat, Vibrant Gujarat 2011, Paper on
International Round Table on Contribution of SMEs to Growth of Emerging
Nations
9. Census of India 2011, Human Development Index Report, RGI, GOI.
10. Confederation of Indian Industry (CII), ‘The impact of FDI in Retail on
SME Sector’, Dec 2011-Jan 2012.
11. Cooper, C.L., and Burke R.J. Human Resource Management in Small
Business: Achieving Peak Performance. Edward Elgar Publishing Limited,
Cheltenham, 2011.
12. Darwish T (2013), ‘Strategic HRM and Performance: Theory & Practice’,
Cambridge Scholars Publishing, ISBN (13): 978-1-4438-4729-2.

LIST OF REFERENCES
©Ranjita Banerjee 422
13. Development Commissioner (MSME) Ministry of MSME, GOI, ‘Initiative
of the Ministry of MSME’s in recent years’, (2010-11).
14. District Industries Centre (Vadodara), ‘Gujarat Industrial Policy 2015
Report’, Industries & Mines Department, Industries Commissioner,
Government of Gujarat (2015).
15. Easterby-Smith., M; Thorpe, R. and Lowe, A., 1991, Management
Research: An Introduction, Sage Publications, London Industries
Commisionerate, Gov of Gujarat; http://ic.gujarat.gov.in/?page_id=414)
16. IMF External Relations Department, ‘Overcoming the Great Recession’,
John Lipsky, First Deputy Managing Director of the International Monetary
Fund
at the Japan National Press Club
Tokyo, May 18, 2009, Indicators Research, 75(3), 361-394.
17. Industries Commissionerate, Govt. of Gujarat, Report on Micro, Small and
Medium Enterprises Development Act 2006, w.r.t Reporting, Tax Audit and
Registration, Neeraj Bhagat & Company, 2006
18. International Round Table on Contribution of SMEs to Growth of Emerging
Nations - An Initiative by CBC, EICC, CII & Govt. of Gujarat, Vibrant
Gujarat 2011
19. ISED Small Enterprise Observatory (2013), ‘Gujarat Micro, Small and
Medium Enterprises Report 2013, ISBN - 978-93-80830-16-2
20. M. Joseph E. McGrath, and Richard A. Kulka (Ed.), Judgment calls in
research (pp. 69-102). Beverly Hills: Saga Publications.
21. Machado Carolena & Melo Pedro (2013), ‘Effective Human Resources
Management in Small and Medium Enterprises: Global Perspectives’, Idea
Group US Publishers, ISBN-13: 978-1466647312.
22. Malhotra N and Dash S, ‘Marketing Research- An Applied Orientation’,
Pearson Publication (Old Edition, 2010)
23. Matthias Fink & Sascha Kraus (2009), ‘The Management of Small and
Medium Enterprises’, Routledge Publisher, ISBN-13: 978-0415467247.

LIST OF REFERENCES
©Ranjita Banerjee 423
24. McGrath, J. (1982). Dilemmatics: The study of research choices and
dilemmas. In J.
25. Ministry of Commerce & Industry, Department of Commerce, Report on
Special Economic Zones in India, April 24, 2012
26. Ministry of Law and Justice (Legislative Department), Gazette of India,
Micro, Small and Medium Enterprises Development Act, 2006, Delhi
(2006)
27. Ministry of Micro, Small and Medium Enterprises, Government of India,
MSME Annual Report (2015-16)
28. Ministry of Micro, Small and Medium Enterprises, Government of India,
MSME Annual Report (2014-15)
29. Ministry of Micro, Small and Medium Enterprises, Government of India,
MSME Annual Report (2013-14)
30. Ministry of Micro, Small and Medium Enterprises, Government of India,
MSME Annual Report (2012-13)
31. MSME Development Institute, GOI, ‘Brief Industrial Profile of Vadodara
District’, 2012.
32. MSME, GOI (Jan 2010), Report of Prime Minister’s Task Force.
33. Office of Development Commissioner MSME, Ministry of MSME, GOI
Report, October 30. 2011.
34. Planning Commission, Government of India (Dec 2002), ‘Committee on
India Vision 2020’, Chairman- Dr. S P Gupta.
35. Press Information Bureau, Government of India, Ministry of Micro, Small &
Medium Enterprises, 22-July-2014 (Available at:
http://pib.nic.in/newsite/PrintRelease.aspx?relid=107201
36. Prime Minister’s Task Force on Micro, Small and Medium Enterprises,
Govt. of India, January 2010.
37. Report Economic Survey 2015, GOI.
38. Senyucel Z (2009), ‘Managing the human resource in the 21st century’,
Bookboon.com, Ventus Publishing APS, ISBN 978-87-7681-468-7.

LIST OF REFERENCES
©Ranjita Banerjee 424
39. Shoaib Nawaz’s (2014), ‘Guideline to develop HR Policies for SME (Case
study of TurkPlast)’, Amazon Digital South Asia Services, Inc., Kindle
Edition.
40. Sturm Andreas (2000.), ‘A handbook on the implementation of the New
Standard on Corporate Social Accountability initiated by CEAAA: SA
8000: Corporate Social Accountability Management’.
41. Van de Vorde (2009), ‘HRM, Employee well-being and Organizational
Performance- A Balanced Perspective’, Ridderprint OBV, ISBN-978-90-
5335-238-0.
42. World Bank. (2002), “SME”, World Bank Group Review of Small Business
Activities, Washington, DC: World Bank.
43. World Bank. (2004), “SME”, World Bank Group Review of Small Business
Activities, Washington, DC: World Bank
44. Zimmerer T & Scarborough N, ‘Essentials of Entrepreneurship and Small
Business Management’, Fifth Edition, Pearson Education.
WEBSITE REFERENCES
1. Gallup Study 2016 :
file:///C:/Users/Admin/Downloads/Focus_on_Customer_and_Employee_E
ngagement_Leads_to_Dramatic_Growth_in_Profits_and_Sales.pdf)
2. http://articles.economictimes.indiatimes.com/2013-06-
09/news/39834857_1_smes-workforce-small-and-medium-enterprises
3. http://msme.gov.in/mob/home.aspx
4. http://qualitative-research.net/fqs/fqs-e/2-00inhalt-e.htm
5. http://www.csb.gov.hk/hkgcsb/hrm/e-good-practices/e-gp.htm (As on
5.9.15)
6. http://www.scribd.com/doc/25485875/India-GDP-Composition-Sector-
Wise
7. http://www.tradingeconomics.com/india/gdp-growth-annual

LIST OF REFERENCES
©Ranjita Banerjee 425
8. Mayring, P. (2000). Qualitative content analysis. Retrieved 2007, June 12
NEWS PAPER ARTICLES
1. Times of India, article dated 19th June 2016, titled ‘SMEs to become
partner vendors of large EPCs’ 2. Times of India, March 13, 2012, ‘Budget 2012: Nasscom for removal of
MAT on SEZ, clear transfer pricing norms’

LIST OF PUBLICATIONS RELATED TO PhD WORK
©Ranjita Banerjee 426
LIST OF PUBLICATIONS RELATED TO PhD
WORK
Year
Sr. No. Description
2015-16
1 ‘An empirical analysis of the HRM Practices and SMEs
Performance in Vadodara District- A Prelude’, ‘Research Trends in
Economics, Finance & HRM’, Excel Publishers, April 2016. (ISBN:
978-93-85777-44-8)
2 ‘An empirical analysis of the governance in SMEs at Vadodara
district: The road ahead’, Sankalpa-Journal of Mgt. & Research’,
Volume 6, Conference Issue, February 2016, Impact Factor: 2.813
(ISRA: JIF, Year 2016). ISSN 2231:1904. *
2014-15
3 ‘SMEs priority for sustainability: Customer over profits’, Sankalpa-
Journal of Mgt. & Research’, Volume 5, Conference Issue, February
2015, Impact Factor: 2.372 (ISRA: JIF, Year 2015). ISSN
2231:1904. *
4 ‘The linkage between HRM Practices & Performance of SMEs: A
conceptual understanding’, Management of SMEs in global era,
Excel India Publishers (2015), ISBN: 978-93-84869-34-2*
2013-14
5 ‘SMEs innovative Human Resource Management practices for
competitive advantage’, Protsahan-A Journal to encourage young
researchers, Vol.1, No.1, Part-II (Sept 2013), ISSN: 2321-869X.*
2012-13 6 ‘Improving Corporate Governance of SMEs for inclusive growth in
an emerging economy like India’, ‘Sankalpa-Journal of Management

LIST OF PUBLICATIONS RELATED TO PhD WORK
©Ranjita Banerjee 427
& Research’, Vol 3, Special Issue (February 2013), ISSN No. 2231-
1904.*
7 ‘Small and medium enterprises…A panacea for economic
growth & development - An analytical study of the global
scenario’, IES Mumbai (Feb, 2013), Sita Publications,
Mumbai, ISBN No. 978-81-86052-08-2.
8 ‘Micro, Small and Medium Enterprises…A silver-lining for
economic stability & growth’, NICM Bulletin- The Journal of
Management & Co-operation, Vol IX, No.3 (July-September 2012),
ISSN No. 2249-2275.*

BRIEF PROFILE OF THE AUTHOR
©Ranjita Banerjee 428
BRIEF PROFILE OF THE AUTHOR
Ms. Ranjita Banerjee
MHRD, MA-Eco., UGC-NET, B.Ed.
Asst. Professor, CKSV Institute of Management, Vadodara
Email: [email protected]
Ranjita is an Asst. Professor in CKSV Institute of Management, Vadodara (Affiliated
to Gujarat Technological University), the only Institute in western India accredited
by ACBSP, USA. Her areas of interest are Strategic Human Resource Management,
Business Ethics & Corporate Governance, Managerial Economics, Organizational
Development, HRD and HRM. She has 15 years of work experience of which 10 years
are in MBA teaching, 3 years in corporate and 2 years in School teaching.
Her Professional Teaching career is across two MBA Colleges and in a variety of roles.
Besides being responsible for HR Specialization as faculty, she has played variety of
organizational roles like Head of Department as MBA in-Charge, driving National and
international Accreditations, Content Management through Syllabus Designing for
specialized new Post-Graduation Courses, developing industry-academia relationships,
editing and report-writing for various institutes’ published matters, Master of Ceremony
for numerous occasions, Event Management and responsibility for publication as the
Principal Asst. Editor of the Institute’s Journal ‘Sankalpa: Journal of Mgt. & Research’
(ISSN 2231-1904, indexed in ProQuest) in addition to being a mentor and problem-
solver.

BRIEF PROFILE OF THE AUTHOR
©Ranjita Banerjee 429
Her corporate HR experience included work in HRM, introducing Performance
Management Systems in the organization, compliance system, Compensation
Management system, Training & Development and more…from where she drew the
inspiration to conduct this study to examine existence of linkages if any, between HR
practices and organizational performance.
She has to her credit, publication of 14 Papers in renowned International level Journals
and has presented over 12 Papers in various National and International Conferences. She
has also received ‘Best Paper Awards’ for 4 of her papers. She co-edited a book with
Dr. Rajesh Khajuria, Director, CKSV Institute of Management, titled ‘CSR Profile
of India Inc-Case Studies’ published by Excel India Publishers (ISBN: 978-93-
84869-61-8), which included 19 Case Studies of Corporate India. She is the elected
Managing Committee member of ISTD (Indian Society for Training &
Development) - Vadodara Chapter, since the last four consecutive years.
She truly believes that learning is a life-long process…it never stops…’Never stop
learning as life never stops teaching and only sky is the limit of unearthing…!’