a study of infrastructure contract processing …
TRANSCRIPT

AAA SSSTTTUUUDDDYYY OOOFFFIIINNNFFFRRRAAASSSTTTRRRUUUCCCTTTUUURRREEE
CCCOOONNNTTTRRRAAACCCTTT PPPRRROOOCCCEEESSSSSSIIINNNGGGTTTIIIMMMEEESSS
OFFICE OF THE CITY AUDITOR
APRIL 200201-R-12R
epor
t fro
m th
e C
ity A
udito
r

TABLE OF CONTENTS
Introduction 1Background 1Scope and Methodology 2
Analysis 5Summary 5Comparison Processing Times 5Time Analysis Demonstrates Wide Variation of Cycle Times 7Flowcharts Demonstrate the Complexity of the Current Process 9Conclusion 10
City Manager’s Response 11
Appendix A: Elapsed Times for Infrastructure Contracts over$25,000 (July 2000 - December 2001)
13
Appendix B: Flowchart – Invitation for Bids Contracting Process forInfrastructure Contracts Valued Over $25,000
15
Appendix C: Flowchart – Request for Proposal Contracting Processfor Infrastructure Contracts Valued Over $25,000
21
Appendix D: Time Analysis – Invitation for Bid Contracts Over$25,000
27
Appendix E: Time Analysis – Request for Proposal Contracts Over$25,000
29

- 1 -
INTRODUCTION
In accordance with the City Auditor’s 2001-02 Annual Plan and incooperation with the CityWorks Contract Streamlining Team(Team), we have prepared a study of infrastructure contractprocessing times. The purpose of our study was to provide theTeam with baseline information that it can use to restructure andimprove the infrastructure contracting process. Therefore, thisreport is informational in nature, and does not include auditfindings or recommendations.
This project is one of several on the City Auditor’s Annual Planthat emphasize collaboration between the City Auditor’s Officeand other City staff. These projects were designed to use theindependent, analytical skills of the City Auditor’s Office to supportstaff initiatives without impairing the City Auditor’s organizationalindependence. We conducted this review in accordance withgenerally accepted government auditing standards and limited ourwork to those areas specified in the Scope and Methodologysection of this report.
The City Auditor’s Office would like to thank the members of theCityWorks Contract Streamlining Team, City Manager’s Office,City Attorney's Office, Information Technology and PurchasingDivisions of the Administrative Services Department, Public WorksDepartment, and Utilities Department for their assistance andcooperation during this project.
Background
The City of Palo Alto (City) is responsible for constructing andmaintaining a wide range of public facilities and otherinfrastructure improvements including parks, landscaping, openspace, buildings and facilities, streets, sidewalks, medians, utilitydistribution systems, and waste water systems. The City expectsto commit a total of $240 million to capital improvement projectsfrom 2001 to 2006, including CityWorks projects to rehabilitate theCity’s General Fund infrastructure. The City uses the services ofprofessional architects, engineers, and contractors to design andcomplete infrastructure projects.
Infrastructure contracts over $25,000 are usually initiated throughthe Invitation for Bid (IFB) or the Request for Proposal (RFP)processes. Where project specifications are exact and detailed(such as construction work), the City uses the IFB process whichrequires formal competitive bidding. Where project specificationsrequire solution to a problem or an architectural or engineeringdesign, the City follows the RFP contracting process in which

- 2 -
competing proposals are evaluated using pre-determined criteriato judge each proposer's expertise and experience.
Each infrastructure contract involves a number of Citydepartments. Project managers and/or infrastructure planners inthe initiating department prepare technical specifications orscopes of services. Contract managers in the Purchasing Divisionof the Administrative Services Department (Purchasing) use thatinformation to assemble IFB or RFP packages, and distribute thepackages to prospective vendors. The City Attorney's Officereviews preliminary and final contract documents. Departmentdirectors and the City Manager approve and sign purchaserequisitions, Council memoranda, and legal documents asnecessary. Contracts over $65,000 require City Council approval,with the Mayor and City Clerk signing the final contract.
In November 2001, the City Manager’s Office and Public WorksDepartment assembled the CityWorks Contract StreamliningTeam to improve the infrastructure contracting process. TheTeam is a cross-departmental effort with members from theAdministrative Services Department, the City Attorney's Office, theCommunity Services Department, the Public Works Department,the Utilities Department, and the City Auditor's Office.
Scope and Methodology
We researched authoritative sources for contract cycle times forinfrastructure items, and conducted telephone interviews ofseveral other cities and a major local company to obtain theirestimates of contract cycle times for construction items requiringformal bids.
With the assistance of the Information Technology Division, weextracted a list of capital improvement project contracts over$25,000 from the City’s Integrated Fund Accounting System(IFAS). We selected contracts administered by CommunityServices, Public Works, and Utilities Departments, that werefinalized during the eighteen months ended December 31, 2001.We excluded change orders, sole source acquisitions, andemergency contracts. We did not test the reliability and accuracyof all of the data provided in the report. We used this list toestimate average contract cycle times from the purchaserequisition entry date to the purchase order print date for 66contracts. Although limited by the fact that some departmentsenter purchasing documents into IFAS at a different stage thanother departments, IFAS does provide a convenient measurementof overall cycle time.
We used contract documents, correspondence, and projecttracking logs to estimate cycle times for several activities within

- 3 -
the contracting process for 28 of the 66 contracts. We selectedthis limited sample of contracts based on availability of informationand type of contract.
We reviewed City manuals dealing with infrastructure contracts,reviewed previously prepared flowcharts dealing with variousfacets of the contracting process, and spoke with City staff toobtain information about phases of the contracting cycle. Weused this information to prepare flowcharts of the IFB and RFPcontracting processes.

- 4 -
- 5 -
ANALYSIS
Summary
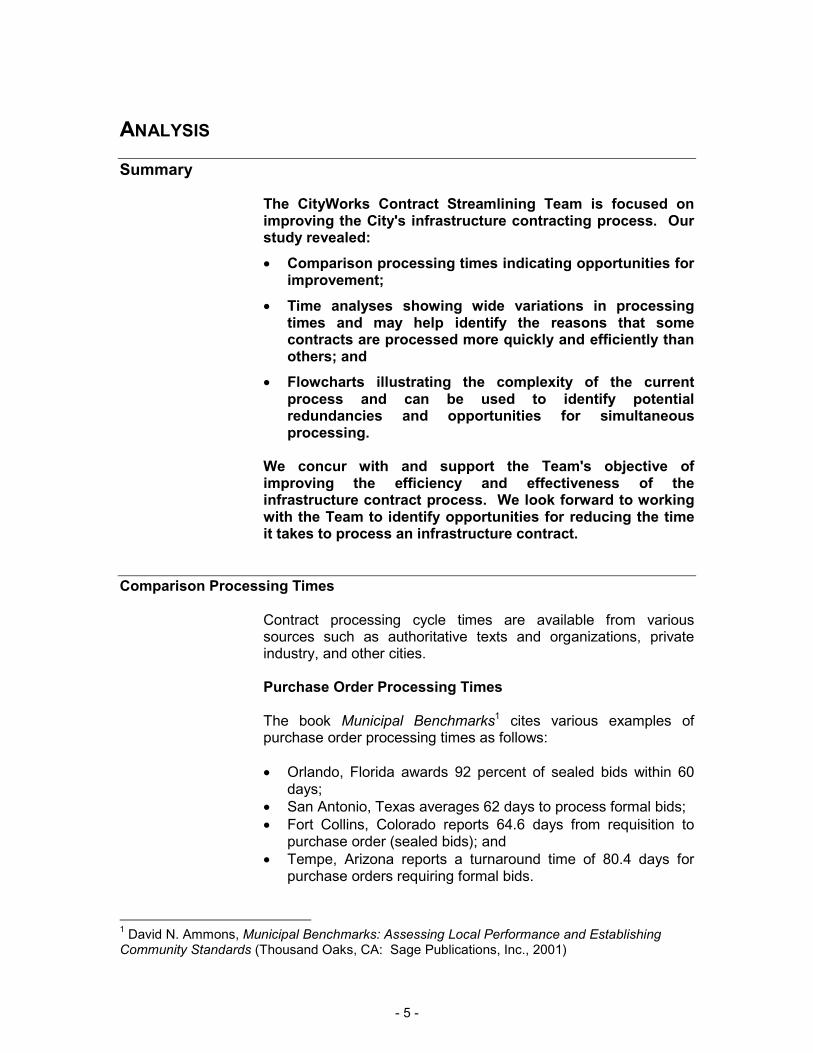
The CityWorks Contract Streamlining Team is focused onimproving the City's infrastructure contracting process. Ourstudy revealed:� Comparison processing times indicating opportunities for
improvement;� Time analyses showing wide variations in processing
times and may help identify the reasons that somecontracts are processed more quickly and efficiently thanothers; and
� Flowcharts illustrating the complexity of the currentprocess and can be used to identify potentialredundancies and opportunities for simultaneousprocessing.
We concur with and support the Team's objective ofimproving the efficiency and effectiveness of theinfrastructure contract process. We look forward to workingwith the Team to identify opportunities for reducing the timeit takes to process an infrastructure contract.
Comparison Processing Times
Contract processing cycle times are available from varioussources such as authoritative texts and organizations, privateindustry, and other cities.
Purchase Order Processing Times
The book Municipal Benchmarks1 cites various examples ofpurchase order processing times as follows:
� Orlando, Florida awards 92 percent of sealed bids within 60days;
� San Antonio, Texas averages 62 days to process formal bids;� Fort Collins, Colorado reports 64.6 days from requisition to
purchase order (sealed bids); and� Tempe, Arizona reports a turnaround time of 80.4 days for
purchase orders requiring formal bids.
1 David N. Ammons, Municipal Benchmarks: Assessing Local Performance and EstablishingCommunity Standards (Thousand Oaks, CA: Sage Publications, Inc., 2001)
- 6 -
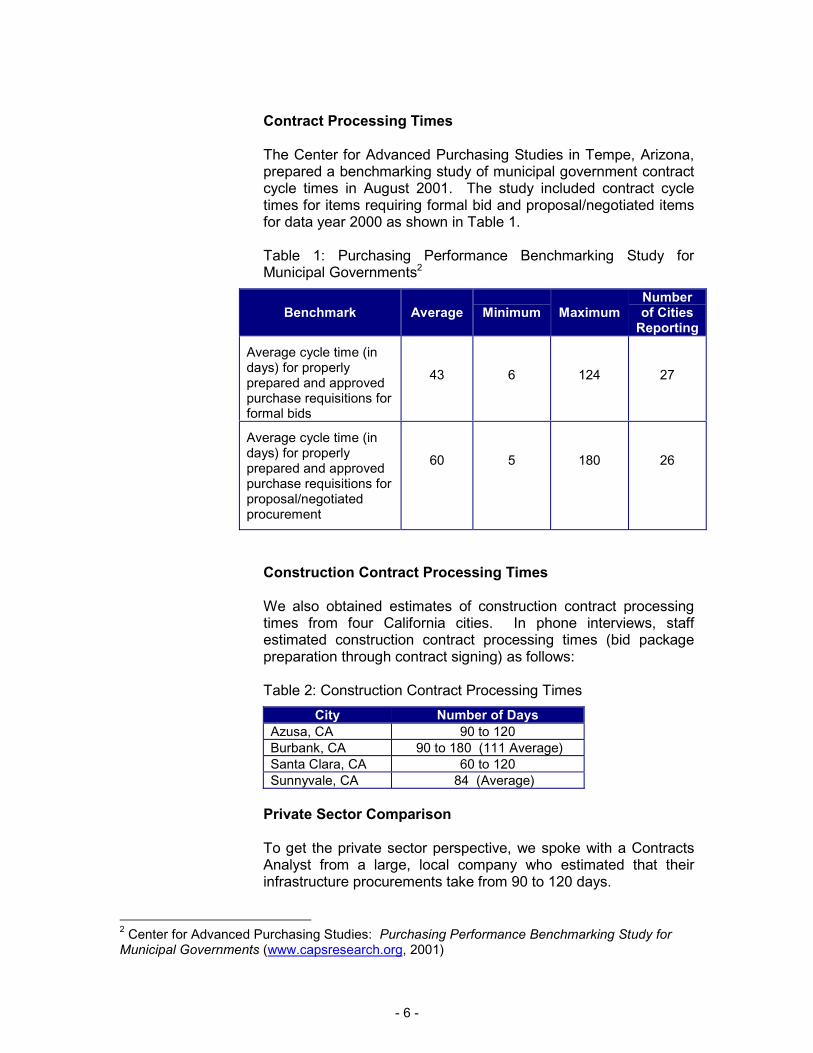
Contract Processing Times
The Center for Advanced Purchasing Studies in Tempe, Arizona,prepared a benchmarking study of municipal government contractcycle times in August 2001. The study included contract cycletimes for items requiring formal bid and proposal/negotiated itemsfor data year 2000 as shown in Table 1.
Table 1: Purchasing Performance Benchmarking Study forMunicipal Governments2
Benchmark Average Minimum MaximumNumberof Cities
Reporting
Average cycle time (indays) for properlyprepared and approvedpurchase requisitions forformal bids
43 6 124 27
Average cycle time (indays) for properlyprepared and approvedpurchase requisitions forproposal/negotiatedprocurement
60 5 180 26
Construction Contract Processing Times
We also obtained estimates of construction contract processingtimes from four California cities. In phone interviews, staffestimated construction contract processing times (bid packagepreparation through contract signing) as follows:
Table 2: Construction Contract Processing TimesCity Number of Days
Azusa, CA 90 to 120Burbank, CA 90 to 180 (111 Average)Santa Clara, CA 60 to 120Sunnyvale, CA 84 (Average)
Private Sector Comparison
To get the private sector perspective, we spoke with a ContractsAnalyst from a large, local company who estimated that theirinfrastructure procurements take from 90 to 120 days.
2 Center for Advanced Purchasing Studies: Purchasing Performance Benchmarking Study forMunicipal Governments (www.capsresearch.org, 2001)

- 7 -
Palo Alto’s Current Infrastructure Contract Processing Time
In comparison, we estimate Palo Alto’s median time3 forprocessing infrastructure contracts (from requisition to purchaseorder) is approximately 137 days. The average number of days is145. This estimate is based on a partial listing of 66 infrastructurecontracts finalized between July 2000 and December 2001 (seeAppendix A).
Average processing times in other municipalities generally rangedfrom 43 to 120 days, but did not indicate any one “best” time. Still,Palo Alto’s 137-day median time indicates that there is room forthe City to improve its cycle time for infrastructure contracts.
Time Analysis Demonstrates Wide Variation in Cycle Times
To help pinpoint the causes of long cycle times, we provided theTeam more details on 28 of the 66 contracts in our sample. Ouranalysis shows wide variations in elapsed times for the variousactivities within the IFB and RFP contracting processes, andindicates opportunities for improvement.
IFP Cycle Times
As shown in Table 3, total cycle time for our sample of 16 IFBcontracts ranged from 69 to 295 days, with an average cycle timeof 152 days. The processing times for eight activities within theIFB cycle varied widely.
Table 3: Invitation for Bid Activity Cycle Times (In Days)Description of Activity Average Range
Sample Contracts Processing Time 152 69 to 295
Activities:1. Assemble IFB (including contract) 21 1 to 552. Review of Bid Package 9 5 to 173. Complete IFB 10 0 to 274. Bid Open Period 26 18 to 395. Select and Approve Contractor 34 2 to 626. Secure Contract Requirements 32 2 to 777. Review and Signing of Contract 8 0 to 378. Final Signatures and Arrange for Start of Work 29 2 to 107
An examination of the averages and ranges reveals that somecontracts are moving quickly through some activities. Forexample, assembling the IFB (#1 above) took an average of 21
3 That is, half of the contracts were completed in less time and half the contracts took longer.
- 8 -
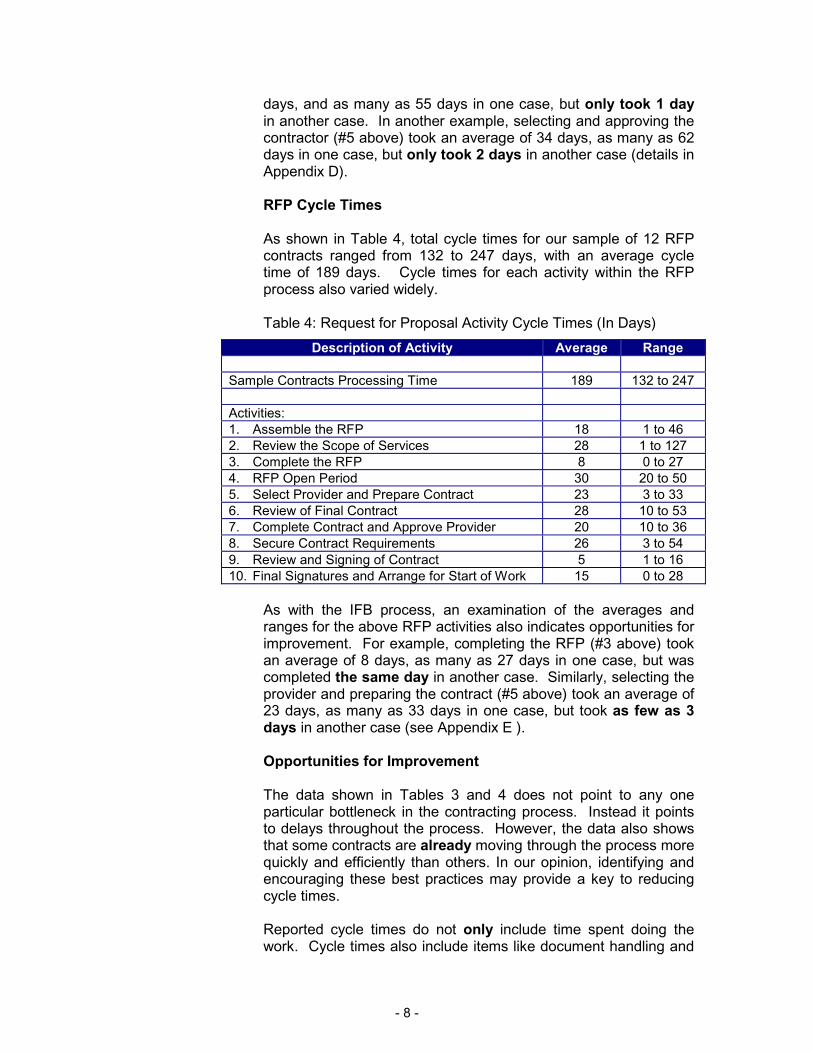
days, and as many as 55 days in one case, but only took 1 dayin another case. In another example, selecting and approving thecontractor (#5 above) took an average of 34 days, as many as 62days in one case, but only took 2 days in another case (details inAppendix D).
RFP Cycle Times
As shown in Table 4, total cycle times for our sample of 12 RFPcontracts ranged from 132 to 247 days, with an average cycletime of 189 days. Cycle times for each activity within the RFPprocess also varied widely.
Table 4: Request for Proposal Activity Cycle Times (In Days)Description of Activity Average Range
Sample Contracts Processing Time 189 132 to 247
Activities:1. Assemble the RFP 18 1 to 462. Review the Scope of Services 28 1 to 1273. Complete the RFP 8 0 to 274. RFP Open Period 30 20 to 505. Select Provider and Prepare Contract 23 3 to 336. Review of Final Contract 28 10 to 537. Complete Contract and Approve Provider 20 10 to 368. Secure Contract Requirements 26 3 to 549. Review and Signing of Contract 5 1 to 1610. Final Signatures and Arrange for Start of Work 15 0 to 28
As with the IFB process, an examination of the averages andranges for the above RFP activities also indicates opportunities forimprovement. For example, completing the RFP (#3 above) tookan average of 8 days, as many as 27 days in one case, but wascompleted the same day in another case. Similarly, selecting theprovider and preparing the contract (#5 above) took an average of23 days, as many as 33 days in one case, but took as few as 3days in another case (see Appendix E ).
Opportunities for Improvement
The data shown in Tables 3 and 4 does not point to any oneparticular bottleneck in the contracting process. Instead it pointsto delays throughout the process. However, the data also showsthat some contracts are already moving through the process morequickly and efficiently than others. In our opinion, identifying andencouraging these best practices may provide a key to reducingcycle times.
Reported cycle times do not only include time spent doing thework. Cycle times also include items like document handling and

- 9 -
delays due to staff workloads and rework. In our opinion, findingand targeting these delays will be another key factor insuccessfully reducing cycle time.
It should be noted that while the IFB “bid open period” averages26 days in our sample, it is not the major time driver in the IFBprocess. This is also true of the “RFP open period” (an average of30 days for these sample contracts) in the RFP process.
Flowcharts Demonstrate the Complexity of the Current Process
Process flowcharts can help pinpoint bottlenecks, identifyoverlooked or missing steps, and discover redundant orunnecessary steps in complex processes.4 The infrastructurecontracting process certainly meets the test for complexity.
Our flowchart of the IFB process (see Appendix B) includes 23steps for contracts over $25,000 and 38 steps for contracts over$65,000. The RFP process includes at least 25 steps forcontracts over $25,000 and 39 steps for contracts over $65,000(see Appendix C).
Not only do the flowcharts display the many steps in the process,they also show the involvement of City staff from multipledepartments. Specifically, the flowcharts show contractdocuments moving between the initiating department, Contractor,Purchasing Division, City Attorney’s Office, AdministrativeServices Department, City Manager’s Office, and the City Council.
In addition, some key players touch the contract documentsnumerous times. For example, the IFB flowcharts in Appendix Bshow 15 discrete steps for the project manager and 9 steps for thecontract manager shown in the IFB flowcharts in Appendix B. Inour opinion, the City’s contract processing times are proportionalto the number of steps and number of signoffs required. To theextent that the Team can identify potential redundancies andunnecessary handling and reviews, it will be able to reduce cycletimes.
The flowcharts show the current sequencing of tasks. Some tasksare performed simultaneously. However, most tasks areperformed sequentially. For example, the RFP contract signingprocess (shown in Appendix C) is sequential and involves 8 to 11steps. Using the flowcharts to identify opportunities forsimultaneous processing may help the Team reduce cycle times.
The flowcharts do not show rework – the additional steps requiredwhen contract documents are returned for correction or when
4 Robert Kreitner, Management (Boston, MA: Houghton Mifflin Company, 1989)

- 10 -
attachments are missing. Team members have already identifiedthat in these cases, proper preparation and knowledge of thecontracting process could reduce cycle times.
Conclusion
We hope the Team finds this information useful, and look forwardto working with the Team to improve and streamline theinfrastructure contracting processes.


