a study of effective practice in the teaching of reading ... · to adult learners, ... 3 local...
TRANSCRIPT

THE STUDY OF EFFECTIVE PRACTICE IN THE TEACHING OF READING TO ADULT LEARNERS, 2003-06
PROJECT PG3.9ESF OF THE NATIONAL RESEARCH AND DEVELOPMENT CENTRE
FOR ADULT LITERACY AND NUMERACY
Full report October 2013
Greg Brooks Maxine Burton
Pam Cole Marcin Szczerbiński
University of Sheffield

2
Contents
Page
List of Figures 4
List of Tables 5
Project team 7
Authorship 7
Note on timescale 7
Independent peer review 8
Authors’ acknowledgments 8
1 Executive summary Greg Brooks 9
2 Context: background, origin, aims and scope of the project Greg Brooks
13
2.1 The policy background 13
2.2 The five effective practice studies 13
2.3 Features of this study 14
2.4 Aims 14
2.5 Scope 16
2.6 Literature review 16
2.7 Brief account of method Pam Cole 21
2.8 Structure of this report 22
3 Local characteristics: the providers and settings Pam Cole 23
3.1 The providers 23
3.2 The settings 23
3.3 Special classes 24
4 The learners and their experience Greg Brooks 25
4.1 The learners 25
4.2 Note on ethnicity, nationality and language Celia Roberts 27
4.3 The learners’ previous experience of provision 28
4.4 Learners’ voices 28
4.5 Special learners 30
4.6 Returners, drop-outs and the representativeness of the retained sample 31
5 Learners’ progress Marcin Szczerbiński 32
5.1 Reading attainment across the three occasions 32
5.2 Error analysis Richard Finnigan 34
5.3 Exploring individual differences in changes in reading attainment 36
5.4 Attitudes questionnaire: descriptive statistics 47
5.5 Attitudes questionnaire: factor analysis 47
5.6 Attitudes questionnaire: trends over time on the three sections and overall

3
5.7 Correlations between attainment and attitudes 54
5.8 Attendance 56
5.9 Other provision attended 60
5.10 Learners’ progression 60
5.11 Summary 61
6 Teachers’ practice Maxine Burton 62
6.1 The teachers’ profiles 62
6.2 The teachers’ concerns 65
6.3 Issues arising from consultations 70
6.4 Classroom organisation 76
6.5 Patterns of classroom activity 82
6.5.1 Patterns of groupings and their implications Yvonne Spare 84
6.5.2 Patterns of classroom activity 2004/05 89
6.6 General teaching strategies and opportunities for learner involvement: descriptive statistics and correlations Marcin Szczerbiński
94
6.7 Specific teaching strategies: descriptive statistics Marcin Szczerbiński 95
6.8 Some specific teaching strategies illustrated and analysed 99
6.9 Summary 111
7 Teaching and learning Marcin Szczerbiński 113
7.1 Teachers’ profiles and changes in reading scores 113
7.2 Patterns of activity in class and changes in reading scores and attitudes 113
7.3 General teaching strategies and learner involvement and changes in reading scores
114
7.4 Class groupings and changes in reading scores 115
7.5 Specific teaching strategies and changes in reading scores 116
7.6 A case study of a class of adults with Down syndrome John Harman 117
7.7 Summary 118
8 Insights from the practitioner-researchers Maxine Burton 119
8.1 Origin and topics of individual analyses 119
8.2 The individual analyses 120
8.2.1 Teachers’ perceptions of learners’ progress and the impact of the Core Curriculum on the nature of this assessment Jan Wainwright
120
8.2.2 Writing which supports reading Colette Beazley 122
8.2.3 Observed use of ICT Judy Davey 124
8.3 Benefits to the practitioner-researchers’ professional development 130
8.4 Conclusions 135
9 Conclusions and implications Maxine Burton and Greg Brooks 136
9.1 Strengths 136
9.2 Findings 136
9.3 Limitations 137
9.4 Implications and recommendations 138

4
References 139
Appendix A: Full account of method 144
Appendix B: The research instruments 151
List of Figures
Page
Figure 5.1: Reading attainment at the three occasions, returners only, by year 32
Figure 5.2: Changes in learners’ attitudes, by cohort 50
Figure 5.3: Changes in learners’ self-confidence 51
Figure 5.4: Learners’ participation in literacy activities 52
Figure 5.5: Learners’ attitudes to literacy 53
Figure 5.6: Scattergrams of attendance vs change in reading scores, by cohort
54
Figure 6.1: Specific teaching strategies, five main categories 97

5
List of Tables
Page
Table 4.1: Background characteristics of the sample of learners 26
Table 4.2: Learners’ declared ethnicities 27
Table 4.3: Learners’ first languages other than English 28
Table 4.4: Length of time since last course 28
Table 5.1: Reading attainment at the three occasions, returners only, overall and by cohort
32
Table 5.2: Correlations in reading attainment between occasions 34
Table 5.3: Pre-test scores, by gender 36
Table 5.4: Post-test scores, overall and by cohort, by gender 37
Table 5.5: Changes in average scores between pre- and post-test, by gender and cohort and overall
37
Table 5.6: Average pre-test scores, by age-bands 38
Table 5.7: Average post-test scores, by age-bands 38
Table 5.8: Changes in average scores between pre- and post-test, by age bands
38
Table 5.9: Average pre-test scores, by English as first or additional language 39
Table 5.10: Average post-test scores, by English as first or additional language 39
Table 5.11: Changes in average scores between pre- and post-test, by English as first or additional language
39
Table 5.12: Average pre-test scores, by white vs other ethnicity 40
Table 5.13: Average post-test scores, by white vs other ethnicity 40
Table 5.14: Average pre-test scores, by occupational status 41
Table 5.15: Average post-test scores, by occupational status 41
Table 5.16: Changes in average scores between pre- and post-test, by occupational status
42
Table 5.17: Average pre-test scores, by educational qualifications 43
Table 5.18: Average post-test scores, by educational qualifications 43
Table 5.19: Changes in average scores between pre- and post-test, by educational qualifications
44
Table 5.20: Average pre-test scores, by time since last course 45
Table 5.21: Average post-test scores, by time since last course 45
Table 5.22: Average pre-test scores, by having dyslexia or not 46
Table 5.23: Average post-test scores, by having dyslexia or not 46
Table 5.24: Average pre-test scores, by having been diagnosed with dyslexia or not
46
Table 5.25: Average post-test scores, by having been diagnosed with dyslexia or not
47
Table 5.26: Averages scores and standard deviations for learner questionnaire responses, returners only (N=298)
48
Table 5.27: Changes in learners’ attitudes, by cohort 50
Table 5.28: Changes in learners’ self-confidence 51
Table 5.29: Learners’ participation in literacy activities 52

6
List of Tables, cont.
Table 5.30: Learners’ attitudes to literacy 53
Table 5.31: Correlations between questionnaire scores, and changes in them, and pre-test reading scores
54
Table 5.32: Correlations between questionnaire scores, and changes in them, and post-test reading scores
55
Table 5.33: Correlations between attitudes to literacy (and changes in them) and changes in reading scores
55
Table 5.34: Average change in reading scores by class, 2003/04 cohort 58
Table 5.35: Average change in reading scores by class, 2004/05 cohort 59
Table 5.36: Accredited qualification achieved, first cohort 60
Table 5.37: Further course of study, first cohort 60
Table 5.38: Summary of factors associated with change in reading attainment 61
Table 6.1: Profiles of the observed teachers 63
Table 6.2: Number of years of basic skills teaching experience 66
Table 6.3: Frequency of use of room layouts 2003-05 78
Table 6.4: Websites accessed for teaching materials 80
Table 6.5: Sources of paper-based materials 81
Table 6.6: Learner groupings in class, descriptive statistics 83
Table 6.7: General teaching strategies and opportunities for learner involvement, descriptive statistics
94
Table 6.8: Internal consistency of measures of general teaching strategies and opportunities for learner involvement
95
Table 6.9: Specific teaching strategies, descriptive statistics, each code 96
Table 6.10: Specific teaching strategies, descriptive statistics, five main categories
97
Table 6.11: Correlations between main categories of specific strategies 98
Table 6.12: Most commonly used specific teaching strategies 99
Table 7.1: Change in reading scores, by 3 class activity patterns 113
Table 7.2: Changes in attitudes, by 3 class activity patterns 114
Table 7.3: Correlations of general teaching strategies and opportunities for learner involvement with change in reading scores
115
Table 7.4: Correlations between class groupings and reading scores 115
Table 7.5: Correlations between main categories of specific teaching strategies and change in reading scores
116
Table 8.1: Outline data on the teachers 121
Table 8.2: Strategies in which writing supports reading 123
Table 8.3: Availability of ICT equipment 126
Table 8.4: Range of software observed in use 127

7
Project team All at University of Sheffield during the project All School of Education except Marcin Szczerbiński Professor Greg Brooks, project director (now Emeritus) Dr Maxine Burton, Research Fellow Pam Cole, Research Fellow Jacquie Gillott, project secretary Dr Sam Roberts, assistant project statistician (now at University of Chester) Dr Marcin Szczerbiński, Human Communication Sciences Department, project
statistician (now at University of Cork, Ireland) Practitioner-researchers, 2003/04:
Colette Beazley Judy Davey Richard Finnigan Yvonne Spare Jan Wainwright
Practitioner-researchers, 2004/05: The 2003/04 team, plus Gill Fuller John Harman Margaret Harman Liz Heydon Naomi Horrocks Gaye Houghton
Authorship See the list of Contents. Note on timescale The original version of this report was submitted to the then Department for Education and Skills in late 2006. From it were developed a shorter version and an even shorter summary, which were published in 2007 (Brooks et al., 2007a, b). In October 2013 it was decided to make the full report available on the NRDC website, and at that point Greg Brooks updated it, lightly and without attempting to note every development in the interim. Maxine Burton checked his updates. Meanwhile, some members of the project team carried out three associated projects:
- a randomised controlled trial evaluation of offering adult literacy learners a financial incentive to attend classes – this was built onto the second year of this project (Brooks et al., 2008);
- an evaluation of three promising strategies for improving adult learners’ reading, spelling and writing of which very little evidence had been seen during this project and the parallel one on writing (Grief et al., 2007), namely phonics, oral reading fluency, and sentence combining for improving writing (see Burton et al., 2008, 2010)’
- production of a guide to the phonetic knowledge needed to underpin accurate phonics teaching (Burton, 2011).

8
Independent peer review The report was read and independently peer-reviewed by (to be confirmed). N.B. PEER-REVIEWERS ARE NAMED IN THE 2007 VERSION – DO WE NEED MORE? Authors’ acknowledgments We wish to express our deep gratitude to:
– the Skills for Life Strategy Unit within the Department for Education and Skills, for funding the project as part of match-funding for European Social Fund funding of other NRDC projects;
– the project secretary, Jacquie Gillott, for superb efficiency in every respect and in particular for creating and maintaining the project’s large databases
– Anne Kispal of the National Foundation for Educational Research, Slough, for marking all the reading assessments in 2004/05;
– our Sheffield colleague Sammy Rashid for providing the LSC data in Table 4.1;
– Celia Roberts, for contributing the text of section 4.2;
and above all
– all the teachers and learners who agreed to participate and be observed. Without their cooperation this study would of course have been impossible, and we hope that they and/or their successors will benefit from it.

9
THE UNIVERSITY OF SHEFFIELD/NRDC STUDY OF EFFECTIVE PRACTICE IN THE TEACHING OF READING TO ADULT LEARNERS, 2003-06 (PG3.9ESF)
Final report, October 2013 1. Executive summary Greg Brooks Structure of the project This was a correlational study. Adult learners’ attainment in and attitudes to reading were assessed, and the strategies their teachers used were observed. The aim was to correlate learners’ progress in reading and changes in their attitudes with their teachers’ strategies, and thus get some purchase on what enables learners to make progress and/or develop more positive attitudes. The design required an achieved sample of learners of about 250; given the usual rate of drop-out from adult literacy provision the target for initial recruitment was set at 500. Data-gathering There were two cohorts of learners, in academic years 2003/04 and 2004/05. Each cohort was assessed at three points, pre, mid and post. The purpose of assessing at three points was to strengthen the statistical analyses. Five practitioner-researchers (fieldworkers) and one of the Research Fellows gathered data in 2003/04, and they were joined by six more fieldworkers in 2004/05. In total, they recruited 454 learners in 59 classes (an average of 7.7 per class). The research settings were mainly in the East Midlands and North of England, in an area bounded by Liverpool, Chorley, Leeds, Louth in Lincolnshire, and Swadlincote in Derbyshire; there were three outlying classes, two in Norfolk and one in West Sussex. The classes consisted of 34 provided by Colleges of Further Education (FE), 19 provided by Local Education Authorities (LEAs), three provided by a charity, 2 run by private Training Providers, and one in a prison. All 454 learners completed a consent form, a learner profile and a pre-questionnaire on attitudes to literacy, and 440 completed a reading pre-assessment. Across the two years, 338 learners (74%) of those recruited returned for the mid-assessment and 322 (71%) for the post-assessment, and full data (profile, and both reading assessment and attitudes questionnaire on all three occasions) were obtained on 298 (66%). Thus the good retention rate compensated for the initial recruitment being below target, and the final achieved sample was significantly above target. The instruments used to assess reading on five of the six occasions (that is, all except the pre assessment in the first year) were the Go! suite of tests produced for NRDC by the National Foundation for Educational Research in 2003. These were still being developed at the time of the pre assessment in the first year of the project, and a pilot version was therefore used then. This is thought to account for the discrepancy in the results between the two years mentioned under Main findings below.
10
Comparison of the profiles, pre questionnaire responses and pre assessment results of the learners for whom full data were obtained (‘returners’) against those who dropped out showed no statistically significant differences – the returners were therefore fully representative of the original sample. In each class, four observations were carried out between the pre- and mid-assessments, the majority being of 2 hours’ duration; the total number of observations was 236. Because some tutors were involved in both years and/or taught more than one observed class in the same year, the total number of tutors involved was 47. Almost all tutors involved answered questions on lesson planning and learners’ progress at each observation, and at the mid-assessment some further questions were asked of them about their qualifications, experience, and teaching approach and philosophy. At the end of each year they also provided information on their learners’ progression to further courses, etc. Data analysis The raw scores on the reading assessment for all three occasions were converted to scaled (‘standardised’) scores and National Standards levels. For each class observed, teaching strategies were analysed, both general (following the model used in a study of adult ESOL learners in the USA), and specific, using 54 coded strategies for teaching reading. One of the 2003/04 fieldworkers carried out a quantitative error analysis of the pre-assessments – see section 5.2, and the other four wrote qualitative analyses of various aspects of the observation data – see chapters 6 and 8. Main findings The sample of learners seemed quite representative of the national distribution. Analysis of the reading assessment data showed no statistically significant differences between the three occasions of assessment overall, and no significant differences between mid and post in either year. However, in 2003/04 there was a statistically significant fall between pre and mid, and in 2004/05 a statistically significant gain between pre and mid. The reason for the discrepancy between the two cohorts is probably the fact that the instrument used at the pre assessment in the first year was the pilot version of the test; it follows that the improvement detected in the second year is probably a more reliable finding. Statistical tests of the attitudes questionnaire data for the three occasions for the returners showed a small but significant increase in self-confidence (the first section of the questionnaire), but not on the other sections (frequency of a few literacy-related habits, attitudes to literacy properly so called).
11
The 20 general teaching strategies were so highly inter-correlated that they could be considered as measuring one main facet, quality of teaching. The most frequent patterns of classroom activity were (a) whole-class opening section followed by individual practice; (b) all individual work. Both entailed learners working alone for substantial amounts of time – and indeed this was found to be the most frequent specific teaching strategy. Other very frequent strategies were giving appraisal/feedback immediately, discussion of vocabulary during a reading, other word study (e.g. word lists, puzzles, word searches), and using a dictionary to find word meanings. However, active reading tuition (i.e. excluding time which learners spent reading silently) occupied less than half the class time, on average. Factors that were not found to be significantly related to change in reading attainment were: learner’s age, English as L1 or L2, ethnicity, age of leaving full-time education, time since last course, having dyslexia, having a formal diagnosis of dyslexia, attending other provision, scores at pre-test, growth in self-confidence (even though this was significant in itself), the teachers’ qualifications or length of experience, frequency of the few literacy activities investigated, overall quality of the teaching as measured, classroom activity patterns (all individual vs all whole-class + individual vs mixed patterns). The few factors that were found to be significantly related to change in reading (but the correlations were always weak and not always consistent across cohorts) were:
Gender (women made slightly better progress than men), employment status (employed people made better progress than the unemployed) and possession of formal qualifications (people with an FE/NVQ qualification made better progress than those with no qualifications), having more positive attitudes to literacy to start with. However, since these are outside teachers’ control they provide no guidance for practice.
Regular attendance – but this effect was very weak.
Learners who spent more time working in pairs made better progress.
Learners who spent less time working alone made better progress. Although few positive correlations were found, this must not detract from the fact that the database this project created is a valuable research resource, in that it is the largest amount of data collected to date on adult literacy in England and representative of the range of learners and classes. The effect of capacity-building in the field was also an important benefit.

12
Implications and recommendations For policy and practice Few strong implications for policy and teaching practice emerged, but the following tentative recommendations seem justified:
The intensity of provision should be increased so that learners can attend for more hours.
The amount of time learners spend working alone should be reduced.
At the policy level, the clearest way to achieve that would be to increase staffing levels and thus lower learner:staff ratios.
At the level of classroom practice, the most practicable ways to reduce the amount of time learners spend working alone would be to increase whole-class work and opportunities for learners to work in pairs, e.g. in a buddy system.
For research Before changes in policy and practice are adopted, more rigorous research into their putative benefits should be conducted. In particular, comparisons between intensive courses and the typical pattern of extended provision, between large and small amounts of whole-class teaching, and between more and less time spent working alone should be carried out. Finally, the analysis of the current limitations of phonics teaching in adult literacy would suggest that a detailed development and research project needs to be carried out on this possibly promising aspect of pedagogy (for the outcomes of this recommendation see Burton, 2011 and Burton et al., 20008, 2010).

13
Chapter 2 Context: background, origin, aims and scope of the project
Greg Brooks
2.1 The policy background In most English-speaking countries there is currently considerable turmoil in the field of adult literacy. Rather high proportions of adults are thought to have less than functional literacy (see section 2.6) – for England the Moser committee settled on an averaged figure of about 20 per cent, or about 7 million people (GB. DfEE, 1999) – and in some countries there is evidence that average progress is modest: for England and Wales see Progress in Adult Literacy (Brooks et al., 2001a), for the USA see Beder (1999) and Sticht and Armstrong (1994) (both summarised in Brooks et al., 2001b: 115-9), and for similar recent data Brooks (2011) and the Survey of Adult Skills (PIAAC) (OECD, 2013). In England, the British government’s response was to establish the Skills for Life initiative (GB. DfEE, 2001), with an unprecedented budget for this field and targets for increasing adult literacy, language and numeracy enrolments and qualifications by 2004, 2007 and 2010. Within Skills for Life the government also established the National Research and Development Centre for adult literacy and numeracy (NRDC). Since Brooks et al. (2001b) had also shown that rather little was firmly known from research about effective pedagogy (see again section 2.6), part of NRDC’s remit was a focus on effective practice. 2.2 The five effective practice studies The project reported here was conducted as part of the research agenda developed by NRDC. The project was one of a suite of four which had the common aim of investigating effective teaching of literacy, language and numeracy to adults. Adult learners were defined for this purpose as those (mainly over 19) seeking primarily to improve their literacy, language or numeracy, and not those young people pursuing mainly GCSE courses in the further education sector. The areas which the four projects covered, and the organisations which conducted them, were:
Reading University of Sheffield Writing Learning and Skills Development Agency English for speakers of other
languages (ESOL) University of Leeds and King’s College London Numeracy King’s College London.
There was also a fifth project which covered information and communications technology (ICT); this was conducted by the Institute of Education, University of London. That project differed from the others in that its first phase was developmental, rather than evaluative; as a consequence, only the second phase of its data-gathering resembled that of the four projects listed above, and its final sample size was smaller. Also, it had a shorter timescale, being completed in March 2005.

14
The other four projects all began in July 2003 and were completed in March 2006. The motives for them were the questions posed in NRDC’s Strategy, published in July 2003 (NRDC, 2003: 30):
How can teaching, learning and assessing literacy, numeracy and ESOL be improved?
What factors contribute to successful learning? Even before NRDC was set up it was apparent from reviews of the field (Brooks et al., 2001b; Kruidenier, 2002) that rather little reliable research-based evidence existed to answer these questions, and various NRDC reviews showed that progress in amassing such evidence, though welcome where it was occurring, was slow (Coben et al., 2003; Barton and Pitt, 2003; Torgerson et al., 2003, 2004, 2005). Four preliminary studies, on reading, writing, ESOL and ICT, were undertaken by NRDC between 2002 and 2004 (Besser et al., 2004; Kelly et al., 2004; Roberts et al., 2004; Mellar et al., 2004, respectively). However, NRDC recognised a need to build on these to expand the research base on the practice of teaching these subjects and therefore the information available to policy-makers and professionals, both teachers and trainers. The inspiration for the design of the reading, writing, ESOL and numeracy projects, and the second year of the ICT project, was a US study of the teaching of literacy and English language to adult learners for whom English is an additional language (Condelli et al., 2003). The goal of that study too was not merely to be descriptive but also to try to identify ‘what works’. The projects were carried out in two phases, in academic years 2003/04 and 2004/05. The targets across the two years were to recruit and gather background data on about 250 learners, assess their attainment and attitudes at two points during the year in which they were participating in the study, interview both learners and teachers, observe the strategies the teachers used, and correlate those strategies with changes in the learners’ attainment and attitudes. 2.3 Features of this study The reading study largely conformed to the generic description just given, except that: - the learners were assessed at three points (described as pre, mid and post) instead of two. The purpose of assessing at three points was to strengthen the statistical analyses. This was also a feature of the Condelli et al. study in the USA; - no interviews with learners were conducted. This was because in-depth information had been gathered from learners in the preliminary study (Besser et al., 2004) and because the resource was put into the extra assessment. 2.4 Aims The overall aim of the reading study was to gain some purchase on what enables learners to make progress and/or develop more positive attitudes.

15
The specific aims were to: a) establish, from the literature and from the preceding investigation of adult learners’
difficulties in reading (Besser et al., 2004), what were currently held to be effective pedagogical practices in teaching reading in adult literacy provision, as a basis for the observation of practice
b) investigate in depth
(1) the range of pedagogical practices which occur ‘naturally’, that is in the normal course of events and not as part of intervention studies, in the teaching of reading to adult learners in England
(2) changes in adult learners’ attainment in and attitudes to reading over the course of an academic year, and
(3) the correlation between the different pedagogical practices and any such changes,
and from theory and the findings to
c) identify possible gaps in the pedagogical repertoire (e.g. is account taken in adult literacy of the school-level evidence on the teaching of phonics?)
d) make recommendations to the profession about effective practices and undertake detailed communication of the findings to teacher trainers for maximum impact
e) generate hypotheses for investigation in intervention studies. More specifically, the project’s research questions were:
What is the range of naturally occurring variation in the teaching of reading to adult learners in England, and what are the correlations between different practices and changes in learners’ attainment and attitudes?
What are the implications of this for teaching, initial teacher training and CPD, for employability, and for policy?
Thus for the purposes of this study, the following working definitions were used:
Effectiveness: enabling learners to make progress in reading and/or improve their self-confidence and/or attitudes to literacy and/or progress to further study; Assessing effectiveness: identifying significant progress in reading and/or improved self-confidence and/or attitudes to literacy and/or progress to other study; Identifying effective practice: finding factors which correlate significantly with the above;
16
Identifying promising practice: finding factors which are less significantly correlated with the above and/or are suggested by professional knowledge (of researchers and/or practitioners).
2.5 Scope This report covers both phases of the project, and they are mentioned separately only where details differed. The statistical design required an achieved sample of learners of about 250; given the usual rate of drop-out from adult literacy provision the target for initial recruitment was set at 500. Five practitioner-researchers (fieldworkers) and one of the Research Fellows gathered data in 2003/04, and they were joined by six more fieldworkers in 2004/05. In total, they recruited 454 learners in 59 classes (an average of 7.7 per class). All 454 learners completed a consent form, a learner profile and a pre-questionnaire on attitudes to literacy, and 440 completed a reading pre-assessment. Across the two years, 338 learners (74%) of all those recruited returned for the mid-assessment and 322 (71%) for the post-assessment, and full data (profile, and both attitudes questionnaire and reading assessment on all three occasions) were obtained on 298 (66%). Thus the good retention rate compensated for the initial recruitment being below target, and the final achieved sample was significantly above target. 2.6 Literature review This review of the literature on teaching reading to adult learners is brief because the literature is fairly scanty and because two comprehensive reviews were carried out only a few years ago. The literature on adult basic skills generally was reviewed by Brooks et al. (2001b). They found that the only area which had been thoroughly covered in England was surveys of the scale of need; there had been one survey of adults’ reading levels in 1972 and five in the 1990s. Though the tests and samples differed widely, the general conclusions were that very few adults could be considered illiterate, but many had less than functional literacy (defined as below Level 1) – possibly as many as 20 per cent, or about 7 million, the figure the Moser committee settled on. In the present decade there have been two further such surveys. The 2004 sweep of the British Cohort Study 1970 (Bynner and Parsons, 2006) found that little had changed in the skills levels of their study cohort. The 2002/03 Skills for Life survey (Williams et al., 2003) suggested that about 16 per cent, or about 5.8 million, adults in England had reading attainment below Level 1; the discrepancy from the Moser figure may be due simply to different tests having been used. There have been two more recent surveys. The second Skills for Life survey in 2010-11 (BIS, 2011) found almost no change from the first; and the Survey of Adult Skills (PIAAC) (OECD, 2013) found only a slight improvement since the International Adult Literacy Survey (IALS), in which Britain took part in 1996.

17
Brooks et al. (2001b) also found that there had been only two national surveys of adult learners’ progress in literacy in England, one in 1976-79, the other in 1998-99; neither had attempted to correlate progress in attainment with strategies for teaching (though the latter did have a few other correlational findings – see below). Brooks et al. found almost no information on what adult literacy teaching was actually like on the ground. A first attempt to fill that gap was made in Besser et al.’s (2004) exploratory study for NRDC of 53 adult literacy learners’ difficulties in reading. They found that a wide range of strategies was being used to address the issue, but there appeared to be a less than perfect match between learners’ difficulties and pedagogy. Whilst teaching was observed that targeted some of the identified difficulties, intensive, focused reading instruction did not comprise a significant amount of the teaching that occurred during the sessions. In particular, rather little work at sentence level or on comprehension beyond the literal was seen. Despite extensive recent research in Britain and elsewhere on the phonological aspects of literacy at school level, no research was found which addressed this area with adult learners. The assessment data showed that most of these learners had poor phonological awareness. In the observation data, much of the phonics teaching was done on the spur of the moment, and there were instances of tutors’ inadequate grasp of phonetics leading to inaccurate phonics teaching. Besser et al.’s coding frame for analysing their observation data was used as the basis for the coding frame in this study. Meanwhile, Kruidenier (2002) in the USA had produced a large review focusing on adults’ reading skills. Because the literature on adults’ reading was so scanty, he also used findings from school-level research. In the summary of his conclusions given below, only the more reliable findings from adult-level research are listed. Other relevant work has been appearing from NRDC. Brooks et al.’s (2005) review of assessment instruments for adult literacy and numeracy used in Britain was a useful addition to the literature as there had been no previous thorough review of assessment instruments. Very thorough systematic reviews of randomised and non-randomised trials in adult literacy (and numeracy) were carried out by Torgerson et al. (2003, 2004, 2005); their conclusions are summarised below. But what works? That is, what does the available evidence say about effective pedagogy, and how reliable are the methods on which the findings are based? What counts as evidence depends on what the research question is. If the research question is ‘What factors in teaching cause learners to make progress in learning?’, only randomised controlled trials (RCTs) have the potential to provide robust evidence. This is because only RCTs purport to control all possible extraneous causes of measured progress. It is still legitimate, however, to ask what findings can be derived from other forms of evidence addressing different research questions in the field, for example:
‘What factors in teaching adult literacy and numeracy are known to correlate with better progress in learning?’

18
‘What evidence is there that ICT enables adults to make better progress?’
‘How much instructional time do learners need to make educationally significant progress?’
Findings from randomised and other controlled trials This section is based entirely on the systematic reviews carried out by Torgerson et al. (2003, 2004, 2005), plus the RCT carried out by Brooks et al. (2008). Torgerson et al. found just enough evidence (all of it from the USA) to demonstrate rigorously in a meta-analysis that receiving adult literacy (and numeracy) tuition does produce more progress than not receiving it. Though this finding is intuitively obvious, this was the first time it had been rigorously demonstrated. If the finding had not been positive, questions would have had to be raised about whether provision should continue. Among the studies covered in the systematic reviews were several that had individual positive findings:
Reciprocal teaching (see Palincsar, 1982, 1986; Palincsar and Brown, 1984) had positive effects on reading comprehension (Rich and Shepherd, 1993).
A ‘diagnostic prescriptive’ approach had positive effects on reading comprehension, but not on word identification (Cheek and Lindsey, 1994). The approach involved formal and informal diagnostic procedures to identify adults’ strengths and weaknesses, and use of the diagnoses to develop individual educational prescriptions.
For inmates at a US prison, a ‘community-building group process’ accompanied by the SRA reading programme had a positive effect on reading (Roberts and Cheek, 1994). This appears to parallel the finding at school level in Britain that working on children’s self-esteem and reading in parallel has definite potential (see Lawrence, 1985, 1988, and summary in Brooks, 2002).
However, if these positive findings from single trials are accepted, there is also one negative finding that should also be accepted. In this study there was a statistically significant advantage for the control group, that is, the intervention had the opposite of the intended effect:
The aim of the study (Dietrich, 1994) was to investigate the effectiveness of auditory perception training on the reading ability of adult poor readers at a community college. The experimental group received a phonological skills approach, while the control group received a traditional metacognitive approach. The results showed no difference on an auditory perception test or a word naming test, but the control group made more progress on a word identification test. Since the auditory test results suggested that auditory perception training was ineffective, perhaps the negative result for word naming meant that the control group were making better use of the time available.
19
Brooks et al. (2008) carried out an RCT evaluating the effect on attendance and reading attainment of offering adult literacy learners an incentive to attend. The trial was in fact built on top of second half of the second year of the effective practice study reported here, but did not interfere with that study and was funded separately (by the University of Sheffield). There was no effect on attainment, but learners receiving the incentive attended on average 1.5 sessions fewer than those not receiving it; that is, the incentive had a perverse effect. This is consistent with other findings that offering a reward to undertake an activity that participants are already intrinsically motivated to undertake is liable to reduce their involvement in it. Factors that are known to correlate with better progress Sticht et al. (1987) reported on the US Army’s Functional Literacy (FLIT) programme and related programmes for the National Guard and Air Force in the early 1970s. These all focused on training job-related reading quickly (the average programme length was six weeks), and produced not only greater gains for job-related reading than either no literacy training or general literacy programmes, but also gains in general reading that were (of course) greater than from no literacy training and, more significantly, on average better than those delivered by general literacy programmes (see Sticht et al., 1987: 113-8, giving data on over 3,000 participants). The only workplace study in the UK so far (Wolf and Evans, 2011) found little progress – but the courses were only funded for 30 hours, and were therefore too short to have much impact. An early piece of research commissioned by the Basic Skills Agency (BSA, 1997) found that, in further education, the provision of basic skills support reduced drop-out rates and increased completion rates. The BSA summed up its views on programmes that are most effective in enabling adults to improve their basic skills in its booklet Effective Basic Skills Teaching for Adults (BSA, 2000, especially p.11). Of the various factors listed, two seem to be strongly based on quantitative empirical evidence, namely that effective programmes:
have high expectations of learners’ achievements;
enable learners to gain credit and accreditation for their learning and enable them to move into further study if they so desire.
Brooks et al. (2001a) carried out a large-scale study for the BSA of the progress in literacy made by adult learners in England and Wales. Average progress in reading was slow and modest, and in writing almost non-existent. Factors associated with better progress in reading (none were found for writing) were:
All the tutors in an area having qualified teacher status;
Tutors having assistance in the classroom;
Regular attendance by learners.

20
Kruidenier’s (2002) highly detailed US review of research on reading in adult literacy listed dozens of findings. He distinguished between ‘principles’ based on ‘more than one’ experimental study and ‘trends’ based on only one study or on indirect evidence (mainly from school-level research). Here only the principles based on adult-level research are listed. They are reproduced verbatim, hence the tentative tone:
Phonemic awareness and/or word analysis instruction may lead to increased achievement in other aspects of reading for adult beginning readers.
Word analysis may be taught using approaches that include direct instruction in word analysis along with instruction in other aspects of reading.
Fluency [in this context, ‘fluency’ means greater speed in reading aloud] may be taught to adult basic education students and fluency practice may lead to increases in reading achievement.
Fluency may be taught using approaches that include the repeated reading of passages of text, words from texts, and other text units.
Providing explicit instruction in reading comprehension strategies may lead to increased reading comprehension achievement.
Combining comprehension instruction with instruction in various other components of reading may lead to increased reading comprehension achievement.
What evidence is there that ICT enables adults to make better progress? A pioneering US systematic review (Rachal, 1995) comparing computer-assisted and traditional approaches in adult reading achievement included 21 studies dated between 1979 and 1995, and found no convincing evidence of benefits from ICT over conventional instruction. Information and communications technology did show some benefit for learners at entry levels 2 and 3 in a study in England conducted for Ufi (Mellar and Kambouri, 2001) – but this was a single-group pre-test/post-test study. In Torgerson et al.’s systematic review of RCTs, a meta-analysis of the two relevant studies showed no benefit of ICT over conventional instruction. Apparently on the basis of the same two US RCTs (both conducted, as it happens, in prisons), Kruidenier (2002) expressed the finding more optimistically as: ‘In general, computer-assisted instruction (CAI) is at least as effective as non-CAI in increasing reading comprehension achievement.’ In total, Torgerson et al.’s two systematic reviews found three RCTs and 16 other controlled trials relevant to ICT and adult literacy and/or numeracy. All three RCTs (one of which was not used in the meta-analysis because its subjects were not prisoners) had non-significant results. Of the 16 controlled trials, three had no clear result, seven were non-significant, and four had at least one statistically significant finding in favour of ICT,

21
but two had statistically significant results in favour of the traditionally taught control group, that is, against the use of ICT. The evidence can be summed up by saying that there is no convincing evidence of benefits from ICT over conventional instruction. How much instructional time do learners need to make educationally significant progress? John Vorhaus, in his review for BIS (2009: 16), summarised the evidence as follows:
[T]here is a growing body of evidence relating … length of courses … to learner progress and skill development. The evidence strongly suggests that length and intensity of course, together with related patterns of learning, are significant determinants of progress and skill development.
However, it remains true, as we implied in the 2006 paragraph which this replaces, that many learners stay in provision for too few hours in a year to make significant progress. 2.7 Brief account of method Pam Cole (A fuller account of the methods used is given in the Appendices.) This was a correlational study. The aim was to correlate learners’ progress in reading and changes in their attitudes with their teachers’ strategies, and thus get some purchase on what enables learners to make progress and/or develop more positive attitudes. Adult learners’ attainment in and attitudes to reading were assessed three times (usually once per term during an academic year), and between the first two assessments the strategies their teachers used were observed. The reading assessment tool used was specifically designed for NRDC. The reading items are a mixture of multiple-choice and open-ended (‘supply’) types of question. Each of the three assessments also included an attitudes questionnaire. This contained questions on:
learner’s self-confidence in various language-, literacy- and learning-related situations (10 items)
the frequency with which the learner engaged in a few literacy activities (4 items)
the learner’s attitudes properly so called to some literacy activities (7 items). In addition a learner profile (e.g. age, etc.) and a learner consent form were completed by learners at the start. Information was also gathered from the tutors on their teaching background, aims for the session and, when this was known, progression data on learners. Across the two years, 454 learners were recruited in 59 classes (an average of 7.7 per class). Full data were obtained from 298 learners (66% of those initially recruited).

22
Four observations per class of the teaching and learning activities in the adult literacy classes from which our adult learners were drawn were carried out. The observations involved:
Background information on the session and on the learners:
o the physical circumstances, who was present (including any volunteers or assistants)
o the layout of the room
o information gathered from the teacher beforehand about the aims of the session, etc.
o information gathered from the teacher afterwards about how the session went
A timed log. This sought to capture as many as possible of the teacher’s teaching strategies and of the learners’ activities as they occurred. It covered, among other things:
o whole class, small group and individual formats, and changes between these
o the content and style of the teaching
o whether individual learners or small groups received help from the teacher or others present
o the materials used (copies of which were acquired whenever possible)
o the time spent on each activity, logged to the minute as far as possible.
An analysis of the session against a classification of teaching strategies and activities. The observations were coded into general and specific strategies. There were 19 codes for general strategies and 54 for specific strategies.
The majority of the classes were of 2 hours duration. Since 59 classes were observed four times each, approximately 472 hours of classroom observation were achieved. The methods used to analyse the data are described at the appropriate points in the report. 2.8 Structure of this report The characteristics of the providers and settings are described in chapter 3, and those of the sample of learners in chapter 4. Chapter 5 presents the findings on the learners’ attainment and attitudes at each assessment point, the correlation between attainment and attitudes, trends across assessment points, and supplementary detail on learners’ attendance, other provision they were attending, and their progression to further study, etc. In chapter 6 details are given of the teachers’ practices, both as described by them and as observed. Chapter 7 contains the nub of the quantitative data – an analysis of the correlations between the observational data, etc., and changes in attainment and attitudes. Chapter 8 contains the practitioner-researchers’ qualitative analyses of the observational findings. Conclusions and implications are stated in chapter 9. A fuller account of method is given in the Appendices.
23
Chapter 3 Local characteristics – the providers and the settings
Pam Cole 3.1 The providers Conceptually, the providers of adult literacy classes can be divided into two categories, those who commission classes and those who deliver them, i.e. provide the staff to teach them. However, for 57 of our classes these were the same. The two instances where they were different were: a course in a prison commissioned by the prison but delivered by an FE College, and one LEA course, also delivered by an FE College. Thus the 59 courses in this study were commissioned as follows:
34 by FE Colleges (of which 1 was learndirect) 19 by LEAs (including one delivered by FE) 3 by a charity 2 by training providers 1 by a prison (delivered by FE).
At least 24 classes were designated as Adult and Community Learning, but this category cut across the rest, and it was not possible to determine the exact number of classes that met this description. Overall, the classes were fairly representative of mainstream adult literacy provision, but not of the full range. For instance, there were no classes in workplaces or Young Offender Institutions, and only one in a prison. 3.2 The settings All 59 classes were held in England. Because the study was directed in Sheffield, and in order to avoid clashes with other NRDC projects, in 2003 recruitment was confined to the East Midlands and the north of England, in an area bounded by Trafford, Leeds, Louth in Lincolnshire, and Swadlincote in Derbyshire. In 2004 the range was extended so that the main area was now bounded by Liverpool, Chorley, Leeds, Louth and Swadlincote; there were also three outlying classes, two in Norfolk and one in West Sussex. Most of the classes were in urban or suburban settings, but some were in small towns or rural areas. Of the 59 observed courses, 39 were held in the daytime and 20 in the evening. The classes were held in a wide variety of venues, with FE main college sites and FE ‘other sites’ providing the majority, followed by LEA adult education centres. However, there were also community centres, schools (both primary and secondary); outreach and drop-in centres; libraries (both local and college); training provider premises; private premises (offices); a prison study centre; and a secure private residential establishment (mental health).

24
Several classes (again, it was not possible to determine the exact number) in FE were basic skills support for FE students, the rest dedicated provision. 3.3 Special classes Most of the courses were ‘single purpose’, i.e. adult literacy classes. However, eight were ‘integrated’ courses, i.e. they included another subject as well as literacy. The most common was numeracy (4), one was labelled ‘financial literacy’, two focused on ICT as well as literacy, and another was an art class with ‘literacy support’ – the teacher brought art into the literacy class and there was a ‘real buzz’, the fieldworker said. Of these eight courses, four had separate sessions for literacy and the other four had mixed sessions, i.e. the class involved the other subject being taught in that class. Unfortunately, there were too few such integrated classes to be analysed separately. For special learners, see section 4.5.

25
Chapter 4 The learners and their experience
Greg Brooks 4.1 The learners This chapter looks first at the characteristics of the learners, and then at the representativeness of the sample. Salient characteristics of the 454 learners who formed the initial sample are shown in Table 4.1. Comparisons with national Learning and Skills Council (LSC) adult literacy data for 2003/04 (the year when the first phase of this study was carried out) are included, but learners studying for GCSE English or key skills qualifications have been excluded. This is because very few learners in this study were in that category, most of those in that category were under 20, and to have included them would have skewed the comparison with the present sample. LSC data for 2004/05 were not yet fully available at the original time of writing, but would probably have shown very similar percentages to those for 2003/04. Not all the cells in Table 4.1 are filled because the present study collected more detailed data than LSC. The gender balance in this study was quite similar to the national picture; in broad terms, so was the age distribution, except that nationally there were more young people in basic skills provision. The higher percentage of people of white ethnicity in this study than nationally will be because this study sampled only a few areas with high ethnic minority populations, and in particular none in the London area – see also Table 4.2. The predominance of 15 and 16 as ages of leaving full-time education was as would be expected. Much less expected was the proportion who left full-time education before age 15 – some may have had their school education abroad. As pointed out by one of the practitioner-researchers during a consultation on the study (see section 6.3), some of those who stayed on in full-time education after 16 may have been people with special educational needs – for more on this topic see section 4.5.

26
Table 4.1: Background characteristics of the sample of learners
Effective practice in reading
(present study)
Learning and Skills Council
2003/04 *
Sample Size – but N.B. some categories for this study do not total to 454 because of missing
information
454 454 468,984
N % %
Gender (%) Men 191 44 40
Women 244 56 60
Age distribution (%)
16-19 31 7 17**
20-29 78 18 19***
30-39 114 26 25
40-49 107 25 18
50-59 68 16 11
Over 59 37 9 9
Ethnicity (%) White 371 84 73
Other (for more detail see Table 4.2)
72 16 27
First language (%)
English 385 89
Other (for more detail see Table 4.3)
47 11
Occupational status (%)
Employed 158 38
Unemployed 72 17
Unwaged **** 185 45
Age of leaving full-time education
(%)
Under 15 40 10
15 112 28
16 179 45
Over 16 68 17
Highest qualification (%)
None 222 55
CSE/GCSE/O-Level (Levels 1-2)
75 19
FE/NVQ (Level 3) 88 22
A-Level or above (Levels 3+)
20 5
* Source Learning and Skills Council database for 2003/04 (All adult basic skills learners with a learning aim in literacy other than GCSE English or key skills). Analysis provided by Sammy Rashid, University of Sheffield
** 15-20; *** 21-29; **** Unwaged: In education (37, 9%), looking after home/family (62, 15%), sick/disabled (60, 14%), retired (26, 6%)
Blank cells - information not available
27
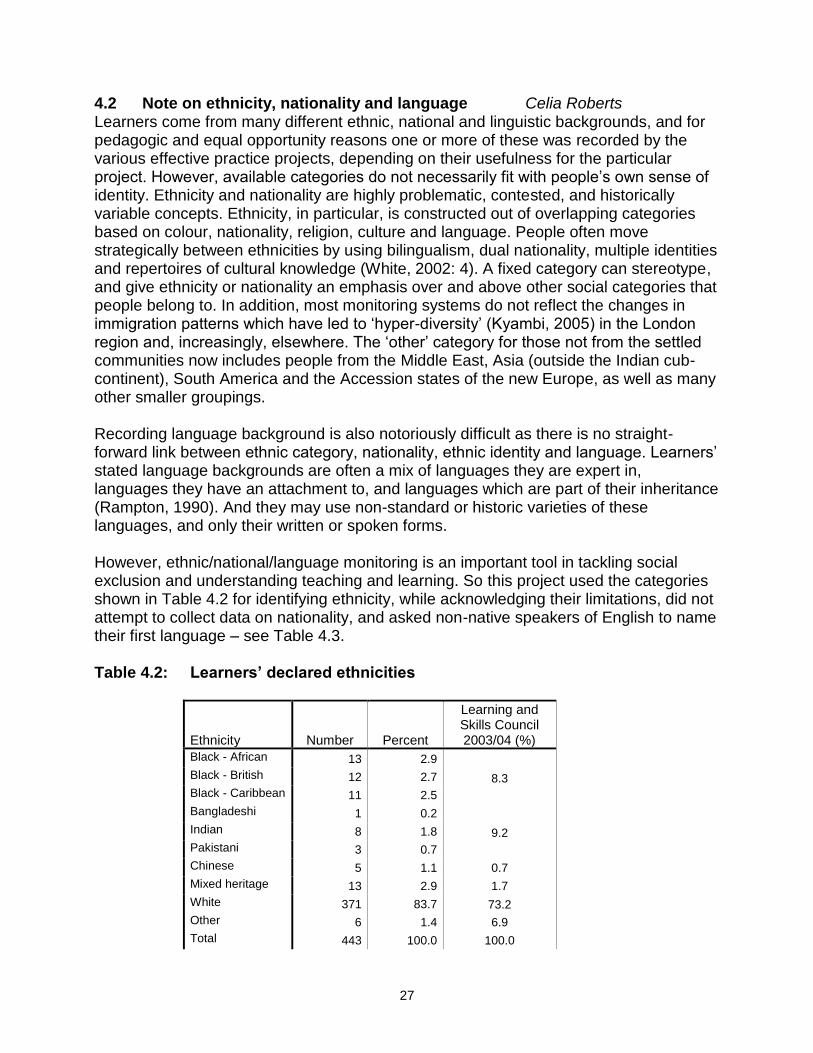
4.2 Note on ethnicity, nationality and language Celia Roberts Learners come from many different ethnic, national and linguistic backgrounds, and for pedagogic and equal opportunity reasons one or more of these was recorded by the various effective practice projects, depending on their usefulness for the particular project. However, available categories do not necessarily fit with people’s own sense of identity. Ethnicity and nationality are highly problematic, contested, and historically variable concepts. Ethnicity, in particular, is constructed out of overlapping categories based on colour, nationality, religion, culture and language. People often move strategically between ethnicities by using bilingualism, dual nationality, multiple identities and repertoires of cultural knowledge (White, 2002: 4). A fixed category can stereotype, and give ethnicity or nationality an emphasis over and above other social categories that people belong to. In addition, most monitoring systems do not reflect the changes in immigration patterns which have led to ‘hyper-diversity’ (Kyambi, 2005) in the London region and, increasingly, elsewhere. The ‘other’ category for those not from the settled communities now includes people from the Middle East, Asia (outside the Indian cub-continent), South America and the Accession states of the new Europe, as well as many other smaller groupings. Recording language background is also notoriously difficult as there is no straight-forward link between ethnic category, nationality, ethnic identity and language. Learners’ stated language backgrounds are often a mix of languages they are expert in, languages they have an attachment to, and languages which are part of their inheritance (Rampton, 1990). And they may use non-standard or historic varieties of these languages, and only their written or spoken forms. However, ethnic/national/language monitoring is an important tool in tackling social exclusion and understanding teaching and learning. So this project used the categories shown in Table 4.2 for identifying ethnicity, while acknowledging their limitations, did not attempt to collect data on nationality, and asked non-native speakers of English to name their first language – see Table 4.3. Table 4.2: Learners’ declared ethnicities
Ethnicity Number Percent
Learning and Skills Council 2003/04 (%)
Black - African 13 2.9
8.3 Black - British 12 2.7
Black - Caribbean 11 2.5
Bangladeshi 1 0.2
9.2 Indian 8 1.8
Pakistani 3 0.7
Chinese 5 1.1 0.7
Mixed heritage 13 2.9 1.7
White 371 83.7 73.2
Other 6 1.4 6.9
Total 443 100.0 100.0
28
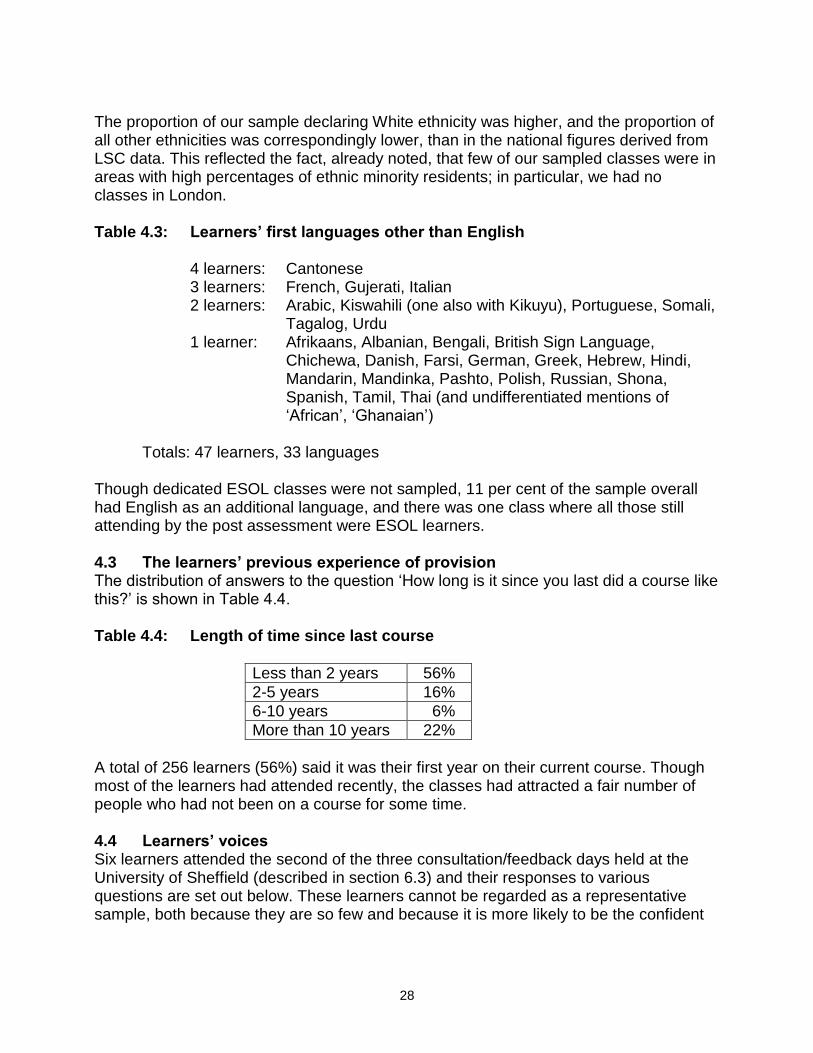
The proportion of our sample declaring White ethnicity was higher, and the proportion of all other ethnicities was correspondingly lower, than in the national figures derived from LSC data. This reflected the fact, already noted, that few of our sampled classes were in areas with high percentages of ethnic minority residents; in particular, we had no classes in London. Table 4.3: Learners’ first languages other than English 4 learners: Cantonese
3 learners: French, Gujerati, Italian 2 learners: Arabic, Kiswahili (one also with Kikuyu), Portuguese, Somali,
Tagalog, Urdu 1 learner: Afrikaans, Albanian, Bengali, British Sign Language,
Chichewa, Danish, Farsi, German, Greek, Hebrew, Hindi, Mandarin, Mandinka, Pashto, Polish, Russian, Shona, Spanish, Tamil, Thai (and undifferentiated mentions of ‘African’, ‘Ghanaian’)
Totals: 47 learners, 33 languages Though dedicated ESOL classes were not sampled, 11 per cent of the sample overall had English as an additional language, and there was one class where all those still attending by the post assessment were ESOL learners. 4.3 The learners’ previous experience of provision The distribution of answers to the question ‘How long is it since you last did a course like this?’ is shown in Table 4.4. Table 4.4: Length of time since last course
Less than 2 years 56%
2-5 years 16%
6-10 years 6%
More than 10 years 22%
A total of 256 learners (56%) said it was their first year on their current course. Though most of the learners had attended recently, the classes had attracted a fair number of people who had not been on a course for some time. 4.4 Learners’ voices Six learners attended the second of the three consultation/feedback days held at the University of Sheffield (described in section 6.3) and their responses to various questions are set out below. These learners cannot be regarded as a representative sample, both because they are so few and because it is more likely to be the confident

29
and successful who are willing to share their experiences in this way; however, the points they made were valid. How do you think you did in the assessment?
One learner said she had liked it and thought she had done well. When asked if she had found it ‘intimidating’ she immediately responded ‘No’.
Another learner also said that she thought she’d done well and had found it ‘interesting’.
One learner said that he had been worried, but after he realised there was no pressure, his ‘blind panic’ disappeared. He explained how people in his position can sometimes be so nervous that they can’t ‘see’ what is written down in front of them.
What milestones do you see as marking your own progress?
One learner said he had now read his first book (‘The Hitch-hiker’s Guide to the Galaxy’) and had just finished a second. (His teacher said that the ‘most fantastic thing’ for her was when he came in and said he had read that first book.) In terms of writing, he said he was now prepared to persevere, writing it out about 5 times to get it right, even although he still finds the process difficult.
Another learner said that she could now understand ‘how they want me to answer certain questions’. She also said she read more, and not just the TV magazines but things she wouldn’t have read before. With writing, what was key was the realisation that everyone has to do rough drafts first – her teacher had explained this to her. The first big step was actually going to class. Two learners spoke about this. Doing this built up confidence. One learner described how she had to pluck up courage even to enquire about what classes were available.
With some prompting from their teachers, the other learners were happy to share their achievements with the group, which included: - writing the first letter ever to her brother (‘He was shocked and said, don’t let that be the only letter you write to me!’); - writing a book review for the first time (‘I was quite proud of that’); - achieving National Test levels 1 and 2 and about to start GCSE English; this same learner had also got a new job in a college as a learning support worker for learners with profound learning difficulties; she could now write a c.v.; and she had a story printed in the Daily Mail. (This story features in the extract from the transcript at the end of this section.)
How important are the National Tests?
The learners seemed to be in favour of them, even although they were aware that there was always the chance of failure. One explanation given was that a requirement for many jobs was Level 2 English.
Are there factors which get in the way of learning? This was not a question that the learners seemed able to answer, not even in terms of practical considerations such as childcare, although the teachers and practitioner-researchers were able to make various suggestions (see 6.2).

30
Was there any specific thing that had helped?
The final question about any other barriers or specific things that had helped the learners again met with silence. One teacher suggested that for one pre-Entry learner (not present) having one-to-one help from a volunteer had been crucial.
Thus prompted, two learners indicated their teacher, and said that she had helped them a lot and was more like a friend. It was not like at school. The one-to-one help was ‘tremendous’ and had helped their confidence and self-esteem;
Earlier on, one of these learners had mentioned the different atmosphere in adult education compared with school. She described it as being treated as ‘an equal’.
The following extract about one learner’s experience from the transcript of the session illustrates the pride felt by learners in their achievements:
One learner talked about how she was so nervous that it took her about forty minutes of pacing up and down outside before she dared to go in to enquire about what help she could get with her reading and writing. When she was given the forms, she didn’t have her glasses with her – ‘yes, really’ – and joked about how often people would have heard that excuse! ‘It was the best thing I’ve ever done in my life.’ She said that last year she had been made redundant after 17 years working in a factory and had thought she would not be able to get another job. ‘Now I have done my English levels 1 and 2 and maths level 1, have just signed on to do GCSE English and I’ve just got a job in a college as a learning support worker for learners with profound learning difficulties. I’m able to write a c.v.’ She also talked about how she had never written a letter, but ‘five weeks ago I emailed a complaint to the Daily Mail. I’ve now got the confidence to do that even though it took me about three hours sitting with my dictionary, but I was so passionate about it I had to do it….They didn’t print it but they did send me a reply and the next day it was in the Daily Mail as a story, word for word.’ She said that it was not attributed to her but her teacher agreed that it was what she had sent and as she gleefully added, ‘They had not even had to change her spelling because she had spent so long getting it right!’
4.5 Special learners Some of the learners observed had special educational needs. Except on dyslexia (see below) information was not gathered systematically on this. However, most of the 59 classes had no observed learners (as far as the fieldworkers were aware) with special needs, but in 20 classes at least one learner was known to the fieldworker or said by the teacher to have a special need. Two classes consisted entirely of learners with special needs, another of five Downs people and two with severe learning difficulties (on this class see section 7.6), and a fourth entirely of people recovering from mental health problems. Two other learners were Downs people, one was recovering from a head injury, and in other classes 20 observed learners had special educational needs, so that there were at least 60 special learners (13%) in the sample.

31
A total of 108 other learners (27% of those for whom the question was answered; 24% of the full sample) were said by their teachers to have dyslexia, of whom 50 had been formally assessed and the rest were judged by their teachers to have dyslexia; only one learner was said to have been formally assessed as not having dyslexia. The seven learners in a prison who were initially recruited should also be mentioned here, because of their special problems. In particular, none could be re-contacted at the post assessment because they had all been moved to other prisons. For special classes, see section 3.3. 4.6 Returners, drop-outs and representativeness of the retained sample In the few categories where direct comparisons with national data were possible (see again section 4.1 and Table 4.1), the 454 learners who provided data at the pre assessment seemed reasonably representative, except perhaps for under-representation of ethnic minority learners and of young people. However, of more pressing concern was the representativeness of the retained samples, because if the learners who dropped out and those who stayed differed significantly the generalisability of the findings even to the original sample would be limited. Of the 454 learners who had provided data at the pre assessment, 338 (74%) were seen again at the mid assessment, and 322 (71%) at the post. Because of scattered absences, the number of learners on whom all seven forms of data (learner profile at pre assessment only; reading attainment and attitudes questionnaire on all three occasions) were gathered was 298 (66% of the original sample). This group are referred to often in this report as the ‘returners’, and the rest as the ‘drop-outs’. These retention rates are above average for the sector: the general retention rate is about 50%, and in the Progress in Adult Literacy study of 1998-99 (Brooks et al., 2001a) the rate was 57%. Though the retention rates were satisfactory, the question remains: Were the returners representative of the original sample? To investigate this several statistical comparisons between the returners and the drop-outs were undertaken, looking for possible differences between the two groups on
- each of the background characteristics, as gathered through the Learner profile
- their levels of reading, as measured in the pre assessment
- their attitudes to reading, as measured in the pre questionnaire; this analysis was carried out on both the overall score and each of the three parts of the questionnaire.
None of the comparisons showed a statistically significant difference between returners and drop-outs. It was therefore concluded that the returners were adequately representative of the full original sample.
32
Chapter 5 Learners’ progress Marcin Szczerbiński
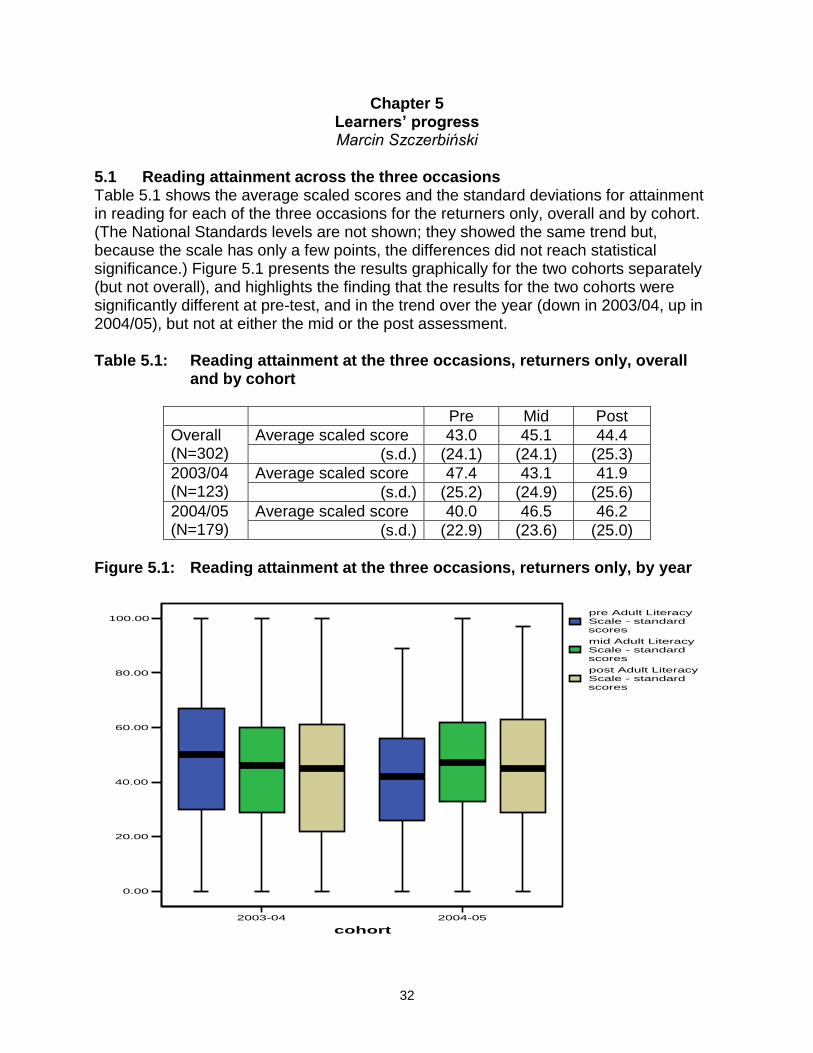
5.1 Reading attainment across the three occasions Table 5.1 shows the average scaled scores and the standard deviations for attainment in reading for each of the three occasions for the returners only, overall and by cohort. (The National Standards levels are not shown; they showed the same trend but, because the scale has only a few points, the differences did not reach statistical significance.) Figure 5.1 presents the results graphically for the two cohorts separately (but not overall), and highlights the finding that the results for the two cohorts were significantly different at pre-test, and in the trend over the year (down in 2003/04, up in 2004/05), but not at either the mid or the post assessment. Table 5.1: Reading attainment at the three occasions, returners only, overall
and by cohort
Pre Mid Post
Overall (N=302)
Average scaled score 43.0 45.1 44.4
(s.d.) (24.1) (24.1) (25.3)
2003/04 (N=123)
Average scaled score 47.4 43.1 41.9
(s.d.) (25.2) (24.9) (25.6)
2004/05 (N=179)
Average scaled score 40.0 46.5 46.2
(s.d.) (22.9) (23.6) (25.0)
Figure 5.1: Reading attainment at the three occasions, returners only, by year
2003-04 2004-05
cohort
0.00
20.00
40.00
60.00
80.00
100.00pre Adult Literacy Scale - standard scores
mid Adult Literacy Scale - standard scores
post Adult Literacy Scale - standard scores

33
It appears that the first cohort started off with somewhat better scores, but got worse over time, while the second cohort, conversely, started off worse, but improved slightly. These impressions were largely confirmed by statistical tests of significance. A two-way factorial analysis of variance was carried out, with a between-subject factor of Cohort (2003/04 vs 2004/05) and a within-subject factor of Time (pre- vs mid- vs post-test). The main factor of Time was not significant: F(2,299)=1.142, p=0.238. It means that, averaging across both cohorts, there was no significant change in learners’ performance over time. Comparing pre- and post-test results only, we see an average improvement of 1.42 standard points – a non-significant and negligible difference. The main factor of Cohort was also not significant: F(1,300)=0.001, p=0.970. The average standard scores of the two cohorts, averaged across the three time points, were virtually identical. However, there was a significant and robust interaction between Cohort and Time: F(2,299)=53.270, p<0.001. This confirms that the pattern of change over time was different for each cohort. Repeated measures analysis of variance carried out on the scores of the first cohort revealed a significant change over time: F(2,121)=18.063, p<0.001. Simple contrasts showed that post-test results were significantly worse than pre-test (though no different from mid-test). The second cohort analysis also revealed a significant change over time: F(2,177)=43.858, p<0.001. However, this time simple contrasts showed that post-test scores were significantly better than pre-test scores (with mid-test being again no different from post-test). T-test analyses showed that the second cohort was significantly worse than the first at pre-test but then caught up; the two groups did not differ significantly at mid- and post-test. Table 5.2 shows the correlations between the pre-, mid- and post-test scores. (The figures below the diagonal represent the 2003-04 cohort; those above the diagonal (in italics) the 2004-05 cohort.) The stability of individual differences between participants is remarkable. Whatever the intervention does to increase (or decrease) participants’ performance, it does very little to alter individual differences in performance (the ‘rank order’). This is consistent with a number of intervention studies which also showed that improving performance is easier than reducing individual differences in performance.
Overall, there was no effect of the educational intervention. Each cohort responded slightly differently, however: the first got worse, while the second got better. More to the point, why did the cohorts differ significantly at the outset (by some 7.6 points, on average)? It seems most likely that the cause was the difference in assessment procedures (the pilot version of the test for the first cohort, the final version for the second one). This is a strong possibility, considering that the cohorts differed only at pre-test, not other stages (see Figure 5.1). We concluded that the result for the second cohort (showing an improvement) is probably more reliable.
34
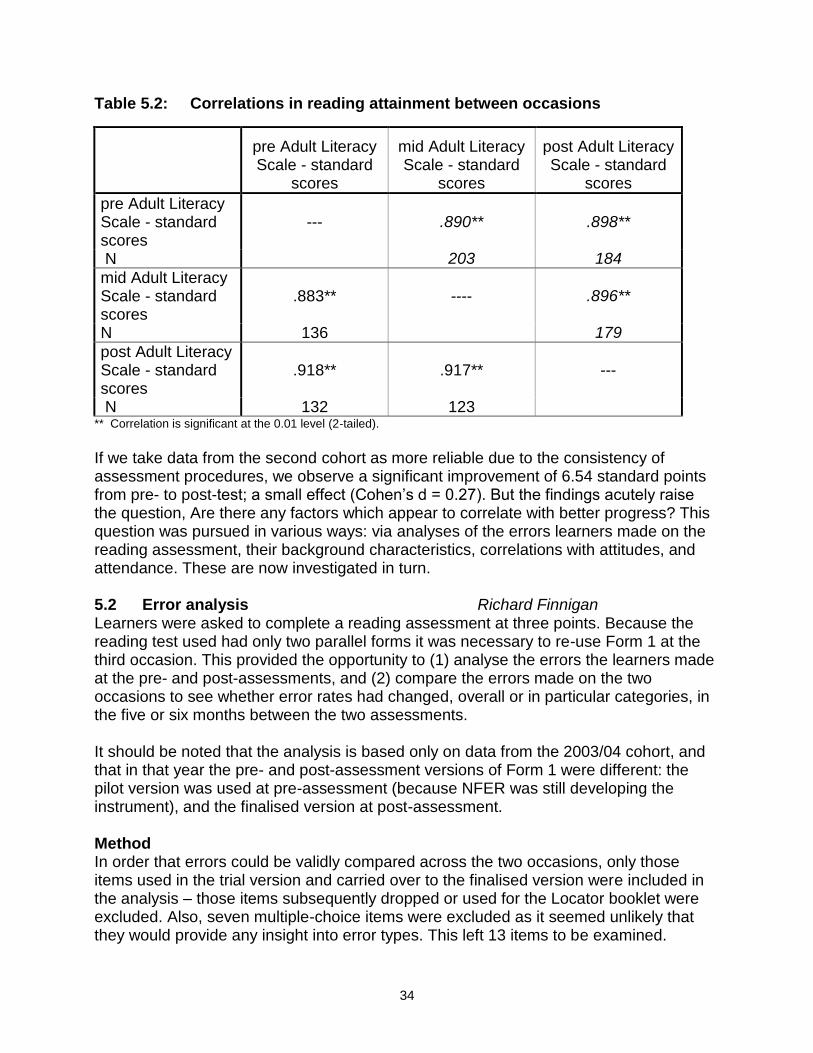
Table 5.2: Correlations in reading attainment between occasions
pre Adult Literacy Scale - standard
scores
mid Adult Literacy Scale - standard
scores
post Adult Literacy Scale - standard
scores
pre Adult Literacy Scale - standard scores
--- .890** .898**
N 203 184
mid Adult Literacy Scale - standard scores
.883** ---- .896**
N 136 179
post Adult Literacy Scale - standard scores
.918** .917** ---
N 132 123 ** Correlation is significant at the 0.01 level (2-tailed).
If we take data from the second cohort as more reliable due to the consistency of assessment procedures, we observe a significant improvement of 6.54 standard points from pre- to post-test; a small effect (Cohen’s d = 0.27). But the findings acutely raise the question, Are there any factors which appear to correlate with better progress? This question was pursued in various ways: via analyses of the errors learners made on the reading assessment, their background characteristics, correlations with attitudes, and attendance. These are now investigated in turn.
5.2 Error analysis Richard Finnigan Learners were asked to complete a reading assessment at three points. Because the reading test used had only two parallel forms it was necessary to re-use Form 1 at the third occasion. This provided the opportunity to (1) analyse the errors the learners made at the pre- and post-assessments, and (2) compare the errors made on the two occasions to see whether error rates had changed, overall or in particular categories, in the five or six months between the two assessments. It should be noted that the analysis is based only on data from the 2003/04 cohort, and that in that year the pre- and post-assessment versions of Form 1 were different: the pilot version was used at pre-assessment (because NFER was still developing the instrument), and the finalised version at post-assessment. Method In order that errors could be validly compared across the two occasions, only those items used in the trial version and carried over to the finalised version were included in the analysis – those items subsequently dropped or used for the Locator booklet were excluded. Also, seven multiple-choice items were excluded as it seemed unlikely that they would provide any insight into error types. This left 13 items to be examined.
35
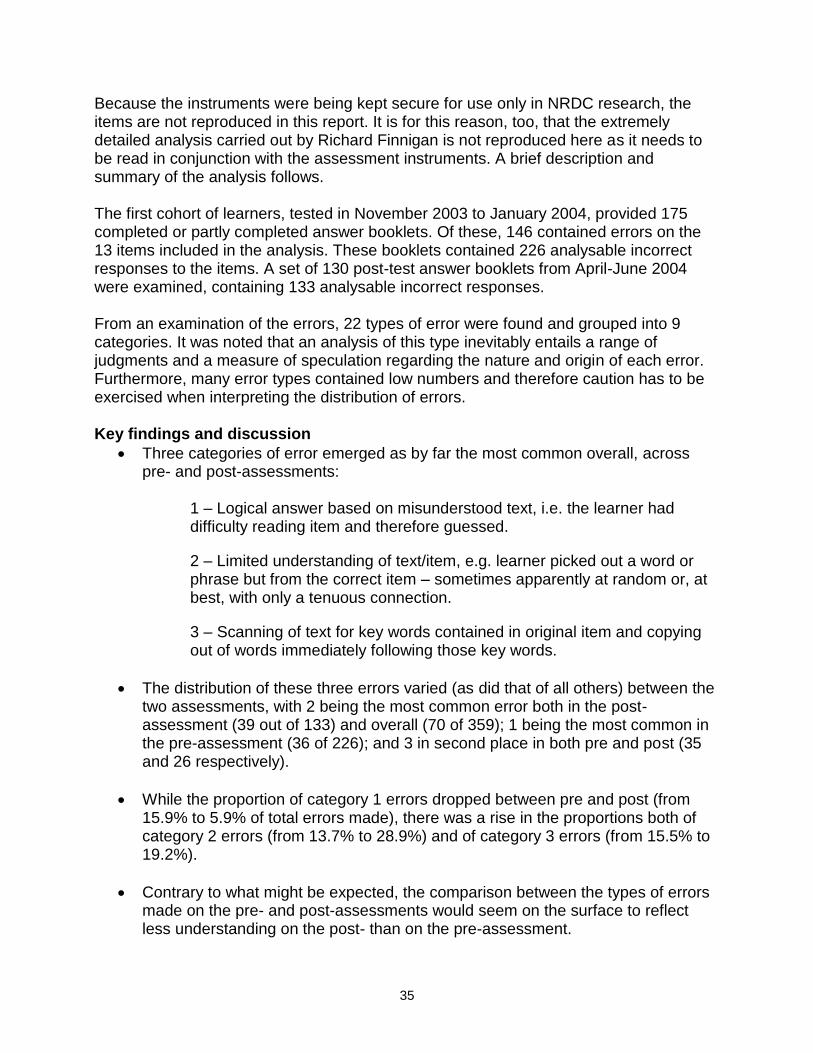
Because the instruments were being kept secure for use only in NRDC research, the items are not reproduced in this report. It is for this reason, too, that the extremely detailed analysis carried out by Richard Finnigan is not reproduced here as it needs to be read in conjunction with the assessment instruments. A brief description and summary of the analysis follows. The first cohort of learners, tested in November 2003 to January 2004, provided 175 completed or partly completed answer booklets. Of these, 146 contained errors on the 13 items included in the analysis. These booklets contained 226 analysable incorrect responses to the items. A set of 130 post-test answer booklets from April-June 2004 were examined, containing 133 analysable incorrect responses. From an examination of the errors, 22 types of error were found and grouped into 9 categories. It was noted that an analysis of this type inevitably entails a range of judgments and a measure of speculation regarding the nature and origin of each error. Furthermore, many error types contained low numbers and therefore caution has to be exercised when interpreting the distribution of errors. Key findings and discussion
Three categories of error emerged as by far the most common overall, across pre- and post-assessments:
1 – Logical answer based on misunderstood text, i.e. the learner had difficulty reading item and therefore guessed.
2 – Limited understanding of text/item, e.g. learner picked out a word or phrase but from the correct item – sometimes apparently at random or, at best, with only a tenuous connection.
3 – Scanning of text for key words contained in original item and copying out of words immediately following those key words.
The distribution of these three errors varied (as did that of all others) between the two assessments, with 2 being the most common error both in the post-assessment (39 out of 133) and overall (70 of 359); 1 being the most common in the pre-assessment (36 of 226); and 3 in second place in both pre and post (35 and 26 respectively).
While the proportion of category 1 errors dropped between pre and post (from 15.9% to 5.9% of total errors made), there was a rise in the proportions both of category 2 errors (from 13.7% to 28.9%) and of category 3 errors (from 15.5% to 19.2%).
Contrary to what might be expected, the comparison between the types of errors made on the pre- and post-assessments would seem on the surface to reflect less understanding on the post- than on the pre-assessment.

36
It is possible to speculate about the reasons for this change: learners’ reading ability may have decreased between assessments, which seems unlikely, or learners’ motivation may have decreased by the third assessment, in some way affecting their responses. Conversely, it may be that confidence and ability increased and learners felt able to attempt the more complex questions, and made more basic errors as they were working at the limit of their ability level. 5.3 Exploring individual differences in changes in reading attainment In order to try to find explanations for the decline in reading attainment in the first cohort and the rise in the second, and especially any factors that might correlate with improvement rather than decline, a series of univariate (single-factor) analyses were carried out. All of these were attempts to find answers to the following question:
What characteristics of participants (demographic, attitudinal, etc.) might explain individual differences in the direction and magnitude of change in reading attainment (as measured by the instrument used) over the duration of the course?
For simplicity, the discussion focuses on the difference between pre- and post-assessments only. This seems justified, as the change in reading levels was linear (i.e. mid-course results followed the same direction as post-course ones); also, it maximises the interval between the occasions, which is necessary for the correlations with teaching. 5.3.1 Did the changes depend on gender? Yes, weakly. Women outperformed men in terms of actual levels of performance, both at pre-test (F[1, 431]=16.749, p<0.001) and at post-test (F[1,308]=14.353, p<0.001) – see Tables 5.3 and 5.4. Table 5.3: Pre-test scores, overall and by cohort, by gender
cohort Gender Mean Std. Deviation N
03-04 Male 40.25 23.16 77
Female 53.18 24.96 95
Total 47.39 24.95 172
04-05 Male 36.59 23.87 114
Female 42.95 23.54 149
Total 40.19 23.85 263
Total Male 38.06 23.59 191
Female 46.93 24.57 244
Total 43.04 24.52 435

37
Table 5.4: Post-test scores, overall and by cohort, by gender
cohort Gender Mean Std. Deviation N
03-04 Male 35.13 22.74 56
Female 47.70 26.61 73
Total 42.24 25.68 129
04-05 Male 41.85 24.80 87
Female 50.97 24.40 96
Total 46.63 24.94 183
Total Male 39.22 24.16 143
Female 49.56 25.35 169
Total 44.82 25.30 312
The effects were cohort-independent (Cohort×Gender interaction: F[1, 431]=1.940, p=0.164 for pre-test; F[1,308]=0.364, p=0.547 for post-test). However, the 2×2 Cohort×Gender factorial analysis of variance (ANOVA) revealed a significant effect of Gender: F(1,308)=5.168, p=0.024. There was no interaction between Cohort and Gender: F(1,308)= 0.150, p=0.699. This means that, in the 2003-04 cohort, women showed a slightly smaller decrease in standard score than men, while in the 2004-05 cohort women showed a slightly greater increase in standard scores (see Table 5.5). Table 5.5: Changes in average scores between pre- and post-test, by gender and cohort and overall
cohort Gender Mean Std. Deviation N
03-04 Male -6.75 10.37 56
Female -4.44 10.01 73
Total -5.44 10.19 129
04-05 Male 4.89 11.55 87
Female 8.15 10.26 96
Total 6.60 10.99 183
Total Male .33 12.45 143
Female 2.71 11.90 169
Total 1.62 12.19 312
The effect was small, though. When the cohorts were analysed separately no significant gender effect emerged for the 2003-04 cohort: t(127)=1.280, p=0.203, and the effect for the 2004-05 cohort was only marginally significant: t(181)=2.022, p=0.045. 5.3.2 Did the changes depend on age? No. Tables 5.6 and 5.7 show the pre and post average scores for the six age-bands used in this project. They also show just how few young or older learners were recruited into the study – only 31 in the 16-19 range and 37 over 59 – with a strong concentration in the middle years.

38
Table 5.6: Average pre-test scores, by age-bands
cohort Age Mean Std. Deviation N
Total 16-19 42.2 23.0 31
20-29 49.3 26.0 78
30-39 45.9 24.7 114
40-49 43.4 23.3 107
50-59 41.5 20.7 68
Over 59 26.5 24.3 37
Total 43.3 24.4 435
Table 5.7: Average post-test scores, by age-bands
cohort Age Mean Std. Deviation N
Total 46.9 24.9 181
Total 16-19 39.4 25.29 20
20-29 53.2 26.5 53
30-39 48.3 24.2 84
40-49 43.4 24.4 75
50-59 43.1 21.7 54
Over 59 29.8 28.1 26
Total 44.9 25.2 312
The 2×6 Cohort×Age factorial ANOVA revealed no significant effect of Age on changes in scores: F(5,300)=0.476, p=0.794, nor an interaction between Cohort and Age: F(5,300)= 0.796, p=0.553 – see Table 5.8. Table 5.8: Changes in average scores between pre- and post-test, by age-bands
cohort Age Mean Std. Deviation N
Total 16-19 -2.70 11.41 20
20-29 3.08 12.67 53
30-39 1.88 12.24 84
40-49 0.99 12.55 75
50-59 0.76 11.76 54
Over 59 1.85 12.92 26
Total 1.38 12.29 312
While there were no significant age-related differences in the magnitude of change, age groups did differ significantly in terms of actual levels of performance, both at pre-test (F[5,423]=5.282, p<0.001) and post-test (F[5,300]=3.694, p=0.003) (see again Tables 5.6 and 5.7). The effects were cohort-independent (Cohort×Age interaction: F[5,423]=1.962, p=0.083 for pre-test; F[5,300]=1.006, p=0.414 for post-test). These age-related differences are attributable primarily to an exceptionally poor performance of the over 59 group. The post-hoc test (Scheffé) showed that that group performed significantly worse than the 20-29, 30-39 and 40-49 groups at pre-test. At post-test, that group was worse than the 20-29 and 30-39 groups.

39
5.3.3 Did the changes depend on home language? No. Overall, native speakers of English tended to be better readers than those who had English as an additional language (see Tables 5.9 and 5.10) – but the numbers of EAL speakers were small: 47 at pre-test and 34 at post-test. Table 5.9: Average pre-test scores, by English as first or additional language
cohort English as a first language Mean Std. Deviation N
Total No 36.9 21.2 47
Yes 44.2 24.4 385
Total 43.4 24.2 432
Table 5.10: Average post-test scores, by English as first or additional language
cohort English as a first language Mean Std. Deviation N
Total No 33.7 18.0 34
Yes 46.3 25.4 277
Total 44.9 25.0 311
The 2×2 Cohort×Language factorial ANOVA revealed no significant effect of Language: F(1,307)=1,205, p=0.273. There was no interaction between Cohort and Language: F(1,307)= 0.059, p=0.808. Thus, the magnitude of change did not depend on whether or not the learner was a native speaker of English (see Table 5.11). Table 5.11: Changes in average scores between pre- and post-test, by English as first or additional
language
cohort English as a first language Mean Std. Deviation N
Total No -0.3 11.3 34
Yes 1.7 12.3 277
Total 1.5 12.2 311
5.3.4 Did the changes depend on ethnicity? No. The detailed ethnic profile of the sample was presented in Table 4.2. Because the numbers of ethnic minority learners were small, for purposes of analysis all ethnicities other than white were collapsed into a single category.
White learners performed better than others at pre-test (F[1,425]=13.012, p<0.001) and at post-test (F[1,304]=21.205, p<.0001) – see Tables 5.12 and 5.13. Neither effect interacted with cohort (pre-test: F[1,425]=0.209, p=0.648; post-test: F[1,325]=0.118, p=0.738. Neither group made significantly greater loss or gain than the other.
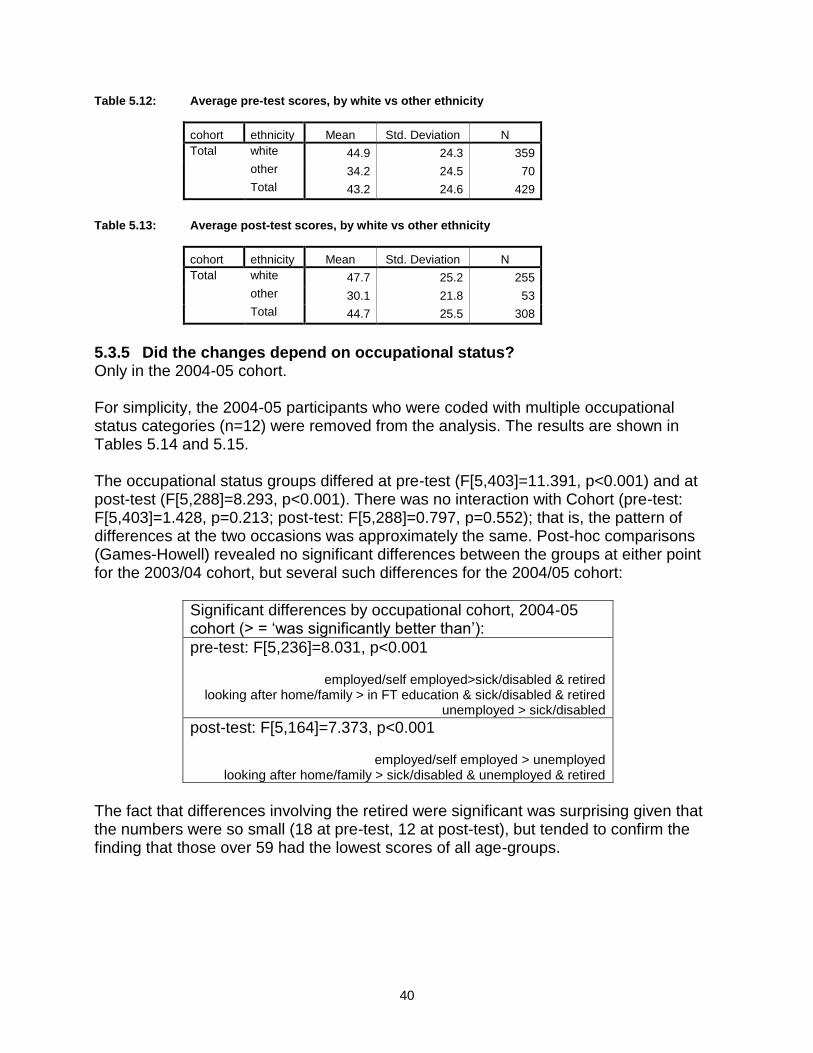
40
Table 5.12: Average pre-test scores, by white vs other ethnicity
cohort ethnicity Mean Std. Deviation N
Total white 44.9 24.3 359
other 34.2 24.5 70
Total 43.2 24.6 429
Table 5.13: Average post-test scores, by white vs other ethnicity
cohort ethnicity Mean Std. Deviation N
Total white 47.7 25.2 255
other 30.1 21.8 53
Total 44.7 25.5 308
5.3.5 Did the changes depend on occupational status? Only in the 2004-05 cohort. For simplicity, the 2004-05 participants who were coded with multiple occupational status categories (n=12) were removed from the analysis. The results are shown in Tables 5.14 and 5.15. The occupational status groups differed at pre-test (F[5,403]=11.391, p<0.001) and at post-test (F[5,288]=8.293, p<0.001). There was no interaction with Cohort (pre-test: F[5,403]=1.428, p=0.213; post-test: F[5,288]=0.797, p=0.552); that is, the pattern of differences at the two occasions was approximately the same. Post-hoc comparisons (Games-Howell) revealed no significant differences between the groups at either point for the 2003/04 cohort, but several such differences for the 2004/05 cohort:
Significant differences by occupational cohort, 2004-05 cohort (> = ‘was significantly better than’):
pre-test: F[5,236]=8.031, p<0.001
employed/self employed>sick/disabled & retired
looking after home/family > in FT education & sick/disabled & retired unemployed > sick/disabled
post-test: F[5,164]=7.373, p<0.001
employed/self employed > unemployed looking after home/family > sick/disabled & unemployed & retired
The fact that differences involving the retired were significant was surprising given that the numbers were so small (18 at pre-test, 12 at post-test), but tended to confirm the finding that those over 59 had the lowest scores of all age-groups.
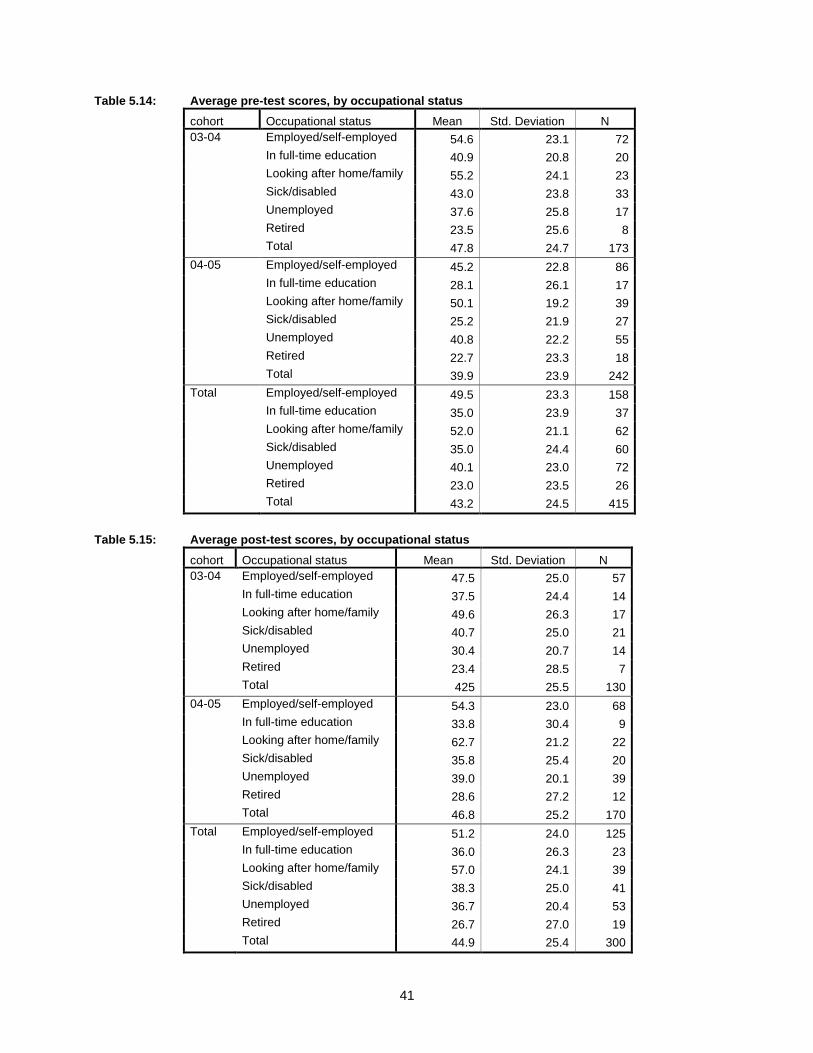
41
Table 5.14: Average pre-test scores, by occupational status
cohort Occupational status Mean Std. Deviation N
03-04 Employed/self-employed 54.6 23.1 72
In full-time education 40.9 20.8 20
Looking after home/family 55.2 24.1 23
Sick/disabled 43.0 23.8 33
Unemployed 37.6 25.8 17
Retired 23.5 25.6 8
Total 47.8 24.7 173
04-05 Employed/self-employed 45.2 22.8 86
In full-time education 28.1 26.1 17
Looking after home/family 50.1 19.2 39
Sick/disabled 25.2 21.9 27
Unemployed 40.8 22.2 55
Retired 22.7 23.3 18
Total 39.9 23.9 242
Total Employed/self-employed 49.5 23.3 158
In full-time education 35.0 23.9 37
Looking after home/family 52.0 21.1 62
Sick/disabled 35.0 24.4 60
Unemployed 40.1 23.0 72
Retired 23.0 23.5 26
Total 43.2 24.5 415
Table 5.15: Average post-test scores, by occupational status
cohort Occupational status Mean Std. Deviation N
03-04 Employed/self-employed 47.5 25.0 57
In full-time education 37.5 24.4 14
Looking after home/family 49.6 26.3 17
Sick/disabled 40.7 25.0 21
Unemployed 30.4 20.7 14
Retired 23.4 28.5 7
Total 425 25.5 130
04-05 Employed/self-employed 54.3 23.0 68
In full-time education 33.8 30.4 9
Looking after home/family 62.7 21.2 22
Sick/disabled 35.8 25.4 20
Unemployed 39.0 20.1 39
Retired 28.6 27.2 12
Total 46.8 25.2 170
Total Employed/self-employed 51.2 24.0 125
In full-time education 36.0 26.3 23
Looking after home/family 57.0 24.1 39
Sick/disabled 38.3 25.0 41
Unemployed 36.7 20.4 53
Retired 26.7 27.0 19
Total 44.9 25.4 300
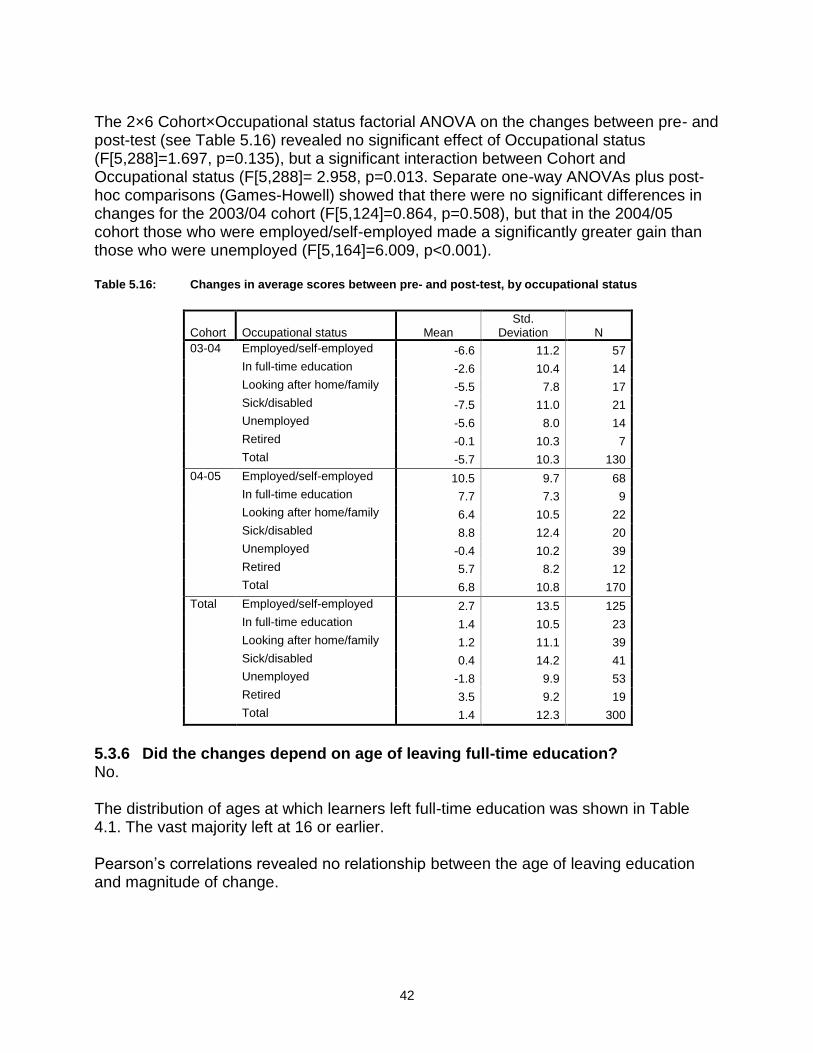
42
The 2×6 Cohort×Occupational status factorial ANOVA on the changes between pre- and post-test (see Table 5.16) revealed no significant effect of Occupational status (F[5,288]=1.697, p=0.135), but a significant interaction between Cohort and Occupational status (F[5,288]= 2.958, p=0.013. Separate one-way ANOVAs plus post-hoc comparisons (Games-Howell) showed that there were no significant differences in changes for the 2003/04 cohort (F[5,124]=0.864, p=0.508), but that in the 2004/05 cohort those who were employed/self-employed made a significantly greater gain than those who were unemployed (F[5,164]=6.009, p<0.001). Table 5.16: Changes in average scores between pre- and post-test, by occupational status
Cohort Occupational status Mean Std.
Deviation N
03-04 Employed/self-employed -6.6 11.2 57
In full-time education -2.6 10.4 14
Looking after home/family -5.5 7.8 17
Sick/disabled -7.5 11.0 21
Unemployed -5.6 8.0 14
Retired -0.1 10.3 7
Total -5.7 10.3 130
04-05 Employed/self-employed 10.5 9.7 68
In full-time education 7.7 7.3 9
Looking after home/family 6.4 10.5 22
Sick/disabled 8.8 12.4 20
Unemployed -0.4 10.2 39
Retired 5.7 8.2 12
Total 6.8 10.8 170
Total Employed/self-employed 2.7 13.5 125
In full-time education 1.4 10.5 23
Looking after home/family 1.2 11.1 39
Sick/disabled 0.4 14.2 41
Unemployed -1.8 9.9 53
Retired 3.5 9.2 19
Total 1.4 12.3 300
5.3.6 Did the changes depend on age of leaving full-time education? No. The distribution of ages at which learners left full-time education was shown in Table 4.1. The vast majority left at 16 or earlier. Pearson’s correlations revealed no relationship between the age of leaving education and magnitude of change.
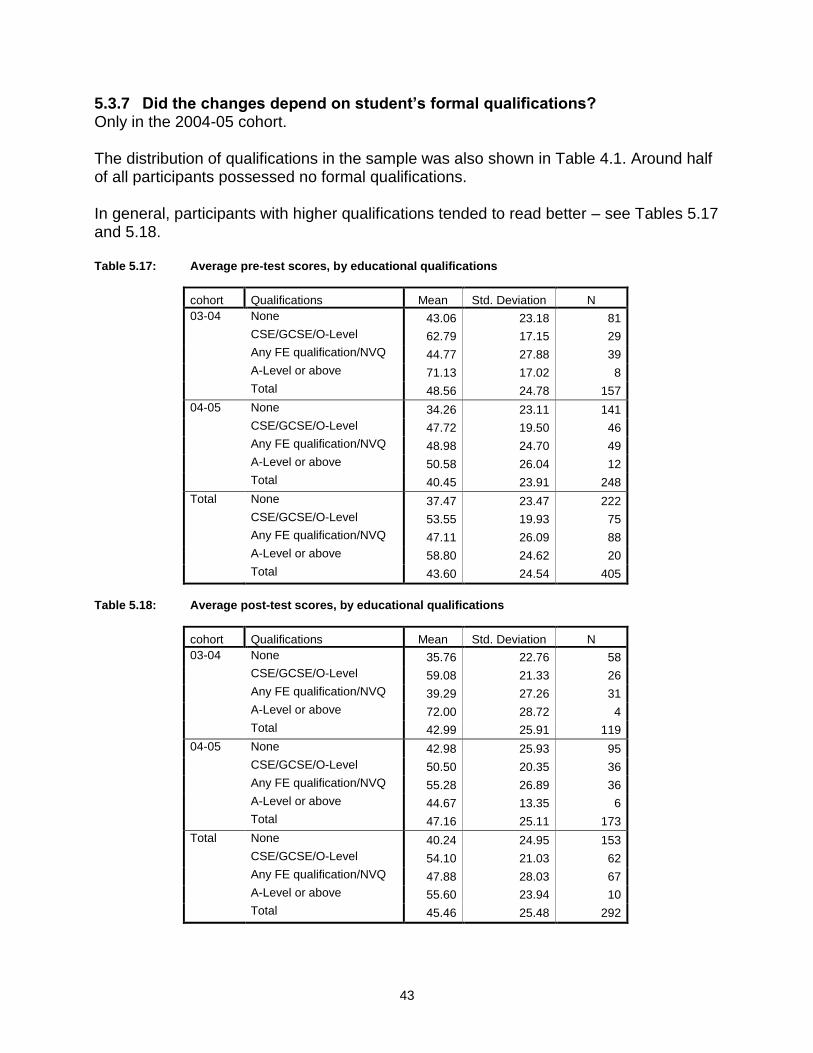
43
5.3.7 Did the changes depend on student’s formal qualifications? Only in the 2004-05 cohort. The distribution of qualifications in the sample was also shown in Table 4.1. Around half of all participants possessed no formal qualifications. In general, participants with higher qualifications tended to read better – see Tables 5.17 and 5.18. Table 5.17: Average pre-test scores, by educational qualifications
cohort Qualifications Mean Std. Deviation N
03-04 None 43.06 23.18 81
CSE/GCSE/O-Level 62.79 17.15 29
Any FE qualification/NVQ 44.77 27.88 39
A-Level or above 71.13 17.02 8
Total 48.56 24.78 157
04-05 None 34.26 23.11 141
CSE/GCSE/O-Level 47.72 19.50 46
Any FE qualification/NVQ 48.98 24.70 49
A-Level or above 50.58 26.04 12
Total 40.45 23.91 248
Total None 37.47 23.47 222
CSE/GCSE/O-Level 53.55 19.93 75
Any FE qualification/NVQ 47.11 26.09 88
A-Level or above 58.80 24.62 20
Total 43.60 24.54 405
Table 5.18: Average post-test scores, by educational qualifications
cohort Qualifications Mean Std. Deviation N
03-04 None 35.76 22.76 58
CSE/GCSE/O-Level 59.08 21.33 26
Any FE qualification/NVQ 39.29 27.26 31
A-Level or above 72.00 28.72 4
Total 42.99 25.91 119
04-05 None 42.98 25.93 95
CSE/GCSE/O-Level 50.50 20.35 36
Any FE qualification/NVQ 55.28 26.89 36
A-Level or above 44.67 13.35 6
Total 47.16 25.11 173
Total None 40.24 24.95 153
CSE/GCSE/O-Level 54.10 21.03 62
Any FE qualification/NVQ 47.88 28.03 67
A-Level or above 55.60 23.94 10
Total 45.46 25.48 292
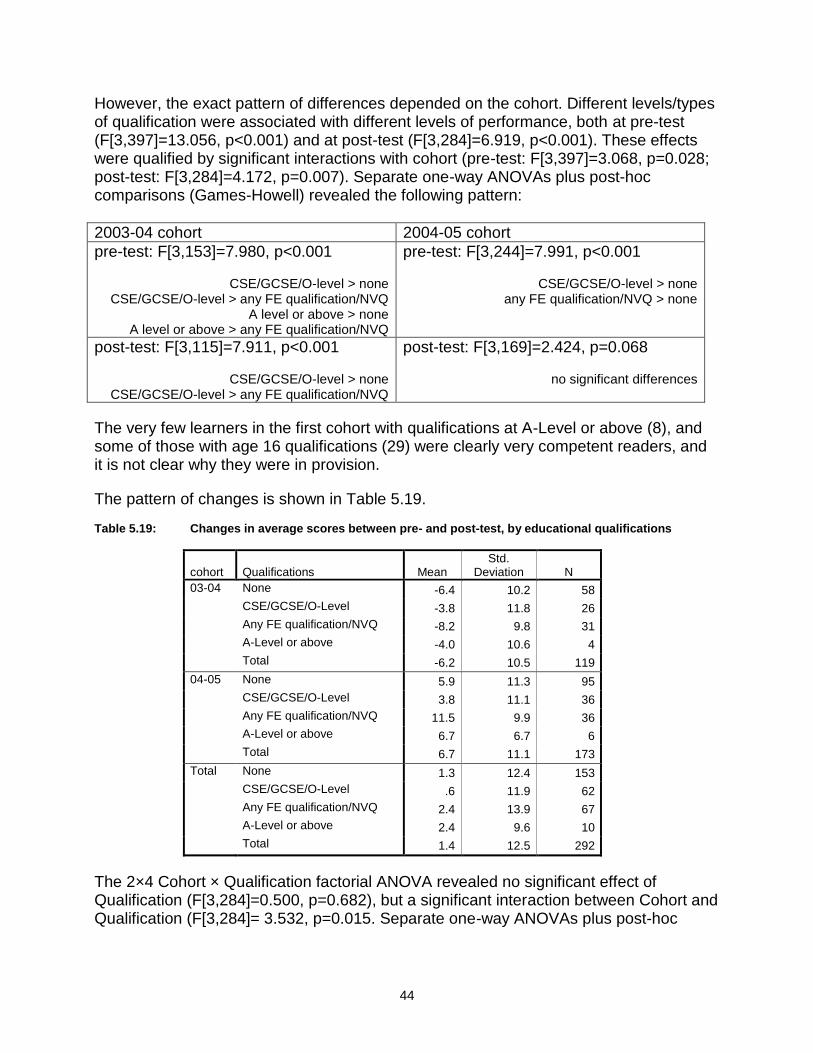
44
However, the exact pattern of differences depended on the cohort. Different levels/types of qualification were associated with different levels of performance, both at pre-test (F[3,397]=13.056, p<0.001) and at post-test (F[3,284]=6.919, p<0.001). These effects were qualified by significant interactions with cohort (pre-test: F[3,397]=3.068, p=0.028; post-test: F[3,284]=4.172, p=0.007). Separate one-way ANOVAs plus post-hoc comparisons (Games-Howell) revealed the following pattern:
2003-04 cohort 2004-05 cohort
pre-test: F[3,153]=7.980, p<0.001
CSE/GCSE/O-level > none CSE/GCSE/O-level > any FE qualification/NVQ
A level or above > none A level or above > any FE qualification/NVQ
pre-test: F[3,244]=7.991, p<0.001
CSE/GCSE/O-level > none any FE qualification/NVQ > none
post-test: F[3,115]=7.911, p<0.001
CSE/GCSE/O-level > none CSE/GCSE/O-level > any FE qualification/NVQ
post-test: F[3,169]=2.424, p=0.068
no significant differences
The very few learners in the first cohort with qualifications at A-Level or above (8), and some of those with age 16 qualifications (29) were clearly very competent readers, and it is not clear why they were in provision.
The pattern of changes is shown in Table 5.19. Table 5.19: Changes in average scores between pre- and post-test, by educational qualifications
cohort Qualifications Mean Std.
Deviation N
03-04 None -6.4 10.2 58
CSE/GCSE/O-Level -3.8 11.8 26
Any FE qualification/NVQ -8.2 9.8 31
A-Level or above -4.0 10.6 4
Total -6.2 10.5 119
04-05 None 5.9 11.3 95
CSE/GCSE/O-Level 3.8 11.1 36
Any FE qualification/NVQ 11.5 9.9 36
A-Level or above 6.7 6.7 6
Total 6.7 11.1 173
Total None 1.3 12.4 153
CSE/GCSE/O-Level .6 11.9 62
Any FE qualification/NVQ 2.4 13.9 67
A-Level or above 2.4 9.6 10
Total 1.4 12.5 292
The 2×4 Cohort × Qualification factorial ANOVA revealed no significant effect of Qualification (F[3,284]=0.500, p=0.682), but a significant interaction between Cohort and Qualification (F[3,284]= 3.532, p=0.015. Separate one-way ANOVAs plus post-hoc
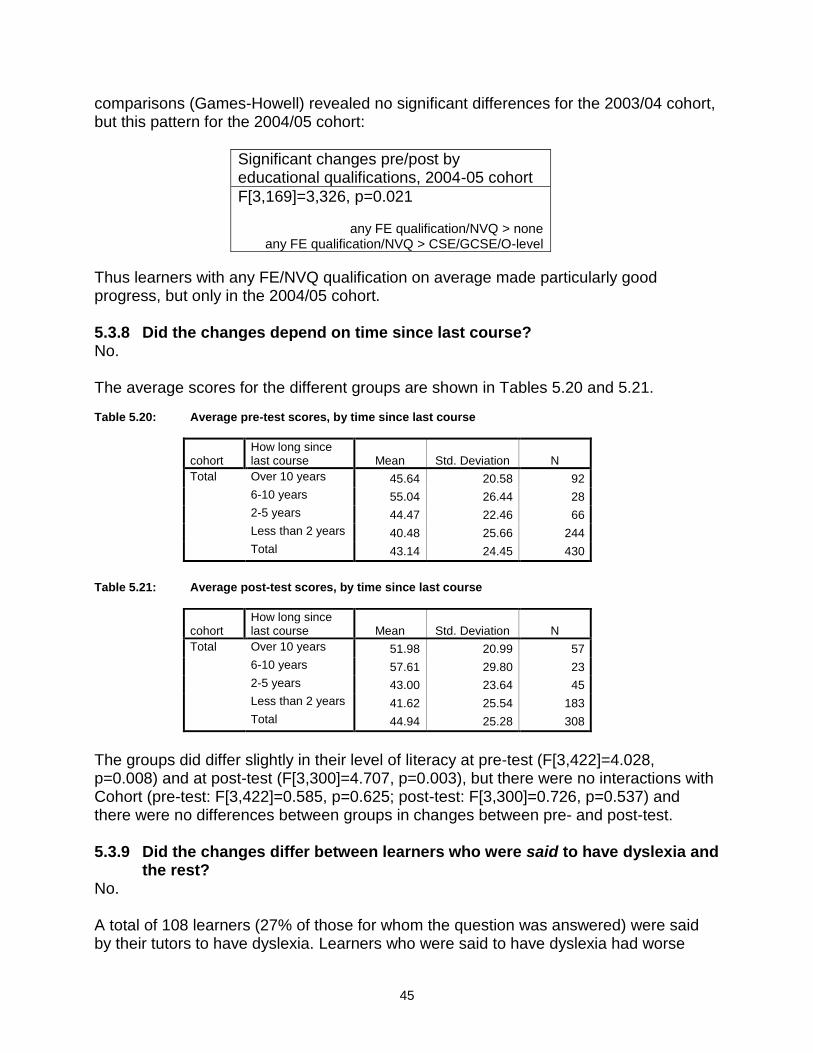
45
comparisons (Games-Howell) revealed no significant differences for the 2003/04 cohort, but this pattern for the 2004/05 cohort:
Significant changes pre/post by educational qualifications, 2004-05 cohort
F[3,169]=3,326, p=0.021
any FE qualification/NVQ > none any FE qualification/NVQ > CSE/GCSE/O-level
Thus learners with any FE/NVQ qualification on average made particularly good progress, but only in the 2004/05 cohort. 5.3.8 Did the changes depend on time since last course? No. The average scores for the different groups are shown in Tables 5.20 and 5.21. Table 5.20: Average pre-test scores, by time since last course
cohort How long since last course Mean Std. Deviation N
Total Over 10 years 45.64 20.58 92
6-10 years 55.04 26.44 28
2-5 years 44.47 22.46 66
Less than 2 years 40.48 25.66 244
Total 43.14 24.45 430
Table 5.21: Average post-test scores, by time since last course
cohort How long since last course Mean Std. Deviation N
Total Over 10 years 51.98 20.99 57
6-10 years 57.61 29.80 23
2-5 years 43.00 23.64 45
Less than 2 years 41.62 25.54 183
Total 44.94 25.28 308
The groups did differ slightly in their level of literacy at pre-test (F[3,422]=4.028, p=0.008) and at post-test (F[3,300]=4.707, p=0.003), but there were no interactions with Cohort (pre-test: F[3,422]=0.585, p=0.625; post-test: F[3,300]=0.726, p=0.537) and there were no differences between groups in changes between pre- and post-test. 5.3.9 Did the changes differ between learners who were said to have dyslexia and
the rest? No. A total of 108 learners (27% of those for whom the question was answered) were said by their tutors to have dyslexia. Learners who were said to have dyslexia had worse
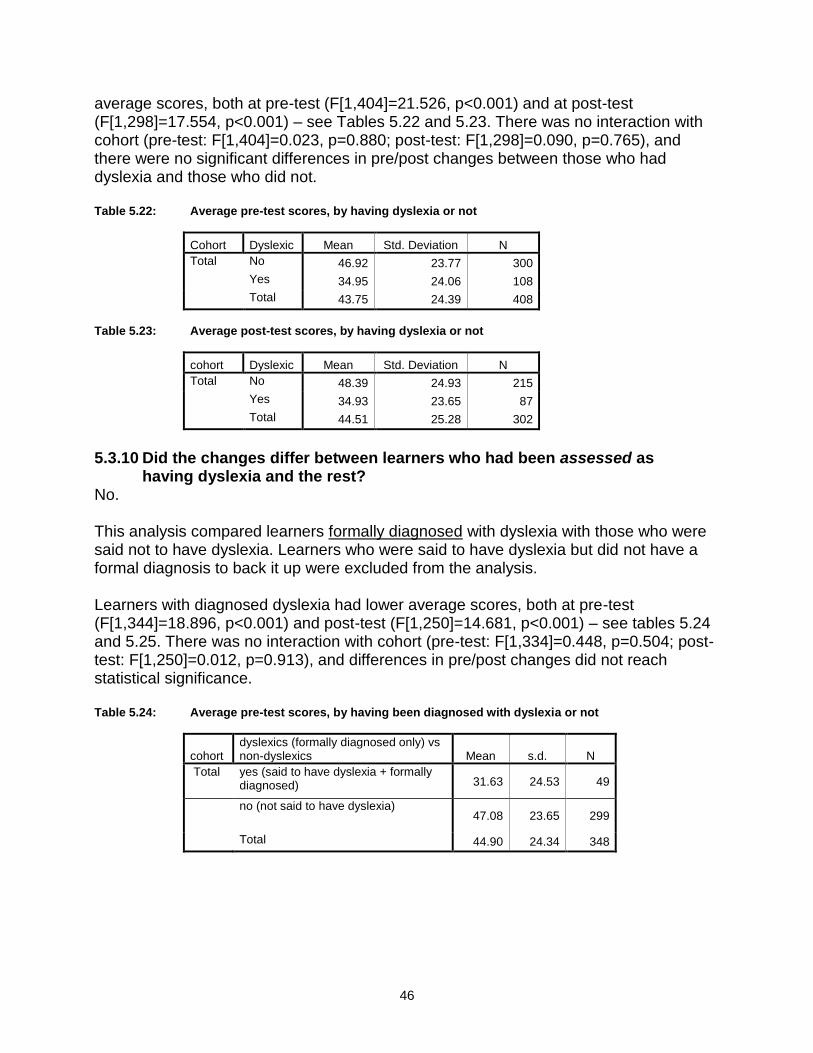
46
average scores, both at pre-test (F[1,404]=21.526, p<0.001) and at post-test (F[1,298]=17.554, p<0.001) – see Tables 5.22 and 5.23. There was no interaction with cohort (pre-test: F[1,404]=0.023, p=0.880; post-test: F[1,298]=0.090, p=0.765), and there were no significant differences in pre/post changes between those who had dyslexia and those who did not. Table 5.22: Average pre-test scores, by having dyslexia or not
Cohort Dyslexic Mean Std. Deviation N
Total No 46.92 23.77 300
Yes 34.95 24.06 108
Total 43.75 24.39 408
Table 5.23: Average post-test scores, by having dyslexia or not
cohort Dyslexic Mean Std. Deviation N
Total No 48.39 24.93 215
Yes 34.93 23.65 87
Total 44.51 25.28 302
5.3.10 Did the changes differ between learners who had been assessed as
having dyslexia and the rest? No. This analysis compared learners formally diagnosed with dyslexia with those who were said not to have dyslexia. Learners who were said to have dyslexia but did not have a formal diagnosis to back it up were excluded from the analysis. Learners with diagnosed dyslexia had lower average scores, both at pre-test (F[1,344]=18.896, p<0.001) and post-test (F[1,250]=14.681, p<0.001) – see tables 5.24 and 5.25. There was no interaction with cohort (pre-test: F[1,334]=0.448, p=0.504; post-test: F[1,250]=0.012, p=0.913), and differences in pre/post changes did not reach statistical significance. Table 5.24: Average pre-test scores, by having been diagnosed with dyslexia or not
cohort dyslexics (formally diagnosed only) vs non-dyslexics Mean s.d. N
Total yes (said to have dyslexia + formally diagnosed) 31.63 24.53 49
no (not said to have dyslexia) 47.08 23.65 299
Total 44.90 24.34 348

47
Table 5.25: Average post-test scores, by having been diagnosed with dyslexia or not
cohort dyslexics (formally diagnosed only) vs non-dyslexics Mean s.d. N
Total yes (said to have dyslexia + formally diagnosed) 32.15 23.19 40
no (not said to have dyslexia) 48.59 24.81 214
Total 46.00 25.24 254
5.3.11 Summary So far, then, very few factors have been found which correlated with better progress in reading: gender (women on average mode slightly more progress than men), and (in the 2004/05 cohort only) occupational status (those who were employed/self-employed made more progress than those who were unemployed) and highest qualification (those with any FE qualification or an NVQ made more progress than those with age 16 or no qualifications). The next set of factors to be investigated are correlations with attitudes to literacy. 5.4 Attitudes questionnaire: descriptive statistics The responses on the 4-point scales in the questionnaire were converted to numerical form by ascribing scores of 1 and 4 to the responses at the left- and right-hand ends, respectively, and appropriate scores for the intermediate points. In the third section, on attitudes properly so called, some items were positively phrased and others negatively: for statistical analysis and presentation, the ‘polarity’ of the scores on the positive items was reversed so that all were compatible. Table 5.26 shows the average scores and standard deviations for the 21 items on the questionnaire for each of the three occasions. The mid-point of the scale was 2.5. For the reason given in the next section, statistical analyses were not carried out on individual items. 5.5 Attitudes questionnaire: factor analyses The attitudes questionnaire had been compiled ad hoc, that is, from a number of items used in previous studies and from others generated by the project team in an attempt to sample areas thought to be important. It was theory-driven only in so far as the research team and earlier colleagues held implicit theories about what was important, and worth investigating, about learners’ self-confidence, literacy activities, and attitudes properly so called. There was also a severe constraint on the length of questionnaire that adult literacy learners could reasonably be asked to complete; hence only a few items could be included on any aspect. The first step in the deeper analysis of the questionnaire data, therefore, was to investigate empirically whether the responses had a latent structure, that is, did they measure a single dimension of ‘attitude towards literacy and learning’, or several different dimensions, or were they largely independent of each other? These questions were important for two reasons: (1) if interpretable factors emerged they might bring the learners’ attitudes into sharper focus; (2) if a limited number of factors accounted for all or most of the items this would make the intended correlations with attainment easier.
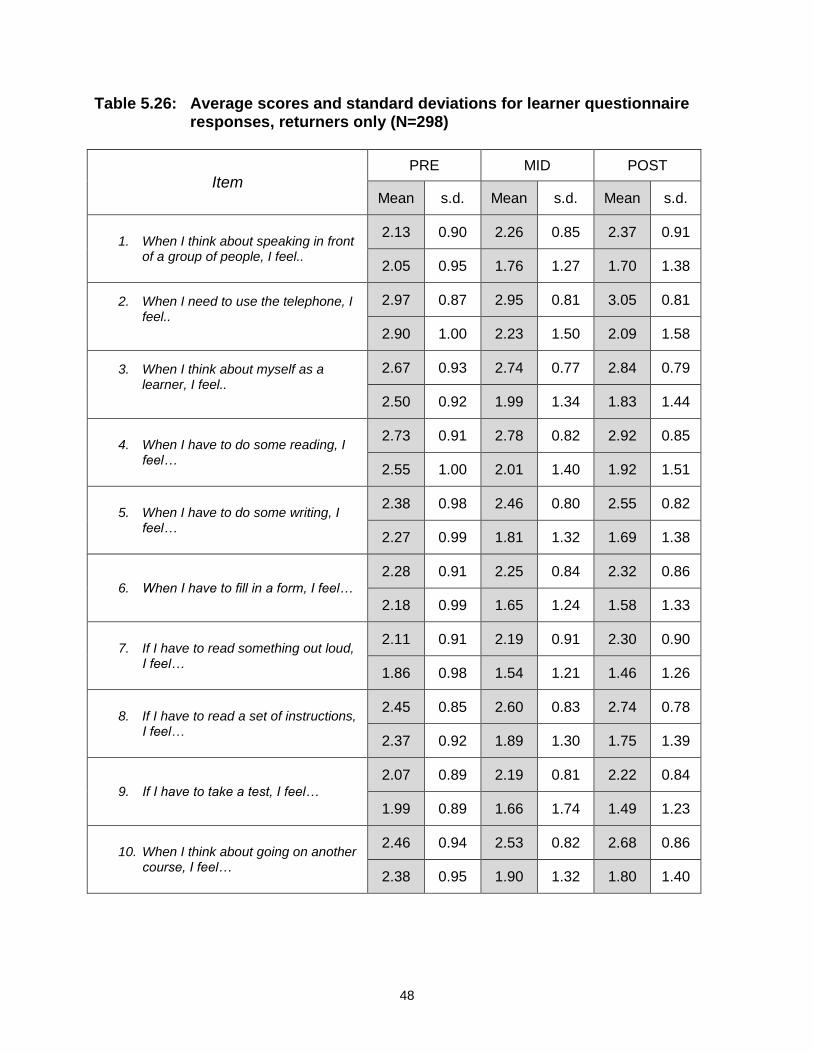
48
Table 5.26: Average scores and standard deviations for learner questionnaire responses, returners only (N=298)
Item
PRE MID POST
Mean s.d. Mean s.d. Mean s.d.
1. When I think about speaking in front of a group of people, I feel..
2.13 0.90 2.26 0.85 2.37 0.91
2.05 0.95 1.76 1.27 1.70 1.38
2. When I need to use the telephone, I feel..
2.97 0.87 2.95 0.81 3.05 0.81
2.90 1.00 2.23 1.50 2.09 1.58
3. When I think about myself as a learner, I feel..
2.67 0.93 2.74 0.77 2.84 0.79
2.50 0.92 1.99 1.34 1.83 1.44
4. When I have to do some reading, I feel…
2.73 0.91 2.78 0.82 2.92 0.85
2.55 1.00 2.01 1.40 1.92 1.51
5. When I have to do some writing, I feel…
2.38 0.98 2.46 0.80 2.55 0.82
2.27 0.99 1.81 1.32 1.69 1.38
6. When I have to fill in a form, I feel…
2.28 0.91 2.25 0.84 2.32 0.86
2.18 0.99 1.65 1.24 1.58 1.33
7. If I have to read something out loud, I feel…
2.11 0.91 2.19 0.91 2.30 0.90
1.86 0.98 1.54 1.21 1.46 1.26
8. If I have to read a set of instructions, I feel…
2.45 0.85 2.60 0.83 2.74 0.78
2.37 0.92 1.89 1.30 1.75 1.39
9. If I have to take a test, I feel…
2.07 0.89 2.19 0.81 2.22 0.84
1.99 0.89 1.66 1.74 1.49 1.23
10. When I think about going on another course, I feel…
2.46 0.94 2.53 0.82 2.68 0.86
2.38 0.95 1.90 1.32 1.80 1.40

49
Table 5.26: Average scores and standard deviations for learner questionnaire responses, returners only (N=298), cont.
Item
PRE MID POST
Mean s.d. Mean s.d. Mean s.d.
11. I read a newspaper
2.69 1.01 2.71 0.98 2.59 0.98
2.49 1.14 1.93 1.43 1.80 1.48
12. I read a book/magazine
2.76 0.87 2.81 0.94 2.85 0.91
2.49 1.06 1.90 1.34 1.76 1.42
13. I borrow a book from a library
1.66 0.83 1.70 0.92 1.71 0.84
1.58 0.94 1.20 0.99 1.17 1.10
14. I write a letter or postcard
1.92 0.87 2.07 0.94 2.04 0.86
1.91 0.99 1.42 1.11 1.32 1.18
15. I enjoy reading
3.15 0.83 3.01 0.91 3.07 0.73
3.12 0.89 3.59 1.06 3.70 1.10
16. I seldom see a book I want to read
2.54 0.96 2.57 0.90 2.45 0.83
2.41 1.06 1.85 1.37 1.76 1.43
17. I like reading non-fiction
2.61 0.98 2.68 0.94 2.82 0.95
2.87 1.09 3.23 1.36 3.49 1.31
18. I prefer watching television to reading
2.28 1.02 2.19 0.91 2.21 0.97
2.06 1.09 1.58 1.26 1.49 1.28
19. I only read what I have to
2.40 1.01 2.40 1.01 2.42 0.95
2.29 1.12 1.77 1.39 1.69 1.43
20. I like reading fiction (stories)
2.69 1.03 2.66 0.97 2.64 0.99
2.78 1.09 3.31 1.28 3.46 1.32
21. I like using the internet/world wide web
2.52 1.10 2.51 1.06 2.58 1.13
2.86 1.26 3.37 1.40 3.51 1.41

50
Factor analyses of the questionnaire as a whole and of its three sections separately were carried out, for each cohort. The findings were that:
- one item (no.21, ‘I like using the internet / world wide web’) correlated so poorly with the rest that it should only be reported as a single item and not aggregated with others for any purpose;
- no particularly useful factors emerged;
- further analyses should be based on the three existing sections of the questionnaire, which had at least some basis in theory. 5.6 Attitudes questionnaire: trends over time on the three sections and overall 5.6.1 Whole questionnaire Table 5.27 and Figure 5.2 illustrate changes in learners’ attitudes, by cohort. Table 5.27: Changes in learners’ attitudes, by cohort
cohort Mean Std. Deviation N
PRE-WHOLE QUESTIONNAIRE
03-04 49.00 8.49 119
04-05 47.66 8.52 179
Total 48.19 8.52 298
MID-WHOLE QUESTIONNAIRE
03-04 49.63 8.53 119
04-05 49.10 7.95 179
Total 49.31 8.17 298
POST-WHOLE QUESTIONNAIRE
03-04 50.66 8.39 119
04-05 50.78 7.88 179
Total 50.73 8.07 298
Figure 5.2: Changes in learners’ attitudes, by cohort
03-04 04-05
cohort
20.00
30.00
40.00
50.00
60.00
70.00
80.00
243
100
PRE-WHOLE QUESTIONNAIRE
MID-WHOLE QUESTIONNAIRE
POST-WHOLE QUESTIONNAIRE
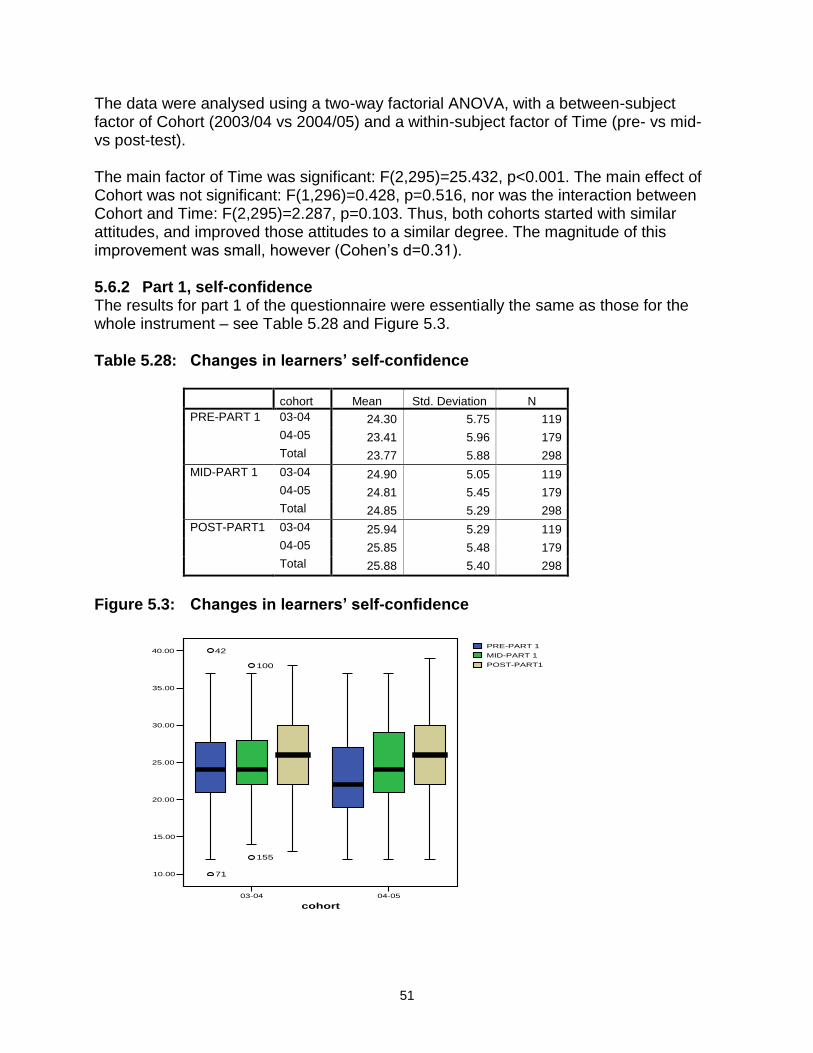
51
The data were analysed using a two-way factorial ANOVA, with a between-subject factor of Cohort (2003/04 vs 2004/05) and a within-subject factor of Time (pre- vs mid- vs post-test). The main factor of Time was significant: F(2,295)=25.432, p<0.001. The main effect of Cohort was not significant: F(1,296)=0.428, p=0.516, nor was the interaction between Cohort and Time: F(2,295)=2.287, p=0.103. Thus, both cohorts started with similar attitudes, and improved those attitudes to a similar degree. The magnitude of this improvement was small, however (Cohen’s d=0.31). 5.6.2 Part 1, self-confidence The results for part 1 of the questionnaire were essentially the same as those for the whole instrument – see Table 5.28 and Figure 5.3. Table 5.28: Changes in learners’ self-confidence
cohort Mean Std. Deviation N
PRE-PART 1 03-04 24.30 5.75 119
04-05 23.41 5.96 179
Total 23.77 5.88 298
MID-PART 1 03-04 24.90 5.05 119
04-05 24.81 5.45 179
Total 24.85 5.29 298
POST-PART1 03-04 25.94 5.29 119
04-05 25.85 5.48 179
Total 25.88 5.40 298
Figure 5.3: Changes in learners’ self-confidence
03-04 04-05
cohort
10.00
15.00
20.00
25.00
30.00
35.00
40.00
71
42
155
100
PRE-PART 1
MID-PART 1
POST-PART1
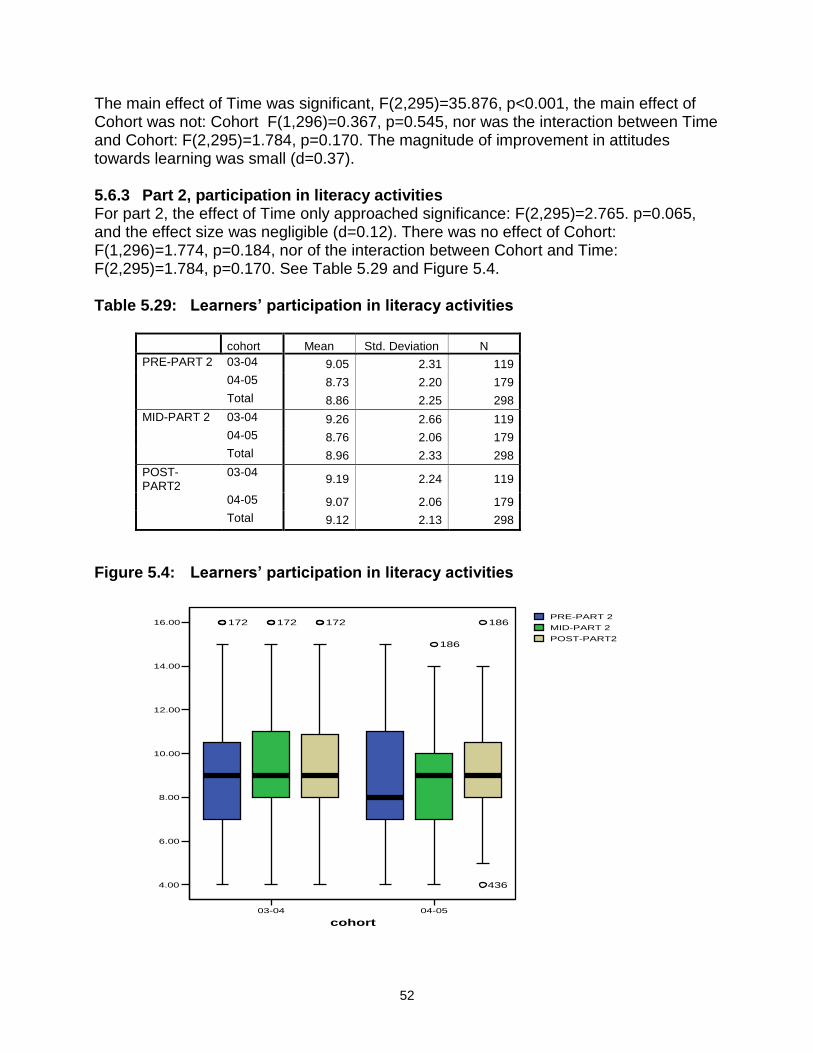
52
The main effect of Time was significant, F(2,295)=35.876, p<0.001, the main effect of Cohort was not: Cohort F(1,296)=0.367, p=0.545, nor was the interaction between Time and Cohort: F(2,295)=1.784, p=0.170. The magnitude of improvement in attitudes towards learning was small (d=0.37). 5.6.3 Part 2, participation in literacy activities For part 2, the effect of Time only approached significance: F(2,295)=2.765. p=0.065, and the effect size was negligible (d=0.12). There was no effect of Cohort: F(1,296)=1.774, p=0.184, nor of the interaction between Cohort and Time: F(2,295)=1.784, p=0.170. See Table 5.29 and Figure 5.4. Table 5.29: Learners’ participation in literacy activities
cohort Mean Std. Deviation N
PRE-PART 2 03-04 9.05 2.31 119
04-05 8.73 2.20 179
Total 8.86 2.25 298
MID-PART 2 03-04 9.26 2.66 119
04-05 8.76 2.06 179
Total 8.96 2.33 298
POST-PART2
03-04 9.19 2.24 119
04-05 9.07 2.06 179
Total 9.12 2.13 298
Figure 5.4: Learners’ participation in literacy activities
03-04 04-05
cohort
4.00
6.00
8.00
10.00
12.00
14.00
16.00 172 172
186
172
436
186PRE-PART 2
MID-PART 2
POST-PART2
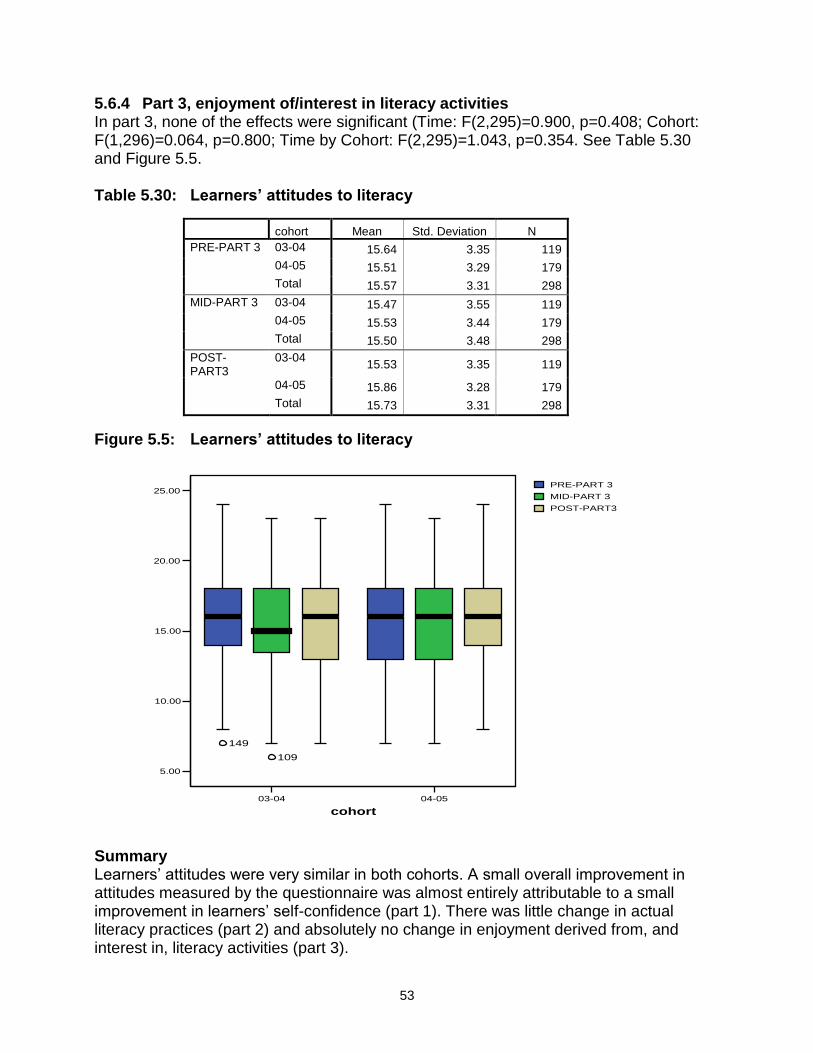
53
5.6.4 Part 3, enjoyment of/interest in literacy activities In part 3, none of the effects were significant (Time: F(2,295)=0.900, p=0.408; Cohort: F(1,296)=0.064, p=0.800; Time by Cohort: F(2,295)=1.043, p=0.354. See Table 5.30 and Figure 5.5. Table 5.30: Learners’ attitudes to literacy
cohort Mean Std. Deviation N
PRE-PART 3 03-04 15.64 3.35 119
04-05 15.51 3.29 179
Total 15.57 3.31 298
MID-PART 3 03-04 15.47 3.55 119
04-05 15.53 3.44 179
Total 15.50 3.48 298
POST-PART3
03-04 15.53 3.35 119
04-05 15.86 3.28 179
Total 15.73 3.31 298
Figure 5.5: Learners’ attitudes to literacy
03-04 04-05
cohort
5.00
10.00
15.00
20.00
25.00
149
109
PRE-PART 3
MID-PART 3
POST-PART3
Summary Learners’ attitudes were very similar in both cohorts. A small overall improvement in attitudes measured by the questionnaire was almost entirely attributable to a small improvement in learners’ self-confidence (part 1). There was little change in actual literacy practices (part 2) and absolutely no change in enjoyment derived from, and interest in, literacy activities (part 3).

54
5.7 Correlations between attainment and attitudes This section is an attempt to address the question:
Did the changes in reading attainment depend on attitudes towards literacy, or on change in those attitudes during the course?
Weakly and inconsistently. Table 5.31 shows the relationship between questionnaire scores, and changes in them, and pre-test reading scores; Table 5.32 shows the relationship between questionnaire scores, and changes in them, and post-test reading scores. In all cases the two cohorts are combined. In these Tables and in Table 5.33 the pre/post differences in attitudes are expressed in terms of (post attitudes score) minus (pre attitudes score), so a positive value for a cor-relation indicates an improvement in attitudes, a negative value indicates a deterioration. Learners’ reading scores at pre- and post-tests generally showed a weak but significant relationship with questionnaire scores. The better the attitudes towards literacy (or the more regular the literacy practices), the better the reading scores. There was little relationship between the changes in questionnaire scores and the reading scores at either point. Table 5.31: Correlations between questionnaire scores, and changes in them, and pre-test reading
scores
Occasion/difference, and section/whole of questionnaire
Correlation with pre-test reading scores
PRE - PART 1 0.107* PRE - PART 2 0.131** PRE - PART 3 0.175** PRE - WHOLE QUESTIONNAIRE 0.173** POST - PART 1 0.090 POST - PART 2 0.128* POST - PART 3 0.122* POST - WHOLE QUESTIONNAIRE 0.145** POST-PRE DIFFERENCE - PART 1 0.010 POST-PRE DIFFERENCE - PART 2 -0.006 POST-PRE DIFFERENCE - PART 3 0.037 POST-PRE DIFFERENCE - WHOLE QUESTIONNAIRE
0.023
* p<0.05 ** p<0.01

55
Table 5.32: Correlations between questionnaire scores, and changes in them, and post-test reading scores
Occasion/difference, and section/whole of questionnaire
Correlation with post-test reading scores
PRE - PART 1 0.067 PRE - PART 2 0.154** PRE - PART 3 0.158** PRE - WHOLE QUESTIONNAIRE 0.151** POST - PART 1 0.034 POST - PART 2 0.139* POST - PART 3 0.169* POST - WHOLE QUESTIONNAIRE 0.129* POST-PRE DIFFERENCE - PART 1 0.040 POST-PRE DIFFERENCE - PART 2 0.033 POST-PRE DIFFERENCE - PART 3 -0.014 POST-PRE DIFFERENCE - WHOLE QUESTIONNAIRE
0.031
* p<0.05 ** p<0.01
But did attitudes at either point, or changes in them, correlate with changes in reading? The data are shown in Table 5.33. Table 5.33: Correlations between attitudes to literacy (and changes in them) and changes in reading
scores
Occasion/difference, and section/whole of questionnaire
Correlation with change in reading scores
PRE - PART 1 -0.082 PRE - PART 2 0.080 PRE - PART 3 0.035 PRE - WHOLE QUESTIONNAIRE -0.021 POST - PART 1 -0.096 POST - PART 2 0.056 POST - PART 3 0.160** POST - WHOLE QUESTIONNAIRE 0.016 POST-PRE DIFFERENCE - PART 1 0.003 POST-PRE DIFFERENCE - PART 2 -0.022 POST-PRE DIFFERENCE - PART 3 0.142* POST-PRE DIFFERENCE - WHOLE QUESTIONNAIRE
0.064
* p<0.05 ** p<0.01
Scores on parts 1 and 2 and on the whole questionnaire (and the changes in those scores) were not related to the changes in reading scores. Only part 3 of the Questionnaire (items 15-20, asking about enjoyment derived from reading) showed a fairly consistent relationship with the magnitude of change. Learners who benefited more from the classes tended to score higher on this part at post-test,

56
and also showed a greater shift in their attitudes (in the positive direction). Those relationships were very weak, however (less than 2% of shared variance). This finding does not contradict the earlier finding that there was a significant improvement in learners’ self-confidence: that did not correlate with improvement in reading, and the correlation of better attitudes with better progress was true at both pre- and post-assessment. In other words, the correlation with attitudes depended on learners already having better attitudes to start with, and did not depend on their improving. 5.8 Attendance Two questions about correlations between attendance are tackled in this section. 5.8.1 Did the changes in reading attainment depend on regularity of attendance? Yes, but weakly and inconsistently. Learners for whom both pre-to-mid and mid-to-post attendance data were available (N=278) attended, on average, around 30 hours in those two periods. This figure does not fully represent the attendance of the typical learner in a year, for two reasons. First, it does not include the three assessment sessions themselves – two thirds of the learners in the study attended all three, and about six hours should be added to the average for the year on this basis. Secondly, it does not include any sessions attended before the pre-assessment or after the post-assessment. This would particularly affect the figure for 2003/04 because the pre-assessments in that year occurred somewhat later than those in 2004/05 – none earlier than November 2003 and some as late as January 2004. Where adult literacy courses run for an academic year, they typically (though a few run longer, or offer more hours per session) provide one two-hour session a week for about 30 weeks, total about 60 hours. On the basis of the average attendance of the learners in the 2004/05 sample (36 hours), and adding six hours for the assessment sessions and, say, three hours for sessions early and late in the year, the project team estimated that the average learner’s attendance in a year was probably about 45 hours, or three quarters of the available time. The project team also estimated that the average length of time between the pre and post assessments across the two years was about six calendar months (26 weeks); taking out six weeks for the Christmas and Easter breaks and two more weeks for a half-term and the mid assessment would leave 18 weeks. Given that the maximum amount of attendance in 18 weeks would therefore be 36 hours, an average of 30 hours would actually represent quite regular attendance. These provisos need to be borne in mind when interpreting the analyses of reading scores against attendance, as does the caveat at the end of section 2.6: many learners spend too few hours in provision in a year to make significant progress. The two cohorts showed different patterns of relationship between attendance and change – see Figure 5.6.

57
Figure 5.6: Scattergrams of attendance vs change in reading scores, by cohort
2003/04 cohort 2004/05 cohort
0.00 10.00 20.00 30.00 40.00 50.00 60.00 70.00
attendance pre-post (sum)
-40.00
-30.00
-20.00
-10.00
0.00
10.00
20.00
30.00
Pre
_po
st c
han
ge
in A
LA
S s
tan
dar
d s
core
s
R Sq Linear = 0.077
0.00 10.00 20.00 30.00 40.00 50.00 60.00 70.00
attendance pre-post (sum)
-30.00
-20.00
-10.00
0.00
10.00
20.00
30.00
40.00
Pre
_po
st c
han
ge
in A
LA
S s
tan
dar
d s
core
s
R Sq Linear = 0.012
In the 2003/04 cohort, attendance and change were correlated positively (albeit weakly): more regular attendance was associated with a smaller decrease in reading scores. However, in the 2004/05 cohort a non-significant trend in the opposite direction was observed: learners who attended more tended to improve somewhat less. When the two cohorts are taken together, the relationship is positive and significant (greater attendance was associated with greater improvement) but very weak. There is no obvious explanation for these findings. 5.8.2 Did the changes in reading attainment depend on the group (class)
attended? Probably. The classes were clearly different in their pre-test and post-test average reading skills:
2003/04 cohort 2004/05 cohort
pre-test: F(23,151)=5.553, p<0.001 post-test: F(22,109)=5.703, p<0.001
pre-test: F(23,151)=5.553, p<0.001 post-test: F(22,109)=5.703, p<0.001
Therefore courses were in some cases recruiting very different types of learner – as was clear from the nature of the special learners discussed in section 4.5. At first glance, classes differed markedly in average change in reading scores – see Tables 5.34 and 5.35. In the 2003/04 cohort, the best class improved its average performance by almost 5 points, while the worst experienced an almost 12 point decrease. Similarly, in the 2004/05 cohort, the best class improved by 19 points, while the worst got worse by 3 points. A one-way ANOVA carried out on the 2003/04 cohort data showed the between-class differences approached significance: F(22,109)=1.578, p=0.065. The differences for the 2004/05 cohort were significant: F(33,150)=1.905, p=0.005. So, although the classes were very small, differences between them were probably not just random fluctuations.

58
Table 5.34: Average change in reading scores by class, 2003/04 cohort
N Mean Std. Deviation
51 6 -7.33 9.14
52 9 -2.89 10.35
53 6 -11.17 5.81
54 6 -11.17 15.07
55 4 -10.25 4.50
56 7 -4.29 7.67
81 4 -4.75 2.50
82 7 -10.00 8.21
83 4 -8.25 15.50
91 5 2.60 5.27
111 6 -12.83 8.30
112 4 -5.50 6.45
113 7 -4.00 11.42
121 4 -12.75 4.03
171 6 -2.67 8.07
172 7 -.14 10.95
173 5 -6.00 2.74
174 6 -8.83 15.35
191 3 -7.33 18.15
241 7 4.86 9.44
271 7 -9.14 8.93
291 6 3.00 12.21
292 6 -9.83 6.82
Total 132 -5.72 10.26

59
Table 5.35: Average change in reading scores by class, 2004/05 cohort
N Mean Std. Deviation
57 7 -1.14 5.76
58 8 4.25 6.92
84 9 8.67 8.32
85 7 1.57 9.78
86 4 -2.75 13.07
92 5 16.20 14.82
114 4 10.50 18.38
115 6 10.83 13.20
116 5 12.40 4.51
175 7 10.29 9.46
176 6 -.33 4.93
177 8 13.13 14.88
178 5 7.20 12.21
192 6 6.00 4.90
242 6 5.33 5.09
293 3 4.33 7.51
331 9 -3.11 10.01
361 2 .50 3.54
362 7 5.86 11.68
401 6 15.00 10.99
411 3 3.00 14.80
421 5 11.00 9.70
422 5 8.60 8.88
431 5 1.60 13.39
441 5 3.40 7.57
451 5 7.80 8.26
452 7 18.00 5.23
471 4 -2.75 6.34
481 4 1.75 7.50
491 4 9.75 10.14
501 4 .75 10.44
502 4 19.00 14.17
541 5 2.40 15.57
561 4 8.00 5.83
Total 184 6.55 10.97
N.B. In this cohort there were two classes where none of the learners returned at the post-assessment; hence only 34 classes are listed.

60
5.9 Other provision attended
Did the changes in reading attainment depend on other provision attended during the course?
No. Somewhat less than half of learners were also attending some other provision. There was no correlation between attending other provision or not and change in reading scores. 5.10 Learners’ progression As an alternative source of insights on learners’ achievements, in the first year teachers were asked at the end of the year for information on whether their learners had achieved an accredited qualification and/or gone on to a further course of study. The results are shown in Tables 5.36 and 5.37; inevitably, there were larger than usual gaps in the data, especially on further study. Table 5.36: Accredited qualification achieved, first cohort
All learners on whom
information was available Returners only
Frequency Percent Frequency Percent
None 61 40.7 37 33.3
Entry Level 43 28.7 35 31.5
Level 1 or 2 46 30.7 39 35.1
Total 150 100.0 111 100.0
Table 5.37: Further course of study, first cohort
All learners on whom
information was available Returners only
Frequency Percent Frequency Percent
None 18 12.0 9 8.1
Same course 25 16.7 25 22.5
New course 62 41.3 55 49.5
Missing 45 30.0 22 19.8
Total 150 100.0 111 100.0
The number of returners in the first cohort was 119, so the data on their achievement of a qualification were nearly complete; they show that two thirds (74) had done so. A further 16 non-returners (out of 65; 25%) were also known to have achieved a qualification. At first sight, this is a remarkable contrast to the reading data gathered by the study – but it may be that the accreditations achieved were actually certifying where learners already were, rather than attesting to progress.

61
Also, 70 returners (nearly two thirds) had started a further course, whether the same or a new one, and seven non-returners (11%) were also known to have done so. 5.11 Summary The following table summarises the factors that appeared to be related to changes in reading attainment. Also, here is a list of factors that were not found to be significantly related to change in reading: age, English as L1 or L2, ethnicity, age of leaving full-time education, time since last course, having dyslexia, having a formal diagnosis of dyslexia, attending other provision, scores at pre-test. Table 5.38: Summary of factors associated with change in reading attainment
Variable Finding
Gender Changes in scores were slightly better for women than for men.
Occupational status
In the 2004/05 cohort only, employed/self-employed improved more than unemployed.
Formal qualifications
In the 2004/05 cohort only, learners with any FE or NVQ qualifications improved significantly more than those with no qualifications or CSE/GCSE/O-Level.
Attendance Better attendance was associated very weakly with improvement.
Literacy attitudes and practices (Learners’ Questionnaire)
Better attitudes (and greater improvement in attitudes) were associated with better change. The effects were very weak, limited mostly to part 3 of the Questionnaire, and not fully consistent across cohorts.
Class attended There were strong differences between classes in the amount of progress.
The last item immediately raises the question, Were the differences in progress between classes related to how the teachers taught? Chapter 6 lays the groundwork for this by describing what went on in the classrooms, and chapter 7 then addresses the actual question.

62
Chapter 6 Teachers’ practice
Maxine Burton The focus in this chapter is firstly on building up a profile of the observed teachers in terms of gender, qualifications and experience (section 6.1). Then their concerns as teachers are analysed, with the issues grouped under separate headings to correspond with the main themes that emerged (6.2); further issues arising from the feedback/ consultation days are then explored (6.3). We then move onto classroom practice with an examination of classroom layouts and teaching materials (6.4) and patterns of grouping (6.5). Descriptive statistics follow for general teaching strategies and opportunities for learner involvement (6.6) and specific strategies (6.7). Section 6.8 provides illustrations and analyses of three specific teaching strategies, namely formative assessment, ‘talking points’, and the use of phonics. 6.1 Teachers’ profiles During 2003/04, 19 semi-structured interviews were conducted, one with each of the participating teachers, on completion of the four (or in the case of the four teachers observed teaching two classes each, eight) observations of their classes. A further 30 interviews took place in 2004/05, of which three were with teachers who had also been interviewed the previous year. (Of the five teachers who were not interviewed in 2004/05, two had already been interviewed previously.) The information from these interviews is tabulated in Table 6.1. Gender Of the 47 different teachers observed over the two years, 36 were female and 11 male. Eight of the female teachers were observed twice1 and one three times2, but only one male teacher was observed more than once3. Thus the great majority – 78% – of classes observed were given by female teachers (46 classes out of 59). Qualifications Core curriculum training had been undertaken by all but one teacher. When questioned about their teaching qualifications, teachers provided information both on their generic teaching qualifications, which ranged from the ‘legacy’ FE 7407 qualification right up to PGCE, and also on adult literacy qualifications, which ranged from the City and Guilds 9282 (originally devised as a volunteer’s qualification) right up to the (then) new Level 4 qualification. Only 3 teachers out of the 44 on whom this information was available had no generic teaching qualification; 16 teachers had a Cert Ed and 13 a PGCE, with 1 having both. Nearly half (20 out of the 44) had no basic skills qualification, but only one teacher had neither generic nor basic skills teaching qualifications.
1 Classes 171,172; 052,055; 081,086; 091,092; 174,176; 173,178; 241,242; 361,362 2 classes 291,292,293 3 classes 053,054,057

63
Table 6.1: Information on the observed teachers Teacher’s class ID & gender
Teaching qualifications
Previous teaching
Years of experience in basic skills
Number of regular assistants
Range of learner numbers (total in class, including those not in project)
041 F (2) NOT INTERVIEWED 1 11-15
051 F PGCE 9282, 9285
Maths GCSE/ A-Level
12 1 8-11
052, 055 F
PGCE 9285
Primary, secondary
26 052 - 1-2 6-10
055 - 1 6-8
053, 054, 057 M
Teaching Cert, Dip special/ remedial ed, 9282/3
Primary, secondary; badminton, history, geography
3-4 053 - 2-3 3-6
054 - none 2-8
057 - none (except carer for 1 learner)
6-8
056 F PGCE 9281/2/5
ESOL (children); psychology
8 1-2 10-14
058 F PGCE, T30, 9282/5
GCSE/A-Level maths
12 1-2 5-13
081, 086 F PGCE Infants 22 081 - none 4-7
086 - none 3-5
082 F Cert Ed No basic skills qualification
infant 13 1 7-9
083 M Cert Ed No basic skills qualification
No CC training
ESOL new 1 4-7
084 F Cert Ed, C&G 7407, 9281
None 3 none 9-11
085 F PGCE, level 4 numeracy
None Nearly 2 1-2 4-9
091, 092 F PGCE, TEFL Secondary French
6 091 - 4-5 6-8
092 - 4 8-10
111 F PGCE 9282
Primary and secondary adult ed (langs)
5 none 3-6
112 F Cert Ed, 9285 PE (secondary) 17 1-2 5-8
113 F CertEd, 9282/3 primary 5 1-2 5
114 M C&G 7307, 9282/3
None (except short time as volunteer)
4 3-4 6-7
115 F Cert Ed Primary Primary 4-5 2 3-6
116 F PGCE Primary 3 2 7-8
121 F 7307, 9282/5 none 9 1 5-6
171,172 F Cert Ed, B.Ed Primary/ secondary/ FE
2 171 – None 4
172 – none 4-7
173, 178 F 9282/3, 9295 Work-based training
new teacher 173 - 1 5
178 - none 5-7
174, 176 F Cert Ed Primary 20 174 - none 5-7
176 - none 6-9
175 F RSA diploma, none 20 1 7-9
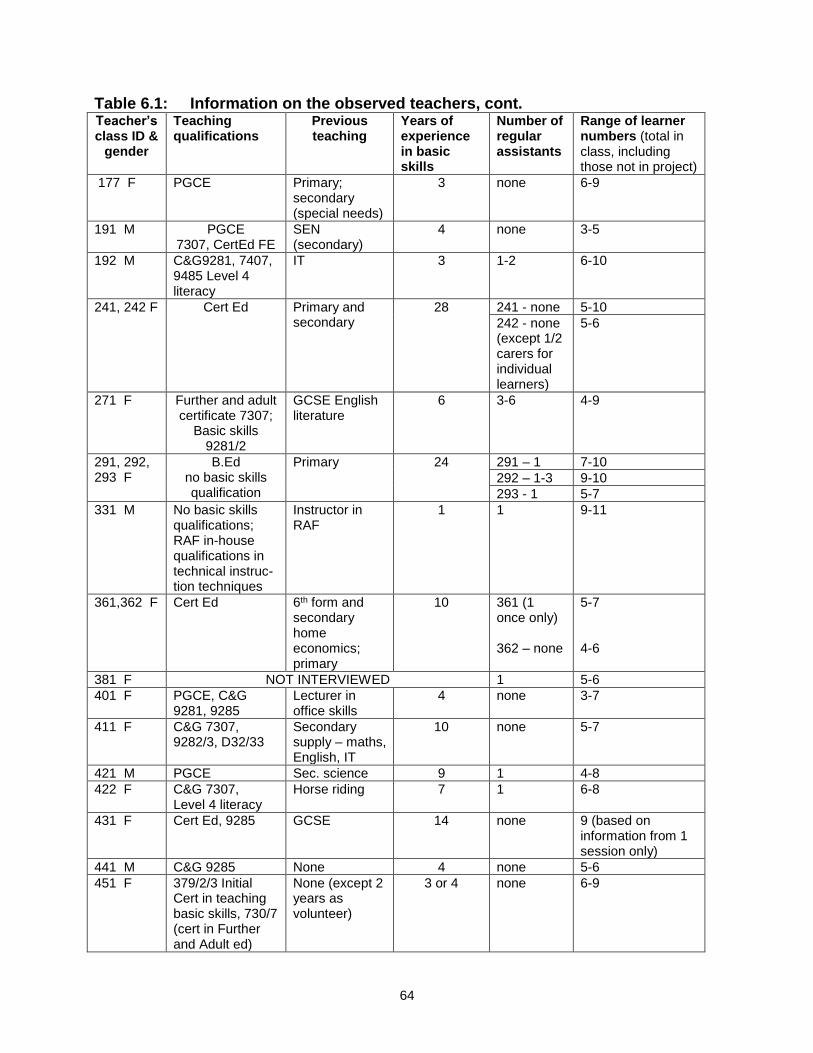
64
Table 6.1: Information on the observed teachers, cont. Teacher’s class ID &
gender
Teaching qualifications
Previous teaching
Years of experience in basic skills
Number of regular assistants
Range of learner numbers (total in class, including those not in project)
177 F PGCE Primary; secondary (special needs)
3 none 6-9
191 M PGCE 7307, CertEd FE
SEN (secondary)
4 none 3-5
192 M C&G9281, 7407, 9485 Level 4 literacy
IT 3 1-2 6-10
241, 242 F Cert Ed Primary and secondary
28 241 - none 5-10
242 - none (except 1/2 carers for individual learners)
5-6
271 F Further and adult certificate 7307;
Basic skills 9281/2
GCSE English literature
6 3-6 4-9
291, 292, 293 F
B.Ed no basic skills qualification
Primary 24 291 – 1 7-10
292 – 1-3 9-10
293 - 1 5-7
331 M No basic skills qualifications; RAF in-house qualifications in technical instruc-tion techniques
Instructor in RAF
1 1 9-11
361,362 F Cert Ed 6th form and secondary home economics; primary
10 361 (1 once only) 362 – none
5-7 4-6
381 F NOT INTERVIEWED 1 5-6
401 F PGCE, C&G 9281, 9285
Lecturer in office skills
4 none 3-7
411 F C&G 7307, 9282/3, D32/33
Secondary supply – maths, English, IT
10 none 5-7
421 M PGCE Sec. science 9 1 4-8
422 F C&G 7307, Level 4 literacy
Horse riding 7 1 6-8
431 F Cert Ed, 9285 GCSE 14 none 9 (based on information from 1 session only)
441 M C&G 9285 None 4 none 5-6
451 F 379/2/3 Initial Cert in teaching basic skills, 730/7 (cert in Further and Adult ed)
None (except 2 years as volunteer)
3 or 4 none 6-9

65
Table 6.1: Information on the observed teachers, cont. Teacher’s class ID &
gender
Teaching qualifications
Previous teaching
Years of experience in basic skills
Number of regular assistants
Range of learner numbers (total in class, including those not in project)
452 M 730/7, 928/1/2 None except as trainer of bank staff
5 none 4-5
471 M PGCE, Level 4 literacy
University teaching (theology)
2 1 6-7
481 F NOT INTERVIEWED none 3-5
491 F 7307 None (except as volunteer)
4 2 4-6
541 F Cert Ed, 9285, D32/33
None (except as volunteer)
10 none 6
501 F Cert Ed, 9285, level 4
Primary and secondary (geography)
15 1-2 4-5
502 F PGCE, 9285 TEFL 15 3 4
561 M PGCE, TEFL, 9281/2
ESOL 3 none 4-10
Experience Over three quarters of those interviewed (34) had additional teaching experience in other subjects, as can be seen in Table 6.1. Nearly half of these teachers (16 of the 34) had infant or primary school experience. All but two had previous basic skills teaching experience, which varied from one year to 28 years, with a mean of nearly 9 years, as shown in Table 6.2.
Many of the teachers with the highest number of years’ experience (20, 22, 24 and 28 years) were the ones with generic but not basic skills teaching qualifications. The three teachers without any generic qualification were amongst those with less experience (0, 1 and 4 years).
6.2 The teachers’ concerns Some of these concerns were prompted by specific questioning from the practitioner-researchers, on the topics of attitudes to the Core Curriculum and to assistance in the classroom. Other concerns were voiced as additional comments, recorded by the practitioner-researchers but not usually initiated by them. These were on a variety of issues that were raised independently and were presumably particularly important to the teachers. The responses to the two specific questions on the Adult Literacy Core Curriculum and assistance in the classroom are analysed first, followed by other concerns.
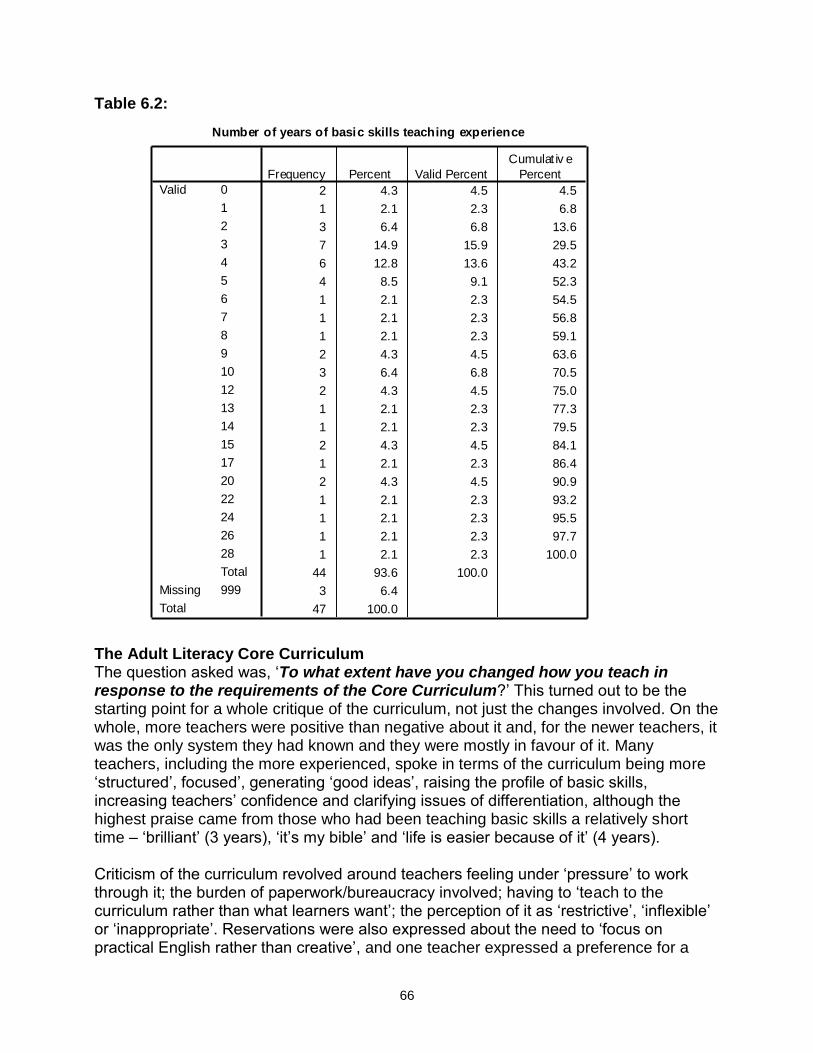
66
Table 6.2:
Number of years of basic skills teaching experience
2 4.3 4.5 4.5
1 2.1 2.3 6.8
3 6.4 6.8 13.6
7 14.9 15.9 29.5
6 12.8 13.6 43.2
4 8.5 9.1 52.3
1 2.1 2.3 54.5
1 2.1 2.3 56.8
1 2.1 2.3 59.1
2 4.3 4.5 63.6
3 6.4 6.8 70.5
2 4.3 4.5 75.0
1 2.1 2.3 77.3
1 2.1 2.3 79.5
2 4.3 4.5 84.1
1 2.1 2.3 86.4
2 4.3 4.5 90.9
1 2.1 2.3 93.2
1 2.1 2.3 95.5
1 2.1 2.3 97.7
1 2.1 2.3 100.0
44 93.6 100.0
3 6.4
47 100.0
0
1
2
3
4
5
6
7
8
9
10
12
13
14
15
17
20
22
24
26
28
Total
Valid
999Missing
Total
Frequency Percent Valid Percent
Cumulat iv e
Percent
The Adult Literacy Core Curriculum The question asked was, ‘To what extent have you changed how you teach in response to the requirements of the Core Curriculum?’ This turned out to be the starting point for a whole critique of the curriculum, not just the changes involved. On the whole, more teachers were positive than negative about it and, for the newer teachers, it was the only system they had known and they were mostly in favour of it. Many teachers, including the more experienced, spoke in terms of the curriculum being more ‘structured’, focused’, generating ‘good ideas’, raising the profile of basic skills, increasing teachers’ confidence and clarifying issues of differentiation, although the highest praise came from those who had been teaching basic skills a relatively short time – ‘brilliant’ (3 years), ‘it’s my bible’ and ‘life is easier because of it’ (4 years). Criticism of the curriculum revolved around teachers feeling under ‘pressure’ to work through it; the burden of paperwork/bureaucracy involved; having to ‘teach to the curriculum rather than what learners want’; the perception of it as ‘restrictive’, ‘inflexible’ or ‘inappropriate’. Reservations were also expressed about the need to ‘focus on practical English rather than creative’, and one teacher expressed a preference for a

67
previous syllabus (OCN Routes through English). The DfES-produced booklets were criticised as always needing to be adapted, as they offered insufficient coverage of topics. Assistance in the classroom The question here was, ‘Do you welcome help from volunteers/assistants?’ A few teachers reacted with a simple Yes; many more expanded on their replies. The overwhelming majority were broadly in favour, whether or not they actually had assistance in the class, one exception describing them as only ‘a mixed blessing’. Just over half the classes observed (31) regularly had assistants and/or volunteers, but 28 classes out of the total of 59 had no assistance available for any of the observed sessions. It is difficult to make any generalisations about the ratios of learners to staff and the effect of assistants in this connection. As Table 6.1 shows, learner/staff ratios could vary from virtually 1:1 when there were multiple assistants and/or small classes, to 11:1 where there was no assistance. Learner numbers could fluctuate wildly from week to week, and it was not necessarily only the largest classes which had the benefit of assistants. Teachers who did have volunteer(s)/assistant(s) often said they ‘couldn’t manage without’ the help and wished they could have more. From the observations carried out, it seemed that most assistants, whether volunteers, learning/additional support workers or teaching trainees, were assigned to work on a one-to-one basis with individual learners, usually those at the lower levels in the class. They also undertook practical jobs like tea-making, photocopying, etc. The teachers saw the roles of their assistants in terms of:
Providing valuable help, including help ‘with odd jobs’, and/or moral support with larger/mixed ability classes
Supporting the weaker learners or those with dyslexia or learning difficulties
Working one-to-one to increase individual progress
Helping to keep learners on task/reducing time spent waiting for help
Taking the pre-entry/weaker learners ‘off my hands’
Just being there – ‘The more interaction with other adults the better. You get an interesting dynamic’ (052,055).
Reservations were also expressed. However, the six teachers who said in the interviews that they had started off as volunteers themselves seemed less critical of the shortcomings of their assistants. One teacher claimed that help was welcomed ‘as long as they are not dropped on me and as long as they do not overwhelm the group’, in other words issues of preparation and classroom dynamic. Occasionally former learners are employed as volunteers, and one teacher said that the problem with ex-learners was that, although they are ‘good salespeople’ they tend to confuse the learners owing to lack of training and ‘can sometimes want to show off. They like to fill the stereotype of the teacher’. But another teacher (and ex-volunteer) claimed that the best volunteers were ex-learners, the qualities of ‘people skills/patience’ being the most important. Other
68
reservations tended to revolve round the personal qualities and/or training of the volunteers and included:
The desirability of having properly trained volunteers. Several teachers mentioned this, regarding training as a way of ‘raising awareness of the difficulties learners face’ and more practically, teaching them ‘grammar’! However the teacher who valued people skills/patience most thought that the level 2 training requirements for volunteers were too high.
Issues of pedagogy – possible conflict between teaching strategies teachers want to use and what the assistant is happy doing; volunteers providing the answer for the learner rather than helping them find the answer.
Issues of volunteer dependability, for example not turning up every week.
Learners were thought to become too dependent on volunteer help.
Trainees (as opposed to volunteers/assistants) can actually mean more work for the teacher – although most teachers seemed to regard trainees as useful.
Limitations on the support possible from volunteers/assistants – ‘They’re not teachers’; volunteers, with limited basic skills themselves, are retained because of reliability and rapport with learners or given a more limited role, compared with more able volunteers who are given a role in planning; even when given specific tasks, they still ‘have to use their initiative’ and one teacher judged the quality of volunteers by their ability to extend what they’d been asked to do in response to the learner.
Other comments These covered a range of topics and, although for the most part unprompted, they seemed to fall into four main categories – administration, learners, resources and accommodation, and wider issues in basic skills teaching. Each will be discussed separately. Although some of the comments do suggest a measure of disillusionment with basic skills teaching, most of the teachers observed brought considerable energy and commitment to the classroom. Two even went as far as declaring how much they ‘loved’ the work. Administration The comments under this heading reflected similar concerns to those prompted by the question on the Core Curriculum. One teacher, who regularly said he felt overburdened with paperwork and subsequently left the profession, was not alone, as the following remarks show: there are now ‘too many hoops to jump through. You spend as much time on paperwork as on teaching’; pressures on teachers to produce additional paperwork also meant there was less time to plan properly and less time to develop projects for and with learners; and the amount of paperwork caused one teacher such stress that she resigned in the summer term. Learners Many teachers expressed detailed understanding of and concern for their learners, hence the high number of comments under this heading. Anxiety and frustration were expressed by many teachers when they felt a session had not gone as well as planned.

69
There was a frequent regret expressed at having to spread themselves too thinly – ‘I worry about not getting round them all, not giving them quality time’; it was difficult to give each learner enough attention. Indeed trying to give learners individual support was a high priority amongst the teachers. Dyslexic learners in a class were regarded as being in great need of this, and generally, for individuals who need a ‘great deal of support’, one-to-one tuition was regarded as essential; for learners who actually need to learn how to read, one-to-one help would be the way to achieve this, according to the teacher of a class where no help was available; another stated that ‘I don’t have the time for the one-to-one work although one-to-one is most profitable for learners; if I had one learner for 3 or 4 weeks, I could achieve so much’. There were concerns about irregular attendance and consequent lack of continuity and failure to make progress, but weekly classes were regarded as insufficient, anyway, for significant progress to be made. Learner absence was said to make planning, especially of group activities, difficult. There was also concern about provision for pre-entry learners by a JobCentre-plus teacher – learners were sent through, but failed to use skills, so regressed, or failed to complete the course, were sent back again, in an endless cycle. Elsewhere there was concern about provision for Entry 1/2 learners: in one case their class closed because of small numbers and, because of that provider’s streaming policy, they could not be accommodated in one of the higher-level classes. Resources and accommodation Teachers who had to operate away from a well-resourced centre or college felt at a disadvantage: for one teacher going out into the community, away from their resource ‘base’, it was difficult to deliver anything other than worksheet-based approaches; however, another teacher regarded working in community education as preferable as it made it easier to treat learners as individuals and not be so focused on targets; travelling between centres can create a difficulty with resources. One teacher, teaching in a room with no basic skills resources whatever (an art studio) said it would be ‘my dream to plan a lesson and know I have the resources to hand’. And there were concerns about stocks of certain resources, e.g. dictionaries, even at apparently well resourced centres, and audio cassettes to enable individual work to be managed more easily. There was also mention of a lack of suitable structured reading resources available for beginner readers. Wider issues in basic skills teaching Two teachers expressed strong views on pay: one commented that basic skills teaching was so badly paid, compared with her previous employment with a law firm, that ‘I shall have to think seriously about adult education as a career’; the other made the point that ‘since basic skills are now being taught by good quality, qualified staff, pay and conditions need to reflect this or the staff will not stay’. Further observations include the following: ‘It is good that basic skills is getting a higher profile, but it is not widely known that the courses are free’; some parts of level 4 training were perceived as not obviously relevant; teachers could still feel very isolated and they would all benefit from sharing ideas and resources, said a teacher running an evening class.

70
Conclusion The adult literacy workforce emerged from the interviews as on the whole well-qualified and experienced. There were strong feelings about excessive bureaucracy, and inadequate pay and conditions prompted some teachers to speak out. Others, if they had been specifically asked, might well have voiced similar views; nevertheless, the overarching concern that emerged was about doing justice to their learners and their needs. In this they felt thwarted by the burden of paperwork, and at times limited or non-existent resources, lack of (suitably trained) help in the classroom and the consequent difficulty of giving each individual learner the help that they needed within large and/or mixed-level classes. Furthermore, the views stated about the benefits and drawbacks of volunteers and assistants give some helpful pointers for improving training and classroom practice.
6.3 Issues arising from consultations Introduction In addition to regular training and consultation meetings at the University of Sheffield for the practitioner-researchers, three special consultation and feedback events were held – in September 2004, at the end of the first year’s data collection, in September 2005, to mark the conclusion of fieldwork, and in February 2006 before the writing of this report. All these meetings were attended by the project team, including most of the practitioner-researchers, and several of the observed teachers. The 2005 meeting was also attended by six of the learners who had participated in the project. Each of the days is described in turn, concentrating on the main themes and issues that arose; some highlights from the session transcripts are also included where they help to illustrate significant points. 6.3.1 The first consultation/feedback day, 8 September 2004 Seventeen people, including ten teachers, attended this day. The main points have been grouped under separate thematic headings. General impact of participation in project on the learners and teachers
Most teachers reported their learners as interested in the project and happy to be involved.
They found the observations unobtrusive.
One teacher claimed she actually enjoyed being observed and another that ‘it was nice to have someone do the watching’.
One teacher said it made her feel nervous, although the observations were carried out in a friendly and informal way.
One teacher said he liked the idea of contributing to something that would make a difference.
The assessments
They were well liked as such. One teacher reported her learners as wanting to take the assessment materials home with them.
Assessment fatigue had set in generally by the time of the post-assessment and few were keen to do it a third time.

71
The assessments seemed to come rather close together. This was partly due to the late start to fieldwork. However, there was some concern that an earlier start would have meant that our assessment would follow too soon after the teachers’ initial assessments of their learners.
A distinction was made between the reactions of learners at lower and higher levels. Those who were more able and found it easy (Levels 1 and 2) were happier to keep doing the assessments than those at Entry level. They also had the expectation of taking an exam (national test).
The fact that they were standardised had drawbacks (see below under learner progress).
Effect on their teaching
Overwhelmingly, the teachers said that being observed didn’t affect how they planned their lessons or taught them; various reasons were given for this: they had been told by fieldworkers not to change anything and took that seriously; they were relaxed enough to have the attitude of ‘take us as you find us’; and due to pressure of time there was little opportunity to change anything.
The point was made that anyone coming into the profession now was used to being observed.
The only thing reported that happened differently was more care with the production of worksheets/extra copies in response to the fieldworkers’ requirement to have materials.
The questions asked of the teachers about their teaching were described as ‘rigorous’ but, according to one teacher, only reflected aspects of their teaching that the teachers thought about anyway. It was also difficult to give fieldworkers much attention after a lesson.
One teacher was ‘alarmed’, on reflection, by how little teaching of reading she had actually done.
It was difficult to answer the question on how much progress they thought their learners had made (see below).
They would all have welcomed feedback from the observations – because, as one teacher expressed it, ‘everyone just wants to improve their teaching’.
Reflections on learner progress and ways of measuring it
It was hard to judge how much progress a learner had made immediately after the end of the lesson. Suggestions of how much time was needed before evaluation could be made varied from a couple of weeks to a couple of years.
The limitations of standardised tests as a way of measuring progress were recognised; the real measure of progress concerned what happened outside the classroom (e.g. reading to a child, completing an absence slip) and involved self-reporting.
There was some doubt about the progress that could be made at Entry 1 and 2. It was suggested that it was more a question of increasing confidence at the lower levels. One teacher stated that their greatest role is to give people confidence.

72
The national test creates the possibility of failure and was compared unfavourably with Wordpower and OCN, which didn’t put pressure on the learners and helped them to feel successful.
Illustration from the transcript: discussion amongst teachers in response to the question, ‘How do learners recognise their own progress?’ H: They come saying they can’t do something. Then they say, ‘I’ve done this’, ‘I’ve read to my daughter..’ S: They can write an absence slip P: Had read a letter from the doctor’s and had arranged an appointment. They tell you what they’ve done. It’s real world stuff. S: That’s what matters M: Each year, I ran my own in-house diagnostic. I saw a difference in their attitude, confidence had improved. H: They’ve had a go Gi: When they join, they feel they’re the only person who can’t do this. They join a group and feel better. P: They start to remember what they did at school. Ga: They help each other. (Comment from project director: If the real measures are what is tackled outside the classroom, the implications – can’t be standardised, would rely on self-reporting) S: You ask, ‘Have you attempted anything new this year?’ It’s still self-reporting. General observations on current situation in adult literacy
It was recognised that there are literacy classes where the learners are there for the ‘social situation’ rather than the education. This was happening less then because of college policy, but it was suggested that such classes help to give people their identity, their sense of belonging to one of the communities of practice; they are functioning at a reasonable level and they are benefiting in some way.
There was agreement that the learners were also being helped to maintain their skills but again this was seen in terms of confidence, in the willingness to ‘have a go’.
Peer support within the class was thought to be important and might help retention rates.
There is often nothing suitable for learners who have reached Level 2 to go on to, and it was pointed out that they can still have difficulties with writing.
Despite the findings about the grouping patterns that had emerged from the first year’s data (see section 6.5) and the emphasis of the Core Curriculum on groupwork, there were claims that this was never covered convincingly in the Curriculum training; there were problems doing groupwork in a class with a wide range of abilities; it was also thought to be unsuitable for very low levels.
Possibility of using ‘buddy’ approach was raised: it would only suit some learners, others prefer working on their own; shared writing was described as useful, with one learner acting as scribe.

73
Use of phonics: some teachers claimed to use it a lot and mentioned the problems with blending that some learners had.
Non- and beginning readers need to attend classes more than once a week. Conclusions Generally the feedback from the teachers was very positive about the experience of participating in the study. Concern for their learners seemed paramount, and it was striking how much the teachers’ sense of well-being depended on their learners being happy. The importance of confidence came up again and again. 6.3.2 The second feedback/consultation day, 2 September 2005 Following the success of the event the previous year, a second such day was held to mark the conclusion of the second year’s fieldwork. On this occasion, 30 people attended, including nine from the team of researcher-practitioners, plus 10 teachers and six learners from classes observed during the second year. Points raised by teachers and practitioner-researchers about the project These were unprompted and showed a keen and critical interest in various aspects of the data which were considered significant. These revolved mainly around issues of learner assessment, progress, attendance and motivation. Responses to these issues, where made, are given in italics.
Whether there was a difference in attitudes and attainment between learners who attended weekly and those attending more intensive provision. There was limited scope for comparison as there were very few intensive classes observed.
Possible limitations of the reading assessments to show progress, where learners were either very weak or very good. The assessments measured levels from just below Entry 2 to Level 2. A few of the learners did score either 100 or 0, so they were above or below the level at which progress could be measured.
Whether it made a difference to progress if a class was mixed-ability or at one level. Most of the classes were mixed-ability, with the notable exception of a Special Needs Downs class (see section 7.6).
The relationship of reading to writing: reading is often embedded in writing; people who can read can have problems with writing; reading, unlike writing, takes place on a daily basis, whether a learner is attending class or not. From an analysis of the first year’s data we have found that many writing activities do involve reading. There is a parallel project looking at writing (reported in Grief et al., 2007).
Reasons for attending class: the importance of motivation to succeed, a point not necessarily captured by the attitudes questionnaire; ‘social’ reasons for attending and/or habit; difference between voluntary and compulsory attendance; the enthusiasm of newly arrived ESOL learners compared with those who had been in Britain longer. This project had not specifically recruited ESOL learners (and again, there was a parallel project studying them – reported in Baynham et al., 2007)
The possible importance of self-directed study. The number of hours a week spent studying was captured in the mid and post questionnaires

74
Issues arising from questions to the learners The learners present initially seemed reluctant to contribute to the discussion. A series of questions was then asked of them, prompting detailed and interesting responses, which are described in section 4.4. Where teachers and practitioner-researchers prompted or added comments to the learner responses, they are listed below:
On the topic of reading a book as a milestone marking learners’ progress, one of the teachers said it was disappointing that there hadn’t been a question on the questionnaire about reading that first book. However, one of the practitioner-researchers said that, if she had been given such information about a learner, she would certainly have noted it in her write-up of the session.
The process of writing rough drafts prompted the comment from one of the practitioner-researchers that it was so important for teachers to say that they have to go through this process too.
The question on whether there were factors which get in the way of learning was not one that the learners seemed able to answer easily. The teachers and practitioner-researchers made various suggestions:
The issue was one of progression from Level 2. Progressing to GCSE meant moving, in one teacher’s case, from a small community centre to college, a move which many learners were unwilling to make. There was then some discussion about whether GCSE was actually a necessary step after achieving Level 2. It seemed that nursing courses at some colleges required GCSE, others didn’t.
Other options for progression after level 2 were discussed, e.g. creative writing, general interest classes which might enable reading and writing skills to be maintained. It was pointed out that these would not be free and might not be available anyway.
It was a big jump from Level 1 to Level 2 in just a year, and there was every chance of a learner failing. Progression between Entry levels was also hard to find as it was not (then) possible to get funding for a move between Entry 2 and 3 in the same year.
Practical considerations as a factor were also discussed; whether facilities were good at a centre, e.g. somewhere to get a coffee or not; suitable class hours, with flexibility important, so those with, e.g., childcare commitments could arrive late. This was not an issue the learners raised themselves.
Conclusion Since this day took place after data collection was finished, the aim was not to find pointers to improving the experience of being observed for the teachers and learners, as was the case for the first day. Generally however, the experience seems again to have been received positively. The session was very much learner-focused and this was not just because of the presence of learners. The teachers themselves were continually trying to view things from their learners’ viewpoints and prompting them to express their

75
opinions. As with the first day, it was again noticeable that concern for the learners was paramount. It was telling that one teacher, when attempting to describe how she found the observation process, explained how anxious she had been to find out how her learners would feel about being part of the project. It was only later that she realised that she, too, would be observed. The learners had difficulty identifying barriers to their learning. Perhaps this is not so surprising in view of the fact that these were learners who had successfully overcome any barriers. There was certainly little reluctance on their part to talk about their successes and achievements. 6.3.3 The third consultation/feedback day, 17 February 2006 This was attended by 15 people; in addition to the project team, including most of the practitioner-researchers, four observed teachers were also able to come. The main aim of the meeting was to share the latest findings and to draw on reactions and practitioner insights to inform further analyses for the final report. The issues raised are summarized below:
The presence of learners with special needs in any of the classes would need to be taken account of, both in terms of their progress and of the age beyond which they reported they had remained in education.
Any difference in progress made when a pre-assessed learner actually stopped attending the class but did take mid- and post-assessments.
Furthermore those learners who were willing to return for assessments might be the more confident ones.
Whether the findings from the hours of self-study recorded might indicate the value of setting homework.
Various reasons were suggested for the fact that there was a smaller range of specific strategies coded in the second year compared with the first. These included having a specific focus such as learndirect, Jobcentre plus or ‘teaching to the test’; the influence of class size and range of levels; the influence of grouping, e.g. an increase in whole-class work rather than individual, illustrated by the following exchange from the transcript:
When it was suggested by one of the practitioner-researchers that the SfL curriculum had pushed people towards more group work, a teacher said that the inspectors had stressed whole-class and small group work. The fieldworker who had observed his classes asked if this had reduced his teaching strategies and he replied that there was ‘less that he could do’. Another teacher said she thought that the push to whole group work had started before our research got under way. Another fieldworker agreed, ‘Yes – but it takes time before teachers really begin to do it.’
Whether more progress was made when learners were at the same level. ‘As a teacher I always felt I was working against the flood when I had from pre-Entry to Level 2 and there would be some ESOL learners in there as well. Do we need to think about streaming by ability? The ensuing discussion revolved around the
76
difficulties of streaming in practice – the limited times that learners were actually available to attend; the closure of streamed classes if numbers were too low. The point was also made that, in a mixed class, if there was no tutorial time officially built in, a non-reader might not get to read in the whole session.
The availability and value of ICT. This issue was raised by a teacher who said she had used internet access very effectively with a dyslexic learner. It was all right when well serviced but no good when it breaks down, observed a fieldworker who continues to teach adult literacy. When holding a class in an ICT room, it’s good to have access to the equipment, but more time can then be spent teaching ICT skills rather than literacy (a teacher). This provoked the response that it depends on what we mean by being ‘literate’ (another fieldworker) and that ‘scrolling though is still reading’ (yet another). A fifth fieldworker said it all depends on the ICT skills of the teacher and learners and that her ICT analysis of the first year data showed that equipment was not always used effectively.
There could be more time spent on writing than reading, because most learners were better at reading and so the focus would be more on writing. There were sessions where there was no reading observed at all.
The effect of motivation and morale on progress. A class was mentioned where there were a lot of ESOL learners being ‘taught to the test’ and they all passed the Level 1 test because they were highly motivated. If teachers are not happy with the philosophy of Skills for Life, then this would rub off on the learners.
Where possible and appropriate, many of the above questions and insights have been followed up and further information obtained (e.g. on which were the integrated classes; where there were special needs learners; on the exact range of learner ability in each class) and incorporated into further analyses. Summary The three feedback and consultation days were highly successful. This can be measured both in terms of the participants’ enjoyment and enhancement of their professional development, and in terms of benefit to the project. The insights gained helped us to focus on issues that are important to practitioners and learners, and thus to shape some of our research questions and follow additional lines of analysis.
6.4 Classroom organisation Introduction This section looks at some of the physical characteristics of the observed classes, firstly in terms of the classroom layouts, and secondly with respect to the teaching materials used. Teaching and learning took place in a variety of settings, with a range that included dedicated and well-resourced basic skills classrooms in colleges and adult centres, other rooms (for example, an art studio) in such institutions, school classrooms, used both within school time and out-of-hours, and spaces in community centres shared with other services (e.g. with a Citizen’s Advice Bureau).
77
Analysis of room layouts 1. 2003/04 This analysis of the room layouts is based on the plans drawn by each practitioner-researcher of the classrooms used for their observations. In the first year 23 groups of learners were observed, involving 18 different classrooms. (Classes 171, 172 and 174 all took place in the same room, as did classes 052, 053, 054, 055.) First the layouts in use are described, with a breakdown of their frequency, and then any correlations between the layouts available and the grouping used for teaching. Five different room layouts were identified, in order of frequency of use:
A. One main table (or smaller tables pushed together) around which all the learners sat B. Separate smaller tables, varying in number from 2 to 5 C. Tables in a horseshoe configuration with teacher’s table at the open end D. Tables (with computers) round the edge of the room E. Traditional arrangement with desks/tables in rows and all learners facing the same way.
The most frequently observed layout was A, used by 8 groups4, representing 6 different classrooms. Layout B was used by 6 different groups5 and layout C by 5 groups6, but in only 2 classrooms. Layouts D and E were used by 2 groups each7. It is also interesting to note that layout C was used by only one of the institutions observed. In the case of class 113, in addition to arrangement D of tables round the room, there was also a central table which was used by different combinations of learners during the session. When the use of room layouts was read in conjunction with the analysis of grouping patterns, a limited number of correlations could be found. Lessons which contained no group teaching at all took place in every layout except layout A, the commonest for individual work being B and D, with 2 groups each. Conversely, where the whole or nearly the whole session was taught as a group, the commonest set-up was layout A. The vast majority of sessions contained at least some group teaching (18 out of 23 groups) and all layouts were used for this except layout D where, not surprisingly, only individual work took place. Layout E seems the most likely to have facilitated traditional teaching from the front. It was indeed used by one of the groups in which there was whole-class teaching for most of the time each session (191) but also, surprisingly, by a group in which every session consisted only of individual work (083). It is not possible to draw firm conclusions about the extent to which layout dictated the style of teaching, although certain trends could be observed.
4 Classes 241; 112; 121; 081; 171, 172, 174; 173 5 Classes 091, 271, 292, 291, 051, 082 6 classes 052, 053, 054, 055; 056 7 D – 111, 113; E – 083, 191

78
2. 2004/05 This further analysis was based on available plans of 21 different classrooms for 22 classes (175 and 177 took place in the same room). 36 classes were observed during the second year, so this represents nearly two thirds of the total. Again, the same pattern was seen as the previous year, with the most frequent layout being A, used by 10 classes8, followed by B, used by 79. Layout C was used by 4 groups in 3 different classrooms10. Only one class11 used layout D exclusively, although it should be noted that, as before, there were classrooms with at least 3 computers on tables round the edge of the room, which were used at times in addition to the main layouts12. According to the data available, layout E was not used by any classes. The patterns over the two years are shown in Table 6.3. Table 6.3: Frequency of use of room layouts 2003-05
Layout A B C D E
No of classes (N = 45) 18 13 9 3 2
Similar correlations emerged between room layouts and grouping patterns in the data from both years. The use of layouts A and C, ostensibly more conducive to group work, did not guarantee it, as there were instances of both substantial and minimal whole group work taking place in these layouts. However where there was almost entirely group teaching, layout A was favoured over all others. Layout B again correlated with little or no group teaching, but this time, a substantial amount of whole group teaching did take place in layout D. No information was available about whether the classrooms had been arranged according to the teachers’ preferences, or whether there was no scope for altering the recorded layouts. The latter scenario may perhaps be inferred more readily when the class took place in a ‘borrowed’ space rather than a dedicated one. Teaching materials 2003/04 The issue of dedicated versus borrowed spaces also had a bearing on the teaching materials in use and available for the practitioner-researchers to take away. As part of each class observation, the practitioner-researchers were asked to collect the teaching materials used in the course of that class. Not all materials were available, for a variety of reasons, but worksheets were collected in sufficient numbers during the first year of data collection to provide the basis for some conclusions about the paper-based materials in use. The quantity and availability of materials was also affected by whether all the resources had to be brought in by the teacher, and whether photocopying facilities were easily available on site. It was partly because of such constraints that the decision was taken not to analyse the materials from the second year, and partly
8 057, 084, 178, 362, 401, 422 441, 451, 452, 561 9 058, 085, 086, 116, 331, 361, 421 10 175 and 177, 176, 431 11 293 12 085, 116, 293, 362, 421, 561

79
because there did not, prima facie, appear to be any significant difference in the types of materials collected. In this analysis, various aspects of teaching materials will be discussed: appearance and fonts used; the ratio of teacher-designed to commercially-produced materials; sources of commercially-produced materials, including web-based; extent of overt mapping onto the Core Curriculum levels and general influence of the Curriculum; focus at text, sentence or word level; topics covered; and use of ‘realia’. Since all teachers were interviewed informally at the end of each set of four observations conducted in their classes, this analysis begins by looking at both relevant responses from teachers and comments from fieldworkers. Interviews, in the form of ‘Teacher Questionnaires’, were completed by the practitioner-researchers for 19 teachers. None of the questions on the Questionnaire directly addressed their choice of teaching materials, but one question in particular had a bearing on the issue, namely ‘To what extent have you changed how you teach in response to the requirements of the [then] new Adult Literacy Core Curriculum?’ The requirement to follow any curriculum will of course affect materials used. In the great majority of cases, attitudes to the curriculum were positive; concerns about its restrictions and increased bureaucracy have been described in section 6.2. Of those teachers observed in the first year who had had experience of teaching before the introduction of the Core Curriculum, all but three said it had changed their teaching considerably. The changes revolved around the issues of class grouping, teaching structure and ideas/materials. Many mentioned doing more group teaching as a result of the curriculum. Many referred to the change in terms of ‘focus’, with comments such as, ‘It helps you focus on what you do’; ‘more of a focus, particularly on differentiation’; ‘more focused teaching’. The reactions to lesson planning and resources were more mixed; many spoke of the Curriculum generating ‘ideas’, for example, ‘We are given lots of ideas. Previously you had to think it up for yourself’ and ‘It is easier to focus by picking up ideas from the Core Curriculum – it’s my Bible!’ At the same time there was criticism of the DfES-produced materials, which were regarded as offering insufficient coverage of topics and usually having to be adapted. Furthermore one teacher criticised the lack of structured materials for beginner readers. The web-based materials, ready-mapped onto the Curriculum, were generally received very favourably. Further comments in the questionnaires from both teachers and practitioner-researchers included observations on types of teaching materials. One teacher (new to the profession) was described as being very conscious of the Skills for Life approach, and tried to relate lessons to the real world by bringing in her own materials and using those brought in by the learners, such as newspapers, adverts, leaflets, letters, etc. However, several other teachers seemed to resist the use of ‘realia’ in the classroom. There were different reasons for this: it would not be ‘appropriate’ for learners to bring in their own materials because everything ‘has to be accredited’; realia were not used much because they were regarded as ‘too difficult’, illustrated by the following example: ‘One learner has brought in material about joining the army but it is just too difficult to read and I see no point in simplification as this does not reflect the real world’; it was also mentioned

80
that the learners never seemed to want to bring in their own work anyway; and it was considered better if the teacher chose the materials as ‘you can choose the structure and the right level’. Teaching materials were made available from 21 of the 23 classes observed, of varying amounts and not always from each of the four observations undertaken. Extra copies of material could not always be provided, and to a considerable extent it was the teacher’s decision as to what was handed over. In the case of differentiated individual work, as opposed to group sessions, it was not practicable to collect every piece of work. Materials collected also included writing tasks which were outside the reading codings (see section 6.7). Therefore the collection of materials that was finally amassed cannot be regarded as truly representative of what is used in the teaching of reading, and any conclusions must be treated accordingly. The majority were printed on white A4 paper, using san serif fonts. Handwritten materials were rare. The greatest use of other fonts arose from photocopied articles in books and newspapers. Font size varied considerably. In the few instances where coloured paper was used there was no obvious preference for a particular colour. Not every apparently commercially-produced sheet gave its source, but when the source was recorded, it seemed that the greatest number had been downloaded from websites. Table 6.4 gives a list of websites used. Of interest is the fact that not all the teaching/ learning sites are the dedicated adult literacy ones, although the most popular was actually BBC Skillswise, used by three different classes. (Each of the other websites was accessed by only one class.) This table only accounts for those resources printed off, of course, and does not reflect sites visited online in the course of the class sessions. Table 6.4: Websites accessed for teaching materials
activityvillage.co.uk
Bbc.co.uk/skillswise (3)
bbc schools bitesize
Bignell.uk.com
britishlibrary.net
chambers.co.uk
Egyptian sites (kingtut-treasures.com, virtual-egypt.com)
englishresources.co.uk
funtrivia.com
learndirect
members.aol.com
Onestopenglish.com
puzzlemaker.com
reward-english.net
talent.ac.uk
teachit.co.uk
users.globalnet.co uk

81
Non-web sources were also used – see Table 6.5. The Abc production sheets were used most widely (by 5 classes), followed by the Liverpool Community College materials (4 classes), DfES, and Brown & Brown (2 classes each). Table 6.5: Sources of paper-based materials
Abc production (5)
Alpha to Omega activity pack
Brown and Brown (2)
Copymaster
DfES (2)
EFL textbooks
Foundation Spelling (MCH pubs)
Liverpool Community College (4)
Thanks to the availability of IT, it is harder to tell nowadays if worksheets have been teacher-designed rather than commercially produced, unless the teacher’s name actually appears on the sheet. There are no longer the clues of typewritten or handwritten sheets, although there were three exceptions. These were: a set of materials which consisted of photocopied extracts from newspapers with hand-written comprehension questions; a handwritten wordlist for a particular learner; a typewritten and photocopied sheet on ‘writing sentences’ which bore the date 1993! Several of the teacher-designed materials included photocopied sections from recent editions of newspapers (including The Yorkshire Evening Post, The Big Issue, The Daily Mirror, The Daily Express), magazines (television listings, local attractions) or poetry books, either with supporting questions, or related to a topic covered by other worksheets. Such articles were usually the main sources of ‘realia’ in the classroom too, although materials downloaded from general websites might also be considered in this category. Of the materials collected, however, the majority appeared to be – or at least had the appearance of being – commercially produced. Of the materials which covered reading skills, there were fairly equal numbers of those at text and at word level, with far fewer at sentence level. Despite the requirements for mapping onto the Core Curriculum, only a minority of the materials actually had the relevant Curriculum sections noted on them, although when lesson plans were included they usually included the specific mapping details. The absence of mapping information may merely illustrate the fact that many of the materials pre-dated the introduction of the Curriculum. The materials covered a variety of topics, but there were commonly recurring themes. At each level – text, sentence and word – all were easily accommodated within the system devised for coding specific teaching strategies. In the examples of texts, factual extracts outnumbered those from fiction or poetry. Most were reproduced without alteration, although there was one instance of apparent simplification (of a newspaper text). When the text was accompanied by associated

82
work, this was most often in the form of comprehension questions and/or work on vocabulary. There were also instances of skimming and/or scanning skills being specifically addressed, and discussion of types of language and purposes of texts. At sentence level, punctuation was a favourite topic, especially exercises on capitals, full stops and apostrophes, with verb tenses, subject/verb agreement and use of conjunctions also popular. The greatest variety of types of work was found at word level. Word recognition/ decoding included: alphabet recognition and sequencing; recognition of key words, including Dolch words; phonemic work on vowels, especially long vowels and ‘silent <e>’; spelling patterns. Comprehension was also covered with sheets on word meanings, both with and without dictionary/thesaurus practice. Words were also analysed in terms of syllable structure, parts of speech, compound words, roots and suffixes. Puzzles such as word searches and anagrams were in frequent use. Any conclusions can only be tentative, as the materials on which this analysis was based represent a) group activities more often than individualised ones, and b) the most easily reproduced (and portable) paper-based materials. Despite the perception, in most cases, on the part of teachers of a change in attitudes to teaching and materials since the introduction of the Core Curriculum, it was surprising how little that was reflected in the type of materials in use. Indeed many of the materials still in circulation (other than web-based) pre-dated the Curriculum.
6.5 Groupings This heading refers to whether learners were operating as a whole class, or individually, or in small groups, and with or without assistance from a volunteer or paid classroom assistant. Experience in the field and the preceding project on adult learners’ difficulties in reading (Besser et al., 2004) led to a pragmatic classification of all the theoretical possibilities into six categories:
A whole class with teacher/assistant B alone C 1:1 with teacher D 1:1 with assistant E Learner pair with no support from teacher/assistant F Small group (2 or more) with support or small group (3 or more)
without support. The decision to make E a separate category was based on the frequency with which (it was thought) learners were set tasks to do in pairs working without assistance – ‘buddying’, as it is often called (but as it happened, this turned out to be the least frequent mode of working). If such a pair received a ‘visit’ from a teacher or assistant, for the duration of the visit the grouping was coded as F. Descriptive statistics for the grouping categories are presented in Table 6.6.

83
Table 6.6: Learner groupings in class, descriptive statistics
Grouping category Mean Median SD
A (whole class with teacher/ assistant)
25.40 19.00 24.31
B (alone)
29.06 23.33 24.86
C (1:1 with teacher)
4.63 2.50 6.53
D (1:1 with assistant)
6.34 .00 16.94
E Learner pair (no teacher/ assistant support)
3.63 .00 8.21
F small group (with or without support)
4.37 .00 8.75
Uncoded time, = activities other than reading
46.57
Unlike most other Tables in this report, Table 6.6 shows both mean scores (i.e. arithmetical averages) and median scores (i.e. those at the centre point of the distribution). The values are numbers of minutes, e.g. over the observed classes attended learners spent on average 29 minutes working alone. It is apparent that working as a part of the whole class (A) and working alone (B) were the predominant modes of working. Relatively little time was spent in each of the other groupings. The fact that all the medians are smaller than the means shows that the distributions were negatively skewed, i.e. towards the low end. Indeed, the zero medians for categories D, E and F show that at least half the learners spent no time at all working in those groupings. Another inference can be drawn from these data. The average length of a session was about 120 minutes. For the average learner, the reading activities coded took up about 73 minutes (sum of means for the six categories), or about 61% of time in class. What happened during the other 47 minutes? Some was social time – opening chat, tea breaks – but most of it was work- but not reading-related: working on writing, discussing Individual Learning Plans with the teacher. The topic of ‘Grouping’ took on greater salience during a ‘thinking aloud session’ during a project team meeting in Sheffield in February 2004. Some key topics were identified by the practitioner-researchers, and subsequently developed as described in Chapter 8. One topic which featured constantly in the discussion and aroused considerable interest was the classroom dynamic, as expressed by the grouping patterns. The Adult Literacy Core Curriculum placed a new emphasis on group work, whereas ‘traditional’ literacy teaching had tended to focus on individual work. Both patterns were evident from the class observations, and the suggestion was made that the teaching actually happens in group work and individual work is just ‘practising’. The issue of learner dependence was also raised, particularly in cases where there is a high learner/teacher ratio. Yvonne Spare undertook a major analysis of grouping patterns 2003/04, in which some significant observations were made; it was from this piece of work that both the analysis

84
of room layouts in the preceding section and a further analysis of grouping patterns in 2004/05 were developed. Yvonne’s original piece of analysis is set out first, with some additional statistical analyses based on her findings. The analysis of the 2004/05 groupings follows, with some further correlations noted between grouping patterns and assistance in the classroom. The final summary attempts to draw together trends and implications over the two years. 6.5.1 Patterns of grouping and their implications Yvonne Spare In writing the observation notes, careful account was taken of the grouping of the learners, information which was later used to inform the analysis of specific strategies. Such groupings may be described as ‘whole group’ (usually with a teacher), ‘learner group or small group’ or ‘learner pair’ (with or without a teacher), ‘one-to-one’ (with a teacher) or ‘alone’. It was decided to look more closely at the occurrence of these groupings to see if it would be possible to ascertain any effect upon the progress made by the learners. Groupwork followed by practice 92 teaching sessions in 23 classes were studied during the first year. Of these, a large number were found to contain whole-group teaching, 62 sessions in 18 classes13. It was the predominant pattern, being seen in over two thirds of sessions. In studying these sessions more closely, a pattern can be seen. 43 sessions in 14 classes14 followed a style which may be simply described as groupwork followed by practice. This usually consisted of a taught lesson, ranging from 10 minutes to an hour, where the teacher involved the whole group in the teaching of some point, often a reading strategy or a spelling or punctuation rule, followed by individual, paired or small group practice. Frequently the teacher would have prepared worksheets, usually differentiating the level of work in mixed-level groups. There was some variation within this general pattern:
Eight teachers taught every session this way15.
Four teachers (191 four times, 172 three times, 174 twice and 241 twice) taught the whole, or almost whole, session to the class, with practice work being done in the class, or interspersing short periods of between 10 and 35 minutes of individual, one-to-one or paired practice.
13 Groups 051,052,053,054,055,056,081,091,112,121,171,172,173,174,191,241,291,292 14 Groups 051,052,053,054,055,056,081,091,112,121,173,191,291,292 15 Groups 052,054,055,056,091,121,172,174,191,241 (groups 052/055 and 172/174 were
taught by the same teachers)

85
Teachers 121 and 241 were notable in being the only ones not only to teach but to practise reading as a whole-class exercise. They both used the technique of having each learner read aloud a paragraph in turn, with the other learners prompting where necessary. The observation notes include the following comments.
121 – ‘(The teacher) tells me that when the group started she explained to them that they all had similar reading and spelling problems and that it was easier to read ahead than to read aloud, therefore if someone didn’t know, someone else may have a try. Only if no-one knew would she step in herself with help.’ 241 – ‘Learners do not interrupt the flow of reading but prompt if another learner seems to be struggling. From what I have seen this works well, possibly because the group has been together for some time and seem to be able to judge when prompting is appropriate.’
Five teachers (091, 112, 121, 191, 241), whilst following the general pattern of teaching followed by practice, also included a whole-class review of what had been taught, either linking it to the previous week’s work or recapping the current session at the end.
Teacher 053, in one of his classes but not the other (054), followed a pattern of group teaching for between 45 and 55 minutes in three of his sessions, followed by unrelated individual practice in reading, which he has identified as a priority for the individual learners.
Lessons containing no group teaching 27 sessions in 10 classes were observed to consist entirely of individual work. Five teachers taught all their sessions in this way (Classes 111, 082, 083, 113, 271). Class 111 follows this pattern because it is a learndirect group consisting entirely of computer-based exercises, which are planned according to an on-line diagnostic assessment. The learners work through individual programmes of learning and may work at the learndirect centre, at home, at work or in libraries, etc., and so may progress at their own speed. The teacher’s role is more for support than teaching. Classes 082 and 083 take place at the same institution, in the same centre. Notably the other class run by this institution (081) also shows evidence of the same pattern of high amounts of individual work, mainly based on worksheets. The explanations given by the teachers were different, however: Teacher 082 claimed to be ‘overwhelmed’ by the difficulty of working with different levels, choosing the ‘safety of them working on their own’. Very little actual teaching took place. Learners used worksheets to practise various things (punctuation, letter/sound correspondences, homophones, etc.). The teacher’s input was mainly explaining what to do, marking and feedback. Similarly with teacher 081 – ‘It’s difficult with different levels.
86
They would get through the work at different rates. It’s not something you can do every week.’ Teacher 083 – This teacher has interpreted the Core Curriculum as meaning that he could no longer do whole-class teaching. ‘Lessons are planned at an entirely individual level … the learners just work their way through the worksheets so the only planning is seeing where they’ve got to and carrying on from there.’ The teacher talks about the difficulties of getting through ILPs (Individual Learning Plans) with a class of 13. ‘(The learners) just go through the books at Entry 1 to 3. There are 40 lessons at each level. They’ve got through 11 so we should get to mid-30s by the end of the year.’ In observation 083.2 one learner is using his own book. The others are using worksheets. The observation notes comment: ‘For neither worksheet does S (the teacher) attempt to explain/teach the topics. Leaves learners to work it out for selves. Similarly in 083.3, ‘S doesn’t stop to explain exactly…. The learners seem reluctant to ask S for help – because he always seems so busy? …. S doesn’t seem to explain much about this lesson.’ When asked about the learners working on something of their own choice, he says that he thought this would be ‘inappropriate as everything has to be accredited.’ Class 113 – The work was all one-to-one or alone, based on a diagnostic assessment and ILPs. The learners range from Entry level 1 to Level 2, some of whom were working towards the National Test. One recurring pattern was that learners would read or write something of their own choice or from their own experience, and any problems arising would be addressed by using worksheets for practice. Class 271 – It was noted that ‘the teacher is in charge with an overseeing role, with a very small amount of teaching. All work is individual; there is no overall plan for the lesson.’ The class has six assistant teachers and this evidently facilitates one-to-one work to an unusual extent. The assistant teachers seem to be expected to find and bring in work for their learners. Five classes (051, 081, 112, 173 and 291) varied between the pattern of groupwork and practice and having no taught whole-group session at all. There were usually identifiable reasons for this. In one case the main teacher was unexpectedly absent for one session (class 081). On two occasions the teachers decided that the learners needed to work on gaps in their ILPs (classes 081 and 291). Another session in class 291 was due to the planned resources not being available. In the first session of class 112 the teacher had been ill the previous week and therefore had just decided to continue with earlier work. The other instance, in class 051, happened in the pre-Christmas session. The implications of grouping for the learners The two main areas of enquiry have been around class atmosphere, including peer support, and the issue of learner dependence when all work is individualised and takes place either alone or one-to-one. The importance of class atmosphere The question being investigated was whether groupwork promotes better class atmosphere and peer support. In fact the evidence is inconclusive.

87
It is undoubtedly true that, in the classes where groupwork took place, there was plenty of evidence of mutual support between learners. However, there were also sessions in the classes where work was individualised in which the observers noted the positive class atmosphere. In class 111 the learners took breaks together and were encouraged to look at each other’s work. This was especially significant because of its nature as a computer-based class. Class 113 had a relaxed, friendly atmosphere, possibly because of the way in which the teacher talked casually to the whole group, for example in session 113.4 where she asked a learner about his brother’s wedding, something about which the whole group seemed to be aware. The layout of seats, around a large central table, may have contributed to this as well. In class 082, the observer noted: ‘Good atmosphere in this class. The learners get on well and look out for each other.’ There was mention of a learner’s mum and at one point the teacher was chatting to a group of learners about liberty bodices! Class 081 was described as being ‘informal and collaborative’. The teacher said that the learners quite often helped each other and that she loved it when it happened. Classes 082 and 083, in the same institution and both classes working individually, differed greatly in their atmosphere, even to the extent of their habits at their breaks. The learners in 082 took their breaks together, whilst those in 083 sat separately even though they left the room together, and did not seem to know or care about each other. Learner dependence Two classes showed the greatest evidence of learner dependence. The first was class 271, which had the highest number of assistant teachers of any of the observed classes – six in addition to the class teacher. Almost all the work carried out in this class was one-to-one. In session 271.2, two learners spent 10 minutes alone, waiting before they began work, and another spent 25 minutes alone, then left, without apparently having been given any work. In the following session, one learner spent 6 minutes waiting and another waited for 20 minutes until a teacher brought something to do. In session 271.4, there was further evidence – the learner who left session 271.2 was ‘sitting alone, watching others’ for five minutes, and another stopped work as soon as the assistant teacher left. The second class, 083, consisted mainly of learners working alone on worksheets. The observer noted: ‘(The teacher) … seemed very popular with the learners, who hardly complained about having to wait for ages, without work, until he could get round to them … They would also reject offers of help from the volunteer – only S would do!’ In session 083.2 the volunteer tried to help three times and was refused each time (at 7.10, 7.30 and 8.30). Interestingly, the teacher himself remarked in the questionnaire that he thought assistants were useful but learners can get dependent on their help.
88
In fact their dependence on S (their teacher) led to a tendency for learners to wait a long time doing nothing constructive. In session 083.1 the notes record: ‘7.05: 03 is just sitting. 7.10: 03 and 04 wait for work’. In the following session, 083.2, it was noted at 6.30 ‘No-one is really doing anything … all facing front. Silence.’ At 6.25 a new learner arrived, who 15 minutes later had still been given nothing to do. ‘7.25: 04 sighs. 09 is being ignored and hasn’t been asked if he has anything to do. 7.30: 09 is looking bored. He puts his hand up for attention. 7.35: 09 still waiting and yawning. 8.05: 09 returns’ (from a tea-break). He still hadn’t been given work to do. He left the room at 8.10 for 5 minutes, was finally given a worksheet, but left the room again at 8.20.’ He had therefore been left from 7.25 until 8.15 with no work to do. He finally packed up to leave at 8.40. The following week he did not attend, but in week 4 the notes observe: ‘8.00: 09 not working, looks bored. 8.10: 09 is just sitting. 8.16: 09 is doing a lot of sighing and some writing. 8.25: 09 grunting and sighing.’ Other classes show similar, but less marked, evidence. In class 082, session 1, ‘11.20: 08 finished. 11.40: 08 doing nothing. 11.45: Still waiting for work until 11.50.’ However, this seems to have been an exception for this class. Although there was almost no whole-class teaching – there was a brief five-minute session – work did take place in small groups and the learners did talk to each other. In class 051, session 3, a learner arrived at 1.17 and was given a wordsearch. It was 1.59 before she told the teacher that she had not done one before, so over 40 minutes had passed before any work was done. As soon as she was left alone she began to interrupt other learners. At 2.17 she was not working and was distracting others for short intervals. There was no mention of her work being marked or feedback being given in the rest of the session. Again this seems to have been an isolated instance. All of this teacher’s other sessions included whole-group work and showed no evidence of such dependence. In class 113 the teacher commented that learner 07 ‘is better when M (her volunteer) is with her.’ In session 113.1 this learner found it very difficult to settle and was upset to find that her usual volunteer was not there. This may have been at least partly because she is assessed at Entry level 1 – there may be evidence that Entry level learners find it more difficult to work independently. Conclusions It should perhaps not be surprising to conclude that much seemed to depend on the attitude and preferences of the teachers. Of the eight teachers questioned about the frequency of group teaching, only four mentioned the influence of the Core Curriculum as their main reason, contrary to what might have been expected. Teachers 191 and 056 claimed to have always preferred groupwork. Teacher 121 said that it was easier to teach if the needs of the group were the same, even if the levels were different. Teacher 091 said that it gave a more focused approach and felt positive.
89
However, the teacher in class 052 said that it was ‘a compromise between the core curriculum and the ideal, which would be more individual work’, similar to teacher 053 who ‘enjoyed group teaching but hoped there would be room for both’, and 174, who preferred ‘one-to-one teaching in a supportive group setting’. Teacher 052 went further in stating that classes had moved from an individual focus to group teaching in response to the core curriculum, and mentioned one learner ‘who now likes collaborative work so much that he cannot do much on an individual basis’. It must be significant that the class with the greatest evidence of learner dependence, leading to long periods of inactivity, was the class whose teacher expressed the most negative attitude towards his teaching and who spent some time in every session complaining about his high workload and the demands being placed on him. Following this analysis, a statistical analysis was undertaken to see whether learners in the three groups of classes (every session has a whole-class section plus individual work; all individual work in every session; mixed) differed in their progress in reading and/or changes in their attitudes. This is reported in section 7.2. 6.5.2 Patterns of classroom activity 2004/05 This further analysis of classroom activity patterns draws on data from 36 classes, taught by 35 different teachers in 2004/05, giving a total of 144 observed sessions. The most commonly occurring patterns will be described briefly, then the exceptions in more detail. As in the previous year, the majority of sessions contained at least some whole group teaching. There were only three teachers (085, 086, 115) who used no whole-class teaching at all. All the other teachers’ sessions included at least one which contained some element of whole-class work, with a total of 107 sessions which included whole-class work. The length of time devoted to this varied from 3 minutes to 128 minutes. 20 teachers taught every one of their four observed sessions with an element of whole-class work, and four of these 20 teachers taught at least one of their sessions exclusively in a whole-class grouping. By far the most common combination of groupings was whole-class work plus individual work. The balance between ‘Whole-class’ and ‘Alone’, and the balance between the two, while varying from teacher to teacher, most often favoured a greater proportion of work done alone. There were a few classes where the commonest grouping was something else, for example, 1-to-1 with an assistant (092) or small group work (422). It seems that the pattern found to be predominant in the previous year was followed, namely groupwork followed by (or interspersed with) practice. The occurrences of this trend were similar to what was found in 2003/04, as, although there were fewer teachers who did no whole-class work at all (3 as opposed to 5), there were still 37 sessions consisting only of individual work. Since the implications of the ‘groupwork and practice’ pattern were considered carefully in the previous year’s analysis, the focus here is on looking at those class sessions

90
which went against the trend, firstly those whose teachers did no whole-class teaching, and secondly those sessions which contained nothing but whole-class teaching. No whole-class teaching There were only three teachers who never did any whole-class teaching at all during the observations. Since 13 of the other teachers varied from session to session in their inclusion of whole-class teaching or not, it might be instructive to look first at the practice of one teacher (classes 361 and 362) who did whole-class work as a significant part of all but one of her eight observed sessions, to see if there was any rationale behind the change. When questioned about her attitude to whole-class teaching, this teacher said that she felt it was important, being ‘the only way you can actually teach. If it’s all individual work you can’t’. She had 10 years of basic skills teaching and claimed she had always done group teaching, long before the Core Curriculum was introduced. Seven out of eight of her sessions included whole-class work that ranged in duration from 18 to 66 minutes. In class 362 the time spent on groupwork exceeded individual work in each session. The other class (361) spent proportionally less time on whole-class work, with individual work (both alone and one-to-one) usually exceeding groupwork, and as mentioned, in one session (week 2) no whole-class work. The learners had a very similar range of abilities in both classes, consisting of E2, E3 and L1. The teacher also followed the same lesson plan for both classes. The main difference was that class 362 had a more stable core of learners attending (at least 7 on a regular basis), with no learners absent for more than a week at a time. Attendance in class 361 tended to fluctuate. During the 361 session with no whole-class teaching, two learners appeared having missed the previous weeks, and another learner with behavioural problems was being particularly disruptive. The teacher divided the class into two groups, a higher and lower level, and gave them separate work to do. There was still some small group work carried out, but most work was done on an individual basis. The decision to do no whole-class work would seem to be a response to a particular situation and learner needs on that day. Those teachers who never did any whole-class teaching (085, 086, 115) were questioned about their grouping preferences. Teacher 085 said that she found it ‘difficult to do whole-class work with such a wide range of abilities within the class’. (These ranged from E2 to L2.) She did plan for small group activities but these often came to nought because of learner absences. The number of learners attending during the observations ranged from 4 to 9 and she had the support of 2 assistants. She had 2 years’ experience of basic skills teaching and the observer noted that she was negative about her performance and ‘always gave the impression that she thought it could have been better’. By way of contrast, teacher 086, with 22 years of experience, never considered whole-class teaching an option with her class. Generally only 3 learners attended on a regular basis, and she saw this an opportunity for one-to-one direct teaching, tailored to learner needs. However this teacher had also been observed during the first year of data collection (081) and again did hardly any whole-class teaching even with a larger class, on the basis that it was difficult with learners at different levels.

91
Teacher 115 never planned any group work. Her learners, who ranged in number from 3 to 6 during the observations, always did entirely individual work in accordance with their ILPs. She did have the support each week of 2 assistants, which gave a lower learner/ teacher ratio than in the other two classes. She had 4-5 years’ experience of basic skills teaching and was not questioned directly about her views on whole-class teaching. In view of the above it might be tempting to conclude that the presence of assistants made whole-class teaching less likely. In two classes, 116 and 331, whole-class teaching was observed in only one of the four sessions. Class 116 regularly had 2 assistants and quite a large class of 7-8 learners. Class 331 had one support worker and the observer reported the teacher, DR, as making the point that ‘as they are dealing with people as individuals [rather than group work] they can resolve any “glitches”.’ This was a large class, and 9-11 learners attended during the observations. On the evidence of these classes, presence or absence of whole-class teaching cannot be predicted by number of learners alone, but may be influenced by the ratio of learners to teachers, a low ratio making whole group work less likely. This hypothesis will be tested in the following section. (The numbers of learners and assistants in each class is shown in Table 6.1.) Only whole-class teaching Here the focus is on classes where the sessions observed consisted of at least two where there was whole-class teaching and (virtually) nothing else. One of the classes, 381, was a class of five Downs people and two with severe learning difficulties; 5 or 6 attended the sessions from a roll of 7, and there was support from one assistant. The teacher was not questioned about her grouping preferences or years of teaching experience, but it would appear to be a cohesive group of learners with learning difficulties, all living in similar circumstances (two local hostels) and each session was almost entirely whole-class. This is atypical of mainstream basic skills teaching. Another three classes, 451, 452, 561 each had at least one observed session which consisted of only whole-class teaching, and each will be looked at in turn. In class 451 there were two sessions where there was entirely whole-class teaching. The learners’ levels ranged from E3 to L1/2; 6 were present for one of the sessions, 9 for the other, with no assistance on either occasion. The teacher had 5 years’ teaching experience, including 2 as a volunteer. She seemed to have her reservations on the benefits of group work – ‘I enjoy groupwork. I don’t have the time for the one-to-one work, although one-to-one is most profitable for learners’. At the same time, after the fourth observed session, she said more positively ‘They (the learners) have more confidence as a group – working together: they are grasping things and telling each other’. The practitioner-researcher noted that the teacher never commented on the progress individuals made, but referred to the whole group’s progress. Class 452 had three sessions where there was only (or very nearly only) whole-class teaching. It was a small class of only 4 learners, with no assistant, and they were working at E2 and E3. Although worksheets were used extensively, the observer coded them as being done mostly on a whole-class, rather than individual basis. The teacher had taught basic skills for 5 years, including as a volunteer. He attributed his teaching

92
style to his training background with a bank; ‘I am OK standing in front of a group and tend to do whole-group teaching instinctively’, and ‘I want to try to develop small clusters of people as this promotes good interaction and is lively’. Classes 451 and 452 took place at the same institution and this teacher also admitted to picking up ‘guidance’ from teacher 451 – although on lesson content rather than grouping. Three of the sessions of class 561 were also taught almost entirely as whole-class; learner numbers varied from only 4 up to 10, and they were at either E3 or L1. The teacher, with 3 years’ basic skills experience, taught without assistance but said that ‘volunteers are nice to have … to help with odd jobs; one-to-one tuition is helpful and it is nice to have some moral support.’ His focus was very definitely on group work (his background was in ESOL) – ‘I try to get the group to move forward together, to work as a group and then work on their individual practice on the same theme’. However, according to the observer, his ‘awareness of learners’ progress is detailed and shows a concern for each learner and the group as a whole’. On the evidence from these classes, whole-class teaching does seem to correlate with lack of assistance in the classroom, an obvious but tentative conclusion which merits further investigation across both years. Assistance in the classroom Of the classes observed during 2004-05, 1516 were conducted without any assistance from volunteers, paid assistants or care workers. There was a trend for lack of assistants to be consistent across particular providers’ classes. Of these 15 classes, all but one (086, already discussed) featured whole-class work, which varied from a small fraction of the overall class time (3 minutes) to virtually the entire duration. These classes included those described above where there was whole-class teaching and almost nothing else (451, 452 and 561). A further five17 of these classes contained sessions where the time spent on whole-class teaching exceeded that of any of the other grouping possibilities. The relationship between grouping and the presence or absence of assistance in the classroom was not originally explored in the analysis of the 2003/04 data. Revisiting those later, similar trends were evident. Of the eight classes18 where there were no volunteers or assistants, again all but one (111) included whole-class teaching. And of these eight classes, four19 were the same four which had been identified in the original analysis as having sessions where the whole or almost the whole time was spent on whole-class teaching. Conversely, where there was no whole-class teaching, in all but one case (111) this corresponded to situations where there was at least one assistant in the classroom.
16 Classes 057, 084, 086, 176, 177, 178, 362, 401, 411, 431, 441, 451, 452, 541, 561 17 classes 057, 362, 431, 441, 541 18 classes 054, 081, 111, 171, 172, 174, 191, 241 19 Classes 172, 174, 191, 241
93
This seems to confirm the correlation between a significant amount of whole-class teaching and the absence of help in the classroom. However, it is not possible to make further predictions about grouping from this as whole-class work was found to be undertaken both with and without assistance. Conclusions For teachers who do little or no whole-class work, the frequent claim is that whole-class work is difficult when there is a range of learner levels. However, as we have seen, for other teachers that does not seem to be a problem, and indeed most classes have a range of abilities. There are teachers, however, who reject whole-class work because they believe that one-to-one teaching is the better choice. Reasons for favouring whole-class work vary from a genuine belief that it is the best way to teach a class, to perceived lack of time for doing one-to-one work. Many cite the Core Curriculum as influencing their decision to do group work. All the classes which had the most whole-class work tended not to have assistance. Conversely, the classes with little or no whole-class teaching tended to have at least one assistant present. Without knowing all the circumstances, it is difficult to know the extent to which presence or absence of assistance actually influenced the teachers’ choice of grouping. But the actual number, in itself, of learners did not predict the grouping preferences, nor the diversity of the group in terms of levels, nor the teacher’s years of basic skills experience. Sometimes a response to particular circumstances might provide an explanation for a decision to abandon whole-class work, for example previously absent learners needing to catch up (361) or planned groupwork having to be abandoned because of learner absences (085). There may also be an institutional ethos at work, as similar approaches to grouping and/or non-availability of assistants or volunteers seem to operate across a selection of classes which had the same providers, for example in 2004/05 with classes 084 and 086; 176, 177 and 178; and 451 and 452. (361 and 362 had the same provider but were taught by the same teacher anyway.) In 2003/04, there was a similar trend involving classes 171, 172, 173 and 174. Summary The data from both years yield similar findings. These can be summarised as the following trends:
Predominance of ‘groupwork plus practice’ model
Similar reasons given for not doing whole-class work, mainly the difficulty of finding suitable joint activities for different levels of learners
The influence of the Core Curriculum is mentioned by many teachers as the reason for changing to group teaching
An obvious but clear correlation between proportion of whole-class work and presence/absence of assistants, i.e. little whole-class work with assistants, considerable whole-class work with no assistants.

94
6.6 General teaching strategies and opportunities for learner involvement, descriptive statistics and correlations Marcin Szczerbiński
The General Strategies Observation Analysis (see Appendix B.5) comprised 19 individual items, blocked into two parts (A: General Instructional Strategies, 11 items; and B: Opportunities for Learner Involvement, 8 items). Descriptive statistics for all 19 items are presented in Table 6.7. The findings for the two cohorts were so similar that only those for the full sample are shown. Table 6.7: General teaching strategies and opportunities for learner
involvement, descriptive statistics
Mean Median SD
A1 8.48 9.00 3.88
A2 10.04 11.00 2.95
A3 9.87 11.00 2.78
A4 8.48 9.00 3.01
A5 9.48 10.00 2.81
A6 9.26 11.00 3.24
A8 7.04 7.00 2.84
A9 4.48 5.00 3.85
A10 6.35 7.00 4.06
A11 10.43 11.00 1.88
A12 10.91 12.00 1.65
B1 8.30 8.00 3.38
B2 7.87 9.00 3.88
B3 5.43 5.00 2.29
B4 7.87 9.00 3.44
B5 9.61 10.00 2.39
B6 10.43 12.00 3.30
B7 5.74 6.00 2.45
B8 6.22 6.00 3.26
Table 6.7 again shows both means and medians. The fact that all but one of the medians are higher than the means reflects the fact that the distribution of scores was positively skewed, i.e. towards the high end of the scale. In fact, since the maximum score was 12, for the two items with this score at least half of the classes observed must have been given the top rating. Slightly less extreme interpretations apply to other high medians. One implication of this is that the quality of teaching observed was, in general, high, in the opinion of the fieldworkers, who were themselves experienced practitioners. Another is that there is not much range in the data for correlations with other data to operate on – this point is taken up in section 7.3. A factor analysis of the 19 items produced four factors. They were, however, rather difficult to interpret. Most items loaded substantially on more than one factor, suggesting that the factors were related. Given the small sample size, those results must be treated

95
with caution. It is better to treat the whole instrument as a measure of a single latent variable of teaching quality, with two aspects corresponding to the two sections. This approach is supported by the following results: - Nearly all the correlations between individual items were significant and often strong,
suggesting a substantial amount of shared variance; - The internal consistency (Cronbach’s alpha) of the instrument was very high, and the
correlations between parts 1 and 2 were strong (see Table 6.8). Table 6.8: Internal consistency of measures of general teaching strategies
and opportunities for learner involvement Part A (General Instructional Strategies) .895
Part B (Opportunities for Learner Involvement) .892
Whole instrument .940
Items whose removal would improve the reliability of the whole instrument
b3 (03/04 only) a5 (04/05 only
Correlation between parts A and B (Pearson) .848
Correlation between parts A and B (Spearman) .761
6.7 Specific teaching strategies, descriptive statistics Marcin Szczerbiński Descriptive statistics for all 54 individual specific teaching strategies (see Appendix B.6) are presented in Table 6.9. Again, the values shown are minutes. They indicate striking variability: most strategies were used only with a minority of learners (as most medians are zero), yet there are usually a few learners with whom a given strategy was used quite a lot (see standard deviations and maximum scores in the ranges).
Descriptive statistics for the specific strategies grouped into the five main categories are presented in Table 6.10 and Figure 6.1. In Figure 6.1 the bars with red boxes represent the 2003/04 cohort, those with blue bars the 2004/05 cohort. Clearly, the strategies appeared with unequal frequency. Text-level strategies were used most often, followed by word-level and other strategies. Sentence-level and multimodal strategies were relatively infrequent. This rank order was the same for both cohorts. It is also apparent that the distribution of all strategies was positively skewed, that is, all strategies (even those generally rare, such as multimodal) were used extensively with a minority of learners. Finally, it is apparent that, in the 2004/05 cohort, fewer strategies of any type were used in comparison with the 2003/04 cohort. This should be examined further: was this a genuine reflection of differences in teaching, or rather an artefact of the observers’ experience?

96
Table 6.9: Specific teaching strategies, descriptive statistics, each code
2003/04 COHORT 2004/05 COHORT FULL SAMPLE
Mean Median SD Range Mean Median SD Range Mean Median SD
1.1.1 1.30 .00 2.31 0-15 .78 .00 2.31 0-15 .98 .00 2.32
1.1.2 3.97 1.00 6.09 0-35 2.40 .00 5.27 0-33.67 3.01 .00 5.65
1.1.3 3.96 .29 8.17 0-71 2.36 .00 5.91 0-41.67 2.98 .00 6.91
1.1.4 13.23 8.75 15.33 0-86 10.51 6.00 13.71 0-75 11.57 7.33 14.40
1.1.5 5.49 .75 8.76 0-35 3.00 .00 6.29 0-53.25 3.97 .00 7.44
1.1.6 7.01 3.75 8.81 0-42.5 2.92 .00 5.40 0-50.75 4.51 .67 7.20
1.2.1 6.16 .00 12.33 0-75 6.26 .00 11.53 0-68 6.22 .00 11.83
1.2.2 3.42 .00 8.50 0-45 2.18 .00 5.78 0-35 2.66 .00 6.98
1.2.3 3.86 .00 9.86 0-74 4.54 .00 8.23 0-55 4.28 .00 8.90
1.3.1 8.13 .00 15.57 0-75 4.45 .00 9.86 0-70 5.88 .00 12.51
1.3.2 3.77 .00 9.53 0-47.5 1.90 .00 6.64 0-75 2.62 .00 7.93
1.3.3 3.93 .00 10.48 0-52.5 2.94 .00 8.32 0-78 3.32 .00 9.22
1.3.4 6.93 .00 12.22 0-75 3.24 .00 8.82 0-75 4.67 .00 10.42
1.3.5 4.73 .00 13.49 0-83.33 1.17 .00 5.92 0-68 2.55 .00 9.73
1.3.6 .98 .00 3.00 0-16.67 .80 .00 6.42 0-75 .87 .00 5.35
2.1.1 7.46 .00 14.69 0-71 5.08 .25 10.96 0-53.50 6.00 .00 12.57
2.1.2 9.74 .00 18.39 0-119 5.73 .00 12.08 0-75 7.29 .00 14.96
2.2.1 1.39 .00 3.51 0-21.25 .64 .00 3.52 0-42 .93 .00 3.53
2.2.2 7.90 .00 14.00 0-74.67 .62 .00 1.85 0-14.50 3.45 .00 9.51
2.2.3 4.14 .00 14.30 0-115 9.08 .00 15.23 0-96 7.16 .00 15.05
3.1.1 4.08 .00 7.15 0-41.25 2.71 .00 7.73 0-50.67 3.24 .00 7.53
3.1.2 3.01 .00 7.02 0-40 1.76 .00 5.98 0-31.25 2.25 .00 6.42
3.1.3 6.01 .25 11.10 0-55.33 4.71 .00 10.43 0-74.75 5.21 .00 10.70
3.1.4 2.32 .00 4.69 0-22 1.02 .00 5.89 0-68 1.53 .00 5.49
3.1.5 1.98 .00 6.57 0-60 .07 .00 .29 0-3 .81 .00 4.19
3.1.6 3.13 .00 7.02 0-37 3.05 .00 6.76 0-38 3.08 .00 6.85
3.2.1 5.76 2.17 7.55 0-38.5 3.63 1.33 5.54 0-42 4.46 1.75 6.47
3.2.2 5.39 1.54 7.47 0-44 5.52 1.00 11.08 0-82.25 5.47 1.25 9.83
3.2.3 2.35 .00 4.96 0-33 .55 .00 1.84 0-14.75 1.25 .00 3.52
3.3.1 3.96 .00 8.71 0-45 3.95 .00 10.23 0-63 3.96 .00 9.66
3.3.2 .97 .00 2.73 0-17.5 .74 .00 3.23 0-30 .83 .00 3.04
3.3.3 4.79 .00 8.38 0-42.33 3.49 .00 8.82 0-60.50 4.00 .00 8.66
3.3.4 1.08 .00 3.16 0-16.5 .36 .00 2.35 0-27 .64 .00 2.72
3.3.5 4.92 1.84 7.18 0-33.5 7.86 2.00 12.74 0-80 6.72 2.00 11.00
4.1.1 1.32 .00 4.89 0-36.25 1.39 .00 4.66 0-27.50 1.36 .00 4.75
4.1.2 .03 .00 .40 0-5 .24 .00 1.43 0-11.67 .16 .00 1.15
4.1.3 .41 .00 2.49 0-23.33 1.42 .00 7.22 0-77.25 1.03 .00 5.87
4.1.4 3.48 .00 12.97 0-79 1.27 .00 6.87 0-77.25 2.13 .00 9.75
4.1.5 2.02 .00 4.30 0-30 2.10 .00 4.55 0-35 2.07 .00 4.45
4.1.6 .14 .00 .42 0-2.5 .04 .00 .20 0-1.67 .08 .00 .31
4.2.1 1.58 .00 3.87 0-16.67 .75 .00 4.18 0-53 1.07 .00 4.08
4.2.2 .16 .00 .73 0-5.33 .56 .00 5.58 0-85.25 .40 .00 4.39
4.2.3 1.86 .00 5.07 0-30.25 .91 .00 5.37 0-76.50 1.28 .00 5.27
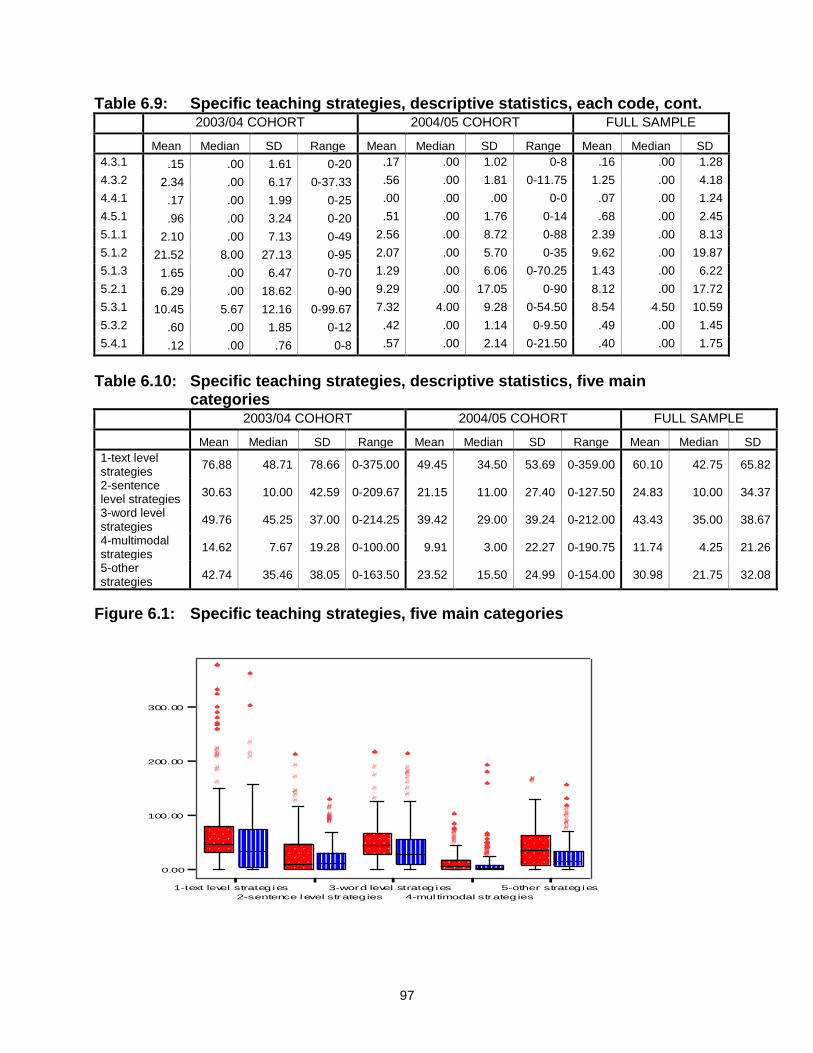
97
Table 6.9: Specific teaching strategies, descriptive statistics, each code, cont.
2003/04 COHORT 2004/05 COHORT FULL SAMPLE
Mean Median SD Range Mean Median SD Range Mean Median SD
4.3.1 .15 .00 1.61 0-20 .17 .00 1.02 0-8 .16 .00 1.28
4.3.2 2.34 .00 6.17 0-37.33 .56 .00 1.81 0-11.75 1.25 .00 4.18
4.4.1 .17 .00 1.99 0-25 .00 .00 .00 0-0 .07 .00 1.24
4.5.1 .96 .00 3.24 0-20 .51 .00 1.76 0-14 .68 .00 2.45
5.1.1 2.10 .00 7.13 0-49 2.56 .00 8.72 0-88 2.39 .00 8.13
5.1.2 21.52 8.00 27.13 0-95 2.07 .00 5.70 0-35 9.62 .00 19.87
5.1.3 1.65 .00 6.47 0-70 1.29 .00 6.06 0-70.25 1.43 .00 6.22
5.2.1 6.29 .00 18.62 0-90 9.29 .00 17.05 0-90 8.12 .00 17.72
5.3.1 10.45 5.67 12.16 0-99.67 7.32 4.00 9.28 0-54.50 8.54 4.50 10.59
5.3.2 .60 .00 1.85 0-12 .42 .00 1.14 0-9.50 .49 .00 1.45
5.4.1 .12 .00 .76 0-8 .57 .00 2.14 0-21.50 .40 .00 1.75
Table 6.10: Specific teaching strategies, descriptive statistics, five main categories
2003/04 COHORT 2004/05 COHORT FULL SAMPLE
Mean Median SD Range Mean Median SD Range Mean Median SD
1-text level strategies
76.88 48.71 78.66 0-375.00 49.45 34.50 53.69 0-359.00 60.10 42.75 65.82
2-sentence level strategies
30.63 10.00 42.59 0-209.67 21.15 11.00 27.40 0-127.50 24.83 10.00 34.37
3-word level strategies
49.76 45.25 37.00 0-214.25 39.42 29.00 39.24 0-212.00 43.43 35.00 38.67
4-multimodal strategies
14.62 7.67 19.28 0-100.00 9.91 3.00 22.27 0-190.75 11.74 4.25 21.26
5-other strategies
42.74 35.46 38.05 0-163.50 23.52 15.50 24.99 0-154.00 30.98 21.75 32.08
Figure 6.1: Specific teaching strategies, five main categories
1-text level strategies
2-sentence level strategies
3-word level strategies
4-mul timodal strategies
5-other strategies
0.00
100.00
200.00
300.00

98
Spearman correlations between the five main categories are presented in Table 6.11. Table 6.11: Correlations between main categories of specific strategies
2003/04 COHORT 1-text level strategies
2-sentence level
strategies 3-word level strategies
4-multimodal strategies
2-sentence level strategies -.241**
3-word level strategies -.023 .227**
4-multimodal strategies .072 .080 .515***
5-other strategies .643*** -.033 .072 .231**
2004/05 COHORT
2-sentence level strategies -.136*
3-word level strategies -.191** .194**
4-multimodal strategies .044 -.041 .216**
5-other strategies -.002 .030 .081 .069
*** = p<0/001; ** = p<0.01; * = p<0.05
The pattern of correlation was slightly different for each cohort. In the 2003/04 cohort, there was a moderate negative correlation between text-level and sentence-level strategies. At the same time, word-level and sentence-level strategies were moderately positively related. This suggests that learners who concentrated on lower levels of analysis (words and sentences) did so at some expense to the higher level (text). The pattern may also indicate general teacher preferences: some teachers may have adopted a more text-based, ‘whole language’ approach, at the expense of lower levels – and vice versa. Additionally, ‘other’ strategies were strongly related to text-level strategies, and weakly to multimodal strategies. Multimodal strategies were strongly related to word reading strategies. This pattern is harder to explain. In the 2004/05 cohort the negative relationship between high-level (text) and low-level (words and sentences) strategies was also observed. Text-level strategies showed a weak negative correlation with both word- and sentence-level strategies, while the latter two were weakly positively correlated. Interestingly, there was absolutely no relationship between ‘other’ strategies and text-level strategies, which were strongly related in the 2003/04 cohort. Multimodal strategies were again related to word-level strategies, but no longer to ‘other’ strategies. The most commonly used single strategies (median above 1, i.e. most learners experienced each of these strategies for at least one minute per class they attended) are listed in Table 6.12. They were generally similar for both cohorts. Learners reading silently was the most frequent strategy in both years. Of course this means they were practising their reading, but could/should they have done this between
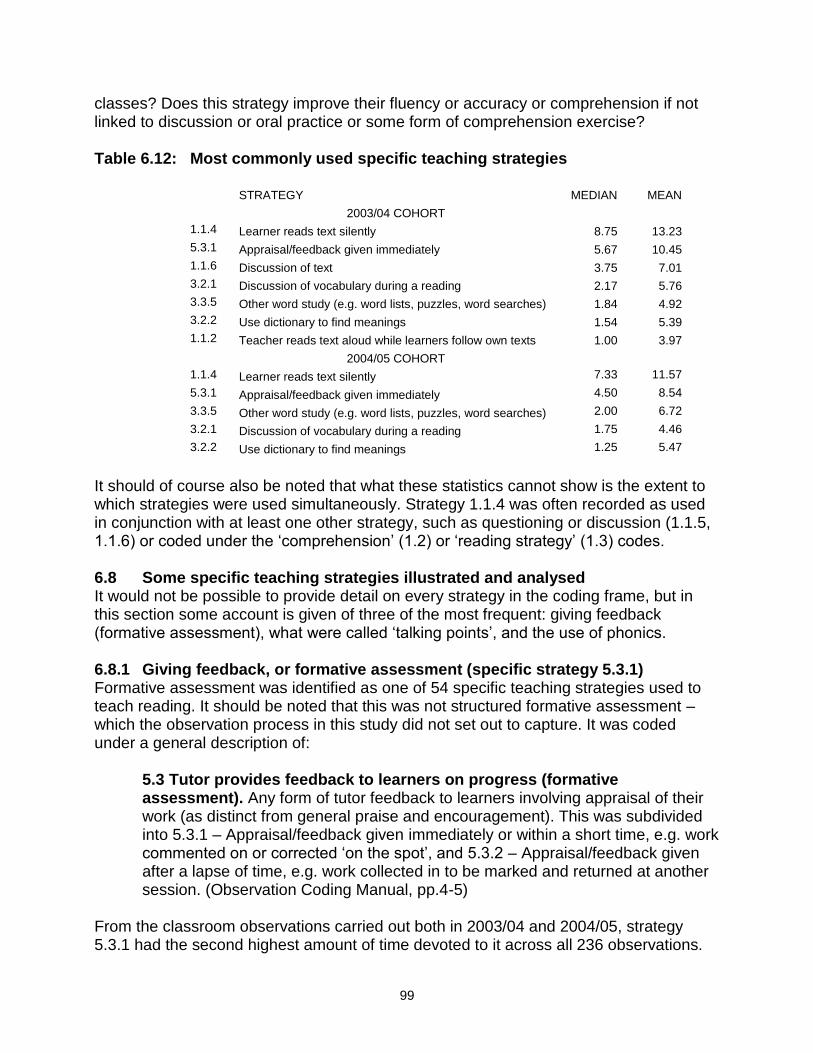
99
classes? Does this strategy improve their fluency or accuracy or comprehension if not linked to discussion or oral practice or some form of comprehension exercise? Table 6.12: Most commonly used specific teaching strategies
STRATEGY MEDIAN MEAN
2003/04 COHORT
1.1.4 Learner reads text silently 8.75 13.23
5.3.1 Appraisal/feedback given immediately 5.67 10.45
1.1.6 Discussion of text 3.75 7.01
3.2.1 Discussion of vocabulary during a reading 2.17 5.76
3.3.5 Other word study (e.g. word lists, puzzles, word searches) 1.84 4.92
3.2.2 Use dictionary to find meanings 1.54 5.39
1.1.2 Teacher reads text aloud while learners follow own texts 1.00 3.97
2004/05 COHORT
1.1.4 Learner reads text silently 7.33 11.57
5.3.1 Appraisal/feedback given immediately 4.50 8.54
3.3.5 Other word study (e.g. word lists, puzzles, word searches) 2.00 6.72
3.2.1 Discussion of vocabulary during a reading 1.75 4.46
3.2.2 Use dictionary to find meanings 1.25 5.47
It should of course also be noted that what these statistics cannot show is the extent to which strategies were used simultaneously. Strategy 1.1.4 was often recorded as used in conjunction with at least one other strategy, such as questioning or discussion (1.1.5, 1.1.6) or coded under the ‘comprehension’ (1.2) or ‘reading strategy’ (1.3) codes.
6.8 Some specific teaching strategies illustrated and analysed It would not be possible to provide detail on every strategy in the coding frame, but in this section some account is given of three of the most frequent: giving feedback (formative assessment), what were called ‘talking points’, and the use of phonics. 6.8.1 Giving feedback, or formative assessment (specific strategy 5.3.1) Formative assessment was identified as one of 54 specific teaching strategies used to teach reading. It should be noted that this was not structured formative assessment – which the observation process in this study did not set out to capture. It was coded under a general description of:
5.3 Tutor provides feedback to learners on progress (formative assessment). Any form of tutor feedback to learners involving appraisal of their work (as distinct from general praise and encouragement). This was subdivided into 5.3.1 – Appraisal/feedback given immediately or within a short time, e.g. work commented on or corrected ‘on the spot’, and 5.3.2 – Appraisal/feedback given after a lapse of time, e.g. work collected in to be marked and returned at another session. (Observation Coding Manual, pp.4-5)
From the classroom observations carried out both in 2003/04 and 2004/05, strategy 5.3.1 had the second highest amount of time devoted to it across all 236 observations.
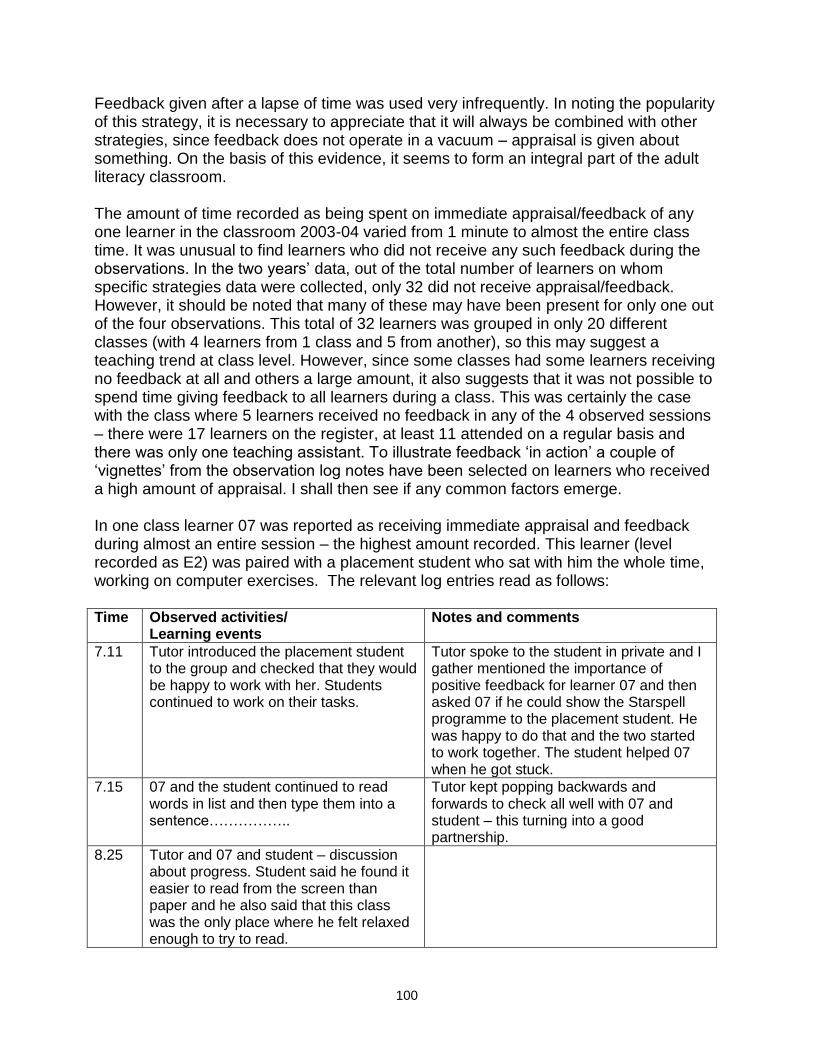
100
Feedback given after a lapse of time was used very infrequently. In noting the popularity of this strategy, it is necessary to appreciate that it will always be combined with other strategies, since feedback does not operate in a vacuum – appraisal is given about something. On the basis of this evidence, it seems to form an integral part of the adult literacy classroom. The amount of time recorded as being spent on immediate appraisal/feedback of any one learner in the classroom 2003-04 varied from 1 minute to almost the entire class time. It was unusual to find learners who did not receive any such feedback during the observations. In the two years’ data, out of the total number of learners on whom specific strategies data were collected, only 32 did not receive appraisal/feedback. However, it should be noted that many of these may have been present for only one out of the four observations. This total of 32 learners was grouped in only 20 different classes (with 4 learners from 1 class and 5 from another), so this may suggest a teaching trend at class level. However, since some classes had some learners receiving no feedback at all and others a large amount, it also suggests that it was not possible to spend time giving feedback to all learners during a class. This was certainly the case with the class where 5 learners received no feedback in any of the 4 observed sessions – there were 17 learners on the register, at least 11 attended on a regular basis and there was only one teaching assistant. To illustrate feedback ‘in action’ a couple of ‘vignettes’ from the observation log notes have been selected on learners who received a high amount of appraisal. I shall then see if any common factors emerge. In one class learner 07 was reported as receiving immediate appraisal and feedback during almost an entire session – the highest amount recorded. This learner (level recorded as E2) was paired with a placement student who sat with him the whole time, working on computer exercises. The relevant log entries read as follows: Time Observed activities/
Learning events Notes and comments
7.11 Tutor introduced the placement student to the group and checked that they would be happy to work with her. Students continued to work on their tasks.
Tutor spoke to the student in private and I gather mentioned the importance of positive feedback for learner 07 and then asked 07 if he could show the Starspell programme to the placement student. He was happy to do that and the two started to work together. The student helped 07 when he got stuck.
7.15 07 and the student continued to read words in list and then type them into a sentence……………..
Tutor kept popping backwards and forwards to check all well with 07 and student – this turning into a good partnership.
8.25 Tutor and 07 and student – discussion about progress. Student said he found it easier to read from the screen than paper and he also said that this class was the only place where he felt relaxed enough to try to read.

101
This was a small enough class (5 learners) to be able to pair a learner with an assistant 1-to-1 for most of the time. Learner 07 said he was looking forward to returning the following week (having been given no feedback in previous weeks, according to the observation data). The other learners present were recorded as receiving no feedback during that particular session. When asked at the end about the progress her learners had made, the tutor confirmed that 07 ‘left a lot more positive than he arrived’. The practitioner-researcher observing made the following comment about the pairing: ‘I thought she (the tutor) was particularly adept at using her placement student to good effect, but at the same time monitoring her performance and giving advice. It worked well but only because the tutor was experienced.’ In the session of another class where learner 05 received feedback for well over half the class running time, there were 7 learners and one volunteer present. The volunteer was usually paired with 05, who had been identified as the weakest learner in the class (E1). To begin with the tutor sat with learner 05, going through words on Dolch list worksheets, and then handed over to the volunteer after briefing her and providing a short period of ‘overlap’. Time Observed activities/learning events Notes
9.50 Tutor shows volunteer what she’s done with learner 05 and tells her to go on to the next worksheet.
9.55 Tutor gets 05 to read the words out again. Volunteer then stays with 05 while tutor returns to another learner. Volunteer dictates the words to 05.
9.58 Volunteer gets 05 to read from what he’s written. She ticks what’s right…………..
10.15 11.25 11.30 11.45
……volunteer reads aloud the list of words 05 has written. ‘Excellent’, ‘that’s really good’….. ‘excellent’….. ‘yes, well done’….. ‘that’s wonderful, brilliant’
(Dictation, writing and reading Dolch words continue until the end of the class, encouraged by the volunteer, who supplies feedback for every word, written or oral.)
The volunteer gave constant positive feedback to the learner but, arguably, the repetitive nature of the task meant that the learner had a good chance of success. The observer recorded that the tutor was very grateful for help from a volunteer and said that she ‘could do with more (volunteers). If she didn’t have this volunteer’s help, she would have to spend all her time with the weaker learners.’ In the past she said she had to manage without any help, for example she once had a class of 14, all at different levels. As with the previous class, this was also a class where there were other learners who received no feedback during the entire session. Both classes had an assistant working one-to-one exclusively with a learner who had been assessed as being at a low level within the class. In both cases, the assistants received guidance from the tutor. It may well be that such 1-to-1 pairings do facilitate the use of large amounts of feedback and

102
appraisal, and it might be instructive to see the extent to which feedback is reduced in large classes with no assistance available. Feedback and appraisal, however, do not necessarily depend on exclusive one-to-one pairings as the following vignette shows. Time Grouping Observed activities/Learning events Notes
10.17 Alone The learners work individually at reading the sentences and putting L, T or P beside each one.
This entails deciding which of Letter, in Person or Telephone applies to 7 different sentences.
10.19 Whole class (01, 04, 05, 06, 08)
‘OK’ – Tutor reads out each sentence, asking the learners in turn which they’d put. 07 breaks in to discuss the response to sentence 4 – tutor tells him – ‘good point’. There’s some misunderstanding of how sentence 5 might be interpreted, but tutor merely says ‘That’s fair enough.’ They all discuss the last sentence and 01 suggests witnesses could be a record.
Feedback to each.
This was a class with no assistant, 8 on the register and usually about 6 learners present. Here the tutor managed to give appraisal/feedback on a comprehension exercise in a whole-class grouping, which in turn generated further discussion of the text. Teachers do worry about trying to give each learner some individual attention. A tutor from another class expressed her main concern as ‘I worry about not getting round them all, not giving them ‘quality time’. This was despite it not being an excessively large class (7 or 8 attending during the observations) and the presence of 2 assistants. Her learners did receive feedback during at least 2 of the 4 observed sessions, although this was done not by whole class teaching but by her moving round the class and sitting with those who were not already paired up with assistants. Finally, it should be noted that feedback and appraisal do not have to be positive. But, as all these examples show, many tutors try to give praise and encouragement as a way of boosting confidence and self-esteem, especially with weaker learners. 6.8.2 ‘Talking points’ (specific strategy 5.4.1) The frame for coding specific strategies for teaching reading was designed to be as all-embracing as possible, drawing on the literature on the pedagogy of reading, the preceding project on adult learners’ difficulties in reading, and the practitioner-researchers’ considerable professional experience. As there was an instance noted at the very start of the observation process of a practice which could not be easily categorised, it was decided, after consultation with the practitioner-researchers, to include a coding which could embrace the unexpected in the classroom. Thus the coding manual described strategy 5.4.1 as ‘Talking points: Any noteworthy or bizarre occurrence, e.g. learner relating length of word to size of object represented by that word’ (using the example that evoked the category to illustrate it). Although we advised that this code ‘should only be used for exceptional circumstances which cannot be reflected by the existing codes’, the decision to code as 5.4.1 was at the discretion of the
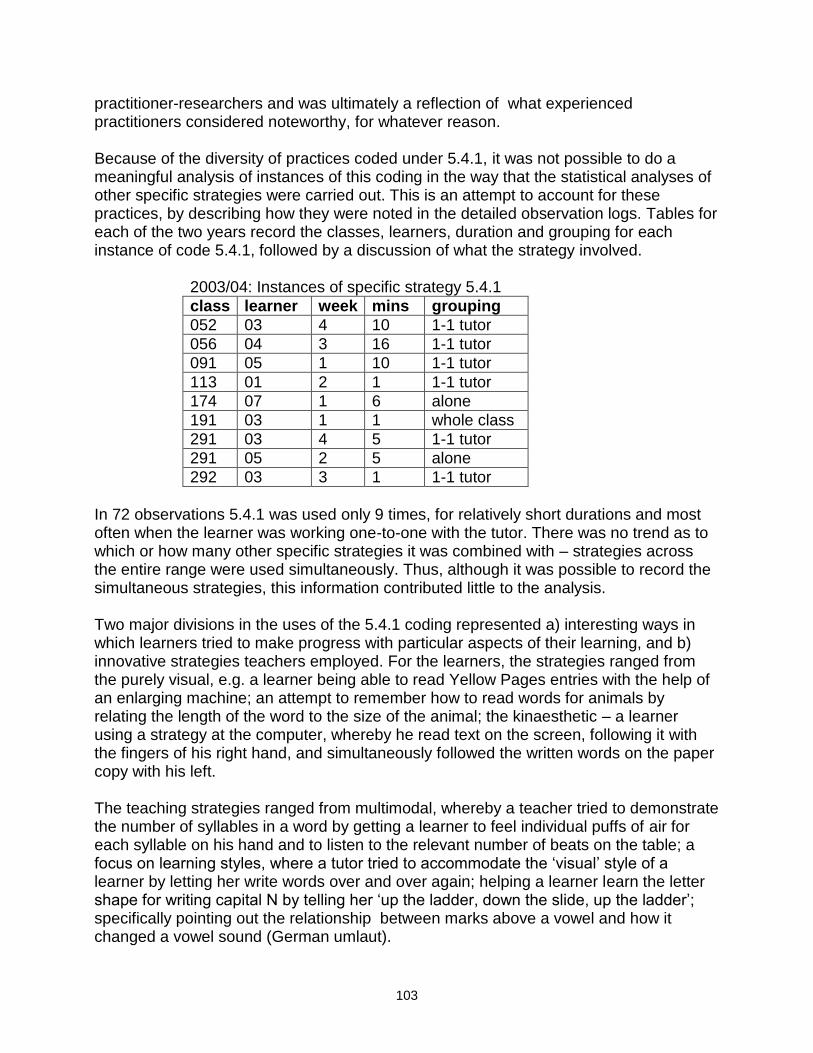
103
practitioner-researchers and was ultimately a reflection of what experienced practitioners considered noteworthy, for whatever reason. Because of the diversity of practices coded under 5.4.1, it was not possible to do a meaningful analysis of instances of this coding in the way that the statistical analyses of other specific strategies were carried out. This is an attempt to account for these practices, by describing how they were noted in the detailed observation logs. Tables for each of the two years record the classes, learners, duration and grouping for each instance of code 5.4.1, followed by a discussion of what the strategy involved.
2003/04: Instances of specific strategy 5.4.1
class learner week mins grouping
052 03 4 10 1-1 tutor
056 04 3 16 1-1 tutor
091 05 1 10 1-1 tutor
113 01 2 1 1-1 tutor
174 07 1 6 alone
191 03 1 1 whole class
291 03 4 5 1-1 tutor
291 05 2 5 alone
292 03 3 1 1-1 tutor
In 72 observations 5.4.1 was used only 9 times, for relatively short durations and most often when the learner was working one-to-one with the tutor. There was no trend as to which or how many other specific strategies it was combined with – strategies across the entire range were used simultaneously. Thus, although it was possible to record the simultaneous strategies, this information contributed little to the analysis. Two major divisions in the uses of the 5.4.1 coding represented a) interesting ways in which learners tried to make progress with particular aspects of their learning, and b) innovative strategies teachers employed. For the learners, the strategies ranged from the purely visual, e.g. a learner being able to read Yellow Pages entries with the help of an enlarging machine; an attempt to remember how to read words for animals by relating the length of the word to the size of the animal; the kinaesthetic – a learner using a strategy at the computer, whereby he read text on the screen, following it with the fingers of his right hand, and simultaneously followed the written words on the paper copy with his left. The teaching strategies ranged from multimodal, whereby a teacher tried to demonstrate the number of syllables in a word by getting a learner to feel individual puffs of air for each syllable on his hand and to listen to the relevant number of beats on the table; a focus on learning styles, where a tutor tried to accommodate the ‘visual’ style of a learner by letting her write words over and over again; helping a learner learn the letter shape for writing capital N by telling her ‘up the ladder, down the slide, up the ladder’; specifically pointing out the relationship between marks above a vowel and how it changed a vowel sound (German umlaut).

104
It is significant how many of these strategies were multimodal. The codings for the multimodal strategies were infrequently used in the course of the specific strategies analysis in 2003/04, but it seems that when multimodal strategies were employed they were regarded as especially worthy of attention.
2004/05: Instances of specific strategy 5.4.1
class learner week mins grouping
084 04 09
2 1 2
Learner pair Learner pair
086 02 4 86 1-to-1 tutor/assistant
116 01,02,04,05 2 19 Whole class
293 01, 02, 03 04 06
1 3 9 3 3 6
Small group Learner pair
362 01,05,06, 07 1 19 Whole class
421 01 05
4 1 1-to-1 assistant 1-to-1 tutor
441 01,02,03,07 4 33 Whole class
451 01,02,03,04, 05,06,07,08 1 3 Whole class
471 01, 02,04, 05,06,08
3 12 Whole class (10 mins) Alone (2 mins)
471 08 4 1 Small group
501 07 4 15 1-to-1 assistant
In the second year of observations, there were 11 instances recorded out of a total of 144 observations, an even smaller proportion than during the first year. Again there was no pattern to the types and number of other specific strategies used simultaneously. However, there were two significant differences in the data from the second year compared with the first year, namely that strategy 5.4.1 was used 1) most often in a whole class or small group situation, and 2) for longer periods of time – a feature possibly related to 1). Not all the descriptions were of events which were, strictly speaking, unusual, or even related to reading, as opposed to writing/oral work, so not all will be discussed here. In some cases, the choice of a 5.4.1 code seems to have been regarded as a marker of good or interesting, rather than innovative, teaching practice, for example, where a tutor was giving explicit instruction to learners about where to locate images on the internet, and how to find publisher’s name, contents, blurb, etc., in a book; carefully explaining layout in terms of paragraphs and indented lines; giving learners a short PowerPoint presentation on the history of the English language, including origins of certain words and information on different accents and dialects. If we try to make the same division between a) learning and b) teaching as we did for the first year, these are all instances of the latter. In addition, a long session of map reading using grid references was

105
flagged as an unexpected exercise in a literacy class. The most unusual practice observed, which would fall into the category a) learner progress, was the use of a hand-held electronic scanning device called a ’Quicktionary Reading Pen’, on loan from the learner’s dyslexia tutor (whose class she also attends). This device will speak any word that is scanned, give its meaning and also say the letter sounds. Across the two years, there was little that was recorded as exceptionally noteworthy, and thus the exclusion of 5.4.1 from the quantitative analysis of specific strategies is not significant. It is not possible to make generalisations about the nature of strategies coded as 5.4.1. Speculation about the rarity of this coding, especially during the second year, is not particularly helpful, although it is interesting that during the second year there was also a narrower range of specific strategies recorded anyway. A possible explanation may lie partly in the constraints placed on the content of the syllabus by the Core Curriculum and the focus on the National Tests. 6.8.3 The use of phonics in teaching reading (specific strategy 3.1.3) Introduction Phonics as a strategy for decoding words is included at Entry levels 1-3 of the Adult Literacy Core Curriculum, and indeed has emerged from our data as one of the most commonly used word decoding strategies in adult literacy classes. There is, however, no substantial research to support its inclusion as an effective teaching strategy for adults. This section will describe and analyse the occurrences of its use in the observations undertaken in the project. We start by defining what is meant by phonics and how we have coded this for our observations, then outline its stated role in the Adult Literacy Core Curriculum and also briefly summarise some of the research findings on phonics, including the phonics element of the National Literacy Strategy. Some definitions According to the Cambridge Encyclopaedia of the English Language, phonics is ‘a method of teaching reading that trains the recognition of sound values of individual letters’ (Crystal, 1995: 456). To avoid ambiguity, I will refer to these ‘individual letters’ as graphemes, the smallest contrastive units in the writing system of a language (Crystal, 1995: 453). This word was coined by analogy with phoneme, by which is meant the smallest contrastive unit in the sound system of a language. The expression, grapheme-phoneme correspondences, is commonly used to describe the relationships that hold between letters and sounds. I follow the normal linguistic convention in using <angled brackets> for individual graphemes and written words and /forward slashes/ for phonemes and phonetic realizations of words. When coding our specific teaching strategies, any strategy that related graphemes to phonemes was placed in one sub-category, ‘Use of phonics/phonemic awareness’ (3.1.3), under the higher-level heading of ‘Word recognition/decoding’ (3.1). This would include learning to recognise and blend or segment initial, medial and final sounds, in other words ‘phonemic awareness’. This is not to be confused with ‘phonological awareness’, which is more of a ‘blanket term’ (Goswami and Bryant, 1990: 2) although the two are often used interchangeably. For our project, we have coded analysis of
106
words into syllables – ‘the most obvious way’ (Goswami and Bryant, 1990: 2) of breaking up words – under a separate heading, without reference to phonology. Division into onset and rhyme is not mentioned specifically in our list of categories, but any occurrences would be coded as 3.1.3. The Adult Literacy Core Curriculum The 2001 adult curriculum drew heavily on the National Curriculum for schools. For reading at Entry levels 1-3, there is reference to ‘decoding’ words; one of the strategies to be employed is specifically stated to be the recognition of grapheme-phoneme correspondences and the development of ‘phonemic awareness’. The Curriculum defines ‘phonics’ as ‘a method of teaching reading and spelling that is based on establishing the link between the sound of a word and its graphical representation’ (Basic Skills Agency, 2001: 140). The glossary lists ‘phonological awareness’ but not phonemic awareness, an anomaly which may merely reflect a confusion of the two definitions. There is a table headed ‘phonics and spelling’ (p.107) and showing a suggested progression from recognition of initial consonants to end clusters, but no equivalent table in the reading section. The research literature Research on the use of phonics and phonemic awareness in reading has been confined almost entirely to children’s literacy acquisition and it is outside the scope of this short analysis to go into detail about the research that has been done. It is sufficient to note, for our purposes, that there is now considerable evidence to support the use of phonics, to the extent that it was recently stated that ‘There should no longer be any dispute that phonics is part of the main highway to success in literacy learning’ (Brooks, 2003: 6). Torgerson et al. (2006), in their systematic review of the research literature on the use of phonics instruction with children, concluded that ‘systematic phonics instruction within a broad literacy curriculum was found to have a statistically positive effect on reading accuracy’ (p.9). And the government-commissioned report on the teaching of reading in schools, The Rose Review, recommended phonics as the key teaching strategy (Rose, 2006). However, the proviso must be made that the undoubted role of phonics in the literacy acquisition of children cannot automatically be assumed to have a parallel importance for adults. The similarities and differences need to be explored more fully. The NRDC report on adult learners’ difficulties in reading (Besser et al., 2004) noted the lack of adult phonics materials, and suggested that ‘in some adult literacy circles phonics was taught through spelling and that at times “spelling” was used as a euphemism for phonics.’ The report also confirmed that, in general, the appropriateness of teaching phonics to adults is very much a contested area within adult literacy circles. Method All the observations over the two years were checked for occurrences of teaching strategy 3.1.3, as recorded by the practitioner-researchers in the specific strategies analysis sheets. Although each year was analysed separately to start with, similar trends were observed, so the analysis is of the total sample, with any differences noted where appropriate. Each occurrence of 3.1.3 was recorded, along with the grouping and the strategies being used simultaneously. Neither the individual learners on the receiving

107
end of the strategy nor the individual timings are analysed here, as this was done through the quantitative data analysis of the spreadsheets. The use of strategy 3.1.3 was then tracked back through the original observation logs in order to find further details about the ways in which this strategy was used. Some of the issues which are raised by the delivery and range of uses found are then discussed. Preliminary analysis of the data Of the total of 236 observations undertaken, 101 had specific strategy 3.1.3 recorded at least once during the session. The time spent could range from ‘episodic’ (a notional 1 minute) to practically the entire class time. In each of the years, the percentage of sessions in which the strategy was used was very similar, 43% (40 of 92) in the first year and 42% (61 out of 144) in the second year. Because of the difficulties in timing strategies when multiple activities were going on, it is not possible to comment on the significance of the time devoted to the strategy. The two main findings were:
All possible groupings were used, although the strategy was used most often in a 1-to-1 grouping with a teacher or assistant.
Even in the shorter periods of time, the strategy was rarely used alone, and was usually combined with at least one other strategy, most often another word-level strategy. Although it was also quite often combined with other strategies at text level, it was least often combined with those at sentence level.
These two aspects will now be examined in greater detail. Grouping Phonics was used most often in 1-to-1 situations. This could be with either teacher or assistant, although, when there was an assistant in the class, it would more often be the assistant, rather than the teacher. This is no doubt because assistants are most often used in mixed-ability classes to support the weakest learners, who are also the ones who most benefit from being taught decoding strategies. In one observation, however, the volunteer was still completing her training and this was her first placement, again with the weakest learner (Entry 2/3) in the class. She did not attempt phonics, relying mainly on whole-word prompting or referring to letter names rather than sounds. Strategy 3.1.3 was found in all other grouping possibilities, with whole class/small group being the next most frequent. Sometimes, but not always, these classes shared certain characteristics, for example they were specifically designed for learners with dyslexia or were designated Entry level classes, with learners ipso facto at a similar level, or were for Downs learners. Simultaneous strategies Although 3.1.3 did take place on its own, it was usually combined with one or more other strategies from such a wide range that it was difficult to find a meaningful pattern. What can be stated, however, is that it was most often used with one or more of the 13 other word-level strategies. In the first year’s data it was found in combination most often with 3.1.6 (recognition of spelling patterns within words). It was also commonly used with 3.1.5 (teacher’s correction of miscues) and 3.3.3 (studying affixes). In the second year,
108
the most frequent combinations with other decoding strategies were 3.1.1 (sight recognition of key words) and 3.1.2 (recognition of letters of the alphabet). Commonest of all the word-level strategies used with 3.1.3 were 3.2.2 (dictionary use) and 3.3.5 (‘other word study’, a coding that was a ‘catch-all’ to include word lists, searches, puzzles and anagrams). In both years it was also quite often combined with text-level strategies, especially 1.1.2 (teacher reads aloud), 1.1.3 (learner reads aloud) and 1.1.4 (learner reads silently). Accompanying strategies at sentence level were the least common. The frequent use of the combination of 3.1.3 with 3.1.6 demanded a closer examination, especially in view of the perceived connection between spelling and phonics. When looking through the observation notes for the 3.1.3/3.1.6 combination, it was significant how often it was actually spelling, rather than reading, which instigated the phonics instruction. Arguably this should not always have been coded as a reading strategy, although the boundaries are difficult to define. Thus, to take two examples, there was one session which opened with a discussion of strategies for learning spellings. The teacher then wrote a list of words sharing the same roots on the board and they were then sounded out (= read by phonics). In another class a common pattern was to set a spelling test, with the teacher writing out on the board five vowel digraphs representing different diphthongs. As the teacher read each word out, she often helped by pointing to the appropriate digraph and sounding it out. Overall, the most frequently used word recognition/decoding strategy has emerged from the statistical analysis as phonics. However this apparently high incidence should not be allowed to obscure the fact that it was rarely used as the only decoding strategy. Range of phonics activities In addition to the spelling-based phonics already illustrated above, a wide range of phonics activities was undertaken. Since our phonics coding allowed for no further subdivisions, it was necessary to track the occurrences from the observation logs for further details. All those which seemed to be used primarily to teach spelling were excluded, although the divisions were not always clear-cut. For example, with a list of singular nouns, a teacher asked the learners to hear the ‘hiss’ of fricatives to decide on the spelling of the plural morpheme as <s> or <es> since it would be ‘too hard to say’ otherwise. And it was not always possible to recover descriptions from the practitioner-researchers’ log notes; sometimes there would just be a reference to ‘decoding’ a word, sometimes no details of the strategy could be found. However, enough information was recovered to provide a representative sample of the activities that were coded as 3.1.3. These can be divided into three main kinds of activity: 1. ad hoc decoding, 2. more systematic approaches to decoding, and 3. phonics in a wider context. I shall describe the activities observed under each heading. 1. Ad hoc decoding This was the most commonly occurring category and the learner would be helped to sound out words – either individual phonemes, onsets, rimes or syllables – as and when the need arose. This could also include prompting by suggesting another word which

109
rhymed, e.g. to help read <bore>, a learner was asked, ‘What sounds like <snore>?’ And to read <calm> with its silent <l>, the suggestion was made that it could be written <carm>. The words could be part of a longer text, for example a newspaper article, or in a word list. Into this category also came a learner being asked to sound out a misspelled word as a way of helping correct it. 2. More ‘systematic’ approaches Frequently this would involve worksheets, or web-based materials, more often than not dealing with vowels. These would often require the learner to identify the difference between so-called long and short vowels in words, taking the grapheme as the starting
point, e.g. <o> in <office> vs <home> (although actually ‘long’ <o> is a diphthong /əʊ/, not a pure long vowel). Consonant work happened less frequently but tended to involve digraphs, e.g. <ch> where learners were asked to assign words starting in <ch> to one
of three lists depending on the sound – /ʧ/, /∫/ or /k/ . In this category were also attempts to explain ‘rules’ usually with reference to a spelling pattern, e.g. ‘magic e’ making a vowel ‘long’; which vowel sound you hear in 2-vowel graphemes, e.g. in <ea>; or context-sensitive grapheme-phoneme correspondences, for example the following vowel influencing whether <c> or <g> are ‘hard’ or ‘soft’, or whether <c> sounds like /k/ or /s/. Sometimes these ‘rules’ would also be stated ad hoc. Games could also be set up round phonic ‘rules’ and patterns, for example domino phonetics, sounds bingo or matching ‘long’ vowels with pictures representing words containing them. 3. Phonics in a wider context There were instances observed where the grapheme-phoneme relationships and the problems connected with having more sounds than letters in English were discussed. This was used to explain the spelling system and why English was ‘silly’, ‘frustrating’ and ‘annoying’, according to one teacher. Explanation was given in two cases in terms of the historical development of the language. Dialectal differences were also discussed. On the whole, however, linguistic terms such as ‘phoneme’ and ‘grapheme’ were avoided with the learners, although one teacher did describe two unfamiliar words a learner encountered – <Hal> and <lent> – as ‘phonic’ words to help him decode them. Presumably it was a similar distinction she was making on another occasion when she said that the sounds in the word <cat> ‘help us to read it’, but that in <night> ‘the sounds don’t help’, the <ight> ending being a ‘funny one’ – except that the correspondence of
grapheme <igh> to phoneme /aɪ/ (the sound of the word <eye>) after a consonant letter is one of the few in English that has no exceptions in ordinary words, though there are some in unusual names (Carney, 1994: 332). Discussion The most frequent use of phonics arose ad hoc when decoding words in a text or word list. The next most common activity was relating spelling patterns to the sounds they made. Despite the frequency with which the 3.1.3 coding was applied, there was disconcertingly little evidence of a good grasp of phonetics on the part of the teachers, together with some confusion in terminology (such as the use of ‘phonic’ in the preceding section). Some examples of misinformation were as follows:
110
There was no attempt to distinguish diphthongs from long vowels (indeed ‘diphthongs’ were not mentioned once), with vowel letters described misleadingly as ‘saying their name’ when ‘long’.
There was also some confusion as to whether it was the spoken or written language being referred to, and there was even some switching between letter names and sounds for decoding purposes. ‘Rhyming’ seemed to be used to mean ‘having the same written ending’. The grapheme-phoneme confusion led to various misleading statements; it seems distinctly misleading to call <rush> a ‘phoneme frame’ to which <b> (/b/) is added to make <brush>, or to refer to the ‘<i> before <e>’ rule with reference to the pronunciation of the word ‘friend’. Spelling-influenced (mis)pronunciations and misdirections abounded, for example
in normal connected speech the initial vowel sound of ‘exotic’ is not /e/ but /ɪ/; ‘accept’ and ‘except’ do not have different initial vowel sounds except in very careful speech; asking a learner to listen out for the /t/ sound in the <tion> ending is entirely unhelpful since there is no /t/ sound here.
There was also some distinctly wrong information being imparted, for example when you get 2 vowels together, e.g. <ea>, it is not always the first one that ‘makes the sound’ – see the demolition of this notion by Clymer (1963/1996). Nor is it always the case that when you get 2 vowels together ‘one of them doesn’t sound’ – the example was the word ‘favour’, but one of the next words the teacher mentioned was ‘society’, which did not seem to prompt any realisation of inconsistency. And to suggest that you can hear the /t/ in ‘creation’ because it is derived from ‘creature’ is both phonetically and etymologically unsound.
Dismissing English as a ‘silly’ language may be comforting for learners to hear, but there is a danger, in the process, of rejecting the help that phonics can still offer for decoding many of the less transparent words (as in the example of ‘night’ above). There is some evidence from the data that learners do have a level of phonemic awareness and do recognise the benefits of understanding grapheme-phoneme relationships. For example one learner said she found sounds easier to identify at the beginning of words than at the end because they sound ‘different at the end’, and another learner realised that if he knew how the letters sounded in words he could recognise, he could sound out other words. And another learner, observing phonics instruction going on in the class with someone else, said she ‘could do with that sort of thing to help her to pronounce words properly’. It is not as though learners, especially those who have contact with primary school children, are unaware of phonics; one learner was apparently doing work, at her own request, on long vowel recognition, according to the observer’s log notes, ‘so she can keep up with her seven-year-old, who is fully conversant with phonemes and long vowels’.
Conclusion Although phonics has emerged as the most commonly used of the word-recognition/ decoding strategies, our data have also shown that it can be delivered in inaccurate, unsystematic and misleading ways. This may be due to absence of training in phonics delivery, combined with a lack of the necessary underpinning phonetics knowledge; lack of conviction that it is an appropriate strategy; or lack of time and opportunity in multi-

111
ability classes. Often weaker learners are teamed up with volunteers, who may not have received much, if any, training in phonics or who lack confidence in using it as a strategy. In a mixed-ability class, it may not be felt to be a suitable strategy for whole-class teaching. There may also be a feeling that it may be more appropriate to give adults context cues, or even to correct miscues and supply the whole word. There was an example of a teacher supplying entertaining but ultimately unhelpful ‘clues’ for the word ‘shark’ by making hand movements to suggest ‘waves’ and pointing to his chin to suggest ‘Jaws’. These are prompts which will not actually help a learner to become an independent reader. The reluctance to use phonics here may be because of the association with school-level literacy; indeed there was one telling reference made by a teacher in one of the classes to the sounds the letters made as the ‘baby alphabet’. There does not appear to be the same reluctance to use phonics as a strategy for teaching spelling. Indeed many of the phonics exercises and games observed seem to have been designed to help spelling rather than reading. Although, in general, teachers were not asked for their opinions on phonics, two experienced teachers who had both worked as primary teachers were specifically asked for their views. One said she did not rule phonics out, but thought that what was needed was a variety of strategies that were appropriate for each individual learner. Phonics was not a strategy she used during the observed sessions. Another teacher, who was observed to make a limited use of phonics, said that she considered it an ‘important strategy’. The underlying question that is being asked, of course, is how effective a strategy phonics is for helping adults to improve their reading. It will be difficult, from our observations, to reach a conclusion on its true effectiveness until the teaching of phonics is more rigorous, consistent and confident. What we can hope to find out from the data is the extent to which exposure to phonics, albeit of variable quality, affects progress. The lack of phonic accuracy and phonetic underpinning knowledge detected in this project prompted a small-scale investigation of whether training some adult literacy tutors to use phonics more knowledgably and accurately would benefit their learners’ progress – the evidence was positive (Burton et al., 2010). See also the associated practitioner guide (Burton et al., 2008) and Maxine Burton’s summary of the underlying phonetics in Phonetics for Phonics (Burton, 2011). 6.9 Summary Information from interviews and from feedback and consultation days was used to build up a detailed profile of the observed teachers. Nearly all teachers had generic teaching qualifications, but, although all but one had received Core Curriculum training, less than half had Basic Skills qualifications. Many had considerable teaching experience. Their views covered a range of issues, but paramount amongst these was their concern for their learners. Valuable insights were also gained about the drawbacks and benefits of using volunteers to assist in the classroom. Classroom layouts showed that the most popular arrangement was one large table with learners sitting round. The arrangements used also correlated to an extent with grouping

112
patterns. The analysis of grouping patterns showed an overall preference for the model of ‘groupwork followed by practice’. Scores on the general teaching strategies and opportunities for learner involvement indicated a single measure of teaching quality; although a wide range of teaching quality was observed, most teaching was assessed as of high or fairly high quality. With regard to the specific teaching strategies, overall strategies at text level were the most frequently used, followed by those at word level, the most frequent strategy being recorded as silent reading. Significantly fewer strategies were logged in the second year than in the first, but there was no obvious explanation for this. The illustrations and analyses of three specific teaching strategies suggested that some might be so frequent as to lose impact (praise and encouragement) or so rare (‘talking points’ and phonics) and/or (in the case of phonics) inaccurate as to be ineffective.

113
Chapter 7 Teaching and learning
Marcin Szczerbiński In this chapter the nub of the matter is tackled: what factors, if any, in teachers or teaching were correlated with learners’ progress in reading and/or improvements in their attitudes? The question is addressed in turn from several angles: teachers’ characteristics, classroom groupings, general teaching strategies, opportunities for learner involvement, and specific teaching strategies. 7.1 Teachers’ profiles and changes in reading scores Correlations between teachers’ qualifications (both generic and in basic skills) and years of experience in teaching basic skills, on the one hand, and changes in their classes’ average reading scores on the other were examined. There appeared to be no relationship with any factor. 7.2 Patterns of activity in class and changes in reading scores and attitudes As mentioned in section 6.5, a statistical analysis was undertaken on the first cohort’s data to see whether learners in the three groups of classes (every session has a whole-class section plus individual work; all individual work in every session; mixed) differed in their progress in reading and/or changes in their attitudes. The results are shown in Tables 7.1 and 7.2.
The differences between the three groups in change in reading attainment were negligible (F<1, p>0.50), and the same was true for changes in attitudes (p>0.10 for all analyses). Overall, there was no evidence that the three different ‘grouped’ modes of teaching resulted in different outcomes. The analysis was therefore not repeated for the second cohort. Table 7.1: Change in reading scores, by 3 class activity patterns
N Mean Std. Deviation
Pre_post difference in reading scores
whole-class followed by individual 58 -4.24 10.43
all individual work 31 -5.61 12.31
mixed 43 -5.67 8.74
Total 132 -5.03 10.34
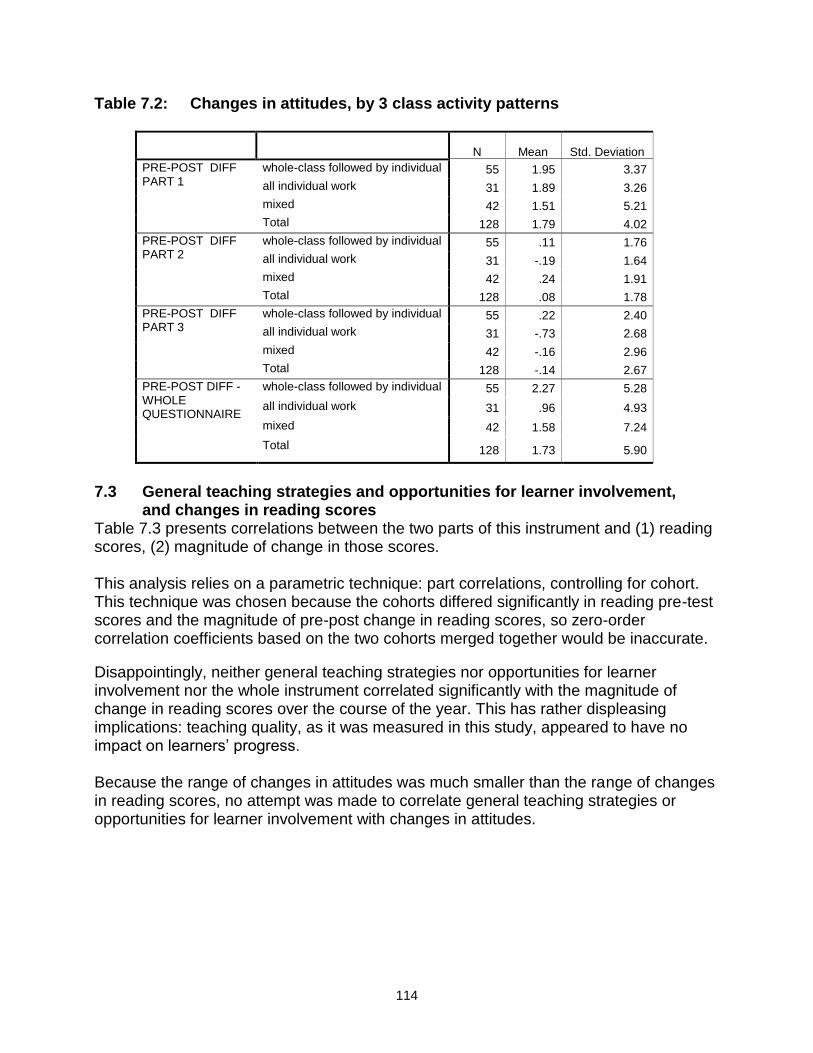
114
Table 7.2: Changes in attitudes, by 3 class activity patterns
N Mean Std. Deviation
PRE-POST DIFF PART 1
whole-class followed by individual 55 1.95 3.37
all individual work 31 1.89 3.26
mixed 42 1.51 5.21
Total 128 1.79 4.02
PRE-POST DIFF PART 2
whole-class followed by individual 55 .11 1.76
all individual work 31 -.19 1.64
mixed 42 .24 1.91
Total 128 .08 1.78
PRE-POST DIFF PART 3
whole-class followed by individual 55 .22 2.40
all individual work 31 -.73 2.68
mixed 42 -.16 2.96
Total 128 -.14 2.67
PRE-POST DIFF - WHOLE QUESTIONNAIRE
whole-class followed by individual 55 2.27 5.28
all individual work 31 .96 4.93
mixed 42 1.58 7.24
Total 128 1.73 5.90
7.3 General teaching strategies and opportunities for learner involvement, and changes in reading scores
Table 7.3 presents correlations between the two parts of this instrument and (1) reading scores, (2) magnitude of change in those scores. This analysis relies on a parametric technique: part correlations, controlling for cohort. This technique was chosen because the cohorts differed significantly in reading pre-test scores and the magnitude of pre-post change in reading scores, so zero-order correlation coefficients based on the two cohorts merged together would be inaccurate.
Disappointingly, neither general teaching strategies nor opportunities for learner involvement nor the whole instrument correlated significantly with the magnitude of change in reading scores over the course of the year. This has rather displeasing implications: teaching quality, as it was measured in this study, appeared to have no impact on learners’ progress. Because the range of changes in attitudes was much smaller than the range of changes in reading scores, no attempt was made to correlate general teaching strategies or opportunities for learner involvement with changes in attitudes.

115
Table 7.3: Correlations of general teaching strategies and opportunities for learner involvement with change in reading scores
2003/04 COHORT
Pre-post change in
reading scores
Part A (General Strategies) .156
Part B (Opportunities for Learner Involvement)
.028
Part A+B (All) .051
2004/05 COHORT
Part A (General Strategies) .147
Part B (Opportunities for Learner Involvement)
.299
Part A+B (All) .254
FULL SAMPLE*
Part A (General Strategies) .114
Part B (Opportunities for Learner Involvement)
.128
Part A+B (All) .124 * part correlations
7.4 Class groupings and changes in reading scores Table 7.4 presents Spearman’s correlations between grouping categories and pre and post reading scores as well as changes in those scores. Table 7.4: Correlations between class groupings and reading scores
2003/04 COHORT 2004/05 COHORT FULL SAMPLE×
Grouping category
pre-test scores
post-test scores
pre-post change
in scores
pre-test scores
post-test scores
pre-post change
in scores
pre-test scores
post-test scores
pre-post change
in scores
A .129 .188* .130 -.007 .060 .003 .070 .151** .072
B
.284*** .313*** -.161 .078 -.035 -.110 .136** .070 -.141**
C
-.056 -.111 -.158 -.119 -.186* .032 -.068 -.112 -.023
D -.398*** -.355*** .064 -.423*** -.352*** .081 -.321*** -.324*** .046
E .285*** .264** -.060 .157* .245** .182* .116* .112 -.008
F .112 .056 -.029 .188** .207** .113 .036 .012 .016
* p<0.05 ** p<0.01 *** p<0.001 Key: A - whole class with teacher/assistant; B – alone; C - 1:1 with teacher; D - 1:1 with assistant;
E - Learner pair (no teacher/assistant support); F - small group (with or without support)
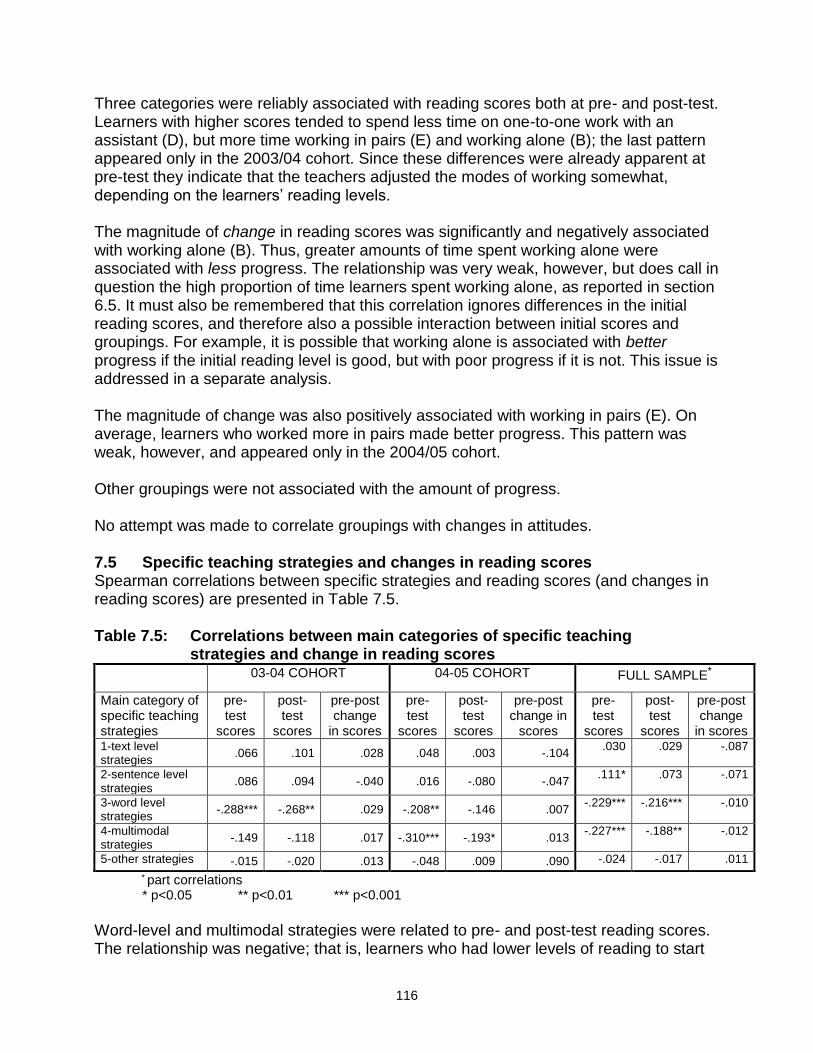
116
Three categories were reliably associated with reading scores both at pre- and post-test. Learners with higher scores tended to spend less time on one-to-one work with an assistant (D), but more time working in pairs (E) and working alone (B); the last pattern appeared only in the 2003/04 cohort. Since these differences were already apparent at pre-test they indicate that the teachers adjusted the modes of working somewhat, depending on the learners’ reading levels. The magnitude of change in reading scores was significantly and negatively associated with working alone (B). Thus, greater amounts of time spent working alone were associated with less progress. The relationship was very weak, however, but does call in question the high proportion of time learners spent working alone, as reported in section 6.5. It must also be remembered that this correlation ignores differences in the initial reading scores, and therefore also a possible interaction between initial scores and groupings. For example, it is possible that working alone is associated with better progress if the initial reading level is good, but with poor progress if it is not. This issue is addressed in a separate analysis. The magnitude of change was also positively associated with working in pairs (E). On average, learners who worked more in pairs made better progress. This pattern was weak, however, and appeared only in the 2004/05 cohort. Other groupings were not associated with the amount of progress. No attempt was made to correlate groupings with changes in attitudes. 7.5 Specific teaching strategies and changes in reading scores Spearman correlations between specific strategies and reading scores (and changes in reading scores) are presented in Table 7.5. Table 7.5: Correlations between main categories of specific teaching
strategies and change in reading scores 03-04 COHORT 04-05 COHORT FULL SAMPLE*
Main category of specific teaching strategies
pre-test
scores
post-test
scores
pre-post change
in scores
pre-test
scores
post-test
scores
pre-post change in
scores
pre-test
scores
post-test
scores
pre-post change
in scores 1-text level strategies
.066 .101 .028 .048 .003 -.104 .030 .029 -.087
2-sentence level strategies
.086 .094 -.040 .016 -.080 -.047 .111* .073 -.071
3-word level strategies
-.288*** -.268** .029 -.208** -.146 .007 -.229*** -.216*** -.010
4-multimodal strategies
-.149 -.118 .017 -.310*** -.193* .013 -.227*** -.188** -.012
5-other strategies -.015 -.020 .013 -.048 .009 .090 -.024 -.017 .011
* part correlations
* p<0.05 ** p<0.01 *** p<0.001
Word-level and multimodal strategies were related to pre- and post-test reading scores. The relationship was negative; that is, learners who had lower levels of reading to start
117
with (and to finish with) were given more word-level work, and used more multimodal strategies. The relationship between literacy skills and multimodal strategies was apparent in the 2004/05 cohort only. Additionally, there was a very weak trend towards greater use of sentence-level strategies with learners with better pre-test scores. There was no relationship between the main categories of specific strategies used and the magnitude of change in reading scores. 7.6 A case study of a class of adult learners with Down syndrome John Harman One of the classes recruited in the second year comprised seven learners, of whom five were adults with Down syndrome. Their teacher had been working with adult literacy groups for some time, and was currently following a course leading to a certificated qualification. She was regularly supported by an assistant, also experienced. Both staff and most of the learners had worked together in the previous academic year. The sessions followed a typical structure:
registration (interactive, with the teacher always involving each learner in some familiar, friendly conversation about the learner’s week)
recapitulation (active revision of an aspect of the previous week’s work)
administration
repetition (practice of an activity – usually word recognition – within a developing series of contexts)
refreshment (but with active, purposive conversation continuing with the learners)
recreation (playing a favourite game, e.g. Letter bingo, but ensuring increasing demands on the learners, session on session, even if the game was usually the same)
record and report (helping the learners maintain the record of activities in their file). The sessions displayed common characteristics, adopted by both staff:
casual, familiar conversational approach, but without ever losing group control
very little formal exposition, with what there was always supported by a medium other than speech and almost always involving the learners (thus a form of interactive modelling)
considerable support/encouragement of even the smallest effort/achievements
staff involving themselves as participants in the activities they were presenting, ostensibly at the same level as the learners
relatively swift move to individual participation in group work, or to individual work (mainly copying) with staff sitting with single learners or pairs to encourage and support (not a static activity – staff moved easily from learner to learner)
use of minimal but effective role play techniques to encourage involvement, often (as with Letter bingo) with the learners taking the lead role, or with staff pretence as ‘learners’
absolute acceptance that the pace had to be measured, and that progress would be slow.
118
Over the year, the learners’ growth in confidence was evident. It was most marked in one learner who, by the end of the year, was a markedly different person – open and communicative, not just wanting to please by her responses but wanting to get involved. It was also possible to see that some learners had made a little progress, even at the minimal level of literacy that these learners needed in order to cope with their lives. This seems consistent with the (extremely limited) research on the literacy levels of Downs adults. For example, Carr (2003) reported the findings of a population sample with Downs that had been studied repeatedly since infancy, and had been followed up again at age 35, though the focus of the study was on measurement of attainment, not on processes that might develop skills. The author’s summary reads as follows:
Results from all the tests used showed little change from those found at 21 and/or 30 years. Small, statistically insignificant, increases in mean scores were found in reading and on the British Picture Vocabulary Scale. Means of all other measures had declined, also by small and statistically insignificant amounts. Apart from one individual who showed dramatic declines in all areas, the rest of the cohort has continued to be stable.
Only one study was located which investigated whether an effective intervention to develop the speech and language (including reading) skills of Downs adults could be developed. Jenkins and MacDonald (2005) recruited 28 people with Down syndrome aged 19 to 49 (mean age 37), of whom 21 remained in the study after the two-year intervention. All had reading ages below 8:0. They were randomly assigned to two matched groups: a Language group, who received structured language teaching, and a Reading group, who received the language teaching plus supporting written materials. Thus the main focus was spoken language, with the written materials intended mainly to support that. However, after two years, the number of participants who were able to score on a standardised reading test had increased from five to eight (average number of words known had gone up by 4), all eight of these learners had also significantly improved their ability to recognise words used in the teaching programme but not in the test (average now 42 words), and seven others were now able to recognise a few of the teaching programme words (average 2.2, range 1-5). Even these very slow and limited gains were clearly significant for these learners; but they also show just how sustained the effort to make them needed to be. 7.7 Summary Overall, there are some factors (groupings and specific teaching strategies) that did appear to be linked with individual differences in reading. It is likely that these relationships represented teachers adjusting their methods of work to fit individual learners’ reading levels – or, indeed, the learners themselves actively choosing the way of working that suited them. However, there was little relationship between strategies (general or specific) or groupings and the magnitude of change in reading scores. Change was significantly related to just two variables: working alone and working in pairs. Learners who worked alone less made better progress, and learners who worked in pairs more made better progress. Both relationships were very weak, however. Though they may be an extreme case, the case study of adults with Down syndrome does suggest how narrowly focused expectations may have to be for some learners.

119
Chapter 8 Insights from the practitioner-researchers
Maxine Burton The five practitioner-researchers who worked for both years of the project, namely Colette Beazley, Judy Davey, Richard Finnigan, Yvonne Spare and Jan Wainwright, undertook additional analyses based on the first year’s data. Two of these analyses – Richard Finnigan’s error analysis and Yvonne Spare’s grouping patterns analysis – are reproduced elsewhere in the report (sections 5.2 and 6.5.1). This chapter next sets out the remaining three non-quantitative analyses, prefacing them with an explanation of the genesis of this undertaking and the choice of topics (sections 8.1 and 8.2). The concluding paragraph of 8.2 summarises the findings and sets them in the wider context of the project. These five practitioner-researchers were also each asked to contribute a short piece on the experience of working on the project and the ways in which their professional lives were enhanced. These form section 8.3. The concluding section, 8.4, summarises the contribution made by the practitioner-researchers. One of the practitioner-researchers who worked only on the second year of the project, John Harman, contributed the item on adults with Down syndrome included as section 7.6. 8.1 Origin and topics of the individual analyses The idea of asking the practitioner-researchers to contribute analyses arose initially from a ‘thinking aloud session’ during a project team meeting in Sheffield in February 2004. As experienced practitioners, their insights about what they had observed out in the field were particularly pertinent. It was suggested that incorporating these would provide a helpful and complementary addition to the other, quantitative, analyses that were being carried out. Some key topics were identified, and practitioner-researchers’ particular areas of interest and expertise were also incorporated. It was also on this occasion that Richard Finnigan expressed an interest in doing an error analysis of the responses in the reading assessments, an outline of which can be found in section 5.2. One topic which featured constantly in the discussion and aroused considerable interest was the classroom dynamic, as expressed by the grouping patterns. Yvonne Spare’s analysis of the first year’s grouping data led to significant findings, which suggested that a similar examination of the second year’s data should be carried out. This major piece of analysis also provided the basis for a linked analysis of classroom layouts. These can both be found in chapter 6. Grouping patterns were certainly influenced in many cases by the teachers’ responses to the Core Curriculum. This was one of the pieces of information elicited from the teachers in an additional questionnaire, administered after the four observation sessions had taken place. At the same time it also requested information on the teachers’ teaching qualifications and experience, and summarized their general satisfaction with the lessons they had taught and the progress they felt their learners had made. Jan

120
Wainwright’s brief Report on Teachers’ Perception of Learners’ Progress and the Impact of the Core Curriculum on the Nature of this Assessment is the first of the analyses in the next section (8.2.1), supported by a table of teacher histories, which sets out some of the key information from the teacher questionnaires from the first cohort. This, too, was the starting point for a more detailed examination of what the data from both years told us about teachers’ experience and concerns (with which Chapter 6 opens). From more general matters of teacher experience and class structure we move to the actual teaching strategies observed in the sessions. As already explained in chapter 2, this project is one of a suite of four, which includes a project on the teaching of writing. Obviously the relationship between reading and writing is a close one and Colette Beazley undertook an investigation of the role played by writing in our class observations, with specific reference to instances where our reading codes incorporate an element of writing (8.2.2 – Writing which supports reading). The final analysis deals with a teaching strategy that is promoted in the Core Curriculum. In 8.2.3, Observed use of IT, Judy Davey, an experienced teacher of IT, not only examines the way IT featured in classroom activities and the software used, but also describes the availability of IT equipment for each class. 8.2 The individual analyses 8.2.1 Teachers’ perceptions of learners’ progress, and the impact of the Core
Curriculum on the nature of this assessment Jan Wainwright Most of the 19 teachers had received Core Curriculum training, and the more experienced amongst them said it made them more focused, rather than radically changing their teaching methods. This change was also reflected in the assessment of their lessons because they tended to judge learners’ progress by how close they were to achieving the targets set at the beginning of the lesson. For outline data, see Table 8.1. Overall, the comments the teachers made about progress showed an awareness of the learners’ needs, and in most cases this led to planning for the next lesson. The majority of the teachers mentioned problems that learners had faced, but these were not discussed in a negative way. It was more a case of this being a challenge to be overcome in the next lesson. Another concern raised by an experienced teacher (17 years) was the danger that you could teach to the Curriculum even if it were irrelevant to the learner. This fear seemed to be borne out by two of the teachers (273, 083) who rated progress made by how much of the curriculum had been covered, rather than by how much had been learnt. 083 was driven by the quantity of material he mistakenly thought he had to ‘get through’ and consequently the learning experience of the learners was spoilt. It is interesting to note that this teacher had not received any Core Curriculum training, but had just been given the book to follow.

121
Table 8.1: Outline data on the teachers
Teacher’s Class ID
Years of experience Core curriculum training?
Effect of CC training Measure of satisfaction
Teaching qualifications Basic
skills Previous teaching
174 20 Primary y A few ideas, more group work
Generally pleased Cert Ed
172,171 2 Primary/ secondary/ FE
y Prepared to adapt for own purpose
Objective assessment positive/neg
Cert Ed BEd
173 new teacher
Work-based training
y Gave framework mixed 9282/3 9295
052,055 26 Primary, secondary
Y Move to group teaching
Reluctant to say progress made but
thorough, fair analysis
PGCE 9285
271 6 GCSE English lit
Y Mapped work. Great change. More
focussed; more IT, more group
Generally satisfied Further and adult certificate 730/7;
Basic skills 9281/2
053,054 3 Primary Secondary
Y Structure Clear analysis CertEd 9282/3
083 new ESOL N Dominated by CC Never felt he had done enough.
Changed from group to individual teaching
Cert Ed No basic skills qualification
082 13 infant y No change Negative comments but observer said positive atmosphere
Cert Ed No basic skills qualification
051 12 Maths GCSE/ A-Level
y Changed delivery and feels positive
Satisfied but aware of problems
PGCE 9282, 9285
056 8 ESOL y More focus Pleased with progress but aware of problems
PGCE 9281/2/5
291 24 primary y More confident Can identify progress on individual basis
BEd no basic skills qualification
111 5 Primary and secondary
yes More focus Clear analysis, generally satisfied
PGCE 9282
112 17 Primary and secondary
y Teaches to curriculum rather than what
learners want
As above Cert Ed 9285
113 5 primary y Gives ideas and confidence
Mentions concerns but not at all negative
CertEd 9282/3
121 9 none y No change Clear analysis 730 9282/5
191 4 SEN (sec’ndry)
y ‘Enormous’ change -framework, ‘bible’
Realistic. Appreciates small successes
PGCE 7307, CertEd FE
081 22 Infants y Little change although more group work
Self-critical. Aware of individual progress
and difficulties
PGCE
091 6 Secondary French
y More group teaching, more focussed
approach
General satisfaction; many learners
maintain skills rather than make progress
PGCE, TEFL
241 28 Primary and secondary
Y More group work Satisfied Cert Ed
A quarter of the teachers mentioned ‘buzz’ or ‘enjoyment’ when assessing their lessons. This element in a lesson can be overvalued because it can mask the fact that no learning is taking place. However, enjoyment can be motivational and therefore a key to successful learning. There is, of course, the possibility that the researchers’ questioning techniques encouraged positive or negative accounts of the lessons.

122
8.2.2 Writing which supports reading Colette Beazley While analysing the observations I tried where possible to isolate aspects of writing which support reading, but not to duplicate the writing project findings (Grief et al., 2007). There may, of course, be strategies common to both studies. Some links between reading and writing are suggested in the Core Curriculum, and examples of integrated activities are given. From the catalogue of specific strategies used to teach reading (the Observation Coding Manual) I noted the strategies (3-digit sub-categories) in which writing formed an integral part – see Table 8.2. In selecting these, I list those in which writing is seen to support reading in some way, rather than where it is actually the reading which supports the writing activity. For instance in the case of 3.2.2 (Use of dictionary to find meanings and also for other purposes including spelling), dictionary usage enabled learners to complete written work related to their reading and so would be excluded from this analysis. Discussion The actual breakdown of the frequency of strategies used can be found elsewhere in the report, so here I shall just note some general trends on written work based on information from the observation logs. There were more instances noted of text-level work than sentence- or word-level. Over 50% of observations reported written work at this level in the form of comprehension and cloze exercises based on text. In many cases instruction was given on scanning published materials in order to make notes about page content. The text was then read in detail, either as a group or individually, followed by a written exercise. Text at an appropriate level was also used for highlighting and/or underlining punctuation, key words and parts of speech. Teachers were also observed instructing learners to look at the purpose of text and to write their own essay, advertisement, letter, etc., in response to a textual stimulus. Learners were also observed writing summaries of texts. At sentence level groups were observed working on punctuation. This mainly took the form of filling in missing punctuation on prepared text or by completing worksheets. In 24 of the 92 observations, written exercises were used, either computer- or paper-based, to reinforce punctuation and capitalisation. Work on linking words and parts of speech was reinforced in 16 observations using gap-filling, cloze or writing own sentences. At word level, exercises following on from the reading of text were seen to include:
Synonyms Prefixes Suffixes Key words Plurals Pronouns Finding words beginning with particular letters or letter combinations.
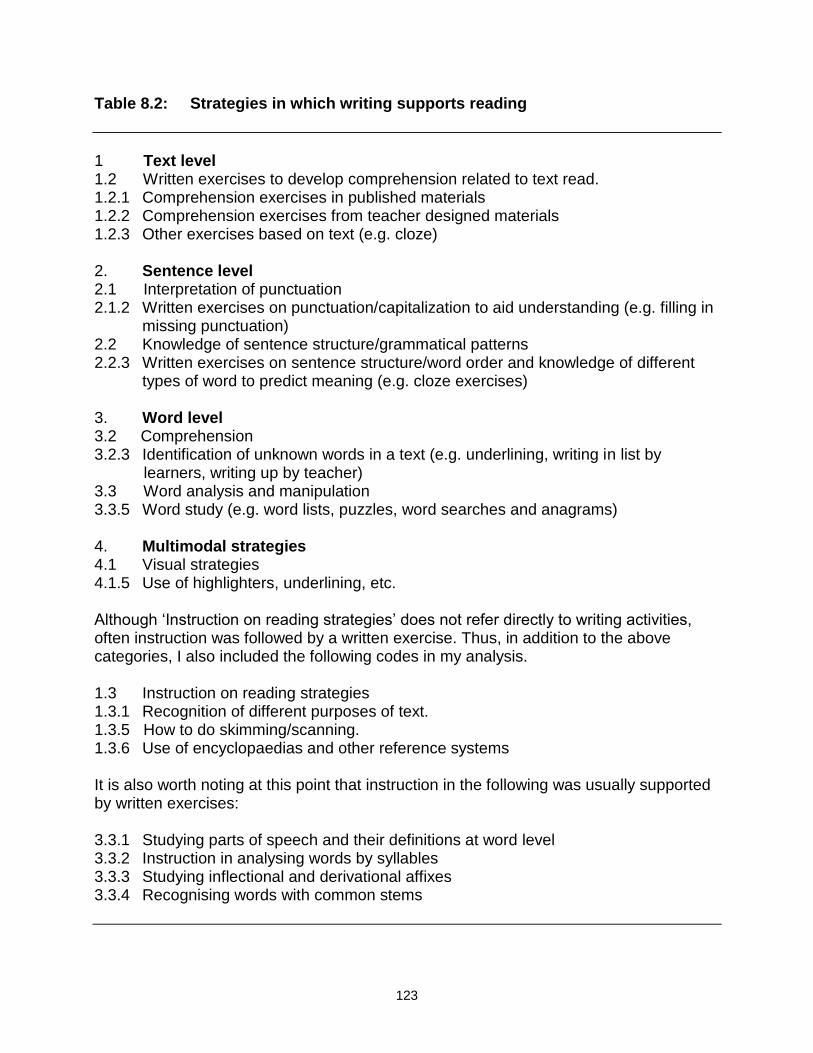
123
Table 8.2: Strategies in which writing supports reading
1 Text level 1.2 Written exercises to develop comprehension related to text read. 1.2.1 Comprehension exercises in published materials 1.2.2 Comprehension exercises from teacher designed materials 1.2.3 Other exercises based on text (e.g. cloze) 2. Sentence level 2.1 Interpretation of punctuation 2.1.2 Written exercises on punctuation/capitalization to aid understanding (e.g. filling in
missing punctuation) 2.2 Knowledge of sentence structure/grammatical patterns 2.2.3 Written exercises on sentence structure/word order and knowledge of different
types of word to predict meaning (e.g. cloze exercises) 3. Word level 3.2 Comprehension 3.2.3 Identification of unknown words in a text (e.g. underlining, writing in list by
learners, writing up by teacher) 3.3 Word analysis and manipulation 3.3.5 Word study (e.g. word lists, puzzles, word searches and anagrams) 4. Multimodal strategies 4.1 Visual strategies 4.1.5 Use of highlighters, underlining, etc. Although ‘Instruction on reading strategies’ does not refer directly to writing activities, often instruction was followed by a written exercise. Thus, in addition to the above categories, I also included the following codes in my analysis. 1.3 Instruction on reading strategies 1.3.1 Recognition of different purposes of text. 1.3.5 How to do skimming/scanning. 1.3.6 Use of encyclopaedias and other reference systems It is also worth noting at this point that instruction in the following was usually supported by written exercises: 3.3.1 Studying parts of speech and their definitions at word level 3.3.2 Instruction in analysing words by syllables 3.3.3 Studying inflectional and derivational affixes 3.3.4 Recognising words with common stems

124
Other word study such as word lists, puzzles and word searches (strategy 3.3.5) were observed in 33% of observations. Time spent on these activities ranged from five minutes to 110 minutes, and they were mainly done by learners working on their own, with support as required. In multi-level classes, however, differentiation merely seemed to mean that the same worksheets were worked through at a different pace with a higher or lower level of support. Learners were also encouraged to identify unknown words in a text by underlining and highlighting them, and writing them in lists, and this was observed in 23% of the observations. Teachers in many cases explained the origins of different words in the English language in order to clarify some spelling patterns rather than to facilitate reading. At this level it was noted that very few teachers had found a structured approach to phonics work (cf. section 6.8.3). Learners were exposed to a range of initial sounds, ‘blends’ (consonant clusters), digraphs, etc., but there was no systematic method of determining which sounds were known, which needed some reinforcement and which needed to be taught. The Core Curriculum lists phonemes under Entry level 1 Writing, and suggests using these to aid recognition of phoneme-grapheme correspondences at Entry 1 level Reading. In the observations I noted that written work on phonemes was generally related to spelling rather than to assist reading. Arranging words in alphabetical order was also observed in some classes, in order to aid the use of manuals, directories, etc. In the financial literacy class, filling in forms, cheques and paying-in slips, etc. enabled learners to become familiar with relevant vocabulary and recognise key social/personal words and phrases (3.1.1). The use of forms, on screen and paper, was a widespread practice generally, to support both reading and writing. Finally, the use of highlighting and underlining text as a visual strategy to support reading, was observed on 10 occasions, and was generally used by learners working one-to-one with a teacher or assistant
By way of conclusion it can be noted that in most observations some form of written work was used in order to support reading. 8.2.3 Observed use of ICT Judy Davey Introduction Use of ICT was assigned a general code in the catalogue of strategies (5.2.1) to encompass all instances observed, and it was therefore possible to capture generic usage. The primary aim of the observations was to observe the teaching of reading in detail. Observed use of ICT was secondary to the observation of reading activity and, because of the nature of the coding, data obtained from observations and analyses were less detailed.

125
Method A total of 91 sessions were analysed for usage of ICT firstly from specific strategies analyses, which identified general usage of ICT. ICT usage was found in 22 of these observations. Secondly, those 22 observation logs were scrutinised to find the following information:
Number of learners involved
Observed activity
Software used
Class time for ICT usage
Grouping
Specific reading strategies used with ICT
Points of interest. Information on availability of ICT equipment was requested from individual fieldworkers in the following format:
Number of computers in classroom
Whether the room used was dedicated to ICT
Availability of ICT equipment in the centre during session time. Literature review A detailed literature review was not carried out, but it was considered that the Core Curriculum (2001) was an important indicator of potential uses of ICT within the teaching of reading and was available to teachers. In the Core Curriculum (2001) it is also stated that there are ‘examples of the use of literacy and numeracy in different contexts’. Examples of potential and more detailed sample activities at text, sentence and word levels at all learner ability levels are included. ICT strategies for teaching reading are promoted throughout the curriculum for reading in examples, including using word processing software, on-line form completion, use of graphics, web hunts, email, predictive text and so on, providing a useful resource. Availability of resources ICT equipment was available in 18 of the 23 classrooms where observations took place. However the number of computers varied between 1 and dedicated ICT rooms (2). A high proportion (13) had a small number of computers (up to 3). See Table 8.3. In some cases where there were either no or small numbers of computers, equipment was available on the premises but was not observed being used by the literacy classes.

126
Table 8.3: Availability of ICT equipment Class ID
Computers available in classroom?
If so how many? Or is it a
dedicated ICT room (D)?
Is IT equipment available (not being
used at class time) in another part of the
building and which could be used?
Notes
051 Y 3 N
052 Y 2 Y
053 Y 2 Y
054 Y 2 Y
055 Y 2 Y
056 Y 3 Y Limited number
081 N N Computers used in first session when another teacher took class. Regular teacher had limited ICT knowledge and experience
082 N N
083 N N
091 Y 3 Y
111 Y D learndirect class
112 Y 8
113 Y 8
121 N Y
171 Y 1 Y
172 Y 1 Y
173 Y 6 N Experienced ICT teacher. Did not use ICT in class – log in and other system problems
174 Y 1 Y
191 Y 1 Y
241 Y 1 Y Teacher arranged for one learner to use computer during break
271 Y 2 Y learndirect in next room
291 Y D
292 N N
Number of learners involved A total of 22 observations out of 91 showed use of ICT, with 10 of the centres (45%) involved in the project using ICT in at least 1 observation. However, the distribution was uneven, with 3 centres demonstrating the use of ICT during all the observations and 5 using IT resources in only one observation. There were only 2 centres that used ICT with the whole class or small groups. There was much evidence of teachers using ICT with 1 or 2 learners during a class, with learners working individually and on the whole independently. Observed activity Although described as observed use of ICT, only use of computers was observed, with one exception: a demonstration of text messaging and discussion of the language of texting.

127
A limited range of activities was observed:
Finding information using a web search
On-line software
Dedicated software (CD)
Quizzes
Use of Office software. The range of software observed is shown in Table 8.4. Table 8.4: Range of software observed in use
Dedicated/on-line software Websites accessed Office applications
BBC Skillswise Greenfingers Checkpoint Reading disk* Letter taster* House game Penfriend Franklin Wordmaster GAMZ Starspell Driving your car
RHS BBC – TV programmes listings Hieroglyphics website Bigsmokedebate.com Learner choice – to produce a review of a programme
MS Word: -copying written work -letter writing -use of spellcheck -inputting text -thesaurus -changing fonts -coloured screens WordArt
* Software undefined Use of BBC Skillswise was observed in 9 classes and was the most widely used resource. MS Word was used primarily for inputting text, but evidence was found of discussion of preferred screen colour and font style. A post-session quotation from a teacher relating to a change of screen colour was that ‘the use of the coloured screen was helping (07) and he was starting to see patterns in words’ (174). As well as Franklin Wordmaster used during discussion of possible spelling (171), Word thesaurus was used by learners when producing typewritten work (291). On the whole learners were directed to software and given an explanation, and then worked independently, with teacher support. There was limited evidence of learner pair activity or group working but peer support was indicated in several observations, particularly when learners were working individually and experienced problems. When finding web information learners tended to be directed to web sites and then work independently. One interesting exception to this was with a class of full-time learners who were undertaking a course to improve basic skills through the use of ICT. During one observation learners had their own choice of topic to research through a web search to review a television programme. The search was preceded by whole group work on the subject. Learners also incorporated pictures from the Net to illustrate reviews. There

128
was a wide range of ability in the class, from pre-entry to level 2 and different aims were provided for individual abilities (291(1)). Another example of group work being used was a web search for hieroglyphics, following a discussion of the changing nature of language and the use of text messaging. It was interesting that, post-session, the teacher felt that the session had been ‘lively and interactive’ and that it had ‘awakened interest in how language is changing and that English is a living language’ (171). There was some indication of learner choice (291 choice of topic, 112 some learner-requested aims), although on the whole learning materials were chosen by the teacher. One learner was observed working on the GAMZ website, and a comment from the teacher revealed that ‘she enjoys that program’ (271). Four instances of ‘distraction’ were noted, 2 in which learners accessed alternative web sites, ebay, a fan website and a games site. In another observation learners accessed email whilst waiting for the teacher. However, the Core Curriculum states that the structure of the standards provides ‘examples of the social roles and activities in which adults need literacy and numeracy in order to function independently and exercise choice’, so accessing choice of site could be viewed as learner autonomy and indicate that learners are achieving the aim of the curriculum. Specific strategies used with ICT Specific strategies used for the teaching of reading together with ICT usage were correlated with groupings used in the observational analyses. The aim was to attempt to establish patterns when viewed with observation logs and teacher planning. The number of learners involved was also included as it was felt that this would impact on any attempted analysis of the range of specific strategies observed. Analysis proved difficult and only tentative patterns could be established. Only 2 issues were considered to be of interest:
Strategies indicated by the use of a single resource were limited by the activity undertaken (055(1),055(2),113(1),113(3),113(4),171,174,271,291(2)).
Classes which had a higher usage of ICT tended to use a wider range of resources. These classes also indicated a greater range of specific strategies in most cases (111,112,113) but this was dependent on the activity undertaken (291(1),113(1)). However this analysis was at class level, and different findings might have arisen if the analysis had been extended to learner level.
Points of interest There was very limited evidence of the level of teacher expertise in ICT although this was indicated within 2 observations, when one teacher admitted to not being proficient with ICT and another was defined as an experienced ICT teacher. It would be useful to question teachers regarding their ICT expertise and confidence in teaching during the next round of observations.

129
Different levels of ICT expertise within a class of learners did not appear to cause problems, although there were some instances of the teacher teaching basic word-processing skills. Conclusions There was limited use of ICT in the teaching of reading, which could be the result of various factors:
Resource limitations Approximately 22% of classes observed had no ICT equipment. When resources were available they were not always used. A further 50% of classrooms had either 1 or 2 computers. However in 82% of centres ICT equipment was available.
Teacher expertise and training Do teachers have the necessary expertise and ICT training? Core Curriculum training is a requirement at most centres, but does this include the effective use of ICT in teaching reading? It is possible that certain resources are more effective in the teaching of reading. It may be possible to review all software and web-based resources used and compare them with the strategies used with individual learners, to establish effectiveness. How the resource is used could be an important factor in learner progression. Examples were seen of resources being used as a teaching tool for single strategies, and on other occasions as part of a more structured approach and integral part of a themed activity. 8.2.4 Summary of the findings from analyses The main points are summarized below and followed by a brief additional commentary:
The teachers observed had a wide range of experience and qualifications and generally positive responses to the Core Curriculum.
Most observations contained references to the use of some form of written work to support reading; furthermore it seems that writing is the main way chosen of reinforcing reading.
There was use of ICT in just under a quarter of the observations, despite the general availability of computers (although often in insufficient numbers) in most of the classrooms and/or elsewhere on the premises. This raises questions about the level of teacher expertise and training in ICT, and the effectiveness of software and web-based resources in literacy teaching.
These three analyses present an alternative, qualitative view of the data, and the findings raise interesting issues for further consideration and analysis. As mentioned above, the initial work on teachers’ perceptions was expanded into a more detailed

130
analysis of their experience and concerns. However, the suggestion that correlations might be found between teachers’ satisfaction with their lessons and learners’ progress might not be a straightforward matter. The comment was made that interviewing style could have evoked positive or negative answers from the teachers. Furthermore reports of satisfaction, or otherwise, seem on many occasions to have been a product of the teachers’ own level of experience and confidence rather than an objective measure of the teaching and learning that took place. ICT is popularly and widely promoted as a key strategy in basic skills teaching. However, while recognising that action may be required to improve the level of teacher expertise, and increase the quantity of ICT equipment available, it is also worth bearing in mind the research findings; in the NRDC systematic reviews of randomised and other controlled trials in adult literacy and numeracy teaching (Torgerson et al., 2004), no convincing evidence of the effectiveness of the use of computers was found. However, the associated NRDC project on effective use of ICT in adult basic skills teaching (Betts et al., 2007) did find benefits for learners’ progress in reading. 8.3 Benefits to the practitioner-researchers’ professional development The following five accounts describe very different developmental journeys and outcomes. All, however, serve to illustrate what Jan Wainwright, at the end of her account, describes so aptly as the ‘symbiosis’ of research and practice that is embodied by practitioner-researchers. 8.3.1 Colette Beazley I have been part of the team working on the adults’ reading project since October 2003. The timing for this couldn’t have been better as it coincided with reducing my full-time teaching commitment in August and working on a part-time basis for the Skills for Life Quality Initiative. Although I hadn’t expected to embark on further work quite so quickly, the prospect of being involved in a project such as this was far too enticing. The first meeting took place at the University of Sheffield with members of the reading project team and others who would be conducting parallel projects in numeracy, writing, ESOL and ICT. In a way that was the start of my own developmental journey. I learned how the research would be undertaken and how it was based on the Condelli et al. (2003) Study which had been done in the United States, and saw how there were differences and similarities in the way that the other projects would be covered. I have been involved in literacy and numeracy teaching for 30 years, so I felt confident in the subject area. Training in observation techniques and analysing the components of a reading lesson formed a major part of training and updating days in Sheffield. I was intrigued to find out how these component parts would be recorded; I didn’t have too long to wait before we embarked on learning about an elaborate coding system. By the end of the training I had acquired vital insights into the teaching of reading and also the means of recording this information.

131
The next stage involved observing classes. I had been observed in 2002 by a researcher on the NRDC project on adult learners’ difficulties in reading (Besser et al., 2004), so I knew that I must ensure that tutors were as comfortable with me being in the room as I had been with my observer. It was also essential that I did not overlook any vital learning or teaching taking place. Fortunately each practitioner-researcher worked alongside an experienced researcher on the first observation. This double observation certainly gave me confidence in recording further sessions. Coding aspects of the observation relating to strategies used by the tutor and the learner was a very interesting part of the project. However, when putting the information on spreadsheets, I think I tried the patience of everybody concerned with my lack of ICT skills. Help was at hand, not only by receiving good advice by e-mail but also being offered further development at the University. I think I have learnt more computer skills by being on the reading project than in all the ICT courses that I have started over the years and never finished. Observing good practice over a two-year period, and also looking at observations carried out by other members of the project in order to look at writing to support reading, has served to make me more critical of my own planning and teaching, whether it relates to the arrangement of the room, the delivery, or the resources used. Reading other observations also helped to spark an interest in financial literacy, which was the focus of one of our observed classes, and I have been able to build on this in my own teaching. My developmental journey continued when I attended research conferences, and not only heard about current research being undertaken but was also involved in talking about our project to others. I was overwhelmed by the dedication, enthusiasm and willingness to share ideas and information given by participants of the RaPAL and NRDC conferences. Questions raised about the reading project served to show me how much insight I had gained during my role as a practitioner-researcher. During the latter years of teaching my main focus had been family learning. At the RaPAL conference 2005 I was particularly interested in attending a workshop devoted to a family learning initiative. The workshop inspired me to extend my work in this area and I was pleased when I was recommended, as a result of my research experience on the project and my teaching background, to carry out an evaluation of family learning. So what am I doing now? I am a Skills for Life Quality Initiative facilitator. I am working with my local authority on a financial literacy project. I am evaluating a residential family learning project. 8.3.2 Judy Davey When I started to work on the project I had over 20 years’ experience of teaching adults, mainly in a vocational area. I had some experience of research, having completed a Master’s degree, some research methodology knowledge gained during 2 years of a doctorate, and a small amount of research experience within the organisation where I had worked. I had never had the opportunity to work on such a large-scale research project. I thought that working on the reading project would increase my experience of research and develop greater practical skills to add to theoretical.

132
I considered that my knowledge of adult literacy was limited. My experience in this area had been predominantly in identifying and organising support for learners to bring their literacy and numeracy skills to a level which enabled them to be successful in vocational examinations. But as the project progressed I realised that I had been constantly embedding literacy within my vocational teaching and using many of the strategies identified as specific to the teaching of reading. What the project has done for my development in this area is to organise and put the knowledge gained into a structure which I could usefully employ. Data from classroom observations gave me experience in both quantitative and qualitative research analysis. My research knowledge has gained both from that and from discussions within the team around methodology. Attendance at conferences and seminars has enabled me to look laterally at possibilities for research into literacy within a vocational area. There was such a wide spectrum of information to be gained at various workshops which I might not have considered looking at independently. Another benefit of the conferences was that they gave me the opportunity to meet people with interests in similar areas of education, which I found particularly valuable. Within the project I was asked to identify areas where ICT had been used and to look at resources, teaching, specific software used and teaching strategies. This left me with many unanswered questions regarding the use of ICT and motivated me to research the topic further. As an addendum to the above, the day after being asked to write about how the project had impacted on my personal development, I was approached by a member of an organisation who had become aware of my teaching and project experience. The result of this is that there may be an opportunity for me to use the experience of the last 2 years to move into another and complementary area. So, in conclusion, yes, the work was valuable to my personal development. It has extended the boundaries of my self-perceived expertise and enabled me to be open to wider opportunities. 8.3.3 Richard Finnigan Practitioners in adult literacy often drift along with only a tenuous grasp of current or recent research, at best. This is not to imply any lack of professionalism; the demands of the role mean that, unless they are directly involved in the research arena, finding the time to keep abreast of developments can seem an insurmountable task. To become involved in a research project is to open the door to a wide-ranging and stimulating world full of refreshingly intelligent exploration and debate. It is difficult to decide which aspect was the most interesting or beneficial to me personally, although carrying out the classroom observations would have to be near the top: practice in observing and then producing an accurate account of a literacy class;

133
meeting new tutors and seeing first-hand how others teach; meeting learners and gaining their trust; and developing skills in maintaining as objective and non-interventionist a stance as possible. It was also a chance to discover that tasks such as writing up a few thousand words of observation log could actually be stimulating, and a counterpoint to getting out and about meeting tutors and learners. Carrying out the independent analysis into errors made on the reading tests vies for top place, however, with the challenge of identifying patterns among the incorrect or partly incorrect responses in the answer booklet – a fusion of comparing quantitative data with a good deal of intuitive analysing; trying to spot similarities between groups of answers. I found this a fascinating and absorbing exercise which built on similar work I had undertaken for my MSc. The project also provided a welcome opportunity to use, if only in some very small way, the training in statistics and research methods which almost cost me my sanity during my MSc. It was good to be able to understand some of the analyses which took place after the data collection phase ended. The conferences we were able to attend provided the opportunity to find out what interesting projects were running elsewhere, to be more able to fit ‘our’ project into the wider context, and to participate in presenting a workshop. Perhaps a more nebulous benefit of involvement in the project was to discover that certain qualities I possessed were ones which suit research work, such as meticulousness and an (over)analytical mind. I learned that in research work you cannot have too much attention to detail. It is this discovery which has kindled in me an interest, and an ambition, to continue working in the research field. And indeed I am currently (February/March 2006) working on another NRDC research project, the evaluation of the Skills for Life Quality Initiative. 8.3.4 Yvonne Spare I had been a teacher of adult literacy for 14 years, including some time as a manager, when the opportunity came along to join the research team for the reading project. It came at just the moment when I was looking for something different. I had recently completed an MA in Education and had included a research module because it looked interesting, but with no clear idea of how I was going to make use of it. Moreover we had begun to see all the promised changes actually starting to happen: new training and qualifications for tutors, new qualifications for learners, new courses and new resources. Teaching on the Level 4 Certificate for Adult Literacy tutors, I was seeing for myself what a diverse group of people we are as tutors – different backgrounds, experience, skills and maybe teaching methods as well. Here was the opportunity to take a closer look at some of those different methods, to see what works and maybe to learn something myself in the process. So, what did I learn? I had the privilege of sitting in with a wider group of tutors than I would have under any other circumstances; observing four or five of them at a time

134
allowed me a much broader perspective than the team-teaching or occasional observations I had previously carried out. I saw tutors using methods and resources I had not thought of myself, working for different organisations in different settings. I saw classes of different durations and different levels of intensity, and learners with different motivations. I saw examples of whole-class teaching, small-group teaching, one-to-one teaching and various levels of classroom support. With an objective eye I could see how these factors were working without the familiar pressure of managing it all myself. I had to observe classes and produce a timed log, which meant trying to see everything that was happening simultaneously in every corner of the room, and then learn how to analyse these activities according to over 50 individually coded specific teaching strategies. Later this material had to be re-analysed according to how much time individual learners spent experiencing each teaching strategy, an exercise that found me surrounded by pages covered in numerical codes – a new and alarming experience to someone who has generally tried to steer clear of numbers in favour of words! I met and talked to a wide variety of learners. These were not so different – many of their problems, their worries, their aspirations seemed familiar from my own classes over the years. Here, though, I had the opportunity to measure their progress objectively over a whole year, in some cases being able to make contact and talk to them after they had left their classes. I have been given the opportunity to dip into all these different classes and activities and gain a real overview of what is happening in my area. Although the findings had to be, and were of course, objective, it was impossible, as a working tutor, not to be continually thinking, ‘That’s a good idea’, or, ‘That seems to be working’ or, no less importantly, ‘The learners really seemed to enjoy that session’. There is so much I will take back with me to the classroom, some things that I will perhaps not do again, and many more that I can’t wait to try out. But as well as informing my teaching practice, I have discovered that I enjoy the research process too. I loved talking to the tutors and interviewing the learners, and enjoyed the team meetings where we discussed what we were seeing and tried to work out its significance. I chose to take part in the research because I was interested. In the end I found it fascinating. Participating in this study has given me the skills to take part in other research projects (a small-scale evaluation of a family literacy project for travellers’ families, the NRDC evaluation of the Skills for Life Quality Initiative, and an NRDC study of family literacy, language and numeracy) and the opportunity to use my teaching experience in a way I had not foreseen. 8.3.5 Jan Wainwright Prior to joining the project in 2003, I had no research experience. Being a practitioner-researcher enabled me to keep working as a basic skills tutor, but at the same time acquire some research skills. Because of my involvement with all stages of the project, from its methodology and design to its dissemination, I have gained a valuable insight into the world of research and feel encouraged to do more.
135
I am now aware not only of the importance of research being based upon a representative and meaningful data set, but also how difficult this is to achieve. I selected my sites and helped to compile the 54 coded strategies that were used. Support in the form of team meetings and dual observations enabled me to be informed and objective when conducting and writing up interviews and observation logs. I was not just a collector of data, but was able to analyse the material, code it and input it into the system. I suggested a question suitable for further study, and then wrote a qualitative analysis of it. Towards the end of the project the practitioner-researchers joined in discussions which helped the team propose hypotheses for further investigation. The experience of working with expert researchers means that I feel more able to formulate research questions. My ICT skills were weak in 2003, but with support I rapidly became more proficient, which enabled me to cope with the demands of the job. Once I joined the reading project I had easy access to research material. I studied previous research projects and saw how the methodology of one report can inform another. My interest was further fuelled by attendance (funded by the project) at international and national conferences, where I could listen to researchers explaining their findings and then join in the ensuing discussions. I was encouraged to participate in workshops and explain the methodology and aim of the reading project, and summarise its progress. I was also pleased to have the opportunity to take part in a PowerPoint presentation and outline our research methods to a Lifelong Learning Institute seminar. Being a member of the research team meant I was no longer confined to the bottom of the staircase, but met educationalists from every step. It was interesting to hear policy first-hand and see how it can be misinterpreted as it filters down – sometimes becoming an unnecessary burden to practitioners. The experience of working on the project has indirectly sustained my enthusiasm for teaching, which can be reduced in these times of targets and cut-backs. I have trialled ideas gained from my reading and used suggestions from workshops attended at conferences. My students have become involved with other research projects and this has had a beneficial effect on their morale as learners. So it can be seen that my professional development has been considerably enhanced by being a practitioner-researcher, and I hope the project has also gained because, although research should inform practice, practice can inform research. The practitioner-researchers embody this symbiosis. 8.4 Conclusion The many benefits of having fieldwork carried out by experienced practitioners included the opportunity to draw not only on their expertise to inform the design of research instruments and methods of data collection, but also on their ability to identify and contribute to significant aspects of the data analysis. This in turn has immensely benefited their professional development. The substance of this chapter has been contributed by the practitioner-researchers themselves; and it is their own words, above all, as they describe the professional benefits obtained, and analyse their individual topics – in this chapter and elsewhere – that best illustrate this reciprocity.

136
Chapter 9 Conclusions and implications Maxine Burton and Greg Brooks
9.1 Strengths This was the largest study in Britain to date of the strategies used to teach reading in adult literacy classes, and the first to attempt to correlate that evidence with measures of change in learners’ reading attainment and attitudes to literacy. The study gathered an unprecedented amount of data which provided a valuable research resource, especially the detailed observation logs (236 logs, at least 472 hours’ worth). The study also contributed powerfully to the scanty literature on adult literacy teaching. Learner retention was higher than in previous studies – of the 454 learners initially recruited, 298, or 66%, returned for both mid and post assessments and therefore provided full data. Eleven practitioner-researchers participated as fieldworkers and as analysts of data, thus providing all of them with professional development and the field with increased research and development capacity. Six practitioner-researchers also contributed to this report as authors. Insights gained for teacher training and (practitioner-)researcher training have been disseminated in a Practitioner Guide (Burton et al., 2008).
9.2 Findings The descriptive statistics on the providers and settings, the learners and the teachers, and the qualitative analyses of the teachers’ concerns and of classroom organisation and groupings, provided a snapshot of the background to adult literacy teaching in a mainly representative sample of classes in England in 2003-5. The average amount of attendance between the pre- and post-assessments was about 30 hours – on this basis, the research team estimated that the average attendance in a full year was probably about 45 hours, or three quarters of the average 60 hours available in standard provision. Change in learners’ reading attainment was mixed: the average score went down in 2003/04, but up in 2004/05. When the two cohorts’ data were combined there was a very small improvement, on average. An analysis of the errors made on the reading assessment revealed some guessing (this appeared to decrease between pre- and post-assessment), and a fairly strong tendency to latch onto key words in the passage related to words in the question but not providing the answer (conversely, this appeared to increase between pre- and post-assessment). Learners’ self-confidence increased between pre- and post-assessment, and, because this was the largest section of the questionnaire, the average score on the entire

137
instrument also increased significantly. However, there were no significant differences on the other sections (frequency of a few literacy activities, attitudes to literacy properly so called). Scores on the general teaching strategies and opportunities for learner involvement indicated a single measure of teaching quality; although a wide range of teaching quality was observed, most of the lessons observed were judged by the practitioner-researchers to be of high or fairly high quality – few were judged to be middling or poor. The most frequent patterns of classroom activity were (a) whole-class opening section followed by individual practice; (b) all individual work. Both entailed learners working alone for substantial amounts of time – and indeed learners reading silently was found to be the most frequent specific teaching strategy. Other very frequent strategies were giving appraisal/feedback immediately, discussion of vocabulary during a reading, other word study (e.g. word lists, puzzles, word searches), and using a dictionary to find word meanings. However, active reading tuition (i.e. excluding time which learners spent reading silently) occupied less than half the class time, on average. Factors that were not found to be significantly related to change in reading attainment were: learner’s age, English as L1 or L2, ethnicity, age of leaving full-time education, time since last course, having dyslexia, having a formal diagnosis of dyslexia, attending other provision, scores at pre-test, growth in self-confidence (even though this was significant in itself), frequency of the few literacy activities investigated, the teachers’ qualifications or length of experience, overall quality of the teaching as measured, classroom activity patterns (all individual vs all whole-class + individual vs mixed patterns). Factors that were found to be significantly related to change in reading (but the correlations were always weak and not always consistent across cohorts) were:
Gender (women made slightly better progress than men), employment status (employed people made better progress than the unemployed), possession of formal qualifications (people with an FE/NVQ qualification made better progress than those with no qualifications), having more positive attitudes to literacy to start with. However, since these are outside teachers’ control they provide no guidance for practice
Regular attendance – but this effect was very weak.
Learners who spent more time working in pairs made better progress.
Learners who spent less time working alone made better progress. 9.3 Limitations The standardised reading assessment instrument used could not capture other valid forms of progress, e.g. markers which learners noticed as significant for themselves.

138
The timescale involved was short. The average number of hours attended between pre- and post-assessments (about 30 hours) may well not have been sufficient to enable significant progress in all cases (for a similar finding from workplace literacy courses see Wolf and Evans, 2011). The range of teaching quality observed may have been too narrow to allow significant correlations with reading progress or attitudes to emerge. 9.4 Implications and recommendations For policy and practice Few strong implications for policy and teaching practice emerged, but the following tentative recommendations seem justified:
The intensity of provision should be increased so that learners can attend for more hours.
The amount of time learners spend working alone should be reduced.
At the policy level, the clearest way to achieve that would be to increase staffing levels and thus lower learner:staff ratios.
At the level of classroom practice, the most practicable ways to reduce the amount of time learners spend working alone would be to increase whole-class work and opportunities for learners to work in pairs, e.g. in a buddy system.
For research Before changes in policy and practice are adopted, more rigorous research into their putative benefits should be conducted. In particular, a comparison between intensive courses and the typical pattern of extended provision would ideally require the recruitment of a cohort of learners who could equally well attend in either pattern and who were prepared to be allocated randomly to one or the other. Post-tests would be given to both groups when the intensive learners had had the opportunity to attend, say, 60 hours, and again at the end of the year, when the extended learners would have had the opportunity to attend about that number of hours. A rigorous comparison of more and less time spent working alone would in theory be easier to implement. A reasonable number of teachers (say 40) would be recruited who were equally prepared to adopt large or small amounts of whole-class teaching and also prepared to be allocated randomly to do one or the other and to be observed regularly to check that they were adhering to the conditions of the research design. In this case, both groups of learners would be post-tested at the same time. A similar design could be used to investigate the benefit of more or less time spent working in pairs. Finally, the analysis of the current limitations of phonics teaching in adult literacy would suggest that a detailed development and research project needs to be carried out on this possibly promising aspect of pedagogy. For the follow-up project which managed this on a small scale, see Burton et al. (2010).

139
References Barton, D., and Pitt, K. (2003). Adult ESOL Pedagogy: a review of research, an annotated bibliography and recommendations for future research. London: NRDC. http://www.nrdc.org.uk/publications_details.asp?ID=7 Basic Skills Agency (1997). Staying the Course: the relationship between basic skills support, drop out, retention and achievement in Further Education Colleges. London: Basic Skills Agency. Basic Skills Agency (2000). Effective Basic Skills Provision for Adults. London: Basic Skills Agency. Basic Skills Agency (2001). The Adult Literacy Core Curriculum. London: Basic Skills Agency. Baynham, M., Roberts, C., Cooke, M., Simpson, J., Ananiadou, K., Callaghan, J., McGoldrick, J. and Wallace, C. (2007). Effective Teaching and Learning: ESOL. London: NRDC. http://www.nrdc.org.uk/publications_details.asp?ID=89#
Beder, H. (1999). The Outcomes and Impacts of Adult Literacy Education in the United States (NCSALL Report 6). Cambridge, MA: Harvard Graduate School of Education, National Center for the Study of Adult Learning and Literacy. Betts, S., Kambouri, M., Logna, K., Mellar, H., Moriarty, V. and Nance, B. (2007). Effective Teaching and Learning: Using ICT. London: NRDC. http://www.nrdc.org.uk/publications_details.asp?ID=87 Besser, S., Brooks, G., Burton, M., Parisella, M., Spare, Y., Stratford, S. and Wainwright, J. (2004). Adult Learners’ Difficulties with Reading: an exploratory study. London: NRDC. http://www.nrdc.org.uk/publications_details.asp?ID=14 BIS (2011). 2011 Skills for Life Survey: Headline Findings. (BIS Research Paper no.57) London: BIS.
Brooks, G. (2002). What Works for Children with Literacy Difficulties? The effectiveness of intervention schemes. London: DfES Research Report no. RR380. Brooks, G. (2003). Sound Sense: the phonics element of the National Literacy Strategy. A report to the Department for Education and Skills. Published on DfES website, 20/8/03 http://core.roehampton.ac.uk/digital/general/soundsense.pdf Brooks, G. (2011). ‘Chapter 9: Adult literacy (Age 18 and beyond).’ In Kamil, M.L., Pearson, P.D., Moje, E.B. and Afflerbach, P.P. (eds) Handbook of Reading Research, vol.IV. London and New York: Routledge, pp.177-96.
140
Brooks, G., Burton, M., Cole, P.A., Miles, J., Torgerson, C.J. and Torgerson, D. (2008). ‘Randomised controlled trial of incentives to improve attendance at adult literacy classes.’ Oxford Review of Education, 34, 5, 493-504. Brooks, G., Burton, M., Cole, P. and Szczerbiński, M. (2007a). Effective Teaching and Learning: Reading. London: NRDC. http://www.nrdc.org.uk/publications_details.asp?ID=90 Brooks, G., Burton, M., Cole, P. and Szczerbiński, M. (2007b). Effective Teaching and Learning: Reading. Summary report. London: NRDC. http://www.nrdc.org.uk/publications_details.asp?ID=90 Brooks, G., Davies, R., Duckett, L., Hutchison, D., Kendall, S. and Wilkin, A. (2001a). Progress in Adult Literacy: do learners learn? London: Basic Skills Agency. Brooks, G., Giles, K., Harman, J., Kendall, S., Rees, F. and Whittaker, S. (2001b). Assembling the Fragments: a review of research on adult basic skills. London: Department for Education and Employment Research Report no.220. http://www.education.gov.uk/publications/eOrderingDownload/RR220.pdf Brooks, G. and Hannon, P. (2013). ‘Research issues in family literacy.’ In Larson, J. and Marsh, J. (eds.) The SAGE Handbook of Early Childhood Literacy, 2nd edition. London: SAGE, pp.194-206. Brooks, G., Heath, K. and Pollard, A. (2005). Assessing Adult Literacy and Numeracy: a review of research instruments (research report). London: NRDC. http://www.nrdc.org.uk/publications_details.asp?ID=23 Burton, M. (2011). Phonetics for phonics. Leicester: NIACE. Burton, M., Davey, J., Lewis, M., Ritchie, L. and Brooks, G. (2008). Improving Reading: phonics and fluency. Practitioner guide. London: NRDC. http://www.nrdc.org.uk/publications_details.asp?ID=156# Burton, M., Davey, J., Lewis, M., Ritchie, L. and Brooks, G. (2010). Progress for Adult Literacy Learners. London: NRDC. http://www.nrdc.org.uk/publications_details.asp?ID=175#
Bynner, J. and Parsons, S. (2006). New Light on Literacy and Numeracy. London: NRDC. http://www.nrdc.org.uk/publications_details.asp?ID=78 Carney, E. (1994). A Survey of English Spelling. London: Routledge. Carr, J. (2003). ‘Patterns of ageing in 30–35-year-olds with Down's syndrome.’ Journal of Applied Research in Intellectual Disabilities, 16, 1, 29-40.

141
Cheek, E.H. and Lindsey, J.D. (1994). ‘The effects of two methods of reading instruction on urban adults’ word identification and comprehension abilities.’ Journal of Vocational and Technical Education, 11, 14-19. Clymer, T. (1963). ‘The utility of phonic generalizations in the primary grades’. The Reading Teacher, 16, 252-8. Reprinted in The Reading Teacher, 50, 3 (November 1996), 182-7. Coben, D. with Colwell, D., Macrae, S., Boaler, J., Brown, M. and Rhodes, V. (2003). Adult Numeracy: review of research and related literature. London: NRDC. http://www.nrdc.org.uk/publications_details.asp?ID=35 Condelli, L., Wrigley. H., Yoon. K., Seburn, M. and Cronen, S. (2003). What Works Study for Adult ESL Literacy Students. Washington, DC: US Department of Education. Crystal, D. (1995) The Cambridge Encyclopedia of the English Language. Cambridge: Cambridge University Press. Dietrich, J.A. (1994). The effect of auditory perception training on the reading ability of adult poor readers. USA: Rhode Island. Goswami, U. and Bryant, P. (1990) Phonological Skills and Learning to Read. Hove: Lawrence Erlbaum Associates Ltd. Great Britain. Department for Education and Employment (1999). A Fresh Start: improving adult literacy and numeracy. (The Moser Report) London: DfEE. Great Britain. Department for Education and Employment (2001). Skills for Life: the national strategy for improving adult literacy and numeracy skills. London: DfEE. Grief, S., Meyer, B. and Burgess, A. (2007). Effective Teaching and Learning: Writing. London: NRDC. http://www.nrdc.org.uk/publications_details.asp?ID=88 Jenkins, C. and MacDonald, J. (2005). ‘Developing the language skills of adults with Down syndrome.’ In Rondal, J.A. and Rasore-Quartino, A. (eds) The Adult with Down Syndrome: a new challenge for society. London and Philadelphia: Whurr, 160-6. Kyambi, S. (2005). Beyond Black and White: mapping new immigrant communities. London: IPPR.
Kelly, S., Soundranayagam, L. and Grief, S. (2004). Teaching and Learning Writing: a review of research and practice. London: NRDC. http://www.nrdc.org.uk/publications_details.asp?ID=24
Kruidenier, J. (2002). Research-based Principles for Adult Basic Education Reading Instruction. Portsmouth, NH: National Institute for Literacy.

142
Lawrence, D. (1985). ‘Improving self-esteem and reading.’ Educational Research, 27, 3, 195-200. Lawrence, D. (1988). Enhancing Self-esteem in the Classroom. London: Paul Chapman. Mellar, H. and Kambouri, M. (2002). Basic Skills and ICT: a report to Ufi. London: Institute of Education, University of London. Mellar, H., Kambouri, M., Sanderson, M. and Pavlou, V. (2004). ICT and Adult Literacy, Numeracy and ESOL. London: Institute of Education, University of London. NRDC (2003). Three Years On: what the research is saying. London: NRDC. OECD (2013). OECD Skills Outlook 2013. First results from the Survey of Adult Skills. Paris: OECD Publishing. http://dx.doi.org/10.1787/9789264204256-en Palincsar, A.S. (1982). Improving the reading comprehension of junior high school students through the reciprocal teaching of comprehension-monitoring strategies. Unpublished doctoral dissertation, University of Illinois at Urbana-Champaign. Palincsar, A.S. (1986). ‘The role of dialogue in providing scaffolded instruction.’ Educational Psychology, 21, 73-98. Palincsar, A.S. and Brown, A.L. (1984). ‘Reciprocal Teaching of comprehension-fostering and comprehension-monitoring activities.’ Cognition and Instruction, 1, 2, 117-72. Rachal, J.R. (1995). ‘Adult reading achievement comparing computer-assisted and traditional approaches: a comprehensive review of the experimental literature.’ Reading Research and Instruction, 34, 239-58. Rampton, B. (1990). ‘Displacing the “native speaker”: expertise, affiliation and inheritance.’ ELT Journal, 44, 2, 97-101. Rich, R. and Shepherd, M.J. (1993). ‘Teaching text comprehension strategies to adult poor readers.’ Reading and Writing, 5, 387-402. Roberts, C., Baynham, M., Shrubshall P., Barton, D., Chopra, P., Cooke, M., Hodge, R., Pitt, K., Schellekens, P., Wallace, C. and Whitfield, S. (2004). English for Speakers of Other Languages (ESOL) – case studies of provision, learners’ needs and resources. London: NRDC. http://www.nrdc.org.uk/publications_details.asp?ID=19 Roberts, R.E. and Cheek, E.H. (1994). ‘Group intervention and reading performance in a medium-security prison facility.’ Journal of Offender Rehabilitation, 20, 97-116. Rose, J. (2006). Independent review of the teaching of early reading (The Rose Review). London: Department for Education and Skills.
143
http://socialsciences.exeter.ac.uk/media/universityofexeter/collegeofsocialsciencesandinternationalstudies/education/pgce/pre-coursedocuments/Secondary_PGCE_Subject-Specific_Information_-_English_-_Rose_Report.pdf Sticht, T.G. and Armstrong, W.B. (1994). Adult Literacy in the United States: a compendium of qualitative data and interpretive comments. San Diego, California: Applied Behavioral and Cognitive Sciences Inc and San Diego Community College District. Sticht, T.G., Armstrong, W.B., Hickey, D.T. and Caylor, J.S. (1987). Cast-off Youth: policy and training methods from the military experience. New York: Praeger. Torgerson, C.J., Brooks, G. and Hall, J. (2006). A Systematic Review of the Research Literature on the Use of Phonics in the Teaching of Reading and Spelling. London: Department for Education and Skills Research Report 711. https://czone.eastsussex.gov.uk/sites/gtp/library/core/english/Documents/phonics/A%20Systematic%20Review%20of%20the%20Research%20Literature%20on%20the%20Use%20of%20Phonics%20in%20the%20Teaching%20of%20Reading%20and%20Spelling.pdf Torgerson, C.J., Porthouse, J. and Brooks, G. (2003). ‘A systematic review and meta-analysis of randomised controlled trials evaluating interventions in adult literacy and numeracy.’ Journal of Research in Reading, 26, 3, 234-55. Torgerson, C., Brooks, G., Porthouse, J., Burton, M., Wright, K. and Watt, I. (2004). Adult Literacy and Numeracy Interventions and Outcomes: a review of controlled trials. London: NRDC. http://www.nrdc.org.uk/publications_details.asp?ID=37#
Torgerson, C., Porthouse, J. and Brooks, G. (2005). ‘A systematic review and meta-analysis of controlled trials evaluating interventions in adult literacy and numeracy.’ Journal of Research in Reading, 28, 2, 87-107. White, A. (2002). Social Focus in Brief: Ethnicity 2002. Norwich: National Statistics. Williams, J. with Clemens, S., Oleinikoka, K. and Tarvin, K. (2003). The Skills for Life Survey: a national needs and impact survey of literacy, numeracy and ICT skills. London: HMSO. Wolf, A. and Evans, K. (2011) Improving Literacy at Work. London and New York: Routledge.

144
Appendix A: Full account of method A.1 General structure This was a correlational study. Adult learners’ attainment in and attitudes to reading were assessed, and the strategies their teachers used were observed. The aim was to correlate learners’ progress in reading and changes in their attitudes with their teachers’ strategies, and thus get some purchase on what enables learners to make progress and/or develop more positive attitudes. A.2 Recruitment Area Because the study was directed in Sheffield, and in order to avoid clashes with other NRDC projects, in 2003 recruitment of researchers, classes and learners was confined to an area of the East Midlands and North of England bounded by Trafford, Leeds, Louth in Lincolnshire, and Swadlincote in Derbyshire. In 2004 recruitment was extended to Liverpool and Chorley in the North of England, and to Norfolk and Littlehampton in the South. Though not fully representative of the regions of England, these areas are very diverse in socio-economic and demographic terms. The research team were confident that the range of settings and teaching strategies to be observed would be fully representative. Practitioner-researchers One of the joint holders of the Research Fellow post in the study (MB, who had been a practitioner in the field for many years up to 2002, and a fieldworker on the preceding Besser et al., 2004 study) carried out fieldwork in six classes; the rest of the fieldwork was done by 11 practitioner-researchers who were all highly experienced in further education, most in teaching adult literacy. Two had also been fieldworkers on the Besser et al. study; the others were recruited by personal contact and word-of-mouth recommendations. The practitioner-researchers covered between two and five classes each, according to personal circumstances and their other commitments. They were all trained at sessions at the University of Sheffield in October 2003 and September 2004; the first session was also attended by representatives of most of the other Effective Practice studies teams. Classes The fieldworkers all recruited the classes in which they assessed learners and observed sessions, again largely through personal contacts, though a few teachers and classes were contacted through adult basic skills coordinators or (in one case) by a serendipitous visit to a further education setting where a teacher took to the idea of participating at once. A total of 47 teachers and 59 classes were recruited (several teachers provided access to more than one class each, and some in both years). A description of the settings and providers used is given in chapter 3. Almost all the teachers answered questions on lesson planning and learners’ progress at each observation, and at the mid-assessment some further questions were asked of them about their qualifications, experience, and teaching approach and philosophy. At the end of each year they also provided information on learners’ progression to further study, employment, etc.

145
Learners A total of 454 learners in the 59 classes (an average of 7.7 per class) were recruited. The characteristics of the sample are described in chapter 4. Confidentiality and ID system Providers, teachers and learners were all promised that they would not be identifiable in reports arising from the project, and learners also that their individual data would remain confidential. To provide anonymity, only a central list was kept of providers and settings, and each was allocated a two-digit identifier (ID). A third digit served to distinguish classes where more than one class was recruited from the same provider. Then each learner in a class was allocated two further digits which were added to the first three to set up a unique five-digit ID for each learner. Though individual learners’ names and other contact details were obtained, these were held on paper only, and all computerised records contained only the ID numbers; similarly, all statistical operations were carried out on the anonymised datasets. A.3 Data-gathering timetable The initial (‘pre’) assessments of the learners, including gathering information on their background characteristics, took place in the Autumn terms of 2003 and 2004 (though in the first year a few trickled over into January 2004). The second and third (‘mid’ and ‘post’) assessments were carried out in the Spring and Summer terms of 2004 and 2005. The reason for having three assessments was to strengthen the statistical analyses by allowing not just pre/post comparisons but also trend analyses. The observations were conducted between the pre and mid assessments, that is, between November 2003 and March 2004 and between October 2004 and February 2005 – the exact dates were determined according to local circumstances. Four observations were conducted in each of the 59 classes, making 236 observations in all. Since the average duration of the classes was two hours, the total amount of observation time was about 572 hours. In addition, a series of double observations were carried out in order to ensure consistency between the fieldworkers. A.4 Instruments Consent form Every learner who was a potential participant was given an explanation of the study by the fieldworker at the pre assessment session; all those who agreed then provided their contact details on, and signed, a form giving informed consent to their participation, and each participating learner was also given a blank copy of the form to keep. Learner profile Immediately after giving consent and signing the consent form, learners were asked to provide details about themselves. Any who needed help in completing the Learner profile were given it by the fieldworker. The profile covered gender, age, English as first or additional language, any other language, ethnicity, occupational status, age of leaving full-time education, educational qualifications, whether it was the learner’s first, second or other year on the course, the length of time since the learner last took a course,
146
whether the learner had dyslexia and, if so, whether that was based on a formal assessment or not. The profile is reproduced in Appendix B.1. Attitudes questionnaire Following the profile, learners were asked to complete an attitudes questionnaire; those who returned for the mid and post assessments completed the questionnaire again on both occasions. It contained three sections, dealing with:
the learner’s self-confidence in various language-, literacy- and learning-related situations (10 items)
the frequency with which the learner engaged in a few literacy activities (4 items)
the learner’s attitudes properly so called to some literacy activities (7 items). The mid and post questionnaires were identical to the pre version except for two additional questions covering the number of hours of provision the learner had attended between the pre and mid/mid and post assessments, respectively, and whether the learner was attending any other provision; if so, details were requested. The mid version of the questionnaire is reproduced in Appendix B.2. Reading attainment instrument Immediately after NRDC was set up in February 2002, a review of assessment instruments for adult literacy and numeracy was carried out. Though the review (Brooks et al., 2005) was not published until early 2005, its findings were known by October 2002; one of the main ones was that there was no literacy instrument suitable for use in NRDC’s research projects. Accordingly, a new set of instruments for assessing learners’ attainment in reading and writing was commissioned from the National Foundation for Educational Research (NFER) in early 2003, and the finalised set of instruments was delivered to NRDC in early 2004. It contains both reading and writing assessments, and two parallel forms, 1 and 2, for each. The parallel forms enable progress over periods less than three months to be reliably measured (three months being the period within which practice effects are known from the literature to extinguish). The reading items are a mixture of multiple-choice and open-ended (‘supply’) types; the writing tasks are by their nature all open-ended. Forms 2 and 1 respectively of the reading measures within the instrument were used at the mid and post assessment occasions in both years, and Form 1 at the pre assessment in 2004/05. However, in the first year, a pilot version of Form 1 was used at the pre assessment in late 2003, and NFER provided scores for that occasion based on the items in that pilot version which were carried forward into the finalised version. NFER provided the administration instructions, and the fieldworkers used these on all three occasions. NFER also provided marking keys; the initial scores they provided were based on a pilot version of the key for Form 1. In 2003/04 the fieldworkers used the definitive versions to score the mid and post assessments, but following an analysis of the validity of the marking key and the consistency with which it had been applied both by NFER and by the fieldworkers (see below), some corrections were made to the scores, and a decision was made to employ a single outside marker for 2004/05.

147
The pilot version of the reading assessment instrument used in the first pre assessment contained over 40 items and was the same for all participating learners; the definitive versions used at mid and post assessments in both years and at pre assessment in 2004/05 had two levels, (a) with 30 items, and (b) with 39 items. Several items were common to both. The (b)-level versions were intended for learners already at or above Level 1 of the National Standards for adult literacy (QCA, 2000); the (a) versions for learners below Level 1. Differentiated versions were not available at the first pre assessment because NFER was still in the process of developing the instruments, so all learners attempted the same version. At the mid and post assessments in 2004 the fieldworkers asked learners to take the easier (a) version or the less easy (b) version based on the knowledge they had gleaned of individual learners during their observations and in consultation with the teachers. In 2004/05 the corresponding process was applied at the pre assessment. For the first pre assessment NFER provided not only raw scores (the number of questions each learner answered correctly), but also both scaled (standardised) scores and broad equivalents in terms of the levels of the National Standards. The scaled scores are on a 0-100 scale, with a mean of 50 and a standard deviation of 10. Included in the information NFER supplied were tables for converting raw scores to scaled scores and National Standards levels, and these were used by the central project team (not the fieldworkers) to convert the mid and post assessment raw scores. Two of the fieldworkers (Richard Finnigan and Judy Davey) later checked the consistency of the marking across the three occasions in the first year, and the validity of the marking schemes; they made a number of detailed suggestions for adjustment of both the scores and marking schemes, and these were implemented. The revised marking schemes were used by the sole marker in 2004/05. Thus the administration, scoring and measurement of learners’ reading attainment were consistent across the six occasions. The literacy assessment instruments developed for NRDC by NFER were kept secure for use only within NRDC’s research programme; to release them would have risked their influencing the field and thus to some extent distorting what they were supposed to measure. For this reason, these instruments are not reproduced in this report. Though they have been used successfully in several NRDC projects – for collations of both reading and writing results see Brooks and Hannon (2013), like all tests they have gradually gone out of date, and in 2013 the Department for Business, Innovation and Skills commissioned new ones to replace them. A.5 Observation system The document which sets out the observation system is reproduced in Appendix B.3. It is a linear descendant of one developed at NFER over many years, versions of which have been used in several projects there and at the University of Sheffield directed by Greg Brooks (see, for example, Brooks et al., 1996, 1999, 2002, 2004). As stated in the preamble to the version used in this study,
“The purpose of the observations is to provide information on teaching which we can relate to the evidence of progress gained from the reading assessments and
148
attitude questionnaires. The information on teaching strategies will arise from the logs kept during the observations and from background information on the sessions; and a key variable will be amounts of time devoted to different teaching activities. “Therefore what we need from each observation is:
Background information on the session and on the learners
A timed log
An analysis of the session against our classification of teaching strategies and activities.”
Background information This covered:
the physical circumstances, who was present (including any volunteers or assistants), the layout of the room; the fieldworkers were asked to draw a sketch each time, and these were later analysed – see section 6.3
information gathered from the teacher beforehand about the aims of the session, etc.
information gathered from the teacher afterwards about how the session went.
The cover sheet for the observations on which much of this information was entered is reproduced in Appendix B.4. Timed log This sought to capture as many as possible of the teacher’s teaching strategies and of the learners’ activities as they occurred. It covered, among other things:
whole class, small group and individual formats, and changes between these
the content and style of the teaching
whether individual learners or small groups received help from the teacher or others present
the materials used (copies of which were acquired whenever possible)
the time spent on each activity, logged to the minute as far as possible. Where fieldworkers wished to record judgments on what was happening they were asked to distinguish these clearly from the actual log. Keeping the log was recognised to be particularly demanding when the teacher was not teaching the whole class together, and the fieldworkers were urged to make ‘sub-columns’ in the log to keep track of separate activities occurring simultaneously. This part of the observation system was intended to provide as objective a record as possible of what was happening. In particular, fieldworkers were not required to look for specific activities determined in advance, or to apply any form of classification or coding during the observations. They were even asked to record activities that were not going

149
to form part of the study’s analysis, including the teaching of writing or spoken English, and writing activities undertaken by the learners. This was to avoid the fieldworkers overlooking reading strategies and activities, and to ensure that they focused on keeping a very full log. Coding was to be applied afterwards. Fieldworkers were required to type up their handwritten logs, and carry out the coding and analysis of them, soon after the event, within 48 hours if possible. A.6 Analyses of the observations For each class observed, both general and specific teaching strategies were analysed. For general strategies the instrument used in the Condelli et al. (2003) study of adult ESOL learners in the USA was followed verbatim, except that a few details of wording were changed to make them more applicable to the context in England and that item 7, which was felt to be specific to ESOL, was not used; the version used is reproduced in Appendix B.5. The two sections of the instrument cover various aspects of the teacher’s activity and several indicators of opportunities for learner involvement. The fieldworkers circled one number on the scale for each of the general strategies. The full logs were particularly useful for this purpose. The system for analysing the specific strategies was more complex. First the fieldworkers had to break their observation logs down into recognisable blocks of time, e.g. the opening whole-class section (if there was one), or phases when learners worked individually or in small groups. In most cases this involved identifying moments when the general pattern of activity changed, e.g. from whole-class to individual work or vice versa, or from one worksheet to another, or from working alone to working with another learner or an assistant or the teacher. If individual learners worked on their reading on their own before the main class or during the tea break, these activities too would be analysed as recognisable blocks of time. Whenever the class was not in whole-class grouping each learner’s time was accounted for separately. When non-reading activities occurred these were not counted, thus leaving gaps in individual learners’ time records – this occurred quite frequently since writing was a feature of many classes and we were not covering this. However, in the way described, all the time that each learner spent on reading-related activity was covered, with each learner being identified on the form by his/her ID both in whole-class and other groupings. Next, within each block of time the fieldworkers ticked boxes to indicate groupings: whole class, small group, learner pair, alone, one-to-one with the teacher, one-to-one with an assistant. Thirdly, within each block of time the fieldworkers allocated specific strategy codes to each of the activities that counted as reading and/or the teaching of reading, using the manual reproduced in Appendix B.6. This contained 55 coded strategies for teaching reading, derived from several sources:
- the preceding project on adult learners’ difficulties in reading (Besser et al., 2004)
- the Research Fellows’ and the first year’s practitioner-researchers’ professional experience
150
- the literature on the theory and practice of teaching reading.
The codes were grouped in four main categories: text-level, sentence-level, word-level, and multimodal, with a fifth category for a few items which could not plausibly be grouped elsewhere and/or which the research team wanted to be able to pick out easily (e.g. use of ICT). The system recognised that a single activity may warrant more than one code, e.g. ‘teacher/assistant giving praise and encouragement’ plus ‘learner reading own writing’. Within each block of time the fieldworkers worked out, as far as possible, how many minutes each learner spent on each coded activity and entered this, too, in their analysis. In addition to main blocks of time, the analytic system allowed for the recognition and coding of brief ‘episodes’ when the general activity during a block of time was interrupted, e.g. when the teacher, at a time when the learners were working individually, called the attention of all of them to a specific point for a particular purpose; or when the teacher or an assistant ‘checked in’ for a minute or so with a learner who had been working alone in order to ensure that the learner’s activity was proceeding according to plan and/or to offer praise and encouragement. These ‘episodes’ were each allocated one minute of teaching time for the purposes of analysis, and were not subtracted from the numbers of minutes spent on the activities in the main time block within which they occurred. The fieldworkers sent all the learner profiles, attitudes questionnaires, reading assessments, and general and specific strategies analyses in to the project office in Sheffield for further statistical analysis. A.7 Statistical analyses The main statistical analyses were carried out by Dr Marcin Szczerbiński of the Human Communication Sciences department of the University of Sheffield, a highly experienced literacy researcher and statistician (now at the University of Cork). Other analyses were carried out by Dr Sam Roberts, who had recently completed a doctorate on concealment behaviour in baboons and macaques at the University of Sussex and was working temporarily in the School of Education, and has since gained a post at the University of Chester. Descriptive statistics (frequencies and, where appropriate, means) were compiled for each form of data, including for the attainment and attitudes data for each occasion separately (see chapter 5). The returners were compared with the drop-outs (section 4.6). Correlations between attainment and attitudes were calculated for each occasion (section 5.7), and trends across the three occasions were investigated (chapter 5). Correlations were further calculated between general and specific strategies on the one hand, and changes in learners’ attainment and attitudes (chapter 7). In addition, the fieldworkers carried out a number of qualitative analyses (sections 5.2 and 6.4 and chapter 8).
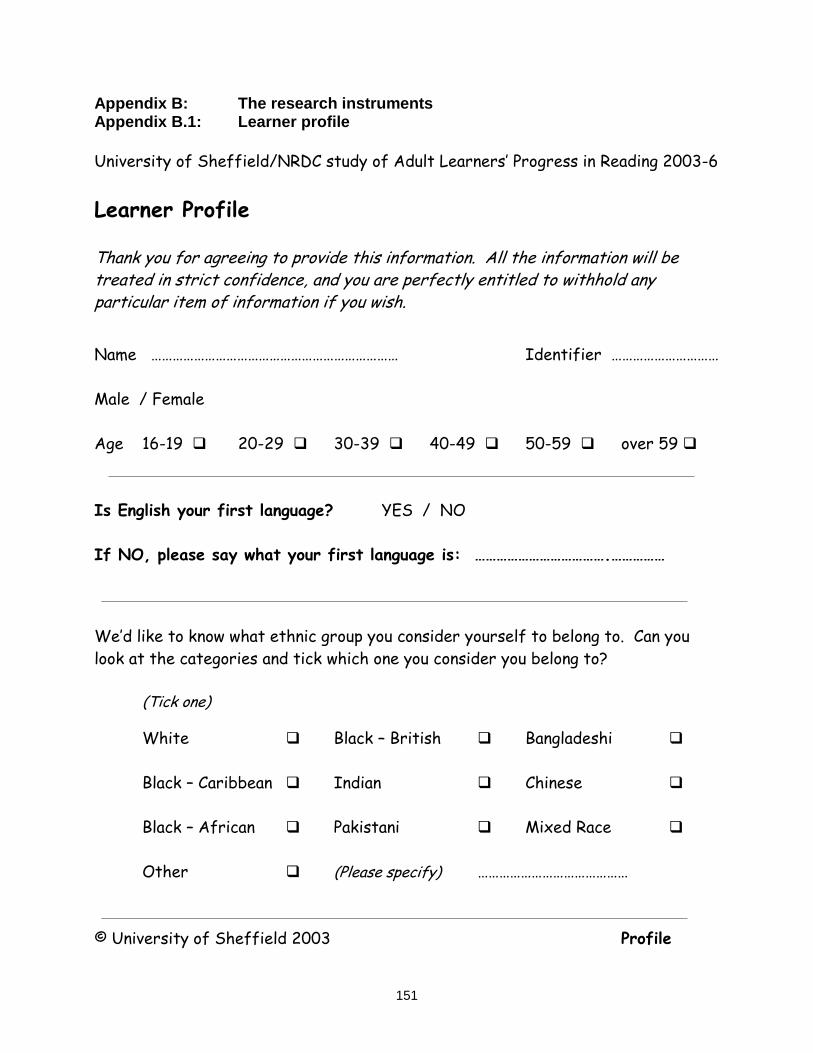
151
Appendix B: The research instruments Appendix B.1: Learner profile
University of Sheffield/NRDC study of Adult Learners’ Progress in Reading 2003-6
Learner Profile
Thank you for agreeing to provide this information. All the information will be treated in strict confidence, and you are perfectly entitled to withhold any particular item of information if you wish.
Name …………………………………………………………… Identifier …………………………
Male / Female
Age 16-19 20-29 30-39 40-49 50-59 over 59
Is English your first language? YES / NO
If NO, please say what your first language is: ……………………………….……………
We’d like to know what ethnic group you consider yourself to belong to. Can you
look at the categories and tick which one you consider you belong to?
(Tick one)
White Black – British Bangladeshi
Black – Caribbean Indian Chinese
Black – African Pakistani Mixed Race
Other (Please specify) ……………………………………
© University of Sheffield 2003 Profile

152
Occupational status (please tick one):
Employed/self-employed (either full- or part-time)
In full-time education Looking after home/family
Sick/disabled (temporarily or permanently) Unemployed
Retired
Education: What age were you when you left full-time education?
Educational qualifications (please tick all that apply):
None Any FE qualification/NVQ
CSE/GCSE/O-Level A-Level or above
Is this your first year on this course? YES / NO
If NO, did you attend a course like this last year? YES / NO
How long is it since you last took a course of any sort? (please tick one):
Over 10 years 2-5 years
6-10 years Less than 2 years
Are you dyslexic? YES / NO
If YES, is this based on a formal assessment? YES / NO
THANK YOU VERY MUCH FOR COMPLETING THIS PROFILE

Appendix B.2: Learner Questionnaire UNIVERSITY OF SHEFFIELD/NRDC STUDY OF ADULT LEARNERS’ PROGRESS IN READING, 2003-06
Learner Questionnaire (Mid), p.1 Identifier ………………..
Learner’s Surname (IN CAPS) …………………..……. Learner’s Given Name(s) (IN CAPS) ……………………………….. Number of sessions attended between pre-assessment and mid-assessment ………. Number of hours of tuition/provision attended between pre-assessment and mid-assessment ………. What other provision have you been attending? ………………………………………………………………… Please circle one number in each row
Not at all confident/Not very confident/Quite confident/Very confident
‘When I think about speaking in front of a group of people, I feel …’ 1 2 3 4
‘When I need to use a telephone, I feel ………………………………’ 1 2 3 4
‘When I think about myself as a learner, I feel ……………………….’ 1 2 3 4
‘When I have to do some reading, I feel ……………………………...’ 1 2 3 4
‘When I have to do some writing, I feel ……………………………….’ 1 2 3 4
‘When I have to fill in a form, I feel …………………………………….’ 1 2 3 4
‘If I have to read something out loud, I feel …………………………...’ 1 2 3 4
‘If I have to read a set of instructions, I feel …………………………...’1 2 3 4
‘If I have to take a test, I feel ……………………………………………’1 2 3 4
‘When I think about going on another course, I feel ………………….’1 2 3 4
© University of Sheffield 2004 ESF4, Mid Qre

1
UNIVERSITY OF SHEFFIELD/NRDC STUDY OF ADULT LEARNERS’ PROGRESS IN READING, 2003-06
Learner Questionnaire (Mid), p.2 Identifier ………………..
Please circle one number in each row Never / Occasionally / Once or twice a week / Every day I read a newspaper 1 2 3 4
I read a book / magazine 1 2 3 4
Never / Occasionally / Once a month / More often
I borrow a book from a library 1 2 3 4
I write a letter or postcard 1 2 3 4
Please circle one number in each row Strongly agree / Agree / Disagree / Strongly disagree
I enjoy reading 1 2 3 4
I seldom see a book I want to read 1 2 3 4
I like reading non-fiction 1 2 3 4
I prefer watching television to reading 1 2 3 4
I only read what I have to 1 2 3 4
I like reading fiction (stories) 1 2 3 4
I like using the internet / world wide web 1 2 3 4
I’m happy with the teaching I’m getting on this course 1 2 3 4
I think I’m learning a lot on this course 1 2 3 4
I intend to go on another course after this one 1 2 3 4
THANK YOU VERY MUCH FOR COMPLETING THIS QUESTIONNAIRE

2
Appendix B.3: Observation system UNIVERSITY OF SHEFFIELD/NRDC STUDY OF ADULT LEARNERS’ PROGRESS IN READING, 2003-06
Observation system
The purpose of the observations is to provide information on teaching which we can relate to the evidence of progress gained from the tests and attitude questionnaires. The information on teaching strategies will arise from the logs kept during the observations and from background information on the sessions; and a key variable will be amounts of time devoted to different teaching activities. Therefore what we need from each observation is:
Background information on the session and on the learners
A timed log
An analysis of the session against our classification of teaching strategies and activities.
Background information This consists of:
A description of the physical circumstances – who was present, layout of the room, etc. – see first part of Cover Page of observation log sheets
Information gathered from the tutor beforehand about the aim, etc. of the session – see second part of Cover Page of observation log sheets
Information gathered from the tutor afterwards about how the session went – see third part of Cover Page of observation log sheets.
Timed log
See instructions on p.4. Analysis of session
See instructions in separate manual.
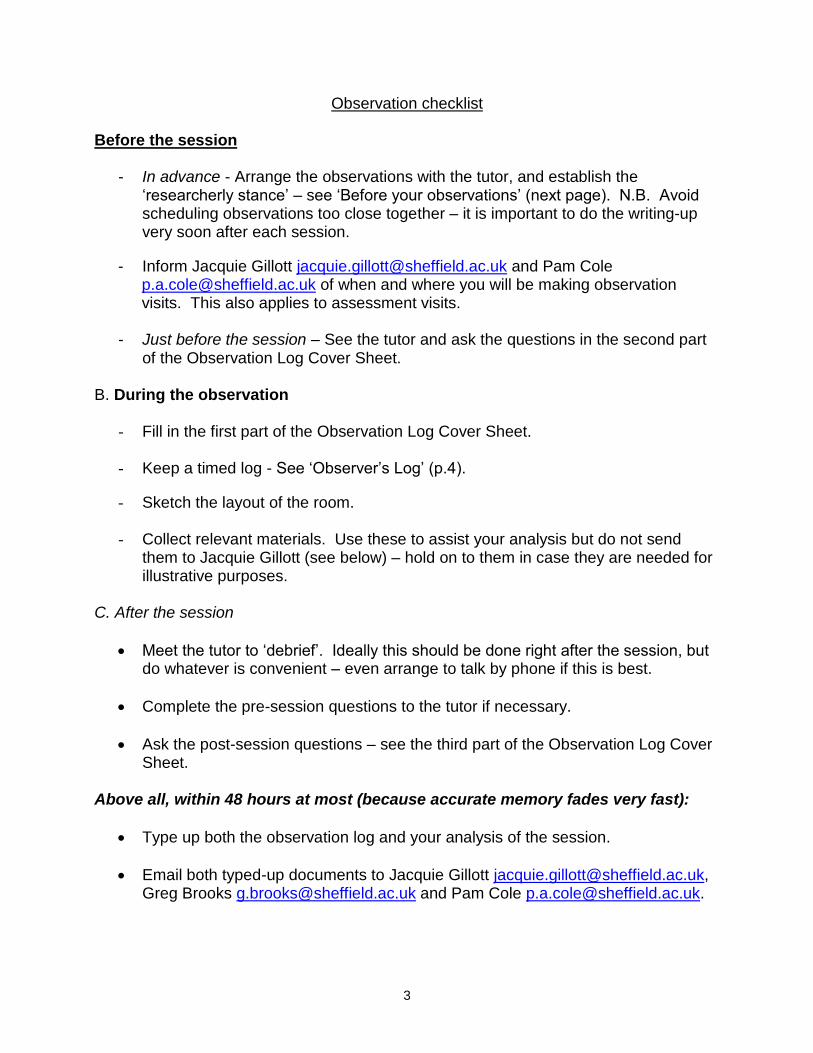
3
Observation checklist
Before the session
- In advance - Arrange the observations with the tutor, and establish the ‘researcherly stance’ – see ‘Before your observations’ (next page). N.B. Avoid scheduling observations too close together – it is important to do the writing-up very soon after each session.
- Inform Jacquie Gillott [email protected] and Pam Cole [email protected] of when and where you will be making observation visits. This also applies to assessment visits.
- Just before the session – See the tutor and ask the questions in the second part
of the Observation Log Cover Sheet. B. During the observation
- Fill in the first part of the Observation Log Cover Sheet. - Keep a timed log - See ‘Observer’s Log’ (p.4).
- Sketch the layout of the room. - Collect relevant materials. Use these to assist your analysis but do not send
them to Jacquie Gillott (see below) – hold on to them in case they are needed for illustrative purposes.
C. After the session
Meet the tutor to ‘debrief’. Ideally this should be done right after the session, but do whatever is convenient – even arrange to talk by phone if this is best.
Complete the pre-session questions to the tutor if necessary.
Ask the post-session questions – see the third part of the Observation Log Cover Sheet.
Above all, within 48 hours at most (because accurate memory fades very fast):
Type up both the observation log and your analysis of the session.
Email both typed-up documents to Jacquie Gillott [email protected], Greg Brooks [email protected] and Pam Cole [email protected].

4
Notes on observing Before your observations In this project, because the observations take place after the first round of assessment, by the time you begin the observations both tutors and learners should be well used to your presence. Nevertheless, it is important to establish the appropriate understanding with each tutor about the purpose of the observations, and to reiterate this even if you have already explained it earlier in the project. For example, you may already have explained that the purpose of the project is to ‘find out what is going on in adult literacy classes and relate it to the progress learners make’. Now you need to emphasise that your role during observations is that of a researcher, an interested but neutral observer. You are there to learn about what is going on – not to evaluate, judge, or provide advice and feedback on the lesson. You will be taking notes about the nature of the activities. Assure the tutor that your notes are for you and the rest of the research team only and that you will protect the identity of the tutor and learners by making them anonymous when you write up your notes and especially in the project reports. If learners ask you ‘How did I do?’, give a neutral answer like ‘You did fine – thanks for doing that for us – it will provide very interesting information for our project.’ Similarly, if tutors ask you for feedback, also say something neutral like ‘That was a very interesting session– it will provide very interesting information for our project.’

5
The observation Observer’s log During each observation, keep a log, using the sheets provided. The log is essentially a running record of what is happening (see examples provided during Training Day). We are not interested in micro-details, so you will not need to get what people say down verbatim, but we are interested in a detailed description of the teaching and learning. Some verbatim details will be useful both to make a precise point about the form of teaching and learning which is occurring, and for possible use as illustrations in reports. Pay particular attention to the following:
The structure of the session, e.g. tutor addressing a whole group, individual tutorials, a combination of the above (we are not assuming that the whole session will be in one format). There is a special column for this.
Content of the lessons? What actually is being taught?
What is the nature of the teaching? For example, does the tutor lecture? Engage the learners in discussion? Model things on a board? Read aloud? Use props?
What materials are being used?
If individuals are working individually or in small groups what are they working on? What materials are they using?
Does the tutor walk around and help individuals? What kind of help does she give? What do any assistants who are present do?
How much time is spent on each part of the session? e.g. 5 minutes lecture, 15 minutes individual work. You’ll need to keep a running record of the time as it passes during the session, especially when activities change, in the first column.
When you are observing, you may have judgements, thoughts, or opinions that arise from the current situation. Include these in your log, but distinguish them from the running record by putting them in the right-hand column. See the examples. Very few sessions will be in whole-group format throughout. Where separate activities are going on it will be necessary to make ‘sub-columns’ in the main column of the observation sheets – and to keep close check on the times when different activities begin, change and end. Layout of room If possible, make a sketch of the room and its layout. Note the display and equipment, and anything of interest in the ‘atmosphere’.

6
Appendix B.4: Observation log cover sheet UNIVERSITY OF SHEFFIELD/NRDC STUDY OF ADULT LEARNERS’ PROGRESS IN READING, 2003-06 Observation Log Cover Sheet 1. Background information Observer: Date:
Times: Start of session End of session: Duration:
Location:
Course Description: e.g., weekly class in English, Basic Skills Support, Drop-In
Tutor: Class ID:
Number of learners present: including …….. ESOL (if any)
Was anyone else present, e.g., volunteers? If so note who they were and their role in the session. 2. Pre-session questions to tutor
- You may not be able to talk to her for very long - if so, just ask the first question; the rest can be picked up afterwards.
Ask the tutor:
What are you planning to do today?
What is the general purpose of the lesson?
What are the specific aims?
How does this relate to what the learners have done previously?
What accreditation (if any) are these learners working towards? 3. Post-session questions to tutor
How did you feel the session went today?
Did you get through what you wanted to cover?
[If appropriate] You seemed to change the session from what you had intended – why was that?
To what extent did you feel that the learners made progress in what they were attempting to learn?

7
Appendix B.5: General teaching strategies instrument
University of Sheffield / NRDC Study of Adult Learners’ progress in Reading 2003-06
Observation Analysis: General Strategies
Class:….…………….............ID:…………………Observer:………………………………. Site:…………………………………………………Date:…………………………………… Key: 0 - Not observed 1 - Observed to a very limited extent 2 - Observed to some extent 3 - Observed to a high degree (characteristic of teacher)
A General instructional strategies Emphasis
Tutor …
1. Shares the overall goal for the lesson as well as individual activities; brings lesson back to the overall point or theme
0 1 2 3
2. Is flexible and responds to learners’ concerns as they arise
Goes with the teachable moment
0 1 2 3
3. Engages in direct teaching When point is unclear, pattern or point needs to be
highlighted, a generalization is in order
0 1 2 3
4. Provides a range of activities that keep learners involved and engaged
0 1 2 3
5. Provides opportunities for practice
0 1 2 3
6. Asks for open-ended responses
0 1 2 3
7. Supports authentic communication
0 1 2 3
8. Links what is learned to life outside the classroom
0 1 2 3
9. Brings ‘outside’ into the classroom Field trips Guest speakers Realia
0 1 2 3

8
10. Provides opportunities to work together, do projects, jointly solve problems,
read and write collaboratively
0 1 2 3
11. Provides feedback in class to learners on their work and understanding of what is taught
0 1 2 3
12. Provides praise and encouragement
0 1 2 3
B Opportunities for learner involvement
Opportunities provided in class for learners to:
1. Contribute ideas based on their experience
0 1 2 3
2. Learn with and from each other
0 1 2 3
3. Make choices regarding content and ways they want to learn
0 1 2 3
4. Think about a task and discuss it and how to approach it
0 1 2 3
5. Spend sufficient time on a task to ‘get it’
0 1 2 3
6. Express themselves (even if it means making mistakes) without being immediately corrected
0 1 2 3
7. Be engaged in different types of literacy Textbook exercises, functional tasks, songs, rhymes
0 1 2 3
8. Make the connection between school-type task and the challenges they face outside the classroom
0 1 2 3

9
Appendix B.6: Specific strategies coding manual UNIVERSITY OF SHEFFIELD/NRDC STUDY OF ADULT LEARNERS’ PROGRESS IN READING, 2003-06
Observation coding manual: Catalogue of strategies used to teach reading
1. Text-level
1.1 Comprehension (aural)
1.1.1 Tutor reads text aloud while learners listen (i.e. they have not been given/do not
refer to their own texts)
1.1.2 Tutor reads text aloud while learners follow own texts (for comprehension
purposes, not generally if e.g. tutor, prior to correcting exercise sentences which
learner has written, reads them out aloud)
1.1.3 Learners read aloud from text (again primarily for comprehension, to be
contrasted with 4.2.3). Also characteristic of a beginning reader strategy, if it
takes place ‘alone’ rather than in a grouping with tutor/assistant support.
1.1.4 Learners read text silently
1.1.5 Tutor or volunteer asks specific questions - during and after the reading
1.1.6 Discussion of text (more general, less structured than 1.1.5)
1.2 Written (and other) exercises to develop comprehension related to text read
1.2.1 Comprehension exercises using published materials
1.2.2 Comprehension exercises from tutor-designed materials
1.2.3 Other exercises based on text (e.g. cloze, re-arranging sets of instructions, writing
a summary)
1.3 Instruction on reading strategies
1.3.1 Recognition of different purposes of texts
1.3.2 How to do skimming and/or scanning
1.3.3 How to locate information by using organizational/structural features (e.g. index,
subheadings)
1.3.4 How to obtain specific information through detailed reading, including picking out
main points, picking out descriptive phrases or particular parts of speech etc.
1.3.5 Use of illustrations, images etc. to assist comprehension, (e.g. photos in
newspaper)

10
1.3.6 Use of encyclopaedias and other reference systems, e.g Yellow Pages (but not in
order to look up individual word meanings/spellings as in 3.2.2)
2. Sentence-level
2.1 Interpretation of punctuation
2.1.1 Use of punctuation/capitalization to aid understanding (e.g. recognition that a
word with initial capital can be the name of person/place but if preceded by full
stop will be the start of a new sentence)
2.1.2 Written exercises on the above (e.g. filling in missing punctuation)
2.2 Knowledge of sentence structure/grammatical patterns
2.2.1 Use of sentence structure/word order (syntax) to predict meaning and decipher
words, e.g. structure of questions vs statements; subjects and objects etc.
2.2.2 Knowledge of different types of word (e.g. linking words, parts of speech) to
predict meaning. The emphasis here is on the function of the word in the
sentence, e.g. ways of joining sentences/clauses by using conjunctions
2.2.3 Written (and other) exercises on 2.2.1 and 2.2.2 above (e.g. cloze exercises).
Any exercise at sentence level, e.g. rearranging cut-up words to make sentences,
re-writing compound sentences as complex sentences, filling in missing
prepositions, comparing complete with incomplete sentences, identifying the
subject in a sentence and changing its position, changing verb tenses etc.
3. Word-level
3.1 Word recognition/decoding
3.1.1 Sight recognition of key social/personal words and phrases. Here the definition of
‘word’ can be expanded – as long as it is still less than sentence-length, e.g. ‘date
of birth’. This would also include ‘Dolch’ words.
3.1.2 Recognition of letters of the alphabet, upper/lower case and alphabet sequencing
(without specific reference to their sounds, e.g. spelling out letter names)
3.1.3 Use of phonics/phonemic awareness
This can cover a wide range of activities, e.g. learners are taught to sound out
words; taught letter/sound correspondences; instruction in blending, initial,
medial, final sounds, segmenting; long/short vowels, hard/soft c/g etc.
3.1.4 Use of context clues to predict meaning of words
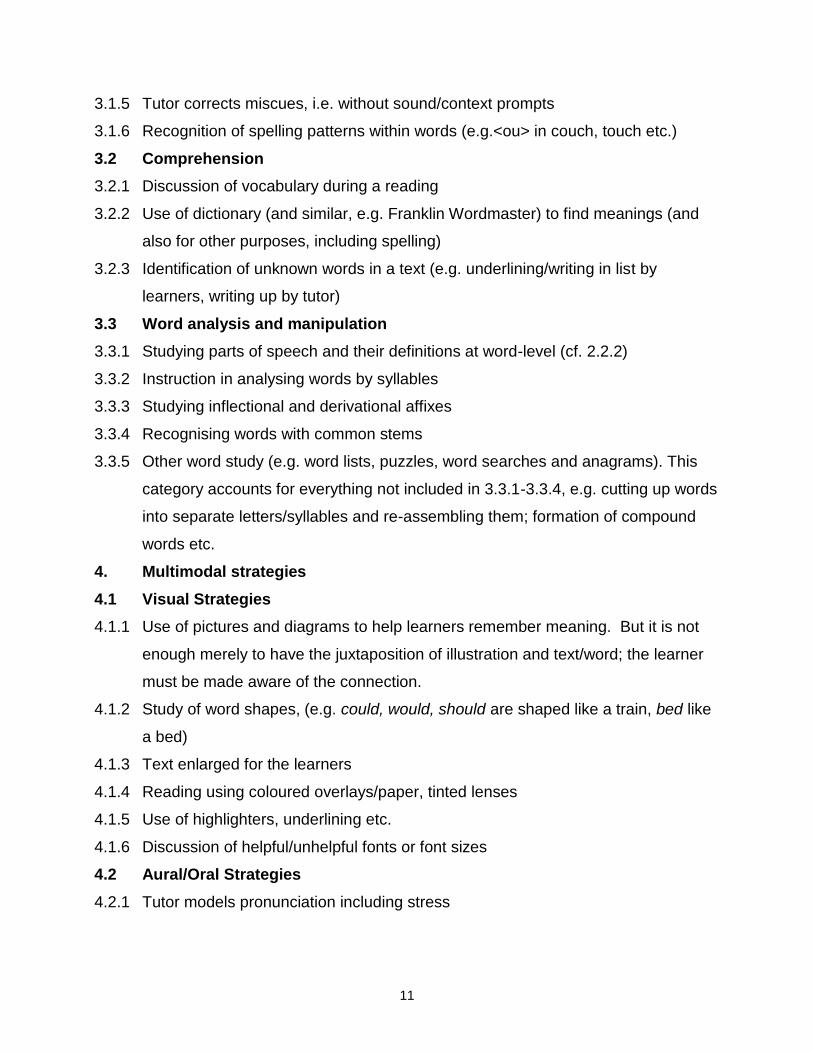
11
3.1.5 Tutor corrects miscues, i.e. without sound/context prompts
3.1.6 Recognition of spelling patterns within words (e.g.<ou> in couch, touch etc.)
3.2 Comprehension
3.2.1 Discussion of vocabulary during a reading
3.2.2 Use of dictionary (and similar, e.g. Franklin Wordmaster) to find meanings (and
also for other purposes, including spelling)
3.2.3 Identification of unknown words in a text (e.g. underlining/writing in list by
learners, writing up by tutor)
3.3 Word analysis and manipulation
3.3.1 Studying parts of speech and their definitions at word-level (cf. 2.2.2)
3.3.2 Instruction in analysing words by syllables
3.3.3 Studying inflectional and derivational affixes
3.3.4 Recognising words with common stems
3.3.5 Other word study (e.g. word lists, puzzles, word searches and anagrams). This
category accounts for everything not included in 3.3.1-3.3.4, e.g. cutting up words
into separate letters/syllables and re-assembling them; formation of compound
words etc.
4. Multimodal strategies
4.1 Visual Strategies
4.1.1 Use of pictures and diagrams to help learners remember meaning. But it is not
enough merely to have the juxtaposition of illustration and text/word; the learner
must be made aware of the connection.
4.1.2 Study of word shapes, (e.g. could, would, should are shaped like a train, bed like
a bed)
4.1.3 Text enlarged for the learners
4.1.4 Reading using coloured overlays/paper, tinted lenses
4.1.5 Use of highlighters, underlining etc.
4.1.6 Discussion of helpful/unhelpful fonts or font sizes
4.2 Aural/Oral Strategies
4.2.1 Tutor models pronunciation including stress
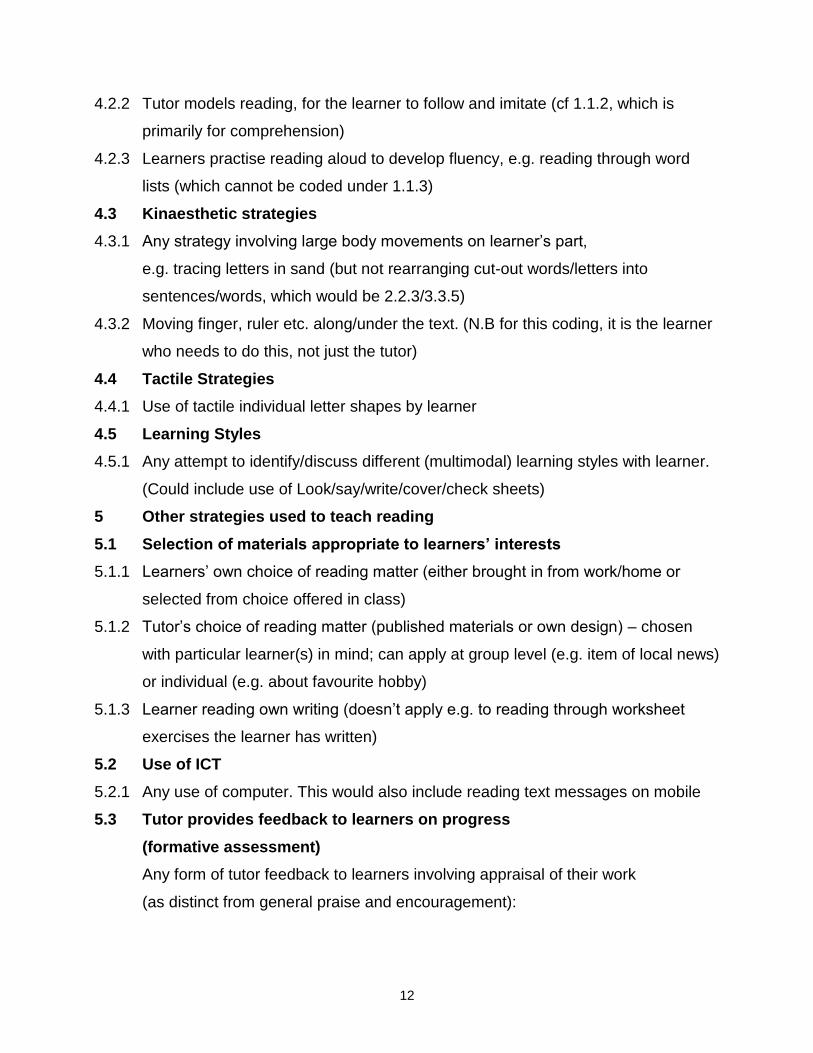
12
4.2.2 Tutor models reading, for the learner to follow and imitate (cf 1.1.2, which is
primarily for comprehension)
4.2.3 Learners practise reading aloud to develop fluency, e.g. reading through word
lists (which cannot be coded under 1.1.3)
4.3 Kinaesthetic strategies
4.3.1 Any strategy involving large body movements on learner’s part,
e.g. tracing letters in sand (but not rearranging cut-out words/letters into
sentences/words, which would be 2.2.3/3.3.5)
4.3.2 Moving finger, ruler etc. along/under the text. (N.B for this coding, it is the learner
who needs to do this, not just the tutor)
4.4 Tactile Strategies
4.4.1 Use of tactile individual letter shapes by learner
4.5 Learning Styles
4.5.1 Any attempt to identify/discuss different (multimodal) learning styles with learner.
(Could include use of Look/say/write/cover/check sheets)
5 Other strategies used to teach reading
5.1 Selection of materials appropriate to learners’ interests
5.1.1 Learners’ own choice of reading matter (either brought in from work/home or
selected from choice offered in class)
5.1.2 Tutor’s choice of reading matter (published materials or own design) – chosen
with particular learner(s) in mind; can apply at group level (e.g. item of local news)
or individual (e.g. about favourite hobby)
5.1.3 Learner reading own writing (doesn’t apply e.g. to reading through worksheet
exercises the learner has written)
5.2 Use of ICT
5.2.1 Any use of computer. This would also include reading text messages on mobile
5.3 Tutor provides feedback to learners on progress
(formative assessment)
Any form of tutor feedback to learners involving appraisal of their work
(as distinct from general praise and encouragement):
13
5.3.1 Appraisal/feedback given immediately or within a short time, e.g. work
commented on or corrected ‘on the spot’. This can often be ‘episodic’, e.g. if tutor
goes to have a look at the work a learner has been doing, makes a quick
comment or suggestion and moves on; or if a feedback comment is directed to an
individual within a group session. It can also be for a longer period of time, if the
main object is to go over and correct work that has just been done by the
learner(s)
5.3.2 Appraisal/feedback given after a lapse of time, e.g. work collected in to be
marked and returned at another session. This should be coded at the time of its
return to the learner – ‘episodic’ if just handed back corrected with little or no
comment; otherwise timed.
5.4 Talking points
5.4.1 Any noteworthy or bizarre occurrence (e.g. learner relating length of word to size
of object represented by that word)
This code should only be used for exceptional circumstances which cannot be
reflected by the existing codes. In many cases, when it seems difficult to reach a
decision on coding, it should be possible to decide on the level at which an
activity is operating and then chose one of the more general codes within that
level, e.g. 1.2.3, 2.2.3, 3.3.5. Remember that the examples given for each code
are only for guidance and are not an exhaustive list.