a study of b quark fragmentation into b0 and b+ mesons at lep
TRANSCRIPT
14 December 1995
PHYSICS LETTERS B
ELSEVIEl: Physics Letters B 364 ( 1995) 93- 106
A study of b quark fragmentation into B” and B+ mesons at LEP
OPAL Collaboration
G. Alexander w, J. Allisoni’, N. Altekamp’, K. Ametewee Y, K.J. Anderson’, S. Anderson ‘, S. Arcelli b, S. Asai x, D. Axen ac, G. Azuelos’*‘, A.H. Ballq, E. Barberio ‘, R.J. Barlow P,
R. Bartoldus c, J.R. Batley e, G. Beaudoin’, J. Bechtluft”, A. Beck”, G.A. Beck m, C. Beeston P, T. Behnke h, K.W. Bell ‘, G. Bella”, S. Bentvelsen h, P. Berlich j, S. Bethke “,
0. Biebel”, I.J. Bloodwortha, P. Bock k, H.M. Bosch k, M. Boutemeur r, S. Braibant ‘, P. Bright-Thomas Y, R.M. Brown t, H.J. Burckharth, C. Burgardaa, R. Btirginj,
P, Capiluppi b, R.K. Carnegie f, A.A. Carter m, J.R. Cartere, C.Y. Changq, C. Charlesworthf, D G Charltona**, S.L. Chu d, P.E.L. Clarke”, J.C. Clayton”, S.G. Clowesp, I. Cohen w, . .
J.E. Conboy O, O.C. Cooke P, M. Cuffiani b, S. Dado “, C. Dallapiccolaq, G.M. Dallavalle b, C. Darling ae, S. De Jong ‘, L.A. de1 Pozo h, H. Deng 9, M.S. Dixits, E. do Couto e SilvaY,
E. Duchovni ‘, G. Duckeckh, I.P. Duerdoth P, U.C. Dunwoody h, J.E.G. Edwards p, P.G. Estabrooks f, H.G. Evans i, F. Fabbri b, B. Fabbro “, P. Fath k, F. Fiedler’, M. Fierro b, M. Fincke-Keeler ab, H.M. Fischer ‘, R. Folman ‘, D.G. Fong q, M. Foucherq, H. Fukui ‘, A. Ftirtjesh, P. Gagnon f, A. Gaidot”, J.W. Gary d, J. Gascon’, S.M. Gascon-Shotkinq,
N.I. Geddes t, C. Geich-Gimbel’, S.W. Gensler i, F.X. Gentit “, T. Geralis t, G. Giacomelli b, P. Giacomellid, R. Giacomelli b, V. Gibsone, W.R. Gibson”, J.D. Gillies t,
D.M. Gingrich ad*‘, J. Goldberg “, M.J. Goodricke, W. Gorn d, C. Grandi b, E. GrossZ, C. Hajdu af, G.G. Hanson’, M. Hansroul h, M. Hapkern, C.K. Hargroves, P.A. Hart i,
C. HartmannC, M. Hauschild h, C.M. Hawkesh, R. Hawkings h, R.J. Hemingway f, G. Hertenj, R.D. Heuerh, J.C. Hille, S.J. Hillierh, T. Hilsej, P.R. Hobson y, D. Hochman ‘,
R.J. Homer a, A.K. Honmaab,' , D. Horvath af,3, R. HowardaC, R.E. Hughes-Jones P, D.E. Hutchcrofte, P. Igo-Kemenesk, D.C. Imriey, A. Jawaheryq, P.W. Jeffreys t,
H. Jeremie r, M. Jimacka, A. Joly r, M. Jones f, R.W.L. Jones h, U. Jost k, P. Jovanovica, J. Kanzaki ‘, D. Karlen f, K. Kawagoe ‘, T. Kawamotox, R.K. Keelerab, R.G. Kelloggq, B.W. Kennedy t, B.J. King h, J. King m, J. Kirk ac, S. Kluth e, T. Kobayashi ‘, M. Kobel J,
D.S. Koetke f, T.P. KokottC, S. Komamiya ‘, R. Kowalewski h, T. Kress k, P. Krieger f, J. von Krogh k, P. Kyberd m, G.D. Lafferty P, H. Lafoux “, R. Lahmann q, W.P. Lai ‘,
D. Lanske n, J. Lauber O, J.G. Layterd, A.M. Lee ae, E. Lefebvre r, D. Lellouch ‘, J. Letts b,
0370-2693/95/$09.50 @ 1995 Elsevier Science B.V. All rights reserved
SSDIO370-2693(95)01293-l
94 OPAL Cailaboration/ Physics Letters B 364 (1995) 93-106
L. Levinson ‘, C. Lewis”, S.L. Lloyd”, F.K. Loebingerr, G.D. Longq, B. Lorazo’, M.J. Lostys, J. Ludwigj, A. Luigj, A. Malik”, M. Mannelli h, S. Marcellini b, C. Markus c,
A.J. Martin m, J.P. Martin’, G. Martinez q, T. Mashimo ‘, W. Matthews Y, P. Mtittig ‘, J. McKenna ac, E.A. Mckigney O, T.J. McMahon a, A.I. McNab m, F. Meijers h, S. Menke ‘, ES. Merritt i, H. Mess, J. Meyer aa, A. Michelini h, G. Mikenberg”, D.J. Miller O, R. Mir z,
W. Mohrj, A. Montanari b, T. Mori ‘, M. Morii ‘, U. Mi.iller c, B. NellenC, B. Nijjharp, S.W. O’Neale”, F.G. Oakhams, F. Odorici b, H.O. OgretrY, N.J. Oldershaw P, C.J. Oramab*‘,
M.J. Oreglia’, S. Orito’, M. Palazzo b, J. Palinkas as, J.P. Pansart “, J.R. Paterr, G.N. Patrick’, M.J. Pearce”, P.D. Phillipsr, J.E. Pilcher’, J. Pinfoldad, D.E. Plane h,
I? Poffenberger ab, B. Poli b, A. Posthaus’, T.W. Pritchardm, H. Przysiezniak ad, D.L. Rees a, D. Rigby a, M.G. Rison e, S.A. Robins m, N. Rodning ad, J.M. Roney ab, E. Ros h,
A.M. Rossi b, M. Rosvick ab, P. Routenburgad, Y. Rozen h, K. Rungej, 0. Runolfsson h, D.R. Rust ‘, R. Rylko Y, M. Sasaki ‘, C. Sbarrab, A.D. Schaile h, 0. Schailej, F. Scharfc,
P. Scharff-Hansen h, P. Schenkd, B. Schmitt”, M. Schroderh, H.C. Schultz-Coulonj, M. Schulz h, P. SchtitzC, J. Schwiening’, W.G. Scott t, M. Settles!, T.G. Shearsr,
B.C. Shen d, C.H. Shepherd-Themistocleous s, P. Sherwood O, G.P. Siroli b, A. Sittler aa, A. Skillman’, A. Skuja 4, A.M. Smithh, T.J. Smithab, G.A. Snowq, R. Sobieab,
S. Sdldner-Remboldj, R.W. Springerad, M. Sproston’, A. Stahl”, M. StarksY, C. StegmannJ, K. Stephensr, J. Steuererab, B. Stockhausen”, D. StromS, F. Strumiah, P. Szymanski t,
R. Tafirout r, l? Taras r, S. Tarem ‘, M. Tecchio h, N. Tesch ‘, M.A. Thomson h, E. von Tijrne ‘, S. Towers f, M. TscheulinJ, T. Tsukamoto ‘, E. Tsur w, AS. Turcot i,
M.F. Turner-Watsonh, P. Utzat k, R. Van Kooten ‘, G. Vasseur “, P. Vikas r, M. Vincter ab, E.H. Vokurka P, F. Wackerle j, A. Wagner aa, D.L. Wagner i, C.P. Ward e, D.R. Ward e,
J.J. Ward O, P.M. Watkins a, A.T. Watson a, N.K. Watson s, P. Weber f, P.S. Wells h, N. Wermes ‘, B. Wilkens j, G.W. Wilson aa, J.A. Wilson a, T. Wlodek ‘, G. Wolf ‘,
S. Wottonk, T.R. Wyatt P, S. Xella b, G. Yekutieli z, V. Zacek r a School uj’physics and Space Research, University of’ Birmingham, Birmingham B15 2T7; UK
’ Dipartimento di Fisica deN’ Universitti di Bologna and INFN. I-40126 Bologna, Italy
c Physikalisches Instinct. Universittit Bonn, D-531 I.5 Bonn, Germany
d Department of Physics, University of California, Riverside, CA 9252 I 1 USA
e Cavendish Laboratory, Cambridge CB3 OHE, UK
f Orrawa-Carlerun institute ji)r Physics, Department of’ Physics. Carleton University, Ottawa, Ontario KI S 586. Canada
g Centre jix Research in Particle Physics. Carleton Universig. Ottawa, Ont. KIS 586. Canada
h CERN. European Organisation@ Par&e Physics. CH-I21 I Geneva 23, Switzerland
’ Enrico Fermi institute and Department @‘Physics. University of Chicago. Chicago, IL 60637. USA
j Fakultiitfir Physik. Albert Ludwigs Universitiil, D-79104 Freiburg, Germany
k Physikalisches Institut. Universittit Heidelberg, D-69120 Heidelberg, Germany
’ Indiana University, Department of’ Physics, Swain Hall West I 17, Bloomington. IN 47405, USA
m Queen Mary and Westfield College, University of‘l.ondon. London El 4NS, UK
n Technische Hochschule Aachen. III Physikalisches Institut, Sommerfeldstrasse 26-28, D-52056 Aachen. Germany
o Uni\lersi@ College London. London WC/E 6BT. UK
P Department of’ Physics, Schuster Laboratory, The University, Manchester Ml3 9PL , UK
q Department of Physics. University of Maryland, CalleRe Park. MD 20742. USA
r Lnborataire de Physique Nucliaire, Universitb de Montrt!al. Man&al, Que. H3C 3J7, Canada
‘i University qf’ Oregon. Department of Physics, Eugene. OR 97403. USA
( Ruthet-ford Appleton Laboratory. Chilton. Didcot. Oxjtirdshire OXI I OQX. UK

OPAL Collaboration/Physics Letters 3 364 (1995) 93-106 95
u CEA, DAPNIAISPP, CE-Saclay, F-91 191 G&w-Yvette, France
” Department of Physics, Technion-Israel Institute of Technology, Haifb 32000, Israel
w Department of Physics and Astronomy, Tel Aviv University, Tel Aviv 69978, Israel
h International Centre for Elementary Particle Physics and Department of Physics. University of Tokyo, Tokyo 113, Japan
and Kobe University, Kobe 657, Japan
Y Brunel University, Uxbridge, Middlesex LIB8 3PH. UK
z Particle Physics Department, Weizmann lnsrirute of Science, Rehovot 76100, Israel
aa Universitiit HamburgiDESY, I/ Institut fir Experimentat Physik. Notkestrasse 85, D-22607 Hamburg, Germany
ab University of Victoria, Department of Physics, P.O. Box 305.5, Victoria BC V8W 3P6, Canada
” University of British Columbia, Department uf Physics, Vancouver BC V6T IZI, Canada
ad University of Alberta. Department of Physics, Edmonton AB T6G 251, Canada
a= Duke University, Department of Physics, Durham, NC 27708-0305, USA
a’ Research Institute j&r Particle and Nuclear Physics, H-1525 Budapest, P.O. Box 49, Hungary
“8 Insrirute of Nuclear Research. H4001 Debrecen, P.O. Box 51 t Hungary
Received 16 August 1995 Editor: K. Winter
Abstract
A study of b quark fragmentation at LEP is presented using a sample of semileptonic B decays containing a fully reconstructed charm meson. The data are compared to several theoretical models for heavy quark fragmentation; the free parameters in these models are fitted and the sensitivity of the model parameters to the rate of P-wave B meson production is studied. The mean scaled energy fraction of B0 and B+ mesons has been determined to be (xh) = 0.695 51 0.006 41 0.003 * 0.007, where the errors are statistical, systematic and model dependence respectively. This result is consistent with previous, less direct measurements from inclusive leptonic B decays. Also presented is a model independent fit to the shape of the energy distribution of weakly decaying B mesons at LEP.
-
1. Introduction
The study of b quark fragmentation may help us understand more fully hadronization effects in non- perturbative QCD. From the point of view of pertur- bative QCD, the production of a heavy quark from a 2’ decay is well understood. Measuring the B meson fragmentation function should help in determining the non-perturbative contribution and test the theoretical predictions for such effects [ 11. The uncertainty in the b quark fragmentation is also a significant component of the error in many other heavy quark physics results
which could be reduced by a more precise measure- ment of the fragmentation into B hadrons in Z” decays.
To date, most measurements of the fragmentation function have relied on the study of inclusive B -+ IX decays [ 2,3], where e is either an electron or a muon.
’ Also at TRIUMF, Vancouver, Canada V6T 2A3.
? Royal Society University Research Fellow.
-’ Institute of Nuclear Research, Debrecen. Hungary.
These samples provide large statistics but have sys- tematic limitations. With the high statistics now avail- able at LEP, it has become possible to identify signif- icant samples of B -+ Df?X or B --+ D*CX decays [ 41 in which the D or D* is fully reconstructed. The kine- matics of the Dc*)e combination constrain the B en- ergy more precisely than in inclusive B + eX decays. Therefore, in the absence of large statistics of fully reconstructed B mesons, the data samples used in this analysis are expected to provide the most direct op-
portunity for studying b quark fragmentation. In this letter we use a maximum likelihood tech-
nique to extract information on the fragmentation function from the observed kinematics of B + D’*‘CX
decays. Using this technique the models of Peterson et al. [ 51, Collins and Spiller [ 61, Kartvelishvili et
al. [ 71 and Lund [ 81 are compared with the data. The sensitivity of the results to the fraction of B mesons originating from excited P-wave states is investigated. We also perform a model independent fit in order to extract the energy spectra of B” and B+ mesons in Z”

96 OPAL Collaboralion / Physics Letters B 364 I1 995) 93-106
decays and compare this with theoretical predictions for the distribution.
Throughout this paper, charge conjugation is im-
plicitly assumed and the symbol D’*’ denotes either a Do, D+, D’(2010)’ or a D*(2010)+ meson. The
symbol D**(B**) is used to denote a mixture of P- wave D(B) mesons.
2. Event selection
A complete description of the OPAL detector can be found elsewhere [ 91. Most of this analysis relies on the tracking of charged particles provided by the cen- tral detector, consisting of a silicon microvertex detec-
tor, a precision vertex drift chamber, a large volume jet chamber and chambers measuring the z coordinate4 of tracks as they leave the jet chamber. The central de- tectors are surrounded by a magnet, outside which are electromagnetic and hadronic calorimeters which ab-
sorb and measure the energy of electrons, photons and hadrons. These are surrounded by muon chambers.
The data used in this analysis were recorded by OPAL from 1991 to 1994. They were collected from e+e- annihilations at centre of mass energies between 88.5 and 93.8 GeV. The selection criteria we used for isolating hadronic 2’ decays are described else- where [ lo] and have an efficiency of (98.4% 0.4)%. After data quality and detector performance require- ments, the available sample consists of 3.1 million
events. The selection of B --f Df?+X and B ----t D*!+X
events uses kinematic and vertex information from the decays of the B and D mesons. We consider the fol-
lowing five decay modes, D+ ---$ K-r+n-+, Do + K-n-+, Do -+ K-?r+?r+q- and D*+ + DOT+ where
the Do decays to K-n-+ or K-r+?r+r- as before. The selection is described in detail in a previous pa-
per [ 41 and is only summarized here. Charged pions and kaons are identified using dEldx
information from the jet chamber. Electrons are iden- tified from energy deposited in the electromagnetic calorimeter and dEldx information from the jet cham- ber. Muons are identified by associating central detec-
4The OPAL coordinate system is defined with positive ; along
the e- beam direction, H and q5 being the polar and azimuthal
angles. The origin is taken to be the nominal interaction point.
tor tracks with track segments in the muon chambers along with loose dE/dx requirements to reject kaons
and protons.
The D(*) mesons are selected by considering all track combinations consistent with the appropriate
particle identification hypotheses. All D(*)e- combi- nations are considered as possible B candidates. In selecting D*+ candidates we required the mass differ- ence between the D*+ and Do candidate to be in the
range 0.1415-0.1485 GeV. To ensure statistical inde-
pendence, Do candidates were rejected if there existed a possible D*+ candidate with a mass difference less than 0.16 GeV.
To reduce the combinatorial background several kinematic cuts are made [ 41; the main requirements
being that the mass, Moe, and energy, ED~, of the can- didates satisfy certain minimum criteria. The symbols MDP and ED~ represent the invariant mass and the
combined energy of the D (*)t system respectively and XD~ is equal to ED~/E~~,,,, where Eka,,, is the beam energy. We require the D(*) meson candidate to have energy greater than 5-9 GeV, depending on the decay channel, and place loose requirements on the decay lengths of the B and D meson candidates. To reject badly reconstructed vertices we require the lepton track and at least two of the D decay tracks to have at least one associated microvertex hit. This ensures that vertex reconstruction is dominated by tracks with microvertex detector information. The x2 probability for the vertex fit is required to be greater than 1%.
The mass distributions for the five different decay modes are shown in Fig. 1. A signal is clearly visible in each of the decay modes. Fitting the signal with a Gaussian and the background with a second order polynomial in each case gives a total of approximately 2300 signal events. The K-r+ mass distributions also show a satellite peak around 1.6 GeV which are also fitted with a Gaussian. An enhancement is expected in this region from partially reconstructed decays, par- ticularly Do + K-p+,p+ + n-+r’, in which the r” is not reconstructed. These decays are not used for this analysis as the D(*) meson is not fully recon- structed. For the fragmentation fits we use the events within the mass region 1.805- 1.925 GeV. To assess the background in the selected samples we used side- bands from the mass regions 1.735-1.795 GeV and
I .935- 1.995 GeV.

g 150
&oo 2
W 50
0
$ 200
s B 150
g 100 W
50
0
% E 0 100
2
& 50
0
OPAL Collaboration/Physics Lxtters 8 364 (1995) 93-106
OPAL > 400 ii? 2 300
3 f 200 &
100
1.4 1.6 1.8 2 2.2 0
m(Kx) (GeV)
P . . 2 2.2 ’ m(Kmc) (GeV)
g 100
51 3 75
! 50 W
25
1.4 1.6 1.8 2 2.2 m(Kx) (GeV) m(KrW (GeV)
1.4 1.6 1.8 2 2.2 m(Kx%?c) (GeV)
91
Fig. I. D mass distributions for (a) d’ --t K-T+ events, (b) D” --t K-TT+T+T- events, (c) Dt -+ K-?r+rr+ events, (d) D*+ + D”T+,
D” --f K-p+ events and (e) D*+ + Do&, Do + K-z-+TT+T- events. The fits shown are the sum of Caussians and second order polynomials and the lines above the peaks mark the signal and sideband regions.
In addition to the expected B + D’*‘e-X decays there are two other sources of D’*‘!- combinations which may contribute to the observed signals. These
are from the decays B -+ D:*‘D’*’ where the D6”
3. Monte Carlo simulation
To model the B --f D’*‘.?X decays we used a full Monte Carlo simulation of the OPAL detector [ 1 I 1.
decay includes a lepton, and B --+ DrX where the r The JETSET Monte Carlo program [ 121 was used to
decays to either an electron or muon. These have been generate samples of semileptonic B decay events in
studied previously [ 41 and are estimated to make up each of the D’*‘!+ channels. The Peterson parameter- 2-5% of our samples. ization [5] was used for the b quark fragmentation,

98 OPAL Collaboration/Physics Letters B 364 (199s) 93-106
with the fragmentation parameter l b = 0.0057 (corre- sponding to (XE) = 0.691) and we used the JETSET
parameter At_u~o = 0.31 GeV [ 131. The exclusive branching ratios used for these simulated events are
described in detail in Ref. [ 141.
A significant fraction, f$*, of semileptonic B de- cays are known to involve resonant D(*‘r produc-
tion [ 4,151. The states involved, generically referred to as D**, are assumed to be saturated by the four P-wave mesons. Based on CLEO data [ 161 these de-
cays were assumed to form 0.36 + 0.12 of semilep- tonic B decays. Assuming the D** decays are domi- nated by decays to D(*) n- final states, isospin invari-
ance was used to determine the fraction of decays yielding charged and neutral mesons. The fraction of
D** decays to D*%- final states, p(,, was taken to be 0.54 f 0.30 [ 141. Semileptonic B decays may also result in non-resonant DOT production. These were not included in our standard simulations but have been
studied using additional exclusive samples. Similarly a significant fraction, fi*, of b quarks
are known to fragment to excited B** mesons [ 171. In analogy with the B decays to P-wave charmed mesons we assumed these were saturated by the P- wave mesons and that fb+* = 0.36 ZIZ 0.12. We also as-
sumed the production rate of the two narrow P-wave B meson states are equal and twice the production rate of the two wide states [ 181. For the studies without P- wave B mesons, where fbf* = 0.0 all the other Monte Carlo parameters were unchanged. The rate of direct
B* production was set such that N(B*)IN(B) N 0.75 [ 191. Due to the small mass difference between the B and B* mesons, varying this parameter through its uncertainty causes a negligible effect on our results
and is not considered as a systematic error. As we use the Monte Carlo simulated data to obtain
the reconstruction efficiencies for each decay channel, we need to be confident that they simulate the data well. We compared the simulated distributions of ED~ and Mm, on which the tightest selection cuts were made, with the same distributions from the data. It can be seen from Fig. 2 that the simulated distributions are in good agreement with the data.
4. Fragmentation models
Experimentally we observe the B meson XE dis-
tribution, where XE is the energy of the weakly de-
caying B meson divided by the beam energy but, at
present, there is no simple parameterization for this distribution. Instead all the commonly used theoretical
parameterizations for heavy quark fragmentation use the non-observable variable z, where z is the fraction
of the parton energy retained by the B hadron when the b quark undergoes hadronisation. We have studied
these models in the context of the JETSET simula- tion and use the definition, z = (E + pii )hadron/( E + pli ) available [ 121, where most of the ‘available’ energy and momentum is from the b quark and p/l is the mo- mentum in the direction of the quark momentum vec-
tor. Once the models have been compared with the data, these z distributions can then be used to predict the XE distribution using a Monte Carlo simulation
of the z to XE mapping. It should be noted that this mapping has some sensitivity to the other parameters used when producing the Monte Carlo simulation, e.g. ALUND. In this letter we study the following theoreti- cal fragmentation functions: Peterson et al. [ 51
f(z)cc;-’ l-i-&) -2
( z.
where l b is expected to vary as the inverse square of
the effective quark mass, MC&; Collins and Spiller [ 61
f(z)x( z (1 - z) I (;1-_z;;) (1 + z2)
where 4 is alSO expected to vary as M;,il,; Kartvelishvili et al. [ 71
and Lund [ 8 1
1 f(z) 0: -( 1 - z)‘exp
;
where bM$ is considered as a free parameter and a
is a universal parameter which has been tuned to 0.18

OPAL Collaboration/Physics Letters B 364 (1995) 93-106 99
OPAL
2 3 4 5 M(D?) (GeV)
I”“1 ““I”“I’
-b) ;
I I I I I I, 4 ,,I, I ,,I 2 3
M:D+l) (Get)
10 20 E;f+l) (Gpv,
10 20 30 40 E(D’N (GeV)
2 3 4 M(D*‘l) 5 10 20 (GeV) E(%l) ($V)
Fig. 2. Monte Carlo and data comparison of Mo(i for (a) b + D”YX events, (b) b -+ DfYX events and (c) b + D’+PX events and ED{ for (d) b -+ D”YX events, (e) b + D+PX events and (f) b -+ D*+CX events. The histograms are the generator level Monte Carlo distributions and the points are efficiency corrected data after background subtraction. The dotted line on each plot indicates the
experimental lower limit due to the selection criteria applied. These distributions are not fitted, only normalized such that the integration
over the experimental ranges are equal.
by OPAL [ 131. The general symbol E is used in this paper to describe the free parameters in the models (cb, 4, ab or bM; respectively).
5. Fit method
To fit the z distributions predicted by our models to the data, we first have to consider the measurable kinematics of the decays and how they are related to z. There is an approximately linear relationship be-
100 OPAL Collaboration/Physics Letters B 364 (1995) 93- JO6
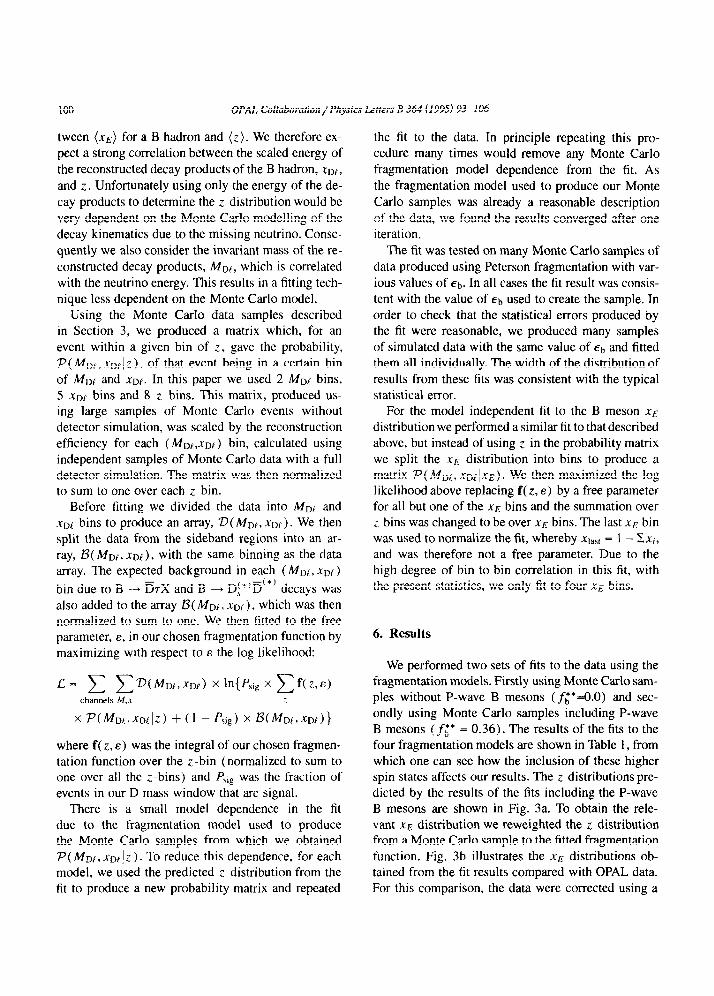
tween (XE) for a B hadron and (z). We therefore ex- pect a strong correlation between the scaled energy of
the reconstructed decay products of the B hadron, _Yb(,
and z . Unfortunately using only the energy of the de-
cay products to determine the z distribution would be
very dependent on the Monte Carlo modelling of the decay kinematics due to the missing neutrino. Conse-
quently we also consider the invariant mass of the re-
constructed decay products, Mot, which is correlated
with the neutrino energy. This results in a fitting tech-
nique less dependent on the Monte Carlo model. Using the Monte Carlo data samples described
in Section 3, we produced a matrix which, for an
event within a given bin of Z, gave the probability,
P( Mm, XDI 1; ), of that event being in a certain bin of MD~ and XD~. In this paper we used 2 MD~ bins, 5 .xo{ bins and 8 z bins. This matrix, produced us- ing large samples of Monte Carlo events without detector simulation, was scaled by the reconstruction efficiency for each ( MD~,xD~) bin, calculated using
independent samples of Monte Carlo data with a full detector simulation. The matrix was then normalized to sum to one over each z bin.
Before fitting we divided the data into MD~ and _TD~ bins to produce an array, V(MD~, XDJ ). We then split the data from the sideband regions into an ar- ray, a( MD~, XD~), with the same binning as the data array. The expected background in each (MD{. XDI )
bin due toB -+ I%X and B + D,i*‘D --( *’ decays was
also added to the array B( MDJ , XD(), which was then normalized to sum to one. We then fitted to the free parameter, E, in our chosen fragmentation function by maximizing with respect to e the log likelihood:
x P(MD~,xD~Iz) + (1 -Psig) x B(MDI,~DY)}
where f( z, E) was the integral of our chosen fragmen- tation function over the z-bin (normalized to sum to one over all the z-bins) and P>ig was the fraction of events in our D mass window that are signal.
There is a small model dependence in the fit due to the fragmentation model used to produce the Monte Carlo samples from which we obtained P( MD{, XD~ jz ). To reduce this dependence, for each model, we used the predicted z distribution from the fit to produce a new probability matrix and repeated
the fit to the data. In principle repeating this pro- cedure many times would remove any Monte Carlo fragmentation model dependence from the fit. As
the fragmentation model used to produce our Monte
Carlo samples was already a reasonable description of the data, we found the results converged after one iteration.
The fit was tested on many Monte Carlo samples of
data produced using Peterson fragmentation with var- ious values of Eb. In all cases the fit result was consis-
tent with the value of Eb used to create the sample. In order to check that the statistical errors produced by the fit were reasonable, we produced many samples of simulated data with the same value of Eb and fitted
them all individually. The width of the distribution of results from these fits was consistent with the typical statistical error.
For the model independent fit to the B meson XE distribution we performed a similar fit to that described
above, but instead of using z in the probability matrix we split the XE distribution into bins to produce a matrix P( MD~, XD~~XE). We then maximized the log likelihood above replacing f( z, E) by a free parameter for all but one of the XE bins and the summation over z bins was changed to be over XE bins. The last xE bin was used to normalize the fit, whereby xtaat = 1 - Z.rj, and was therefore not a free parameter. Due to the high degree of bin to bin correlation in this fit, with the present statistics, we only fit to four XE bins.
6. Results
We performed two sets of fits to the data using the fragmentation models. Firstly using Monte Carlo sam- ples without P-wave B mesons (fz*=O.O) and sec- ondly using Monte Carlo samples including P-wave B mesons (fc* = 0.36). The results of the fits to the four fragmentation models are shown in Table 1, from which one can see how the inclusion of these higher spin states affects our results. The z distributions pre- dicted by the results of the fits including the P-wave B mesons are shown in Fig. 3a. To obtain the rele- vant XE distribution we reweighted the z distribution from a Monte Carlo sample to the fitted fragmentation function. Fig. 3b illustrates the XE distributions ob- tained from the fit results compared with OPAL data. For this comparison, the data were corrected using a

OPAL Collaboration/Physics titters B 364 (1995) 93-106 101
$ 9
g 8
7
6
5
4
3
2
1
0
4 0.25
2 a 0.2
0.15
0.1
0.05
0
t L - Peterson : ------ Collins and Spiller
............ Kartvelishvih _._._._ Lund 4
OPAL
0.3 0.4 0.5 0.6 0.7 0.8 0.9 1
‘b
I- * OPAL t
- Peterson ------ ColliisandSpiller __ __.._____. Kartvelishvili _._._.. Lund
0.3 0.4 0.5 0.6 0.7 0.8 0.9 1
EE
Fig. 3. (a) Normalized fit results for the four fragmentation functions with the free parameters set to the values given in Table I (results
for fits with P-wave B mesons). (b) Distribution to illustrate the fit results in terms of XE. The points are the OPAL data unfolded using
the Peterson fragmentation model and the histograms arc the predicted XE distributions from our four model dependent fit results. The
smaller errors on the points are the statistical errors and the larger are the sum of the statistical errors and the systematic errors (including
an error due to the model dependence).
Table I Fit results and derived result for (XE) for the four different fragmentation functions with and without P-wave B mesons in the Monte Carlo
simulation. The errors shown with the results are the statistical errors from the maximum likelihood fit. The systematic uncertainties on
(J-E) in the final column, are described below in Section 7 and are approximately equal for the fits with and without the P-wave B mesons.
Model Without B”
Fit result (e) (-rd
With B**
Fit result (E) (*E)
Systematic error on (_r~)
Peterson
C. and S.
Kart.
Lund
(4,7”:j1:) X IO-’ 0.694+0.‘e’j (2.4:$) x IO-” 0.69511’:;F? +0.(x)3 -0sXl5 -0.oJ4
(2.5:;;) x IO-’ 0.683’Ljgs (6.4:;;) x lO-4 0.684+“.0°6 fO.(XU --0.006 -o co3
(lo.o+_(:,g) 0,697+“.‘x’6 ( I 3 .s+_y; ) o~699+o.‘x” fO.lW --0.a17 -O.lX)6 -WX)3
(5.3?($ 0.702+O.(X’6 +0.(x)3
-O.(X)6 (7.5:;;::) o.703+“.‘M -0.(x16 -_(I.lXU
102 OPAL Colluboration / Physics Letters B 364 (1995) 93-106
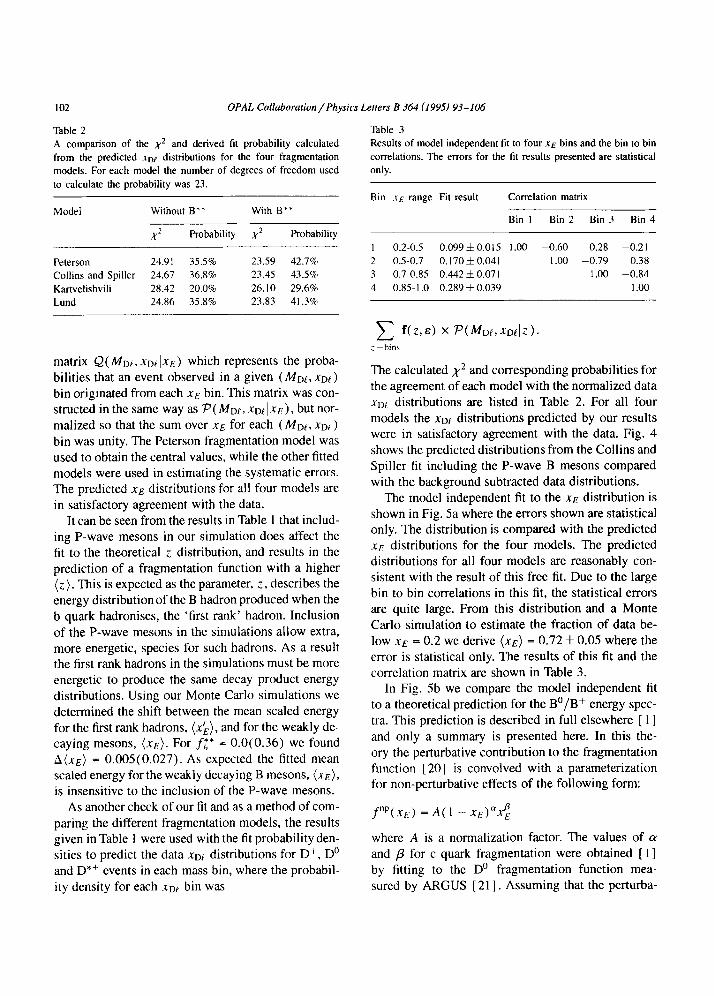
Table 2 Table 3
Results of model independent fit to four XE bins and the bin to bin
correlations. The errors for the fit results presented are statistical
only.
A comparison of the X2 and derived fit probability calculated
from the predicted xop distributions for the four fragmentation
models. For each model the number of degrees of freedom used
to calculate the probability was 23.
Bin SE range Fit result Correlation matrix
Model Without B** With B**
X2 Probability X2 Probability
Bin I Bin 2 Bin 3 Bin 4
Peterson 24.9 I 35.5% 23.59 42.7%
Collins and Spiller 24.67 36.8% 23.45 43.5%
Kartvelishvili 28.42 20.0% 26.10 29.6%
Lund 24.86 35.8% 23.83 41.3%
I 0.2-0.5 0.099 rt 0.015 1 .OO -0.60 0.28 -0.21
2 0.5-0.7 0.1705 0.041 I .oo -0.79 0.38
3 0.7-0.85 0.442 zt 0.071 I .oo -0.84
4 0.85-l .O 0.289 zt 0.039 I .oo
c f(z,e) x P(MDI,xDEIz).
matrix &( kilt, xDC1.x~) which represents the proba-
bilities that an event observed in a given (MD{, xD1)
bin originated from each xE bin. This matrix was con- structed in the same way as P( Mot, xoylx~), but nor-
malized so that the sum over XE for each (Mot, XoI ) bin was unity. The Peterson fragmentation model was used to obtain the central values, while the other fitted models were used in estimating the systematic errors. The predicted XE distributions for all four models are in satisfactory agreement with the data.
The calculated x2 and corresponding probabilities for the agreement of each model with the normalized data XoI distributions are listed in Table 2. For all four
models the XoL distributions predicted by our results were in satisfactory agreement with the data. Fig. 4 shows the predicted distributions from the Collins and Spiller fit including the P-wave B mesons compared with the background subtracted data distributions.
It can be seen from the results in Table 1 that includ- ing P-wave mesons in our simulation does affect the fit to the theoretical z distribution, and results in the prediction of a fragmentation function with a higher (z). This is expected as the parameter, Z, describes the energy distribution of the B hadron produced when the
b quark hadronises, the ‘first rank’ hadron. Inclusion of the P-wave mesons in the simulations allow extra, more energetic, species for such hadrons. As a result the first rank hadrons in the simulations must be more energetic to produce the same decay product energy distributions. Using our Monte Carlo simulations we determined the shift between the mean scaled energy for the first rank hadrons, (xl,), and for the weakly de- caying mesons, (xE). For fl* = 0.0(0.36) we found A(xE) = O.OOS( 0.027). As expected the fitted mean scaled energy for the weakly decaying B mesons, (xE), is insensitive to the inclusion of the P-wave mesons.
The model independent fit to the XE distribution is shown in Fig. 5a where the errors shown are statistical only. The distribution is compared with the predicted XE distributions for the four models. The predicted distributions for all four models are reasonably con- sistent with the result of this free fit. Due to the large bin to bin correlations in this fit, the statistical errors are quite large. From this distribution and a Monte Carlo simulation to estimate the fraction of data be- low XE = 0.2 we derive (XE) = 0.72 f 0.05 where the error is statistical only. The results of this fit and the correlation matrix are shown in Table 3.
In Fig. 5b we compare the model independent fit to a theoretical prediction for the B”/Bf energy spec- tra. This prediction is described in full elsewhere [ 1 ] and only a summary is presented here. In this the-
ory the perturbative contribution to the fragmentation function [ 201 is convolved with a parameterization for non-perturbative effects of the following form:
As another check of our fit and as a method of com- paring the different fragmentation models, the results given in Table 1 were used with the fit probability den- sities to predict the data xoi distributions for D+, Do
and D*+ events in each mass bin, where the probabil-
ity density for each Xo( bin was
aP fnP(X~) = A( 1 - XE) XE
where A is a normalization factor. The values of LY and p for c quark fragmentation were obtained [ 11 by fitting to the Do fragmentation function mea- sured by ARGUS [ 211. Assuming that the perturba-

OPAL Collaboration/Physics Letters B 364 (1995) 93-106 103
OPAL
f 0.6
g 0.4
J b)
1
I
t
I T
1
-__ __---___ ________________ III III III
0.4 0.6 0.8 1
t a)
I
t + ’
l
-__ ________ _________ -- III III III
0.2
0 0.4 0.6 0.8
r(D4: x(D%
t’ ” ” ” ” ” ’ ‘i 3 0.6 n
z 0.4 5
I ’ ’ ’ I ’ ’ ’ I ’ ’ ‘_’
4
* -_w __---_-- _________________ 0l,lllllIl~l~_
0.4 0.6 0.8 1 x(D+I)
0.2
0 0.4 0.6 0.8 1
x@+l)
0.2
__ mm---___ ________________ ,I1 I I, I I I I 0.4 0.6 0.8
x(D*+-l:
0 0.4 0.6 0.8 1
x@'+l) Fig. 4. Comparison of data .Y~Y distributions with predicted distributions for each Mm bin from the Collins and Spiller fit result for (a)
and (b) b + D”PX events, (c) and (d) b -+ D’YX events and (e) and (f) b -+ D”’ YX events. Histograms (a), (c) and (e) are for the
lower &Q bin (3.0-4.0 GeV) and (b), (d) and (f) for the higher MD{ bin (4.0-5.0 GeV). The histograms are the predicted distributions
and the points are the background subtracted data distributions.
tive matching scale, rug = Mb = 4.5 GeV, AQcD =
300(200) MeV for five quark flavours and that non- perturbative effects scale linearly in the mass of the heavy quark the values ag = 1.46(0.595) and PB = 37.76( 18.67) were obtained [ 11. The other fragmen- tation models used in this analysis are constrained by OPAL data whereas this theory has many free param-
eters and systematic uncertainties. Nevertheless the predicted distribution shown is in good agreement 5 with our data where x2 = 1.62 for AQCD = 300 MeV
- 5 In the comparison with the model independent tit, extra com-
plications to the theory such as the P-wave B mesons are ignored.

104 OPAL Collaboration/Physics Letters B 364 (1995193-106
2 0.6
2 = 0.5
0.2 0.3 0.4 0.5 0.6 0.7 0.8 0.9 1
0 ~,,,I,,,I’,,I,,,I’,.I,,‘I,,,I.,‘~ 0.2 0.3 0.4 0.5 0.6 0.7 0.8 0.9 1
Fig. 5. Comparison of model independent binned fit to SE dis-
tribution with all the bin to bin correlations accounted for in the
fit, shown by the points (the errors shown being statistical only),
with histograms showing (a) the predicted x,s distributions from
our parameterized fits to the four models and (b) the theoretically
predicted IE distributions for AQCD = 200 MeV and 300 MeV.
and x2 = 6.17 for Aoco = 200 MeV with 3 degrees of freedom.
7. Systematic uncertainties
There are several sources of systematic uncertainty which affect our results, most of which are due to un-
certainties in the Monte Carlo modelling of the decay channels. These are summarized in Table 4 and were evaluated as follows: - Although f;* has been measured [ 171 there are still
large uncertainties in the fraction of wide P-wave
states. As a result we use a uncertainty of f0.12 which is larger than the measured errors. This error was evaluated by producing new samples of gener-
ator level Monte Carlo with fb* scaled accordingly and repeating the fit. As can be seen from the differ- ence in the results shown in Table 1 varying ft* has
Table 4
Effect on (.r~) of the systematic errors for the four different
fragmentation fits.
Systematic A(Q) x10’
Peterson C. and S. Kart. Lund
f;* f0.12 +0.1
-0.5
f;* f0.12 +1.5
-2.8
,‘,. & 0.3 $2.0
- I .9
Non-resonant +1.3
decays ( IO% )
B + DrX and B + Dj*‘E(*) +OS
background -0.8
Combinatorial +0..5
background -0.6
Total +2.9
-3.6
+0.3 +0.2 +0.3
-0.7 -0.5 -0.4
+ I .8 +2.3 $1.8
-2.4 -2.5 -2.4
+1.5 +1.5 fl.7
- I .5 -1.5 -1.4
+ I 2 +1.5 +1.5
+o.s f0.6 +0.6
-0.7 -0.7 -0.7
+0.5 $0.5 to.4
-0.7 -0.5 -0.5
f2.7 +3.2 +3.0
-3.1 -3.1 -3.0
a large effect on the free parameters of the models,
E, but the fitted value of (XE) is much less sensitive. - We varied fs:* by f0.12 as measured by
CLEO [ 161. By splitting the Monte Carlo samples into the components from D**, D* and direct de- cays and recombining them scaled according to the variation in j$* to produce a new probability ma- trix, P( Mot, XoL 1 z ), we refit the data and obtained the systematic uncertainty.
- The uncertainty due to pv was evaluated in the same way as for fz* whereby pr was varied by 50.30 as assumed previously [ 141.
- Experimental measurements indicate that a large fraction of the D** component of semileptonic B decays consist of the P-wave states [ 41; but a con- tribution of non-resonant decays of the type B * D(*)&r is not excluded at the 10% level. There- fore to account for the possibility of such decays we produced Monte Carlo data samples in which 10% of the semileptonic B decays were of this type. Fit-
ting to the data using these samples to produce the probability matrix we estimated the uncertainty due to such decays.

OPAL Collaboration/Physics Letters B 364 (1995) 93-106 105
- The systematic uncertainty due to background from
B -+ DTX and B ---t Dj*)D’*’ decays was assessed by varying the measured branching ratios 6 by their
uncertainty. - The uncertainty in the Mot and ED~ distributions
from the sideband regions was evaluated by mov-
ing the sideband regions by 30 MeV in both direc-
tions and the effect on the fit result was used as the systematic error.
For all four models, both the statistical and system-
decaying hadron rather than the first-rank hadron. Us- ing A(xE) as predicted by the JETSET model we can
translate this result to the corresponding mean energy
fraction for the first rank hadrons, (x/E). For fb* = 0.0
and 0.36 we obtain (XL) = 0.700 and (XL) = 0.722
respectively.
atic errors are fully correlated. Therefore to combine them we took the mean of the four results and errors for the fits including the P-wave B mesons shown in
Table 1. In combining these results an extra system- atic error due to the model dependence was included. This was calculated as the r.m.s. of the deviation from the mean of the individual results. This gives a final result for (xE):
We have also made the first model independent fit to the shape of the XE distribution for weakly decay-
ing B mesons. This fit is consistent with the predicted
distributions from the four fragmentation models stud- ied and with the present statistics none of them can be
eliminated. In addition, the fit is in good agreement with a theoretical prediction for the B meson energy
spectrum.
Acknowledgements
(Q) = 0.695 f 0.006 * 0.003 f 0.007
We thank Paolo Nason for useful discussion and providing the program from which we produced the theoretical XE distribution shown in Fig. 5b.
where the errors are statistical, systematic and model dependence respectively.
8. Conclusions
Using a sample of approximately 2300 semileptonic Be/B+ meson decays to charm mesons we have fit- ted the data to four theoretical models for the b quark fragmentation variable z. Using these results, we ob- tained the mean Be/B+ meson energy fraction:
It is a pleasure to thank the SL Division for the efficient operation of the LEP accelerator, the precise information on the absolute energy, and their contin- uing close cooperation with our experimental group. In addition to the support staff at our own institutions we are pleased to acknowledge the Department of Energy, USA, National Science Foundation, USA, Particle Physics and Astronomy Research Council,
UK Natural Sciences and Engineering Research Council, Canada,
(Q) = 0.695 f 0.006 f 0.003 f 0.007 Fussefeld Foundation,
where the errors are statistical, systematic and model dependence respectively. With the statistics available, none of the models can be excluded and the quality of the fit is unchanged by including the P-wave B mesons in the data simulation.
This result is in good agreement with previous mea- surements [ 2,3,23] with a small improvement in pre- cision. It is also consistent with a less precise result using a similar method and event sample [ 241. We emphasize that in this paper (XE) refers to the weakly
6 We used the branching ratios B(b - DTX) = (4.1 f l.O)%
and B(B -+ Dj*‘D’*‘) = (5.0&0.9)% [22].
Israel Ministry of Science,
Israel Science Foundation, administered by the Israel Academy of Science and Humanities, Minerva Gesellschaft, Japanese Ministry of Education, Science and Culture (the Monbusho) and a grant under the Monbusho International Science Research Program,
German Israeli Bi-national Science Foundation
(GIF), Direction des Sciences de la Matihre du Commissariat B I’Energie Atomique, France, Bundesministerium ftir Forschung und Technologie,
Germany, National Research Council of Canada,

106 OPAL Collaboration/Physics Letters B 364 (1995) 93-106
A.P. Sloan Foundation and Junta National de Investiga@o Cientifica e Tecnolbgica, Portugal. Hungarian Foundation for Scientific Research, OTKA T-01 6660.
References
[ I ] G. Colangelo and P Nason, Phys. Lett. B 285 ( 1992) 167.
[2] OPAL Collab., PD. Acton et al., Z. Phys. C 58 ( 1993) 523.
[ 31 ALEPH Collab., D. Decamp et al., Phys. Lett. B 244 ( 1990)
551;
DELPHI Collab., P Abrcu et al., Z. Phys. C 56 ( 1992) 47;
L3 Collab., B. Adeva et al., Phys. Lett. B 241 ( 1990) 416;
L3 Collab., B. Adeva et al., Phys. Lett. B 271 ( 1991 ) 461;
OPAL Collab., M.Z. Akrawy et al., Phys. Lett. B 263 ( I99 I ) 311.
[ 151 ARGUS Collab., H. Albrecht et al., Z. Phys. C 57 (1993)
533;
ALEPH Collab., D. Buskulic et al., Phys. Lett. B 345 ( 1995)
103.
[ 161 CLEO Collab., R. Fulton et al., Phys. Rev. D 43 ( I99 I ) 65 I.
[ 171 OPAL Collab., R. Akers et al., Z. Phys. C 66 ( 1995) 19;
DELPHI Collab., P Abreu et al., Phys. J-ett. B 345 ( 1995)
598.
[4] OPAL Collab., R. Akers et al., Z. Phys. C 67 ( 1995) 57.
[5] C. Peterson, D. Schlatter, I. Schmitt and PM. Zenvas, Phys.
Rev. D 27 (1983) 105.
[ 181 E.J. Eichten, C.T. Hill and C. Quigg, Phys. Rev. Lett. 71
(1993) 4116.
[6] P Collins and T. Spiller, J. Phys. G I I ( 1985) 1289.
[7] V.G. Kartvelishvili, A.K. Likhoded and V.A. Petrov, Phys.
Lett. B 78 (1978) 615.
[8] B. Andersson, G. Gustafson and B. Siiderberg, Z. Phys. C
20 (1983) 317.
[ 191 DELPHI Collab., J? Abreu et al., B* Production in Z”
Decays, CERN-PPE/95-53;
L3 Collab., M. Acciarri et al., Phys. Lett. B 345 ( 1995) 589.
[20] B. Mele and P Nason, Phys. Lett. B 245 ( 1990) 635;
B. Mele and P Nason, Nucl. Phys. B 361 ( 1991) 626.
[2l] ARGUS Collab., H. Albrecht et al., Z. Phys. C 52 ( 1991)
353.
[9] OPAL Collab., K. Ahmet et al., Nucl. Instrum. Methods A [22] Particle Data Group, L. Montanet et al., Phys. Rev. D 50
305 (1991) 275; (1994).
PP. Allport et al., Nucl. Instrum. Methods A 324 (1993)
34; A 346 (1994) 476.
[ 231 L3 Collab., 0. Adriani et al., Phys. Lett. B 288 ( t 992) 412.
[24] DELPHI Collab., P Abreu et al., Z. Phys. C 57 ( 1993) 181.
[IO] OPAL Collab., G. Alexander et al., Z. Phys. C 52 ( 1991)
175.
[I I ] J. Allison et al., Nucl. Instrum. Methods A 317 ( 1992) 47.
[ 121 T. Sjostrand, Comp. Phys. Comm. 39 (1986) 347;
T. Sjostrand and M. Bengtsson, Comp. Phys. Comm. 43
(1987) 367.
[ 131 OPAL Collab., M.Z. Akrawy et al., Z. Phys. C 47 ( 1990)
505.
[ 141 OPAL Collab., PD. Acton et al., Phys. Lett. B 307 ( 1993)
247.