“a study of attitudes towards beer products in bangkok”240647/fulltext01.pdf · “a study of...
TRANSCRIPT

Master Thesis in Business Studies
(EFO705, 15 Credits) Date June 2nd, 2009
“A study of attitudes towards beer products in
Bangkok”
Tutor: Joakim Netz
Authors: Group 2297
830109: Nattakarn Ramasut 830625: Suteera Saranpattranon

Abstract
Date: 2009-06-02 Program: International Marketing Authors: Nattakarn Ramasut & Suteera Saranpattranon Title: A study of attitudes towards beer products in Bangkok Problem: What are attitudes towards beer of Thai consumers at different demographic characteristics? Purpose: The authors study different in demographic features affect consumer’s attitudes towards beer products. Due to attitudes are opinions or feeling and evaluation of knowledge towards the products. While demographic features play an important role in understanding the consumers’ need and influences to the consumers’ thinking. The result of this research will be truly helpful for marketer to adapt their strategy to response consumers’ need in different target group suitably. Method: The theories of demographic features and attitude components are chosen to study at different consumer groups towards beer products at 395 sample size in Bangkok. Conclusion: The diversifications of gender and income levels have different attitudes towards beer product. But at different age, occupation, and education have no different attitudes towards beer product. Recommendation: Manufacturers should focus on female as new target group and also adapt the product to the right requirement of consumer to persuade people to consume the product. Keywords: beer, demographic, attitude
Table of Contents
1. Introduction ...........................................................................................................................1 1.1 Background of beer market in Thailand ........................................................................................ 1 1.2 The current situation and beer market in Thailand ................................................................. 2 1.3 Problem statement and Research question.................................................................................. 4 1.4 Related researches .................................................................................................................................. 5 1.5 Purpose......................................................................................................................................................... 8 1.6 Target audience ........................................................................................................................................ 8 2. Theoretical Reviews .............................................................................................................9 2.1 Demographic.............................................................................................................................................. 9 2.2 Attitude.......................................................................................................................................................12 2.3 The conceptual framework model..................................................................................................14 3. Methodology ........................................................................................................................16 3.1 The choice of topic.................................................................................................................................16 3.2 The chosen theories ..............................................................................................................................16 3.3 Collecting data .........................................................................................................................................17 3.4 Sample design..........................................................................................................................................18 3.5 Questionnaire design............................................................................................................................19 3.6 Scope of research ...................................................................................................................................21 3.7 Validity and Reliability ........................................................................................................................22 3.8 Data analysis ............................................................................................................................................23 4. Analysis .................................................................................................................................24 4.1 Research results .....................................................................................................................................24 4.2 Demographic data of the respondents..........................................................................................24 4.3 Consuming habits of the respondents ..........................................................................................25 4.4 Attitudes of the respondents towards beer products ............................................................26 4.5 Measure reliability.................................................................................................................................30 4.6 Hypotheses test.......................................................................................................................................31 5. Discussion and Conclusion................................................................................................34
6. Recommendation ................................................................................................................39
7. References ............................................................................................................................40
8. Appendixes...........................................................................................................................44
Appendix 1: Questionnaire in English ................................................................................................44 Appendix 2: Questionnaire in Thai ......................................................................................................47 Appendix 3: Mean value of the respondents’ cognitive towards beer products with different background ...................................................................................................................................50 Appendix 4: Mean value of the respondents’ affective towards beer products with different background ...................................................................................................................................51 Appendix 5: Mean value of the respondents’ behavioral towards beer products with different background ...................................................................................................................................52

Appendix 6: Reliability analysis (Cronbach’s alpha) - Cognitive component....................53 Appendix 7: Reliability analysis (Cronbach’s alpha) - Affective component.....................53 Appendix 8: Reliability analysis (Cronbach’s alpha) - Behavioral component.................53 Appendix 9: T-test on mean difference between gender and three components of attitude...............................................................................................................................................................................54 Appendix 10: ANOVA test on mean difference between each age and three components of attitude...............................................................................................................................54 Appendix 11: ANOVA test on mean difference between occupations and three components of attitude...............................................................................................................................54 Appendix 12: ANOVA test on mean difference between income and three components of attitude..........................................................................................................................................................55 Appendix 13: Comparison Mean Difference of the respondents’ attitudes at different income ................................................................................................................................................................55 Appendix 14: One-way ANOVA on mean difference between education and three components of attitude...............................................................................................................................56
List of Tables Table 1: Situation of Thai beer industry in 2004-2008.............................................................. 3 Table 2: Summary the related researches on demographic features and consuming habits . 6 Table 3: Five point Likert Scale .................................................................................................. 19 Table 4: The structure of questionnaire .................................................................................... 20 Table 5: Personal data of the respondents in this survey ........................................................ 24 Table 6: Beer consuming behavior of the respondents in this survey ................................... 25 Table 7: Average scores of attitudes towards beer products with different background .... 27 Table 8: Conbach’s Alpha Test on three components of attitude towards beer products .... 31 Table 9: Comparison between this research and others in the demographic data of respondents ................................................................................................................................. 34 Table 10: Comparison between this research and other researches in the consuming habits data of respondents..................................................................................................................... 35 Table 11: Comparison between this research and other researches in overall attitudes towards beer products of the respondents ............................................................................... 36 Table 12: Comparison between different in demographic features and three components of attitude ......................................................................................................................................... 38 List of Figures Figure 1: Three components of attitude model (Wells & Prensky, 1996).............................. 13 Figure 2: A diagram of consistency of three components of attitude ..................................... 14 Figure 3: The conceptual model (The authors’ model)............................................................ 14

1
1. Introduction This part provides background and the current situation of beer market in Thailand.
Also, the problem statement, research questions, purpose, and target audience. This aims to
make the readers understand a comprehensive idea of this research. 1.1 Background of beer market in Thailand Since 1993 beer industry in Thailand was begun and has continually operated over 75 years ago. Before 1992, beer industry in Thailand was monopoly market characteristic which was occupied by only two beer manufacturers as Boon Rawd Brewery Co., Ltd. and Thai Amarit Brewery Co., Ltd. In addition, Thai government did not encourage in increasing of beer manufacturer because beer is a luxurious goods. Therefore, the tariff wall was set in order to protect the domestic beer manufacturers (Chumnanwej, 2001 and Wasrisrit, 2006). Theparwut (1998) said that at the beginning, the business in Thailand executed by Thai principle must be barely preserved for Thai citizenship as a holder. After Thai government campaigned on free market in 1992, the holder of the business was adapted to allow Thai corporation to be principle shareholder. Also, it is motivate foreign investors to invest in Thailand. At that time, there are two foreign beer companies interested in establishment beer plant in Thailand such as Thai Asia Pacific Brewery Co., Ltd. and Carlsberg Brewery (Thailand) Co., Ltd. Moreover, beer companies also get good opportunities to import its products easier (Thailand Development Research Institute, 2005). Since 1992, high competition in Thai beer market among the following large five domestic beer manufacturers group were happened; Boon Rawd Brewery Co., Ltd. produces Singha brand; Thai Amarit Brewery Co., Ltd. produces Kloster which was bought business by San Miguel in 2004; Carlsberg Brewery Co., Ltd. produces Carlsberg brand; Thai Beverage Public Co., Ltd. produces Chang brand and Thai Asia Pacific Brewery Co., Ltd. produces Heineken brand. Also, other brands were imported and brew pubs, for example, President Park Property Co., Ltd., Professional Food and Beverage Co., Ltd and so on (Thailand Development Research Institute, 2005).

2
In order to beat the competitor in the market, beer manufacturers were trying to differentiate their product. They had set pricing level different in each beer segment. According to Prasad (2004) and Pecotich & Shultz (2006) reported that Thai beer market has clearly segmented on the basis of pricing. It comprises of three consumption patterns: economy, standard and premium as follow; Premium refers to beer brands at the top end of the market with sales volume at approximately 6.8 percent of the total beer market (Positioning Magazine, 2007). The examples of the premium brands are Heineken, Asahi, San Miguel, and other imported brands. Premium beer is higher price than standard beer and economy beer at price 59-65 baht per 640 ml. (Prachachart, 2009). They target the consumers who have high income and want to be accepted by society (Wasrisrit, 2006). Standard refers to beer is focused on selling to consumers with average income. Mostly, it has an alcohol level more than premium beer but lower than economy beer at price 45-50 baht per 640 ml. (Wasrisrit 2006 and Prachachart 2009). Sale volume is only approximately 10 percent of the total Thai beer market. The examples of the standard brands are Singha, Tiger, and Chang lights (Positioning Magazine, 2007). Economy refers to beer is lowest price of all segments because it was produced by lower quality of material and higher an alcohol level than two segments above. It is focused on selling to consumers who want strongly alcohol level and have low income at price 35-40 baht per 640 ml. (Wasrisrit 2006 and Prachachart 2009). This category of beer represents 83.2 percent of the total beer market in the country. The examples of economy brands are Chang, Leo, and Archa (Positioning Magazine, 2007).
1.2 The current situation and beer market in Thailand With the domestic beer market value in Thailand continually increased of since 2004-2008 from 83,887 million baht to 115,000 million baht, which can attract more new comers enter to invest. As a result, Thai beer consumers have lots of choices and also it affects extremely competition in the market. The averages of beer production volume in Thailand were more than 2,000 million liters per year since 2006-2008 which increased from 1,600 million liters during 2004-2005. From the domestic demand for beer consumption increased and substituted for alcohol consumption because alcohol is higher

3
price (Chavasiri, 2008). Also, today Thai consumers prefer to drink low alcohol like beer (Pengsuwan, 2005). However, in 2007-2008 found that Thai beer industry tends to slightly decelerate from the change rate of the domestic market value from 5.3% to 3% and the production volume from 7.5% to -0.1% as shown in Table 1 below. With the result from higher living cost and political unrest were happened. As a result, people reduced unnecessary expenses like beer is luxurious goods (National Food Institute Thailand, 2008). Table 1: Situation of Thai beer industry in 2004-2008 Year 2004 2005 2006 2007 2008 Domestic Market Value 83,887 87,428 106,076 111,647 115,000 (Million baht) Chang Rate (%) 4.0 4.2 21.3 5.3 3.0 Production Volume 1,632 1,695 2,011 2,161 2,160 (Million liters) Chang Rate (%) 1.9 3.9 18.6 7.5 -0.1 Source: National Food Institute Thailand (2008) In addition, Siamturakij (2008) reported that the overall beer market has grown only 6 percent in 2007. There is only economy segment was grown while the growths of premium and standard segment has shrink 10 percent and 5 percent respectively. Therefore, trend of beer industry is expected to continually slow down because of the domestic economic crisis of Thailand. Thai beer consumers have more aware of impact from economic slowdown so they are concern about making their shopping. It cause purchasing powers reduced. Also, Thai beer consumers were changed from drinking at the restaurant or pub to buying from minimart to stay at home. As a result, beer manufacturers are trying to adapt their market strategies in order to response the consumers’ need, also to increase sales and market share. This is challenge to beer manufacturers as how they can adapt their marketing plan in the different target groups (Thannews, 2008).

4
1.3 Problem statement and Research question As the problems mentioned above, beer is seen as a luxurious goods along with the period of economic crisis in Thailand which will be an obstacle for beer manufacturers to successfully increase sales in Thai market. As a result, Thai consumers’ purchasing powers decreased. Therefore, beer manufacturers should focus on Thais’ consuming habits and attitudes towards beer products. According to Chavasiri (2008) stated that individual factors affect drinking beer of consumers. Understanding the consumers’ needs is important, marketers have to investigate and analyze consumer backgrounds and behaviors since these factors are influenced on their way of thinking, emotion, and decision making (Thach & Olson, 2004). Blackwell, Miniard & Engel (2006) supported that the effect of individual variables are important to understanding consumer behavior and developing marketing plans. Therefore, changing in demographic features such as nationality, age, religion, gender, occupation, marital status, income, region, ethnicity and education will affect individuals’ attitudes, lifestyles, purchasing behavior and motivation (Mowen & Minor, 2001, p.286). Attitudes include three components (cognitive, affective, and behavioral) which are not easy to change, the consumers are likely to buy the product when they have positive attitude so attitudes is an importance factor to be accurate predictor of consumer behavior (Well & Prensky, 1996). In addition, Limrat (1998) studied consumers’ attitudes towards beer image because the relationship of beer image affects consumers’ purchasing decision. This study found that different in gender, age, education, and income affect consumers’ attitudes towards image of beer image. This study made deeper understanding the consumers’ thinking, feeling, and opinion. Therefore, the authors will study beer consumers’ attitude towards beer products at individual features in order to a better understanding about opinion and need towards beer product of Thai consumers. The research question and strategic question are formulated as follow; Research question: “What are attitudes towards beer of Thai consumers at different
demographic features?” Strategic question is: “How can marketers adapt the marketing plan to the right
target group?”

5
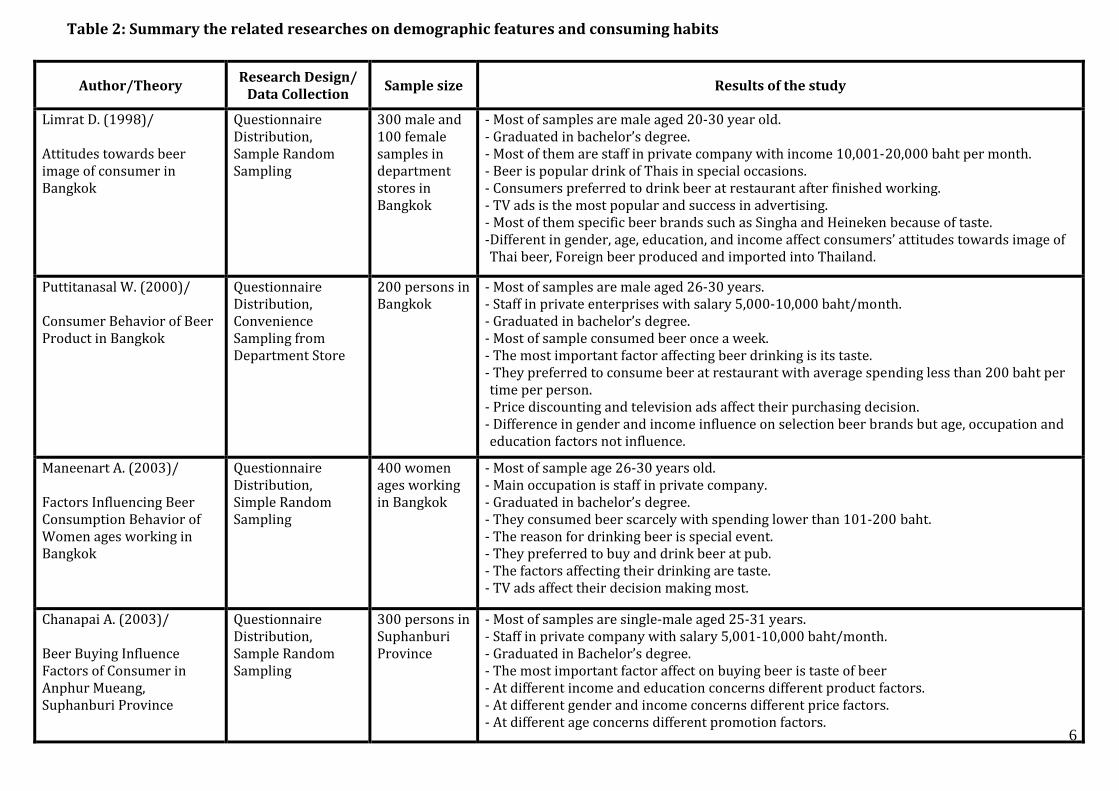
1.4 Related researches There are some previous researches carried out about beer products or related this research. This found that these researches will be basic of this research in order to give the clear idea about the topic that the authors have been concluded as Table 2. The studies from all researchers in Table 2 show the difference of demographic features of beer consumers were analyzed to study behaviors and attitudes towards beer products. Almost all consumers are male in Thai beer market. Main consumers are young (younger than 30). However, there some against result show that main consumers are older than 30. The consumers’ income in all researches is low at 5,000-10,000 baht (lower than 10,000 baht). These results show that main consumers are staff in private company. Lastly, the education of main consumers is high at bachelor’s degree (higher than high school). The majority of consuming frequencies are once a week. The most popular place to drink is the restaurant and buy is at restaurant and department store with spending not more than 400 baht per time. The main reason for consuming is special events. The most popular brands are Singha, Leo and Heineken because they prefer the taste of beer. TV ads are the most popular. In addition, the results of these previous researches show that different in gender, age, income, education, and occupation affects consumers’ behavior and attitudes. However, there are some contradict results show that different in gender, education, and income not affects. From these studies below, it is the study of attitudes and behaviors of beer consumers by analysis the personal characteristics of personal and the general beer consuming behavior. Therefore, it can be concluded that difference in demographic features results in difference in attitudes and consuming behavior of beer consumers.
6
Table 2: Summary the related researches on demographic features and consuming habits
Author/Theory Research Design/
Data Collection Sample size Results of the study Limrat D. (1998)/ Attitudes towards beer image of consumer in Bangkok
Questionnaire Distribution, Sample Random Sampling 300 male and 100 female samples in department stores in Bangkok
- Most of samples are male aged 20-30 year old. - Graduated in bachelor’s degree. - Most of them are staff in private company with income 10,001-20,000 baht per month. - Beer is popular drink of Thais in special occasions. - Consumers preferred to drink beer at restaurant after finished working. - TV ads is the most popular and success in advertising. - Most of them specific beer brands such as Singha and Heineken because of taste. -Different in gender, age, education, and income affect consumers’ attitudes towards image of Thai beer, Foreign beer produced and imported into Thailand. Puttitanasal W. (2000)/ Consumer Behavior of Beer Product in Bangkok Questionnaire Distribution, Convenience Sampling from Department Store
200 persons in Bangkok - Most of samples are male aged 26-30 years. - Staff in private enterprises with salary 5,000-10,000 baht/month. - Graduated in bachelor’s degree. - Most of sample consumed beer once a week. - The most important factor affecting beer drinking is its taste. - They preferred to consume beer at restaurant with average spending less than 200 baht per time per person. - Price discounting and television ads affect their purchasing decision. - Difference in gender and income influence on selection beer brands but age, occupation and education factors not influence. Maneenart A. (2003)/ Factors Influencing Beer Consumption Behavior of Women ages working in Bangkok Questionnaire Distribution, Simple Random Sampling
400 women ages working in Bangkok - Most of sample age 26-30 years old. - Main occupation is staff in private company. - Graduated in bachelor’s degree. - They consumed beer scarcely with spending lower than 101-200 baht. - The reason for drinking beer is special event. - They preferred to buy and drink beer at pub. - The factors affecting their drinking are taste. - TV ads affect their decision making most. Chanapai A. (2003)/ Beer Buying Influence Factors of Consumer in Anphur Mueang, Suphanburi Province Questionnaire Distribution, Sample Random Sampling
300 persons in Suphanburi Province - Most of samples are single-male aged 25-31 years. - Staff in private company with salary 5,001-10,000 baht/month. - Graduated in Bachelor’s degree. - The most important factor affect on buying beer is taste of beer - At different income and education concerns different product factors. - At different gender and income concerns different price factors. - At different age concerns different promotion factors.

7
Source: Developed for the research
Boonkoum A. (2005) / Consumers’ Behaviors And Factors Affecting Beer Selections At Restaurants in Amphur Mueang, Suphanburi
Questionnaire Distribution, Descriptive method 400 samples in Suphanburi Province - Most consumers are male aged 30-39 years old. - Graduated from primary school. - Main occupation is public officer. - The most favorite beer brand is Leo. - They consumed 4-5 times per month. - The average is 3 bottles per time per person with spending 301-400 baht. - The reason for choose the restaurant are reasonable price, serving car park area, and advertising on the TV. Choosil W., Nugdontree S., Dumri T., & Poonthong P. (2007)/ Consumption Behavior of Beer Consumer in Pitsanulok Area
Questionnaire Distribution, Simple Random Sampling 397 respondents in Pisanulok Province
- Main consumers are male 73.3 %. - Most of sample age 20-30 years old 45.09 %. - Main education level at bachelor’s degree 43.07 % - Main occupation is student 26.45 %. - Income is lower than 4,000 baht 25.44 %. - Consumers preferred to buy Singha because of taste. - They bought beer once a month and 1-3 bottles per time. - They preferred to buy beer with large packaging because of easy to find at store. - The factors affecting their purchasing selection are; Strongly satisfaction i.e. price, quality, and famous; Satisfaction i.e. socialization, taste, the variety of channel, and advertisement; and Neutral i.e. sale service. - Consumer behavior of male and female are not different. Sukklom P. (2007)/ Factors Influencing Beer Purchasing at Tesco Lotus in Bangkok Metropolitan Areas Questionnaire Distribution 400 customers who shop in liquor department at Tesco Lotus in Bangkok
- Majority of samples are single-male aged between 31-40 years old. - Graduated in bachelor’s degree. - They have occupation as private or public company employees - With monthly income of 10,000-20,000 baht. - Most of samples preferred drinking beer occasionally such as party and celebration. - Consumption frequency is once week. - They preferred to drink rely on taste and brand priority is Leo. - They often purchase beer at department store with a quantity of 2-3 cans or bottle per visit. Chavasiri T. (2008)/ Factors Affecting Consumer Demand for Beer in Hat Yai, Songkha Province Questionnaire Distribution 400 respondents live in Hat Yai - The genders of sample group are male more than female. - Most of them aged 18-25 year old while the least of them aged 50 year old up. - Their educations are most in bachelor’s degree level while the least are in master’s degree or higher level. - Most of them have income 5,001-10,000 baht per month. - They preferred to consume beer at home or private place because they could drink in high volume. - Most of them drink 1 big size bottle at once time. - The factors of gender, age, and education level have relationship to quantity of beer demand.

8
1.5 Purpose From the related researches above, the authors found that demographic factors affect beer consumers’ behaviors. Therefore, the purpose of this study is to explore attitudes towards beer products in different demographic features i.e. gender, age, education, occupation, and income. As they play an important role in understanding the consumer’ need and influences to the consumers’ thinking and opinion (Well & Prensky, 1996). In addition, the authors aim to study attitudes consist of three components (cognitive, affective, and behavioral). The reason the authors emphasize consumer’s attitudes because attitudes are opinions or feeling caused and evaluation of knowledge towards the products (Well & Prensky, 1996). Consumers’ attitude is easier to change than consumers’ belief. Besides, background characteristic is one of the factors which influence the behavioral process. Marketer must be interested in this process since they can launch marketing activity to cause the consumers to have positive cognitive (knowledge/beliefs), affective (feelings/emotions) toward their brand, and making decision to buy the product or behavioral (intention) (Wu, 2003, p. 37). This could provide deeper understanding of consumers’ need and opinion towards beer products in Thailand. The result of this research will be truly helpful for marketer to adapt their strategy in order to response consumers’ need in different target group suitably.
1.6 Target audience The outcome of this research can be beneficial for the exiting manufactures in beer market as well as new comers in the market, which are interested in understanding Thai beer consumers’ attitudes. This research will help them in adapting their marketing strategy to match with customers’ needs. In addition, the authors also believe that our Master thesis will be useful for academic audience such as scholars and marketing students who are interested in improving their knowledge about the chosen topic. This target group might find our work useful to deepen the familiarity with this issue, and use the paper as a starting point for further related studies.

9
2. Theoretical Reviews
This part presents the relevant theories aimed to give a theoretical background of
keywords; demographic and attitude. Therefore, the conceptual framework model uses to
be research’s analytical tools in the efficient way. 2.1 Demographic Demographics describe the characteristic of groups of people by studying their gender, age, marital status and so on (Evans, Jamal, & Foxall, 2006, p.106). Mowen & Minor (2oo1, p.286) stated that demographic features describe “the characteristics of
population which demographic variables have been used to identify by nationality, age,
gender, occupation, marital status, income, region, ethnicity and education in order to
study behavior patterns”. However, the demographic is consumer’s own personal variable which influences the decision making by assembling the choice to buy and to use the products and service (Blackwell, Miniard & Engal, 2006, p.236). In aspect of marketing view, change in these variables have influence consumers’ attitudes and buying patterns as the potential market segment possessing different needs for products and services (Mowen & Minor, 2001, p.286). Understanding the customers’ demographic is one of the efficient tools for marketer to response their specific requirement. Marketers can use demographic to build attitude toward their brand as “new experiences, new sensations, and new satisfactions” for customer in order to be different from other competitors in the market (Maxim, 1996, p.1). In accordance, Wells & Prensky (1996, p.130) claimed that demographic characteristic provide the stimulus toward the tangible and intangible change about the consumers’ way of think, feeling, and acting. Wells & Prensky (1996, p.187) stated that the background characteristic can influence attitude. Also, Wu (2003) supported that the demographics are consumer background characteristics, which is the way of individuals describe themselves. These characteristics are stable aspects of a consumer’s life that can be not changed. Therefore, it is combined the influence factors of attitude. The demographics in this report can be categorized as the following:

10
1. Gender is an individual factor that affects consuming beer. It will be variable in order to predict alcohol consumption behaviour (Putthangguranon, 2001). Men and women have different needs and wants. Many studies show that women differ from men in behavioural process. Staring with reading and viewing of media, response to the message they get, evaluating of products and services, and decision making (Wells & Prensky, 1996, pp. 134-135). Midanik et al. (1994, p.1221) reported the correlation between demographic and attitude toward beer consumption by investigating Americans. They found that gender influence the frequency of beer drinking. Men drink more than women per week. Moreover, Suggs (1996) reported, in Botswana men and women have difference way of drinking attitude. Men believe that drinking is the right associated with their gender while women believe that drinking is privilege they must earn. Today women make or greatly influence most purchasing decisions. Many companies need to concern their attitudes, for instance, the Westin hotel chain has developed strong marketing relationship with women by conveying respectful attitude in the restaurants by asking the women to taste wine (Peter & Olson, 2005, p.335). It can be implied gender correlate and influence attitude toward products or services. 2. Age is an individual factor that affects consumers’ purchasing decision and beer consumption behaviour (Dowdall & Wechsler, 2002). If the consumer’s age changes, the consumer’s behavioural process and purchasing decision are change too. Age can also be used to segment the market for special product and service (Wells & Prensky, 1996, p. 136). According to Blackwell, Miniard & Engal (2006, p.238), understanding consumers’ needs in marketing analysis is related to age. For instance, group between ages 25 and 34 prefer to drink standard domestic beer drinkers whereas 35 to 44 year-old choose light beer (Bennett, 2002, p.31). Older people drink more than younger people (Midanik et al., 1994, p.1221). 3. Income, at different income levels tends to have quite different behaviors, attitudes, and lifestyles (Peter & Olson, 2005, p.336). This factor influences the willingness to pay. Consumers are primarily segmented by personal income since it affects the customers’ confident to pay for luxury products. Personal income divides the market as upper (premium) market and lower market. This factor also related to the place they buy the product. Wells & Prensky (1996, p.151) claimed that income affects the types and brands of products which consumers can afford and are purchased. Moreover, personal income can help the marketer to select the appropriate media to

11
reach the targeted consumers (Evans, Jamal, & Foxall, 2006, p.125). The upper market consumers buy products at upscale shopping centres. In contrast, lower income consumers emphasize on “reasonable” price and discounts. (Blackwell, Miniard & Engal, 2006, p.258). 4. Education affects drinking beer which at different occupation make different in using alcoholic beverage, cigarette and drug (Dowdall & Wechsler, 2002). It also affects the choice alternative to purchase the product which consumer gathering during pre-purchasing process (Blackwell, Miniard & Engal, 2006, p.111). 5. Occupation affects beer buying decision of consumers (Putthangguranon, 2001). It can be predicted the nature of attitudes (McFayden, 1998). Besides, occupation and circumstances influence consumption patterns. For educational achievement is another variable that explain purchasing decisions and is closely associated with occupation and economic circumstance (Michman, Mazze & Greco 2003, p. 9). According to Wells & Prensky (1996, p.151) claimed that education and occupation might affect the consumer behavior process of evaluating and choosing of products. For instance, the working class will choose products based on function and comfort rather than what is trendy, also most of them will not take risks to try new products. These factors are related to personal income since both education and employment connected to one’s social class. Wells & Prensky (1996) referred to social class as one’s position in the social and economic structures of a society which is based on criteria of income, education and occupation. Level of education, occupation and income connected to social class that is useful to investigate consumers’ belief and behavior pattern (Peter & Olson, 2005, p.340). Michman, Mazze & Greco (2003, p. 9) mentioned it is better determinant to define social class than income, which should include education and occupation. Therefore, it can be implied in different social class (include income, education, and occupation) result in different consumers’ attitudes toward products or services. As mentioned above, gender, age, education, personal income, and employment status influence the attitude of drinking. These are the factors which consumers use to choose their beer preference to express their attitude in society (Bennett, 2002, p.31). Therefore, the more marketers understand the consumer demographics, the more they can build the attitude to their brand in order to response the specific requirements of consumers. In addition, Thach & Olson (2004) supported that it has made more sense to

12
target demographic population for starting of marketing plan to know the certain requirements. Mayers, Gore, & Liu (2008) cited that demographics of customer should be used to segment the market. Manufacturers can predict the different consumption and launch the new different products to serve the specific market niches.
2.2 Attitude What is attitude? According to Wells & Prensky (1996, p.313) attitude is an individual decision that is dependent on their feelings and opinions. In each day, consumers have hundred of decisions on activities such as what to wear, what to eat, where to study and so on. These decisions made based on feelings and opinions are called attitude. Individuals use attitude in many of ways to evaluate alternative base on their knowledge. Kotler et al. (1996, p.288) stated that attitudes are difficult to change so the marketer should try to offer its product fit to the exiting attitude rather than try to change attitude. In contrast, Blackwell, Miniard & E ngal (2006, p.397) mentioned that some attitude are keen to change but other are hard to change therefore, the marketer want the consumer stick to their brand in order to stand the competitive attack from the other rivals in the market. Consumer’s attitudes are opinions or feelings caused an evaluation of knowledge towards the products or services, they are likely to buy the product when they have positive attitude so attitudes are importance (Wells & Prensky, 1996, pp.313-314). Beside, Peter & Olson (2008, p.132) mention that consumers can have attitudes about physical and social objects (e.g. products, brands, model, people), and also about intangible objects (e.g. concepts, ideas, price). Some attitude concepts are defined in term of a particular behavior and situation context. According to Wells & Prensky (1996, pp.320-321) an attitude consist of three components as follows;

13
Figure 1: Three components of attitude model (Wells & Prensky, 1996)
• Cognitive is an individual belief about special attributes or overall object. Typically, the belief of object’s attributes and benefits its offers based on consumer’s own experiences and information that were gathered from marketers and other consumers’ product (Wells & Prensky, 1996, pp.320-321). Evans, Jamal, & Foxall (2006, p.67) mentioned that beliefs need not be correct or mismatch in reality. Many beliefs about attributes are evaluative in nature. The more positive each belief is easier for the individual to retrieve or recall the beliefs. The cognitive component would occur only in very high-involvement purchase situations as consumers have been deliberate evaluated through attitudes (Wells & Prensky, 1996, pp.320-321). • Affective is an individual’s feelings or emotions towards an object as evaluation of the product in positive or negative way (Evans, Jamal, & Foxall, 2006, p.67). Since products are evaluated in the context of a specific situation as a consumer’s affective response to a product may change as the situation changes. For example, a consumer may believe that Diet Coke had caffeine, which caffeine will keep them awake. It could be positive feeling if they need it, or, negative feeling if not. Individuals differ in their affective reactions to product characteristics. The same individuals will different react to the same attributes or outcomes in different situations due to unique motivation and personalities, past experience, and reference group (Wells & Prensky, 1996, pp.320-321). • Behavioral is one’s of tendency to respond in a certain manner toward an object. The decisions to purchase or not purchase, to recommend to friends would occur in the behavioral component. An individual’s intention to act in some way before buying the product to satisfy their needs. However, Evans, Jamal, & Foxall (2006, p.68) supported

14
that this process is consist of how individual response based on what they belief (cognitive) and how they feel (affective) about the product.
Figure 2: A diagram of consistency of three components of attitude
(Wells & Prensky, 1996) According to Figure 2, all three attitude components tend to be consistent with each other. It means change in one attitude component affect to changes in the other components. This tendency is the basic for a significant amount of marketing strategy. As discussion above, the key factors of this report are ‘demographic and attitude’ in order to see how the individual factor influence the attitude toward beer products in Bangkok. Therefore, attitude component is needed to evaluate as the attitude process to see how well the product meet the consumers’ need and aspects. 2.3 The conceptual framework model
Figure 3: The conceptual model (The authors’ model) The authors will adopt the relevant theories for the conceptual framework model to match with the problem and purpose of this research. As Figure 3 illustrates the theories review can be summarized as the model that will be used in the research and will describe the interrelation between five demographic characteristics on consumers’ attitude components which consist of cognitive, affective, and behavioral.
15
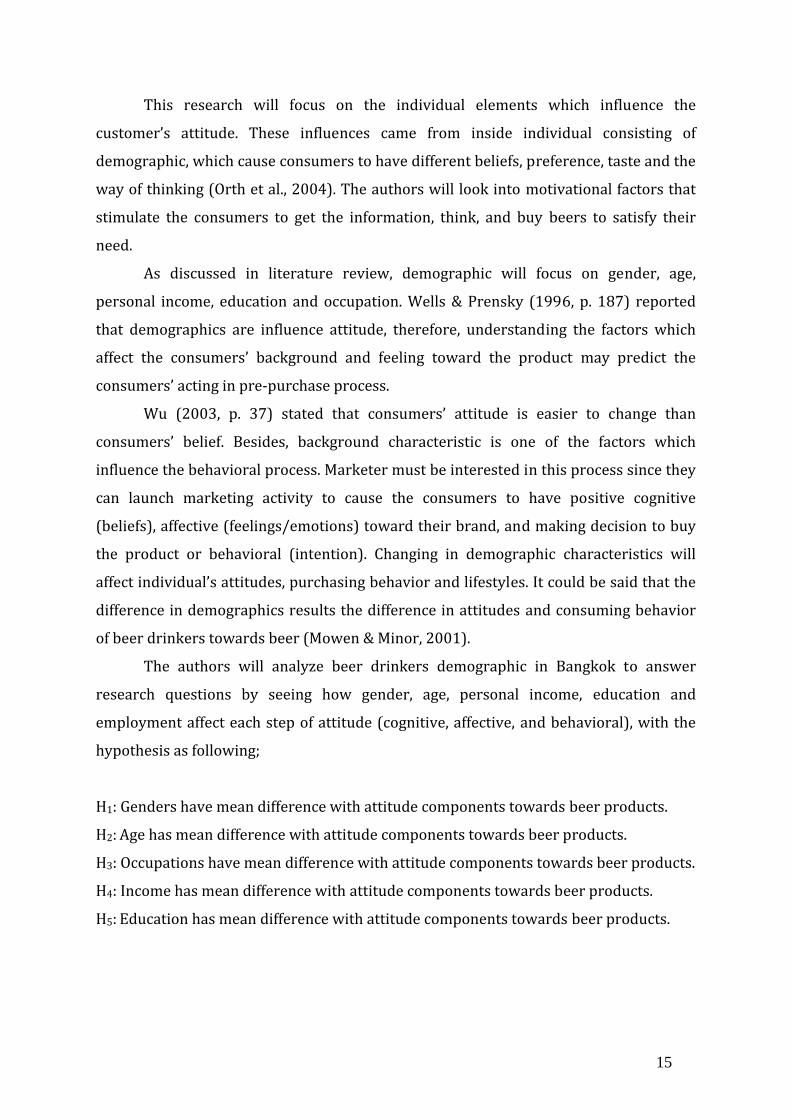
This research will focus on the individual elements which influence the customer’s attitude. These influences came from inside individual consisting of demographic, which cause consumers to have different beliefs, preference, taste and the way of thinking (Orth et al., 2004). The authors will look into motivational factors that stimulate the consumers to get the information, think, and buy beers to satisfy their need. As discussed in literature review, demographic will focus on gender, age, personal income, education and occupation. Wells & Prensky (1996, p. 187) reported that demographics are influence attitude, therefore, understanding the factors which affect the consumers’ background and feeling toward the product may predict the consumers’ acting in pre-purchase process. Wu (2003, p. 37) stated that consumers’ attitude is easier to change than consumers’ belief. Besides, background characteristic is one of the factors which influence the behavioral process. Marketer must be interested in this process since they can launch marketing activity to cause the consumers to have positive cognitive (beliefs), affective (feelings/emotions) toward their brand, and making decision to buy the product or behavioral (intention). Changing in demographic characteristics will affect individual’s attitudes, purchasing behavior and lifestyles. It could be said that the difference in demographics results the difference in attitudes and consuming behavior of beer drinkers towards beer (Mowen & Minor, 2001). The authors will analyze beer drinkers demographic in Bangkok to answer research questions by seeing how gender, age, personal income, education and employment affect each step of attitude (cognitive, affective, and behavioral), with the hypothesis as following; H1: Genders have mean difference with attitude components towards beer products. H2: Age has mean difference with attitude components towards beer products. H3: Occupations have mean difference with attitude components towards beer products. H4: Income has mean difference with attitude components towards beer products. H5: Education has mean difference with attitude components towards beer products.

16
3. Methodology
This part is description of how the whole research will be conducted. Firstly, it start
by giving a brief description of the topic followed the chosen theory and collecting data.
Finally, the analysis of information will be provided to the reader. 3.1 The choice of topic Peter & Olson (2008) suggest that the marketer need to know what the consumers think, feel, and action as well as what causes them to act in order to response their need. So the authors realized that understanding to consumers’ attitude is importance. Since the authors are Thai students and interested in the research about Thai consumers’ attitudes which is familiar to us and easier for us to understand. Therefore, the authors agreed to work on three components of attitude along with demographic features that influence the consumer’s purchasing and consuming of Thai consumers. At the later stage, the authors searched for more information about the problem in beer market and the rate of growth in Thailand. The authors found the literature researches have studied about the importance of demographic features that interrelates with consumer behaviors and attitudes beer products. Due to attitude is difficult to change and much influences the choice of consumer. If they have positive attitude toward the product thus they are likely to chose and purchase it (Wells & Prensky, 1996, pp.313-314). Also, if the marketers can deeper insight of its consumers thus they are able to issue the right strategies and target group to catch and maintain market share in the market. At this point, the authors came up with an idea to do the research on the topic which is about “attitudes towards beer of consumers at different demographic features”. 3.2 The chosen theories There are two main theories that the authors have chosen to study. Firstly, demographic is one of our aimed to be main study because there is some researched mentioned that consumer’s purchasing decision influenced by personal factors which are age, gender, occupation, personal income and education (Puttitanasal, 2000).
17
Moreover, demographic helps to locate and access to target market and different in demographic will affect to different attitudes (Peter & Olson, 2008). Secondly, attitude has been chosen to study to understand consumer’s belief, feeling and intention. Kotler et al. (1996) stated that attitude directly influence decision making. Moreover, attitudes serve as the bridge between consumer background features and the consumption that satisfies their needs (Wu, 2003). Attitudes consist of three components; cognitive, affect, and conation (Wells & Prensky, 1996, pp.320-321). At the later stage, the authors have created the conceptual framework model in order to develop the research and to answer the research question according to the relevant theories. 3.3 Collecting data In this research process, the data collection based on both primary and secondary data, with intent of gaining the most accurate information to fulfill the author’s purpose. The detail are describes as follow;
3.3.1 Primary Data In order to answer the research questions, the authors used the survey method so questionnaire would be the tool to collect data from samples group to provide us with quantitative data. The questionnaires were distributed and collected from May 1st to May 8th 2009. Self-administered survey has been used which questionnaire was left with the respondents and collected back once completed. Due to the authors are in Sweden so the authors will have our friends who live in Bangkok to distribute and collect questionnaire for us. The questionnaire was translated in Thai to facilitate respondent’s understanding and pilot-test before sending e-mail. The result return 470 forms but only 395 forms were completed by beer drinkers. The rest of them were five uncompleted and 70 forms were completed by non-beer drinkers.
3.3.2 Secondary Data The authors gathered the information from many available sources in order to support the research from university database, reliable internet sources, journals, electronics newspaper and text books which will be sufficient to study and analysis.

18
The authors have been searched the relevant researches from the existing articles and data through the university databases (e.g. Emerald, and ABI/Inform), reliable internet sources (e.g. National Food Institute Thailand, and Thai Development Research Institute), and electronic newspapers (e.g. Thannews and Siamturakij) that related to the topic of researches. The authors need to use these sources because some information is more up-to-date, particularly electronic newspaper, which is beneficial and support for our researched information. This would help the authors to understand well about trend and information for beer market in Thailand. Although, Fisher defined that internet source is very useful source of material (Fisher 2007, p.81) but the authors will be careful of inaccuracy of information that presented on internet as well. 3.4 Sample design This part describes the steps involved in sampling design process includes 2 steps; to define sample size and sampling frame.
3.4.1 Sample Size According to National statistical office of Thailand (2009), the population in Bangkok as of April 2009 is 6.86 million persons. Fisher (2007, p.189) stated that the size of sample depends on the size of margin of error and the size of population. The authors applied the sampling technique by accept 5% of margin of error in order to make our report more reliable. Therefore, the estimating sample survey result for population from 1-10 million is 384 samples with 5% margin of error. However, the authors would distribute 500 questionnaires to target respondents in order to collect data as the expected result.
3.4.2 Sampling Frame According to Fisher (2007, p.190) stated that the sampling frame is a list of the name and address of all people in the appropriate population. This could be an obstacle for the authors because limited of time to send all questionnaires via mailing service. Moreover, this research conducted questionnaire in five public places where difficult to know everyone. The questionnaires were distributed to 500 habitants in Bangkok with

19
different background. The authors have chosen five public places where selling beer to conduct questionnaire as follow; 1. Restaurant 2. Pub and Restaurant 3. Night club 4. Minimart (e.g. 7-eleven, 108 shop, family mart) 5. Supermarket (e.g. Big C, TOPs, Lotus, Carreful) Those five public places are located in two areas; Ekamai and Ratchada where have all those places with difference demographic features so that the results will be returned in variety of aspects. 3.5 Questionnaire design The questionnaire will be in Thai to collect data from Thais and translated to English. Three types of questionnaire had been applied as Fisher suggested (2007, pp.193-196); 1. Dichotomous question which is offer the respondent only two alternatives to choose between. This type has applied to the question of asking gender (Male/Female). 2. Multiple choice questions which is provide respondents with a choice of three to eight options and ask them to choose one. This type has applied to the questions of consuming habits and demographic data. 3. Likert scales which is a form of rating scale to measure respondents’ opinions and attitude. It is reliable and suitable for the study of attitudes which use rating scale with five choice answers as shown Table 3 below. This type has applied to the questions of three components of attitude. This question format will help respondents to issue their opinion: what do respondents think about beer products. Moreover, it is easy to compute this data in the SPSS which is widely used.
Table 3: Five point Likert Scale Strongly Agree Agree Neutral Disagree Strongly Disagree Questions 5 4 3 2 1 Source: Developed from Fisher (2007)

20
In addition, there is developed attitude score and attitude level from Fisher (2007, p.196) and Boonmee (2006) in order to be easier analyze. An average score got from statistic analysis will be used to compare with the defined meaning of the respondents’ attitudes level as below. The authors will be interested only high and very high. Scoring for each choice of Likert scale was defined the meaning as follow; 1.00-1.49 means Very low level of attitudes or opinions 1.50-2.49 means Low level of attitudes or opinions 2.50-3.49 means Fair level of attitudes or opinions 3.50-4.49 means High level of attitudes or opinions 4.50-5.00 means Very high level of attitudes or opinions The questions in questionnaire have developed from the relevant previous dissertations from Limrat (1998), Puttitanasal (2000), and Chavasiri (2008) in order to increase validity and reliability. The questions would be developed to relate to the research question so the content in questionnaire is designed with aiming to study attitudes towards beer products in different demographic features. The authors divided to three parts based on consuming habits, demographic features, and three components of attitude as shown in Table 4. Table 4: The structure of questionnaire
Questions Aiming Scale Technique
Part 1: Consuming habit No.1-6
This part used multiple choices to investigate consuming habits such as where to drink, where to buy, how much to spend, how often to drink, which brand to buy. Nominal Frequency, Mean Part 2: Three components of attitude towards beer products Cognitive component No.7-13
This part used rating scales with five choices answer to investigate consumer’s knowledge or belief towards beer products such as you drink beer because of….. Interval ANOVA

21
Affective component No.14-20 This part used rating scales with five choices to investigate consumer’s feeling or emotion about beer products such as in your opinion beer has…... Interval ANOVA
Behavioral component No.21-26 This part used rating scales with five choices to investigate consumer’s intention towards beer products such as you buy beer because of…… Interval ANOVA
Part 3: Demographics Data
No.27-31 This part used multiple choices and dichotomous question to identify the personal data of respondents. Nominal One-Way ANOVA, T-test Source: Developed for the research In the table there is indicated type of variable that the authors have used in order to interpret the data that will be explained in detail more in data analysis part. For example, Categorical (nominal level data) e.g. gender: male/female, and Continuous (interval level data) e.g. age or scores on the optimism scale (Pallant, 2001). The authors have created demographic part at last as suggested by Fisher (2007, p. 192) that people are more likely to answer the personal question if they have already invested time and effort in completing the rest of the questionnaire. The questionnaires have only three pages as stated by Fisher (2007, p.192) that for the master’s dissertation should keep as short as possible. 3.6 Scope of research Even though, beer markets widespread around the world but the authors will focuses on one country which is Thailand as our hometown. However, it needs far too much time to study the consumers’ attitudes in the whole country so the authors have scoped to study consumers’ attitude only in Bangkok, the capital city at five places from two areas as mentioned above. For the reason why the authors have chosen Bangkok because the previous research has studied that the urban area is the first place for company to introduce new product and campaign. Also urban area is concentration of income, consumption, prestige power, business and government activities (Onkvisit & Shaw, 1985). Therefore, there are many kinds of business have started here to response

22
the variety of consumer’s need and demand which is easier for the authors to study consumer’s attitudes to represent in the majority group in Thailand. With the limit of time, this research will be focused on the study of five demographic features such as gender, age, occupation, income and education. Moreover, it is not realistic to conduct interviews or administer questionnaires with a large number of the population so the sample group will be the representative of the whole population. The questions in questionnaire are adapted from other researches in the same field. In addition, the authors will analyze the difference of all demographic features but not analyze every relationship’s strength and direction which only important data will be analyzed. Lastly, some secondary data which found from internet are provided in Thai. There is a small risk of translation accuracy in interpretation.
3.7 Validity and Reliability The authors aim to increase validity and reliability for this research as follows; There is searching data by using information from database and reliable sources such as university database and textbook. The designing questionnaire is adopted questions from other scholars in the related researches such as Limrat (1998), Puttitanasal (2000), and Chavasiri (2008) to use in the questionnaires. The questionnaire is translated in Thai to reduce language barrier. In addition, the authors have conducted a pilot-test of 20 respondents before distributing in order to avoid misunderstand in translation. Cronbach’s Alpha test was used to verify the scale reliability of questionnaire in three components of attitude as well. The value of Cronbach’s alpha coefficient was used to assess the internal consistency of the scales. If a coefficient is greater than 0.7 was considered satisfactory as stated by Nunnally and Berstein (cited by Labarere et al., 2004). Therefore, only questions which guarantee an alpha value of more than 0.70 were selected. The data has been collected from the five potential public places where selling beer. The authors considered that it is highly valid according to get the result from potential target respondents. The questionnaires have returned 395 samples completed as mentioned by Fisher (2007, p.190) that population over one million, the sample size should be 384 respondents to represent an attitude of consumers.

23
3.8 Data analysis Since our purpose focus on investigate attitudes of beer drinkers. Once, data has been collected from target respondents, the authors would have to checked and sorted out uncompleted data as well as form that answered by non-beer drinkers. The authors expected to get back 384 forms from 500 distributions. The fact that, the authors have got 470 returned. Five uncompleted and 70 filled by non-beer drinkers; therefore, only 395 respondents are applicable. For variables in this research consists of; Independence Variable refers to personal data of samples (i.e. gender, age, income, occupation and education). Dependent variable refers to consumer’s attitudes of three components towards beer products. The research aims to study attitudes and demographic features towards beer products. Hence, data analysis was carried out using SPSS program, the effective program that would help to interpret data. SPSS, or, statistics package for social science, is the statistical program is used to analyzed and presented data in form of numbers, percentage and graph (Pallant, 2001). Therefore, SPSS analysis is applied using Independent Sample T-Test and One-Way analysis of variance (ANOVA) that would be suitable to analyze data for this research. T-test is suitable for testing quantitative data with quantitative data. It will be used to compare the mean scores of two different independent groups such as gender (male and female) (Pallant, 2001). In this research, T-test is used to test mean difference between gender and attitudes in (H1). ANOVA measures the effects of independent variables on dependent variable. It is used to compare the mean scores of more than two groups such as age, occupation, income, and education (Pallant, 2001). In this research, ANOVA is used to test mean difference between ages and attitudes in (H2), between occupations and attitudes in (H3), between income and attitudes in (H4), and between education and attitudes in (H5).

24
4. Analysis
This part consists of collected and analyzed data by dividing into four parts;
demographic data of the respondents, consuming habits of the respondents, and attitudes
of the respondents towards beer products. Lastly, hypotheses test.
4.1 Research results The questionnaires were distributed to 500 respondents from two areas at five places. The questionnaires were already returned 470 forms (94%) which there were 395 respondents (79%) who completed the questionnaire (beer consumers). The rest of 75 respondents (15%) are non beer consumers and uncompleted the questionnaire. According to, our purpose is to study only Thai beer drinkers so the questionnaires were screened and used for the further analysis in this research at 395 respondents. 4.2 Demographic data of the respondents This section consists of the personal data of the respondents are summarized in term of frequency and percentage in Table 5. Table 5: Personal data of the respondents in this survey
Demographic data Frequency Percent Gender Male Female 164231 41.5 58.5 Age 20 and younger 21-30 years old 31 and older 16918541 42.8 46.8 10.4 Occupation Self-employment Student Staff in Private company Government Officer Blue collar Unemployment Others
401051872414178
10.1 26.6 47.3 6.1 3.5 4.3 2.0 Income Lower 10,000&10,000baht 10,001-20,000 baht 20,001-30,000 baht Up 30,000 baht 631439594
15.9 36.2 24.1 23.8 Education Lower than High School High School Bachelor Degree Master Degree or higher 56148236
1.3 1.5 37.5 59.7 Source: Data analysis for the research

25
From the surveyed results, the respondents were mostly a female. The portions of gender are male 41.5% and female 58.5%. The majority of respondents answered were aged around 21-30 year-old (46.8%), and 20 and younger (42.8%). The smallest groups of respondents are in 31 and older at 10.4%. Most of the respondents’ occupation is an employee in private company (47.3%), following by student (26.6%), self-employment (10.1%), government officer (6.1%), unemployment (4.3%), blue collar (3.5%), and others (2%). The majority of respondents’ income is at 10,001-20,000 baht (36.2%), 20,001-30,000 baht (24.1%), 30,000 baht up (23.8%) and lower 10,000&10,000 baht (15.9%) consequently. Most of the respondents’ education in this survey is at master degree or higher (59.7%), following by bachelor degree (37.5%), high school (1.5%), and lower than high school (1.3%). 4.3 Consuming habits of the respondents This section consists of the respondents’ consuming habits characteristics are summarized in term of frequency and percentage in Table 6. Table 6: Beer consuming behavior of the respondents in this survey
Consuming behavior Frequency Percent Frequency of drinking Everyday A few times per week Once a week Once a month A few times a month Scarcely
9498166123672.3 12.4 20.5 16.7 31.1 17.0 Place to drink
Home Restaurant Pub & Restaurant Night Club 684819287
17.2 12.2 48.6 22.0 Place to buy Restaurant Pub & Restaurant Night Club Minimart Supermarket
4516889543911.4 42.5 22.5 13.7 9.9 Spending of drinking Less than 500 baht 500-1,000 baht More than 1,000 27710117 70.1 25.6 4.3

26
Brand choices Singha Leo Chang Heineken Other
7956291904120.0 14.2 7.3 48.1 10.4 Sources of information
Newspaper/MagazineDirect mail Radio broadcast Outdoor billboard Internet TV In store Friend/Family Others
523131922137431062
13.2 0.8 3.3 4.8 5.6 34.7 10.9 26.8 0.5 Source: Data analysis for the research From the surveyed results in Table 6, it can be summarized that most of the respondents often drink beer a few times a month (31.1%). Usually, they will both drink and buy beer at the same place at pub & restaurant (48.6%) and (42.5%) consequently. For their spending of drinking at once time, more than a half of the respondents are willing to pay less than 500 baht (70.1%). Beer brands were mostly a Heineken (48.1%). The majority of respondents were known beer products through TV (34.7%). 4.4 Attitudes of the respondents towards beer products This section describes the respondents with different demographic features who have different attitudes components towards beer products as shown in Table 7. Also, there is presents the mean value of three attitude components (cognitive, affective and behavioral) towards beer products as shown in Appendix 3, Appendix 4, and Appendix 5. The score were rated on five Likert scale and the meaning of average score was defined in the methodology part.

27
Table 7: Average scores of attitudes towards beer products with different background
Source: Data analysis for the research According to Table 7, the highlighted boxes have high average scores of attitudes towards beer products. Most of the respondents have high affective component (feeling/emotion) and behavioral component (intention) but fair cognitive component (knowledge/belief) towards beer products. Except, the group of others occupation have fair affective component. Males have higher affective component and behavioral component towards beer products but have lower cognitive component than females. The respondents at 20& younger has the lowest cognitive component, at 21-30 year-old has the highest behavioral component, and at 31 and older has the highest affective component towards beer products among others. Student has the lowest cognitive component towards beer products among others. The other occupations of respondents have the lowest affective component but have the highest behavioral component towards beer products among others. The respondents with income lower 10,000&10,000 baht have the lowest cognitive component and behavioral towards beer products among others, while one with 10,001-20,000 baht has the highest affective component among others. The respondents’ education with lower than high school have the lowest cognitive component but have the highest affective component and behavioral component towards beer products among others.
Three components of
attitude
Table Total
20 & younger
21-30 year-old
31 & older
Self-employ
ment Student
Staff in Private
Company
Government
Officer
Blue Collar
Unemployment
Others
Cognitive 3.33 3.30 3.35 3.36 3.33 3.25 3.36 3.38 3.45 3.38 3.33 Affective 3.66 3.66 3.65 3.70 3.75 3.61 3.65 3.79 3.55 3.84 3.45 Behavioral 4.00 3.93 4.03 3.87 4.04 3.89 3.99 3.95 4.01 4.05 4.21
Three components of
attitude Male Female
Lower 10,000&
10,000 baht
10,001-20,000
baht
20,001-30,000
baht
Up 30,000
baht
Lower than High
school
High school
Bachelor Degree
Master Degree or
higher Cognitive 3.24 3.40 3.05 3.38 3.44 3.33 3.09 3.19 3.33 3.34 Affective 3.76 3.58 3.71 3.75 3.55 3.60 3.89 3.45 3.69 3.64 Behavioral 4.06 3.91 3.79 4.01 3.95 4.07 4.40 3.56 3.97 3.98

28
According to Appendix 3, the respondents were asked for why they drink beer. There are seven reasons for them to give their knowledge or belief towards beer products. The mean value of questions; ‘I drink beer because of Social Activity/Special Event’ (4.14), and ‘….Taste’ (3.71) are agree. The mean value of questions; ‘I drink beer because of Brand’ (3.49), ‘….Availability’ (3.45), ‘…. Reasonable Price’ (3.11), ‘….Advertising’ (2.91), and ‘….Slogan’ (2.52) are neutral. The reason is the lowest at slogan. They do not agree that the reason for drinking beer is slogan. But they agree more that the reasons for drinking beer are social activity/special event and taste. The reason of social activity/special event is agreed most. Males have more agree with the reason of social activity/special event but lower agree with the reason of brand, taste, reasonable price, availability, advertising, and slogan than females. Aging 21-30 year-old has more agree with the reason of social activity/special event, brand, taste, and availability than at 20&younger and 31&older. At 20&younger has more agreeable with the reason of reasonable price than older ones. At 31&older has more agree with the reason of advertising and slogan than lower ones. Others occupation is agreed most with the reason of social activity/special event and availability among others. Unemployment is agreed most with the reason of brand among others. Blue collar is agreed most with the reason of taste, advertising, and slogan among others. Government officer is agreed most with the reason of reasonable price among others. At income 30,000 up baht has more agree with the reason of social activity/special event and taste than lower ones. At income 10,001-20,000 baht is agreed most with the reason of advertising and slogan among others. At income 20,001-30,000 baht is agree most with the reason of brand, reasonable price, and availability among others. At education lower than high school has more agree with the reason of availability, advertising, and slogan than higher ones. Education in master degree or higher has more agree with the reason of social activity/special event and brand than lower ones. Education in high school is agreed most with the reason of taste among others. Bachelor degree is agreed most with the reason of reasonable price among others.

29
According to Appendix 4, the respondents were asked for what do you think about beer. There are seven reasons for them to give their feeling or emotion toward beer products. The mean value of questions; ‘In my opinion beer has interesting promotion’ (3.78), ‘….good taste’ (3.76), ‘….available anywhere’ (3.71), ‘….available in the shop close to where I live’ (3.69), ‘….attractive packaging’ (3.61), ‘….a reasonable price’ (3.54), and ‘….variety kind of products’ (3.52) are agree. The respondents’ affective towards beer is high level. They agree that beer has an attractive packaging, variety kind of products, a reasonable price, and available in the shop close to they live but agree less that beer has a good taste, interesting promotion, and available anywhere. They have agreed most with the interesting promotion. Males have more agree that beer has a good taste, an attractive package, variety kinds of products, a reasonable price, available in the shop close to where I live, available anywhere, and interesting promotion than females. Aging 20&younger has more agree that beer has interesting promotion that older ones. At 21-30 year-old is agreed most that beer has a good taste and available in the shop close to where I live among others. At 31&older has more agree that beer has an attractive package, variety kinds of products, reasonable price, available anywhere than younger ones. Unemployment is agreed most that beer has a good taste, available in the shop close to where I live, and interesting promotion among others. Self-employment is agreed most that beer has an attractive package among others. Government officer is agreed most that beer has variety kinds of products, and a reasonable price among others. Blue collar is agreed most that beer has available anywhere among others. At income lower 10,000&10,000 baht has more agree that beer has variety kinds of products and interesting promotion than higher ones. At income 10,001-20,000 baht is agreed most that beer has a good taste, an attractive package, a reasonable price, and available in the shop close to where I live among others. At 30,000 baht up has more agree that beer available anywhere than lower ones. At education lower than high school has more agree that beer has a good taste, an attractive package, a reasonable price, available in the shop close to where I live and anywhere, and interesting promotion than higher ones. Education in high school is agreed most that beer has variety kinds of products among others.

30
According to Appendix 5, the respondents were asked for why they buy beer. There are six reasons fro them to give their intention toward beer products. The mean value of questions; ‘I buy beer because of Taste’ (4.21), ‘….Easy to find’ (4.01), ‘….Brand’ (3.97), ‘….Special Promotion’ (3.92), ‘….Cheap Price’ (3.88), and ‘….Advertisement’ (3.86) are agree. The respondents’ behavioral towards beer is high. They agree more that the reasons for buying beer are Taste, Brand, and Easy to find rather than cheap price, sale promotion, and advertisement. They have the highest agreed with taste of beer. Males have more agree with the reason of buying because of taste, brand, cheap price, special promotion, advertising, and easy to find than females. Aging 21-30 year-old is agreed most with the reason of buying because of taste, brand, cheap price, special promotion, advertising, and easy to find among others. Unemployment is agreed most with the reason of buying because of taste, and easy to find among others. Blue collar is agreed most with the reason of buying because of brand among others. Others occupation is agreed most with the reason of buying because of cheap price, special promotion, and advertising among others. At income 10,001-20,000 baht is agreed most with the reason of buying because of easy to find among others. At 30,000 baht up has more agree with the reason of buying because of cheap price, special promotion, and advertising than lower ones. However, both income 10,001-20,000 baht and 30,000 baht up are agreed most with the reason of buying because of brand among others. At income 20,001-30,000 baht is agrees most with the reason of taste among others. At education lower than high school has more agree with the reason of buying because of brand, cheap price, special promotion, advertising, and easy to find than higher ones. Education in high school is agreed most with the reason of buying beer because of taste among others.
4.5 Measure reliability The authors used Cronbach’s alpha to test the internal consistency reliable of the variables in each questions. Cronbach’s alpha coefficient above 0.7 is considered satisfactory as mentioned in the methodology part. According to Table 8, the value of Cronbach’s alpha of each question is above 0.7 which represents high internal

31
consistency of the scale used for measuring variables in each question. The detail of reliable test for each question is shown in Appendix 6, Appendix 7, and Appendix 8. Table 8: Conbach’s Alpha Test on three components of attitude towards beer
products Questions of an attitude
components Number of
items Cronbach's
alpha coefficient Cognitive (knowledge/belief) 7 0.729 Affect (feeling/emotion) 7 0.785 Behavioral (intention) 6 0.785 Source: Data analysis for the research 4.6 Hypotheses test This section presents the hypotheses testing (H1- H5) of different demographic data and three components of an attitude towards beer products in order to answer the research questions. Therefore, the authors aimed to analyze the differences of an attitude component with demographics features. One-Way ANOVA is used to test differences between in each variable. Except gender will be tested by Independent sample T-Test. If the results are different, to see which groups are different and how they are different, the ANOVA multiple comparison test is determined which the mean difference between different groups will indicate the significant difference. Also, the mean difference of Independent Sample T-Test will be provided as shown table in appendix.
H1 = Genders have mean difference with three components of an attitude towards
beer products. According to Appendix 9, the significance (2-tailed) of cognitive (0.002), affective
(0.000), and behavioral (0.009) on beer products is less than 0.05.The hypothesis (H1) is accepted. It means Genders have mean difference with three components of an attitude towards beer products. According to Table 7, the result shows that females (3.40) have higher cognitive components towards beer products than males (3.24). But males have higher affective component (3.76) and behavioral component (4.06) towards beer products than females (3.58) and (3.91) respectively. Therefore, it can be implied that males and females have different attitudes towards beer products.

32
H2= Age has mean difference with three components of an attitude towards beer
products. According to Appendix 10, the significance (2-tailed) of cognitive (0.606), affective
(0.867), and behavioral (0.146) on beer products between each age group is larger than 0.05. The hypothesis is rejected. There are no mean difference between age and three components of an attitude towards beer products. Therefore, it can be implied that the respondents at age group of 20-35 year-old have no different attitudes towards beer products. H3 = Occupations have mean difference with three components of an attitude
towards beer products. According to Appendix 11, the significance (2-tailed) of cognitive (0.539), affective (0.145), and conation (0.502) on beer products is higher than 0.05. The hypothesis is rejected. It means Occupation has no mean difference with three components of an attitude towards beer products. Therefore, it can be implied that the respondents’ occupation have no different attitudes towards beer products. H4 = Income has mean difference with three components of an attitude towards
beer products. According to Appendix 12, the significance (2-tailed) of cognitive (0.000), affective
(0.004), and conation (0.011) on beer products is lower than 0.05. The hypothesis is accepted. It means Income has mean difference with three components of an attitude towards beer products. Therefore, it can be implied that between each income period of the respondents have no different attitudes towards beer products. According to Appendix 13, the authors will analyze only the data that have different. At income level of the respondent between lower 10,000&10,000 baht and the group of 10,001-20,000 baht, 20,001-30,000 baht, and 30,000 baht up have different in cognitive component towards beer products at sig lower than 0.05. This mean difference of cognitive components between income lower 10,000&10,000 baht and the group of 10,001-20,000 baht, 20,001-30,000 baht, and 30,000 baht up is -.33046, -.38995, and -.27611 respectively. It means the respondents with income lower 10,000&10,000 baht have negative in cognitive components towards beer products more than higher ones.

33
At income level of the respondents between 10,001-20,000 baht and 20,001-30,000 baht have different in affective component towards beer product at sig. lower than 0.05. This mean difference of affective components between 10,001-20,000 baht and 20,001-30,000 baht up is .20564. It means the respondents with income 10,001-20,000 baht have positive in affective components towards beer products more than 20,001-30,000 baht. The respondents with income lower 10,000&10,000 baht and the group of 10,001-20,000 baht and 30,000 baht up have different in behavioral component towards beer product at sig. lower than 0.05. This mean difference of behavioral component between lower 10,000&10,000 baht and the group of 10,001-20,000 baht and 30,000 baht up is -.22096 and -.28611 respectively. It means the respondents with income lower 10,000&10,000 baht have negative in behavioral components towards beer products more than the group of 10,001-20,000 baht and 30,000 baht up. H5= Education has mean difference with three components of an attitude towards
beer products. According to Appendix 14, the significance (2-tailed) of cognitive (0.607), affective
(0.324), and conation (0.091) on beer products is more than 0.05. The hypothesis is rejected. It means Education has no mean difference with three components of an attitude towards beer products. Therefore, it can be implied that the education level of respondents have no different attitudes towards beer products.

34
5. Discussion and Conclusion
Discussion and conclusion divided into four parts; the demographic of respondents,
the consuming habits of respondents, the attitudes of respondents towards beer products,
and the demographic features and attitude components towards beer products.
Part 1: The demographic of respondents Total respondents are 395. The majority of respondents in this research are female and young. Most of them are staff in private company with high income at 10,001-20,000 baht. Most of them are graduated with high education at master degree or higher. The majority of respondents in other researches are male and young. Most of them are staff in private company with low income at 5,000-10,000 baht. Most of them are graduated with high education at bachelor degree. Therefore, the demographic results from this research only match with other researches in age and occupation. Gender, income, and education are different. The conclusion of similarities and differences in demographic results between this research and others are shown Table 9 below. Table 9: Comparison between this research and others in the demographic data of
respondents Gender Age Occupation Income Education
This research Female (Young)21-30 Staff in private company High High Limrat (1998) Male (Young) 20-30 Staff in private company High High Puttitanasal (2000) Male (Young) 26-30 Staff in private enterprises Low High Maneenart (2003) Female (Young) 26-30 Staff in private company - High Chanpai (2003) Male 25-31 Staff in private company Low High Boonkoum (2005) Male (Old) 30-39 Public officer - Low Choosil, Nugdontree, Dumri, & Poonthong (2007)
Male (Young) 20-30 Student Low High Sukklom (2007) Male (Old) 31-40 Private or Public employees High High Chavasiri (2008) Male (Young) 18-25 - Low High Source: Developed for the research

35
Part 2: The consuming habits of respondents In this research, the majority of respondents’ consuming frequency is a few times a month. Most of them are preferred to drink beer and buy beer at pub & restaurant with spending at less than 500 baht. The most popular brand is Heineken. TV is the most popular media. In other researches, the majority of respondents’ consuming frequency is once a week or 4-5 times per month. Most of them are preferred to drink beer at restaurant. The most popular place to buy is restaurant, pub and department store. Most of them have spending less than 400 baht per time. Most of them preferred to drink beer from three brands such as Singha, Leo, and Heineken. The most popular media is TV. Therefore, the consuming habits results from this research only match with other researches in spending, brand, and media. Frequencies, place to drink and buy are different. The conclusion of similarities and differences in consuming habits results between this research and others are shown Table 10 below. Table 10: Comparison between this research and other researches in the
consuming habits data of respondents
Frequency Place to drink
Place to buy
Spending Brand Media
This research A few times a month Pub & Restaurant Pub & Restaurant Less than 500 Heineken TV
Limrat (1998) - Restaurant - - Singha & Heineken TV Puttitanasal (2000)
Once a week Restaurant - Less than 200 - TV Maneenart (2003) Scarcely Pub Pub Lower than 101-200 - TV Chanpai (2003) - - - - - - Boonkoum (2005)
4-5 times per month Restaurant Restaurant 301-400 Leo TV Choosil, Nugdontree, Dumri, & Poonthong (2007)
Once a month - - - Singha - Sukklom (2007)
Once a week - Department store - Leo - Chavasiri (2008) - Home - - - - Source: Developed for the research

36
Part 3: Overall attitudes towards beer products This research aims to study beer consumers’ attitudes towards beer products. Even though many researchers investigated the attitude related to beer products. Cognitive, affective, and behavioral are the attitudes components which are less mentioned in other researches. Therefore, the authors will summarize the results by using attitude components as a tool as overall attitudes towards beer products. The conclusion of similarities and differences in overall attitudes towards beer products results between this research and others are shown Table 11 below. The majority of respondents in this research have high attitude agree towards the reason of drinking beer because of social activity/special event and taste of beer. The respondents in all other researches agree more that the most popular reason to drink beer is taste of beer. However, in the study of Limrat(1998), Maneenart(2003), and Sukklom(2007) have another reason of drinking beer which agree more that the most popular to drink beer is special occasion. The attitudes results from this research match with others in taste and special event are the reason for drinking beer. Most of them in this research have the highest attitude agree that beer has interesting promotion in their opinion. However, there are no mentioned this results from other researches. In this research, taste of beer is the highest attitudes agree with the reasons for buying beer of respondents. In the study of Chanpai(2003) agree that the most popular reason to buy beer is taste. Therefore, the attitudes result from this research match with other in taste of beer is the reason for buying beer. Table 11: Comparison between this research and other researches in overall
attitudes towards beer products of the respondents
Ovaerall attitudes towards beer products
This research - The reason for drinking beer because of social activity/special event and taste.- Most of respondents think that beer product has interesting and a good taste. - The reason for buying beer because of taste and easy to find.
Limrat (1998) - The reason for drinking beer because of special occasions. - They will specific brand when they drink beer because of taste.
Puttitanasal (2000) - The reason for drinking beer because of taste. Maneenart (2003) - The reason for drinking beer because of special event and taste. Chanpai (2003) - The reason for buying beer because of taste. Choosil, Nugdontree, Dumri, & Poonthong (2007)
- The reason for drinking beer because of taste. - The reason for buying beer with large packaging because of easy to find at store, also the other factors i.e. price, quality, and famous. Sukklom (2007) - The reason for drinking beer because of occasionally and taste. Source: Developed for the research

37
Part 4: The demographic features and attitude components towards beer products Men and Women have different attitude components towards beer products. Men have high positive affective component (feeling/emotion) and behavioral component (intention) towards beer products. Men feel or evaluate more than women towards beer products from a good taste, an attractive package, variety kinds of products, a reasonable price, available in the shop close to where I live, available anywhere, and interesting promotion. In addition, men agree more than women that they decide to buy beer from taste, brand, cheap price, special promotion, advertising, and easy to find. However, women have high positive cognitive component (knowledge/belief) towards beer products. Women agree more than men that they chose to drink beer from brand, taste, reasonable price, availability, advertising, and slogan. The respondents at different ages have no different attitude components towards beer products. The respondents with different occupations have no different attitude components towards beer products. The respondents with different incomes have different attitude components towards beer products. The respondents with income higher than 10,000 baht have high positive cognitive component (knowledge/belief) towards beer products. They agree more than income lower one that they drink beer because of social activity/special event, taste, brand, availability, advertising, and slogan. The respondents with income 10,001-20,000 baht have high positive affective component (feeling/emotion) towards beer products. They feel or evaluate more than income lower than 10,000 and higher than 20,000 baht towards beer products from a good taste, an attractive package, a reasonable price, and available in the shop close to where I live. In addition, the respondents with income 10,001-20,000 baht and 30,000 baht up have high positive behavioral component (intention) towards beer products. Both these income level agree same that they decide to buy beer from brand. The respondents with different educations have no different attitude components towards beer products. Therefore, the result from this study shows that at different gender and income have different attitudes towards beer products. According to the study of Limrat (1998), the respondents also have different gender and income affect consumers’ attitudes towards beer image. The study of Puttitanasal (2000), the respondents have different
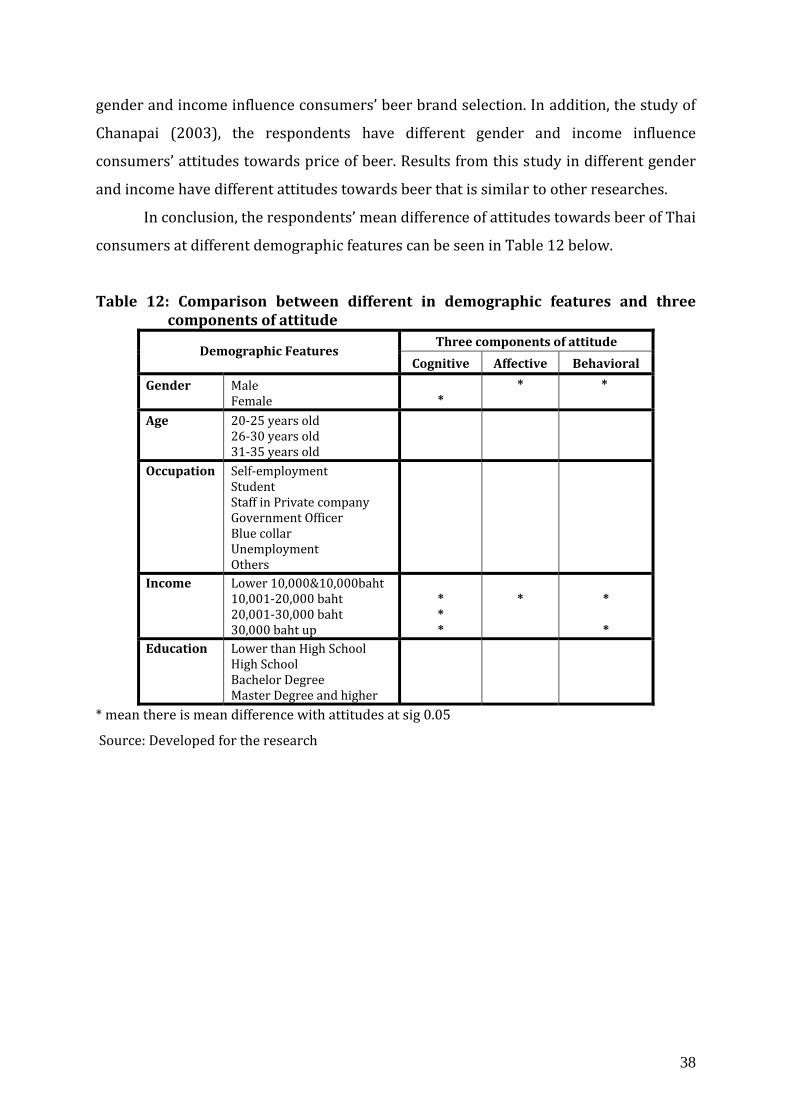
38
gender and income influence consumers’ beer brand selection. In addition, the study of Chanapai (2003), the respondents have different gender and income influence consumers’ attitudes towards price of beer. Results from this study in different gender and income have different attitudes towards beer that is similar to other researches. In conclusion, the respondents’ mean difference of attitudes towards beer of Thai consumers at different demographic features can be seen in Table 12 below. Table 12: Comparison between different in demographic features and three
components of attitude Three components of attitude
Demographic Features Cognitive Affective Behavioral
Gender
Male Female *
*
*
Age
20-25 years old 26-30 years old 31-35 years old
Occupation
Self-employment Student Staff in Private company Government Officer Blue collar Unemployment Others
Income
Lower 10,000&10,000baht 10,001-20,000 baht 20,001-30,000 baht 30,000 baht up * * *
*
* *
Education
Lower than High School High School Bachelor Degree Master Degree and higher
* mean there is mean difference with attitudes at sig 0.05 Source: Developed for the research

39
6. Recommendation From the result of our study Table 9 in discussion part has shown that the number of female respondents more than male if compare with the past. What makes female turn to drink more beer than ever? The result shows that most of respondents drink beer because social activity, special event and taste. And the most of respondents that the authors have mentioned in this study are FEMALE. Then the authors have an idea why beer producer not focusing on female group more. But to make it modernize beer should be the product for both sexes. Refer to our result, the authors would recommend beer producer to focus more on female as a new target group. Since nowadays women have more roles in the society. They have right and confident to think, decide or do more things. Beer producer should have not ignored this target group. Anyway, this study can not refer to the whole population in the country if in the future beer producer going to conduct the research with more amount of respondent it might cause the result to change from our recommendation here. Since most of respondents are age at 20– 30 year-old, beer producer should have understood what this age group like or dislike so that beer producer can adapt their product to the right requirement of consumers. So far this age group seems to have a lot social activities and special event so the producer should have concerned more about design of package how to make it nice and cool to attract consumers. Moreover, organize social activities or special event between beer producer and consumers also build a good relationship and to be well known among them. Taste also one main choice for them to purchasing then producer should study in depth to find out how does this consumer’s group like to taste. Anyhow, we would suggest producer not to ignore the rest group of consumers as well. As from the news, people trend has changed because of the economics crisis in the country that makes consumers consume less outside and preferred to buy a cheap one and drink at home. Hence, the further research should study more about which individual factor that really effect to their purchasing behavior.

40
7. References • Bennett, S. (2002). C-store issues: Who needs one?. NPN, National Petroleum News. Chicago: Volume 94, Issue: 10; pg. 30, 4 pgs. Retrieved May 18, 2009 from ABI/INFORM Global database. • Blackwell, R.D., Miniard, P.W, & Engel, J.F. (2006). Consumer Behavior. USA: Thomson South-Western. • Boonkoum, A. (2005). Consumers’ behaviors and factors affecting beer selections at
restaurants in Amphur Mueang, Suphanburi. Master Thesis. Kasetsart University. Retrieved July 28, 2009 from library of Faculty of Business Administration, Kasetsart University. • Boonmee, S. (2006). Beer buying influence factors of retailers in Ratchaburi province. Master Thesis. Kasetsart University. Retrieved August 01, 2009 from library of Faculty of Business Administration, Kasetsart University. • Chanapai, A. (2003). Beer buying influence factors of consumer in Amphur Mueang,
Suphanburi province. Master Thesis. Kasetsart University. Retrieved July 28, 2009 from library of Faculty of Economics, Kasetsart University. • Chavasiri, T. (2008). Factors affecting consumer demand for beer in Hat Yai, Songkhla
province. Master Thesis. Kasetsart University. Retrieved July 28, 2009 from library of Faculty of Economics, Kasetsart University. • Choosil, W., Nugdontree, S., Dumri T., & Poonthong, P. (2007). Consumption Behavior of
Beer Consumer in Pitsanulok Area. Bachelor Thesis. Retrieved July 30, 2009 from http://www.yimsiam.com/club/board/topicRead.asp?wbID=angthongcity&id=000091 • Chumnanwej, W. (2001). Factors influencing female consumers’ purchasing beer
decisions in Bangkok metropolitan areas. Master Thesis. Kasetsart University. Retrieved July 28, 2009 from library of Faculty of Economics, Kasetsart University. • Dowdall, G. & Wechsler, H. (2002). Studying college alcohol use: widening the lens,
sharpening the focus. Journal of studies on Alcohol/supplement no.14. Retrieved July 31, 2009 from www.collegedrinkingprevention.gov/supportingresearch/dowdall.aspx • Evans, M. & Jamal, A. & Foxall, G. (2006). Consumer Behaviour. Prentice Hall, New Jersey. • Fisher, C. (2007). Researching and Writing a Dissertation- a guide book for business
students. Essex: Pearson Education Limited.

41
• Food Intelligence Center (2008). Situation of Thai beer industry in 2004-2008, translated from National Food Institute Thailand 2008. Retrieved July 25, 2009 from http://fic.nfi.or.th/th/thaifood/product52-beverage.asp • Kotler, P., Armstrong, G., Saunders, J. & Wong, V. (1996). Principles of Marketing. European edition, Prentice Hall European, Hertfordshire. • Kasikorn Research Center (2007). Two beer brands launched marketing campaigns to
complete in 2007, translated from Positioning Magazine 2007. Retrieved May 08, 2009 from http://www.positioningmag.com/magazine/Details.aspx?id=63968 • Labarere, J., Fourny, M., Jean-Phillippe, V., & Marin-Pache, S. (2004). Refinement and
validation of a French on-patient experience questionnaire. International Journal of Health Care Quality Assurance. Retrieved May 03, 2009 from ABI/INFORM Global database. • Limrat, D. (1998). Attitudes towards beer image of consumer in Bangkok. Master Thesis. Dhurakij Pundit University. Retrieved July 20, 2009 from library of Faculty of Communication Atrs, Dhurakij Pundit University. • Maneenart, A. (2003). Factors influencing beer consumption behavior of women ages
working in Bangkok. Master Thesis. Kasetsart University. Retrieved July 28, 2009 from library of Faculty of Economics, Kasetsart University. • Maxim, L. (1996). In your face: You want attitude? Bad Frog & Skeleteens drip with it.
Beverage World. Issue: 1611. Retrieved May 18, 2009 from Emerald database. • McFayden, R. (1998). Attitudes toward the unemployed. Human Relations. New York: Volume 51, Issue: 2; pg. 179, 21 pgs. Retrieved May 18, 2009 from Emerald database. • Michman, A., Mazze, E., & Greco, A. (2003). Lifestyle marketing: reaching the new American
consumer. Greenwood Publishing Group: ISBN 1567206409, 9781567206401. Retrieved April 11, 2009 from ABI/INFORM Global database. • Midanik, L., Lorraine, T., Clark, A. & Walter, B. (1994). The demographic distribution
of US drinking patterns in 1990: Description and trends from 1984. American Journal of Public Health. Washington. Volume 84, Issue: 8, p.1218. Retrieved April 11, 2009 from ABI/INFORM Global database. • Mowen, J. & Minor, M. (2001). Consumer Behavior: A Framework. Prentice Hall, New Jersey. • Myers, H. Gore, J. & Liu, K. (2008). European shopping centre developments; an
industry perspective. Journal of place management and development. Volume 1,

42
Issue: 1, p.112. Retrieved May 14, 2009 from Emerald database. (Document ID: 1753-8335) • National Statistical office of Thailand (2009). Population Statistic. Retrieved April 18, 2009 from http://web.nso.go.th/ • Onkvisit, S. & Shaw, J. (1985). A view of marketing and advertising practices in Asia and
its meaning for marketing managers. Journal of consumer marketing. Volume 2, pp.5-17. Retrieved April 11, 2009 from ABI/INFORM Global database. • Orth, U., McDaniel, M., Shellhammer, T. & Lopetcharat, K. (2004). Promoting brand
benefits: the role of consumer psychographics and lifestyle. Journal of Consumer Marketing. Volume 21, no.2, p.97. Retrieved April 25, 2009 from www.emeraldinsight.com/0736-3761.htm • Pallant, J 2001, SPSS Survival Manual: A step by step guide to data analysis using SPSS
for Windows (Version 10), St. Edmundsbury Press, Australia. • Pecotich, A., Shultz, C. (2006), Handbook of Markets and Economies: East Asia,
Southeast Asia, Australia, and New Zealand. M.E. Sharpe, Inc., Armonk. • Pengsuwan, P. (2000). Marketing factor affecting beer purchasing decision in Pra
Nakorn Sri Ayutthaya province. Master Thesis. Kasetsart University. Retrieved July 28, 2009 from library of Faculty of Business Administration, Kasetsart University. • Peter, J. & Olson, J. (2008). Consumer Behavior and Marketing Strategy. 8th Ed, McGraw-Hill Companies, New York. • Prachachatturakij (2009). Singha launch new strategy to maintain market share, translated from Prachachatturakij online newspaper. Retrieved July 20, 2009 from http://www.prachachat.net/news_detail.php?newsid=2718 • Prasad, G. (2004). Beer wars spill over in Thailand. Retrieved April 11, 2009 from Emerald database. • Putthangguranon, R. (2001). Alcoholic beverage consumption behavior in Bangkok. Master Thesis. Kasetsart University. Retrieved July 28, 2009 from library of Faculty of Economics, Kasetsart University. • Puttitanasal, W. (2000). Consumer behavior of beer product in Bangkok. Master Thesis. Kasetsart University. Retrieved July 28, 2009 from library of Faculty of Economics, Kasetsart University.

43
• Siamturakij (2008). Beer Cheer penetrate into economy beer segment in 2008, translated from Siamturakij online newspaper. Retrieved May 08, 2009 from http://www.prachachat.net/news_detail.php?newsid=2718. • Sukklom, P. (2007). Factors influencing beer purchasing at Tesco Lotus in Bangkok
metropolitan. Master Thesis. Kasetsart University. Retrieved July 28, 2009 from library of Faculty of Economics, Kasetsart University. • Suggs, D. (1996). The Construction of Gender and the Consumption of Alcohol in
Botswana. American Ethnologist. Volume 23, no. 3, pp. 597-610. Retrieved May 22, 2009 from http://www.jstor.org/stable/646354 • Thach, E.C. & Olsen, J.E. (2004). The search for new wine consumers: Marketing focus
on consumer lifestyle or lifecycle. International Journal of Wine Marketing. Volume 16, no.3, pp. 44 – 57. Retrieved May 02, 2009 from Emerald database. • Thailand Development Research Institute. (2005). Protection development research
of alcoholic beverage. Bangkok: Thailand Development Research Institute. • Thannews (2008). Singha brand penetrate international market 2008, translated from Thannews online newspaper. Retrieved May 08, 2009 from http://www.thannews.th.com/detialnews.php?id=M3123281&issue=2328 • Theparwut, J. (1998). Market structure and competition behavior of Thai beer
industry. Self -research. Kasetsart University. Retrieved July 28, 2009 from Kasetsart University Library Center, Kasetsart University. • Warisrit, P. (2006). Market structure and factor affecting demand for beer in
Thailand. Master Thesis. Kasetsart University. Retrieved July 28, 2009 from library of Faculty of Economics, Kasetsart University. • Wells, W. & Prensky, D. (1996). Consumer Behavior. John Wiley & Sons, Inc, USA. • Wu, S. (2003). The relationship between consumer characteristics and attitude toward
online shopping. Marketing Intelligence & Planning: ISSN 0263-4503, P.37-44. Retrieved April 28, 2009 from http://www.emeraldinsight.com/0263-4503.htm

44
8. Appendixes
Appendix 1: Questionnaire in English
This questionnaire is used for a research entitled “Thai consumers’ attitude towards beer product in different demographic features”. It is done within a study program for Master’s Degree in International Marketing at Mälardalen University, Västerås, Sweden. The information provided by the consumer will be used for academic purposes only and will not be given to any other person, your answer are anonymous.
Please mark in front of the item of your choice.
Part 1: Consuming habits 1. How often do you drink? 1) Everyday 2) A few times per week 3) Once a week 4) Once a month 5) A few times a month 6) Scarcely 2. Where do you usually drink? 1) Home 2) Restaurant 3) Pub & restaurant 4) Night Club 5) Other………………………… 3. Where do you usually buy? 1) Minimart 2) Night club 3) Restaurant 4) Pub & Restaurant 5) Supermarket 6) Other………………………… 4. How much do you usually spend on drinking beer at once? 1) Less than 500 Baht 2) 501-1,000 Baht 3) More than 1,000 Baht 5. Which brand do you normally buy? 1) Singha 2) Leo 3) Chang 4) Heineken 5) Other (Please specific)………… 6. Which media do you know beer products? 1) News paper / Magazine 2) Direct mail 3) Radio broadcasts 4) Outdoor billboard 5) Internet 6) TV 7) In store 8) Friend/family

45
Part 2: Attitudes towards beer products
Please rate how much do you agree or disagree with the statements below by circle your
choice on the following scale.
Cognitive component (Knowledge/Belief)
I drink beer because of….. Strongly
Agree Agree Neutral Disagree
Strongly
Disagree7. Social activity/Special event 5 4 3 2 1 8. Brand 5 4 3 2 1 9. Taste 5 4 3 2 1 10. Reasonable Price 5 4 3 2 1 11. Availability 5 4 3 2 1 12. Advertising 5 4 3 2 1 13. Slogan 5 4 3 2 1
Affect component (Feeling/Emotion)
In my opinion beer….. Strongly
Agree Agree Neutral Disagree
Strongly
Disagree14. has a good taste 5 4 3 2 1 15. has an attractive packaging 5 4 3 2 1 16. has variety kind of products (e.g. packaging, degree, categories) 5 4 3 2 1 17. has a reasonable price 5 4 3 2 1 18. available in the shop close to where I live 5 4 3 2 1 19. available anywhere (e.g. restaurant, entertainment place) 5 4 3 2 1 20. has interesting in promotion 5 4 3 2 1

46
Conation component (Intention)
I buy beer because of…. Strongly
Agree Agree Neutral Disagree
Strongly
Disagree21. Taste 5 4 3 2 1 22. Brand 5 4 3 2 1 23. Cheap 5 4 3 2 1 24. Special promotion 5 4 3 2 1 25. Advertisement 5 4 3 2 1 26. Easy to find 5 4 3 2 1
Part 3: Demographic Data
27. Age 1) 20 and younger 2) 21-30 year-old 3) 31 and older 28. Gender 1) Male 2) Female 29. Occupation 1) Self-employment 2) Student 3) Staff in Private Company 4) Government Officer 5) Blue collar 6) Unemployment 7) Other………………………… 30. Personal Income 1) Lower 10,000&10,000 Baht 2) 10,001-20,000 Baht 3) 20,001-30,000 Baht 4) 30,000 Baht up 31. Education 1) Lower than high school 2) High school 3) Bachelor degree 4) Master Degree or higher
End of Questionnaire
Thank you very much for your cooperation
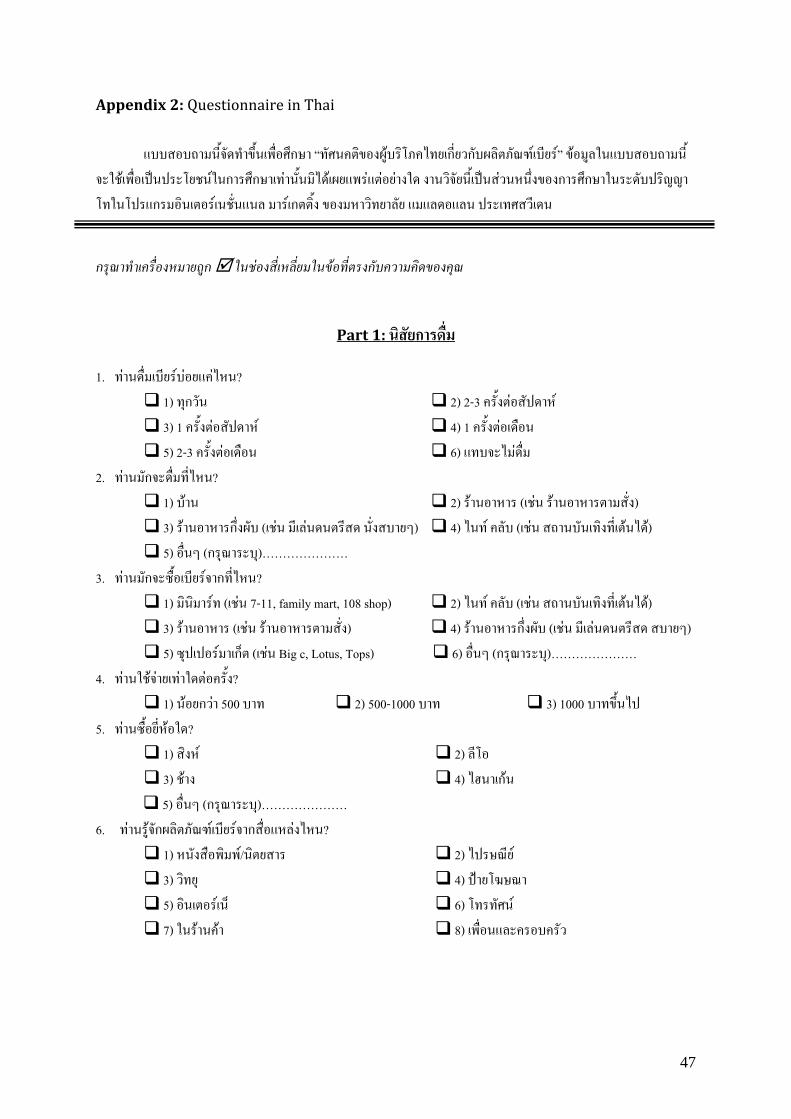
47
Appendix 2: Questionnaire in Thai แบบสอบถามนี้จัดทําขึ้นเพื่อศึกษา “ทัศนคติของผูบริโภคไทยเกี่ยวกับผลิตภัณฑเบียร” ขอมูลในแบบสอบถามนี้
จะใชเพื่อเปนประโยชนในการศึกษาเทานั้นมิไดเผยแพรแตอยางใด งานวิจัยนี้เปนสวนหนึ่งของการศึกษาในระดับปริญญาโทในโปรแกรมอินเตอรเนชั่นแนล มารเกตติ้ง ของมหาวิทยาลัย แมแลดอแลน ประเทศสวีเดน
กรุณาทําเครื่องหมายถูก ในชองสี่เหลี่ยมในขอที่ตรงกับความคิดของคุณ
Part 1: นิสัยการดื่ม
1. ทานดื่มเบียรบอยแคไหน? 1) ทุกวัน 2) 2-3 ครั้งตอสัปดาห 3) 1 ครั้งตอสัปดาห 4) 1 ครั้งตอเดือน 5) 2-3 ครั้งตอเดือน 6) แทบจะไมดื่ม
2. ทานมักจะดื่มที่ไหน? 1) บาน 2) รานอาหาร (เชน รานอาหารตามสั่ง) 3) รานอาหารกึ่งผับ (เชน มีเลนดนตรีสด นั่งสบายๆ) 4) ไนท คลับ (เชน สถานบันเทิงที่เตนได) 5) อื่นๆ (กรุณาระบุ)…………………
3. ทานมักจะซื้อเบียรจากที่ไหน? 1) มินิมารท (เชน 7-11, family mart, 108 shop) 2) ไนท คลับ (เชน สถานบันเทิงที่เตนได) 3) รานอาหาร (เชน รานอาหารตามสั่ง) 4) รานอาหารกึ่งผับ (เชน มีเลนดนตรีสด สบายๆ)
5) ซุปเปอรมาเก็ต (เชน Big c, Lotus, Tops) 6) อื่นๆ (กรุณาระบุ)………………… 4. ทานใชจายเทาใดตอครั้ง?
1) นอยกวา 500 บาท 2) 500-1000 บาท 3) 1000 บาทขึ้นไป 5. ทานซื้อยี่หอใด?
1) สิงห 2) ลีโอ 3) ชาง 4) ไฮนาเกน
5) อื่นๆ (กรุณาระบุ)………………… 6. ทานรูจักผลิตภัณฑเบียรจากสื่อแหลงไหน?
1) หนังสือพิมพ/นิตยสาร 2) ไปรษณีย 3) วิทยุ 4) ปายโฆษณา 5) อินเตอรเน็ 6) โทรทัศน 7) ในรานคา 8) เพื่อนและครอบครัว
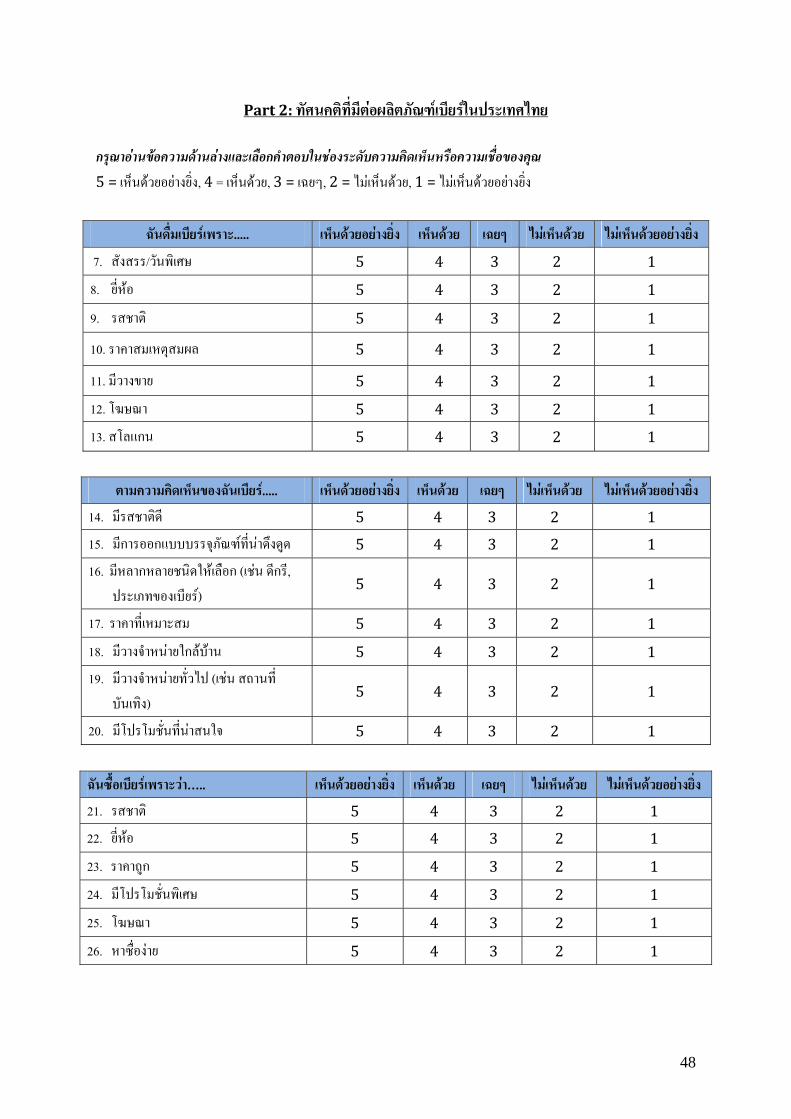
48
Part 2: ทัศนคติท่ีมีตอผลิตภัณฑเบียรในประเทศไทย
กรุณาอานขอความดานลางและเลือกคําตอบในชองระดับความคิดเห็นหรือความเชื่อของคุณ 5 = เห็นดวยอยางยิ่ง, 4 = เห็นดวย, 3 = เฉยๆ, 2 = ไมเห็นดวย, 1 = ไมเห็นดวยอยางยิ่ง
ฉันดื่มเบียรเพราะ..... เห็นดวยอยางยิ่ง เห็นดวย เฉยๆ ไมเห็นดวย ไมเห็นดวยอยางยิ่ง 7. สังสรร/วันพิเศษ 5 4 3 2 1 8. ยี่หอ 5 4 3 2 1 9. รสชาติ 5 4 3 2 1 10. ราคาสมเหตุสมผล 5 4 3 2 1 11. มีวางขาย 5 4 3 2 1 12. โฆษณา 5 4 3 2 1 13. สโลแกน 5 4 3 2 1
ตามความคิดเห็นของฉันเบียร..... เห็นดวยอยางยิ่ง เห็นดวย เฉยๆ ไมเห็นดวย ไมเห็นดวยอยางยิ่ง 14. มีรสชาติดี 5 4 3 2 1 15. มีการออกแบบบรรจุภัณฑที่นาดึงดูด 5 4 3 2 1 16. มีหลากหลายชนิดใหเลือก (เชน ดีกรี,
ประเภทของเบียร) 5 4 3 2 1 17. ราคาที่เหมาะสม 5 4 3 2 1 18. มีวางจําหนายใกลบาน 5 4 3 2 1 19. มีวางจําหนายทั่วไป (เชน สถานที่
บันเทิง) 5 4 3 2 1
20. มีโปรโมชั่นที่นาสนใจ 5 4 3 2 1
ฉันซื้อเบียรเพราะวา….. เห็นดวยอยางยิ่ง เห็นดวย เฉยๆ ไมเห็นดวย ไมเห็นดวยอยางยิ่ง 21. รสชาติ 5 4 3 2 1 22. ยี่หอ 5 4 3 2 1 23. ราคาถูก 5 4 3 2 1 24. มีโปรโมชั่นพิเศษ 5 4 3 2 1 25. โฆษณา 5 4 3 2 1 26. หาซื่องาย 5 4 3 2 1
49
Part 3: ขอมูลสวนตัว
27. อายุ 1) ตํ่ากวา 20 ป 2) 21-30 ป 3) สูงกวา 30 ป
28. เพศ 1) ชาย 2) หญิง
29. อาชีพ 1) ธุรกิจสวนตัว 2) นักเรียน/นักศึกษา 3) พนักงานบริษัทเอกชน 4) ขาราชการ 5) รับจางทั่วไป 6) วางงาน 7) อื่นๆ (กรุณาระบุ)...........................
30. รายได 1) ตํ่ากวา 10,000 และ 10,000 บาท 2) 10,001-20,000 บาท 3) 20,001-30,000 บาท 4) 30,000 บาทขึ้นไป
31. การศึกษา 1) ตํ่ากวามัธยมปลาย 2) มัธยมปลาย 3) ปริญญาตรี 4) ปริญญาโท หรือ สูงกวา
ขอขอบพระคุณสําหรับความรวมมือในการตอบแบบสอบถามคะ

50
Appendix 3: Mean value of the respondents’ cognitive towards beer products with different background
Cognitive (Knowledge/ Belief)
I drink beer because of…..
Social activity/ Special event
Brand TasteReasonable
price Availability Advertising Slogan
Gender Male Female 4.17 4.11 3.24 3.66 3.57 3.81 3.02 3.16 3.40 3.48 2.74 3.02 2.51 2.53 Age 20 & younger 21-30 year old 31 & older 4.06 4.22 4.10
3.47 3.50 3.49 3.63 3.79 3.68
3.20 3.06 2.93 3.45 3.49 3.24
2.87 2.89 3.15 2.43 2.51 2.95
Occupation Self-employment Student Staff in private company Government Officer Blue collar Unemployment Others
4.08 4.03 4.23 4.08 4.14 3.88 4.38
3.63 3.37 3.49 3.50 3.64 3.65 3.63
3.88 3.48 3.80 3.71 4.07 3.59 3.63
2.95 3.10 3.08 3.54 2.93 3.47 2.75
3.38 3.41 3.44 3.46 3.50 3.76 3.88
2.83 2.92 2.91 2.88 3.07 3.00 2.50
2.58 2.42 2.59 2.46 2.79 2.29 2.25 Income Lower 10,000 & 10,000 BHT 10,001-20,000 BHT 20,001-30,000 BHT 30,000 BHT Up
3.70 4.08 4.31 4.34 3.14 3.55 3.71 3.39
3.30 3.75 3.82 3.83 3.17 3.15 3.25 2.85
3.03 3.52 3.58 3.49 2.68 3.03 2.89 2.87
2.33 2.59 2.54 2.52 Education Lower than high school High school Bachelor degree Master degree or higher
3.00 3.83 4.13 4.17 3.20 3.33 3.47 3.51
2.80 3.83 3.73 3.72 2.00 3.17 3.23 3.05
3.60 3.00 3.38 3.50 3.60 2.67 2.86 2.92
3.40 2.50 2.49 2.52 Total 4.14 3.49 3.71 3.11 3.45 2.91 2.52 Source: Data analysis for the research
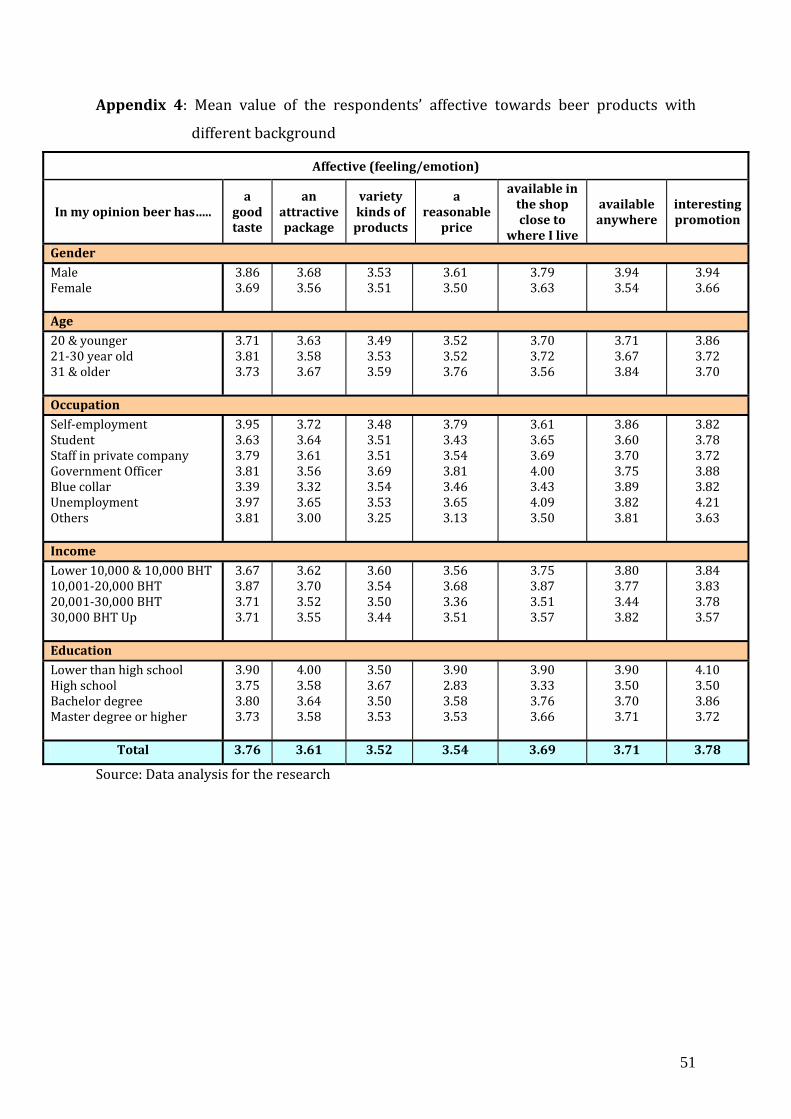
51
Appendix 4: Mean value of the respondents’ affective towards beer products with different background
Affective (feeling/emotion)
In my opinion beer has….. a
good taste
an attractive package
variety kinds of
products
a reasonable
price
available in the shop close to
where I live
available anywhere
interesting promotion
Gender Male Female 3.86 3.69 3.68 3.56 3.53 3.51 3.61 3.50 3.79 3.63 3.94 3.54 3.94 3.66 Age 20 & younger 21-30 year old 31 & older
3.71 3.81 3.73 3.63 3.58 3.67
3.49 3.53 3.59 3.52 3.52 3.76
3.70 3.72 3.56 3.71 3.67 3.84
3.86 3.72 3.70 Occupation Self-employment Student Staff in private company Government Officer Blue collar Unemployment Others
3.95 3.63 3.79 3.81 3.39 3.97 3.81
3.72 3.64 3.61 3.56 3.32 3.65 3.00
3.48 3.51 3.51 3.69 3.54 3.53 3.25
3.79 3.43 3.54 3.81 3.46 3.65 3.13
3.61 3.65 3.69 4.00 3.43 4.09 3.50
3.86 3.60 3.70 3.75 3.89 3.82 3.81
3.82 3.78 3.72 3.88 3.82 4.21 3.63 Income Lower 10,000 & 10,000 BHT 10,001-20,000 BHT 20,001-30,000 BHT 30,000 BHT Up
3.67 3.87 3.71 3.71 3.62 3.70 3.52 3.55
3.60 3.54 3.50 3.44 3.56 3.68 3.36 3.51
3.75 3.87 3.51 3.57 3.80 3.77 3.44 3.82
3.84 3.83 3.78 3.57 Education Lower than high school High school Bachelor degree Master degree or higher
3.90 3.75 3.80 3.73 4.00 3.58 3.64 3.58
3.50 3.67 3.50 3.53 3.90 2.83 3.58 3.53
3.90 3.33 3.76 3.66 3.90 3.50 3.70 3.71
4.10 3.50 3.86 3.72 Total 3.76 3.61 3.52 3.54 3.69 3.71 3.78 Source: Data analysis for the research

52
Appendix 5: Mean value of the respondents’ behavioral towards beer products with different background
Behavioral (intention)
I buy beer because of….. Taste Brand Cheap price
Special promotion
Advertising Easy to find
Gender Male Female 4.23 4.19 4.01 3.94 3.96 3.82 4.02 3.85 4.08 3.71 4.06 3.97 Age 20 & younger 21-30 year old 31 & older 4.16 4.27 4.10
3.88 4.05 3.98 3.88 3.89 3.80
3.86 3.99 3.88 3.80 3.94 3.80
4.02 4.05 3.76 Occupation Self-employment Student Staff in private company Government Officer Blue collar Unemployment Others
4.25 4.03 4.24 4.46 4.29 4.53 4.00
3.98 3.89 4.01 3.92 4.07 4.00 4.00
4.08 3.70 3.94 3.88 4.00 3.65 4.13
3.83 3.92 3.92 3.75 4.00 4.00 4.62
3.98 3.77 3.89 3.75 3.79 3.88 4.38
4.15 4.01 3.96 3.96 3.93 4.29 4.14 Income Lower 10,000 & 10,000 BHT 10,001-20,000 BHT 20,001-30,000 BHT 30,000 BHT Up
4.08 4.21 4.25 4.23 3.71 4.04 3.96 4.04
3.51 3.95 3.87 4.01 3.78 3.97 3.81 4.07
3.71 3.83 3.84 4.03 3.94 4.06 3.94 4.05
Education Lower than high school High school Bachelor degree Master degree or higher 4.60 4.67 4.21 4.18
4.20 3.00 3.94 4.01 4.20 3.17 3.93 3.85
4.60 3.67 3.86 3.95 4.20 3.17 3.87 3.87
4.60 3.67 3.97 4.03 Total 4.21 3.97 3.88 3.92 3.86 4.01 Source: Data analysis for the research

53
Appendix 6: Reliability analysis (Cronbach’s alpha) - Cognitive component Question
No. Items
Scale Mean if
Item Deleted
Scale Variance
if Item Deleted
Corrected Item-Total Correlation
Cronbach's Alpha if
Item Deleted 7 I drink beer because of Brand. 20.18 10.493 0.555 0.671 8 I drink beer because of Taste. 19.88 10.745 0.463 0.692 9 I drink beer because of Reasonable Price. 20.41 11.420 0.330 0.723 10 I drink beer because of Advertisings. 20.65 10.042 0.541 0.671 11 I drink beer because of Availability. 20.11 10.202 0.538 0.673 12 I drink beer because of Slogan. 21.08 10.527 0.444 0.697 13 I drink beer because of Social activity. 19.39 12.610 0.207 0.742 Source: Data analysis for the research
Appendix 7: Reliability analysis (Cronbach’s alpha) - Affective component
Question No.
Items
Scale Mean if
Item Deleted
Scale Variance
if Item Deleted
Corrected Item-Total Correlation
Cronbach's Alpha if
Item Deleted 14 I my opinion beer have a good taste. 21.05 6.941 0.444 0.769 15 I my opinion beer have an attractive package. 21.25 6.537 0.614 0.739 16 I my opinion beer have variety kinds of products (e.g. packaging, degree, categories). 21.34 7.275 0.377 0.780 17 I my opinion beer have a reasonable price. 21.33 6.450 0.632 0.735 18 I my opinion beer have available in the shop close to where I live. 21.03 6.485 0.573 0.745 19 I my opinion beer have available anywhere (e.g. restaurant, entrainment place). 21.08 6.481 0.476 0.765 20 I my opinion beer have interesting promotion. 21.20 6.295 0.488 0.765 Source: Data analysis for the research
Appendix 8: Reliability analysis (Cronbach’s alpha) - Behavioral component
Question No.
Items
Scale Mean if
Item Deleted
Scale Variance
if Item Deleted
Corrected Item-Total Correlation
Cronbach's Alpha if
Item Deleted 21 I buy beer because of taste. 16.95 9.918 0.389 0.787 22 I buy beer because of brand. 17.23 9.702 0.476 0.766 23 I buy beer because of cheap price. 17.61 9.143 0.534 0.753 24 I buy beer because of special promotion. 17.48 8.616 0.613 0.732 25 I buy beer because of advertisement. 17.68 9.024 0.584 0.740 26 I buy beer because of easy to find. 17.11 8.969 0.617 0.732 Source: Data analysis for the research

54
Appendix 9: T-test on mean difference between gender and three components of attitude
Source: Data analysis for the research Appendix 10: ANOVA test on mean difference between each age and three components of attitude
Sum of Squares
df Mean Square
F Sig. Between Groups .247 2 .124 .501 .606 Within Groups 96.688 392 .247 Cognitive (knowledge/belief) Total 96.935 394 Between Groups .064 2 .032 .143 .867 Within Groups 88.083 392 .225 Affective (feeling/emotion) Total 88.148 394 Between Groups .597 2 .590 1.932 .146 Within Groups 119.807 392 .306 Conation (intention) Total 120.988 394 Source: Data analysis for the research
Appendix 11: ANOVA test on mean difference between occupations and three components of attitude
Sum of Squares
df Mean Square
F Sig. Between Groups 1.244 6 .207 .841 .539 Within Groups 95.691 388 .245 Cognitive (knowledge/belief) Total 96.935 394 Between Groups 2.131 6 .355 1.602 .145 Within Groups 86.017 388 .222 Affective (feeling/emotion) Total 88.148 394 Between Groups 1.643 6 .274 .890 .502 Within Groups 119.345 388 .308 Conation (intention) Total 120.988 394 Source: Data analysis for the research
Levene's Test for Equality of
Variances t-test for Equality of Means
95% Confidence Interval of the Dif.
F Sig. t df Sig. (2-
tailed)
Mean Dif.
Std. Error
Dif. Lower UpperEqual variances assumed 6.308 .012 -3.193 393 .002 -.15985 .05007 -.25828 -.06141Cognitive (knowledge /belief) Equal variances not assumed -3.074 300.214 .002 -.15985 .05199 -.26216 -.05753Equal variances assumed .430 .512 3.810 393 .000 .18094 .04749 .08757 .27431Affective (feeling/ emotion) Equal variances not assumed 3.821 354.759 .000 .18094 .04735 .08781 .27407Equal variances assumed .343 .559 2.609 393 .009 .14654 .05617 .03610 .25697Behavioral (intention) Equal variances not assumed 2.644 366.985 .009 .14654 .05542 .03755 .25552

55
Appendix 12: ANOVA test on mean difference between income and three components of attitude Sum of
Squares df Mean
Square F Sig. Between Groups 6.453 3 2.151 9.295 .000 Within Groups 90.482 391 .231 Cognitive
(knowledge/belief) Total 96.935 394 Between Groups 2.966 3 .989 4.539 .004 Within Groups 85.181 391 .218 Affective (feeling/emotion) Total 88.148 394 Between Groups 3.375 3 1.125 3.740 .011 Within Groups 117.613 391 .301 Conation (intention) Total 120.988 394 Source: Data analysis for the research
Appendix 13: Comparison Mean Difference of the respondents’ attitudes at different income
Source: Data analysis for the research
95% Confidence Interval Dependent
Variable (I) Income (J) Income Mean
Dif.(I-J) Std.
Error Sig. Lower Bound
Upper Bound 10,001-20,000 BHT -.33046* .07307 .000 -.5261 -.134820,001-30,000 BHT -.38995* .07259 .000 -.5845 -.1954Lower 10,000 &10,000 BHT 30,000 BHT Up -.27611* .08675 .011 -.5075 -.044820,001-30,000 BHT -.05949 .05414 .852 -.2032 .084210,001-20,000 BHT 30,000 BHT Up .05435 .07203 .973 -.1375 .2462
Cognitive (knowledge/belief)
20,001-30,000 BHT 30,000 BHT Up .11384 .07154 .515 -.0768 .304510,001-20,000 BHT -.04213 .06502 .987 -.2161 .131820,001-30,000 BHT .16350 .06969 .117 -.0226 .3496Lower 10,000 &10,000 BHT 30,000 BHT Up .11287 .08000 .650 -.1004 .326120,001-30,000 BHT .20564* .05670 .002 .0550 .356310,001-20,000 BHT 30,000 BHT Up .15500 .06899 .146 -.0288 .3388
Affective (feeling/ emotion)
20,001-30,000 BHT 30,000 BHT Up -.05063 .07340 .983 -.2460 .144710,001-20,000 BHT -.22096* .08232 .049 -.4412 -.000720,001-30,000 BHT -.15725 .08955 .399 -.3964 .0818Lower 10,000 &10,000 BHT 30,000 BHT Up -.28611* .08910 .010 -.5240 -.048220,001-30,000 BHT .06371 .07311 .946 -.1306 .258010,001-20,000 BHT 30,000 BHT Up -.06514 .07256 .938 -.2580 .1277
Behavioral (intention)
20,001-30,000 BHT 30,000 BHT Up -.12885 .08067 .509 -.3434 .0857

56
Appendix 14: One-way ANOVA on mean difference between education and three components of attitude Sum of
Squares df Mean
Square F Sig. Between Groups .453 3 .151 .612 .607 Within Groups 96.482 391 .247 Cognitive
(knowledge/belief) Total 96.935 394 Between Groups .778 3 .259 1.161 .324 Within Groups 87.370 391 .223 Affective (feeling/emotion) Total 88.148 394 Between Groups 1.983 3 .661 2.172 .091 Within Groups 119.005 391 .304 Conation (intention) Total 120.988 394 Source: Data analysis for the research