a study of association between accounting manipulations
TRANSCRIPT

A Study of Association between
Accounting Manipulations and
Bankruptcy Likelihood
Analysis of 18 public companies from the United
Kingdom
Mariia Gusarova
Yaroslav Shevtsov
Bachelor’s thesis
November 2017
School of Business
Bachelor’s Degree Programme in International Business
brought to you by COREView metadata, citation and similar papers at core.ac.uk
provided by Theseus

2
Description
Author(s) Gusarova, Mariia Shevtsov, Yaroslav
Type of publication Bachelor’s thesis
Date November 2017
Language of publication: English
Number of pages 83
Permission for web publication: yes
Title of publication A Study of Association between Accounting Manipulations and Bankruptcy Likelihood Analysis of 18 public companies from the United Kingdom
Bachelor’s Degree Programme in International Business
Supervisor(s) Hundal, Shabnamjit Assigned by JAMK University of Applied Sciences
The primary objective of this research is to define whether there is any dependence of the probability of bankruptcy on the accounting manipulations. The researchers also tried to identify where the risk of the bankruptcy is coming from – from the market or a firm’s internal problems. In addition to that, the research aims to check whether the companies who poorly perform on the stock market are more likely to be manipulators.
The 18 companies from the United Kingdom have been analysed based on relationships between the Altman Z-score model, Beneish M-score model, beta and the standard deviation of the stock prices. The studied period is from 2010 to 2015.
The results show that the probability of bankruptcy does not depend on the accounting manipulations. The risk that causes the bankruptcy probability is coming from the company’s management rather than from the market. Whereas according to the findings, the more is the internal risks, the more is the extent of the accounting manipulations.
Researchers have also found, that the high-performing companies are less tend to manipulate than the well-performers and low-performers. No evidence found that the low-performing companies are more manipulative than well-performers. Finally, the findings suggest, that the retail industry is the most robust one regarding the likelihood of bankruptcy.
Keywords/tags (subjects) Accounting manipulations, bankruptcy, Beneish M-score, Altman Z-score, beta, standard deviation

3
Misccellanous 11 pages of Appendixes (pp. 91-102) with the calculations and excel spreadsheets with data from the companies’ reports.

4
Tables
Table 2.1 Research Related Models. Adapted from the Literature Review….27
Table 3.1 Types of sample companies............................................................30
Table 3.2 Beta coefficient interpretation. Adapted from Goyal, Joshi
(2012)………………………………………………………………………………..58
Table 4.1 The overall analysis of the ideas suggested by the 18 cases of
studied companies…………………………………………………………………81
Figures
Figure 1.1 Enron’s Stock Performance Fluctuation (Sergey Guriev 2013)…...7
Figure 1.2 Types of Risk in Finance (Akrani 2012)…………….………………24
Figure 3.1 Dunelm Group Plc market performance and FTSE100 fluctuation
(Google Finance 2017)...................................................................................33
Figure 3.2 WH Smith Plc market performance and FTSE100 fluctuation
(Google Finance 2017)...................................................................................34
Figure 3.3 Associated British Foods Plc market performance and FTSE100
fluctuation (Google Finance 2017).................................................................35
Figure 3.4 Cranswick Plc market performance and FTSE100 fluctuation
(Google Finance 2017)...................................................................................37
Figure 3.5 E2V Technologies Plc market performance and FTSE100
fluctuation (Google Finance 2017).................................................................38
Figure 3.6 Halma Plc market performance and FTSE100 fluctuation (Google
Finance 2017)................................................................................................39
Figure 3.7 Kingfisher Plc market performance and FTSE100 fluctuation
(Google Finance 2017)...................................................................................40
Figure 3.8 Marks & Spencer Plc market performance and FTSE100 fluctuation
(Google Finance 2017)...................................................................................41
Figure 3.9 Devro Plc market performance and FTSE100 fluctuation (Google
Finance 2017)................................................................................................42
Figure 3.10 Tate & Lyle Plc market performance and FTSE100 fluctuation
(Google Finance 2017)..................................................................................43
Figure 3.11 Univision Engineering Ltd market performance and FTSE100
fluctuation (Google Finance 2017)................................................................44

5
Figure 3.12 Spectris Plc market performance and FTSE100 fluctuation
(Google Finance 2017)...................................................................................45
Figure 3.13 Debnhams Plc market performance and FTSE100 fluctuation
(Google Finance 2017)...................................................................................46
Figure 3.14 Stanley Gibbons Plc market performance and FTSE100
fluctuation (Google Finance 2017).................................................................47
Figure 3.15 R. E. A. Holdings Plc market performance and FTSE100
fluctuation (Google Finance 2017).................................................................48
Figure 3.16 Premier Foods Plc market performance and FTSE100 fluctuation
(Google Finance 2017)...................................................................................49
Figure 3.17 Artilium Plc market performance and FTSE100 fluctuation (Google
Finance
2017)...............................................................................................................50
Figure 3.18 Oxford Instruments Plc market performance and FTSE100
fluctuation (Google Finance 2017).................................................................53
Figure 3.19. Beneish M-Score Indexes Formulas (Beneish 1999, 23)..........54
Figure 3.20. Beta Coefficient Formula (Obaidullah 2012)............................57
Figure 3.21. Variance and Standard Deviation formulas………………………59
Figure 4.1 Dunelm Group Plc Beneish M, Altman Z, Beta and Standard
Deviation curves fluctuation within 2010-2015………………………………….62
Figure 4.2 WH Smith Plc Beneish M, Altman Z, Beta and Standard Deviation
curves fluctuation within 2010-2015…………………………………………...…63
Figure 4.3 Associated British Food Plc Beneish M, Altman Z, Beta and
Standard Deviation curves fluctuation within 2010-2015………………………64
Figure 4.4 Cranswick Plc Beneish M, Altman Z, Beta and Standard Deviation
curves fluctuation within 2010-2015……………………………………………...65
Figure 4.5 E2V Technologies Plc Beneish M, Altman Z, Beta and Standard
Deviation curves fluctuation within 2010-2015………………………………….66
Figure 4.6 Halma Plc Beneish M, Altman Z, Beta and Standard Deviation
curves fluctuation within 2010-2015……………………………………………...67
Figure 4.7 Kingfisher Plc Beneish M, Altman Z, Beta and Standard Deviation
curves fluctuation within 2010-2015…………………………………………...…68

6
Figure 4.8 Marks & Spencer Plc Beneish M, Altman Z, Beta and Standard
Deviation curves fluctuation within 2010-2015……………………………….…69
Figure 4.9 Devro Plc Beneish M, Altman Z, Beta and Standard Deviation
curves fluctuation within 2010-2015……………………………………………..70
Figure 4.10 Tate & Lyle Plc Beneish M, Altman Z, Beta and Standard
Deviation curves fluctuation within 2010-2015………………………………….71
Figure 4.11 Univision Engineering Ltd Beneish M, Altman Z, Beta and
Standard Deviation curves fluctuation within 2010-2015………………………72
Figure 4.12 Spectris Plc Beneish M, Altman Z, Beta and Standard Deviation
curves fluctuation within 2010-2015……………………………………………...73
Figure 4.13 Debenhams Plc Beneish M, Altman Z, Beta and Standard
Deviation curves fluctuation within 2010-2015………………………………….74
Figure 4.14 Stanley Gibbons Plc Beneish M, Altman Z, Beta and Standard
Deviation curves fluctuation within 2010-2015………………………………….75
Figure 4.15 R.E.A. Holdings Plc Beneish M, Altman Z, Beta and Standard
Deviation curves fluctuation within 2010-2015………………………………….76
Figure 4.16 Premier Foods Plc Beneish M, Altman Z, Beta and Standard
Deviation curves fluctuation within 2010-2015………………………………….77
Figure 4.17 Artilium Plc Beneish M, Altman Z, Beta and Standard Deviation
curves fluctuation within 2010-2015……………………………………………...78
Figure 4.18 Oxford Instruments Plc Beneish M, Altman Z, Beta and Standard
Deviation curves fluctuation within 2010-2015………………………………….79

7
Contents
1 Introduction ................................................................................................. 9
1.1 Background .................................................................................................... 9
1.2 Relevance .................................................................................................... 10
1.3 Research questions and objectives ......................................................... 10
2 Literature review ....................................................................................... 11
2.1 Accounting manipulation: definition ......................................................... 14
2.1.1 Manipulation classification ................................................................. 14
2.1.2 Empirical studies on accounting manipulations .............................. 16
2.1.3 Beneish model ..................................................................................... 18
2.2 Bankruptcy ................................................................................................... 19
2.3 Risk and Risk Measurement Tools .......................................................... 22
2.4 Theoretical Framework Summary ............................................................ 27
3 Methodology ............................................................................................. 28
3.1 Research design ......................................................................................... 28
3.2 Data collection ............................................................................................. 29
3.3 Variables description calculation .............................................................. 53
4 Results ....................................................................................................... 61
4.1 Analysis by company .................................................................................. 62
4.2 Statistics Analysis ....................................................................................... 81
5 Discussion ................................................................................................. 83
5.1 Hypothesis development ........................................................................... 83
5.2 Main findings discussion ............................................................................ 84
5.3 Limitations of the research and suggested fields for studies ............... 86
6 Conclusion ................................................................................................ 87
References ..................................................... Ошибка! Закладка не определена. Appendices .................................................... Ошибка! Закладка не определена.
Appendix 1. Beneish M, Altman Z, Beta and Standard Deviation output
(Year-on-year basis) for each company in the sample.. Ошибка! Закладка не
определена.
Appendix 2. Input data for Beneish-M score calculations for each company
......................................................................... Ошибка! Закладка не определена.
Appendix 3. Input data for Altman Z-score calculations for each company
......................................................................... Ошибка! Закладка не определена.

8
Appendix 4. Descriptive statistics .............. Ошибка! Закладка не определена.
Appendix 5. Altman Z, Beneish M, Beta and Standard Deviation correlations
......................................................................... Ошибка! Закладка не определена.
Appendix 6. Model Summary. .................... Ошибка! Закладка не определена.
Appendix 7. Coefficients. ............................. Ошибка! Закладка не определена.

9
1 Introduction
1.1 Background
The idea for this research has been generated from the old story of the Enron
enterprise that had happened in 2001. The managers of Enron have managed
to create an image of an ultimate company, and their shares raised twice as
they had been in the beginning. However, in one year it was found that this
image had been a product of carefully fabricated accounts.
It has been found that the investor’s behaviour sometimes can be emotionally
driven. This factor may affect the cost of company’s capital and its stock
position on the market. Small and yet unprofitable firms that do not pay
dividends can be negatively affected by the emotional predisposition. (Baker,
Wurgler 2007, 6) On the other hand, the big multinationals are considered as
a less risky security.
As Nassim Taleb has stated in his works, these days, the society goes
through the time of high uncertainty. It means that things that might look
reliable right now can turn into the most dangerous and hopeless fields in two
days or less, just as it happened to a real estate market in 2008, for instance.
(2010, 20)
The primary hypothesis of the research is that any company can apply
accounting manipulations, even the eldest and robust. On the other hand,
small firms from the technology sector might use it to attract the investor’s
attention and raise funding. In any case, applying any manipulations means
that the management is hiding some company’s internal problems and this
can cause the insolvency of the company.
For example, directors are likely to channel their efforts to embrace debt
financing at a low cost, which is an excellent motivation for accounting
manipulations. (Dechhow, Sloan, Sweeney 1996) However, boosting the
share price by covering existing problems might lead to further financial
problems.
10
This research focuses on investigating relations between accounting
manipulations and the probability of bankruptcy and whether there are any. In
addition to this, the sources of risk will be studied in order to see the
dependence of riskiness of the company and the extent of accounting
manipulations.
1.2 Relevance
The work is first and foremost relevant to the existing academic literature. The
purpose of this research is an exploratory study, as its’ aim is to bring new
evidence on the empirical study of bankruptcy and assessing it from different
points of view, like a dependent on accounting manipulations, systematic and
unsystematic risk.
The main innovation of this work is that both of the problems, manipulations
and bankruptcy, have been well studied, but never analysed together. The
accounting manipulations have been investigated from the ethics point of view
and their causes, but not from the position of the riskiness of a financial asset
if it had been artificially changed.
The second application of the work is to try a new method for assessing the
financial health of a company. Even though there are many financial analysis
reviews on the company’s performance with advisory information on whether
to invest or not in the enterprise, it has been found, that the simple earnings
per share ratio is more accurate than their forecasts (Bradshaw, Drake, Myers
and Myers 2009, 16).
1.3 Research questions and objectives
The central question researchers seek an answer for in this work is whether
there is a dependence of bankruptcy on the accounting manipulations.
In order to answer it, the analysis of 18 public companies from the United
Kingdom is to be undertaken. The researchers will compare the fluctuations of
Altman Z-score and Beneish M-score: one is indicating the probability of
bankruptcy, and the other detects the extent of accounting manipulations.

11
The objective of the study is to find the correlation between Altman’s and
Beneish’s score. It is the central goal of this research. Other objectives and
questions are secondary, but ad to the overall understanding of the problem.
The second question concerns the nature of risks company is facing. Initially,
there are two types of risks – factors that the management cannot control
(systematic risk) and the internal problems of the company (unsystematic
risk).
1) What type of risk affects the probability of bankruptcy more, the market
risk or the internal company risk?
To answer this question, the researchers will introduce the beta and the
standard deviation of the company’s stock. The beta is a measure of the
market risk, and the standard deviation shows the overall volatility of the
stock. Consequently, the second objective of this research is identifying which
type of risk - systematic or unsystematic – affects the probability of insolvency
more.
This study also examines the behaviour of the Altman Z-score and the
Beneish M-score depending on the company’s stock performance.
2) The study aims at answering the question whether the low performing
companies are more likely to apply manipulations than the big and old
multinationals with high returns.
The research sample contains sorting by different types of companies to
answer this question. The objective is to detect that the low-performing
companies apply manipulations more often than the well-performers and high-
performers.
2 Literature review
Before the actual literature review is presented, the researchers would like to
introduce the inspirational base for this research. The real-life examples are
the fundamental basis of the idea of studying bankruptcy. There were huge
cases when the company’s risk could not be assessed due to the accounting
manipulations that were used to cover frauds.

12
When there is a stock that can provide an enormous return, investors
sometimes forget to assess risk (Bratton 2002, 2). The most famous case was
probably Enron’s bankruptcy in 2001.
Enron was providing energy and gas supplies in California. It seemed a
profitable business from the beginning. At its peak, the stock price has
reached $90; it was the seventh biggest American company by capitalisation.
People who were working for Enron were considered the smartest in the
world. Within one year the stock price has fallen to zero, and on 2nd of
December 2001, Enron became the most prominent bankruptcy in the history.
(Guriev 2013)
Figure 2.1 Enron’s Stock Performance Fluctuation (Guriev 2013)
The first thing that Enron was doing is putting on the balance sheet the profit
from deals that were supposed to happen in 20 years. Those deals were only
forecasted to bring a certain amount of profit, but, anyway, Enron was putting
them in. Such an action is called market-to market manipulation. The second
type of fraud was the structured finance. Enron has more than 800 offshore
companies that were carrying the financial debt of Enron because they did not
want to show their bank liabilities to shareholders. When the fraud was, the
world found out, that Enron had not had any profit but survived thanks to the
accounting manipulations. (Guriev 2013)

13
When the research on Enron case was undertaken, there was a typical
pattern identified: when the company becomes riskier, it loses links with
objective controls. (Bratton 2002, 77)
In the end, people, who suffered the most from Enron’s collapse, were
employees, who were not able to find a job anymore, and shareholders.
The case about Enron took place 16 years ago. After that, the laws to prevent
similar frauds accounting principles has become more strict. Nowadays, this
name is associated with corruption and fraud (Sims, Birkmann 2003, 244).
This case became the generalised example of big free-market companies
whose central principle is making a profit, even though it requires “cooking”
the books and lying to shareholders (Tracinski 2002).
However, the ethical question towards the Enron phenomenon still exists.
Public companies in their annual reports claim to have sustainable strategies
and deliver value to the shareholders, but is it so in reality? What if the reports
are faked, and the companies are overvalued? What if the risk associated with
them is more than financial analytics can calculate based on the public
information?
There was a study when a researcher tried to prove that the bankruptcy of
Enron has been predictable. Beneish’, Altman’ and some more theories have
been used to investigate bankruptcy predictability. The study showed that it
was possible to predict Enron’s failure using this technique, but financial
analytics assumed the phenomenon as impossible to be eroded (Tebogo
2011, 14).
Similar research with Altman Z and Beneish M has been undertaken when
studying suspicions company’s annual reports. The research aims to find the
correlation between Altman Z-score and Beneish-M score. Both indicators
show that the financial health of the corporation is not profound and the
earning management is occasionally (Bal, Rao, Raja 2013, 16).
In this chapter, the literature review on the components of the studied issue
will be presented. At the end of this chapter, the reader can find the detailed
theoretical framework which is going to be the core of this research.

14
2.1 Accounting manipulation: definition
Financial statement of a company is a document that provides information on
company’s financial position (balance sheet), its financial performance and
capabilities of the firm, which is crucial for decision making of various
stakeholders. According to International Accounting Standards Committee
(IASC), financial documentation in the annual report should consist of the
balance sheet, income statement, cash flow statement, statement of changes
in equity and relative notes to the statements. Except for its evident purpose
for the decision-making process, financial statements reflect the effectiveness
of an enterprise’s management. (Elliot and Elliot 2008, 22-23)
Financial statement of each public listed company is available online for
everyone nowadays. Nevertheless, it can be different from the natural
earnings of the firm. The reason is that at some point in time managers can
record additional current income by adding some value that is expected to
come in the next reporting period (Stein 1989, 567). It has been found, that
the earning announcement directly affects the share price of company’s stock
(O’Brien 1988, 56).
This issue is generally known as accounting manipulations.
The early definition of accounting manipulations says that it is a phenomenon
when the financial data can be increased or decreased depending on
individual’s will (Copeland 1968). Beneish himself defines accounting
manipulations as an example of managerial actions do beyond the Generally
Accepted Accounting Principles (GAAP) with an intention to present firm’s
financial indicators in a good light (1999). In order to understand the purpose
of accounting manipulations, there are some examples of them provided
below.
2.1.1 Manipulation classification
Stolowy and Breton have introduced the framework for classification of
manipulations. Their findings describe not only types of accounting
manipulations, but also various reasons for such actions. The researchers
would like to introduce some of the examples of “accounting cooking”. (1999)
15
Earning management is one of the types of manipulations, where managers
want to boost earnings in the future. The goal of these measures is to impress
the investor. (Degeorge, Patel, Zeckhauser 1999)
However, there is one more side of motivation for earnings management:
Scott has stated that managers take benefits from the asymmetry of
knowledge with shareholders. (1997)
Managers, whose incentives depends on the equity, can manipulate accruals
and accounts to represent lower or higher earnings of the company to benefit
from stock selling or purchase. It was also found, that there is a clear
relationship between the readability of the Annual report and earning
management extent. (Cheng, Warfield 2005)
Another empirical source claims that firms that have a complex structure of
their reports are likely to be manipulators. This effect arises from the fact that
any efforts to distort the information for the shareholder must have some solid
explanation. Such actions often create a cognitive dissonance between the
actual performance of the company and the reported results. (Lo, Ramos,
Rogo 2017 24)
Fudenberg and Tirole identify income smoothing as a way to manipulate with
earning timings or reports of revenue with an intention to make the profit
growth less variable (1995). In other words, income smoothing is a type of
manipulation, where managers tend to create a sense of steadily increasing
income.
The purpose of such an action is to ensure the market participants in a healthy
growth when the actual profit of the company is growing significantly. It also
perceived as a low-risk indicator (Stolowy, Breton 1999).
Another type of accounting manipulations is the “big bath accounting”. The
name of it speaks for itself. When a new CEO is coming to the company,
some previous savings from accounting manipulations and earnings are set to
be “cleaned” to be used for smoothing in the future. Moore suggests that there
could be following reasons for it: firstly, representing the low revenue leave a
place for historical growth for future comparison. Secondly, improved earnings
may be reported in next year. (Beneish 1973)

16
Sometimes, in the annual reports, one can find restated earnings. It is also
called earning recast or earning restatement. It is the act of disclosing
changed financial information (Investing Answers., 2017). It is a revision of
one or more financial statements for a previous fiscal year or several periods.
This method is applied when there has been an inaccuracy in calculations
found, correct accounting errors, frauds, non-compliance with GAAP
(Investopedia., 2017).
Such disclosure of financial inaccuracy summons suspiciousness in
shareholders’ minds. Mainly it is crucial for financial and managerial activities
of an enterprise. It has been calculated, that financial restatements between
1997 and 2002 have resulted in $200 billion in a market loss.
After 60 days since restatement, stock prices of restated companies have
fallen by 18 percent. It is proved, that when the company is coming up with its
restatements voluntary, it has a positive effect on company’s financial position.
(Pfaffer, Bartol, Khanin, Zhang 2008, 388)
Thus, one should keep in mind that earning restatement and earning
manipulation are different terms. Even though, manipulations are one of the
reasons for earning restatements.
2.1.2 Empirical studies on accounting manipulations
Undoubtedly, company’s governance is acting in the best interests of the
company, but one should consider the fact that such actions may cause
severe consequences for the company and stockholders’ wealth.
There is some empirical evidence on the correlation between company’s
financial health and earning management. There have been several studies
(Rosner 2003, Charitou 2007) undertaken to investigate the behaviour of low-
performing corporations and the way they are applying earning management.
It proves that struggling companies surprisingly tend to show the downstream
of their earnings.
The other existing suggestion is that managers want to emphasise a particular
event, for example, the stock performance. Berstresser and Philippon carried

17
out a substantial research in 2005 regarding the behaviour of CEOs and
earning management.
If the CEO holds companies’ stocks, he is more likely to apply manipulations.
It was proven by the fact that the accruals of the companies studied were
always high when CEOs were exercising options, selling and buying shares.
(Berstresser, Philippon 2005)
Nowadays, after the Enron’s scandal and economic collapse in the 1980s,
more attention than ever has been drawn on the corporate governance. The
first corporate governance code, UK’s Cadbury Report has emphasised the
function of independent board directors, audit committees, and others (Tricker
2012).
In 2002, it was suggested, that the lack of independence in company’s Board
of Directors may influence the management monitoring in a harmful way.
(Klein 2002)
The study undertaken after that in 2003 based on the financial statements
analysis and corporate governance statements have found no relationship
between the likelihood of manipulations and independence of Board of
Directors and audit committee. Instead, the presence of an independent
member with a financial background on the board affects the quality of reports
(Agrawal, Chadha 2003).
Nevertheless, in 2010, the majority of European investors have marked board
independence as the most crucial factor for corporate governance (Bloxham
2010). It has been under justified criticism, that independent directors do not
have such an in-depth knowledge of the nature of the company and may not
act in the best interest of the enterprise (Tricker, Mallin 2010).
However, one must also take into account the fact, that there are companies
that were claiming to have an independent Board of Directors but still were
judged for “aggressive” tax avoidance by channelling their profit through
offshore tax havens. (Tricker 2012)
In fact, there has been not too much of the research carried out in the field of
the dependence of bankruptcy on accounting manipulations. There has been

18
a study on the impact of earning management before the company is filing for
bankruptcy.
This research has confirmed that in case if the business is trying to emerge
from the Chapter 11 of the Bankruptcy code of United States (the company
that has fallen into Chapter 11 must prepare a reorganisation plan to keep
their business alive and pay all the debts. Companies usually seek relief in
Chapter 11. (United States Courts 2017)
Therefore, later on, the earning management comes into power, and it usually
represents decreased earnings. (Fisher, Gavious, Martel 2016)
2.1.3 Beneish model
The other concept which is going to be the core of the regression in this
research is the Beneish model. This model is a framework developed in 1999
with the primary purpose to identify the relationship between the probability of
financial manipulations and financial statement variables. Beneish has stated
that the most ”unreliable data”, those indicators that companies may facilitate
untypical increases in receivables, gross profit, asset quality, sales and
increasing accruals.
Further, based on the other models proposed earlier, Beneish has identified
eight variables that show the extent of financial manipulations. These are
Gross Margin Index, Days Sales in receivables Index, Sales General and
Administrative Expenses Index, Asset Quality Index. Also, Sales Growth
Index, Depreciation Index, Leverage Index and Total Accruals to Total Assets
Index are essential. (Beneish 1999)
The variables represent the extent of firms’ perspectives (the more
impoverished the future for the company, the more the probability of
manipulation), cash flow and accruals and management incentives. (Beneish
1999)
The interpretation of Beneish Model is rather simple: when eight variables are
calculated, those are combined altogether. If the M-score is higher than 2.22,
it means that company’s government is using accounting manipulations; if the
score is below -2.22, the likelihood of the fraud is less (Beneish 1999).

19
The limitation of Beneish’ theory is that there can be highly cautious
manipulators. Taking their data into account may jeopardise the whole
framework too.
2.2 Bankruptcy
Definition
The classic definition of bankruptcy is the inability to pay one’s debt (Merriam-
Webster.com 2017). In the United Kingdom, this term concerns only
individuals.
According to the Insolvency Act 1986, which is the same as United States’
chapters 7, 11 and 13, the company which cannot cover its debts before the
expiry date or whose assets are smaller than liabilities on the balance sheet is
called “insolvent”. (1986)
The primary goal of filing for insolvency is to maximise return to company’s
creditors (R3.org.uk., 2008) by the liquidation of company’s assets or by
comprising court actions against debtor’s assets (pwc.co.uk., 2009).
It is possible for the company to overcome insolvency. However, there is a risk
that the reputation among creditors will be damaged. Therefore that is why
declaring insolvency is the last available option for directors.
After the company had met the requirements to be called insolvent, the court
may impose obligations on the company’s directors to contribute creditors’
losses on the trading that took place after the insolvency. In this case, it will be
called “wrongful trading”. (Konstantinov 2015).
On the other hand, if directors of the company knew about the insolvency and
continued trading it will be considered as an intention to create a loss for the
creditors. In this case, it will be called “fraudulent trading”, and this is a
criminal offence.
Altman Z-Score
Bankruptcy prediction was always perceived as one of the most critical
problems for business decision-making (Kirkos 2012, 120). The pioneer in the
20
solution to this problem is Edward Altman, who has published his multivariate
approach in 1968 (Altman, Iwanicz-Drosdowska, Laitinen, Suvas 2014, 2).
He was analysing 53 bankrupt firms and 58 non-bankrupt. The calculations
done by Altman are based on the following input data: Working capital, Total
Assets, retained earnings (percentage of net income not paid as a dividend),
EBIT, the market value of equity, total liabilities and net sales. (Altman 1977).
All the components of the equation describe various creditability dimensions of
the company respectively: Liquidity, profitability, the productivity of assets,
market-based financial leverage and capital turnover. (Miller 2009)
In his study in 1968, Altman argues previous ways to assess the probability of
bankruptcy, because they were all based on some individual signals, like
specific financial ratios, for instance. His innovation was about introducing a
complex discriminant model that combines five financial ratios derived by
Altman and counting their comprehensive impact on the final indicator, the Z-
Score. (Altman 1968)
Altman’s model has inspired many other researchers to study the question of
bankruptcy prediction through some new and developed frameworks. First
and foremost, there were some limitations of the first Altman’s model (1968).
Initially, Altman-Z theory is not applicable to non-manufacturing companies
(Altman 2002). However, there has been a research undertaken by Miller that
has used Z-Score for all types of industries, excluding financial and
companies – insurance and banking and has come up with results that
represent the standard behaviour of Z-Score (2009).
Even though there were so many other studies arguing the efficiency of
Altman-Z or proving it less accurate, nowadays it is still one of the most
common tools for financial analysis (Misankova, Zvarikova, Kliestikova 2017,
109). Thus, authors of the research have chosen the Altman-Z Model as a
bankruptcy probability measure. First of all due to its pioneering nature and
secondly because Altman is still continually making researches based on this
model and this researches seem to prove model’s efficiency.
21
Empirical studies on bankruptcy prediction
Many theories describe the probability of bankruptcy. There is a controversy in
academic world on bankruptcy predictions – many of them evaluate different
models for bankruptcy predictions and share different results and opinions.
As it was already stated before, the Altman’s model belongs to the type of the
Multiple Discriminant Analysis (DMA) models, that was developed in response
to the traditional univariate models proposed between 1932-1966. (Siddiqui
2012, 2013)
Consequently, may researchers after Altman have been trying to assess the
accuracy, come up with their own models and compare them to Altman’s.
In 1999, Shumway was arguing against existing theories of bankruptcy
predictions. One of his arguments was that the variables most of them use are
unreliable, as researchers look at the data only one year before bankruptcy
has happened. Shumway has been comparing different models similar to
Altman-Z, and the results gathered with them. (Shumway 2001)
Using the Altman-Z model, he has found that firms that have higher earnings
relative to assets are unlikely to fail, companies with a small proportion of
liabilities but with a higher working capital are safe, but belong to the so-called
“grey area”. However, during his research, he has also developed his
framework for bankruptcy prediction by enabling some new variables. Those
are the firm’s size comparing to the market, the standard deviation of firm’s
stock return and the time dimension. (Shumway 2001)
Shumway’s suggestion that Altman-Z had been imperfect and could have
presented biased results was supported later.
Based on the Shumway comparison of Altman and Zmijewski model in 2002,
another study has proved that Altman-Z score is less efficient compared to the
Shumway’s model. (Chava, Jarrow 2004)
The research is focused on the suggestion that in various economic sectors
there are different levels of competition; the second reason is that the nature
of the business affects the way the balance sheet is maintained and

22
accounting principles implied. The research results have proved the effect of
industry influence so that the grouping is crucial when applying any
forecasting model (Chava, Jarrow 2004).
In 2009, Miller was comparing different models for bankruptcy prediction.
According to his research, stable companies have very close figures
generated through those models. However, in severe times for the enterprise
Altman-Z shows an increased probability of bankruptcy. (Miller 2009)
In fact, it shows the more dangerous position for insolvent companies then it is
in the real world. This ”misbehaving” of Altman-z concerns mainly the ”ordinal
insolvency predictions”, which means the competitive rate of probability when
comparing to the other company (Bemman 2005).
However, this might be explained by the fact, that the enterprises in this
analysis were public, and the variables in the Altman’s equation are both
related to market and accounting. If there are problems with company’s
financial statements, the market will react negatively to them which will cause
the decrease in its market variables.
Some recent studies also prove the imperfection of Altman’s method. For
example, the Zmijewski’s probit model (1984) and Ohlson’s model (1980) has
been compared by the accuracy with Altman Z. Surprisingly, the Altman-Z has
shown the lowest accuracy among them with only 80 percent, and the most
accurate model was the Ohlson’s one. (Avenhuis 2013, 38)
However, both Z-Score and O-Score perform similarly poor if compared with
Campbell, Hilschare and Szilagyi model. (Mansi, Maxwell, Zhang 2010, 21)
On the other hand, Altman’s model has gone through numerous researches
and changes that have increased its predictability nowadays. (Siddiqui 2013,
218)
2.3 Risk and Risk Measurement Tools
As a matter of fact, every business is opened to several risk categories. When
doing business entrepreneurs and enterprises face a combination of different
types of risk. Those differ in place and time of occurrence, external and

23
internal factors that create them, level of importance. In general, risk means
the chance of things not turning out as expected (Bishop 2009).
Risk can and should be measured. It is crucial to outline that one of the ways
to do that is to use objective probabilities. The reason for that is the fact that
frequently “a risk describes a situation of an array of different outcomes”,
subjective probabilities based on personal judgement of potential outcomes
when there is not enough data or even a combination of two (Arnold 2013).
More precisely, the risk is a probability or threat of damage, injury, liability,
loss, or any other harmful occurrence that is caused by external or internal
vulnerabilities, and that may be avoided through pre-emptive action (Business
Dictionary 2017).
A financial risk type exposes a stakeholder to potential losses through
changes in the financial markets when speaking of finance-related risk issues.
It might also occur when some specific debtors default. (Wissem 2013).
Business is inherently risky, and decision-makers have to be able to identify
the risks and make sure they are appropriately managed since some risks can
be insured and some cannot be. (Brealey, Myers, & Allen 2011).
Return is another variable for financial managers to consider. It is a total gain
or loss experienced in a financial operation (for example, investment) over a
set period (Ortobelli Lozza, Petronio and Lando 2015).
Risk and return trade-off is a highly important factor to keep in mind for
financial managers too - the returns to investors vary according to the risks
they take. Basically, at one extreme, very safe securities can provide a little
average return, and the riskiest investments can bring a higher return.
(Brealey, Myers, Allen 2011).
Proper classification of risks is a key to the more efficient modern risk
management. The following Figure 2.2 designed by Akrani (2012) provides a
better-detailed classification of the risk types.

24
Figure 2.2 Types of Risk in Finance (Akrani 2012)
It has been found out that there are two significant groups of risk: systematic
and unsystematic risks. The unsystematic risks are in fact genuinely
diversifiable. These risks depend on actions carried out by a company’s
executives and employees. For example, R&D failure, wrong implementation
of a marketing strategy, failed corporate strategy, poor HR policies are
unsystematic risks indeed. (Brealey, Myers, Allen 2011).
In the case of the Enron company, the accounting manipulations were one of
the internal factors that had affected the company’s stability. Consequently, it
allows assuming that the quality of annual reports is a part of the unsystematic
risk.
On the other hand, the systematic risks are aggregate (macroeconomic) risks
that cannot be reduced by hedging and diversification. (Zopounidis &
Galariotis 2015). The examples of the systematic risk could be the technology
development that leads to the drop in the oil price. Another example is the
climate change that affects agriculture – for the food production companies it
can turn out into decrease or increase in expenditure on operations.
Therefore, it is time to introduce the Beta Coefficient as a tool for measuring
the systematic risk (market risk) and the Standard Deviation concept as a
metrics used to evaluate the unsystematic risk of the stock.

25
Beta as a market risk measurement
Beta Coefficient is the volatility measurement instrument for stock in
comparison to a market as a whole. The formula to calculate the beta
coefficient is the covariance of the return of stock with the return of
the benchmark (in this case the market) divided by the variance of the return
of the benchmark (market) over a specified period. (Nickolas 2017)
A stock that is profoundly affected by market fluctuations would have a high
beta ratio and have more return if the market grows and have more prominent
losses when the market goes down.
Vice versa, if a stock is more stable towards market changes, it would have a
relatively lower beta coefficient. If the market decreases the stock losses
would be lower than of the market as a whole and if the market grows the
return for the stock would be relatively lower than the growth pace of the
market (McClure 2017).
To sum up, it is safe to assume that the higher the beta ratio is, the more
sensitive is the stock to the systematic (market) risk and vice versa. Thus, the
beta concept represents a “market” point of view on the company’s position.
Empirical studies of Beta
The first empirical study on the reliability of the beta coefficient was examining
not the particular stocks, but the combinations of them – the so-called
investment portfolios. It proved the linear dependence of beta and the stock
volatility. (Black, Jensen, Scholes 1972)
In other words, the finding proves that the beta reflects the potential return and
loss of the investment. Nowadays researchers test the reliability of the beta
coefficient as a systematic risk measure.
Perkovic has found that the beta cannot be trusted entirely, as it is the main
component of the Capital Pricing Asset Model (Sharpe 1964), and that model
has not proved its reliability. (2011, 102)

26
During the studies of the beta, the size effect phenomenon has been
discovered. The idea is that the bigger the size of an enterprise, the less
return it generates, thus, the less likely is the risk and vice vera. (Banz 1981)
Standard Deviation as an unsystematic risk metrics
Risk management concepts suggest wise evaluation of all types of risk. Since
unsystematic risk is a vital part of the risk overall, it is essential to pay a great
piece of attention to its’ scaling. The unsystematic risk is usually associated
with each individual stock because of enterprise-specific events and risks.
Therefore, it is crucial to find and use a proper metric to measure it. (Douglas
2015).
The standard deviation is frequently used and calculated by investors to make
proper evaluations for the unsystematic risk rates of a stock or a stock
portfolio. The basic idea is that the standard deviation is a tool to measure
volatility: the more a stock's returns differ from the stock's average return, the
more volatile the stock is in fact (Mlane 1999).
Originally the term standard deviation is used in statistical analysis to measure
the level of dispersion of variables from its average. (Investopedia 2017) In
other words, standard deviation shows how the variable might differ
depending on the case. A firm’s unsystematic risk is usually assessed by the
unexplained returns on investment. (Bansal, Clelland 2004, 94)
For the first time, the concept has been introduced by Karl Pearson in 1983
and has been considered the most precise tool to measure the dispersion.
(The Economic Times 2017)
In finance, the standard deviation is used to understand the riskiness of the
asset. It takes the return of a security within a specified period and compares
how it is different from the average share price in this studied period. This type
of measure s liked by investors because it shows how different their returns
can be. (Morningstar 2015)
Usually, the total portfolio risks are measured by the standard deviation of the
prices. (IBF, Institute of Business and Finance 2016) Consequently, the higher
is the standard deviation, the more the asset is risky.

27
2.4 Theoretical Framework Summary
It is essential to find the connections between the models related to the
research. The following Table 2.1 sums up the relevance of the used models
to the researched topic.
Table 2.1 Research Related Models. Adapted from the Literature Review
The Altman Z-score is a measure of the probability of the bankruptcy. The
higher is the output number, the more unlikely is the bankruptcy. The nature of
calculation of Altman Z-score is very similar to the Beneish M-Score principle
(Jun 2010). However, the Beneish M-score is designed to detect accounting
manipulations. The more is the Beneish M output, the more likely the
company to be a manipulator.
Consequently, the proof that manipulation of accounts is dangerous for the
company’s solvency would be a negative correlation between Altman and
Beneish’ variables. Both of the indicators are calculated based on the official
consolidated income statements from the annual reports.
The beta coefficient and the standard deviation are calculated based on the
stock price information from the financial databases Yahoo Finance and the
Google Finance.
The beta variable measures how the company is vulnerable to the market
changes. Therefore, it represents the systematic risk. Logically, the more the
beta coefficient is, the more the riskiness is. The researchers seek to find a

28
correlation between the beta and the Altman Z-score in order to understand if
the probability of bankruptcy is defined by the market.
The standard deviation measures the riskiness of the company regardless of
the type of the risk. It represents the total volatility of the stock prices. The
variable is included in the research to define the proportion of the market risk
in the overall riskiness of the company. If there will be a significant correlation
between beta and the Altman Z-score, than the correlation between standard
deviation must be less. If there will be no correlation between beta and Altman
Z-score but with the standard deviation, then it will be possible to assume that
what affects the probability of bankruptcy is the internal risk.
3 Methodology
3.1 Research design
The purpose of disclosing the research design is to show how the research
questions are linked to what the researchers did to answer them. (Saunders,
Lewis, Thornhill 2009, 136) The scholars have suggested a technique for a
description of the research design, called a “research onion”, that opens the
approach, the strategy, the method and the time horizon of the study.
(Saunders, Lewis, Thornhill 2009, 109)
In the beginning, the research philosophy is going to be discussed. The
constructivism philosophy is widely applied to the learning process. It
suggests that the knowledge should be constructed by the learner in order to
make sense of the perceived experience. (Driscoll 2005, 387) The process of
learning, according to constructivists, is arising from comparing the existing
knowledge with new information and generating new ideas. (Ferguson 2015)
In this paper, researchers are trying to build a new connection between two
very well studied topics – accounting manipulations and the probability of
bankruptcy.
The main condition for the constructive knowledge is the multiple perspectives
and models of learning. (Driscoll 2005), this is why the materials will be
carefully analyzed as each case in particular and as an overall statistical
evidence.
29
The research approach defines how sure the researcher about the theory that
he or she is testing. (Saunders, Lewis, Thornhill 2009, 124) This research idea
has been generated by the real-life examples of Enron, Lehmann brothers and
Northen Rock when companies had failed because they have applied
accounting manipulations in one case, and also when they tried to play fair in
another one. Thus, there is an explicit theory that researchers are testing,
which means that the research approach is deductive. The data for testing the
theory is going to be collected from the annual reports of 18 companies and
also share price data for the period from 2010 to 2015. Thus, the research can
be called archival.
For the data analysis, only the numerical data will be collected and analysed
through the SPSS quantitative analysis platform and excel, for presenting the
visualisation of the data. It is called a mono-method quantitative research.
The primary data sources are the annual financial statements of the sample
companies and the historical share prices taken from the online financial
databases Yahoo Finance and Google Finance. The secondary data are the
Beneish M-score and the Altman Z-score, calculated based on the information
from the annual reports, and the beta and standard deviation that are derived
from the share price history.
3.2 Data collection
In this chapter, the principle of choosing and analysing sample companies is
going to be presented. As long as there are 18 companies presented, the
researchers suggest that it would be more reader-friendly to introduce a
coding framework for more efficient communication. (Table 3.1) Also, the
following table helps to understand the overall approach to the sample of
companies.

30
Retail (A) Food production (B) Technologies (C)
High-performing (1) 2xA1x5 years 2xB1x5 years 2xC1x5 years
Well-performing (2) 2xA2x5 years 2xB2x5 years 2xC2x5 years
Low performing(3) 2xA3x5 years 2xB3x5 years 2xC3x5 years
Table 3.1 Types of sample companies
Numbers from one to three represent the level of performance of chosen
companies. 1 – the high-performing companies, 3 – low-performing. There are
six companies of each level, two for every industry. This classification has
been introduced for assessing companies with different stock performance
images and also with the different level of profitability, as the reader will see
from the analysis below.
The letters A, B and C are representing the three different industries where
chosen companies operate. Retail, Food production and Technologies
respectively. There are six companies in every type of industry. This division
by economy sectors has been introduced to remove the research bias coming
from the market affection – some industries, technological, for example, are
riskier and less liquid than retail, for example.
For example, if the reader sees the B2 code, it states for the well-performing
food production company. In total there are 18 companies, nine types of them
and two companies of each type. That is why two companies in the research
will be marked with the same code.
As long as the study period for this research is five years, for each company,
the information will be taken from 5 annual reports. (In the references the
reader can find the links to each company’s investor’s page where all the
reports can be found and accessed.) In total, the data for the Altman-Z score
and Beneish-M has been gathered from 90 annual reports.
The data for calculation of market-driven variables have been taken from the
financial databases of Yahoo.com, Inveting.com and Google Finance.
31
Below, the reader can find detailed information on the critic factors for
choosing companies and data calculations. Those are the location, market
performance, market index, reliability of the historical financial information,
and presence of financial restatements.
Location: United Kingdom
For the sake of the validity of results, all the company have been taken from
the same country, United Kingdom. It is worth to be mentioned, that studied
period is marked as an extremely efficient for British economy after the 2007-
2008 crisis. The national statistics office has published figures that show that
British GDP is increasing each year since the beginning of 2010. (Office of
National Statistics, 2017) This period is beneficial for the research as results
will not be biased with the effect of the economic crisis.
As long as this research studies the dependence of bankruptcy on the quality
of the accounts reported, global unstable economic conditions may bias the
results. Therefore, studying peaceful British companies might provide more
reliable empirical evidence on the issue.
Market performance: high-performing, well-performing and low-
performing.
There are three kinds of companies (1-3) that are different regarding their
market performance. According to Horne J.C.V and Wachowic J.M., the stock
price indicates precisely the level of firm’s financial capabilities, asset
management and investment. The scholars also mention that maximising the
wealth of shareholder is a final goal of a public corporation (2008). Therefore,
the indicator for assessing the market performance of the enterprise is their
share price development within a period of 5 years, starting from the 1st of
January 2010 and ending 31st of December 2015.
Market Index: FTSE100
Critical dimension for the Beta data collection is the belongings to the same
stock index. Companies studied in this research are all listed at London Stock
of Exchange and naturally UK companies. However, London stock exchange

32
work with several indexes, which have different prices. Some of the analysed
companies are listed on FTSE100; others are on FTSE250.
The main difference between this two is that FTSE100 represent a hundred
largest UK corporations, whereas FTSE250 correspond to the next 250
largest companies. Secondly, FTSE100 better show the global position of UK
on the market, as the largest companies are multinationals. (Standard Life
Self Investor 2017).
As long as the majority of the companies in this research also operates
outside of the UK, the researchers consider acceptable to calculate beta only
based on the FTSE100 data.
Financial results up to date
Under perfect conditions when all the firms are publishing their financial
statements on December 31 all of them would be taken from the period of
2010 and 2015. This setting has been implemented to have a more relevant
data, not biased with political priorities in the world and global crisis affection.
However, in reality, the due for publishing annual reports vary for every
company depending on the financial year beginning.
For example, some reports that are officially dated 2010 may contain
statements prepare for the financial year end on the March 31 of 2010. In
practice, these figures reflect more the financial position of 2009. If such cases
appear, the financial information for 2010 will be taken from the report official
published in 2011.
Financial restatements
Earning restatements is a revision of one or more financial statements for a
previous fiscal year or several periods. This method is applied when there has
been an inaccuracy in calculations found, correct accounting errors, frauds,
non-compliance with GAAP (Investopedia 2017).
Some of the sample companies have been publishing the reports with a
restated earnings for the previous year. For the data analysis, the restated
figures had been selected. This decision has been taken because of all the

33
companies restatement can be explained by the modification of the same
amendment in the accounting policies demanded by GAAP. Therefore, the
restated data is valid according to the law.
Further in this chapter, the information on the sample companies will be
presented. It is supposed to contain only necessary information for the
justification of choice based on the dimensions described in above.
Justification of choice for the sample analysis
In this chapter, the researchers intend to present all the sample companies
detailed description. This description will include the overview of the nature of
the business, the assessment of the operational performance of the company
and how it is reflected on the market, the publishing policy and the reasons for
earning restatements if those happened.
Dunelm Group Plc (A1)
Dunelm Group is a leader in homewares retail in the United Kingdom. In 2015,
there were 149 Dunelm superstores in suburban areas and six high streets
among the country overall, as well as an online store with a possibility of home
delivery or reservation in stores. This information is relatively repeated by the
share price indicators.
Figure 3.1 Dunelm Group Plc market performance and FTSE100 fluctuation
(Google Finance 2017)
Figure 3.1 represents the fluctuations of the share price of Dunelm Group. The
evident and straightforward growth fully justifies the reason for considering
Dunelm as a well performing retail company.

34
Dunelm group annual reports are published at the end of June, beginning of
July. Therefore the figures in account reflect half of the current year and half of
the other. The researches consider this shift not significant for the study and
the 2010 publications are recorded as the data for an entire 2010 year. The
share prices data for calculation is going to be taken from the 1st of July.
The company did not restate it’ earning during the studied period.
WH Smith Plc (A1)
WH Smith is a British retailer of books and newsagent. By 2015, the company
is running two businesses - Travel (selling of newspapers, magazines, books,
and supporting products in airports, train stations, and others) and High Street
(selling books, stationery, newspapers and entertainment products in
convenient places).
The growth of WH Smith Plc within five years is reflected in its net profit that
has increased by 30 percent. Also in 2010 it had 1,089 shops total, but by
2015 there were already 1,315. (WH Smith Annual reports 2010 2015)
This real growth is represented by the stock performance.
Figure 3.2 WH Smith market performance and FTSE100 fluctuation (Google
Finance 2017)
Figure 3.2 represents the straightforward growth of WH Smith’s stock. As well
as in the previous case with Dunelm Group, WH Smith has been showing an
increase in its net and operating profit during the studied period. Moreover, it
is reflected in the healthy market growth of the company.

35
WH Smith publishes its reports on 31st of August. Therefore the figures in
account reflect more the current year than the previous. The researches
consider this shift not significant for the study and the 2010 publications are
recorded as the data for an entire 2010 year. Thus, the information on the
stock price for calculations will be taken from the 1st of September.
The Group has made earnings restatement for the years 2012 and 2013. The
reason for restatement is an adaptation of new mandatory standard IAS 19.
Associated British Foods (B1)
Associated British Foods is a multinational diversified food, ingredients and
retail group, which operates internationally in Europe, Asia, Australia and
Oceania, Southern Africa, North America, and South America.
There are five strategic business segments of British Foods under different
brands: Grocery (Twinings, Ovaltine), Sugar, Agriculture (AB Agri), Ingredients
for a bakery (AB Mauri) and Retail (Primark). The last segment is the most
profitable. (Associated British Foods Annual Report 2015)
During the 2010-15 the profit of the company has remained relatively at the
same level, £569,000 in 2010 and still £524 in 2015. However, the corporation
has expanded its market to 4 more countries, starting from 44 and ending with
48 at the end of the period. (Associated British Food Annual reports 2010,
2015)

36
Figure 3.3. Associated British Foods market performance and FTSE100
fluctuation (Google Finance 2017)
In Figure 3.3, one can find the evidence of constant share prices growth of
Associated British Foods. The growth of the share price remains sustainable
even though there has been no significant increase in profitability. This curve
justifies assuming that the observed company can be called high-performing.
The end date of the financial year for Associated British Foods is the middle
(12-19) of September. Therefore the figures in account reflect more the
current year than the previous. The researches consider this shift not
significant for the study and the 2010 publications are recorded as the data for
an entire 2010 year. Thus, the share price figures are dated the 1st of October.
It is assumed, that 15 days will not create a significant impact if the studied
period is five years.
The company has been applying restatement of earnings for the year 2012
and 2013. In 2014 company adopted new accounting policy (IAS 19) for
employee benefits, which affected 2013 and 2012 retained earnings and
shareholder’s equity. (Associated British Foods annual report 2014)
Cranswick Plc (B1)
Cranswick Plc is an innovative British supplier of food. The core market of
Cranswick is the UK, and they mainly provide different meat products and
sandwiches through retail, food services and manufacturing. Nowadays 95
percent of revenue comes from the UK, and five from Europe, Australasia,
West Africa and the US. Retail customers generate 75 percent of revenue.
Cranswick operates through brands – Bodega, Simply Sausages, Yorkshire
Baker, Woodall's and Jack Scaife. (Cranswick Plc Annual report 2015)
37
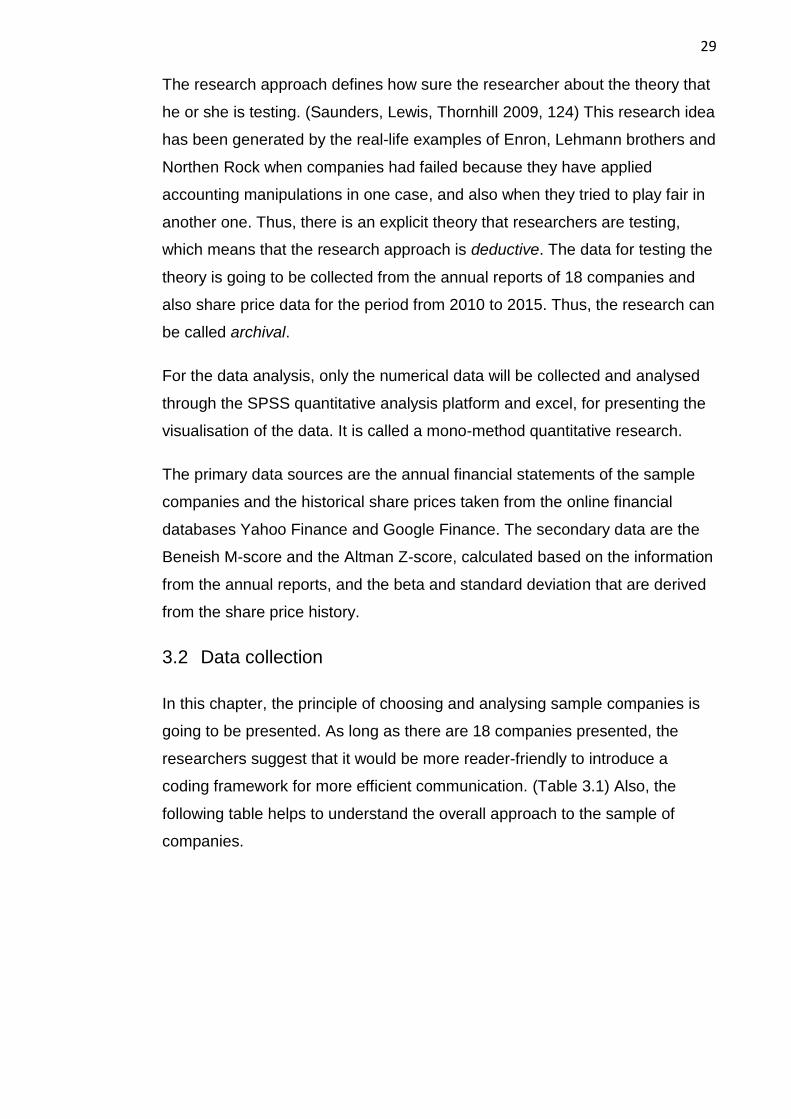
Figure 3.4. Cranswick Plc market performance and FTSE100 fluctuation
(Google Finance 2017)
From the curve, in above one can see a slight but continuous growth of
company’s stock price. Considering the fact, that operating profit of Cranswick
has always been growing (except slight fall in 2013). Also, the Earnings per
share indicate continuous growth from 1990. (Cranswick Annual report 2015)
Thus, this company is assumed as high-performing in this research.
Cranswick’s annual reports are usually published on the 31st of March, which
covers only a third of a studied year. Consequently, the data for 2010 will be
taken from the 2011’s annual report. Thus, the share price for calculations will
be taken from the 1st of April.
Company’s government has applied new accounting policies (IAS 19, IAS 27,
IAS 28) concerning employee benefits and investment policies. Those
changes affected financial statements for 2013 (actual 2012) only.
E2V Technologies (C1)
E2V company is a world-leading technology company that design and supply
innovative solutions for partner companies in healthcare, science, space and
defence industries. (E2V Annual Report 2010, 2) E2V operates through three
business segments: Imaging, RF Power and Semiconductors. More concrete,
they produce screen sensors, and camera solutions, space imaging sensors,
some radio-based system components and also provide human resources for
design and engineering. (E2V Annual Report 2016)

38
According to the development of the employee number, the company did not
expand a lot, starting with 1,666 people in 2010 and 1,645 in 2015. However,
the operating profit o the company has more than doubled, with a £15 million
to £42 million. (E2V Annual Report 2010 2016)
Figure 3.5. E2V Technologies market performance and FTSE100 fluctuation
(Google Finance 2017)
The growth of the shareholders’ appreciation is evident from the share price
fluctuation on Figure 3.5. At the beginning of 2010, E2V had slight problems
regarding the falling demand for the products. (E2V Annual Report 2010)
E2V publishes its annual reports on the 31st of March, which covers only a
third of a studied year. Consequently, the data for 2010 will be taken from the
2011’s annual report. Thus, the share price for calculations will be retrieved
from the 1st of April.
The company has introduced earning restatements for the financial year
ended 31st f March 2013. The reason was the adoption IAS 19 amendment,
that affected company’s benefit schemes and, in turn, company’s total assets.
Worth to be noted, that by the current ay the company does not exist
anymore. In December 2016 it was taken over by a US “Teledyne”. The cost
of the deal was £620 million. (Fedor 2016)
Halma Plc (C1)
Halma is a tech British company listed on FTSE250. The enterprise operates
in Europe, Asia and the USA through five main business formats. These are

39
protection life (products that help to protect from dangerous gases, flame
detectors and corrosion monitors, sensors and audio warning systems); life
quality improvements (products for healthcare, water quality monitoring
devices) (Halma Annual report 2015, 5)
In 2010 Halma had entities in 22 countries with the overall amount of
employees 403 people. After just five years the number of employees has
been increased dramatically to 5,411. By 2015 the company has been
operating in 23 countries already. The operational growth can be seen from
the difference between PBT (Profit Before Tax) in 2010 and 2015, which
corresponds to £86 million and £153 million respectively.
Figure 3.6. Halma Plc market performance and FTSE100 fluctuation (Google
Finance 2017)
This growth both in the actual size of the company and its economic
capacities is well reflected in the overall growth. All these factors allow the
researchers to consider Halma as a high-performing company.
Halma Plc publishes its annual reports on the 31st of March or in the first date
of April, which covers only a third of a studied year. Consequently, the data for
2010 will be taken from the 2011’s annual report. Thus, the share price for
calculations will be taken from the 1st of April.
The company has introduced earning restatements for the financial year
ended 31st f March 2013. The reason was the adoption IAS 19 amendment
that affected company’s benefit schemes and, in turn, has decreased
company’s taxable profit.

40
Kingfisher Plc (A2)
Kingfisher is a multinational retailer of home improvement materials, based
initially in the United Kingdom. Together with products the company is also
offering the home improvement services.
During the studied period, the company has significantly increased its amount
of stores, starting with 831 stores in 2010 and 1,156 in 2015. Enterprise has
expanded its sales to three more countries (2010: 8, 2015: 11), so as the
number of employees (2010: 64,576, 2015: 74,000). However, the size
expenditure has not also been supported by the taxable profit’s slight growth
(2010: £566m., 2015: £686m.) (Kingfisher Annual reports 2010, 2016)
Figure 3.7. Kingfisher Plc market performance and FTSE100 fluctuation
(Google Finance 2017)
In Figure 3.7, one can observe the development of the stock performance.
The research considers Kingfisher Plc as a well-performing company. This
assumption is due to the fact of the relative share price growth, but at the
same time, extreme points in 2013 and 2014 do not correspond to the stable
market performance.
Kingfisher Plc publishes its annual reports on the 31st of January – 1st of
February. Thus, the data presented covers almost the entire previous year.
Thus, the data for the 2010 calculations will be taken from annual reports
dated 2011. The share price information will be gathered from the 1st of
February each year relatively.

41
The company applied earnings restatements to 2013’s data. The reason for
the restatement has been the changes in the IAS19 amendment on the
employee benefits.
Marks and Spencer Group Plc (A2)
Marks and Spencer Group Plc is a famous British retail company that
specialises in clothes, home products and food. The company is multinational.
It operates in UK and 59 countries more. (Marks and Spencer Annual Report,
2015)
In 2010 the company was operating in 42 countries only and had 1,010 stores
in total. By 2015 the number of stores had grown up to 1,330, together with
the international exposure. The taxable profit of M&S had experienced rises
and decreases, but by 2015 it had accounted for £600 million, whereas in
2010 it had been £702 million. However, the fact that the company's history is
more than 125 years, it can be seen as a healthy stable development. (Marks
and Spencer annual reports 2010, 2016)
Figure 3.8. Marks and Spencer Group Plc market performance and FTSE100
fluctuation (Google Finance 2017)
According to the Figure 3.8 in above, one can see a general increase in the
share price, but the growth has not been stable and sometimes even
underperform in comparison with the market growth. Therefore, in this
research, the company is assumed as a well-performing.

42
Marks and Spencer Group Plc publishes its annual report at the end of March
– Beginning of April. Consequently, the data for 2010 will be taken from the
2011’s annual report. Thus, the share price for calculations will be taken from
the 1st of April.
In 2013 Marks and Spencer has introduced the income restatements due to
the IAS 19 amendment change concerning the employee benefits.
Devro Plc (B2)
Devro is a B2B type food production company that supplies collagen gel to the
food producers of different kinds of sausages. Devro operates in more than
100 countries and has a range of more than 1,500 customers. (Devro Annual
report 2015)
During the studied period, the number of employees of the company
increased from 1,484 to 2,258. However, after 2013, the company’s revenue
had never been showing a positive development. The operating profit of Devro
had fallen from £38,000 in 2010 to £19,000 in 2015. (Devro Annual reports
2010, 2013, 2015)
Figure 3.9. Devro Plc market performance and FTSE100 fluctuation (Google
Finance 2017)
Regardless of the operating profit fall, one can notice an increase of
company’s stock in general. However, the profitability gap is seen as a slight
drop in 2013 onwards. Because the financial indicators of the company and its
43
stock fluctuations are unstable, but anyway positive, Devro Plc is considered
as a well-performing company.
The company publishes its reports always in 31st of December. Thus, the
financial data for 2010 will be taken from the annual report dated 2010. The
share price figures will be taken on the 1st of January.
There has been an earning restatement in 2011 for the financial year 2010
concerning the IFRS5 amendment about discounted operations held for
share. The 2012 results are affected by the IAS19 amendment about the
employee benefits.
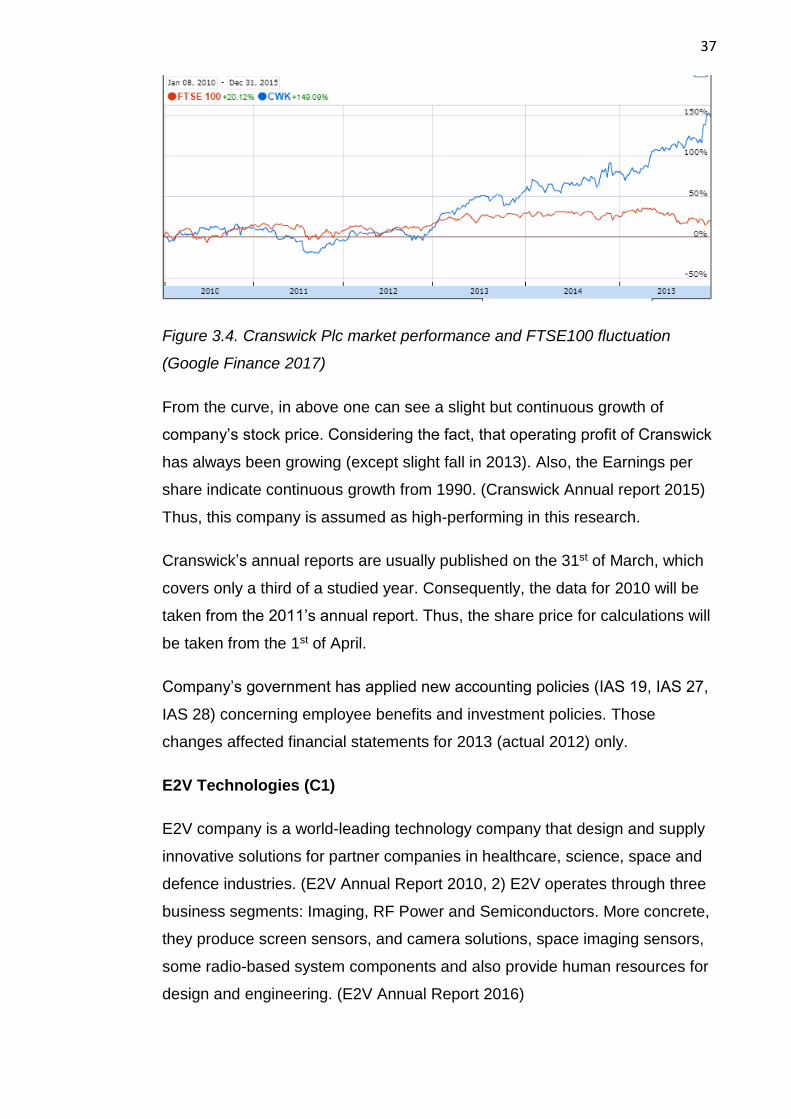
Tate & Lyle Plc (B2)
Tate and Lyle Plc produces specific food ingredients for adding taste,
structure and nutrition to the actual food produced by their customers. The
company is a multinational, operating in Europe, North and South Amerca,
Asia and Australia. (Tate&Lyle Annual report 2015)
In 2010, the net profit of Tate&Lyle was accounting for £19 million. The
number of employees was 5,616 people. Comparing to the previous and next
financial years it seems relatively low. However, this was due to the payment
of company’s financial debt. In 2014 the profitability of the enterprise
increased to £273 million and then dramatically dropped to £30 million.
Furthermore, the financial report for 2015 has shown that the net debt of the
company has significantly increased. (Tate&Lyle Annual Reports 2010, 2015)

44
Figure 3.10. Tate & Lyle Plc market performance and FTSE100 fluctuation
(Google Finance 2017)
The fluctuations of the Tate & Lyle’s share price reflect perfectly the
profitability of the company. The stock history saw its’ rises and decreases,
but in the long run, there is no significant drop. Thus, Tate & Lyle is assumed
as a well-performing company in this research.
Tate & Lyle publishes its annual reports always on the 31st of March.
Consequently, the data for 2010 will be taken from the 2011’s annual report.
Thus, the share price for calculations will be taken from the 1st of April.
There has been a restatement of earning for 2013 (actual 2012) financial year.
The reason for the restatement has been the changes in the IAS19
amendment on the employee benefits.
Univision Engineering Ltd (C2)
Univision Engineering is a Hong Kong-based producer of equipment for
security issues. The primary clientele of the company is the security system
service providers and alarm manufacturers. Mainly the company operates in
China, with 60 projects undertaken there within past years. (Uvel 2017)
Even though the company is Limited, its stock is traded on the London Stock
Exchange, and the annual reports available for public and the primary trading
currency is British Pounds.
Since Annual reports of the company are made rigorously and humbly, it is
difficult to assess the physical size of the company. However, the Property,
Plant and Equipment, marked in the financial statements decreased
dramatically from £285,000 in 2010 to £43,000 in 2015. The profit of the
company was also fluctuating a lot. In 2010, the company had a loss of £10
million. During 2011 and 2014 there were positive results presented, however,
on the 31st of March 2016, the loss was £340,600. (Univision Engineering
Annual Reports 2010, 2016)

45
Figure 3.11. Univision Engineering Ltd market performance and FTSE100
fluctuation (Google Finance 2017)
This stock of the company does not reflect its reported financial statements.
The dramatic peaks can be explained by the company having very successful
periods reported and as well as losses. In the long run, Univision Engineering
is considered a well-performing company because the stock price does not
have a significant drop in the studied period.
Univision Engineering publishes its annual reports always on the 31st of
March. Consequently, the data for 2010 will be taken from the 2011’s annual
report. Thus, the share price for calculations will be taken from the 1st of April.
There were no restatements on financial indicators reported during the studied
period.
Spectris Plc (C2)
Spectris is a company that produces the instruments for controlling
environment, quality and manufacturing processes for R&D and the laboratory
purposes as well as for the manufacturers. Spectris is a multinational
company that operates in North America, Europe and Asia mainly. (Spectris
Annual Report 2015)
The development of Spectris profitability correlates well with its stock
correlation (Figure ). In 2010 the profit was £96 million. Between 2011 and
2013 there was a noticeable growth of the profitability, and in 2015 the
indicator again fell, accounting for £113 million. In 2010 the number of

46
employees was 5,781 people. By 2015 it had already been 8,053, which tells
about the actual size of the company and possible projects.
Figure 3.12. Spectris Plc market performance and FTSE100 fluctuation
(Google Finance 2017)
The Spectris Plc is considered as a well-performing company in this research
as the stock price has not been fluctuating dramatically and in the end,
accounted for more than at the beginning of the studied period. However, the
profitability is no stable, so it is not the high-performing.
Spectris Plc publishes its annual reports only on the 31st of December. Thus,
the financial year and the actual year are in alignment, the data for 2010 will
be taken from the annual report dated 2010. The share price data will be
taken from the 1st of January.
In 2013 Spectris announced earning restatements for the financial year 2012
due to the change in IAS 19 amendments concerning employee benefits.
Debenhams Plc (A3)
Debenhams is a British multinational retailer of apparel, accessory and
homeware. The history of the company in the British market is more than 200
years. Nowadays the company makes sales through the high street stores
and online platform. (Debenhams Annual report 2015)
According to the profitability indicators, Debenhams has reported a slight
decrease in profit, with £97 million in 2010 and £93 million in 2015. However,
the number of stores has increased from 227 in 2010 to 248 in 2015. Another
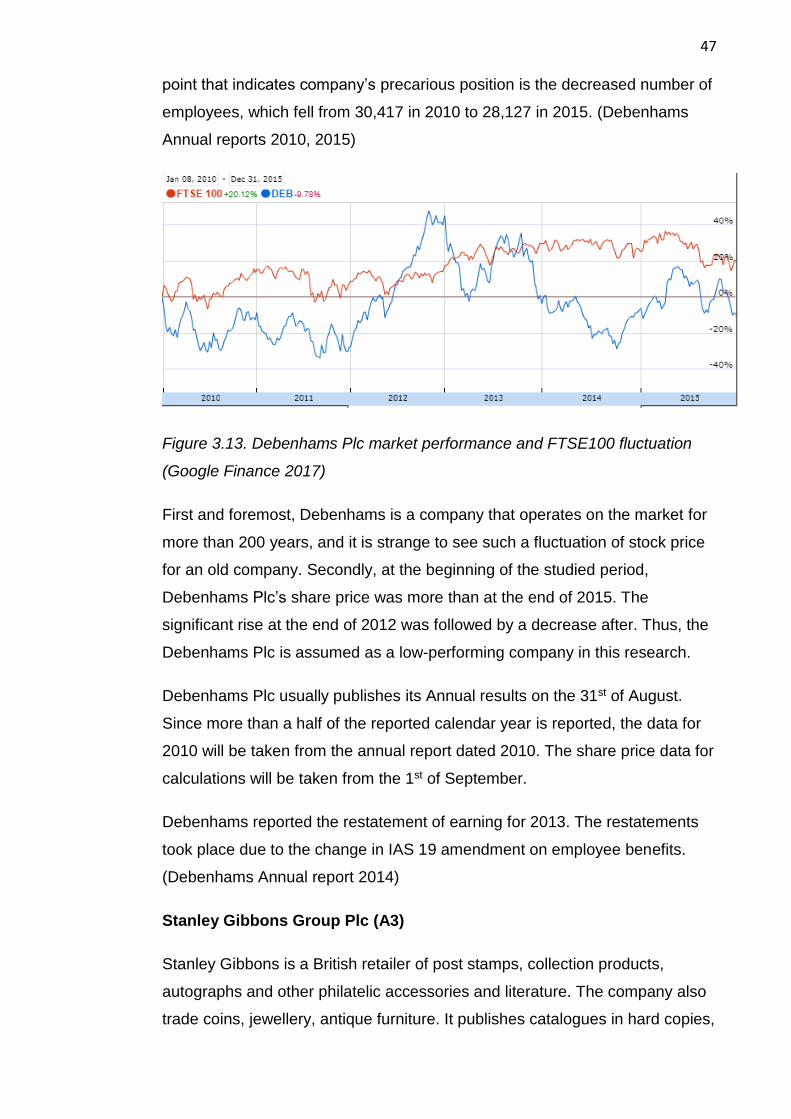
47
point that indicates company’s precarious position is the decreased number of
employees, which fell from 30,417 in 2010 to 28,127 in 2015. (Debenhams
Annual reports 2010, 2015)
Figure 3.13. Debenhams Plc market performance and FTSE100 fluctuation
(Google Finance 2017)
First and foremost, Debenhams is a company that operates on the market for
more than 200 years, and it is strange to see such a fluctuation of stock price
for an old company. Secondly, at the beginning of the studied period,
Debenhams Plc’s share price was more than at the end of 2015. The
significant rise at the end of 2012 was followed by a decrease after. Thus, the
Debenhams Plc is assumed as a low-performing company in this research.
Debenhams Plc usually publishes its Annual results on the 31st of August.
Since more than a half of the reported calendar year is reported, the data for
2010 will be taken from the annual report dated 2010. The share price data for
calculations will be taken from the 1st of September.
Debenhams reported the restatement of earning for 2013. The restatements
took place due to the change in IAS 19 amendment on employee benefits.
(Debenhams Annual report 2014)
Stanley Gibbons Group Plc (A3)
Stanley Gibbons is a British retailer of post stamps, collection products,
autographs and other philatelic accessories and literature. The company also
trade coins, jewellery, antique furniture. It publishes catalogues in hard copies,

48
manufacture albums for the order, set up auctions. Stanley Gibbons is a B2C
company. Officially company is not British because it belongs to the Jersey
Island. However, this position only affects the rights of shareholders. It
operates mainly in the UK. However, it also has subsidiaries in Jersey, the
USA, Singapore and Hong Kong. (Stanley Gibbons 2017)
The profitability of the company has been decreasing through the studied
period continually. In 2010, the operating profit and the net profit accounted for
£4,887 and £3,831 respectively. (Stanley Gibbons Annual report, 2010) By
2015, the profit has fallen more than just significantly. The net loss of Stanley
Gibbons was 29,249. The Chairman of Stanley Gibbons has stated the
significant fall was due to the wrong merger and accusation policy and overall
Internat development. (Stanley Gibbons Annual report 2016)
Figure 3.14. Stanley Gibbons Group Plc market performance and FTSE100
fluctuation (Google Finance 2017)
Despite the constant decrease of company’s profitability, one can see on the
Figure 3.14 that before 2014, the stock price has been developing
straightforward. However, in summer 2015, the significant profitability fall
affected the investors’ loyalty, and the stock went down dramatically. Thus,
Stanley Gibbons is assumed as a low-performing company in this research.
Before 2013, Stanley Gibbons has been publishing its annual results on the
31st of December. However, on the 31st of December 2013, there were only
mid-term results. The full report was presented on the March 31st of 2014. Afer
this, company’s financial year ends on the 31st of March always. The data for
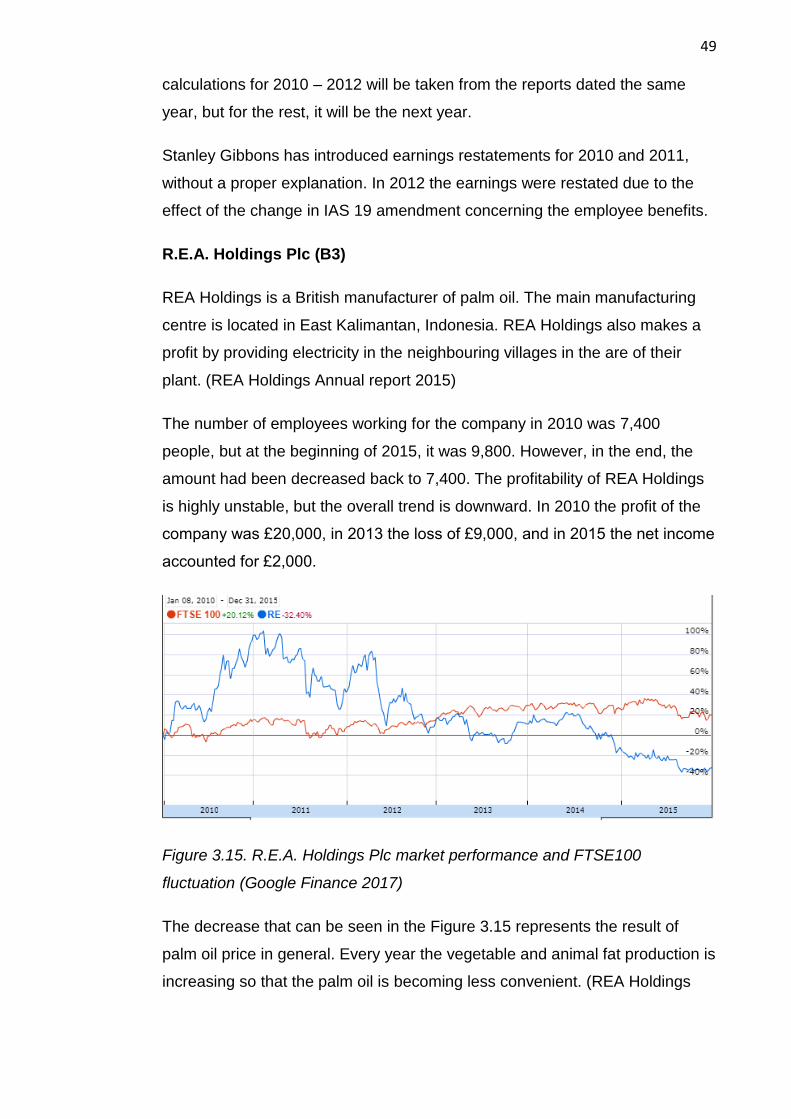
49
calculations for 2010 – 2012 will be taken from the reports dated the same
year, but for the rest, it will be the next year.
Stanley Gibbons has introduced earnings restatements for 2010 and 2011,
without a proper explanation. In 2012 the earnings were restated due to the
effect of the change in IAS 19 amendment concerning the employee benefits.
R.E.A. Holdings Plc (B3)
REA Holdings is a British manufacturer of palm oil. The main manufacturing
centre is located in East Kalimantan, Indonesia. REA Holdings also makes a
profit by providing electricity in the neighbouring villages in the are of their
plant. (REA Holdings Annual report 2015)
The number of employees working for the company in 2010 was 7,400
people, but at the beginning of 2015, it was 9,800. However, in the end, the
amount had been decreased back to 7,400. The profitability of REA Holdings
is highly unstable, but the overall trend is downward. In 2010 the profit of the
company was £20,000, in 2013 the loss of £9,000, and in 2015 the net income
accounted for £2,000.
Figure 3.15. R.E.A. Holdings Plc market performance and FTSE100
fluctuation (Google Finance 2017)
The decrease that can be seen in the Figure 3.15 represents the result of
palm oil price in general. Every year the vegetable and animal fat production is
increasing so that the palm oil is becoming less convenient. (REA Holdings

50
Annual report 2015) Also, the company’s unstable profitability might affect the
curve.
REA Holdings publishes its’ reports always on the 31st of December. Thus, the
financial year and the actual year are in alignment, and the data for 2010 will
be taken from the annual report dated 2010. The share price data will be
taken from the 1st of January.
During the studied period, REA Holdings did not report any earnings
restatements.
Even though the REA Holdings is initially a British company and it is traded on
London Stock Exchange, the currency in which the financial statements are
presented is the US Dollar. For calculations, the researchers converted the
figures into Great Britain Pounds according to the end date of each financial
period. The exchange rate information has been retrieved from Xe.com.
Premier Foods Plc (B3)
Premier food is mainly a domestic producer of food, with 5 percent of sales
going international. They produce quick meals, desserts, sweets and sauces.
The profitability of Premier Foods during the studied period had always been
somewhat a loss. In 2011, the loss accounted for £339 million. By 2015, it was
£123 million. However, the number of company’s employees increased from
2,000 people in 2010 to 3,737 in 2015, which is an evidence of business
expansion.

51
Figure 3.16. Premier Foods Plc market performance and FTSE100 fluctuation
(Google Finance 2017)
The Figure 3.16 suggests that the shareholder’s attitude to British Foods is
decreasing every year during the selected period. The chairman claims that
the negative profitability trend is due to the change in consumer habits and
growing commodity costs. However, as one can already notice from the
previous food companies analysis, other food producers do not suffer from
these factors in the British market.
Before 2013, Premier Foods has been publishing its annual results on the 31st
of December. However, on the 31st of December 2014, there were only mid-
term results. The full report has was on the 4th of April of 2015. Afer this,
company’s financial year ends at the beginning of April. The data for
calculations for 2010 – 2013 will be taken from the reports dated the same
year, but for the rest, it will be the next year.
For the year 2011 Premier Foods has reported restatements due to the
company’s reclassification of costs. The same reason for restatements occurs
in 2013. In 2012 the reason for the earnings restatement was the change in
IAS 19 amendment concerning benefits for employees.
Artilium Plc (C3)
Artilium is a B2B tech company that focuses on the development of software
solutions and communication applications. Artilium Plc is listed on London
Stock Exchange but with headquarters in Belgium.
Artilium reported positive profit results only in 2014, with £170,000 in plus. All
the other years of the studied period company has been facing losses. In 2010
the loss was £3,509 million. By 2015 it had already been £161,000. The
number of employees had not changed significantly within five years. The
intangible assets indeed increased from £585,000 in 2010 to £1,805 million in
2015. Such a change underlines that the tech company just was not
innovative enough with the supported solutions.

52
Figure 3.17. Artilium Plc market performance and FTSE100 fluctuation
(Google Finance 2017)
Shareholders’ negative attitude is represented in Figure 3.17. Artilium is
assumed in this research as a low-performing company because of the
negative profit reported and the following respond of its shareholders.
Artilium publishes its annual reports always on the 30th of June. It means that
the annual report usually covers less than half of the studied year. Thus, the
results for 2010 will be taken from the annual reports of 2011 and so on.
During the studied period, there was no earnings restatement reported.
Oxford Instruments Plc (C3)
Oxford Instruments is a British tech company with a history of more than 55
years. It produces nano-technology tools for research, industrial products and
service solutions. Oxford Instruments is a multinational with offices in 16
countries, including the USA, Europe and Asia.
The number of employees of the company increased from 1,566 people to
2,077 in 2015 worldwide. In 2010, the profit of the company was £32,2 million,
and in 2015 it was only £7 million. During the studied period, in 2014 Oxford
Instruments announced a loss of £6.3 million.

53
Figure 3.18. Oxford Instruments Plc market performance and FTSE100
fluctuation (Google Finance 2017)
As one can see from the previous figure, the stock performance of the
company was going up until 2013. The followed decrease is suggested to be
due to the negative results reported. Even though the company’s share price
at the end of 2015 is more than at the beginning of 2010, it is assumed as the
low-performing company anyway because of the negative profit reported.
Oxford Instruments publishes its annual reports always on the 31st of March.
Since more than a half of the reported calendar year is reported, the data for
2010 will be taken from the annual report dated 2010. The share price data for
calculations will be taken from the 1st of April.
Oxford Instruments has reported the restatements of earnings for 2010 and
2013. For 2010 there was no explanation found in the report, and for 2013 the
reason was the IAS 19 amendment concerning the employee benefits.
3.3 Variables description calculation
In this part of the methodology chapter, the formulas of calculation each
variable will be disclosed. At the end of this section, the reader can find the
explanation of each financial term used in the calculations.
Beneish M-score
The research by Nesson Beneish suggests that the detection of bankruptcy
might be done through a set of financial statement ratios combined in several
indexes. (Beneish 1999)

54
According to Beneish, there are 8 Indexes that must be calculated for the final
score calculated. Those variables show the change within years in financial
indicators. (Beneish 1999)
Figure 3.19. Beneish M-Score Indexes Formulas (Beneish 1999, 23)
Days Sales in Receivables index (DSRI) measures whether the balance
between revenue and receivables is kept within two years.
Gross Margin Index (GMI) compares the gross profit of the previous year to
the current. It has been studied, that a dramatic change in gross margin
positively correlates with the earning management.
Asset Quality Index (AQI) assesses what a proportion of non-current assets
(excluding Property, Plant and Equipment) to total assets of the company is.
Hypothetically, the significant change within years of this indicator means that
the company is trying to pretend less risky than it actually is.
Sales Growth Index (SGI) detect the growth of sales between two years.
Initially, the growth of sales does not necessarily mean that there are some
manipulations. However, empirical studies prove that the growing revenues
are associated with fraud.
55
Depreciation Index (DEPI) compares depreciation rates between the previous
and the current year. If in the current year it is less than in the previous, then it
is assumed as the company is trying to report more value.
Leverage Index (LVGI) compares the current year proportion of total debt to
total assets and in the previous. The increase in company’s leverage might be
used to use the debt covenants incentives.
Total Accruals to Total Assets (TATA) shows the extent of cash underlies
reported earnings. The less cash there is in the company, the more there is a
probability of manipulations.
After the five indexes are calculated, the Equation for the M-Score is the
following:
M=-6.065+0.823DSRI+0.906GMI+0.593AQI+0.717SGI+0.717DEPI
The interpretation of the gathered variable is rather simple: If M-Score is more
than -2.22, then the firm can be assumed as a manipulator. (Beneish, 1999)
For the sample companies, the Beneish M model has been calculated for five
years, starting from 2010 to 2015. As it has been stated in above, depending
on the ending date of the financial year, the numbers may be different from
reports dated the same year. In this case, the reader should address to the
next year annual report. All the demonstrated calculations have been
performed in the Microsoft Excel. (Appendix 2)
The M-score is an independent variable. In this research, the accounting
manipulations are seen as a cause of bankruptcy. Consequently, the reason
for introducing this variable is to establish any kind of correlation with the
Altman Z-score.
Altman Z-score
Very similar to Beneish-M Score, Altman Z-score has been created on the
assumption, that the aggregate variable will provide a way more accurate
measure of the bankruptcy possibility assessment, then just compare of
financial ratios. The method was developed in 1968. (Altman 1968) It has
become the revolutionary innovation in financial analysis and bankruptcy

56
prediction. Even though there are some models that might be more accurate
in some situations, Altman Z-score is the most widely used model even
nowadays. (Altman 2014, 3)
In this research, the renewed in 1983 model is going to be used. It also
consists of some indicators, representing financial ratios.
X1= Working Capital/Total Assets
The first component measures the proportion of the liquid assets in the firm to
its total capitalisation. (Altman 1977) It compares the proportion of the
company’s cash at the specified period of time to all of its assets.
X2 = Retained Earnings/Total Assets
This ratio measures the proportion of the retained earnings of the company to
its total assets. It can be interpreted as “how much cash is the firm has in
surplus comparing to what it owns at the moment.”
X3 = Earnings Before Interest and Taxes/Total Assets
This ratio measures the effectiveness of the company’s production. The ratio
is useful as it shows the proportion of the operating profit to what the company
owns already.
X4 = Market Value Equity/Book Value of Total Liabilities
This market value of the company’s equity is determined by investments of
shareholders, whereas the debt finance determines the liability value. This
ratio shows how fast the company will become bankrupt if its shares decline in
value.
X5 = Sales/Total assets
It is also called the Capital-turnover ratio in the financial analysis. It is a
measurement of the competitiveness of the firm because it determines the
number of sales it can make, hence, the market occupation.
After all the components are calculated, the Z-score for manufacturing and
owned firms can be calculated.

57
Z = 0.717X1+0.847X2+3.107X3+0.420X4+0.998X5
The results gathered should be interpreted in accordance with this
benchmark:
If Z > 2.9, the company is financially robust.
The data for the Beneish M-score calculations has been gathered from the
annual reports of the companies. The reader can find all the input data in
Appendix 3. The output data can be found in Appendix 1.
Beta
Beta measures the responsiveness of returns on an asset to the market
fluctuations. (Hundal, 2017) It can be calculated with the formula in the Picture
Figure 3.20. Beta Coefficient Formula (Obaidullah 2012)
The covariance is a metric used for the statistic analysis to show how two
variables change comparing to one another. (Investopedia 2017)
So firstly it measures how the return on the market index is different from the
company’s return.
The variance is a statistical concept that shows how wide the specific
numbers are spread. Logically, the more prominent price fluctuations are
within a specific time period, the riskier the asset is. (Investopedia 2017).
Consequently, the beta measures how the company’s stock return is different
from the market return. The more the beta is, the riskier is the company. The
beta interpretation can be found in the Table 3.2.
Beta = 1
The stock has the same volatility rates as the market. Same
return and loss rates as the market growth or decrease rates

58
Beta > 1
The company’s share price is more volatile than the market.
Higher return or loss rates than the market growth or decrease
rates
Beta < 1
The company’s share price is less volatile than the market. Lower
return or loss rates than the market growth or decrease rates
Beta < 0 The stock is in the negative correlation with the market. If the
market grows, the stock will go down and vice versa
Table 3.2 Beta coefficient interpretation. Adapted from Goyal & Joshi (2012).
In this research, the beta calculations have been done with the use of the
Microsoft Excel. The calculations’ process can be seen below.
1. Downloading the historical prices of all the companies and the
FTSE100 index from the 01.01.2010 to 31.12.2015. The stock
prices have been downloaded from the commercial databases of
Yahoo Finance and Google Finance.
2. Calculation of the return on the market and each company stock by
subtracting the current price from the previous and dividing it by the
previous price.
3. Applying the function SLOPE in the Microsoft Excel for the stock
prices return of a company and the market return.
The beta has been calculated on the historical basis. It means that for the year
2010 the data set was taken from the 01.01.2010 to 31.12.2010. For the year
2011 it the data set was calculated from the 01.01.2010 to 31.12.2011. Every
year the starting point was the 1st of January 2010 and ending with the 31st of
December the year studied. This approach allows generating the most reliable
data for each year. The beta calculations are presented in the tables with the
results of the company-based analysis.
Standard Deviation
The standard deviation measures how the dataset deviates from its average
mean. The standard deviation is a square root of the variance, that was

59
explained in the previous part. The Picture represents the formulas for
calculating the variance and the standard deviation.
Figure 3.21. Variance and Standard Deviation formulas.
For this research, the standard deviation has been calculated using the
Microsoft Excel using the same market data and the same approach as with
the beta calculations. The stock price change has been taken for the company
on the historical basis. After, the function STDEV is applied.
Disclosure of used components in variables calculations
The role of this part is a glossary of all the used financial terms in the
calculations.
Beneish M-score calculation components
Receivables – The unfinished transaction or a financial obligation owed
to a company by other parties. Receivables are reported in the balance
sheet of the company. For the calculations, only the current (expire in
less than one year) receivables are used.
Sales – the account for all the revenue gathered from the operations of
a company. Sales are the first line in the income statement in the
financial reports.
Cost of Goods Sold (COGS) – the account for the expenditure on the
material used in the production of all the goods sold by a company and
cost of labour that was needed to make a product. This account does
not include the administrative and distribution costs. COGS is reported
in the income statement, right after the sales statement.

60
Total Assets – all the items that bear economic value for the owner.
Assets is what the firm own, so it also includes debts that the firm has.
This statement is reported in the balance sheet.
Current Assets – an account that state the value of company’s assets
that can be converted into cash during one year. It is a balance sheet
statement.
Property, Plant and Equipment (PPE) – a tangible fixed asset of the
company, representing the economic value of the machinery needed
for operations. PPE is usually tough to convert into cash. Thus it is
considered as a non-current asset.
Depreciation – a non-cash transaction and is not included in the cash
flow. It is the method which is used for the companies to write off the
cost of a tangible asset. For example, an estimated life of a tangible
asset is 10 years. Writing off its value in one year would show that
there is a significant loss of the assets. Instead, the cost of an asset will
be writing off every year by the sum equal to 10 percent of the original
price. Depreciation expenses account is reported in cash flow
statements.
Sales, General and Administrative Expenses (SG&A) – this account
represents the value spent on daily operations but not directly related to
the production, such as warranty costs, logistics costs, etc. SG&A are
reported in the income statement.
Long-term Debt (LTD) – financial liability of the company that the
company will bear for more than a year. Long-term debt can be found
in the non-current assets as “borrowings”.
Current liabilities – financial obligations of the company that it must
cover within one year. Current liabilities are usually reported in the
balance sheet.
Cash – the most liquid account of the firm. It includes the cost of
securities that can be converted into cash within two days. The cash
account can be found in the current assets in the balance sheet
statement.
Altman Z-score calculation components (those that were not explained
in the Beneish M calculation components)

61
Working Capital – is a financial ratio that measures the
effectiveness of company’s operations. It is calculated by
subtracting current liabilities from current assets. It shows if the
company have enough resources to pay its short-term debt.
Retained Earnings – the account that represents the proportion of
the net profit of the company that have not been paid as dividends
to the shareholders but kept in the turnover for investment into new
projects or for paying firm’s liabilities. It can be found by subtracting
the dividends from the net profit of the company.
Net Profit – the account representing the final economic value of the
company’s operation after paying the income tax. Usually, it is the
last line in the income statement of the financial report.
Earnings Before Income Tax (EBIT) – an account representing the
final economic value of company’s operations before the income tax
has been paid. Also referred as operational profit. Reported in the
income statement after the subtraction of COGS and SG&A from
total sales.
Market Value of Equity – the economic value of the shareholder’s
equity. Calculated by multiplying the number of shares issued by the
share price. For the calculations the share price t the end of the
reporting period has been used.
Book Value of Total Liabilities (total liabilities) – the account
representing the economic value of everything the company owes to
the investors. Total liabilities represent the debt of the company. It is
reported in the balance sheet statements.
4 Results
For generating the best quality of the results, two kinds of analysis have been
used. The first one discloses results on each company’s performance. It is
essential for showing the influence of the performance and the industry level
affection. Also, it removes the bias from the common perception of the picture
that the statistics analysis provide. In the company’s analysis, there are
graphical outputs presented for each case. The graphics are based on the
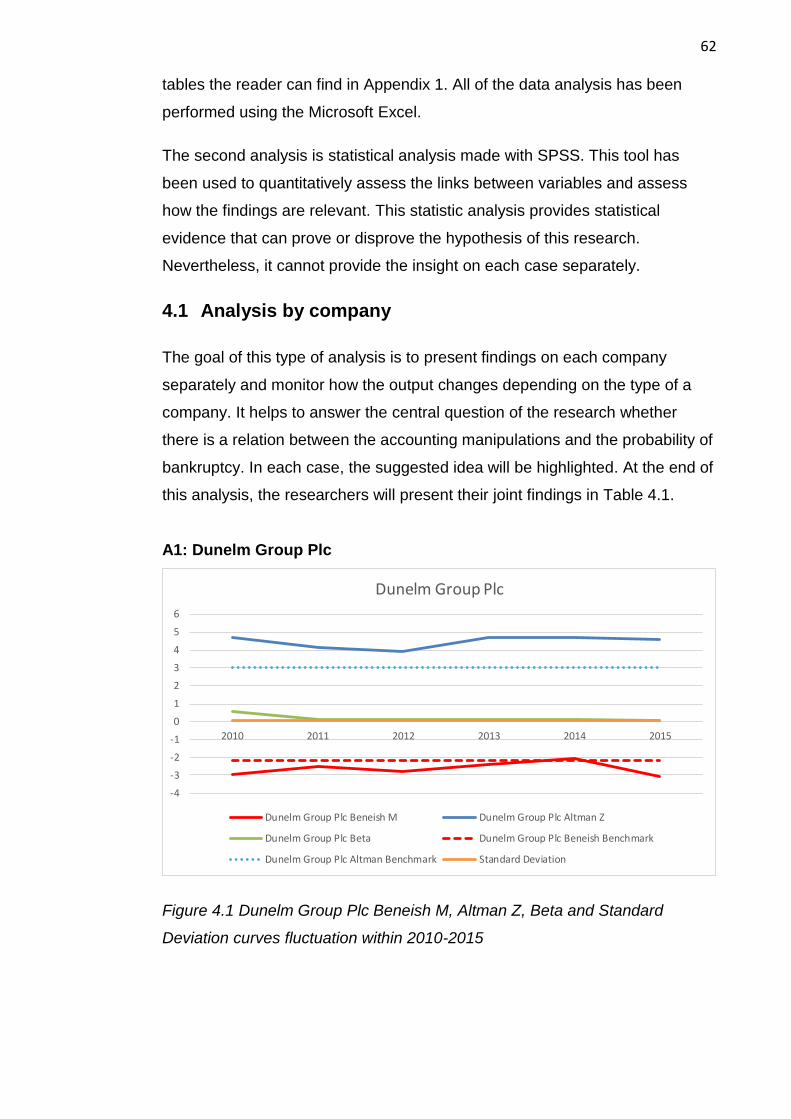
62
tables the reader can find in Appendix 1. All of the data analysis has been
performed using the Microsoft Excel.
The second analysis is statistical analysis made with SPSS. This tool has
been used to quantitatively assess the links between variables and assess
how the findings are relevant. This statistic analysis provides statistical
evidence that can prove or disprove the hypothesis of this research.
Nevertheless, it cannot provide the insight on each case separately.
4.1 Analysis by company
The goal of this type of analysis is to present findings on each company
separately and monitor how the output changes depending on the type of a
company. It helps to answer the central question of the research whether
there is a relation between the accounting manipulations and the probability of
bankruptcy. In each case, the suggested idea will be highlighted. At the end of
this analysis, the researchers will present their joint findings in Table 4.1.
A1: Dunelm Group Plc
Figure 4.1 Dunelm Group Plc Beneish M, Altman Z, Beta and Standard
Deviation curves fluctuation within 2010-2015
-4
-3
-2
-1
0
1
2
3
4
5
6
2010 2011 2012 2013 2014 2015
Dunelm Group Plc
Dunelm Group Plc Beneish M Dunelm Group Plc Altman Z
Dunelm Group Plc Beta Dunelm Group Plc Beneish Benchmark
Dunelm Group Plc Altman Benchmark Standard Deviation

63
The Beneish M-score of Dunelm Group Plc most of the time has been slightly
below its benchmark, however, in 2014, it crossed the line. It means that the
company is unlikely to be a manipulator except for the year 2014.
The Altman Z-score of Dunelm Group Plc during the studied period remains
far above its benchmark, which reflects the fact that the company on the
market is considered high-performing and is not likely to become bankrupt.
The Dunelm group’s Beneish and Altman curves correlate positively (except
for the year 2011) It shows that the lower the Beneish M-score, the lower is
the Altman-Z. For Dunelm Group, the less the extent of the accounting
manipulations is, the more the probability of bankruptcy is.
A1: WH Smith Plc.
Figure 4.2 WH Smith Plc Beneish M, Altman Z, Beta and Standard Deviation
curves fluctuation within 2010-2015
Beneish M-score of WH Smith always remains below its benchmark, which
shows that WH Smith is unlikely to be a manipulator. In 2011 there is a drop
that can be explained by WH Smith’s significant decrease in administrative
expenses. (See Appendix 2)
Altman Z-score in the years 2010 and 2011 remain very close to its
benchmark but after demonstrate slight but confident growth. It means that
within five years the probability of bankruptcy has become lower. It is not
-5
-4
-3
-2
-1
0
1
2
3
4
5
2010 2011 2012 2013 2014 2015
WH Smith Plc
Beneish M Altman Z Beta
Beneish Benchmark Altman Benchmark Standard Deviation

64
surprising because also WH Smith is a high-performing company on the
market.
Except for the fall of Beneish M 2011, Altman and Beneish curves correlate
positively during all the studied period. It makes truth the assumption that the
greater the extent of manipulations is, the less likely the company is to be
bankrupt.
B1: Associated British Foods Plc
Figure 4.3 Associated British Foods Plc Beneish M, Altman Z, Beta and
Standard Deviation curves fluctuation within 2010-2015
During the studied period the Beneish M-score has been falling except for the
year 2011, when there was a slight raise from -2.8 to -2.3. At this moment the
extent of accounting manipulations has been almost -2.22, and in this case, it
would be possible to call Associated British Foods a manipulator.
The Altman Z-score of Associated British foods is below its benchmark. It
means that the company is not as stable as the market perception. However,
it is not reflected on the beta curve, which means that the risk is not coming
from the market.
For Associated British Foods it would have been fair to say that the more
company manipulates its account, the less likely it will face bankruptcy.
-5
-4
-3
-2
-1
0
1
2
3
4
2010 2011 2012 2013 2014 2015
Associated British Foods Plc
Beneish M Altman Z Beta
Beneish Benchmark Altman Benchmark Standard Deviation
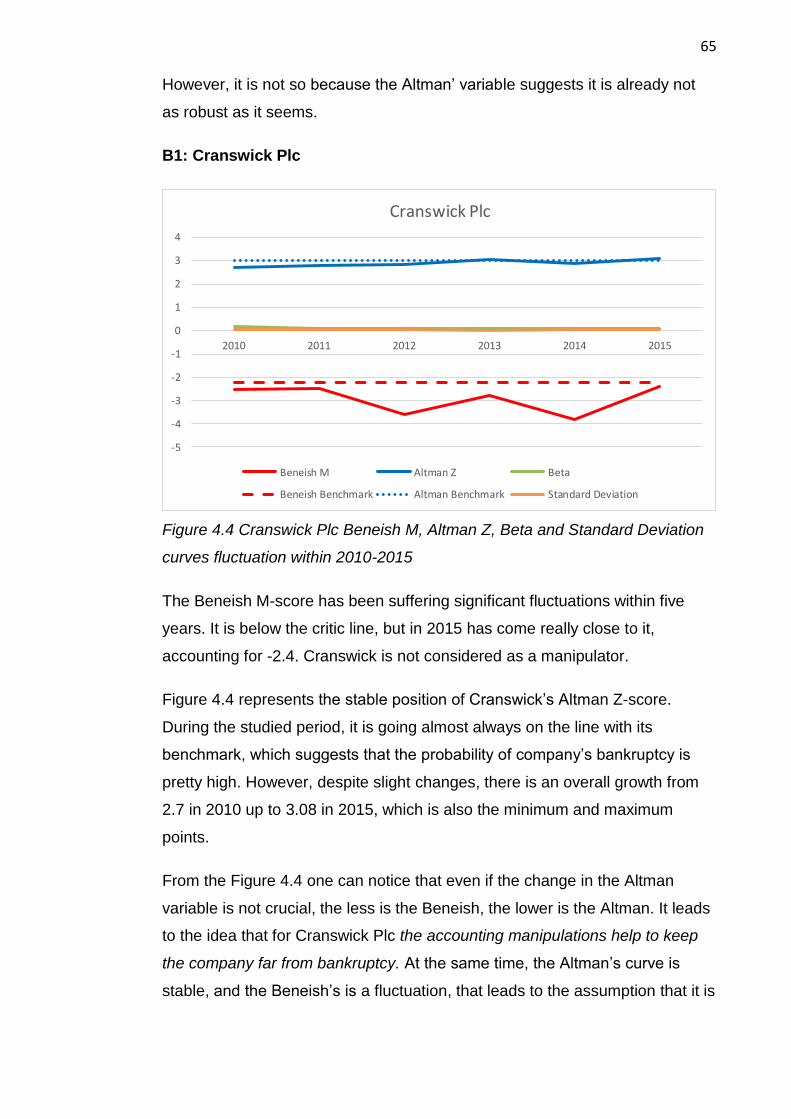
65
However, it is not so because the Altman’ variable suggests it is already not
as robust as it seems.
B1: Cranswick Plc
Figure 4.4 Cranswick Plc Beneish M, Altman Z, Beta and Standard Deviation
curves fluctuation within 2010-2015
The Beneish M-score has been suffering significant fluctuations within five
years. It is below the critic line, but in 2015 has come really close to it,
accounting for -2.4. Cranswick is not considered as a manipulator.
Figure 4.4 represents the stable position of Cranswick’s Altman Z-score.
During the studied period, it is going almost always on the line with its
benchmark, which suggests that the probability of company’s bankruptcy is
pretty high. However, despite slight changes, there is an overall growth from
2.7 in 2010 up to 3.08 in 2015, which is also the minimum and maximum
points.
From the Figure 4.4 one can notice that even if the change in the Altman
variable is not crucial, the less is the Beneish, the lower is the Altman. It leads
to the idea that for Cranswick Plc the accounting manipulations help to keep
the company far from bankruptcy. At the same time, the Altman’s curve is
stable, and the Beneish’s is a fluctuation, that leads to the assumption that it is
-5
-4
-3
-2
-1
0
1
2
3
4
2010 2011 2012 2013 2014 2015
Cranswick Plc
Beneish M Altman Z Beta
Beneish Benchmark Altman Benchmark Standard Deviation

66
possible that there is no dependence of bankruptcy on the accounting
manipulations.
C1: E2V Technologies Plc
Figure 4.5 E2V Technologies Plc Beneish M, Altman Z, Beta and Standard
Deviation curves fluctuation within 2010-2015
E2V Technologies’ Beneish M-score remains below the benchmark except for
the year 2012. It means that the company applied the accounting
manipulations only in 2012.
The Altman’s score is also below its benchmark, however, in this case, it
means that the company’s position is not very stable despite its high market
performance. During the studied years, it improved only in 2011, from the
point of 1.2 to 2.1. In the following years, it was experiencing stagnation.
It is impossible to establish any significant correlation between Altman and
Beneish variable of E2V. Thus, it would be correct to state that the probability
of bankruptcy is not affected by accounting manipulations.
C1: Halma Plc
-4
-3
-2
-1
0
1
2
3
4
2010 2011 2012 2013 2014 2015
E2V Technologies
Beneish M Altman Z Beta
Beneish Benchmark Altman Benchmark Standard Deviation

67
Figure 4.6 Halma Plc Beneish M, Altman Z, Beta and Standard Deviation
curves fluctuation within 2010-2015
The Beneish M-score for the Halma Plc remains below the critical line most of
the time, but still close to it and twice, in 2012 and 2014 the earning
manipulations have been detected. It gives the idea that the Halma’s
managers are not usually totally honest with their stakeholders. Overall, the
Beneish index remains stable.
The Altman Z-score is below its benchmark, which means that despite the fact
that the company is high-performer on the technologies market, it does not
reflect its financial health. During the studied period, the index is stable and
reaches its maximum in 2013, accounting for 2.21.
Before 2014, the reader can notice that the curves have a negative
correlation. Thus, for the majority of the studied period the assumption that the
more the extent of manipulation, the more is the probability of bankruptcy. The
example of Halma Plc proves the opposite of the Dunelm group.
A2: Kingfisher Plc
-3
-2
-1
0
1
2
3
4
2010 2011 2012 2013 2014 2015
Halma Plc
Beneish M Altman Z Beta
Beneish Benchmark Altman Benchmark Standard Deviation
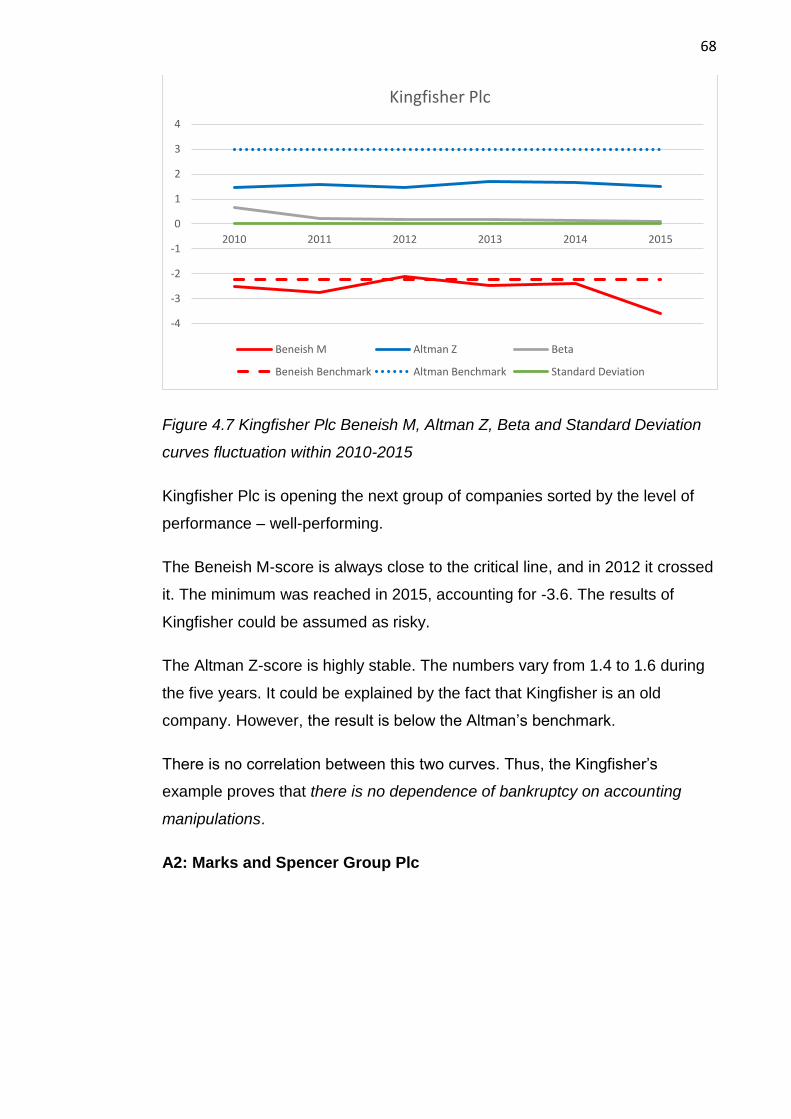
68
Figure 4.7 Kingfisher Plc Beneish M, Altman Z, Beta and Standard Deviation
curves fluctuation within 2010-2015
Kingfisher Plc is opening the next group of companies sorted by the level of
performance – well-performing.
The Beneish M-score is always close to the critical line, and in 2012 it crossed
it. The minimum was reached in 2015, accounting for -3.6. The results of
Kingfisher could be assumed as risky.
The Altman Z-score is highly stable. The numbers vary from 1.4 to 1.6 during
the five years. It could be explained by the fact that Kingfisher is an old
company. However, the result is below the Altman’s benchmark.
There is no correlation between this two curves. Thus, the Kingfisher’s
example proves that there is no dependence of bankruptcy on accounting
manipulations.
A2: Marks and Spencer Group Plc
-4
-3
-2
-1
0
1
2
3
4
2010 2011 2012 2013 2014 2015
Kingfisher Plc
Beneish M Altman Z Beta
Beneish Benchmark Altman Benchmark Standard Deviation

69
Figure 4.8 Marks and Spencer Plc Beneish M, Altman Z, Beta and Standard
Deviation curves fluctuation within 2010-2015
The Beneish M-score of Marks and Spencer is always below the critic line
during the studied period. It has been slightly increasing between 2010 and
2013 from -3.5 to -2.5. After, there was a decrease down to -2.8. Marks and
Spencer cannot be considered as a manipulator.
The Altman Z-score is stable during the five years. It varies from 1.3 to 1.2. It
means that the same as Kingfisher, an old-established company is keeping
the stable position. However there this position is below the benchmark
established. Perhaps, this can be an explanation why such a famous and
robust company is considered not as a market performance star.
There is no correlation between the Altman and Beneish curves.
Consequently, it can be assumed that the example of Marks and Spencer
disprove the dependence of bankruptcy probability on accounting
manipulations. At the same time, both stable variables indicate that the
company’s insolvency is likely, but it could be because it does not apply
accounting manipulations.
B2: Devro Plc
-4
-3
-2
-1
0
1
2
3
4
2010 2011 2012 2013 2014 2015
Marks and Spencer Group Plc
Beneish M Altman Z Beta
Beneish Benchmark Altman Benchmark Standard Deviation

70
Figure 4.9 Devro Plc Beneish M, Altman Z, Beta and Standard Deviation
curves fluctuation within 2010-2015
Devro Plc cannot be considered as a manipulator because the Beneish M-
score is remaining below the critic line. Except for the year 2011, it has been
very stable. The reason for a sudden drop is an increase in the Property, Plant
and Equipment of Devro that has been very well reflected by the increase of
its total assets.
The Altman Z-score during the studied period is falling continuously. In 2010 it
was 2.3 and ended up in 2015 with the number of 0.9. Also, the curve is below
the benchmark, which suggests that the financial health of Devro can be
severely affected.
There is no correlation in-between the two variables of Altman and Beneish.
Thus, the example disproves the assumption of the dependence of bankruptcy
on accounting manipulations. However, it might also be that the company that
experiences terrible times precisely because it shows actual figures.
B2: Tate and Lyle Plc
-5
-4
-3
-2
-1
0
1
2
3
4
2010 2011 2012 2013 2014 2015
Devro Plc
Beneish M Altman Z Beta
Beneish Benchmark Altman Benchmark Standard Deviation

71
Figure 4.10 Tate & Lyle Plc Beneish M, Altman Z, Beta and Standard
Deviation curves fluctuation within 2010-2015
The Beneish M-score of Tate and Lyle clearly indicates that the company
manipulates its accounts. The sudden rise of the Beneish M-score in 2014 can
be explained by the fact, that in 2013 the company has a decrease in sales
from €3.2 million in 2012 to €2.4 million in 2013 and €2.3 million in 2014.
However, the problem is that the costs of sales remained only slightly
changed – €2.5 million in 2013 to €2.3 million in 2014. Overall, the index
majority of the time is on the critic line or above (2011, 2012, 2014)
The Altman-Z score is also below its benchmark, which again is a sign of
problems inside the company. It has been slightly fluctuating for five years. An
interesting thing that it reaches its minimum when the Beneish M-score is at
its peak, accounting for 1.1. However, it is below the benchmark, and it
questions the financial health of the company.
It is impossible to say that there is a significant correlation between Altman Z
and Beneish M, except the case in 2014. That is why the results show that
there is no dependence of bankruptcy on accounting manipulations. At the
same time, the Tate&Lyle’s case can show that a company that is a
manipulator have a high probability of insolvency.
C2: Univision Engineering Plc
-5
-4
-3
-2
-1
0
1
2
3
4
2010 2011 2012 2013 2014 2015
Tate & Lyle Plc
Beneish M Altman Z Beta
Beneish Benchmark Altman Benchmark Standard Deviation

72
Figure 4.11 Univision Engineering Ltd Beneish M, Altman Z, Beta and
Standard Deviation curves fluctuation within 2010-2015
The Beneish M-score curve is fascinating in the case of Univision
Engineering. The Figure 4.11 shows that in 2010 it was accounting for 7,
which is an extremely high point. It can be explained by the fact that in 2009
Univision Engineering had €6 million of total assets and in 2010 it was
reported a number of €17 million, without a significant increase in profit and
with a decreased number for Property, Plant and equipment. Nevertheless,
even without this suspicious peak Univision Engineering is a manipulator
because the majority of the time its Beneish variable is above the critic line.
The Altman Z-score of Univision Engineering was on the borderline of a
benchmark in 2010, accounting for 3. However, within five years, it was falling
to 0.5, which means that the financial stability of the company can be
questioned.
The case of Univision Engineering proves that there is a dependence of
bankruptcy and accounting manipulations because the two curves correlate
positively. This case states for the idea that the more the extent of accounting
manipulations, the more bankruptcy is probable.
The beta variable is decreasing within the period starting from 0.6 in 2010 and
ending at 0.3 in 2015. Comparing to all the previous companies examined son
far, Univision Engineering has the highest rate of vulnerability in the market.
-4
-2
0
2
4
6
8
2010 2011 2012 2013 2014 2015
Univision Engineering Ltd
Beneish M Altman Z Beta
Beneish Benchmark Altman Benchmark Standard Deviation

73
C2: Spectris Plc
Figure 4.12 Spectris Plc Beneish M, Altman Z, Beta and Standard Deviation
curves fluctuation within 2010-2015
The Beneish M-score is relatively high and crosses the critic line once during
the studied period. It means that the company was manipulating its accounts
in 2013.
The Altman Z-score of the Spectris Plc is below its benchmark. It indicates
that the company is likely to be insolvent. At the same time, this indicator
during the studied period does not change significantly, which means that this
position is typical for Spectris Plc.
Since peak for the Altman Z variable was in 2013, accounting for 2. It was also
the peak of the accounting manipulations when the Beneish M was 2,19. It
would be correct to say that the more the company is manipulating its
accounts, the less likely it will face he insolvency.
A3: Debenhams Plc
-4
-3
-2
-1
0
1
2
3
4
2010 2011 2012 2013 2014 2015
Spectris Plc
Beneish M Altman Z Beta
Beneish Benchmark Altman Benchmark Standard Deviation

74
Figure 4.13 Debenhams Plc Beneish M, Altman Z, Beta and Standard
Deviation curves fluctuation within 2010-2015
Beneish M-score of Debenhams Plc remains stable except for the year 2011
when one can see s sudden drop. The researchers cannot explain this by the
data presented in the calculations. Nevertheless, Debenhams Plc is not
considered as a manipulator, because its Beneish variable has never been
more than -2.22, which is a benchmark for the index.
The Altman Z-score is very low for Debenhams, varying between 1.3 (2011)
and 0.4 (2013). It is significantly less than the Altman’s benchmark. Thus the
company is considered not financially stable.
There Figure 4.13 does not reflect any correlation between Altman’ and
Beneish’ curves. It can be assumed, that there is no dependence of
bankruptcy on the accounting manipulations. However, since the Altman’s
curve is below the benchmark, it is also true to say that the probability of
bankruptcy is seen as high because the company does not manipulate its
accounts.
A3: Stanley Gibbons Group Plc
-8
-6
-4
-2
0
2
4
2010 2011 2012 2013 2014 2015
Debenhams Plc
Beneish M Altman Z Beta
Beneish Benchmark Altman Benchmark Standard Deviation

75
Figure 4.14 Stanley Gibbons Group Plc Beneish M, Altman Z, Beta and
Standard Deviation curves fluctuation within 2010-2015
The Beneish M-score of Stanley Gibbons Plc majority of the time is above its
benchmark, which means, that the company can be assumed as a
manipulator. From the beginning of the studied period, the curve is increasing
and reaches its peak in 2013, accounting for -0.2, which is significantly higher
the reasonable level. From 2013 to 2015 the curve is decreasing returning
down to -4.
Stanley Gibbons is the second company in this research that has an Altman
Z-score above the critic line. It represents that the company is financially
robust. It reaches its lowest point in 2014, which is 3.2.
There is no correlation between the two curves representing the Altman’ and
Beneish’ variables. However, the example of Stanley Gibbons suggests that if
the company is applying the accounting manipulations, it is less likely to be
bankrupt.
B3: R. E. A. Holdings Plc
-6
-4
-2
0
2
4
6
2010 2011 2012 2013 2014 2015
Stanley Gibbons Group Plc
Beneish M Altman Z Beta
Beneish Benchmark Altman Benchmark Standard Deviation

76
Figure 4.15 R. E. A. Holdings Plc Beneish M, Altman Z, Beta and Standard
Deviation curves fluctuation within 2010-2015
The Beneish M-score of the R. E. A. fluctuate from -1.5 (2015) to -2.8 (2014).
There are no sudden peaks or drops, however, for the years 2010, 2011 and
2015 the indicator was above the Benchmark. It allows assuming that R. E. A.
applies accounting manipulations.
The Altman Z-score has been decreasing during within five years. Although in
2011 there was a slight growth, it was followed by a gentle drop down to 0.2 in
2015. It indicates that the company’s likelihood of bankruptcy is very high.
What is more, Altman variable matches with the maximum of Beneish.
However, the period between 2011 and 2014 represents the positive
correlation between the two curves. The example of R. E. A. suggests that the
less a company manipulates its accounts, the more the probability of
bankruptcy is.
B3: Premier Foods Plc
-4
-3
-2
-1
0
1
2
3
4
2010 2011 2012 2013 2014 2015
R.E.A. Holdings Plc
Beneish M Altman Z Beta
Beneish Benchmark Altman Benchmark Standard Deviation
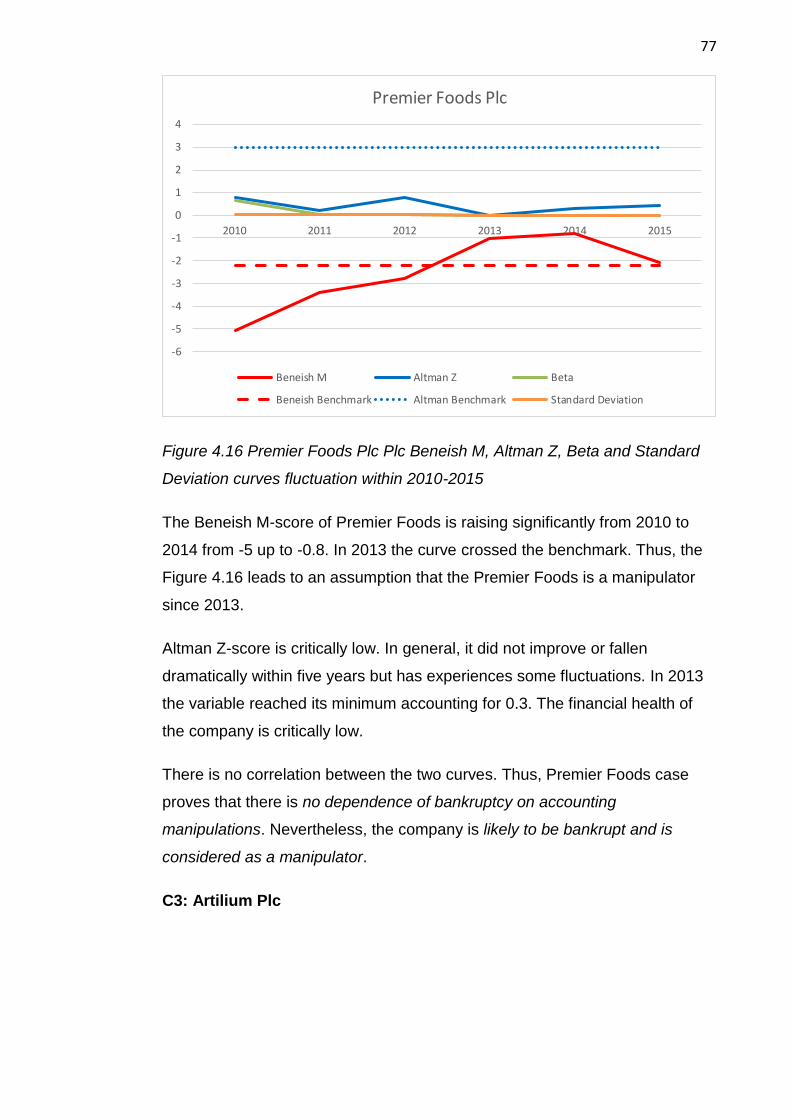
77
Figure 4.16 Premier Foods Plc Plc Beneish M, Altman Z, Beta and Standard
Deviation curves fluctuation within 2010-2015
The Beneish M-score of Premier Foods is raising significantly from 2010 to
2014 from -5 up to -0.8. In 2013 the curve crossed the benchmark. Thus, the
Figure 4.16 leads to an assumption that the Premier Foods is a manipulator
since 2013.
Altman Z-score is critically low. In general, it did not improve or fallen
dramatically within five years but has experiences some fluctuations. In 2013
the variable reached its minimum accounting for 0.3. The financial health of
the company is critically low.
There is no correlation between the two curves. Thus, Premier Foods case
proves that there is no dependence of bankruptcy on accounting
manipulations. Nevertheless, the company is likely to be bankrupt and is
considered as a manipulator.
C3: Artilium Plc
-6
-5
-4
-3
-2
-1
0
1
2
3
4
2010 2011 2012 2013 2014 2015
Premier Foods Plc
Beneish M Altman Z Beta
Beneish Benchmark Altman Benchmark Standard Deviation
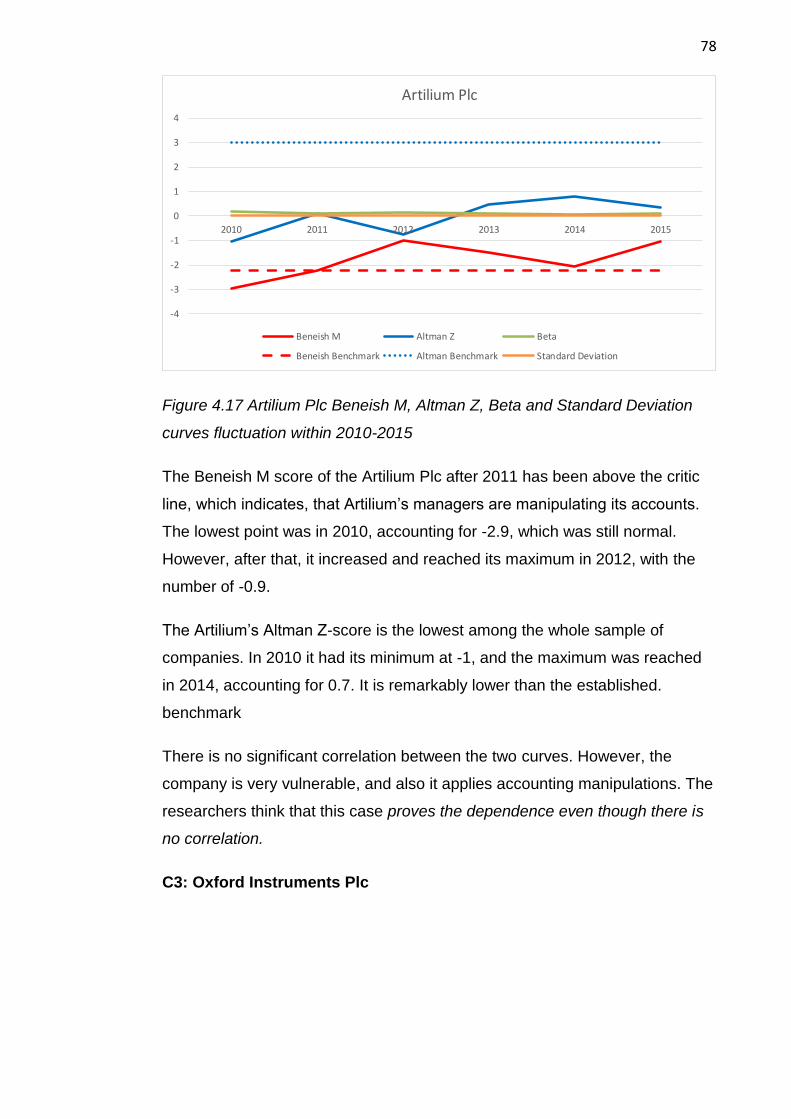
78
Figure 4.17 Artilium Plc Beneish M, Altman Z, Beta and Standard Deviation
curves fluctuation within 2010-2015
The Beneish M score of the Artilium Plc after 2011 has been above the critic
line, which indicates, that Artilium’s managers are manipulating its accounts.
The lowest point was in 2010, accounting for -2.9, which was still normal.
However, after that, it increased and reached its maximum in 2012, with the
number of -0.9.
The Artilium’s Altman Z-score is the lowest among the whole sample of
companies. In 2010 it had its minimum at -1, and the maximum was reached
in 2014, accounting for 0.7. It is remarkably lower than the established.
benchmark
There is no significant correlation between the two curves. However, the
company is very vulnerable, and also it applies accounting manipulations. The
researchers think that this case proves the dependence even though there is
no correlation.
C3: Oxford Instruments Plc
-4
-3
-2
-1
0
1
2
3
4
2010 2011 2012 2013 2014 2015
Artilium Plc
Beneish M Altman Z Beta
Beneish Benchmark Altman Benchmark Standard Deviation

79
Figure 4.18 Oxford Instruments Plc Beneish M, Altman Z, Beta and Standard
Deviation curves fluctuation within 2010-2015
The Beneish M-score of Oxford Instruments is stable during the studied
period. It keeps close to the critic line, however, does not cross it. The
variation of the curve is from -3.2 (2010) to -2.4 (2011). Artilium Plc is not
considered as a manipulator.
The Altman Z-score, most of the time, remains below that benchmark
established. However, in 2012 there is sudden increase up to 5.7. The peak
was followed by a dramatic decrease back to 1.9 in 2013. The variable
reaches its minimum by 2015 with the number of 1.0. Overall, the probability
of bankruptcy is increasing for the Oxford Instruments.
The two curves do not correlate. Since there was no significant change in the
Beneish M-score and the company is not a manipulator, this particular case
proves that the probability of bankruptcy is not dependent on accounting
manipulations.
Overall findings
Majority of the companies in the used sample have an Altman Z-score below
its benchmark, which means that they are all likely to face bankruptcy. It
makes the analysis more difficult. The assumptions about the findings could
be based on two principles: correlation between the curves and their position
to the benchmark. Since the Altman Z-score is almost always below its
-4
-3
-2
-1
0
1
2
3
4
5
6
7
2010 2011 2012 2013 2014 2015
Oxford Instruments Plc
Beneish M Altman Z Beta
Beneish Benchmark Altman Benchmark Standard Deviation

80
benchmark, even if there is any kind of correlation, it might not match with an
assumption based on the position towards benchmark.
For example, the company has a positive correlation of Altman and Beneish’
variables, which suggests that the more the accounting manipulations, the
less likely the company will become bankrupt. However, its Beneish M-score
is above the critical line, and Altman Z-score says that it has problems with
solvency. This gives an opposite suggestion: the company is a manipulator,
and it is likely to face bankruptcy.
There were only three companies, whose Altman Z-score was higher than the
critical line. They were the Dunelm Plc, WH Smith Plc and Stanley Gibbons.
Their codes are the following ones:
A1, A1, C1.
Firstly, this finding means that retail industry is the most reliable one regarding
the probability of bankruptcy. Secondly, Dunelm and Stanley Gibbons are
manipulators. It confirms the confirms the idea of this work that there is a
relation between the probability of bankruptcy and the extent of accounting
manipulations. However, it shows that if the company is solvent, regardless of
its industry and market performance, it applies the accounting manipulations.
For some companies, it is correct to say that the more the company is
applying the accounting manipulations, the more is the probability of
bankruptcy. On the other hand, some of the cases suggest that the more is
the extent of manipulations, the less is the probability of bankruptcy. Some
cases fall into the category of companies that deny the dependence of
bankruptcy on accounting manipulations.
Idea “the more the extent of
accounting manipulations, the
more is the probability of bankruptcy.”
“the more the extent of
accounting manipulations, the
less is the probability of bankruptcy.”
“There is no dependence
between accounting
manipulations and the probability of
bankruptcy.”
Companies* A1, C1, B2, C2, B3, C3
A1, B1, A2, B2, C2, A3, A3, B3
B1, C1, A2, B2, B2, A3, C3

81
Amount** 6 8 7
Table 4.1 The overall analysis of the ideas suggested by the 18 cases of
studied companies
* Only the codes are included in the table because presenting the names of companies does not reflect the critical information. Only the types of the companies matter for analysis.
**Some of the cases fall into two categories at the same time – no dependence and one of the others is possible.
Table 4.1 proves that it is impossible to establish any dependence of the
accounting manipulations on the probability of bankruptcy.
The third objective of the research was to detect that the low-performing
companies are more likely to be a manipulator. According to our findings, only
seven companies out of 18 have not been presenting artificial earnings. Those
codes are:
A1, B1, B1, A2, B2, A3, C3
The codes of the manipulators are:
A1, C1, C1, A2, B2, C2, C2, A3, B3, B3, C3
Based on this findings one can state, that the level of the manipulations is the
lowest in the retail industry. The tech industry is undoubtedly the riskiest one
regarding probability of artificial earnings
Most of the companies that appeared not to be manipulators are the high-
performing companies. However, it is impossible to make an assumption,
because the proportion of high performing manipulators is 50 percent. The
frequency of manipulation detection increases with the decrease of the
performance level. Nevertheless, it is impossible to say that the low-
performing companies are more frequent manipulate accounts.
4.2 Statistics Analysis
The statistical analysis Appendix 4 contains one dependent variable, which is
the Altman-Z score. Beneish M-score, beta and the standard deviation are the
independent variable. This setting has been established to study the impact of
82
accounting manipulations, market risks and internal risk on the probability of
bankruptcy.
From the descriptive analysis, the reader can conclude, that the majority of
sample companies have an Altman-Z score 1.9. It means that most of them
are likely to be bankrupt because the benchmark established for this variable
is 2.9. The mean for Beneish M-score is -2.5, which indicates that on average
the sample companies cannot be considered as manipulators because the
Beneish M-score should not exceed -2.2. The average beta variable is 0.1,
which indicates that the companies are slightly affected by the systematic risk.
On average companies respond by 10 percent to the changes in the market.
The Pearson correlation indicates how the variables behave together and if
there is some typical pattern in their curves.
The correlation between the Altman and the Beneish scores of all the sample
companies is -0.014. (See Appendix 5) The number is close to zero, which
means that the Beneish M-score does not influence the Altman Z-score and
that there is no dependence of bankruptcy on the accounting manipulations.
Since the number is negative, it means that it is more likely that the growth in
Beneish M-score defines the fall in Altman Z-score, which supports the first
idea of the research that the accounting manipulations have a negative impact
on the probability of bankruptcy. Nevertheless, the significance index is 0.44,
(See Appendix 5) which means that the finding does not have a significant
evidence.
The beta and the Altman-Z correlation is also negative, accounting for -0.05,
which is close to zero and it means that there is almost no correlation. It
means that the more the risk that is coming from the market, the more is the
probability of company’s bankruptcy. However, the significance of this finding
is questionable, as the significant index is 0.3. Moreover, the correlation rate is
so relatively low, and it is possible to say that the systematic risk does not
affect the probability of bankruptcy.
The correlation between Altman Z-score and the Standard Deviation is -0.210.
It means that the more is the standard deviation, the less is the Altman Z.
Consequently, it suggests that the more there are overall risks of the

83
company, the closer the company is to the bankruptcy. Since the likelihood of
insolvency is not affected by the external risks, it means that the risk
originates from the management itself.
Another significant finding that the correlation table is suggesting, that the
Beneish M-score and the standard deviation correlate with the rate of 0.4. It
means that in the end, the overall risks of the company do depend on the
probability of bankruptcy more than on the market fluctuations. The
significance index of this finding is zero, which means that the error is highly
unlikely.
The Durbin-Watson test number is 1.7. (Appendix 6) It is a measure of the
probability of error in the calculations, and this number should not exceed 2.5
and be lower than 1.5 (Glen, 2016). Since the generated number falls into the
typical category, it is assumed that the reliability of the whole statistics
calculations is high enough.
5 Discussion
5.1 Hypothesis development
In this chapter, the researchers aim to summarise all the hypothesises from
the beginning of the work and compare them with the results that were
generated during the data analysis process.
The primary objective of the work was to define the relationship between the
accounting manipulations and the probability of bankruptcy, represented by
the Beneish M-score and the Altman Z-score respectively. There were several
possible outcomes.
The primary hypothesis of the researchers was that the management applies
accounting manipulations for their own benefits, such as rewards, bonuses,
additional profit and the tax avoidance. The assumption was built on the
example of the Enron bankruptcy story. In this case, the illegal actions of
management lead to the insolvency. In this case, there should be a negative
correlation between the Beneish M-score and the Altman Z-score.
84
On the other hand, the same result could suggest, that when the company is
suffering from the market instability and is already have problems with liquidity
and investors’ trust, it can apply the accounting manipulations to raise the
foundation and survive. It is why the beta variable was introduced.
The beta measures the market affection of the company’s stock. The
researchers wanted to understand whether the risks are coming from the
market and then the second assumption about the association between
bankruptcy and manipulations would be more likely to be true. For the sake of
making sure about the origins of the risk, the standard deviation has been
introduced. Standard deviation is combining the systematic and unsystematic
risks in one measure.
The sample of the companies examined in the study was carefully chosen
from the public companies in the United Kingdom because its market within
2010 and 2015 did not have any crisis and English economy was experiencing
blooming period.
In order to get the unbiased results, the companies have been taken from the
different types of industries, and they all have different performance results.
The performance result has been assessed by the stock price fluctuation
within the period of time. It helps to have all possible motives for
manipulations. Also, the study wants to examine if the performance of the
company determines the probability of managers being manipulators.
The data analysis has been framed into two types of analysis representing
different points of view. The company-based analysis is showing each case in
particular. It is done to visualise the relationships between Altman Z and
Beneish M score.
5.2 Main findings discussion
The researchers found it challenging to answer the central research question
with this type of analysis, as 15 out of 18 companies had Altman’s score less
than its benchmark – they were all potential future bankrupts. However, it has
been found that all of the companies that were potentially solvent and robust
were from the retail industry. Furthermore, two of them were manipulators,
85
that supports the first idea of this thesis that there is a dependence between
bankruptcy and the quality of annual accounts. Although, it proves that if the
company applies accounting manipulations, its solvency is less likely.
Another interesting finding from the company-based analysis is that the most
manipulative industry is technologies – five out of six technology companies in
the sample appear to be manipulators.
Since the beta and the standard deviation numbers are too small to detect any
fluctuation, any findings related to the second research question about the
nature of the risks were impossible to answer through company-based
analysis.
The statistics analysis examines the company’s indicators regardless of its
belonging to a particular type. The primary purpose of it was to find the
numerical prove of the relationship between the Altman Z and Beneish M and
the analysis of the risk origin.
There is no correlation between the two primary variables studied in this
research, which means that there is no dependence of bankruptcy on the
accounting manipulations. However, since the correlation rate is negative, it
disproves the idea derived from the company-based analysis, that the more
there are the accounting manipulations, the less is the probability of
bankruptcy.
There was no correlation found between the Altman Z-score and the beta. It
means that the market risks do not affect the likelihood of bankruptcy.
Consequently, this risk is coming from the management itself.
There is a relationship between the Altman Z-score and the standard
deviation. It proves that the risk affects the probability of insolvency. Even
though it sounds logical, but in the context of all the findings and that the
systematic risk has no significant affection, it proves that the main risk is the
unsystematic one.
At the last stage of statistical analysis, the researchers have found, that there
is a strong correlation between the standard deviation and the Beneish M-
score. It means, that even though there is no significant relationship between

86
the bankruptcy, companies react on the internal risks with the accounting
manipulations, which, in turns, affect the bankruptcy.
It is also essential to take into consideration the reverse casualty of this
findings: it is not possible to say that it is the internal risks affect the probability
of the company to be a manipulator and not the accounting manipulations that
cause the internal risks.
5.3 Limitations of the research and suggested fields for
studies
The literature review suggests that nowadays there are more accurate
frameworks for the bankruptcy prediction and accounting manipulation
detection. There is no universal opinion on the effectiveness of the Altman Z-
score. It is why the results can be biased by the limitations of the chosen
frameworks.
The researchers have decided to base their assumptions on this particular
models because those are the fundamental systems in the approach and were
well studied in the past.
The company-based analysis has not generated a robust assumption about
the dependence of the frequency of accounting manipulations on the
company’s performance. It is not proved that the low-performing companies
are more tend to manipulate accounts then the well-performers. It is possible
that the sample of 18 companies was not enough.
The authors suggest that setting a more in-depth study of the dependence of
bankruptcy on the accounting manipulations using more innovative models
and more prominent company’s sample. This proposal is due to the reason
that there is a potential dependence because this work’s findings detect the
link between standard deviation.
Another suggestion could be investigating the cause of the phenomenon: is it
the poor quality of annual reports that causes the internal risks or it is the
riskiness of the company that requires “accounting kitchen”?
87
6 Conclusion
The central objective of this research was to find the correlation between the
Altman Z-score and the Beneish M-score that would prove the dependence of
bankruptcy on the accounting manipulations. The results show that there are
no relations between these two phenomena.
There was a negative correlation found between the likelihood of bankruptcy
and the standard deviation. Since there is almost no effect of the beta on the
Altman Z-score, the researchers conclude that the risk that causes the
probability of insolvency is unsystematic and coming from the management of
the company.
The third objective of the research was to detect low-performing companies
applying accounting manipulations more frequently than the others. According
to the findings of this research, the low-performing company tends to
manipulate the accounts as much as the well-performers. It is less likely that
the high-performing companies are cooking its accounts.
Additionally, the study shows that the retail industry is safer than the food
production and the technology industry regarding the probability of
bankruptcy. The retail industry is also the most responsible and reports the
lowest level of accounting manipulations.

88
References
“US Dollar to British pound chart”. 2017. XE.com. The currency rate monitoring resource. Accessed on 06 October 2017. Retrieved from http://www.xe.com/currencycharts/?from=USD&to=GBP&view=10Y
Agrawal A. & Chadha S. 2003.“Corporate Governance and Accounting Scandals”.AFA 2004 San Diego Meeting. Accessed on 2 March 2017. Retrieved from https://papers.ssrn.com/sol3/papers2.cfm?abstract_id=595138
Altman E., Haldeman R. G. & Narayanan P. 1977. “ZETA analysis: A new Model to identify bankruptcy risk of corporations”, Journal of Banking and Finance 1 (1997) 29-54. North-Holland Publishing Company
Altman E.I. 1968. “Financial Ratios, Discriminant Analysis and The Prediction of Corporate Bankruptcy” The Journal of Finance. Volume 23, Issue 4, 589-609. Accessed on 23 October 2017. Retrieved from http://onlinelibrary.wiley.com/doi/10.1111/j.1540-6261.1968.tb00843.x/full
Altman E.I., Iwanicz-Drozdowska M., Laitinen E.K. & Suvas A. 2014. “Distressed Firm and Bankruptcy Prediction in an International Context: A Review and Empirical Analysis of Altman’s Z-Score Model”. Journal of International Financial Management & Accouting. Accessed on 25 October 2017. Retrieved from https://papers.ssrn.com/sol3/papers.cfm?abstract_id=2536340&download=yes
Andreas C., Neophytos l. & Lenos T. 2007. ”Managerial discretion in distressed firms”. The British Accounting Review 39. Pp. 323-346
Arnold, G. 2013. “Essentials of Corporate Financial Management”. Harlow: Pearson
Artilium Plc. 2017. “Company reports”. Summary page with links to the company annual reports. Accessed on 6 December 2016. Retrieved from https://www.artilium.com/investors/financial-performance
Associated British Foods Plc. 2017. “Investors”. Summary page with links to the company annual reports. Accessed on 6 December 2016. Retrieved from https://www.abf.co.uk/investorrelations
Avenhuis J. O. 2013. “Testing the Generalizability of the Bankruptcy Prediction Models of Altman, Ohlson and Zmijewski for Dutch Listed and Large Non-listed Firms”. University of Twente publication. Accessed on 25 October 2017. Retrieved from https://essay.utwente.nl/64326/1/MSc_Oude%20Avenhuis.pdf
Baker M. & Wurgler J. 2007. “Investor sentiment In The Stock Market”. National Bureau of Economic Research. Accessed on 3 March 2017. Retrieved from http://www.nber.org/papers/w13189
Bal G. R., Rao N. S. & Raja S. 2013. “Evidence of Financial Shenanigans from Past and Techniques to Predict Earning Management”, an Article on

89
SSRN. Access on 20 October 2017. Retrieved from file:///H:/THESIS/SSRN-id2208368.pdf
Banz R. W. 1981. “The relations between Return and Market Value of Common Stocks”. Journal of Financial Economies. Vol. 9, 1.
Bemmann M. 2005. “Improving the comparability of insolvent predictions”, Dresden Economic Discusion Paper Series N. 8/5. Accessed on 18 December 2016. Retrieved from file:///C:/Users/Admin/Downloads/SSRN-id731644.pdf
Beneish M. D. 1999. “The Detection of Earnings Manipulations”. Accessed on 23 October 2017. Retrieved through http://citeseerx.ist.psu.edu/viewdoc/download?doi=10.1.1.195.3676&rep=rep1&type=pdf
Bergstresser D. & Philippon T. 2005. “CEO incentives and earnings management”, Journal of Financial Economics 80 (2006). Pp. 511-529
Bishop M. 2009. “Essential economics”. New York, NY: Bloomberg Press. Black F., Jensen M. C. & Scholes M. 1971. “The Capital asset Pricing Model: Some Empirical Tests”. Studies In the Theory of Capital Markets, Preager Publishers Inc. Accessed on 15 December 2017. Retrieved from http://papers.ssrn.com/abstract=908569
Bloxham E. 2010. “The Corporate Governance Alliance Digest”, Value Alliance Company research publication. Accessed on 2 March 2017. https://www.thevaluealliance.com/PDF/CGADigest12012010.pdf
Bradshaw M.T., Drake M.S., Myers J.N. & Myers L.A. 2009. “A re-examination of analysts’ superiority over time-series forecasts”. Review of Accounting tudies, Vol. 17, N. 4, 2012. Accessed on 3 May 2017. Retrieved from http://care-mendoza.nd.edu/assets/152185/bradshawpaper.pdf
Bratton W.W. 2002. “Enron and The Dark Side of the Shareholder Value”. Georgetown University Law Center. Accessed on 21 October2017. Retrieved from http://scholarship.law.georgetown.edu/cgi/viewcontent.cgi?article=1508&context=facpub
Brealey, R. A., Myers, S. C. &Allen F. 2011. “Principles of Corporate Finance”. 10th ed., New York: The McGraw-Hill Companies, Inc.
Brinded l., 2015. “Britain is living through the best time ever”, Business Insider article. Accessed on 14 February 2017. Retrieved from http://www.businessinsider.com/why-britain-is-living-through-the-best-era-ever-uk-economy-jobs-housing-2015-8?r=UK&IR=T&IR=T
BusinessDictionary.com, WebFinance, Inc. Definition of Risk. Accessed on 10 October 2017. Retrieved from http://www.businessdictionary.com/definition/risk.html
Chava S. & Jarrow R. A. 2004. “Bankruptcy Prediction with Industry”. Georgia Institute of Technology, Scheller Collegeof Business and Cornell University, Samuel Curtis Johnson Graduate School of Management joint publication.

90
Accessed on 18 October 2016. Retrieved from file:///C:/Users/Admin/Downloads/SSRN-id287474.pdf
Cheng Q. & Warfield T. 2005. “Equity incentives and earnings management”. Singapore Management University’s research paper. Accessed on 3 May 2017. Retrieved from http://ink.library.smu.edu.sg/cgi/viewcontent.cgi?article=1828&context=soa_research
Copeland, R.M. 1968. ”Income smoothing”. Journal of Accounting Research, Empirical Research in Accounting, Selected Studies 6 (Supplement): 101-116.
Cranswick Plc. 2017. “Report & Account”. Summary page with links to the company annual reports. Accessed on 6 December 2016. Retrieved from https://cranswick.plc.uk/investors/report-accounts
Debenhams Plc. 2017. “Annual reports”. Summary page with links to the company annual reports. Accessed on 6 December 2016. Retrieved from http://phx.corporate-ir.net/phoenix.zhtml?c=196805&p=irol-reportsannual
Dechow M. P., Sloan G. R. & Sweeney P. A. 1996. ”Causes and Consequences of Accounting Manipulations”. Contemporary Accounting Research Vol.13 №.1, p.1-36
Degeorge, F., Patel J.& Zeckhauser R. 1999. ”Earnings management to exceed thresholds”. Journal of Business 72(1): 1-32
Devro Plc. 2017. “Presentations and Webcasts”. Summary page with links to the company annual reports. Accessed on 6 December 2016. Retrieved from http://www.devro.com/investors/presentations-and-webcasts/
Driscoll M. P., 2005, “Psychology of Learning for Instruction”. Pearson Education, 3rd Edition.
Dunelm Group Plc. 2017. “Reports and Presentations”. Summary page with links to the company annual reports. Retrieved from http://dunelm.production.investis.com/investor-relations/reports-and-presentations/2017.aspx
Fedor L. 2016. “UK tech group E”V Technologies sold in £260m deal”, Financial Times. Accessed on 14 December 2017. Retrieved from https://www.ft.com/content/9d3357c5-27e2-343e-98c0-7c2aabe9a4d6 Driscoll M. P., 2005, “Psychology of Learning for Instruction”. Pearson Education, 3rd Edition.
Ferguson J. 2015. “Constructivism (Piaget and Vygotsky)”, a video lecture on YouTube. Accessed on 18 November 2017. Retrieved from https://www.youtube.com/watch?v=Yi8S4YkZI04
Fisher T. C.G., Gavious I. & Martel J. 2006. “Earnings Management and the Firm Value in Chapter 11”. The Journal Of Regulation, Vol. 20, N. 2, pp.207-267, 2003. Accessed on 13 December 2016. Retrieved from file:///C:/Users/Admin/Downloads/SSRN-id2786587.pdf

91
Gaurav A. 2012. “Types of Risk - Systematic and Unsystematic Risk in Finance”. Accessed on 04.10.2017. Retrieved from http://kalyan-city.blogspot.fi/2012/01/types-of-risk-systematic-and.html
Glen S. 2016. ”What is The Durbin Watson Test?”. Statistics How To article. Accessed on 19 November 2017. Retrieved from http://www.statisticshowto.com/durbin-watson-test-coefficient/
Google Finance, 2017, “Stock Screener”. A Financial database for stock price information. Accessed on 14.10.2017. Retrieved from https://finance.google.com/finance#stockscreener
Gov.uk. 2016. “Options when a company is insolvent”. An article on government services web site. Accessed on 1 March 2017. Retrieved from https://www.gov.uk/government/publications/options-when-a-company-is-insolvent/options-when-a-company-is-insolvent
Goyal S & Joshi N. 2012. “The Capital Asset Pricing Model”. Slides in the LinkedIn platform. Accessed on 10 October 2017. Retrieved from https://www.slideshare.net/amritsaab/the-capital-asset-pricing-model-capm-15176518
Gross B. 2014. “Quantitative Finance Stack Exchange: How to calculate unsystematic risk?” An article on Quant Exchange. Accessed on 15 October 17. Retrieved from https://quant.stackexchange.com/questions/2205/how-to-calculate-unsystematic-risk Guriev, S. 2013. “Corporate Sandals”. Russian School of Economy. LinkedIn slides. (Russian language content translated by researchers) Accessed on 15 November 2012. Retrieved from https://www.slideshare.net/EF_MSU/ss-19890683 Accessed on 20.10.2017
Hawks D. 2015. “Systematic & Unsystematic Risk: Definition & Examples”. An article on the Study.com. Accessed on 08 October 2017. Retrieved from http://study.com/academy/lesson/systematic-unsystematic-risk-definition-examples.html Accessed on 15.10.17 Hundal S. 2017. “Financial management Fundamental issues”, JAMK University of Applied Sciences presentation slides. Accessed from the Optima space.
Institute of Business and Finance. 2016. ”Systematic and unsystematic risk”. Accessed on 17 November 2017. Retrieved from http://icfs.com/financial-knowledge-center/systematic-and-unsystematic-risk
Investing Answers. 2017. A definition of Earning management. Accessed on 03 May 2017. Retrieved from http://www.investinganswers.com/financial-dictionary/businesses-corporations/earnings-restatement-5481
Investopedia. 2017. Definition of Covariance. Accessed on 10 November 2017. Retrieved from https://www.investopedia.com/terms/c/covariance.asp
Investopedia. 2017. Definition of Standard Deviation. Accessed on 20.11.2017. Retrieved from https://www.investopedia.com/terms/s/standarddeviation.asp

92
Investopedia. Dfinition of Restatement. Accessed 03 May 2017. Retrieved from http://www.investopedia.com/terms/r/restatement.asp
Jun J. 2010. “How to Detect Earnings Manipulation Using the Beneish M score”. A log post on Old School Value.com. Accessed on 14 April 2017. Retrieved from https://www.oldschoolvalue.com/blog/investment-tools/beneish-earnings-manipulation-m-score/
Kapoor S. 2016.“Financial Reporting Quality in Nordic Countries: A study of 62 publicly listed companies from Finland, Sweden and Denmark”. Bachelor’s thesis. JAMK University of Applied Sciences. Accessed on 03 May 2017. Retrieved from https://www.theseus.fi/bitstream/handle/10024/121053/Kapoor_Shashvat.pdf?sequence=1
Kigfisher. 2017. “Kingfisher’ company overview”. Kingfisher official web site. Accessed on 12 October 2017. Retrieved from http://www.kingfisher.com/index.asp?pageid=15
Kingfisher Plc. 2017. “Company Reports”. Summary page with links to the company annual reports. Accessed on 6 December 2016. Retrieved from https://www.kingfisher.com/index.asp?pageid=61&year=2017#ref_annualreport16-17
Kirkos E. 2012. “Assessing methodologies for intelligent bankruptcy prediction”, Dordrecht journal, Volume 43 Issue 1. 83-123
Konstantinov D. 2015. “Wrongful Trading: comparative approach: England and Wales, Russia and the USA”, BRICS Law Journal №1, volume 2, 2015. Accessed on 01 May 2017. Retrieved from http://cyberleninka.ru/article/n/wrongful-trading-comparative-approach-england-and-wales-russia-and-the-usa
Lo K., Ramos F. & Rogo R. 2017. “Earnings management and annual report readability”. Journal of Accounting and Economics, 63, pp.1-25.
Mansi S. A., Maxwell W. F. & Zhang A. 2010. “Bankruptcy Prediction Models and the Cost of Debt”. Journal of Fixed Income, Forthcoming. Accessed on 25 November 2017. Retrieved from file:///C:/Users/K2298/Downloads/SSRN-id1622407.pdf.
Marks and Spencer Plc. 2017. “Reports, Results & Presentations”. Summary page with links to the company annual reports. Accessed on 6 December 2016. Retrieved from https://corporate.marksandspencer.com/investors/reports-results-and-presentations
Matuleviciene M. & Stravinskiene J. 2015. “The Importance of Stakeholder for Corporate Reputation”. Engineering Economics, 2015, (26(1), p.75-83. Accessed on 4 April 2017. Retrieved from http://inzeko.ktu.lt/index.php/EE/article/view/6921/4972

93
McClure B. 2017. “Beta: Know The Risk” Investopedia.com article. Accessed on 10 November 2017.Retrieved from http://www.investopedia.com/articles/stocks/04/113004.asp
Merriam Webster Dictionary. 2017. Dfinition of Bankruptcy. Accessed on 1 May 2017. Retrieved from https://www.merriam-webster.com/thesaurus/bankruptcy
Miller W. 2009. “Comparing Models of Corporate Bankruptcy Prediction: Distance to Default vs Z-Score”. Morningstar Inc. research paper. Accessed on 28 November 2017. Retrieved from https://papers.ssrn.com/sol3/papers.cfm?abstract_id=1461704&download=yes
Misankova M., Zvarikova K. & Kliestikova J. 2017. ”Bankruptcy Practice In Countries Of Visegrad Four”, Economics and Culture Journal, Volume 14, Issue 1, 108-118
Mlane D.1999. “Standard Deviation and Variance”. An article on Davidmlane.com. Accessed on 15 November 17. Retrieved from http://davidmlane.com/hyperstat/A40397.html Moore M.L. 1973. ”Management changes and discretionary accounting decisions”. Journal of Accounting Research (Spring): 100-107.
O’Brien P.C. “Analysists’ forecasts as earning expectations”. Journal of Accounting and Economics, 10(1). Pp.53-83
Obaidullah J. 2012. Explanation of the Beta coefficient. Retrieved from https://accountingexplained.com/capital/equity-valuation/beta-coefficient
Ortobelli L. S., Petronio, F. & Lando, T. 2015. “A portfolio return definition coherent with the investors' preferences”. IMA Journal of Management Mathematics
Oxford Instruments Plc. 2017. “Financial Reports and Presentations”. Summary page with links to the company annual reports. Accessed on 6 December 2016. Retrieved from https://www.oxford-instruments.com/investors/financial-reports
Perkovic A. 2011. “Research of Beta As Adequate Risk Measure – Is Beta Still Alive?”, Croatian Operational Research Review, Vol. 2, pp. 102-110. Accessed on 15 November 2017. Retrieved from file:///C:/Users/k2298/Downloads/CRORR_2_12.pdf
Premier Foods. 2017. “Result Center”. Summary page with links to the company annual reports. Accessed on 6 December 2016. Retrieved from http://www.premierfoods.co.uk/investors/results-centre
PricewaterhouseCoopers. 2009. “Insolvency in brief: a guide to insolvency terminology and procedure”. LLP publication. Accessed on1 May 2017. Retrieved from http://www.pwc.co.uk/assets/pdf/insolvency-in-brief.pdf
94
R. E. A. Holdings. 2017. “Financial Reports”. Summary page with links to the company annual reports. Accessed on 6 December 2016. Retrieved from http://reagroup.eqs.com/investors/financial-reports
R3 – The association of Business Recovery Professionals. 2008. “Understanding Insolvency”. Publication on the official website. Accessed on 1 March 2017. Retrieved from https://www.r3.org.uk/media/documents/publications/public/Understanding_insolvency_-_October_2008.pdf
Rosner R. 2003. ”Earnings manipulation in failing firms”. Contemporary Accounting Research 20, 361–408.
Saunders M., Lewis P. & Thornhill A. 2009. “Research Methods for Business students” 5th edition.
Scott W.R. 1997. ”Financial Accounting Theory”. Prentice Hall, Scarborough
Shumway T. R. 1999. “Forecasting Bankruptcy More Accurately: A Simple Hazard Model”, Journal of Business. Accessed on 4 December 2016. Retrieved from https://papers.ssrn.com/sol3/papers.cfm?abstract_id=172832
Siddiqui S. A. 2012. “Business Bankruptcy Prediction Models: A Significant Study of the Altman’s Z-Score Model”. Asian Journal of Management Research. Accessed on 25 November 2017. Retrieved from https://papers.ssrn.com/sol3/papers.cfm?abstract_id=2128475&download=yes
Sims R. R. & Brinkmann J. 2003. “Enron Ethics Or Culture Metters More than Codes”, Journal of Business Ethics, Volume 45, 243-256. Accessed on 20 October 2017. Retrieved from https://link.springer.com/article/10.1023/A:1024194519384
Spectris Plc. 2017. “Reports, Results & Presentations”. Summary page with links to the company annual reports. Accessed on 6 December 2016. Retrieved from . http://www.spectris.com/investors/reports-results-and-presentations/2016
Standard Life Self Investor. 2017. “FTSE100 v FTSE250 – why consider one or another?” Accessed on 11 November 2017. Retrieved from https://www.standardlifeselfinvestor.co.uk/invest/news-and-insights/article.page?p=ftse-100-v-ftse-250-consider-one
Stanley Gibbons Plc. 2017. “Group Financial Information”. Summary page with links to the company annual reports. Accessed on 6 December 2016. Retrieved from http://www.stanleygibbonsplc.com/investor-relations/group-financial-information/
Stanley Gibbons. 2017.Company Information. Accessed on 19 November 2017. Retrieved from http://www.stanleygibbonsplc.com/company-info/
Stein J. C. 1989. “Efficient Capital Markets, Inefficient Firms: A Model of Myopic Corporate Behavior”. The Quarterly Journal of Economics, Vol. 104, No. 4. Pp.655-669.

95
Steven N. 2017. “What is the formula for calculating beta?” Investopedia.com article. Accessed on 20 October 2017. Retrieved from http://www.investopedia.com/ask/answers/070615/what-formula-calculating-beta.asp Accessed on 10.10.2017
Tate & Lyle Plc. 2017. “Investor Hub”. Summary page with links to the company annual reports. Accessed on 6 December 2016.Retrieved from https://www.tateandlyle.com/investors/annual-reports?active=3&field=field_left_link
Tebogo B. 2011. “Does The Enron Case Study Provide Valuable Lessons in the Early Detection of Corporate Fraud?”. The Learning Village (Pty) Ltd research paper. Accessed on 23 November 2017 Retrieved from file:///H:/THESIS/SSRN-id1906045.pdf
Tedelyne E2V Plc. 2017. “Historical Financial information”. Summary page with links to the company annual reports. Accessed on 6 December 2016. Retrieved from https://www.e2v.com/about-us/historic-financial-information/
The Economic Times. 2017. The definition of the standard deviation. Accessed on 18 November 2017. Retrieved from https://economictimes.indiatimes.com/definition/Standard-Deviation
Tracinski R. W. 2002. “Enron Ethics”. Capitalism Magazine. Accessed on 20 October 2017. Retrieved from http://capitalismmagazine.com/2002/01/enron-ethics/
Tricker B. 2012. “Business ethics is the bedrock of corporate governance”, an article on corporategovernanceoup.wordpress.com. Accessed on 2 March 2017. Retrieved from https://corporategovernanceoup.wordpress.com/2012/09/06/business-ethics-is-the-bedrock-of-corporate-governance/
Tricker B., & Mallin C. 2010. “Is director independence so important?”, An article on corporategovernanceoup.wordpress.com. Accessed on 2 March 2017. Retrieved from https://corporategovernanceoup.wordpress.com/2010/12/06/is-director-independence-so-important/,
United States Courts. “Bankruptcy Basics”. Accessed on 08 October 2017. Retrieved from http://www.uscourts.gov/services-forms/bankruptcy/bankruptcy-basics/chapter-11-bankruptcy-basics
Univision Engineering Ltd. 2017. “Key Financial Information”. Summary page with links to the company annual reports. Accessed on 6 December 2016. Retrieved from http://www.uvel.com/profile13.html
Van Horne J. C. & Wachowicz J. 2008. “Fundamentals of Financial Management”, Pearson Education Limited, 13th Edition.
Warren M. 2009. “Comparing Models of Corporate Bankruptcy Prediction: Distance to Default vs Z-Score”. Morningstar Inc. research paper. Accessed on 9 November 2017. Retrieved from https://papers.ssrn.com/sol3/results.cfm

96
WebFinance, Inc. 2017. Definition of Risk. Accessed on 20 August 2017. Retrieved from http://www.businessdictionary.com/definition/risk.html.
WH Smith Plc. 2017. “WH Smith Plc Annual Reports”. Summary page with links to the company annual reports. Accessed on 6 December 2016. Retrieved from http://www.whsmithplc.co.uk/investors/company_reports/annual_reports
Wissem E. 2013. “Risks Management”. Polish Journal of Management Studies, 8, p.p. 290. Yahoo Finance. 2017. FTSE100 quote. A financial database for stock price information. Accessed on 14 October 2017. Retrieved from https://finance.yahoo.com/quote/%5EFTSE?p=^FTSE
Zopounidis C. & Galariotis E. 2015. “Quantitative Financial Risk Management: Theory and Practice”, Wiley.
Appendices
Appendix 1. Beneish M, Altman Z, Beta and Standard Deviation output (Year-
on-year basis) for each company in the sample.
Year Beneish M Altman Z Beta Standard Deviation Year Beneish M Altman Z Beta Standard Deviation
2010 -3,00591 4,713645 0,578584 0,02276931 2010 -2,96528 3,355195 0,436411 0,01410311
2011 -2,52222 4,132769 0,143302 0,021432663 2011 -3,85474 3,301114 0,196912 0,015166829
2012 -2,79546 3,951671 0,123203 0,017465825 2012 -2,97373 3,416923 0,158309 0,012983832
2013 -2,40923 4,746158 0,092116 0,016692051 2013 -2,90426 3,534076 0,13154 0,014640846
2014 -2,11376 4,740589 0,102779 0,015921722 2014 -2,62868 3,638653 0,12643 0,015506654
2015 -3,06263 4,576139 0,05747 0,014734916 2015 -2,6235 3,90933 0,107658 0,012131454
Year Beneish M Altman Z Beta Standard Deviation Year Beneish M Altman Z Beta Standard Deviation
2010 -2,82829 1,676968 0,498873 0,012936513 2010 -2,52077 2,742238 0,19013 0,017409676
2011 -2,38787 1,573721 0,179769 0,013103769 2011 -2,48904 2,825807 0,135937 0,017506452
2012 -2,79348 1,802787 0,135996 0,008912803 2012 -3,60176 2,831635 0,13353 0,013730582
2013 -2,77489 2,033244 0,105752 0,013436133 2013 -2,8002 3,041548 0,113431 0,01322476
2014 -2,93867 2,11874 0,11548 0,016123933 2014 -3,80551 2,87362 0,105199 0,014728609
2015 -3,77363 2,155742 0,09031 0,014616128 2015 -2,42335 3,089301 0,087431 0,013503913
Year Beneish M Altman Z Beta Standard Deviation Year Beneish M Altman Z Beta Standard Deviation
2010 -2,72237 1,282478 -0,11919 0,033931584 2010 -2,64323 1,97575 0,592424 0,016085745
2011 -2,61771 2,145651 -0,17447 0,026822071 2011 -2,51446 1,831524 0,182627 0,016572251
2012 -2,23146 1,996889 -0,15005 0,025584163 2012 -2,24895 1,771075 0,11707 0,013439426
2013 -2,43934 2,212709 -0,11829 0,019905778 2013 -3,62884 2,214347 0,105865 0,011639521
2014 -2,95964 1,852637 -0,10159 0,014688401 2014 -2,18013 1,842718 0,094104 0,011443117
2015 -2,53605 2,132524 -0,10153 0,013852704 2015 -2,6735 1,604405 0,071189 0,011926099
A1
B1
C1
Dunelm Group Plc WH Smith Plc
Associated British Foods Plc Cranswick Plc
E2V Technologies Halma Plc

97
Year Beneish M Altman Z Beta Standard Deviation Year Beneish M Altman Z Beta Standard Deviation
2010 -3,00591 4,713645 0,578584 0,02276931 2010 -2,96528 3,355195 0,436411 0,01410311
2011 -2,52222 4,132769 0,143302 0,021432663 2011 -3,85474 3,301114 0,196912 0,015166829
2012 -2,79546 3,951671 0,123203 0,017465825 2012 -2,97373 3,416923 0,158309 0,012983832
2013 -2,40923 4,746158 0,092116 0,016692051 2013 -2,90426 3,534076 0,13154 0,014640846
2014 -2,11376 4,740589 0,102779 0,015921722 2014 -2,62868 3,638653 0,12643 0,015506654
2015 -3,06263 4,576139 0,05747 0,014734916 2015 -2,6235 3,90933 0,107658 0,012131454
Year Beneish M Altman Z Beta Standard Deviation Year Beneish M Altman Z Beta Standard Deviation
2010 -2,82829 1,676968 0,498873 0,012936513 2010 -2,52077 2,742238 0,19013 0,017409676
2011 -2,38787 1,573721 0,179769 0,013103769 2011 -2,48904 2,825807 0,135937 0,017506452
2012 -2,79348 1,802787 0,135996 0,008912803 2012 -3,60176 2,831635 0,13353 0,013730582
2013 -2,77489 2,033244 0,105752 0,013436133 2013 -2,8002 3,041548 0,113431 0,01322476
2014 -2,93867 2,11874 0,11548 0,016123933 2014 -3,80551 2,87362 0,105199 0,014728609
2015 -3,77363 2,155742 0,09031 0,014616128 2015 -2,42335 3,089301 0,087431 0,013503913
Year Beneish M Altman Z Beta Standard Deviation Year Beneish M Altman Z Beta Standard Deviation
2010 -2,72237 1,282478 -0,11919 0,033931584 2010 -2,64323 1,97575 0,592424 0,016085745
2011 -2,61771 2,145651 -0,17447 0,026822071 2011 -2,51446 1,831524 0,182627 0,016572251
2012 -2,23146 1,996889 -0,15005 0,025584163 2012 -2,24895 1,771075 0,11707 0,013439426
2013 -2,43934 2,212709 -0,11829 0,019905778 2013 -3,62884 2,214347 0,105865 0,011639521
2014 -2,95964 1,852637 -0,10159 0,014688401 2014 -2,18013 1,842718 0,094104 0,011443117
2015 -2,53605 2,132524 -0,10153 0,013852704 2015 -2,6735 1,604405 0,071189 0,011926099
A1
B1
C1
Dunelm Group Plc WH Smith Plc
Associated British Foods Plc Cranswick Plc
E2V Technologies Halma Plc

98
Appendix 2. Input data for Beneish-M score calculations for each company
Dunelm Group Plc 2009 2010 2011 2012 2013 2014 2015
Net Receivables 10739 10470 14566 17054 18344 19479 19122
Sales 423783 492839 538474 603729 677192 730152 835805
Current Asets 92650 88422 126160 168465 156411 156747 168437
PPE 88771 102599 125850 146313 151060 152866 158946
Current Liabilities 74365 83383 98839 110693 115499 88945 100905
Long Term Debt 127 152 645 297 0 0 91000
Total Assets 187264 196223 256702 318016 313193 322656 342404
Net Income 37621 54350 59932 71475 81795 86454 98160
COGS 233628 262235 280125 311992 347448 368851 424649
SG&A 137560 155126 175051 196537 223206 245273 288672
Depreceation 8005 9494 12170 16233 20358 20257 21436
Cash Flow from Operattions 67444 71951 74025 91891 100399 103834 118195
WH Smith Plc 2009 2010 2011 2012 2013 2014 2015
Net Receivables 57000 56000 57000 54000 51000 54000 52000
Sales 1340000 1312000 1273000 1243000 1186000 1161000 1178000
Current Asets 262000 285000 259000 246000 233000 235000 230000
PPE 163000 158000 151000 155000 149000 147000 155000
Current Liabilities 281000 300000 307000 305000 288000 294000 279000
Long Term Debt 8000 6000 6000 4000 2000 0 0
Total Assets 494000 513000 498000 483000 463000 457000 456000
Net Profit 51000 56000 58000 76000 82000 86000 137000
COGS 685000 650000 611000 579000 531000 502000 498000
SG&A 81000 80000 490000 567000 551000 72000 79000
Depreceation 41000 39000 38000 39000 37000 36000 38000
Cash Flow from Operattions 113000 104000 118000 115000 119000 116000 145000
Associated British Foods Plc 2009 2010 2011 2012 2013 2014 2015
Net Receivables 1121000 1079000 1259000 1236000 1342000 1293000 1176000
Sales 9255000 10167000 11065000 12252000 13315000 12943000 12800000
Current Asets 3015000 2795000 3163000 3269000 3424000 3626000 3849000
PPE 3519000 3941000 4465000 4541000 4552000 4701000 4518000
Current Liabilities 2460000 2127000 2545000 2588000 2526000 2684000 2742000
Long Term Debt 1202000 1212000 1301000 1287000 1203000 858000 5997000
Total Assets 9033000 9288000 10202000 10267000 10374000 10412000 10219000
Net Profit 383000 569000 577000 583000 533000 552000 516000
COGS 7085000 7554000 8347000 9390000 10095000 9793000 881000
SG&A 1554000 1801000 1918000 2010000 2145000 2072000 2076000
Depreceation 372000 405000 330000 416000 535000 496000 408000
Cash Flow from Operattions 833000 1172000 736000 1240000 1276000 1439000 1175000
Cranswick Plc 2009 2010 2011 2012 2013 2014 2015
Net Receivables 84066 78665 85534 93097 97775 116905 116799
Sales 740338 758422 820775 875171 994905 1003336 1016314
Current Asets 126211 116157 144846 149889 170967 181168 191370
PPE 106137 123262 130853 147386 156578 166087 178477
Current Liabilities 102890 95310 99027 113840 115628 125244 128331
Long Term Debt 59695 57776 49394 35519 33635 28884 6468
Total Assets 362587 377695 400157 149889 170967 493552 510058
Net Profit 32264 35968 34653 36973 39754 40852 45395
COGS 643535 657166 718605 768633 877012 878968 926869
SG&A 22347 20832 23076 21870 28643 27297 40714
Depreceation 11852 12440 13972 15486 17831 18349 21224
Cash Flow from Operattions 32204 51584 45533 49812 40759 54392 83834
A1
B1
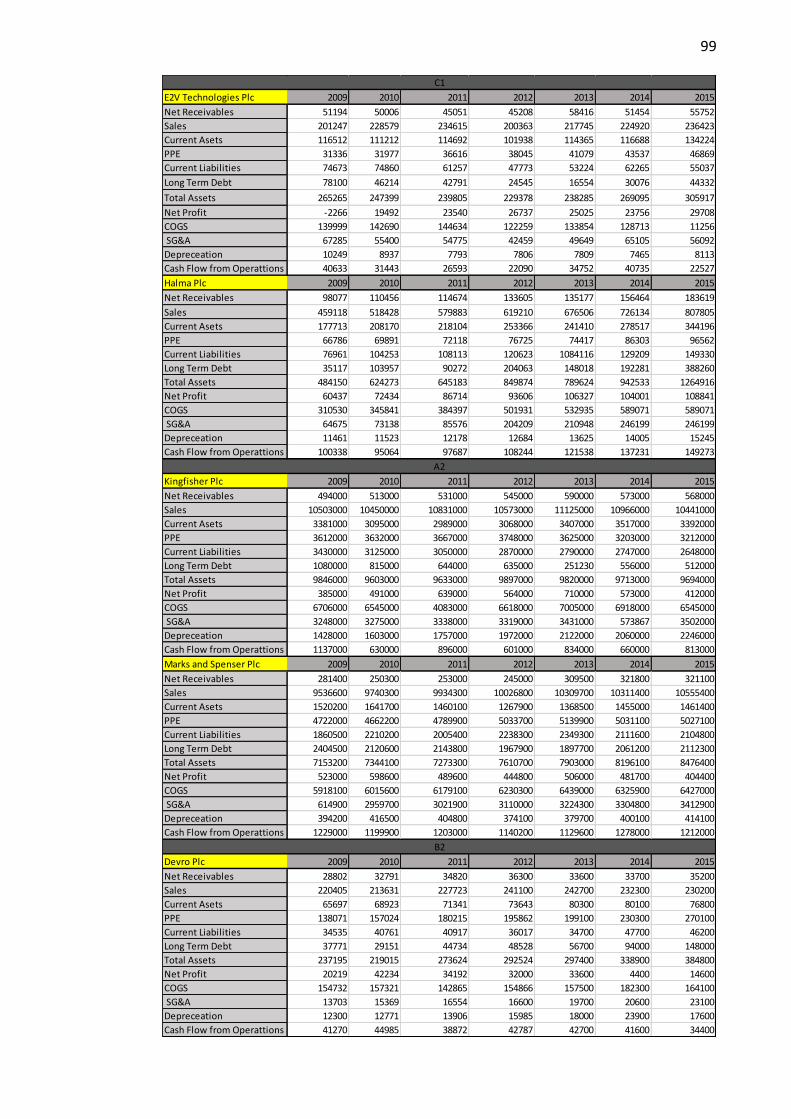
99
E2V Technologies Plc 2009 2010 2011 2012 2013 2014 2015
Net Receivables 51194 50006 45051 45208 58416 51454 55752
Sales 201247 228579 234615 200363 217745 224920 236423
Current Asets 116512 111212 114692 101938 114365 116688 134224
PPE 31336 31977 36616 38045 41079 43537 46869
Current Liabilities 74673 74860 61257 47773 53224 62265 55037
Long Term Debt 78100 46214 42791 24545 16554 30076 44332
Total Assets 265265 247399 239805 229378 238285 269095 305917
Net Profit -2266 19492 23540 26737 25025 23756 29708
COGS 139999 142690 144634 122259 133854 128713 11256
SG&A 67285 55400 54775 42459 49649 65105 56092
Depreceation 10249 8937 7793 7806 7809 7465 8113
Cash Flow from Operattions 40633 31443 26593 22090 34752 40735 22527
Halma Plc 2009 2010 2011 2012 2013 2014 2015
Net Receivables 98077 110456 114674 133605 135177 156464 183619
Sales 459118 518428 579883 619210 676506 726134 807805
Current Asets 177713 208170 218104 253366 241410 278517 344196
PPE 66786 69891 72118 76725 74417 86303 96562
Current Liabilities 76961 104253 108113 120623 1084116 129209 149330
Long Term Debt 35117 103957 90272 204063 148018 192281 388260
Total Assets 484150 624273 645183 849874 789624 942533 1264916
Net Profit 60437 72434 86714 93606 106327 104001 108841
COGS 310530 345841 384397 501931 532935 589071 589071
SG&A 64675 73138 85576 204209 210948 246199 246199
Depreceation 11461 11523 12178 12684 13625 14005 15245
Cash Flow from Operattions 100338 95064 97687 108244 121538 137231 149273
Kingfisher Plc 2009 2010 2011 2012 2013 2014 2015
Net Receivables 494000 513000 531000 545000 590000 573000 568000
Sales 10503000 10450000 10831000 10573000 11125000 10966000 10441000
Current Asets 3381000 3095000 2989000 3068000 3407000 3517000 3392000
PPE 3612000 3632000 3667000 3748000 3625000 3203000 3212000
Current Liabilities 3430000 3125000 3050000 2870000 2790000 2747000 2648000
Long Term Debt 1080000 815000 644000 635000 251230 556000 512000
Total Assets 9846000 9603000 9633000 9897000 9820000 9713000 9694000
Net Profit 385000 491000 639000 564000 710000 573000 412000
COGS 6706000 6545000 4083000 6618000 7005000 6918000 6545000
SG&A 3248000 3275000 3338000 3319000 3431000 573867 3502000
Depreceation 1428000 1603000 1757000 1972000 2122000 2060000 2246000
Cash Flow from Operattions 1137000 630000 896000 601000 834000 660000 813000
Marks and Spenser Plc 2009 2010 2011 2012 2013 2014 2015
Net Receivables 281400 250300 253000 245000 309500 321800 321100
Sales 9536600 9740300 9934300 10026800 10309700 10311400 10555400
Current Asets 1520200 1641700 1460100 1267900 1368500 1455000 1461400
PPE 4722000 4662200 4789900 5033700 5139900 5031100 5027100
Current Liabilities 1860500 2210200 2005400 2238300 2349300 2111600 2104800
Long Term Debt 2404500 2120600 2143800 1967900 1897700 2061200 2112300
Total Assets 7153200 7344100 7273300 7610700 7903000 8196100 8476400
Net Profit 523000 598600 489600 444800 506000 481700 404400
COGS 5918100 6015600 6179100 6230300 6439000 6325900 6427000
SG&A 614900 2959700 3021900 3110000 3224300 3304800 3412900
Depreceation 394200 416500 404800 374100 379700 400100 414100
Cash Flow from Operattions 1229000 1199900 1203000 1140200 1129600 1278000 1212000
Devro Plc 2009 2010 2011 2012 2013 2014 2015
Net Receivables 28802 32791 34820 36300 33600 33700 35200
Sales 220405 213631 227723 241100 242700 232300 230200
Current Asets 65697 68923 71341 73643 80300 80100 76800
PPE 138071 157024 180215 195862 199100 230300 270100
Current Liabilities 34535 40761 40917 36017 34700 47700 46200
Long Term Debt 37771 29151 44734 48528 56700 94000 148000
Total Assets 237195 219015 273624 292524 297400 338900 384800
Net Profit 20219 42234 34192 32000 33600 4400 14600
COGS 154732 157321 142865 154866 157500 182300 164100
SG&A 13703 15369 16554 16600 19700 20600 23100
Depreceation 12300 12771 13906 15985 18000 23900 17600
Cash Flow from Operattions 41270 44985 38872 42787 42700 41600 34400
A2
B2
C1

100
Tate & Lyle Plc 2009 2010 2011 2012 2013 2014 2015
Net Receivables 424000 291000 332000 321000 256000 290000 301000
Sales 2533000 2720000 3088000 3256000 2754000 2356000 2355000
Current Asets 1509000 1626000 1389000 1151000 1062000 930000 1064000
PPE 1208000 855000 922000 812000 732000 750000 926000
Current Liabilities 878000 836000 676000 527000 706000 704000 650000
Long Term Debt 1178000 917000 830000 837000 479000 495000 577000
Total Assets 3288000 3051000 2906000 2716000 2468000 2423000 2554000
Net Profit 19000 167000 309000 273000 273000 30000 163000
COGS 2577000 2417000 2684000 2922000 2503000 2323000 2228000
SG&A 650000 596000 393000 429000 388000 475000 480000
Depreceation 99000 91000 85000 91000 83000 85000 80000
Cash Flow from Operattions 145000 587000 231000 251000 286000 179000 188000
Univision Engineering Ltd 2009 2010 2011 2012 2013 2014 2015
Net Receivables 4400,341 14842,916 14643,264 15706,652 14299,649 4323,003 2460,855
Sales 6473,743 8576,363 7780,444 7313,425 8925,96 3675,494 3866,521
Current Asets 6255,232 16767,699 16238,976 17672,453 15962,439 7001,815 4312,344
PPE 197,093 108,864 109,766 25,83 25,83 47,629 42,629
Current Liabilities 8526,52 11399,074 9007,964 9752,682 6219,352 4406,804 2505,939
Long Term Debt 5,06 0,947 21,918 15,699 7,415 0,641 0
Total Assets 6478,155 17953,775 17714,965 19221,143 17356,486 10048,709 11035,891
Net Profit -10348,258 8231,381 1747,025 184,405 2904,73 112,555 -340,609
COGS 4339,985 5209,729 5505,251 5060,805 6573,248 2613,541 2615,802
SG&A 1791,992 2094,328 1791,289 1802,837 1822,732 995,057 1057,162
Depreceation 55,043 82,498 78,402 65,904 49,086 14,605 16,546
Cash Flow from Operattions 1299,545 470,023 421,67 47,53 548,606 327,764 21,764
Spectris Plc 2009 2010 2011 2012 2013 2014 2015
Net Receivables 164800 194800 220800 208800 215800 157700 182500
Sales 987300 901900 1106200 1230800 1202000 1173700 1190000
Current Asets 313400 391300 438600 439600 427100 444200 494500
PPE 107600 110500 152700 152500 159000 162500 160800
Current Liabilities 261900 273900 304200 368500 249800 298700 258400
Long Term Debt 96200 139400 417400 236500 184700 152600 196000
Total Assets 843900 973200 1362900 1331600 1308800 1406500 1459100
Net Profit 426000 96200 126300 140200 200000 135100 113800
COGS 342000 375000 457500 518000 504400 497300 506900
SG&A 292800 323500 384900 421400 414800 414900 440900
Depreceation 27400 28800 39800 47600 50500 47600 59000
Cash Flow from Operattions 101500 154400 169300 187200 152300 155200 153400
Debenhams Plc 2009 2010 2011 2012 2013 2014 2015
Net Receivables 68500 73400 72100 75400 78300 74700 78000
Sales 1915600 2119900 2209800 2229800 2282200 2312700 2322700
Current Asets 537100 447100 423600 459500 470500 486300 459700
PPE 669200 676100 634600 661600 692100 689200 675300
Current Liabilities 611500 1083600 715600 727000 741900 758000 695700
Long Term Debt 764200 124400 318700 314000 295000 277200 251900
Total Assets 2135800 2087300 2018200 2091200 2132800 2148400 2142600
Net Profit 95100 97000 117200 125300 115900 87200 93500
COGS 1650700 1838900 1913100 1927500 1982600 2033400 2023500
SG&A 82700 98100 113000 127300 144200 150700 165100
Depreceation 96000 94100 92000 91600 94600 100800 104200
Cash Flow from Operattions 158400 207200 1994400 201500 199300 206800 218100
Stanley Gibbons Plc 2009 2010 2011 2012 2013 2014 2015
Net Receivables 9848 8866 9178 11668 14144 19604 15574
Sales 23365 26429 35704 35599 51772 60046 59137
Current Asets 22199 25478 29209 39162 65896 94452 81465
PPE 1103 1862 2032 2145 6294 7974 4916
Current Liabilities 4310 6151 7261 8536 18357 35082 35960
Long Term Debt 161 629 401 233 1288 11004 18565
Total Assets 23730 28386 33526 43994 107250 143756 107941
Net Profit 80 -113 4531 4766 2135 772 -29294
COGS 13454 14859 21872 20031 28937 29108 35304
SG&A 5891 7115 8787 10205 20481 28693 52152
Depreceation 122 202 351 439 982 1539 1913
Cash Flow from Operattions 4110 1784 3575 414 -4341 -8025 -6141
C2
A3

101
R.E.A. Holdings Plc 2009 2010 2011 2012 2013 2014 2015
Net Receivables 8604 18057,06 21863,68 19614,55 17175 11724,02 19499,01
Sales 47331 71844,57 94565,12 76006 66328,2 57897,9 60645,05
Current Asets 29859,6 50008,14 58422,4 49114,76 48326,4 26629,86 39000,03
PPE 43354,8 53857,44 65398,4 88822,1 88198,8 69539,12 104280,14
Current Liabilities 14496,6 19063,8 23119,36 22688,95 37067,4 39673,16 54558,1
Long Term Debt 31738,8 37238,67 46707,84 62722,03 85572 66530,26 113739,2
Total Assets 223186,8 278855,64 326727,68 347096,1 360567,6 279996,02 437064,45
Net Profit 20038,8 19182,87 32682,88 9539,79 -9029,4 4599,54 2028,76
COGS 20370,6 30606,03 43555,84 38775,26 41940,6 35840,44 48512,02
SG&A 5122,2 7360,29 11953,92 12505 12149,4 8149,36 8575,33
Depreceation 2002,2 2339,82 3484,16 3681,35 5964 4715,92 7439,68
Cash Flow from Operattions 17786,4 13413,96 21616,64 19806,7 458,4 11220,32 13442,21
Premier Foods Plc 2009 2010 2011 2012 2013 2014 2015
Net Receivables 347000 356300 297400 298600 248300 123500 100500
Sales 2529700 2438000 1999500 1756200 8562000 964300 771700
Current Asets 584700 901100 514800 550000 501500 237000 173300
PPE 635200 538600 417300 374200 196300 183300 187800
Current Liabilities 868800 995800 757200 691600 532400 267600 214100
Long Term Debt 1296700 1147900 1220600 1240900 818700 587600 541800
Total Assets 3699600 3499500 2611000 2387000 2059900 1913400 2083700
Net Profit -309100 -82300 -422000 -172100 -390500 179300 307700
COGS 1771400 1690900 1445000 1261200 556100 630800 476200
SG&A 574500 655900 730100 394700 245400 377600 241000
Depreceation 123600 126500 113800 92900 61100 66100 53700
Cash Flow from Operattions 68300 1800500 -29100 4200 87500 3400 95400
Artilium Plc 2009 2010 2011 2012 2013 2014 2015
Net Receivables 1887 1160 1126 2384 2946 2348 5263
Sales 6615 3183 6121 3477 11240 10150 7651
Current Asets 4241 2754 2165 3584 5935 2955 6035
PPE 450 323 189 146 99 420 354
Current Liabilities 4220 3959 3057 8341 7570 4240 6832
Long Term Debt 338 2504 39 828 657 497 555
Total Assets 16490 14291 13066 20310 22405 19014 22191
Net Profit -13421 -3059 -2892 -3344 -235 170 -616
COGS 3074 1016 830 783 2977 2292 1882
SG&A 15090 6253 6441 5983 8688 7963 6561
Depreceation 856 745 584 252 803 609 596
Cash Flow from Operattions -3429 -3002 -2173 -2077 2310 -1665 -623
Oxford Instruments Plc 2009 2010 2011 2012 2013 2014 2015
Net Receivables 57600 60200 52500 61000 71800 80900 87300
Sales 206500 211500 262300 337300 350800 360100 385500
Current Asets 111600 112400 125900 159100 171700 188100 189900
PPE 23500 22800 23600 28200 32900 34400 33100
Current Liabilities 84600 82900 88600 112600 118600 128600 144400
Long Term Debt 39400 26300 14600 7000 6200 153400 150200
Total Assets 201300 197400 208500 284700 321500 481600 474400
Net Profit 3100 -6400 44100 400 12200 6900 -7400
COGS 115800 120900 152800 190000 194500 200300 214500
SG&A 77600 75900 81400 93500 101900 112400 139600
Depreceation 8100 7900 8700 16000 8500 19700 27300
Cash Flow from Operattions 14400 31100 39200 50500 50400 21200 24800
B3
C3

102
Appendix 3. Input data for Altman Z-score calculations for each company
Dunelm Group Plc 2010 2011 2012 2013 2014 2015
Total Assets 196223 256702 318016 313193 322656 342404
Current Assets 88422 126160 168465 156411 156747 168437
Current Liabilities 83383 98839 110693 115499 88945 100905
Net Profit 54350 59835 71222 81454 89072 96071
Dividends paid 14029 17119 24248 29386 33411 41458
EBIT 75460 83298 95200 106538 116028 122484
Sales 492839 538474 603729 677192 730152 835805
Number of shares 201040,15 201490,108 202255,248 202830,188 202833,931 202833,931
Total Liabilities 83535 99484 110990 115499 132919 237336
Share prie 0,3989 0,47 0,5585 0,985 0,8315 0,895
WH Smith Plc 2010 2011 2012 2013 2014 2015
Total Assets 513000 498000 483000 463000 457000 456000
Current Assets 285000 259000 246000 233000 235000 230000
Current Liabilities 300000 307000 305000 288000 294000 279000
Net Profit 69000 73000 80000 87000 92000 101000
Dividends paid 26000 29000 31000 34000 38000 42000
EBIT 89000 93000 102000 107000 117000 124000
Sales 1312000 1273000 1243000 1186000 1161000 1178000
Number of shares 151000 139000 130000 123000 119000 115000
Total Liabilities 327000 404000 388000 361000 356000 309000
Share prie 0,4532 0,4937 0,6465 0,827 1,083 1,564
Associated British Foods Plc 2010 2011 2012 2013 2014 2015
Total Assets 9288000 10202000 10267000 10347000 10412000 10219000
Current Assets 2795000 3163000 3269000 3424000 3626000 3849000
Current Liabilities 2127000 2542000 2588000 2526000 2684000 2742000
Net Profit 569000 577000 873000 628000 783000 516000
Dividends paid 200000 212000 223000 232000 256000 271000
EBIT 819000 842000 873000 1088000 1080000 937000
Sales 10167000 11065000 12252000 13315000 12943000 12800000
Number of shares 791674 791674 791674 791674 791674 791674
Total Liabilities 3544000 6175000 4025000 3855000 3704000 3708000
Share prie 1,049 1,11 1,289 1,876 2,679 3,34
Cranswick Plc 2010 2011 2012 2013 2014 2015
Total Assets 377695 400157 426980 459254 493552 510058
Current Assets 116157 144846 149889 170967 181168 191370
Current Liabilities 95310 99027 113840 115628 125244 128331
Net Profit 35326 37480 36241 43207 41252 43395
Dividends paid 10508 11831 11404 12700 15350 14593
EBIT 48717 46736 50041 55782 53737 62709
Sales 758442 820775 875171 994905 1003336 1016314
Number of shares 47636,135 48034,791 48527,532 48961,889 49255,746 49844,854
Total Liabilities 156763 154225 153316 156543 161179 142055
Share prie 0,7535 0,805 1,057 1,197 1,424 2,144
E2V Technologies Plc 2010 2011 2012 2013 2014 2015
Total Assets 247399 239805 229328 238285 269095 305917
Current Assets 11212 114692 101938 114365 116688 134224
Current Liabilities 74860 31257 47773 53224 62265 55037
Net Profit 19492 23540 26729 25025 23756 29708
Dividends paid 0 10373 8729 9054 9746 11335
EBIT 30489 35206 35631 34242 31138 39075
Sales 228579 234615 200363 217745 224920 236423
Number of shares 214861,91 214946,456 218496,459 218780,046 219249,569 220187,058
Total Liabilities 126152 108369 77378 53573 99264 57816
Share prie 0,135 0,146 0,119 0,16675 0,23225 0,23225
A1
B1
C1

103
Halma Plc 2010 2011 2012 2013 2014 2015
Total Assets 624273 645183 849874 789624 942533 1264916
Current Assets 208170 218104 253366 241410 278517 344196
Current Liabilities 104253 108113 120623 108416 219209 149330
Net Profit 72434 86714 95216 106327 104001 108841
Dividends paid 32891 35232 37765 40485 43399 46473
EBIT 99449 109910 118367 143571 137063 142643
Sales 518428 579883 619210 676506 726134 807805
Number of shares 378235,69 37855,028 378880,622 379018,522 379645,332 379645,332
Total Liabilities 268888 247071 396607 303624 393585 618576
Share prie 0,3735 0,4051 0,5005 0,5615 0,7125 0,892
Kingfisher Plc 2010 2011 2012 2013 2014 2015
Total Assets 9603000 9633000 9897000 9820000 9713000 9694000
Current Assets 3095000 2989000 3068000 3407000 3517000 3392000
Current Liabilities 3125000 3050000 2870000 2790000 2747000 2648000
Net Profit 491000 639000 564000 710000 573000 412000
Dividends paid 129000 178000 221000 224000 234000 232000
EBIT 698000 807000 692000 736000 652000 526000
Sales 10450000 10831000 10573000 11125000 10966000 10441000
Number of shares 2364000 2369000 2379000 2376000 2350000 2376000
Total Liabilities 4143000 3906000 3741000 3503000 3483000 3508000
Share prie 0,2544 0,2842 0,2697 0,394 0,3654 0,3343
Marks and Spenser Plc 2010 2011 2012 2013 2014 2015
Total Assets 7344100 7273300 7567700 7903000 8196100 8476400
Current Assets 1641700 1460100 1267900 1368500 1455000 1461400
Current Liabilities 2210200 2005400 2238300 2349300 2111600 2104800
Net Profit 598000 489600 458000 506000 481700 404400
Dividends paid 247500 267800 271300 273600 280700 301700
EBIT 836000 746500 756000 694500 701300 584100
Sales 9740300 9934300 10026800 10309700 10311400 10555400
Number of shares 1584863,9 1605507,102 1613888,192 1632247,974 1647814,75 1622964,807
Total Liabilities 4666700 4494500 5081300 5196300 4997300 5033000
Share prie 0,3614 0,325 0,4307 0,4252 0,536 0,892
Devro Plc 2010 2011 2012 2013 2014 2015
Total Assets 237195 273624 292524 297400 338900 384800
Current Assets 68923 71341 73643 80300 80100 76800
Current Liabilities 40761 40917 36017 34700 7200 46200
Net Profit 42234 34192 32000 33600 4400 14600
Dividends paid 9034 12227 13423 14200 14700 14700
EBIT 57072 42692 43248 42100 6400 19200
Sales 213631 227723 241100 242700 232300 230200
Number of shares 163609,01 165008,564 165633,564 166779,23 166921,042 166932,532
Total Liabilities 84195 133145 145598 139400 205700 257700
Share prie 0,2301 0,2662 0,341 0,3096 0,2815 0,299
Tate & Lyle Plc 2010 2011 2012 2013 2014 2015
Total Assets 3051000 2906000 2716000 2468000 2423000 2554000
Current Assets 1626000 1389000 1151000 1062000 930000 1064000
Current Liabilities 836000 676000 527000 706000 704000 650000
Net Profit 167000 309000 273000 273000 30000 163000
Dividends paid 70000 112000 119000 124000 130000 130000
EBIT 303000 404000 336000 251000 33000 127000
Sales 2720000 3088000 3256000 2754000 2341000 2355000
Number of shares 468111,34 468160,519 468192,9 468202,883 468223,975 468235,944
Total Liabilities 2078000 1848000 1751000 1418000 1487000 1525000
Share prie 0,9535 0,6925 0,8445 0,701 0,5965 0,588
A2
B2

104
Univision Engineering Ltd 2010 2011 2012 2013 2014 2015
Total Assets 17953,775 17714,965 19221,143 17356,486 10048,709 11035,891
Current Assets 16767,699 16238,976 17672,453 15962,439 7001,815 4312,344
Current Liabilities 11399,074 9007,964 9752,682 6219,352 4406,804 2505,939
Net Profit 8231,381 1747,025 184,405 2904,73 112,555 -340,609
Dividends paid 0 0 32,648 242,558 1,149 1,234
EBIT 8251,434 1762,725 241,683 2918,229 33,016 137,711
Sales 8576,363 7780,444 7313,425 8925,96 3675,494 3866,521
Number of shares 1697,617 1697,617 1697,617 1697,617 1697,617 1697,617
Total Liabilities 11400,021 9029,882 9752,682 6219,352 4407,445 5721,589
Share prie 0,0004 0,00043 0,00088 0,00082 0,00102 0,00068
Spectris Plc 2010 2011 2012 2013 2014 2015
Total Assets 973200 1362900 1331700 1308800 1406500 1459100
Current Assets 391300 438600 439600 427100 444200 494500
Current Liabilities 273900 304200 368500 249800 298700 258400
Net Profit 96200 126300 141300 200000 135100 113800
Dividends paid 28900 33800 45600 47700 52300 56900
EBIT 127900 175800 196500 185900 168300 143600
Sales 901900 1106200 1230800 1202000 1173700 1190000
Number of shares 125000 125000 125000 125000 125000 125000
Total Liabilities 459600 758700 640600 464700 490500 493100
Share prie 1,35 1,531 2,214 2,222 2,09 1,582
Debenhams Plc 2010 2011 2012 2013 2014 2015
Total Assets 2087300 2018200 2091200 6132800 2148400 2142600
Current Assets 447100 423600 459500 470500 486300 459700
Current Liabilities 1083600 715600 727000 741900 758000 695700
Net Profit 97000 117200 125300 127900 87200 93500
Dividends paid 0 12900 38500 41400 41700 41700
EBIT 189700 183700 175000 168000 128600 134100
Sales 2119900 2209800 2229800 2282200 2312700 2322700
Number of shares 1286806,3 1286806,299 1286806,299 1286843,441 1286843,44 1286852,54
Total Liabilities 1583900 1358600 1430200 1388400 1381000 829600
Share prie 0,0653 0,05635 0,1024 0,1022 0,0583 0,079
Stanley Gibbons Plc 2010 2011 2012 2013 2014 2015
Total Assets 28386 33018 47994 107250 143756 107941
Current Assets 25478 29209 39162 65896 94452 81465
Current Liabilities 6151 7261 8536 18357 35082 35960
Net Profit -113 4531 4766 2135 772 -29294
Dividends paid 1322 1449 1581 1940 3385 824
EBIT 4287 5108 5363 2354 2245 -28319
Sales 26429 35704 35599 51772 60046 59137
Number of shares 25177,443 25262,311 28421,499 46597,859 47120,357 47120,357
Total Liabilities 7398 9189 12290 23305 76270 69549
Share prie 0,1735 0,1795 0,256 0,348 0,23685 0,01725
R.E.A. Holdings Plc 2010 2011 2012 2013 2014 2015
Total Assets 280745,64 326727,68 347096,1 360567,6 389559,68 437064,45
Current Assets 50008,14 58422,4 49114,76 48326,4 37050,24 39000,03
Current Liabilities 19063,8 23119,36 22688,95 37067,4 55197,44 54558,1
Net Profit 22032,99 29192,96 10798,83 7603,2 14067,84 3284,34
Dividends paid 3122,91 5057,92 6154,29 6618 7948,8 8461,43
EBIT 35448,21 46559,36 23087,28 16846,8 20554,24 11540,75
Sales 71844,57 94565,12 76006 66328,2 80553,6 60645,05
Number of shares 60478,226 77483,098 83414,545 87195,352 94638,001 100613,261
Total Liabilities 130478,04 132842,88 154927,8 180903 193319,68 228255,6
Share prie 0,75 0,6675 0,47113 0,4695 0,3265 0,265
C2
A3
B3

105
Appendix 4. Descriptive statistics
Mean Std. Deviation N
Altman 1,9433867 1,30371440 108
Beneish -2,5299887 1,24965163 108
Beta ,1323564 ,18996810 108
Standard Deviation ,0222 ,01648 108
Premier Foods Plc 2010 2011 2012 2013 2014 2015
Total Assets 3499500 2611000 2387000 20599000 1913400 2083700
Current Assets 901100 514800 550000 501500 237000 173300
Current Liabilities 995800 757200 691600 532400 267600 214100
Net Profit -99300 -339000 12800 -245900 -123600 29200
Dividends paid 0 0 0 0 0 0
EBIT 93100 -176300 96300 52600 -44100 54500
Sales 2438000 1999500 1756200 856200 964300 771700
Number of shares 2398022,6 239805,802 239806,206
Total Liabilities 2510000 2038300 1982100 2042000 1373200 1235200
Share prie 0,13954 0,07861 0,06125 0,09385 0,04625 0,039
Artilium Plc 2010 2011 2012 2013 2014 2015
Total Assets 14291 13066 20310 22405 19014 22191
Current Assets 2754 2165 3584 5935 2955 6035
Current Liabilities 3959 3057 8341 7570 2240 6832
Net Profit -3059 -2892 -3344 -235 170 -616
Dividends paid 0 0 0 0 0 0
EBIT -3913 -919 -3273 -337 78 -719
Sales 3183 6121 3477 11240 10150 9651
Number of shares 90446,964 143278,794 186706,349 216474,437 218925,385 236115,914
Total Liabilities 8878 3148 9190 8243 4737 7387
Share prie 0,0099 0,01013 0,00938 0,00813 0,00625 0,00625
Oxford Instruments Plc 2010 2011 2012 2013 2014 2015
Total Assets 197400 208500 284700 321500 481600 474400
Current Assets 112400 125900 159100 171700 188100 189900
Current Liabilities 82900 88600 112600 118600 128600 144400
Net Profit 13300 32200 24800 22000 18200 -6300
Dividends paid 4100 4100 4800 5600 6400 7100
EBIT 10200 27500 334700 33300 24000 3300
Sales 211500 262300 337300 350800 360100 385500
Number of shares 49567,328 50174,913 56166,723 56916,83 57250,835 57291,336
Total Liabilities 145200 115000 157600 183800 341400 348900
Share prie 0,28475 0,7455 1,224 1,54 1,289 0,93
C3

106
Appendix 5. Altman Z, Beneish M, Beta and Standard Deviation correlations
Altman Beneish Beta
Standard
Deviation
Pearson Correlation Altman 1,000 -,014 -,050 -,210
Beneish -,014 1,000 ,020 ,417
Beta -,050 ,020 1,000 ,270
Standard
Deviation
-,210 ,417 ,270 1,000
Sig. (1-tailed) Altman . ,442 ,304 ,014
Beneish ,442 . ,419 ,000
Beta ,304 ,419 . ,002
Standard
Deviation
,014 ,000 ,002 .
N Altman 108 108 108 108
Beneish 108 108 108 108
Beta 108 108 108 108
Standard
Deviation
108 108 108 108
Appendix 6. Model Summary.
Model R R Square
Adjusted R
Square
Std. Error of the
Estimate Durbin-Watson
1 ,226a ,051 ,024 1,28815248 1,712
a. Predictors: (Constant), Standard Deviation, Beta, Beneish
b. Dependent Variable: Altman
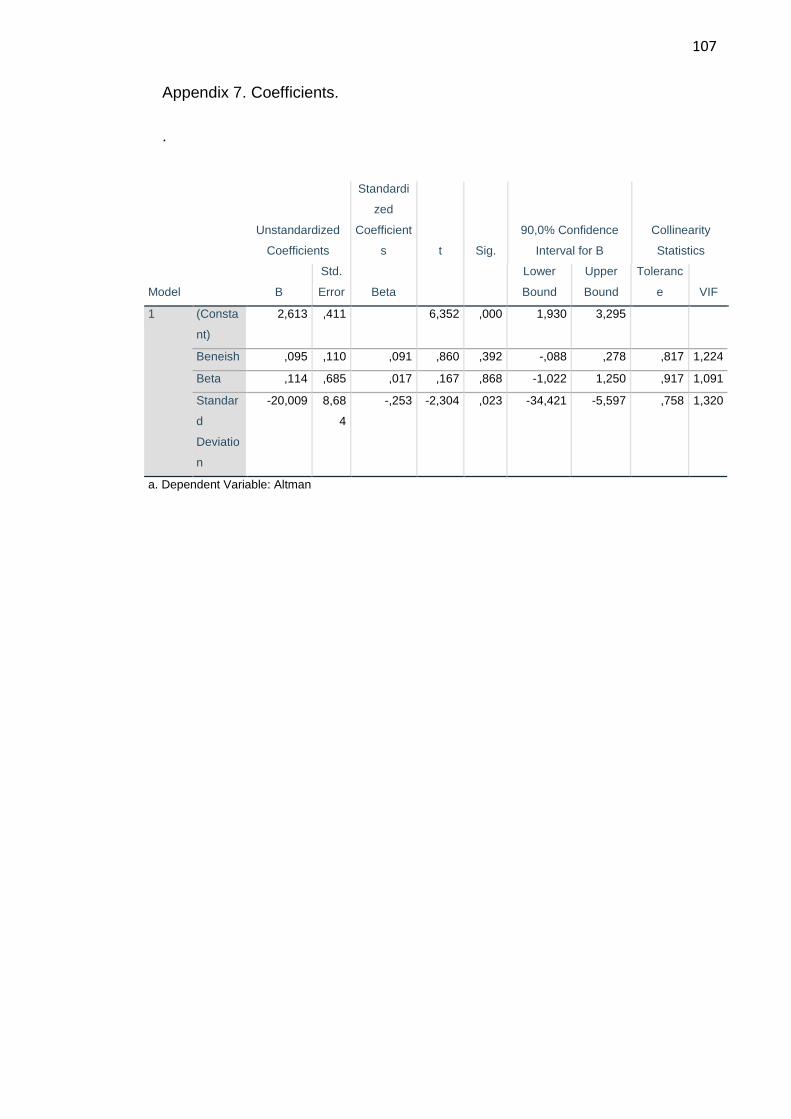
107
Appendix 7. Coefficients.
.
Model
Unstandardized
Coefficients
Standardi
zed
Coefficient
s t Sig.
90,0% Confidence
Interval for B
Collinearity
Statistics
B
Std.
Error Beta
Lower
Bound
Upper
Bound
Toleranc
e VIF
1 (Consta
nt)
2,613 ,411
6,352 ,000 1,930 3,295
Beneish ,095 ,110 ,091 ,860 ,392 -,088 ,278 ,817 1,224
Beta ,114 ,685 ,017 ,167 ,868 -1,022 1,250 ,917 1,091
Standar
d
Deviatio
n
-20,009 8,68
4
-,253 -2,304 ,023 -34,421 -5,597 ,758 1,320
a. Dependent Variable: Altman

108