a study by 2 - transportenvironment.org · 2 a study by transport & environment published:...
TRANSCRIPT


2
a study by
Transport & Environment Published: November 2018 In house analysis by Transport & Environment Coordination: Faig Abbasov
Expert group: Faig Abbasov, Thomas Earl, Carlos Calvo Ambel, Bill Hemmings and Lucy Gilliam
© 2018 European Federation for Transport and Environment, AISBL
Further Information Faig Abbasov Shipping Officer Transport & Environment
[email protected] Tel: +32(0)483717928
Square de Meeûs, 18, 2nd floor | B-1050 | Brussels | Belgium www.transportenvironment.org | @transenv | fb: Transport & Environment

3
a study by
Executive Summary
Shipping is one of the largest greenhouse gas (GHG) emitting sectors of the global economy, responsible for around 1 Gt of CO2eq every year.1 If shipping were a country, it would be the 6th
emissions,
emitting on average 200 Mt/year. 2 This report assesses potential technology pathways for decarbonising EU related shipping through a shift to zero carbon technologies and the impact such a move could have on renewable electricity demand in Europe. It also identifies key policy and sustainability issues that should be considered when analysing and supporting different
technology options to decarbonise the maritime sector. The basis of the study is outbound
journeys under the geographical scope of the EU ship MRV Regulation.
We have not tried to quantify the emissions reductions that specific regulatory measures to be
introduced at the IMO or EU level might contribute towards decarbonisation by 2050 because there are too many uncertainties. We have taken a more limited first approach and investigated
how zero carbon propulsion pathways that currently seem feasible to decarbonise shipping, would likely affect the future EU renewable energy supply needs.
It is now generally accepted that ship design efficiency requirements, while potentially having an important impact on future emissions growth, will fall well short of what is needed. Further operational efficiency measures, such as capping operational speed, will be important to
immediately peak energy consumption and emissions, but will be insufficient to decarbonise the sector or reduce its growing energy needs. In this context, this study assumes that with all the
likely immediate measures adopted, energy demand for EU related shipping will still grow by 50% by 2050 over 2010 levels. This is within the range of the 20-120% global BAU maritime energy
demand growth estimate.3
The decarbonisation of shipping will require changes in on-board energy storage and use and the
necessary accompanying bunkering infrastructure. This study identifies the technology options
for zero emission propulsion that, based on current know-how, are likely to be adopted. It is not
exhaustive nor prescriptive because the ultimate pathways will likely depend on both the
requirements of the shipping industry in terms of cost, efficiency and safety, and on the future renewable electricity sources that the shipping sector will need to compete for.
Literature is nascent on the different techno-economic options likely to be available to decarbonise shipping and individual ships 4 , but almost completely lacking on the possible
impacts of maritime decarbonisation on the broader energy system(s). Understanding these impacts is nevertheless essential, because it will influence financial and economic decision
making by the EU and member states, including those related to investment in future renewable energy supplies and new ship bunkering infrastructure.
With this in mind, the report aims to provide a preliminary first answer to the following question:
Under different zero emission technology pathways, how much additional renewable electricity would be needed to cater for the needs of EU related shipping in 2050?
1 3rd IMO GHG study, 2014. 2 Ricardo-AEA, Technical annex: support for the impact assessment of a proposal to address maritime transport greenhouse gas
emissions, Ref: CLIMA.B.3/SER/2011/0005, 2013. 3 CE Delft, Update of Maritime Greenhouse Gas Emission Projections, 2017 4 E.g. Zero-Emission Vessels 2030. How do we get there? Decarbonising Maritime Transport by 2035,
ITF, 2018.

4
a study by
Main findings & recommendations
Maritime transport is only one of the many sectors of the European economy that will need to rely on renewable energy in order to decarbonise. Together with other sectors, shipping will add additional stress on European renewable electricity production, around the order of magnitude of the current EU power sector, which itself is yet to fully decarbonise. It is therefore essential in our
view that any regulatory and economic policies to support any of the shipping technology pathways analysed in this report take account of this impact and prioritise those minimising the impact on renewable energy demand while maintaining the highest sustainability criteria. From this viewpoint:
We recommend to prioritise battery-electric and hydrogen (pure and/or in the form of ammonia) technologies from sustainable renewable sources to decarbonise shipping.
Although battery-electric propulsion appears to be the most efficient use of primary energy, a
tech mix - battery, hydrogen, ammonia - is a more likely pathway for the different segments of EU shipping - domestic, intra-EU and extra-EU. Varying combinations of battery-electric and carbon-free fuels are likely to be pursued depending on the available renewable energy.
Even though a technology mix of batteries, liquid hydrogen and ammonia appears to be an optimal solution, the impact on the future EU renewable electricity production should not be
underestimated. A very considerable level of additional investment will be required not only in the renewables sector, but also in electricity transmission grids, shore-side charging stations, hydrogen/ammonia production plants, new ship propulsion and energy storage
designs and the widespread provision of new port bunkering infrastructure. This speaks to the absolute necessity of including maritime transport in the development of an EU 2050
economy-wide decarbonisation strategy and the subsequent financial, investment and regulatory decisions that will be needed.
The complete decarbonisation of EU-related shipping in 2050 would require 11-53% additional renewable electricity generation across the EU28 over the 2015 levels. This range is
estimated on the assumption that EU maritime emissions will grow by around 50% between 2010 and 2050, taking into account the deployment of a range of short & mid-term measures, EEDI & SEEMP, speed reduction and wind propulsion.

5
a study by
In the technology mix pathway, which under T&E assumptions uses liquid hydrogen and liquid
ammonia in addition to battery electric propulsion, decarbonising EU shipping would require around 25% of additional electricity generation over and above the EU 2015 levels.
In terms of different segments of EU related shipping, the least additional renewable
electricity demand would likely be associated with EU short-sea shipping (SSS) - ships mostly
engaged in domestic and some intra-EU shipping. Ostensibly, this is due to smaller ships and shorter individual journeys associated with SSS. This suggests that immediate EU regulatory focus on decarbonising SSS would be preferable in order to smooth the transition to zero emission shipping with gradual increase in additional renewable electricity demand.
The least additional demand on renewable electricity supply would likely be associated with decarbonising EU short-sea shipping (SSS). These are typically smaller ships mostly engaged
in coastal shorter individual journeys. The technology is readily available to start this process and range can be extended as technology matures. Such an initial focus would be preferable by involving a more gradual increase in additional renewable electricity demand.
We found the least energy efficient technology pathways to decarbonise shipping to be those
based on synthetic hydrocarbons - electro-methane and electro-diesel, using CO2 from air capture. These pathways would require around 42% and 53% respectively of additional renewable electricity generation in the EU28 over 2015 levels.
In addition, since synthetic methane and synthetic diesel would still emit GHG at the vessel
level, the practical enforcement of their use under any emission reduction requirement could be very challenging, if not impossible for port/flag authorities. This because these synthetic
fuels have very similar chemical characteristics to their fossil equivalents making it very difficult to easily distinguish between them (especially when blended); and since synthetic
fuels are an order of magnitude more expensive than their fossil equivalents, the large price
difference would provide a strong incentive for operators to cheat on any regulatory requirement to use these synthetic fuels thus creating a large competitive distortion.
Furthermore, the theoretical climate neutrality of synthetic methane would not be achieved
if, as with LNG, methane leakage and slip were to take place during the transportation, bunkering and on-board combustion of the fuel. Technology pathways delivering zero GHG emissions at the vessel level would seem to be preferable.
There are also implications for the current investment in fossil LNG bunkering infrastructure for ships, which it is claimed could be used in the future for synthetic methane bunkering.
Since synthetic methane is one of the least sustainable and enforceable technology pathways for shipping, this report also warns against public investment in LNG bunkering infrastructure with the hope that it would underpin synthetic methane uptake in the future.
Although this repor t quantified biofuel pathways for shipping, the enforcement and
sustainability problems we have identified involving synthetic methane seem to be applicable
to biofuels, too
sustainability criteria for biofuels nationally/regionally due to and the mobility of bunker fuel suppliers in avoiding strict regulation. Port-state control of sustainability would be problematic too, as sustainable and non-sustainable biofuels would
have similar apparent physical properties and be difficult to differentiate without mass
spectrometry analysis in high-tech laboratories. The latter are not necessarily at hand everywhere and it would be economically unsustainable to test every ship. Blending and mixing along the fuel supply chain and tank mingling with other fuels, would create even further difficulties for those port-state controls deciding to perform random checks. These all come in addition to sustainability and availability issues surrounding biofuels. Therefore, we
recommend to reserve any available sustainable biofuels to the aviation sector.

6
a study by
Table of Contents
1. The problem ............................................................................................................ 7
2. The political context ................................................................................................ 7
3. Zero emission technologies for ships ......................................................................... 9
3.1. Battery-powered ships (BPSs) ........................................................................................... 9 3.2. Hydrogen Fuel-Cells ....................................................................................................... 10 3.3. Hydrogen in ICE ............................................................................................................. 10 3.4. Ammonia Fuel-Cells ....................................................................................................... 10 3.5. Ammonia ICE ................................................................................................................. 11
3.6. Synthetic diesel ............................................................................................................. 12
3.7. Synthetic methane ........................................................................................................ 12
3.8. Role for biofuels? ........................................................................................................... 12
4. Implications on the primary energy demand for renewable electricity ....................... 13
4.1. Results & Discussions ..................................................................................................... 14 4.1.1. Battery-electric .................................................................................................................................... 15
4.1.2. Hydrogen and Ammonia ...................................................................................................................... 17 4.1.3. Synthetic methane and diesel ............................................................................................................. 17
5. Conclusions ........................................................................................................... 18
Appendix I: Detailed Methodology ................................................................................. 19
Appendix II: Battery-electric, hybrid & hydrogen ships .................................................... 21
Appendix III: Fuel-Cell technologies ............................................................................... 22

7
a study by
1. The problem Transport is now the largest sectoral emitter of CO2 and global shipping emitted almost 1 billion tonnes of GHG in 2015, equal to 2.6% of all anthropogenic CO2 emissions related to energy use. Shipping emissions
have grown by some 70% since 1990 and are projected to increase by between 50% and 250% by 2050.5 This means that on a business-as-usual pathway, total shipping emissions could account for about 18% of
worldwide greenhouse gas emissions by 2050.6
Shipping also emits a range of air and water pollutants causing a range of health and environmental issues. Ship engines, which predominantly burn heavy fuel oil (HFO), contribute to emissions of sulphur dioxides
(SO2), nitrogen oxides (NOx) and particulate matter (PM). The latter includes soot/black carbon (BC), which is not only the second most powerful climate forcer after CO2, but also particularly harmful to human health. Both NOx and SOx are precursors to secondary PM. NOx is also a precursor of ground-level ozone (O3), a gas
that has severe negative impacts on human health. Sulphur oxide and sulphur dioxide (SO and SO2) are toxic gases that are both harmful to human health, plant vegetation and the fabric of buildings. The Danish
Centre for Energy, Environment and Health (CEEH) found that European ship emissions were responsible for around 50,000 premature deaths every year.7 Nitrogen oxides are formed during fuel combustion in the engine and have a significant eutrophication
effect on freshwater bodies, soils and coastal areas. Studies show that ultrafine particles are the most health harming fraction of PM and are emitted in tremendous numbers when diesel is burnt with no exhaust after
treatment8, as is the case for shipping. The World Health Organization (WHO) published a report in July 2012 confirming that BC from diesel combustion is as carcinogenic as asbestos.9
2. The political context Addressing ship emissions is complicated by long-standing lack of agreement at UNFCCC level on their
attribution to countries. Ship emissions are currently reported as a memo item in inventories submitted to
the UNFCCC based on national fuel sales. These reports do not correctly reflect emissions arising from ship
voyages either departing or arriving at countries as oceangoing ships can travel for weeks before needing to refuel. This mobility prevents individual countries from imposing fuel taxes as ships can easily bunker
elsewhere or from taking unilateral action on their registered ships as individual ships can change flag by
simply sending an overnight email.
Harmonised regulation at the global level through the IMO is therefore regarded as the preferable approach. But with little real progress so far. The 1997 Kyoto Protocol Article 2.2 assigned responsibility to reduce
maritime bunker emissions to Annex 1 countries working through the International Maritime Organisation (IMO) - a UN specialised agency, but it was only in November 2003 that the IMO Council tasked its Marine
Protection Environment Committee (MEPC) to consider measures to control ship emissions as a matter of priority. In 2011 the IMO Energy Efficiency Design Index (EEDI) was agreed setting a mandatory energy
efficiency standard for all new ships constructed from 2013. Following various studies10 as to its efficacy, the
IMO commenced changes have yet been made. The EEDI was agreed in 2011 amid parallel discussions on possible market
5 3rd IMO GHG Study, 2014. 6 EP, Emission Reduction Targets for International Aviation and Shipping, 2016 [access link] 7 Assessment of health-cost externalities of air pollution at the national level using the EVA model system (March 2011). By J. Brandt
et al. CEEH Scientific Report No 3. Centre for Energy, Environment and Health [access link] 8 Terzano, C. et al. (2010), Air pollution ultrafine particles: toxicity beyond the lung, European Review for Medical and
Pharmacological Sciences, 14: 809-821; Bhardawaj, A. et al (2017), A Review of Ultrafine Particle-Related Pollution during Vehicular
Motion, Health Effects and Control, Journal of Environmental Science and Public Health, 1 (4): 268-288 9 IARC, Diesel engines exhaust carcinogenic, 2012 [access link] 10 Abbasov, F. (2017), Statistical analysis of the energy efficiency performance (EEDI) of new ships, Transport & Environment.

8
a study by
based measure to tackle emissions from the existing fleet, not just new ships. But these talks fell victim to arguments over technical assistance for developing countries to implement the EEDI. Shortly before the
Paris Climate Conference convened in 2015, the IMO Secretary General summed up in public the prevailing view of the sector: shipping was already the most efficient form of transport and its emissions could not be capped because shipping was the servant of world trade and would need to continue to grow with it.
However, the Paris Agreement itself and mounting pressure from South Pacific nations on the frontline of climate change impacts did indeed lead to a significant change in direction. Industry, led by the International Chamber of Shipping (ICS), eschewed previous attempts at denial and embraced the need for
the shipping sector to act. Amid mounting pressure from a coalition of high ambition states and civil society, the logjam at the IMO was broken. In April 2018 concerted efforts culminated in a landmark agreement calling for the shipping sector to reduce its GHG emissions by at least 50% by 2050 and to improve energy efficiency by at least 40% by 2030. Reductions higher than 50% were sought by many, so the reference to
term measures agreed, in place and
already contributing to emissions reductions by 2023. The April agreement, importantly, directed at the shipping sector achieving the reductions itself in-sector reductions -
available 2050 carbon budget and giving time for mid/longer term solutions essentially focussing on new low/zero carbon fuels to be developed.
The IMO is now embarking on a process to develop, agree and implement a suite of short, medium and long
term regulatory measures to achieve the goals agreed last April. Options for short term measures include mandatory requirements on individual ships to improve operational carbon intensity based on carbon
intensity metrics yet to be agreed or based on mandatory ship speed reductions. Lesser measures involving
better ship management and mandatory retrofits have also been proposed. The longer term challenge is
more fundamental as decarbonising shipping will effectively depend on a shift to zero carbon fuels/propulsion technologies: electrification, hybridisation and hydrogen/ammonia fuels. This transition is a veritable revolution that will depend on many variables regulatory aspects within and outside the
remit of the IMO, the wider transition to renewable electricity production worldwide, further technological
improvements, ship designs and investment in port infrastructure. This challenge coincides with moves in Europe to strengthen its commitment to the Paris Agreement by
developing a strategy to decarbonise the entire European economy. The commitment to a 40% emissions
sector that has been excluded. This is despite long standing European pressure on the IMO to take action and repeated warnings that regional action at the EU level would have to be taken instead. Plans for
shipping to follow aviation and be included in the EU ETS were in fact already being drawn up when the
EEDI was agreed in 2011. However, the EU MRV Regulation agreed in 2015 was limited to an emissions
reporting requirement on all ships calling at EU ports from 2018. The first emissions reports are to be submitted by the first quarter of 2019.
The EU ship MRV was itself the key driver for industry to finally agree to a global ship emissions data
collection system. Less detailed than the EU MRV, the IMO DCS (data collection system) also protects
individual ship efficiency performance from being made public event though it is widely accepted that lack of transparency of such information is a barrier to improving ship efficiency. Pressed by the European
Parliament, EU states are keeping open the possibility of a second step; the imposition of a mandatory
reduction measure on all ships calling at EU ports by, for example, including shipping in the EU ETS or requiring all ships within the EU MRV scope to contribute to a Maritime Shipping Fund as a condition of entry
to EU ports. European pressure on the IMO remains.11 EU ETS legislation for the post 2021 period contains provisions for the shipping sector to be included in reduction measures at the EU level should IMO outcomes
11 EU ETS Directive, 2017 [access link]

9
a study by
prove unsatisfactory, particularly related to the IMO commitment to implement short term measures by 2023.
3. Zero emission technologies for ships Ships require energy both for propulsion (delivered by main propulsion engines/motors), on-board electricity generation (delivered by auxiliary engines) and on-board heating and cargo operations (delivered by boilers). While the main engines are switched off at berth, auxiliary engines and boilers are kept running
to sustain on-board operations. For example, a typical large ocean going cruise ship could burn around 220 MWh worth of fuel per 10-hour port call in order to satisfy on-board energy demand. As a comparison, the main (propulsion) engines of the same ship could use 220 MWh energy (fuel) to sail some 100 km out in the sea.12
Historically, ships have been using heavy fuel oil (HFO) and marine gas/diesel oils (MGO/MDO) propulsion and on-board operation purposes which emit, inter alia, greenhouse gases (GHG) contributing to global
climate change. Energy currently provided to ships by HFO/MGO/MDO can in the future be replaced by energy stored in batteries or synthetic (electro) fuels such as liquid hydrogen or ammonia which generate
no GHG emissions at the vessel level. In addition, marine diesel or methane can also be synthetically produced from renewable H2 and CO2 air capture and used as a replacement for the HFO/MGO/MDO of fossil
origin (table 1). Table 1: Classification of electrofuels for shipping
Carbon free (non-hydrocarbon) Carbon containing (hydrocarbon)
Liquid hydrogen Synthetic (electro-) methane
Liquid ammonia Synthetic (electro-) diesel
Due to technical characteristics (table 2), including conversion inefficiencies of each technological pathway,
the implications on the primary energy production (upstream) will be different, i.e. increase with each
conversion step. Table 2: Summary of technological pathways
Technology Propulsion Energy storage Energy transformation
Battery ships Electric motor Batteries Directly from batteries to electric motor
Hydrogen fuel-cells Electric motor Liquid H2 Electrochemical via fuel-cells
Hydrogen ICE Internal combustion
engine (ICE)
Liquid H2 Direct combustion of liquid H2 in ICE
Ammonia fuel-cells Electric motor Liquid ammonia Extraction of H2 from ammonia via on-
board reformers and electro-chemical
transformation via fuel-cells
Ammonia ICE ICE Liquid ammonia Direct combustion of liquid ammonia in
ICE
Electro-methane ICE Synthetic methane from electricity Direct combustion of electro-methane
in ICE
Electro-diesel ICE ICE Synthetic diesel from electricity Direction combustion of electro-diesel
in ICE
3.1. Battery-powered ships (BPSs) This refers to ships propelled by electric motors, which are powered exclusively by electricity stored in
batteries on board (similar to battery electric cars). Battery technology is likely to be the cornerstone of future hybrid and/or fully electric technologies for ships. Regardless of the source of electricity, the tank-to-
wake (battery-to-wake) GHG and other emissions of these ships are always zero.
12 T&E estimates based on the luxury cruise ship Symphony of the Seas, sailing at full capacity with a speed of 18 knots.

10
a study by
Well-to-wake (grid-to-battery) emissions on the other hand depend on the carbon footprint of the national/regional electricity grids that are used to charge the on board batteries. However, from the
viewpoint of climate policy this is not an inhibiting factor for the shift to battery-powered ships. Electricity generation is included in many of the national pledges to the Paris Agreement. In the EU for example, the power sector is covered under the EU Emissions Trading Scheme (ETS), which sets an absolute cap for
emissions from the sector independent of the growth in demand for power generation. So there is likely to be only a limited margin for increasing emissions from the power sector to meet the likely additional demand for electricity from battery powered ships. Such extra electricity demand will likely have to be met by renewables or other low/zero-carbon means of power production in the not too distant future.
Electrical motors to power battery ships can be of different types, with synchronous and induction13 (AC) motors being more widely accepted for a variety of marine applications. Industry leaders such as ABB and Siemens claim up to 99% efficiency for their synchronous motors. However, AC motors also require the DC current from the batteries to be further converted to AC current for the motor resulting in additional
conversion losses. Appendix II provides a (non-exhaustive) list of battery-powered and battery-hybrid ships that are in operation or under construction across the globe.
3.2. Hydrogen Fuel-Cells This technology converts energy stored in fuels (e.g. liquid hydrogen) directly to electricity via an electrochemical process in fuel-cells, which in turn powers electric motors. Generally, liquid H2 is used
directly in the fuel cells, which produce electricity and water as a by-product. Hence, on a tank-to-wake basis, H2 fuel cells are climate neutral, not causing any emissions apart from water.14 There are different
fuel-cells technologies, with different levels of technological maturity, electrical efficiencies and resulting emissions depending on the fuel choice (Appendix III).
3.3. Hydrogen in ICE There is also emerging literature discussing the possibility of using liquid H2 (or boil off hydrogen gas)
directly in modified ship internal combustion engines. 15 However, T&E is not aware of any practical
application so far of such propulsion systems in existing commercial ships; however, several pilot projects will likely be realised in the near future providing further evidence to shipowners, scientists and regulators alike.
3.4. Ammonia Fuel-Cells Similar to methane, ammonia is a gas at normal temperature and atmospheric pressure. But it becomes liquid under ~10 bars at 24ºC temperature (or -33ºC at atmospheric pressure). Since liquid ammonia has more energy density than in its gaseous form, it can be stored in liquid form and re-gasified when in use.
An ammonia molecule consists of one atom of nitrogen and three atoms of hydrogen (NH3). Because
ammonia does not contain any carbon molecule, during combustion it produces only nitrogen and water vapour.
4NH3 + 3O2 = 2N2 + 6H2O
13 Kirtley, James L., Arijit
2320 2332 14 Other fuels, notably, LNG, methanol, diesel, etc., can also be used but need first to be converted in the on-board reformers to
extract H2, which is then used in the fuel cells to produce electricity. As a result, total on-board emissions associated with the use of
LNG, methanol and diesel are CO2 (from on-board converter) and water (from the fuel cells). For this reason, only non-carbon based
alternative fuels are used for the purpose of this analysis. 15 access link]; Seddiek, S.I. et al. (2015), The
hydrogen-fuelled internal combustion engine for marine applications with a case study, Brodogradnja 66(1): 23-38 [access link]

11
a study by
Ammonia can be used as a hydrogen storage (hydrogen carrier) for fuel cells. Ammonia has a higher volumetric hydrogen density (10.7 kg H2 /100L)16 than liquid hydrogen itself so, for example, a litre of liquid
ammonia contains ~50% more hydrogen than the same volume of liquid hydrogen. Ammonia has to be split via on-board reformers before the released hydrogen can be supplied to fuel cells. However, several technological challenges for on-board reforming of ammonia remain.
Notably, decomposition (splitting) of ammonia into hydrogen and nitrogen is energy intensive and involves high temperatures (up to 1000 °C). At these high temperatures it becomes difficult for the reactor materials, including the catalyst to sustain exposure to this environment.17 Additionally, current fuel cells (except
alkaline fuel cells) have very low tolerance thresholds (< 0.1 ppm) to ammonia. Therefore, extensive purification is required if fuel cells are to use hydrogen produced from ammonia. This appears to remain both a technical CSIRO (Commonwealth Scientific and Industrial Research Organisation) has made recent strides into membrane-based hydrogen separation from ammonia, which, if commercialised, could fill the required technology gap. The CSIRO recently announced18
the successful development of an ammonia-to-hydrogen transformer for hydrogen fuel-cell cars.
It should also be noted that some research points to the possibility of ammonia being used directly in an alkaline fuel cell (FC) without the necessity of the prior splitting of ammonia into hydrogen and nitrogen.19
Ostensibly, this would solve the efficiency and fuel cell contamination problems associated with PEMFCs.
It is important to note that ammonia is a toxic substance and its spill would be hazardous to the environment. These aspects of ammonia need to be seriously investigated and strict safety rules would
need to be put in place before ammonia as a ship fuel/energy source is deployed.
3.5. Ammonia ICE Ammonia can be used in current ICEs with some modifications. Since the fuel does not contain carbon molecules, on-board emissions are free of CO2 and other greenhouse gases (GHG).
However, ammonia has a very high resistance to auto-ignition (651°C - ammonia20 vs. 210/225°C diesel vs.
246/280°C gasoline21) and narrow flammability limits (16-25% by volume in air). Therefore, ammonia does not compression ignite and requires blending with a certain amount of another (high-cetane) fuel e.g.
MDO.
This means that on-board CO2/GHG, SOx and PM emissions would still take place in proportion to the
considerable NOx and soot emissions depending on the engine load.22 These emissions could however be controlled using after-treatment technologies, such as SCR and DPF.
With regard to spark-ignition engines, on the other hand, narrow flammability limits and low flame speed causes incomplete combustion of ammonia. To overcome this, ammonia can be blended with hydrogen or
gasoline. In the latter case, ammonia-gasolines blends will lead to GHG emissions and other pollutants, notably NOx.23
16 Potential Roles of Ammonia in a Hydrogen Economy (2006), U.S. Department of Energy [access link] 17 ibid. 18 ABC news, Hydrogen fuel breakthrough in Queensland could fire up massive new export market, 2018 [access link] 19 Rong Lan and Shanwen Tao (2010), Direct Ammonia Alkaline Anion-Exchange Membrane Fuel Cells, Electrochemical and Solid-
State Letters, 13 8, B83-B86 20 Ammonia- Wikipedia [access link]. 21 Fuels and Chemicals - Auto Ignition Temperatures [access link]. 22 Kong S.C., (2008): Ammonia combustion in diesel engines for reducing greenhouse gas emissions, Technical Report, Iowa State
University, USA [access link]. 23 Kong et al., Characteristics of an SI Engine Using Direct Ammonia Injection, Presentation, University of Iowa [access link].

12
a study by
Ammonia-fuelled combustion turbines and oxidation turbines that produce low or zero GHG and minimal
conventional emissions are also under development, with significant R&D initiatives in Japan, the Netherlands, and elsewhere.24
3.6. Synthetic diesel Similar to liquid ammonia and hydrogen, diesel fuel can also be synthetically produced using renewable
hydrogen from electrolysis and CO2 capture from air.25 The resulting fuel is still carbon-based, hence its combustion emits CO2 (and NOx); but since the CO2 is originally captured from the atmosphere, such a synthetic diesel fuel would be carbon neutral on a full life cycle basis provided the energy/electricity used
for electrolysis and fuel synthesis was carbon free. Electro-diesel fuels would have similar physical and
combustion properties to fossil diesel, so could be used with existing on-board ship machinery and bunkering infrastructure.
3.7. Synthetic methane Electro-methane, to be subsequently liquefied, can be synthesised using the methanation chemical process to combine hydrogen (H2) from electrolysis with carbon dioxide (CO2) to produce methane (CH4). In the
methanation reaction, H2 and CO2 are reacted in the presence of a catalyst (generally nickel)26:
CO2 + 4H2 4 + 2H2O
The resulting electro methane could then be a direct substitute for compressed or liquefied natural gas.
3.8. Role for biofuels? Renewable fuels of biological origin are also put forward as one of the possible alternatives to decarbonise
advanced biofuels could play a role in substituting fossil fuel demand in aviation. However, strict sustainability safeguards are needed to ensure
advanced biofuels offer genuine emission savings - these are not yet in place. If fuels with poor environmental and climate credentials would be excluded, the potential supply of advanced biofuels would be very limited.
[...] biofuels could play a role - meeting up to 11.4% of the remaining 2050 fuel demand in our scenario - but alone won't be available in the quantities needed. This is partly because non-transport sectors will also have
a claim to biomass feedstocks, red .27 With this in mind it is more advisable to use the available sustainable biofuels in a more difficult to decarbonise sector such as aviation.
Moreover, the use of biofuels in shipping would create unique sustainability and enforcement challenges, which do not arise in other transport modes and would appear to be insurmountable from a regulatory point of view. Ocean-going ships usually bunker in specific ports where fuel is cheap; hence, they do not
need to refuel every time they make a port call to take up or discharge cargo. Such a unique refuelling
pattern of shipping makes the application of strict sustainability criteria for biofuels - in order to prevent the use of crop-based biofuels that have higher life-cycle emissions than the fossil fuels that they would be
replacing - extremely challenging. A unilateral application of strict sustainability criteria by one or even a
would be incentivised to go easy on unsustainable biofuels in order to attract more bunkering. A global and
24 E.g., Michinari Hamaguchi, Japan Science and Technology Agency, Development of Carbon-Free Hydrogen Value Change (2016);
Hideaki Kobayashi, Ammonia Direct Combustion: Thermal Power Generation Using Carbon-Free Fuel (2017); Holland Renewable
Energy Technologies BV, From Waste Gas to Sustainable Energy: Oxidation of NH3 Without Formation of NOx, Presentation (2017)
[access link]. 25 ectro-fuels
for road transportation and aviation. Arguably, shipping diesel would follow a similar pathway as road and aviation fuels. 26 Götz, M. et al. (2016), Renewable Power-to-Gas: A technological and economic review, Renewable Energy, Volume 85: 1371-1390. 27 T&E, Roadmap to decarbonising European aviation, 2018 [access link]

13
a study by
uniform application of sufficiently strict sustainability criteria - via for example the IMO or another framework - would require a global consensus agreement, which is improbable because of the interests of
large bio-energy producing countries such as Brazil, Argentina, the US, Colombia, Indonesia, Malaysia, etc. Some of these countries have already threatened the EU with WTO action because EU will discontinue subsidising crop-based biofuels beyond 2030.28
Even if such a global consensus on applying strict environmental criteria was reached uniform enforcement would be an additional and equally insurmountable challenge. Port-state control of sustainability would itself be complex and difficult, because sustainable and non-sustainable biofuels would have similar
apparent physical properties and be difficult to differentiate without mass spectrometry analysis in high-tech laboratories. Such laboratories are not necessarily at hand everywhere and it would be economically unsustainable to test every ship. Blending and mixing along the fuel supply chain and tank mingling with other fuels, would create even further difficulties for those port-state controls deciding to perform random checks.
For these reasons, we consider that in addition to availability problems, enforcement of sustainable fuels
in shipping would be herculean task with a high potential to create an uneven playing field for industry. Policy-makers should steer away from considering biofuels to decarbonise the maritime industry.
4. Implications on the primary energy demand for renewable
electricity Whether ships are powered by batteries to be charged at ports, or by electrofuels to replace HFO/MGO/MDO, this change will increase demand for (renewable) electricity production on land. To analyse the implications
of these different technological pathways on EU primary electricity demand, 7 scenarios/pathways have been analysed for different segments of EU shipping for the year 2050. The main segments of EU shipping
have been defined as I) domestic shipping, II) intra-EU international shipping, III) inbound extra-EU shipping
and IV) outbound extra-EU shipping.
Technology scenarios/pathways29:
1. Full H2 fuel-cell (H2_FC) 2. Full H2 ICE (H2_ICE) 3. Full ammonia fuel-cell (Ammonia_FC)
4. Full ammonia ICE (Ammonia_ICE) 5. Full battery-electric 6. Technology mix - assumes domestic shipping choose batteries; intra-EU shipping half battery, half
H2_FC; outbound extra-EU half H2_FC and half Ammonia_FC 7. Full electro-methane (e-methane_ICE)
8. Full electro-diesel (e-diesel_ICE)
The rationale behind the tech -fold: 1. Domestic shipping in many European countries is already experimenting with battery-electric
distances, smaller ships and the cost-effectiveness of deploying battery-electric propulsion. 2. Intra-EU shipping could use both battery electric and other (including hybrid) technology pathways.
It is assumed that most of the passenger ferries and smaller cargo ships will prefer battery electric propulsion in short-sea shipping, while other ships in this segment will choose hybrid or full
hydrogen fuel cell propulsion.
28 Reuters, Malaysia trade ministry to approach WTO on EU move to limit palm oil use [access link] 29 ion.

14
a study by
3. This analysis does not contain cost effectiveness (or safety/handling aspects) of the technology choices from the ship-
hydrogen and ammonia based technology pathways is determined by a) the well-to-wake energy (conversion) efficiency of the available propulsion options (as a proxy for energy costs) and b) their volumetric energy density which is important for space considerations (as a proxy for opportunity
costs). In this regard, since H2 fuel cells appear to be more energy efficient, it is assumed half the ships on intra-EU journeys will choose H2 fuel cells.
4. Furthermore, since ammonia has twice the volumetric energy density of H2, it is assumed that large ships on long-distance (outbound extra-EU) journeys will chose ammonia fuel-cells over H2.
4.1. Results & Discussions Table 3 and figure 1 below summarise the results, which are presented for each technological pathway identified above, but also in relation to different shipping segments. To put our findings into a policy context, 2050 primary energy demand for EU shipping has been compared to 2015 EU electricity generation.
As it can be seen below, under the 50% maritime growth assumption towards the mid-century, only the full battery-electric and technology mix pathways would result in additional primary energy demand (in 2050)
inferior to that of total EU28 renewable electricity generation in 2015. All other options would require significantly more renewable energy than was generated in 2015 in the EU, with synthetic methane and diesel even requiring up to double the 2015 RES capacity.
When compared to historical EU total electricity generation, different maritime technology pathways would result in additional electricity generation of some 11-53% over 2015 levels. Synthetic methane and synthetic
diesel would have the highest (worst) impact on the primary energy demand requiring respectively 42% and 53% additional energy demand due to high inefficiencies of these pathways. In contrast, battery-electric (although with a caveat - see below) and technology mix would have a much lower impact on the additional
primary energy demand. Table 3: Impact on primary energy demand under different 2050 technology mix scenarios (TWh)
Additional electricity demand for maritime (2050) EU28
total
electri
city
gener
ation
(2015)
EU28
RES
electrici
ty
generat
ion
(2015)
Full
H2_FC
Full
H2_IC
E
Full
ammoni
a _FC
Full
ammoni
a _ICE
Full
battery
electric
Tech
mix
Full e-
methan
e _ICE)
Full e-
diesel
_ICE)
Domestic 188 202 202 217 64 64 246 312
Intra EU 384 412 413 443 130 257 503 639
Extra EU
inbound*
0 0 0 0 0 0 0 0
Extra EU
outbound
461 495 495 532 156 478 604 767
Total 1,032 1,109 1,110 1,192 350 798 1,354 1,718 3,234 966
Compared to
EU28 electricity
generation
(2015)
32% 34% 34% 37% 11% 25% 42% 53%
Source: T&E estimations; for conversion efficiencies see Appendix I. Figures for electricity: EU Energy Statistical Pocketbook, 2017.
* it is assumed that ships will bunker outside the EU on in-bound journeys

15
a study by
Figure 1: Impact on renewable electricity demand under different 2050 technology scenarios (TWh)
4.1.1. Battery-electric
Battery-electric propulsion is the most energy efficient technology pathway. However, this conclusion does
not take into account the potential cargo space lost by accommodating the batteries, which could negate some of energy saving gains particularly for larger ships on long journeys because additional ships could be
needed to make up for the lost cargo space in order to maintain transport supply. Battery propelled ships have increased in numbers in recent years and more and more marine technology providers appear to be
investing in this technology. According to T&E analysis, despite the inferior (specific) energy density of batteries compared to liquid hydrogen, battery-electric propulsion could actually be more cost-effective for small and mid-size ships, notably roll-on/roll-off ships, that are mostly engaged in short-sea coastal
shipping. Figure 2 below compares the real world (propulsion related) operational costs per journey of an existing diesel passenger ferry with the hypothetical battery-electric and hydrogen fuel-cell versions of the
same ship under the identical operational conditions. In shorter journeys this cost difference can be explained by 3 factors:
1. Battery-electric propulsion enjoys a superior total tank-to-wake energy conversion efficiency
(>80%), i.e. conversion of energy stored in batteries into rotational-mechanical energy delivered to
the propellers. As a result, the amount of levelised energy needed to sail the same ship is half as much for a hypothetical battery ship, as opposed to its diesel-ICE or H2 FC equivalents. For example,
an existing ferry - Pride of Burgundy - would require respectively 20,780 kWh, 10,715 kWh and 19,341 kWh energy for diesel, battery-electric and H2 FC propulsion modes in order to complete a single Calais-Dover journey (table 4).
2. The levelised (i.e. kWh for kWh) cost of electricity today is cheaper than the current liquid hydrogen
prices leading to higher per journey energy costs for an H2 FC ship.

16
a study by
3. FC still remain an expensive technology. Although some FC technologies (e.g. alkaline) are considerably cheaper than others (e.g. PEM), any analysis needs to also take into account the
Alkaline FC appears to have a shorter lifetime than PEM FC.30 Table 4: Energy requirements under different technology pathways for a Calais-Dover journey
Existing diesel-ICE
Pride of Burgundy
Battery-powered
Pride of Burgundy
H2 fuel-cell
Pride of Burgundy
Energy/journey (kWh) 20,780 10,715 19,341
Energy mass (tonnes) 2.6 86 <1
Energy weight - DWT ratio (/journey) 0.04% 1.47% 0.01%
Energy volume (m3) 2.40 75 11
Energy volume - GT ratio (/journey) 0.002% 0.0533% 0.008%
Key density assumptions31:
Battery pack32: gravimetric - 175 Wh/kg; volumetric - 200 kWh/m3
Liquid hydrogen: gravimetric - 33,330 Wh/kg (LHV); volumetric - 71 kg/m3
Despite this higher efficiency, battery electric ships are only viable over shorter distances unless
considerable improvements are achieved in battery specific energy densities in the future. For this reason, it would be reasonable to expect battery technology to be used mostly by ships sailing in domestic and intra-EU traffic. It is also possible that batteries could be deployed as auxiliary power sources or in hybrid
modes with other technologies for deep sea shipping.
Figure 2: battery electric and H2 fuel-cell ship in real operational conditions for short-sea shipping
30 Technology Roadmap: Hydrogen and Fuel Cells, IEA, 2015 31 Battery technology is still evolving and further density improvements are expected in the near future. Some manufactures for
road vehicles already claim achieving >200 Wh/kg gravimetric battery density, which allows us to assume that current shipping
battery density can be further improved. See e.g. BMW i3 gets a 100 kWh battery pack for 435 miles of range as a proof-of-concept by
Lion Smart , 2018 [access link]; IAA Commercial Vehicles: AKASOL is showcasing a wide range of solutions for hybrid and electric
mobility , 2018 [access link] 32 See e.g. XALT Energy systems for marine application [access link]

17
a study by
4.1.2. Hydrogen and Ammonia
These appear to be the second most efficient methods of energy provision followed by hydrogen ICE and
ammonia fuel cells. But the total energy efficiency of hydrogen fuel cells/ICE could actually be inferior to that of ammonia fuel-cells/ICE in real life, because of the inferior (volumetric) energy density of H2 compared to ammonia as a fuel or hydrogen carrier. As a result, more cargo space in the largest ships sailing on longer
voyages could be compromised if H2 was chosen over ammonia, necessitating more H2 ships to maintain transport supply. But the choice of H2 over ammonia would also likely be influenced by other factors, such
as journey distance, higher fuel costs of ammonia over hydrogen, potential additional energy losses that might result from on-board splitting of ammonia into H2 (for FC), as well as additional safety standards that would be required for either fuel.
Therefore, even though it is possible that some of the largest ships sailing long distances would prefer ammonia over H2
33, some large ships sailing shorter distances could potentially favour H2 over ammonia as the preferred fuel/energy storage choice.
There do not appear to be huge differences (in terms of impact on the primary energy demand) between
H2/Ammonia FC on the one hand and H2/Ammonia ICE on the other.
4.1.3. Synthetic methane and diesel
Although synthetic methane and diesel are technically viable fuels and can be used in current shipping
infrastructure and engines, their use would appear to suffer from a number of pitfalls, some of which may
be insurmountable: 1. The synthetic diesel followed by synthetic methane pathways place the highest (worst) demands
on renewable energy supplies due to the excessively high amounts of energy needed to produce
them. For example, today around 1.94MJ, 2.29MJ, 2.59MK and 3.2MJ of energy is needed to produce 1MJ of H2, ammonia, synthetic methane and synthetic diesel, respectively.34 As a result, even with
assumed efficiency improvements towards 2050 (table 6), T&E estimations suggest that up to twice
as much primary energy would be required if shipping adopted synthetic methane and synthetic
diesel as opposed to the technology mix pathway described above (figure 1.)
2. Synthetic methane and diesel (and/or blends thereof with existing fuels) would have similar
physical properties to fossil LNG and marine distillates. This would create almost insurmountable regulatory challenges for port and flag states to ensure compliance, especially as synthetic methane
and diesel would be an order of magnitude more expensive than their fossil equivalents35 creating
a significant incentive to cheat. Requiring synthetic fuels (and other carbon-based synthetic alternatives) to decarbonise shipping could become practically unenforceable and the risks of
creating an unequal playing field would be great. Investing (especially from public coffers) today in LNG bunkering infrastructure36 in the hope that it could be used in the future for synthetic methane
bunkering would seem to set the industry and the whole energy system on an expensive,
unsustainable and potentially unenforceable pathway. 3. Synthetic methane and diesel pathways could also create policy complacency and a denial of
responsibilities between technology and fuel providers, shipowners/operators and different -action-
needproduce these synthetic fuels and in sufficient quantities.
4. Regulatory and political difficulties of attempting to decarbonise fuels (as opposed to the means of transport) is a well-known challenge, especially in Europe. Efforts to reduce the carbon intensity of
33 Raucci, C. et al. (2017), Zero-Emission Vessels 2030. How do we get there?, UMA 34 35 e, 2018. 36 Domagoj, B. et al. (2018), LNG as a marine fuel in the EU, Market, bunkering infrastructure investments and risks in the context of
GHG reductions, UMAS [access link]; T&E, CNG and LNG for vehicles and ships - the facts, 2018 [access link]

18
a study by
road fuels through the Fuel Quality Directive has created significant sustainability issues over the past decade and has often lead to higher emissions on a full life-cycle basis. The nature of
international shipping would suggest that such regulatory issues and hurdles involving marine fuels would be significantly magnified in shipping.
For these reasons, whatever is the specific technological pathway for shipping, for sustainability and enforcement purposes, it should deliver zero GHG emissions at the vessel level.
5. Conclusions This report analyses the possible impacts of decarbonising EU related shipping on the primary renewable energy production and concludes that a mix of alternative zero emission technologies including battery-
electric, liquid hydrogen and ammonia would cause the least additional strain on the broader energy
system. Synthetic fuels such as electro-methane and electro-diesel, on the other hand, would be the least optimal for the broader energy system and also extremely difficult to monitor and enforce.
Maritime transport is only one of the many sectors of the economy that will need to rely on primary
renewable energy in order to decarbonise. Together with other sectors this will add tremendous additional stress on the renewable electricity production, possibly an order of magnitude higher than the current
electricity production sector, which itself is yet to fully decarbonise. In addition to improving the efficiency of shipping as much as possible, it is therefore essential in our view that any regulatory and economic policies to support any of the technology pathways analysed in this report take account of this impact and
prioritise those which minimise the impact on primary energy demand.
19
a study by
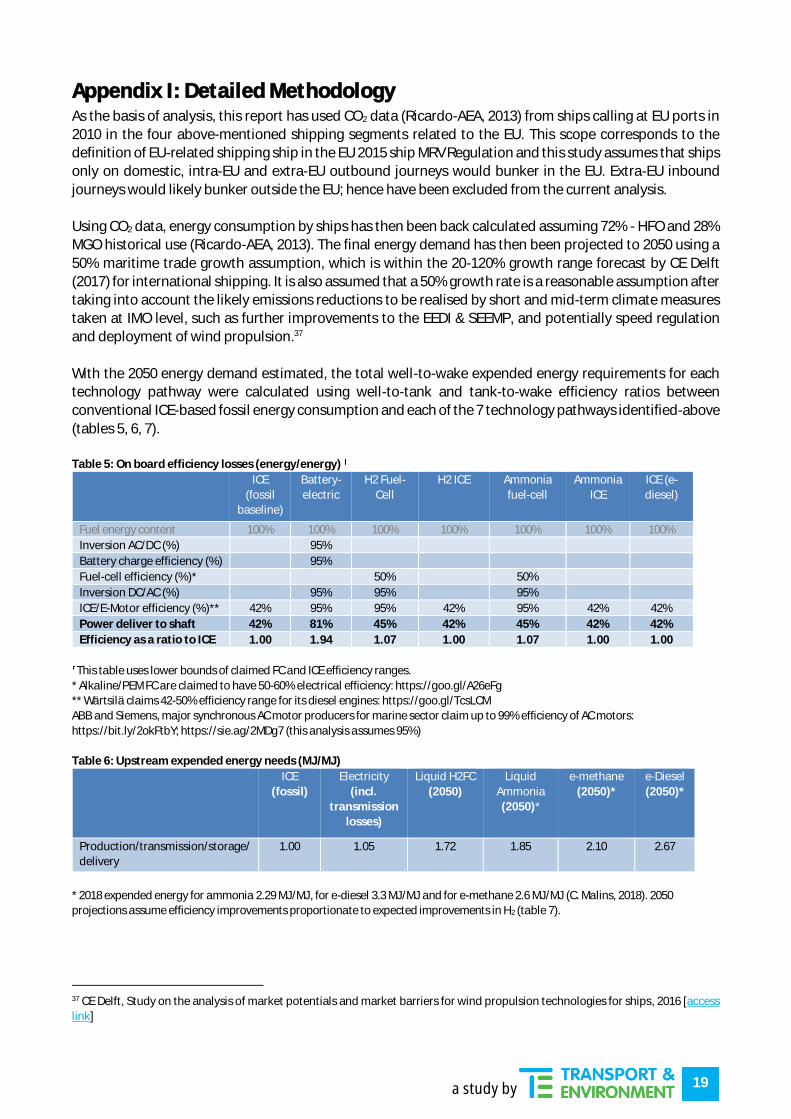
Appendix I: Detailed Methodology As the basis of analysis, this report has used CO2 data (Ricardo-AEA, 2013) from ships calling at EU ports in 2010 in the four above-mentioned shipping segments related to the EU. This scope corresponds to the
definition of EU-related shipping ship in the EU 2015 ship MRV Regulation and this study assumes that ships only on domestic, intra-EU and extra-EU outbound journeys would bunker in the EU. Extra-EU inbound
journeys would likely bunker outside the EU; hence have been excluded from the current analysis.
Using CO2 data, energy consumption by ships has then been back calculated assuming 72% - HFO and 28% MGO historical use (Ricardo-AEA, 2013). The final energy demand has then been projected to 2050 using a
50% maritime trade growth assumption, which is within the 20-120% growth range forecast by CE Delft (2017) for international shipping. It is also assumed that a 50% growth rate is a reasonable assumption after taking into account the likely emissions reductions to be realised by short and mid-term climate measures
taken at IMO level, such as further improvements to the EEDI & SEEMP, and potentially speed regulation and deployment of wind propulsion.37
With the 2050 energy demand estimated, the total well-to-wake expended energy requirements for each technology pathway were calculated using well-to-tank and tank-to-wake efficiency ratios between conventional ICE-based fossil energy consumption and each of the 7 technology pathways identified-above
(tables 5, 6, 7).
Table 5: On board efficiency losses (energy/energy)
ICE
(fossil
baseline)
Battery-
electric
H2 Fuel-
Cell
H2 ICE Ammonia
fuel-cell
Ammonia
ICE
ICE (e-
diesel)
Fuel energy content 100% 100% 100% 100% 100% 100% 100%
Inversion AC/DC (%) 95%
Battery charge efficiency (%) 95%
Fuel-cell efficiency (%)* 50% 50%
Inversion DC/AC (%) 95% 95% 95%
ICE/E-Motor efficiency (%)** 42% 95% 95% 42% 95% 42% 42%
Power deliver to shaft 42% 81% 45% 42% 45% 42% 42%
Efficiency as a ratio to ICE 1.00 1.94 1.07 1.00 1.07 1.00 1.00
This table uses lower bounds of claimed FC and ICE efficiency ranges.
* Alkaline/PEM FC are claimed to have 50-60% electrical efficiency: https://goo.gl/A26eFg
** Wärtsilä claims 42-50% efficiency range for its diesel engines: https://goo.gl/TcsLCM
ABB and Siemens, major synchronous AC motor producers for marine sector claim up to 99% efficiency of AC motors:
https://bit.ly/2okFtbY; https://sie.ag/2MDg7 (this analysis assumes 95%)
Table 6: Upstream expended energy needs (MJ/MJ)
ICE
(fossil)
Electricity
(incl.
transmission
losses)
Liquid H2FC
(2050)
Liquid
Ammonia
(2050)*
e-methane
(2050)*
e-Diesel
(2050)*
Production/transmission/storage/
delivery
1.00 1.05 1.72 1.85 2.10 2.67
* 2018 expended energy for ammonia 2.29 MJ/MJ, for e-diesel 3.3 MJ/MJ and for e-methane 2.6 MJ/MJ (C. Malins, 2018). 2050
projections assume efficiency improvements proportionate to expected improvements in H2 (table 7).
37 CE Delft, Study on the analysis of market potentials and market barriers for wind propulsion technologies for ships, 2016 [access
link]
20
a study by
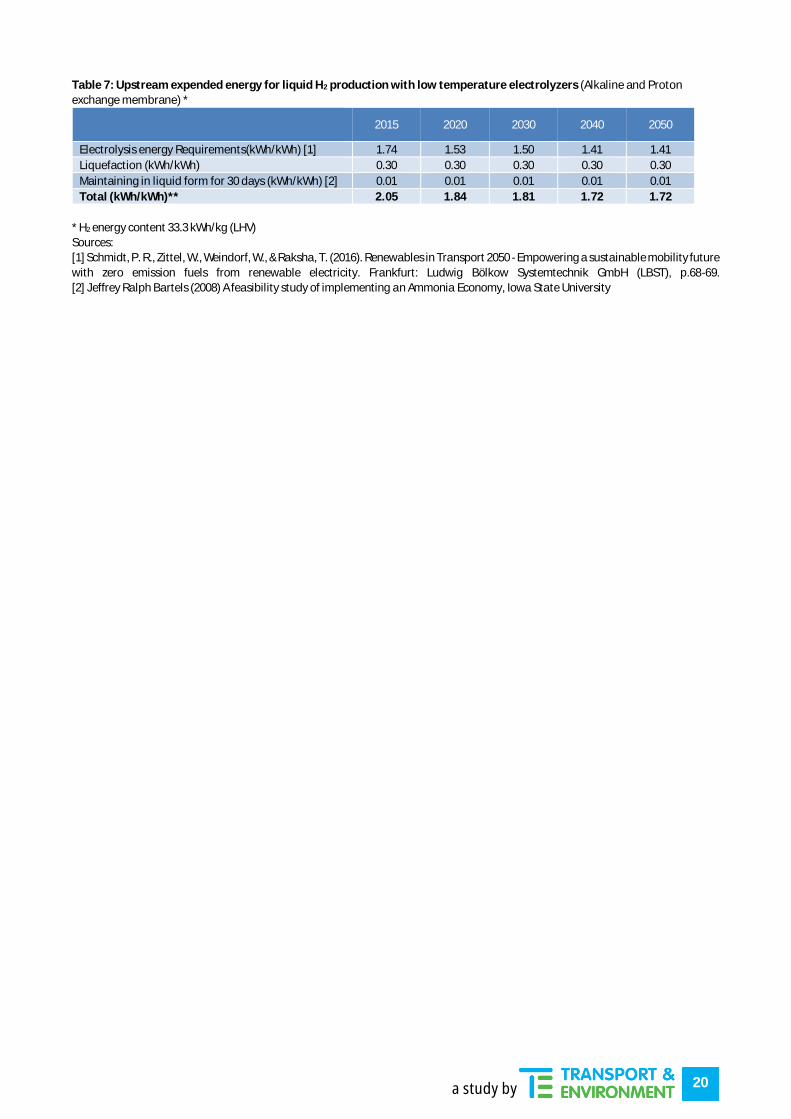
Table 7: Upstream expended energy for liquid H2 production with low temperature electrolyzers (Alkaline and Proton
exchange membrane) *
2015 2020 2030 2040 2050
Electrolysis energy Requirements(kWh/kWh) [1] 1.74 1.53 1.50 1.41 1.41
Liquefaction (kWh/kWh) 0.30 0.30 0.30 0.30 0.30
Maintaining in liquid form for 30 days (kWh/kWh) [2] 0.01 0.01 0.01 0.01 0.01
Total (kWh/kWh)** 2.05 1.84 1.81 1.72 1.72
* H2 energy content 33.3 kWh/kg (LHV)
Sources:
[1] Schmidt, P. R., Zittel, W., Weindorf, W., & Raksha, T. (2016). Renewables in Transport 2050 - Empowering a sustainable mobility future
with zero emission fuels from renewable electricity. Frankfurt: Ludwig Bölkow Systemtechnik GmbH (LBST), p.68-69.
[2] Jeffrey Ralph Bartels (2008) A feasibility study of implementing an Ammonia Economy, Iowa State University
21
a study by
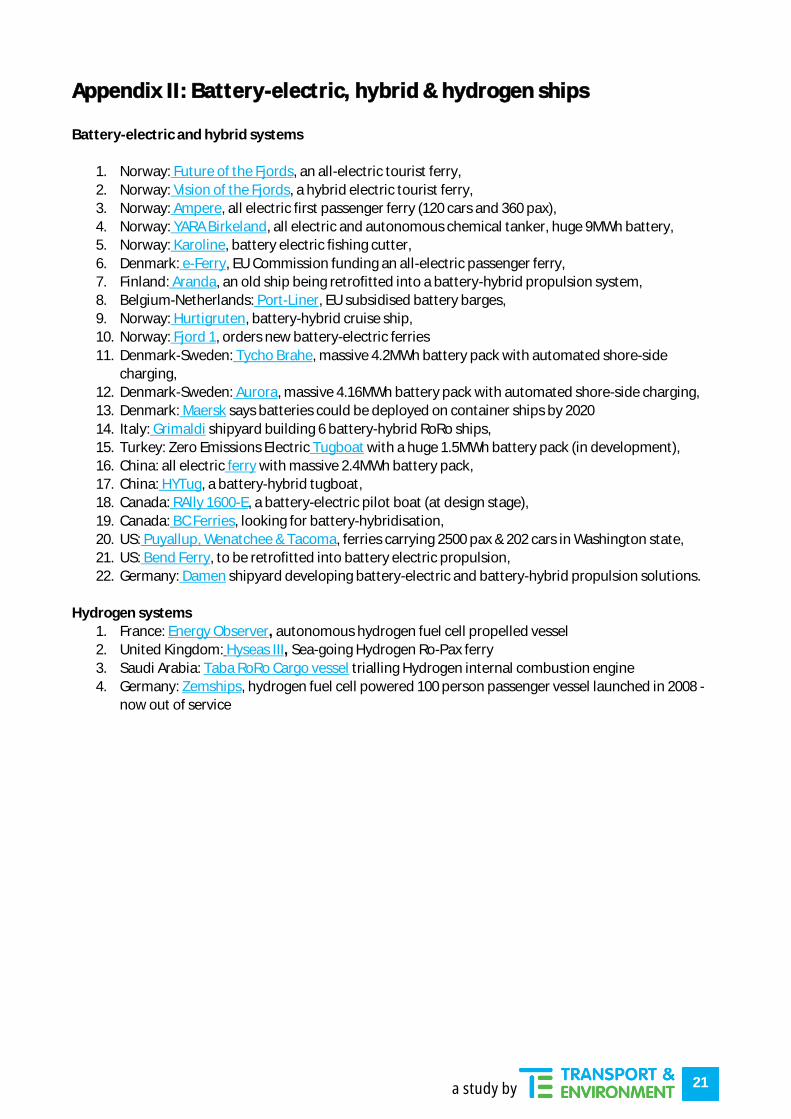
Appendix II: Battery-electric, hybrid & hydrogen ships Battery-electric and hybrid systems
1. Norway: Future of the Fjords, an all-electric tourist ferry,
2. Norway: Vision of the Fjords, a hybrid electric tourist ferry,
3. Norway: Ampere, all electric first passenger ferry (120 cars and 360 pax), 4. Norway: YARA Birkeland, all electric and autonomous chemical tanker, huge 9MWh battery, 5. Norway: Karoline, battery electric fishing cutter,
6. Denmark: e-Ferry, EU Commission funding an all-electric passenger ferry, 7. Finland: Aranda, an old ship being retrofitted into a battery-hybrid propulsion system,
8. Belgium-Netherlands: Port-Liner, EU subsidised battery barges, 9. Norway: Hurtigruten, battery-hybrid cruise ship, 10. Norway: Fjord 1, orders new battery-electric ferries
11. Denmark-Sweden: Tycho Brahe, massive 4.2MWh battery pack with automated shore-side charging,
12. Denmark-Sweden: Aurora, massive 4.16MWh battery pack with automated shore-side charging, 13. Denmark: Maersk says batteries could be deployed on container ships by 2020
14. Italy: Grimaldi shipyard building 6 battery-hybrid RoRo ships, 15. Turkey: Zero Emissions Electric Tugboat with a huge 1.5MWh battery pack (in development), 16. China: all electric ferry with massive 2.4MWh battery pack,
17. China: HYTug, a battery-hybrid tugboat, 18. Canada: RAlly 1600-E, a battery-electric pilot boat (at design stage),
19. Canada: BC Ferries, looking for battery-hybridisation, 20. US: Puyallup, Wenatchee & Tacoma, ferries carrying 2500 pax & 202 cars in Washington state, 21. US: Bend Ferry, to be retrofitted into battery electric propulsion,
22. Germany: Damen shipyard developing battery-electric and battery-hybrid propulsion solutions.
Hydrogen systems
1. France: Energy Observer, autonomous hydrogen fuel cell propelled vessel
2. United Kingdom: Hyseas III, Sea-going Hydrogen Ro-Pax ferry
3. Saudi Arabia: Taba RoRo Cargo vessel trialling Hydrogen internal combustion engine
4. Germany: Zemships, hydrogen fuel cell powered 100 person passenger vessel launched in 2008 - now out of service

22
a study by
Appendix III: Fuel-Cell technologies Table 8: Fuel cell technologies: types, efficiencies, emissions and fuels used.38
Type Temp Fuel Efficiency Tech.
maturity/
marine
experience
Module
Power levels
(kW)
Emissions
(with different
fuels)
Alkaline Fuel Cell
(AFC) Low
High purity
hydrogen
50-60 %
(electrical)
High/ yes
(NASA) < 500 kW - water/nitrogen
Proton Exchange
Membrane Fuel
Cell (PEMFC) Low Hydrogen 50-60%
(electrical) High/ yes < 120 kW - water
High
Temperature
Proton Exchange
Membrane Fuel
Cell (HT-PEMFC)
High
Hydrogen, LNG,
methanol, diesel
(via internal
reformers*)
50-60%
(electrical) Low/ yes < 30 kW
- water (H2);
- CO2, low NOx
(carbon fuels**)
Solid oxide fuel
cell (SOFC)
High
Hydrogen,
LNG/CNG,
methanol, ethanol,
diesel (via internal
reformers),
ammonia (directly)
60%
(electrical);
85% (with
heat
recovery)
Moderate /
yes < 20-60 kW
- water (H2);
- CO2, low NOx
(carbon fuels);
- water & NOx
(ammonia)
Molten
carbonate fuel
cell (MCFC) High
LNG, methanol,
hydrogen
50%
(electrical);
85 % (with
heat
recovery)
High/ Less-
mature < 500 kW
- water (H2);
- CO2, low NOx
(carbon fuels)
38 Tronstad et al., EMSA Study on the use of Fuel Cells in Shipping, 2017.