a step towards the hydrogen economy—a life cycle cost … · 2017-07-17 · 2. methodology 2.1....
TRANSCRIPT

energies
Article
A Step towards the Hydrogen Economy—A Life CycleCost Analysis of A Hydrogen Refueling Station
Ludvik Viktorsson 1,*, Jukka Taneli Heinonen 2, Jon Bjorn Skulason 1 and Runar Unnthorsson 3
1 Icelandic New Energy, Reykjavik 108, Iceland; [email protected] Faculty of Civil and Environmental Engineering, University of Iceland, Reykjavik 107, Iceland;
[email protected] Faculty of Industrial Engineering, Mechanical Engineering and Computer Science, University of Iceland,
Reykjavik 107, Iceland; [email protected]* Correspondence: [email protected]; Tel.: +354-588-0310
Academic Editor: Adolf AcquayeReceived: 8 April 2017; Accepted: 26 May 2017; Published: 31 May 2017
Abstract: This study was aimed to define a methodology based on existing literature and evaluatethe levelized cost of hydrogen (LCOH) for a decentralized hydrogen refueling station (HRS) in Halle,Belgium. The results are based on a comprehensive data collection, along with real cost information.The main results indicated that a LCOH of 10.3 €/kg at the HRS can be reached over a lifetime of20 years, if an average electricity cost of 0.04 €/kWh could be achieved and if the operating hoursare maximized. Furthermore, if the initial capital costs can be reduced by 80%, in the case of directsubsidy, the LCOH could even fall to 6.7 €/kg.
Keywords: hydrogen; hydrogen refueling station; levelized cost of hydrogen; renewable energy
1. Introduction
Global warming has become an unequivocal problem where the main cause is considered tobe anthropogenic greenhouse gas (GHG) emissions [1]. Means to mitigate GHG emissions such asthe implementation of renewable energy (RE) sources, stopping deforestation and increasing powergeneration efficiencies have been presented [2]. New and efficient RE technologies such as wind andsolar power are being implemented in large quantities on a global scale. To demonstrate the rapidgrowth of the global RE capacity, wind power rose from 17,333 MW to 369,608 MW from 2000 to 2014and solar energy capacity increased from 805 MW to 175,305 MW during the same period [3].
These new energy sources entail problems linked to their power output as it is highly intermittentand cannot meet steady energy demand [4]. One solution to this problem is to use hydrogen as anenergy carrier where hydrogen can be produced on site by water electrolysis, and compressed, storedand re-electrified via fuel cells during low production days or used for mobility purposes [5].
Compared to conventional fuels hydrogen is a strong competitor. For example, hydrogen has moreenergy content per unit mass but at the same time occupies more space at atmospheric temperaturewhich makes a high pressure or liquefied storage vital [4,6–12]. Hydrogen can be produced fromvariable sources and by different processes such as coal gasification, partial oxidation of hydrocarbons,steam reforming of natural gas and water electrolysis [13–15]. Water electrolysis is the only methodthat does not entail GHG emissions, making it the perfect method to link to the rapidly increasingRE capacity. Despite the advantages of hydrogen, large scale implementation has been slow to bedeveloped, due to high capital and running costs [16].
The term “hydrogen economy” has a relatively broad meaning [17] and can be traced to theearly 1970’s where the term was first used publicly in the work of Bockris [18,19], who referred to thehydrogen economy as the concept of using hydrogen as the energy medium between future energy
Energies 2017, 10, 763; doi:10.3390/en10060763 www.mdpi.com/journal/energies

Energies 2017, 10, 763 2 of 15
generation sites and consumers where the hydrogen could be used as a fuel or to produce electricity.Since then the term has widely been used in relation to the part hydrogen plays in the car industryand as an energy carrier linked to renewable energy sources aimed to balance intermittent energyproduction [5,20]. Therefore, the term has been referred to as many “economies” instead of one“economy” [17].
Although hydrogen has been considered a viable option as an energy carrier for stationaryapplications, the main application of hydrogen has been linked to the car industry where hydrogencould replace conventional fossil fuels, thus reducing GHG emissions [7,9,21]. During the first decadeof this century hydrogen “hype” linked to the car industry peaked [22]. However, despite the coolingdown of hydrogen hype, car manufacturers have reached a point where hydrogen driven vehicles areready for deployment.
Hydrogen production via water electrolysis is expensive due to the high investment and runningcosts which make an economic assessment of such systems important. Life cycle cost (LCC) analysishas been the method to study the cost due to its capability of capturing all upstream costs associatedwith the overall lifetime of the selected system [12]. Hydrogen systems are often considered as areplacement or addition to conventional energy sources at remote locations where diesel generators areused extensively with relevant emissions and diesel cost. Therefore, as a means to compare differentsystems at different locations the levelized cost of hydrogen (LCOH) method has been implementedin order to evaluate the LCC in terms of cost per energy unit (kWh) or in terms of hydrogen mass(kg) [12,23–25].
The literature reveals many studies that assess the economic feasibility of energy systems thatinclude hydrogen as an energy carrier, especially for remote locations [26–29]. The key similarityamong the results of those studies is that further reduction in hydrogen component cost is needed toachieve economic competitiveness. Thus, new pilot projects and research on their results are neededfor the hydrogen systems to become economically competitive. Furthermore, although there is anabundance of feasibility studies for hydrogen energy systems there is a certain lack of economicassessments of real demonstration and pilot projects despite the fact that a number of hydrogensystems have been installed [30].
The aim of this study was to evaluate the well-to-tank (WTT) LCOH of a hydrogen refuelingstation (HRS) located in Halle, Belgium, compare the cost-level to previous benchmarks, and identifythe most critical cost factors. In addition, a sensitivity analysis for different uncertain components isprovided to evaluate further under which conditions certain target cost levels could be met. The LCCmodel provides a holistic approach based on the existing literature. The main findings are that capitalcosts should be pushed down in the future to reach more competitive cost levels, which in the currentassessment are only reached under the most favorable future running cost development.
The case study project was co-funded by the European Commission. The 7th FrameworkProgramme for the Fuel Cell and Hydrogen Joint Undertaking (FCH JU) initiative and has beengiven the acronym Don Quichote (DQ). The DQ project was initiated in 2012 and is a 5-year projectconsisting of three phases. The first phase, analyzed in this paper, was the evaluation of an existinghydrogen refueling station based on an alkaline water electrolyzer (WE), diaphragm compressor(450 bar) and steel hydrogen storage (50 kg). Phase 2 is aimed to implement a state-of-the-art protonexchange membrane (PEM) WE and a fuel cell (FC) for the re-electrification of the hydrogen and a(40 kg) composite storage tank. The aim of the DQ project is obviously to benchmark the new PEM WEsystem against the mature alkaline WE technology. Phase 3 includes the addition of a state-of-the-artelectrochemical compressor that will be benchmarked against the existing diaphragm compressor. Thefocus of this study is only on phase 1 of the project and can act as a benchmark for phase 2.
The structure of this paper is split, as follows: the research methods are explained in Section 2and a detailed description of the research process is given in Section 3. The results are presented inSection 4, including the main LCC results along with a sensitivity analysis. Implications and furtherdiscussion are provided in Section 5 and finally the main results are concluded in Section 6.

Energies 2017, 10, 763 3 of 15
2. Methodology
2.1. Life Cycle Costing (LCC)
LCC is an important method to evaluate the total cost of a product or a system over its givenlifetime [31,32]. By applying LCC into the early life cycle stage, changes are easier in terms ofminimizing the LCC. There is no global approach that fits all situations and as the literature reveals theLCC discourse has been a long journey. Many methods have been proposed and are rather general inapproach [31–33]. Although the methods are different, many of the main steps are similar to some ofthe first methods such as the steps in the method by Harvey [33]:
• Define the cost elements;• Define the cost structure;• Establish cost estimating relationships;• Establish the method of LCC formulation.
Although LCC has been accepted as a methodology it is still being criticized. The maindisadvantages of the LCC method come from the fact that it includes a future estimation and canlead to uncertain results. Despite the flaws of the LCC method it still provides a somewhat holisticuniversal method to evaluate and compare different investment opportunities.
2.2. Levelized Cost of Hydrogen (LCOH)
Essentially the LCOH method is based on the levelized cost of energy (LCOE) method which iswidely used in the renewable energy sector where the LCC of renewables is presented in terms of costper energy output unit. The definition of the LCOE by IRENA [34] is depicted in Equation (1):
LCOE =∑N
n=1(In + Mn + Fn)·(1 + i)−n
∑Nn=1 En·(1 + i)−n (1)
where In is the initial investment cost for year n, Mn is the maintenance cost in year n, Fn is the fuelcost in year n, En is the energy generation in year n, i is the discount rate and N is the lifetime.
The LCOE method is a valuable tool when comparing different case studies and is not limited torenewable energy sources but has been used widely to assess the cost of hydrogen. Hydrogen outputis usually measured in terms of energy and therefore, similarly to electrical calculations, the cost canbe presented in terms of cost per unit energy or mass of hydrogen [12,35].
2.3. LCC Assessment
The LCC framework was derived from the existing literature, both state of the art and maturepapers [12,24,25,29,35,36]. Equation (2) depicts how the investment cost was calculated:
Cinv = (Cwe + Cc + Cs + Cd + Cmisc) (2)
where Cinv is the investment cost, Cwe is the WE cost, Cc is the compressor cost, Cs is the storage unitcost, Cd is the dispenser cost and Cmisc is miscellaneous costs or all other costs that were connected tothe station such as the Conformité Européene (CE) certification and the preparation costs.
The investment costs were annualized by the capital recovery factor (CRF) depicted inEquation (3):
CRF =i(1 + i)n
(1 + i)n − 1(3)
where i is the nominal discount rate and n is the economic lifetime of the station. The annualized, a,investment costs are therefore:
Cinv,a = CRF × Cinv (4)
Energies 2017, 10, 763 4 of 15
The operational and maintenance (O&M) costs were divided between fixed and variable expenses.The annual fixed O&M is denoted by:
C f om,a = Cmc + Ccont + Crep,a (5)
where Cmc is the maintenance cost for the compressor, Ccont is the service contract cost and Crep,a is theannualized replacement cost.
Annual replacement costs were calculated by applying the single amount present value formulaand the CRF to the replacement costs. Equation (6) depicts how the annual replacement costs werecalculated, where t is the year of replacement, i is the nominal discount rate and Crep is the currentvalue of the component to be replaced:
Crep,a = CRF ×Crep
(1 + i)t (6)
Similarly, the variable O&M is presented by:
Cvom,a = Ce + Cw (7)
where Ce is the annual electricity cost and Cw is the annual water cost. The annualized LCC cantherefore be expressed by Equation (8):
CLCC,a = Ccap,a + C f om,a + Cvom,a (8)
After the annualized LCC have been calculated the LCOH can be assessed by dividing theannualized LCC noted as CLCC,a by the amount of produced hydrogen (kg H2) noted as EH2,a, on anannual basis:
LCOH =CLCC,a
EH2,a(9)
3. Research Design
3.1. Scope of the Study
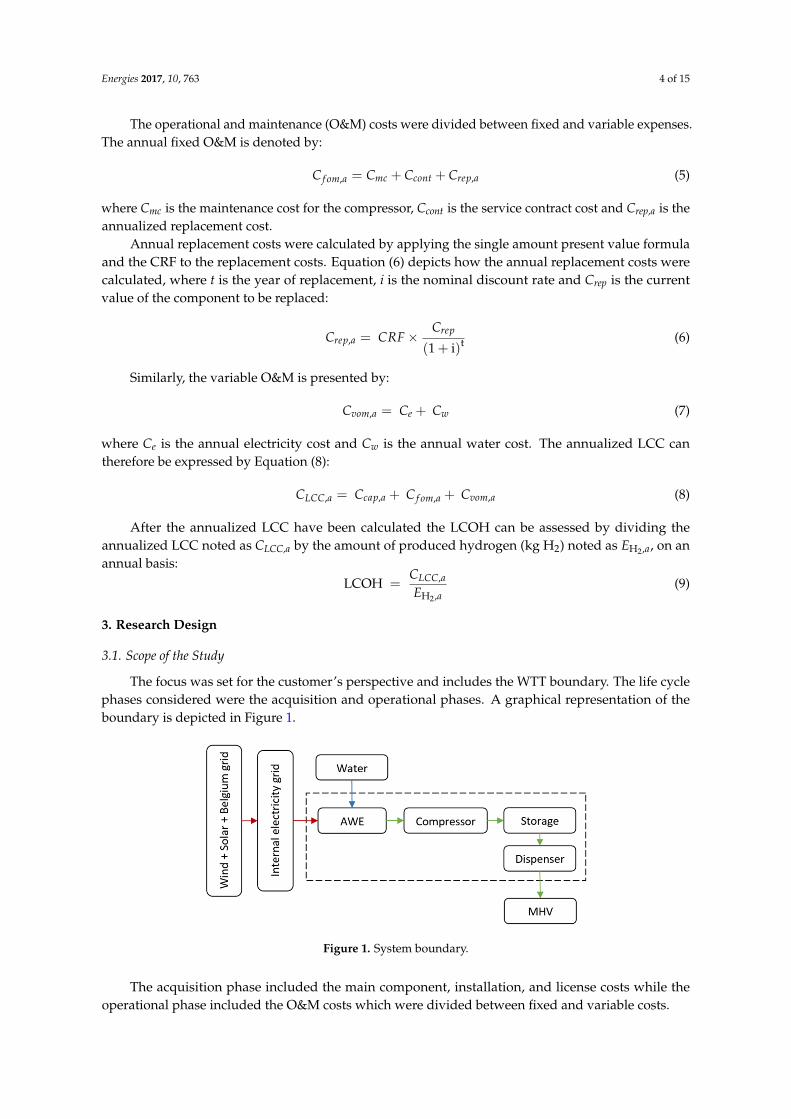
The focus was set for the customer’s perspective and includes the WTT boundary. The life cyclephases considered were the acquisition and operational phases. A graphical representation of theboundary is depicted in Figure 1.
Energies 2017, 10, 763 4 of 15
, = + + , (5)
where Cmc is the maintenance cost for the compressor, Ccont is the service contract cost and Crep,a is the annualized replacement cost.
Annual replacement costs were calculated by applying the single amount present value formula and the CRF to the replacement costs. Equation 6 depicts how the annual replacement costs were calculated, where t is the year of replacement, i is the nominal discount rate and Crep is the current value of the component to be replaced:
, = × (1 + i) (6)
Similarly, the variable O&M is presented by:
, = + (7)
where Ce is the annual electricity cost and Cw is the annual water cost. The annualized LCC can therefore be expressed by Equation (8):
, = , + , + , (8)
After the annualized LCC have been calculated the LCOH can be assessed by dividing the annualized LCC noted as CLCC,a by the amount of produced hydrogen (kg H2) noted as
2H ,aE , on an
annual basis:
2H ,
LCOH = LCC,a
a
CE
(9)
3. Research Design
3.1. Scope of the Study
The focus was set for the customer’s perspective and includes the WTT boundary. The life cycle phases considered were the acquisition and operational phases. A graphical representation of the boundary is depicted in Figure 1.
Figure 1. System boundary.
The acquisition phase included the main component, installation, and license costs while the operational phase included the O&M costs which were divided between fixed and variable costs.
As Figure 1 indicates, the system is connected to the internal electricity grid at Colruyt, which provides electricity to the warehouse for example, and comprises electricity from wind turbines, solar PV and the Belgium grid when needed. The proportion from each source to the station remains unknown to the authors; hence the assumptions of electricity price described in Section 3.3.1.
Figure 1. System boundary.
The acquisition phase included the main component, installation, and license costs while theoperational phase included the O&M costs which were divided between fixed and variable costs.
Energies 2017, 10, 763 5 of 15
As Figure 1 indicates, the system is connected to the internal electricity grid at Colruyt, whichprovides electricity to the warehouse for example, and comprises electricity from wind turbines, solarPV and the Belgium grid when needed. The proportion from each source to the station remainsunknown to the authors; hence the assumptions of electricity price described in Section 3.3.1.
3.2. Case Description
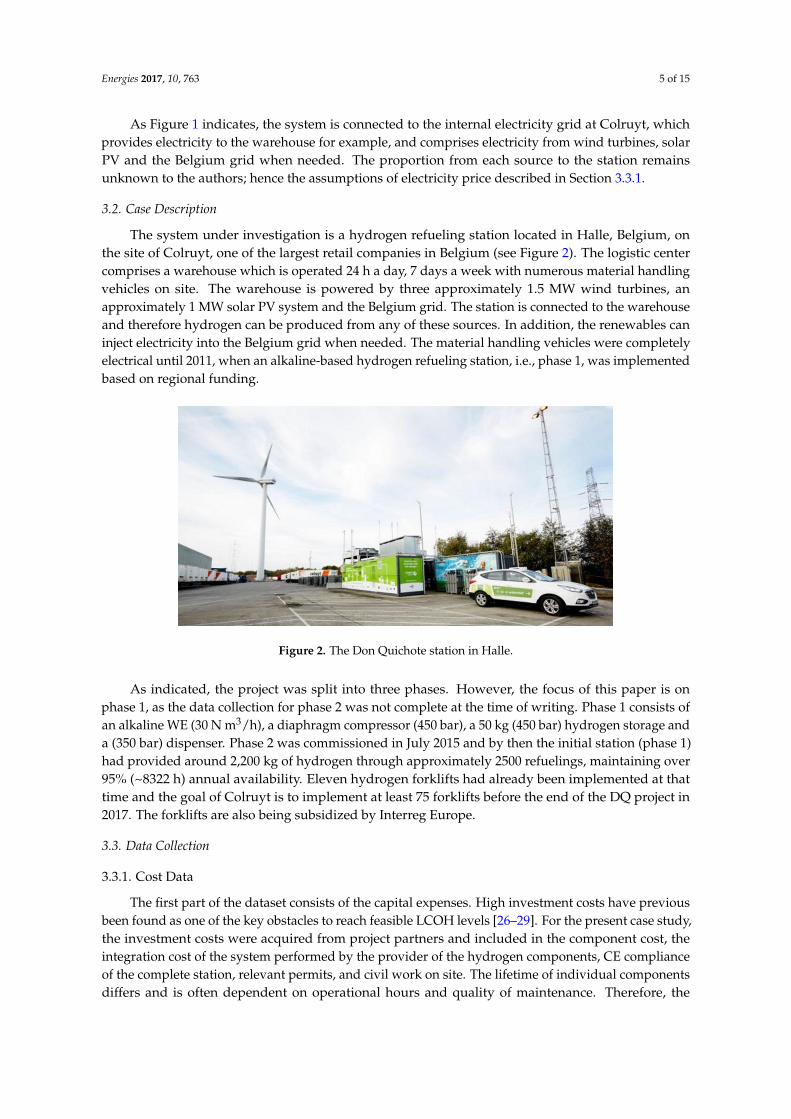
The system under investigation is a hydrogen refueling station located in Halle, Belgium, onthe site of Colruyt, one of the largest retail companies in Belgium (see Figure 2). The logistic centercomprises a warehouse which is operated 24 h a day, 7 days a week with numerous material handlingvehicles on site. The warehouse is powered by three approximately 1.5 MW wind turbines, anapproximately 1 MW solar PV system and the Belgium grid. The station is connected to the warehouseand therefore hydrogen can be produced from any of these sources. In addition, the renewables caninject electricity into the Belgium grid when needed. The material handling vehicles were completelyelectrical until 2011, when an alkaline-based hydrogen refueling station, i.e., phase 1, was implementedbased on regional funding.
Energies 2017, 10, 763 5 of 15
3.2. Case Description
The system under investigation is a hydrogen refueling station located in Halle, Belgium, on the site of Colruyt, one of the largest retail companies in Belgium (see Figure 2). The logistic center comprises a warehouse which is operated 24 hours a day, 7 days a week with numerous material handling vehicles on site. The warehouse is powered by three approximately 1.5 MW wind turbines, an approximately 1 MW solar PV system and the Belgium grid. The station is connected to the warehouse and therefore hydrogen can be produced from any of these sources. In addition, the renewables can inject electricity into the Belgium grid when needed. The material handling vehicles were completely electrical until 2011, when an alkaline-based hydrogen refueling station, i.e., phase 1, was implemented based on regional funding.
Figure 2. The Don Quichote station in Halle.
As indicated, the project was split into three phases. However, the focus of this paper is on phase 1, as the data collection for phase 2 was not complete at the time of writing. Phase 1 consists of an alkaline WE (30 N m3/h), a diaphragm compressor (450 bar), a 50 kg (450 bar) hydrogen storage and a (350 bar) dispenser. Phase 2 was commissioned in July 2015 and by then the initial station (phase 1) had provided around 2,200 kg of hydrogen through approximately 2500 refuelings, maintaining over 95% (~8322 h) annual availability. Eleven hydrogen forklifts had already been implemented at that time and the goal of Colruyt is to implement at least 75 forklifts before the end of the DQ project in 2017. The forklifts are also being subsidized by Interreg Europe.
3.3. Data Collection
3.3.1. Cost Data
The first part of the dataset consists of the capital expenses. High investment costs have previous been found as one of the key obstacles to reach feasible LCOH levels [26–29]. For the present case study, the investment costs were acquired from project partners and included in the component cost, the integration cost of the system performed by the provider of the hydrogen components, CE compliance of the complete station, relevant permits, and civil work on site. The lifetime of individual components differs and is often dependent on operational hours and quality of maintenance. Therefore, the assumption was made that each component has a lifetime of 20 years and salvage value was neglected. The initial capital expenses are depicted in Table 1 and do not include value added tax (VAT).
Figure 2. The Don Quichote station in Halle.
As indicated, the project was split into three phases. However, the focus of this paper is onphase 1, as the data collection for phase 2 was not complete at the time of writing. Phase 1 consists ofan alkaline WE (30 N m3/h), a diaphragm compressor (450 bar), a 50 kg (450 bar) hydrogen storage anda (350 bar) dispenser. Phase 2 was commissioned in July 2015 and by then the initial station (phase 1)had provided around 2,200 kg of hydrogen through approximately 2500 refuelings, maintaining over95% (~8322 h) annual availability. Eleven hydrogen forklifts had already been implemented at thattime and the goal of Colruyt is to implement at least 75 forklifts before the end of the DQ project in2017. The forklifts are also being subsidized by Interreg Europe.
3.3. Data Collection
3.3.1. Cost Data
The first part of the dataset consists of the capital expenses. High investment costs have previousbeen found as one of the key obstacles to reach feasible LCOH levels [26–29]. For the present case study,the investment costs were acquired from project partners and included in the component cost, theintegration cost of the system performed by the provider of the hydrogen components, CE complianceof the complete station, relevant permits, and civil work on site. The lifetime of individual componentsdiffers and is often dependent on operational hours and quality of maintenance. Therefore, the

Energies 2017, 10, 763 6 of 15
assumption was made that each component has a lifetime of 20 years and salvage value was neglected.The initial capital expenses are depicted in Table 1 and do not include value added tax (VAT).
Table 1. Investment expenses without VAT.
Cost Factor Size Total Cost (€)
Electrolyzer ~156 kW 422,760Compressor 450 bar 216,000H2 storage 50 kg (450 bar) 157,500
1 × Dispenser 350 bar 218,000Integration - 41,800
CE certification - 8000Civil work - 75,000
Permits - 14,000
Total 1,153,060
The alkaline WE occupies the largest share or 37%, the compressor and the dispenser both takeup 19% each, and the storage unit takes up 14%. The remaining factors only account for 10% of thetotal (Figure 3).
Energies 2017, 10, 763 6 of 15
Table 1. Investment expenses without VAT.
Cost Factor Size Total Cost (€) Electrolyzer ~156 kW 422,760 Compressor 450 bar 216,000 H2 storage 50 kg (450 bar) 157,500
1 × Dispenser 350 bar 218,000 Integration - 41,800
CE certification - 8000 Civil work - 75,000
Permits - 14,000 Total 1,153,060
The alkaline WE occupies the largest share or 37%, the compressor and the dispenser both take up 19% each, and the storage unit takes up 14%. The remaining factors only account for 10% of the total (Figure 3).
Figure 3. Investment expense share from phase 1.
The annual costs associated with the operational phase were divided between fixed and variable costs. The fixed costs comprised a service contract cost, maintenance and replacement cost for the alkaline WE, and maintenance cost for the diaphragm compressor (see Table 2 for fixed O&M values).
Table 2. Fixed annual operational expenses.
Cost Factor ValueService contract/spear and wear 7.1% of WE investment expenses
Compressor maintenance 6% of compressor investment expenses Cell stack change (2 × 15 N m3/h) 60,600 €/stack change
The variable expenses included the electricity and water costs. The electricity cost is usually the largest cost factor of the LCOH, though uncertain how it will extend into the future, which makes it an extremely important parameter. Detailed information regarding hourly availability of the renewables and the cost of each kWh at Colruyt during the data collection period remained unknown to the authors. This uncertainty was overcome by setting the initial price for electricity to the average Belgium grid price for mid-size companies according to Eurostat [37] during the period 2005 to 2016, and further analyzing the impact of the energy price on the LCOH in the sensitivity analysis.
The water cost represents the actual water cost before entering the system and gives a realistic view of the cost. Table 3 depicts the values of the electricity and water costs used in this study. The sensitivity analysis covered situations such as the valorization of wind or solar power on the power market in case of injection of electricity in the public grid.
Figure 3. Investment expense share from phase 1.
The annual costs associated with the operational phase were divided between fixed and variablecosts. The fixed costs comprised a service contract cost, maintenance and replacement cost for thealkaline WE, and maintenance cost for the diaphragm compressor (see Table 2 for fixed O&M values).
Table 2. Fixed annual operational expenses.
Cost Factor Value
Service contract/spear and wear 7.1% of WE investment expensesCompressor maintenance 6% of compressor investment expenses
Cell stack change (2 × 15 N m3/h) 60,600 €/stack change
The variable expenses included the electricity and water costs. The electricity cost is usually thelargest cost factor of the LCOH, though uncertain how it will extend into the future, which makes it anextremely important parameter. Detailed information regarding hourly availability of the renewablesand the cost of each kWh at Colruyt during the data collection period remained unknown to theauthors. This uncertainty was overcome by setting the initial price for electricity to the average

Energies 2017, 10, 763 7 of 15
Belgium grid price for mid-size companies according to Eurostat [37] during the period 2005 to 2016,and further analyzing the impact of the energy price on the LCOH in the sensitivity analysis.
The water cost represents the actual water cost before entering the system and gives a realisticview of the cost. Table 3 depicts the values of the electricity and water costs used in this study. Thesensitivity analysis covered situations such as the valorization of wind or solar power on the powermarket in case of injection of electricity in the public grid.
Table 3. Variable operational expenses.
Cost Factor Cost/Unit
Water cost 4.9 €/m3
Electricity cost 0.09 €/kWh
One of the main replacement cost factors is the cell stack replacement. The WE is comprisedof 2 cell stacks (15 Nm3/h) each. The rated lifetime of the cell stacks is approximately (60,000 h)corresponding to approximately 7 years, if operated continuously. However, the assumption was madethat the cell stacks would be replaced every 5 years to simplify the initial model. The cost of replacingthe cell stacks, parts, plus labor cost, were estimated at 60,600 €/change. The cell stack replacementcost is included in the sensitivity analysis in Section 4.2.
Following the European Central Bank inflation target [38] and Ammermann et al. [39], the valuesfor the inflation and the discount rate were selected as 2% and 6% respectively in the initial model,and later allowed to vary in the sensitivity analysis.
3.3.2. Field Data
The second part of the dataset was field data. At the beginning of the DQ project a comprehensivedata collection plan was set up and carried out by project partners on a weekly basis. It should benoted that due to some scientific measurement campaigns the system did not always operate in themost effective way.
The data represents the gross consumption of the HRS station which might affect the resultsin a way but still provides information that are realistic and possibly higher than in studies thatonly account for the minimum consumption. The main operational data used in this study were theelectricity and water consumption of the complete station ranging from the year 2014 to 2015. Missingdata from 2014 was replaced with data from 2015 resulting in a whole year of monthly values.
The electrical measurements comprise of the WE consumption, the control units and thecompressor, storage, and dispenser unit. Figure 4 shows the monthly values of the total electricityconsumption in a bar graph.
Energies 2017, 10, 763 7 of 15
Table 3. Variable operational expenses.
Cost Factor Cost/Unit Water cost 4.9 €/m3
Electricity cost 0.09 €/kWh
One of the main replacement cost factors is the cell stack replacement. The WE is comprised of 2 cell stacks (15 Nm3/h) each. The rated lifetime of the cell stacks is approximately (60,000 h) corresponding to approximately 7 years, if operated continuously. However, the assumption was made that the cell stacks would be replaced every 5 years to simplify the initial model. The cost of replacing the cell stacks, parts, plus labor cost, were estimated at 60,600 €/change. The cell stack replacement cost is included in the sensitivity analysis in Section 4.2.
Following the European Central Bank inflation target [38] and Ammermann et al. [39], the values for the inflation and the discount rate were selected as 2% and 6% respectively in the initial model, and later allowed to vary in the sensitivity analysis.
3.3.2. Field Data
The second part of the dataset was field data. At the beginning of the DQ project a comprehensive data collection plan was set up and carried out by project partners on a weekly basis. It should be noted that due to some scientific measurement campaigns the system did not always operate in the most effective way.
The data represents the gross consumption of the HRS station which might affect the results in a way but still provides information that are realistic and possibly higher than in studies that only account for the minimum consumption. The main operational data used in this study were the electricity and water consumption of the complete station ranging from the year 2014 to 2015. Missing data from 2014 was replaced with data from 2015 resulting in a whole year of monthly values.
The electrical measurements comprise of the WE consumption, the control units and the compressor, storage, and dispenser unit. Figure 4 shows the monthly values of the total electricity consumption in a bar graph.
Figure 4. Monthly electricity consumption of the complete station in 2014.
Similarly, the water consumption, in terms of (m3) was collected and represents the gross consumption before the water filtration system and does not represent the real consumption of the WE. The total monthly values for the base year 2014 are depicted in Figure 5.
Figure 4. Monthly electricity consumption of the complete station in 2014.

Energies 2017, 10, 763 8 of 15
Similarly, the water consumption, in terms of (m3) was collected and represents the grossconsumption before the water filtration system and does not represent the real consumption ofthe WE. The total monthly values for the base year 2014 are depicted in Figure 5.Energies 2017, 10, 763 8 of 15
Figure 5. Monthly water consumption of the complete station in 2014.
The output of the station was based on produced hydrogen, in terms of the functional unit kg. Due to a lack of a flow meter the hydrogen output was calculated by team members based on the electrical consumption of the alkaline WE. The results represented the theoretical maximum production of the AWE. The total monthly values from 2014 are depicted in Figure 6.
Figure 6. Monthly hydrogen production in 2014.
The field data described above was assembled and are summarized in Table 4.
Table 4. Summary of the field data for phase 1 based on one year dataset.
Parameter Numerical Value Electricity consumption ~71.6 kWh/kg Annual H2 production ~1111 kg
Availability/annum ~8322 h Water consumption ~0.023 m3/kg
Max potential daily H2 production ~65 kg/day
As Table 4 indicates, the station was running on low capacity in the year 2014. The reason could be that the number of forklifts was low and not been implemented into the daily routine at the warehouse.
The values in Table 4 were used to assess the LCOH. The assumption was made that the station would be run 80% of the time, which is considered a realistic scenario for a decentralized HRS and results in approximately 18,896 kg H2 per year. Estimations for different actual production capacity
Figure 5. Monthly water consumption of the complete station in 2014.
The output of the station was based on produced hydrogen, in terms of the functional unit kg.Due to a lack of a flow meter the hydrogen output was calculated by team members based on theelectrical consumption of the alkaline WE. The results represented the theoretical maximum productionof the AWE. The total monthly values from 2014 are depicted in Figure 6.
Energies 2017, 10, 763 8 of 15
Figure 5. Monthly water consumption of the complete station in 2014.
The output of the station was based on produced hydrogen, in terms of the functional unit kg. Due to a lack of a flow meter the hydrogen output was calculated by team members based on the electrical consumption of the alkaline WE. The results represented the theoretical maximum production of the AWE. The total monthly values from 2014 are depicted in Figure 6.
Figure 6. Monthly hydrogen production in 2014.
The field data described above was assembled and are summarized in Table 4.
Table 4. Summary of the field data for phase 1 based on one year dataset.
Parameter Numerical Value Electricity consumption ~71.6 kWh/kg Annual H2 production ~1111 kg
Availability/annum ~8322 h Water consumption ~0.023 m3/kg
Max potential daily H2 production ~65 kg/day
As Table 4 indicates, the station was running on low capacity in the year 2014. The reason could be that the number of forklifts was low and not been implemented into the daily routine at the warehouse.
The values in Table 4 were used to assess the LCOH. The assumption was made that the station would be run 80% of the time, which is considered a realistic scenario for a decentralized HRS and results in approximately 18,896 kg H2 per year. Estimations for different actual production capacity
Figure 6. Monthly hydrogen production in 2014.
The field data described above was assembled and are summarized in Table 4.
Table 4. Summary of the field data for phase 1 based on one year dataset.
Parameter Numerical Value
Electricity consumption ~71.6 kWh/kgAnnual H2 production ~1111 kg
Availability/annum ~8322 hWater consumption ~0.023 m3/kg
Max potential daily H2 production ~65 kg/day

Energies 2017, 10, 763 9 of 15
As Table 4 indicates, the station was running on low capacity in the year 2014. The reason could bethat the number of forklifts was low and not been implemented into the daily routine at the warehouse.
The values in Table 4 were used to assess the LCOH. The assumption was made that the stationwould be run 80% of the time, which is considered a realistic scenario for a decentralized HRS andresults in approximately 18,896 kg H2 per year. Estimations for different actual production capacitylevels are reported in the sensitivity analysis to demonstrate the effects capacity level has on the LCOH.Table 5 summarizes the costs for the main design variables at the selected utilization factor.
Table 5. Values of selected design variables for the selected utilization (18,896 kg/year).
Cost Factor Cost/Unit Annual Cost
Water cost 4.9 €/m3 ~2120 €Electricity cost 0.09 €/kWh ~121,717 €
Service contract/spear and wear 7.1% of WE investment expenses ~30,011 €Compressor maintenance 6% of compressor investment expenses ~12,931 €
Cell stack change (2 × 15 Nm3/h) 60,600 €/stack change -
4. Results
4.1. Main LCC Results
The main LCC results are summarized in Table 6 where different lifetimes of 10, 15 and 20 yearshave been assumed. The variable lifetime was selected to demonstrate the effect time has on the LCOHin case of a short-lived demonstration project or a long-term investment. The results show that theLCOH is highest for the 10 years lifetime with a value of 16.6 €/kg and decreases with time becoming13.9 €/kg H2 for 20 years of lifetime.
Table 6. Summary of the main LCC results.
Lifetime 10 15 20
LCOH (€/kg) 16.6 14.7 13.9
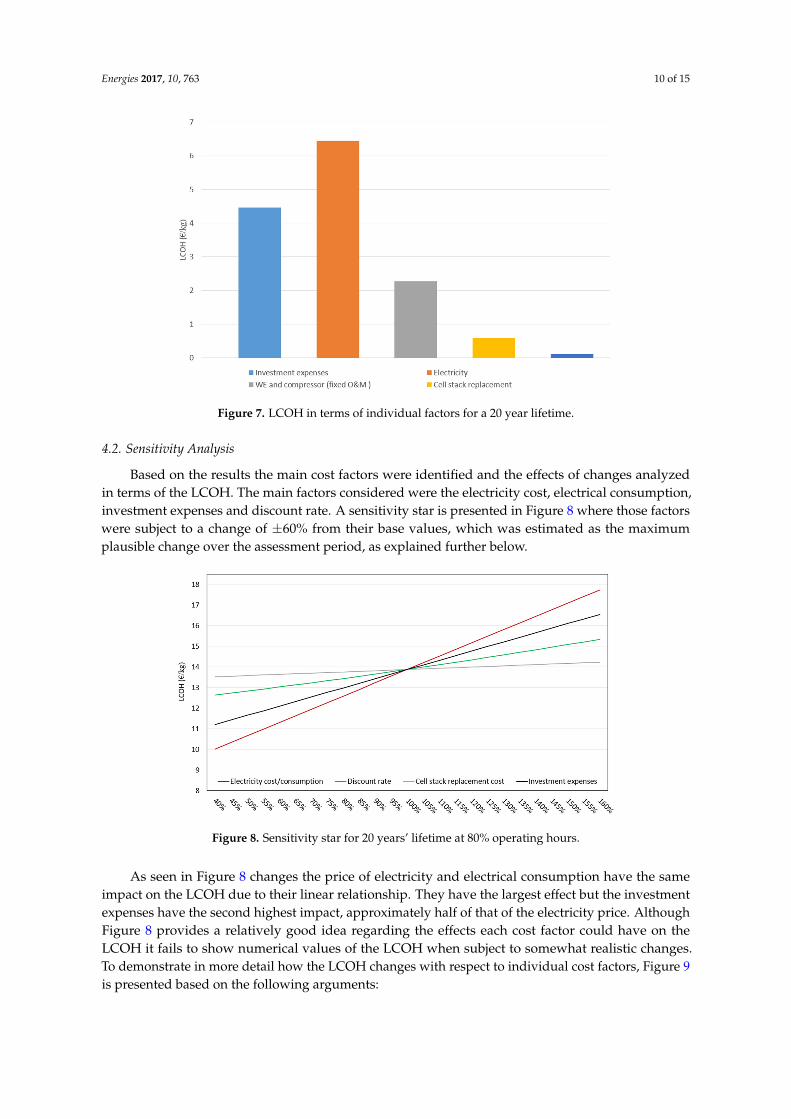
As seen in Table 6 the LCOH is lowest for the 20 years’ lifetime. A system like this wouldrealistically be a long-term investment and therefore the results from the 20 years lifetime were selectedfor further analysis. The share of the main components in terms of annualized costs for 20 yearsof lifetime (€/kg) is presented in Figure 7. The electricity cost has the largest share of 6.4 €/kg, theinvestment costs second largest with a value of 4.5 €/kg, the fixed O&M for the WE and compressorwith a value of 2.3 €/kg, cell stack replacement cost with a value of 0.6 €/kg and water cost with anear negligible value of 0.1 €/kg. It is evident that the electricity cost is the main cost factor, havingan approximately 40% larger share of the LCOH than the investment expenses, the second largestcost factor.
Energies 2017, 10, 763 10 of 15
Energies 2017, 10, 763 9 of 15
levels are reported in the sensitivity analysis to demonstrate the effects capacity level has on the LCOH. Table 5 summarizes the costs for the main design variables at the selected utilization factor.
Table 5. Values of selected design variables for the selected utilization (18,896 kg/year).
Cost Factor Cost/Unit Annual Cost Water cost 4.9 €/m3 ~2120 €
Electricity cost 0.09 €/kWh ~121,717 € Service contract/spear 7.1% of WE investment expenses ~30,011 €
Compressor 6% of compressor investment ~12,931 € Cell stack change 60,600 €/stack change -
4. Results
4.1. Main LCC Results
The main LCC results are summarized in Table 6 where different lifetimes of 10, 15 and 20 years have been assumed. The variable lifetime was selected to demonstrate the effect time has on the LCOH in case of a short-lived demonstration project or a long-term investment. The results show that the LCOH is highest for the 10 year lifetime with a value of 16.6 €/kg and decreases with time becoming 13.9 €/kg H2 for 20 years of lifetime.
Table 6. Summary of the main LCC results.
Lifetime 10 15 20LCOH (€/kg) 16.6 14.7 13.9
As seen in Table 6 the LCOH is lowest for the 20 years’ lifetime. A system like this would realistically be a long-term investment and therefore the results from the 20 year lifetime were selected for further analysis. The share of the main components in terms of annualized costs for 20 years of lifetime (€/kg) is presented in Figure 7. The electricity cost has the largest share of 6.4 €/kg, the investment costs second largest with a value of 4.5 €/kg, the fixed O&M for the WE and compressor with a value of 2.3 €/kg, cell stack replacement cost with a value of 0.6 €/kg and water cost with a near negligible value of 0.1 €/kg. It is evident that the electricity cost is the main cost factor, having an approximately 40% larger share of the LCOH than the investment expenses, the second largest cost factor.
Figure 7. LCOH in terms of individual factors for a 20 year lifetime. Figure 7. LCOH in terms of individual factors for a 20 year lifetime.
4.2. Sensitivity Analysis
Based on the results the main cost factors were identified and the effects of changes analyzedin terms of the LCOH. The main factors considered were the electricity cost, electrical consumption,investment expenses and discount rate. A sensitivity star is presented in Figure 8 where those factorswere subject to a change of ±60% from their base values, which was estimated as the maximumplausible change over the assessment period, as explained further below.
Energies 2017, 10, 763 10 of 15
4.2. Sensitivity Analysis
Based on the results the main cost factors were identified and the effects of changes analyzed in terms of the LCOH. The main factors considered were the electricity cost, electrical consumption, investment expenses and discount rate. A sensitivity star is presented in Figure 8 where those factors were subject to a change of ±60% from their base values, which was estimated as the maximum plausible change over the assessment period, as explained further below.
Figure 8. Sensitivity star for 20 years’ lifetime at 80% operating hours.
As seen in Figure 8 changes the price of electricity and electrical consumption have the same impact on the LCOH due to their linear relationship. They have the largest effect but the investment expenses have the second highest impact, approximately half of that of the electricity price. Although Figure 8 provides a relatively good idea regarding the effects each cost factor could have on the LCOH it fails to show numerical values of the LCOH when subject to somewhat realistic changes. To demonstrate in more detail how the LCOH changes with respect to individual cost factors, Figure 9 is presented based on the following arguments:
• As seen in Table 3 the base electricity cost in this study was set to 0.09 €/kWh, which was the average electricity cost for medium size industries in Belgium for the period 2005 to 2016 [34]. This assumption is somewhat unrealistic considering that Colruyt gets most of the electricity from onsite renewable energy sources and is benefiting from a green certificate scheme, which means a portion of the LCOE from the renewables is subsidized. The actual value was not available for the authors but the assumption was made that it could get as low as 0.04 €/kWh in case of injection into the public grid. The maximum value of 0.15 €/kWh was considered to cover any fluctuations in the price of electricity.
• As seen in Figure 8 the effects of the discount rate are not severe; however, an interval from 3% to 9% was selected based on assumptions.
• Although the initial capital expenses are a fixed cost at the beginning of the project it is important to see how it affects the LCOH in the case of decreased costs in the future due to mass production. To cover any uncertainties an increase in investment expenses of 20% and a decrease of −80%, were selected.
• The water cost was neglected in the sensitivity analysis as it only occupies a small share of the total costs and has been considered negligible in other studies [40].
• The most important part of the fixed O&M costs is the cell stack replacement cost and was selected for further analysis. As the hydrogen implementation is still in its early stages the future costs of the cell stacks are likely to decrease with mass production. Based on pure assumptions the changes in replacement costs were selected as ±50%.
Figure 8. Sensitivity star for 20 years’ lifetime at 80% operating hours.
As seen in Figure 8 changes the price of electricity and electrical consumption have the sameimpact on the LCOH due to their linear relationship. They have the largest effect but the investmentexpenses have the second highest impact, approximately half of that of the electricity price. AlthoughFigure 8 provides a relatively good idea regarding the effects each cost factor could have on theLCOH it fails to show numerical values of the LCOH when subject to somewhat realistic changes.To demonstrate in more detail how the LCOH changes with respect to individual cost factors, Figure 9is presented based on the following arguments:

Energies 2017, 10, 763 11 of 15
• As seen in Table 3 the base electricity cost in this study was set to 0.09 €/kWh, which was theaverage electricity cost for medium size industries in Belgium for the period 2005 to 2016 [34].This assumption is somewhat unrealistic considering that Colruyt gets most of the electricity fromonsite renewable energy sources and is benefiting from a green certificate scheme, which means aportion of the LCOE from the renewables is subsidized. The actual value was not available for theauthors but the assumption was made that it could get as low as 0.04 €/kWh in case of injectioninto the public grid. The maximum value of 0.15 €/kWh was considered to cover any fluctuationsin the price of electricity.
• As seen in Figure 8 the effects of the discount rate are not severe; however, an interval from 3% to9% was selected based on assumptions.
• Although the initial capital expenses are a fixed cost at the beginning of the project it is importantto see how it affects the LCOH in the case of decreased costs in the future due to mass production.To cover any uncertainties an increase in investment expenses of 20% and a decrease of −80%,were selected.
• The water cost was neglected in the sensitivity analysis as it only occupies a small share of thetotal costs and has been considered negligible in other studies [40].
• The most important part of the fixed O&M costs is the cell stack replacement cost and was selectedfor further analysis. As the hydrogen implementation is still in its early stages the future costsof the cell stacks are likely to decrease with mass production. Based on pure assumptions thechanges in replacement costs were selected as ±50%.
Energies 2017, 10, 763 11 of 15
Figure 9. Sensitivity analysis for 20 years of lifetime.
As Figure 9 indicates the LCOH could be reduced to approximately 10.3 €/kg with an electricity price of 0.04 €/kWh. In the case of a reduction of −80% of the total investment costs the LCOH could be reduced to approximately 10.3 €/kg, together with the estimated minimum price of electricity down to 6.7 €/kg over the longest assessed operational phase. The sensitivity of the LCOH on the cell stack replacement cost shows a decrease to approximately 13.6 €/kg.
In the results above, a fixed and relatively modest number of operating hours, 80% of the time or 7008 h annually is assumed. As an important parameter, a specific sensitivity analysis was carried out to see how the operating hours affect the LCOH. The results are depicted in Figure 10 where the operating hours vary from 50% (4380 h)–95% (8322 h) over the 20-year lifetime.
Figure 10. Effects on the LCOH with different operating hours.
As Figure 10 indicates the LCOH could reach approximately 18 €/kg if the operating hours are 4380 h (50%) and as low as approximately 12 €/kg at 8322 h (95%), making the operating hours as important factors as the electricity and investment costs.
5. Discussion
The main goal of this study was to evaluate the LCOH for a decentralized HRS in Belgium. The cost model was derived from mature and state of the art literature and the calculations were based on a comprehensive field data collection to ascertain as realistic costs as possible. The results can also be used as benchmarks for the next phase of the DQ project, where a new state of the art PEM WE and FC have been added to the current HRS.
Figure 9. Sensitivity analysis for 20 years of lifetime.
As Figure 9 indicates the LCOH could be reduced to approximately 10.3 €/kg with an electricityprice of 0.04 €/kWh. In the case of a reduction of −80% of the total investment costs the LCOH couldbe reduced to approximately 10.3 €/kg, together with the estimated minimum price of electricity downto 6.7 €/kg over the longest assessed operational phase. The sensitivity of the LCOH on the cell stackreplacement cost shows a decrease to approximately 13.6 €/kg.
In the results above, a fixed and relatively modest number of operating hours, 80% of the time or7008 h annually is assumed. As an important parameter, a specific sensitivity analysis was carriedout to see how the operating hours affect the LCOH. The results are depicted in Figure 10 where theoperating hours vary from 50% (4380 h)–95% (8322 h) over the 20-year lifetime.

Energies 2017, 10, 763 12 of 15
Energies 2017, 10, 763 11 of 15
Figure 9. Sensitivity analysis for 20 years of lifetime.
As Figure 9 indicates the LCOH could be reduced to approximately 10.3 €/kg with an electricity price of 0.04 €/kWh. In the case of a reduction of −80% of the total investment costs the LCOH could be reduced to approximately 10.3 €/kg, together with the estimated minimum price of electricity down to 6.7 €/kg over the longest assessed operational phase. The sensitivity of the LCOH on the cell stack replacement cost shows a decrease to approximately 13.6 €/kg.
In the results above, a fixed and relatively modest number of operating hours, 80% of the time or 7008 h annually is assumed. As an important parameter, a specific sensitivity analysis was carried out to see how the operating hours affect the LCOH. The results are depicted in Figure 10 where the operating hours vary from 50% (4380 h)–95% (8322 h) over the 20-year lifetime.
Figure 10. Effects on the LCOH with different operating hours.
As Figure 10 indicates the LCOH could reach approximately 18 €/kg if the operating hours are 4380 h (50%) and as low as approximately 12 €/kg at 8322 h (95%), making the operating hours as important factors as the electricity and investment costs.
5. Discussion
The main goal of this study was to evaluate the LCOH for a decentralized HRS in Belgium. The cost model was derived from mature and state of the art literature and the calculations were based on a comprehensive field data collection to ascertain as realistic costs as possible. The results can also be used as benchmarks for the next phase of the DQ project, where a new state of the art PEM WE and FC have been added to the current HRS.
Figure 10. Effects on the LCOH with different operating hours.
As Figure 10 indicates the LCOH could reach approximately 18 €/kg if the operating hours are4380 h (50%) and as low as approximately 12 €/kg at 8322 h (95%), making the operating hours asimportant factors as the electricity and investment costs.
5. Discussion
The main goal of this study was to evaluate the LCOH for a decentralized HRS in Belgium. Thecost model was derived from mature and state of the art literature and the calculations were based ona comprehensive field data collection to ascertain as realistic costs as possible. The results can also beused as benchmarks for the next phase of the DQ project, where a new state of the art PEM WE and FChave been added to the current HRS.
The main limitations of the study are related to assumptions of the price of electricity and theutilization of the HRS. The assumption of the price of electricity was based on an average value,both for the high and low values, which is a simplification of a highly dynamic relationship. Theseassumptions might lead to estimation errors as well, especially if actual operating hours tend to beduring peak hours when the cost of electricity is high or at other times resulting in lower electricitycosts. A further analysis of this relationship is an area of further study.
No consumer tax or other fees were applied to the LCOH, which would reflect real consumercosts similar to some of the results in the study by Linnemann & Steinberger-Wilckens [36]. There wasno salvage value assumed nor any end of life costs due to uncertainty of the status of the componentsafter the lifetimes analyzed.
Based on the assumptions in this study the main results indicated that a LCOH of 13.9 €/kg couldbe reached for a 20 year lifetime with 80% utilization. Furthermore, in favorable conditions, witha reduction in investment expenses of −80% and electricity cost of 0.04 €/kWh a LCOH as low as6.7 €/kg could be reached. Of these, a reduction in investment expenses requires subsidizing or atechnological leap, but the electricity part is already a plausible scenario with the RE systems operatedon the case site, and with an electricity cost of only 0.04 €/kWh the LCOH would drop down close to6.7 €/kg.
When comparing the results with the existing literature on similar production systems [25,36],variations in the results are found placing the current study in between the extremes. The key factorexplaining the differences seems to be the high impact on different assumptions, underlining theearlier stated need for more studies of actual operating facilities.
In comparison to the study by Linnemann and Steinberger-Wilckens [36], where a small and alarge scale hydrogen plant were analyzed, costs of approximately 27.5 €/kg and 11.4 €/kg, respectively,were presented. It is relevant to compare the cost of the smaller scale system from the reference

Energies 2017, 10, 763 13 of 15
study to the 13.9 €/kg in the current study. There is a large difference between the two which couldbe attributed by different assumptions. The main differences are depicted in Table 7 but the maindifference was the operating hours. It should be noted that although the dates of the studies differ, thetechnology is similar and the date of the cost information in the current study is from the year 2011and therefore the validity of the comparison remains.
Table 7. Results and assumptions from selected studies.
Reference WE Size Annual Load Hours Electricity Cost LCOH
[36] ~305 kW 4000 0.091 €/kWh ~27.5 €/kg 1
[36] ~297 MW 6500 0.091 €/kWh ~11.4 €/kg 1
[25] ~1.1 MW - - 2.8 €/kg[25] ~2.2 MW - - 6.2 €/kg
Current study ~156 kW 7008 0.09 €/kWh 13.9 €/kg1 Values converted by authors based on ~39.4 kWh/kg (HHV H2).
In another study, Greiner et al. [25] provide a method of assessment for a wind-hydrogensystem on a Norwegian island, presenting both a chronological simulation and cost calculations.In contrast to the current study and the reference study above there is a large gap between the results.Greiner et al. [25] presented a LCOH of 2.8 €/kg and 6.2 €/kg for grid-connected and stand-alonesystems. Different assumptions (refer to Table 7) are the main reasons for the vast difference wherethe largest factors might be the scale of the system and potentially the electricity costs. The studyby Greiner et al. [25] utilizes electricity from an onsite wind turbine and therefore the electricity costis only connected to the wind turbine cost and production capacity. They also assume hydrogendemand of 450 kg/day. It is appropriate to compare the grid connected system to the current studywhereas both systems have renewables that inject electricity into the local grid, bearing in mind thatGreiner et al. [25] include the sold sale/purchase cost of market price electricity. In this way, in the caseof the lowest electricity cost in the current study the LCOH could reach 10.3 €/kg with an electricitycost of 0.04 €/kWh. The assumption of the lower electricity cost is somewhat unrealistic where thisvalue could only be reached when injecting electricity into the public grid, which then affects theresults to some extent. The actual price would presumably fluctuate, but just how much is an areafor further study. It should be noted that the investment expenses in the current study include morerealistic costs than the comparison studies, and hence a potentially higher LCOH.
Based on the above it becomes evident that the main factor in keeping the LCOH as low as possibleis maintaining operating hours at the maximum level as the LCOH could drop to approximately12 €/kg at 95% utilization, as depicted in Figure 10. The second largest cost factor, which is consistentwith the literature [6,16,40], is the electricity cost, as demonstrated in this study with the sensitivityanalysis. Investment expenses together with replacement costs form the third important category.
The cost figures used in this study date back to the year 2011 and represent relatively high costsas DQ is a small-scale demonstration project. A larger scale commercial system could yield lowerinitial and running costs where WE costs tend to follow a non-linear cost curve [4,11]. The sensitivityanalysis in Section 4.2 depicts the underlying potential in reducing these costs.
6. Conclusions
The main results showed that a LCOH of 13.9 €/kg could be reached if the operational hoursare maximized. However, as seen in the sensitivity analysis, by reducing the electricity cost down to0.04 €/kWh, the investment expenses down by −80% of the total cost and maintaining 80% operatinghours a LCOH of 6.7 €/kg could be reached.
The results indicated that the critical cost factors are the electricity and investment expenses asthey have the largest impact on the LCOH. As hydrogen production is evidently capital intensive andrequires cheap and environmentally friendly electricity, combining the large quantity of renewables

Energies 2017, 10, 763 14 of 15
installed every year and green policies is critical to achieve the cost levels required. However, asystem such as the studied DQ could, together with selected RE technologies, provide an option for acomprehensive off the grid solution even before the aimed cost competitiveness is achieved. Demandfor reliable low-carbon off the grid solutions with high self-sufficiency is growing fast, and the costrequirement for competitiveness is less demanding.
Although the model and the results in this study were solely based on phase 1 of theDQ project, this study takes a small but yet important step towards the hydrogen economy bydemonstrating the realistic cost of small scale hydrogen production and provides a benchmark for newhydrogen technologies.
Acknowledgments: This study was carried out as a part of the Don Quichote (DQ) project which is co-funded bythe 7th Framework Programme (FP7) under the initiative of the Fuel Cell and Hydrogen Joint Undertaking (FCHJU) under grant agreement number 303411. The author would like to use the opportunity to thank the projectpartners for their assistance and for letting this paper become a reality. The project partners are: Hydrogenics,Colruyt, Thinkstep, TUV, Icelandic New Energy, FAST and Waterstofnet. Special thanks to Denis Thomas atHydrogenics for the input he provided.
Author Contributions: Ludvik Viktorsson conducted the assessments and wrote the main part of the paper.Jukka Taneli Heinonen helped defining the methodology and writing the paper. Jon Bjorn Skulason providedthe opportunity and assisted with data acquisition and the design of the study. Runar Unnthorsson providedcomments and helped designing the study.
Conflicts of Interest: The authors declare no conflict of interest.
References
1. Pachauri, R.K.; Meyer, L.; The Core Writing Team. Synthesis Report. Available online: http://epic-reports.awi.de/37530/1/IPCC_AR5_SYR_Final.pdf (accessed on 25 May 2017).
2. Socolow, R.H.; Pacala, S.W. A plan to keep carbon in check. Sci. Am. 2006, 295, 50–57. [CrossRef] [PubMed]3. IRENA. Renewable Energy Capacity Statistics 2015. Available online: http://www.irena.org/
DocumentDownloads/Publications/IRENA_RE_Capacity_Statistics_2015_slide_deck.pdf (accessed on25 November 2016).
4. Mazloomi, K.; Gomes, C. Hydrogen as an energy carrier: Prospects and challenges. Renew. Sustain.Energy Rev. 2012, 16, 3024–3033. [CrossRef]
5. Sherif, S.A.; Barbir, F.; Veziroglu, T. Wind energy and the hydrogen economy-review of the technology.Sol. Energy 2005, 78, 647–660. [CrossRef]
6. Winter, C.-J. Hydrogen energy—Abundant, efficient, clean: A debate over the energy-system-of-change.Int. J. Hydrog. Energy 2009, 34, S1–S52. [CrossRef]
7. Midilli, A.; Ay, M.; Dincer, I.; Rosen, M. On hydrogen and hydrogen energy strategies: I: Current status andneeds. Renew. Sustain. Energy Rev. 2005, 9, 255–271. [CrossRef]
8. Stiegel, G.J.; Ramezan, M. Hydrogen from coal gasification: An economical pathway to a sustainable energyfuture. Int. J. Coal Geol. 2006, 65, 173–190. [CrossRef]
9. Balat, M. Potential importance of hydrogen as a future solution to environmental and transportationproblems. Int. J. Hydrog. Energy 2008, 33, 4013–4029. [CrossRef]
10. Contreras, A.; Yigit, S.; Özay, K.; Veziroglu, T. Hydrogen as aviation fuel: A comparison with hydrocarbonfuels. Int. J. Hydrog. Energy 1997, 22, 1053–1060. [CrossRef]
11. Bertuccioli, L.; Chan, A.; Hart, D.; Lehner, F.; Madden, B.; Standen, E. Development of Water Electrolysis in theEuropean Union; Fuel Cells Hydrogen Joint Undertaking: Lausanne, Switzerland, 2014.
12. Zakeri, B.; Syri, S. Electrical energy storage systems: A comparative life cycle cost analysis. Renew. Sustain.Energy Rev. 2015, 42, 569–596. [CrossRef]
13. Bicáková, O.; Straka, P. Production of hydrogen from renewable resources and its effectiveness. Int. J.Hydrog. Energy 2012, 37, 11563–11578. [CrossRef]
14. Kothari, R.; Buddhi, D.; Sawhney, R. Comparison of environmental and economic aspects of varioushydrogen production methods. Renew. Sustain. Energy Rev. 2008, 12, 553–563. [CrossRef]
15. Holladay, J.D.; Hu, J.; King, D.L.; Wang, Y. An overview of hydrogen production technologies. Catal. Today2009, 139, 244–260. [CrossRef]

Energies 2017, 10, 763 15 of 15
16. Ogden, J.M. Prospects for building a hydrogen energy infrastructure. Annu. Rev. Energy Environ. 1999, 24,227–279. [CrossRef]
17. McDowall, W.; Eames, M. Forecasts, scenarios, visions, backcasts and roadmaps to the hydrogen economy:A review of the hydrogen futures literature. Energy Policy 2006, 34, 1236–1250. [CrossRef]
18. Bockris, J. The hydrogen economy—An ultimate economy? Environ. Mon. 1972, 1, 29–35.19. Bockris, J. The origin of ideas on a hydrogen economy and its solution to the decay of the environment. Int. J.
Hydrog. Energy 2002, 27, 731–740. [CrossRef]20. Maack, M.H.; Skulason, J.B. Implementing the hydrogen economy. J. Clean. Prod. 2006, 14, 52–64. [CrossRef]21. Sigfusson, T.I. Planet Hydrogen: The Taming of the Proton; Coxmoor Publishing Company: Oxford, UK, 2008.22. Bakker, S. The car industry and the blow-out of the hydrogen hype. Energy Policy 2010, 38, 6540–6544.
[CrossRef]23. Lee, J.-Y.; An, S.; Cha, K.; Hur, T. Life cycle environmental and economic analyses of a hydrogen station with
wind energy. Int. J. Hydrog. Energy 2010, 35, 2213–2225. [CrossRef]24. Lee, J.-Y.; Yoo, M.; Cha, K.; Lim, T.W.; Hur, T. Life cycle cost analysis to examine the economical feasibility of
hydrogen as an alternative fuel. Int. J. Hydrog. Energy 2009, 3, 4243–4255. [CrossRef]25. Greiner, C.J.; KorpÅs, M.; Holen, A.T. A Norwegian case study on the production of hydrogen from wind
power. Int. J. Hydrog. Energy 2007, 32, 1500–1507. [CrossRef]26. Khan, M.; Iqbal, M. Pre-feasibility study of stand-alone hybrid energy systems for applications in
Newfoundland. Renew. Energy 2005, 30, 835–854. [CrossRef]27. Zoulias, E.; Lymberopoulos, N. Techno-economic analysis of the integration of hydrogen energy technologies
in renewable energy-based stand-alone power systems. Renew. Energy 2007, 32, 680–696. [CrossRef]28. Hessami, M.-A.; Campbell, H.; Sanguinetti, C. A feasibility study of hybrid wind power systems for remote
communities. Energy Policy 2011, 39, 877–886. [CrossRef]29. Gökçek, M. Hydrogen generation from small-scale wind-powered electrolysis system in different power
matching modes. Int. J. Hydrog. Energy 2010, 35, 10050–10059. [CrossRef]30. Gahleitner, G. Hydrogen from renewable electricity: An international review of power-to-gas pilot plants for
stationary applications. Int. J. Hydrog. Energy 2013, 38, 2039–2061. [CrossRef]31. Fabrycky, W.J.; Blanchard, B.S. Life-Cycle Cost and Economic Analysis; Prentice Hall: Bergen, NJ, USA, 1991.32. Woodward, D.G. Life cycle costing—Theory, information acquisition and application. Int. J. Proj. Manag.
1997, 15, 335–344. [CrossRef]33. Harvey, G. Life-cycle costing: A review of the technique. Manag. Account. 1976, 54, 343–347.34. IRENA Secretariat. Renewable Energy Technologies: Cost Analysis Series. Available online: https://www.
irena.org/DocumentDownloads/Publications/RE_Technologies_Cost_Analysis-WIND_POWER.pdf(accessed on 25 November 2016).
35. Thomas, D.; Mertens, D.; Meeus, M.; Van der Laak W, F.I. Roadmaps for Economic Challenges:Power-to-Gas Roadmap for Flanders. Available online: http://www.power-to-gas.be/final-report (accessedon 25 May 2017).
36. Linnemann, J.; Steinberger-Wilckens, R. Realistic costs of wind-hydrogen vehicle fuel production. Int. J.Hydrog. Energy 2007, 32, 1492–1499. [CrossRef]
37. Electricity Prices by Type of User: Medium Sized Industries. Available online: http://ec.europa.eu/eurostat/tgm/refreshTableAction.do?tab=table&plugin=1&pcode=ten00117&language=en (accessed on26 March 2016).
38. Gerdesmeier, D. Price Stability: Why Is It Important to You? Available online: https://www.ecb.europa.eu/pub/pdf/other/whypricestability_en.pdf (accessed on 25 May 2017).
39. Ammermann, H.; Hoff, D.P.; Atanasiu, M.; Ayllor, J.; Kaufmann, M.; Tisler, O. Advancing Europe’s EnergySystems: Stationary Fuel Cells in Distributed Generation. Available online: http://www.fch.europa.eu/sites/default/files/FCHJU_FuelCellDistributedGenerationCommercialization_0.pdf (accessed on 25 May 2017).
40. Levene, J.I.; Mann, M.K.; Margolis, R.M.; Milbrandt, A. An analysis of hydrogen production from renewableelectricity sources. Sol. Energy 2007, 81, 773–780. [CrossRef]
© 2017 by the authors. Licensee MDPI, Basel, Switzerland. This article is an open accessarticle distributed under the terms and conditions of the Creative Commons Attribution(CC BY) license (http://creativecommons.org/licenses/by/4.0/).