a step beyond visualization: how to ingest meteosat …
TRANSCRIPT

Available on line at Directory of Open Access Journals
Journal of Hyperspectral Remote Sensing v.04, n.01, (2014) 01 – 15
A STEP BEYOND VISUALIZATION: HOW TO INGEST METEOSAT
SECOND GENERATION SATELLITE DATA AND PRODUCTS INTO
McIDAS-V, ILWIS AND TerraMA2
Humberto Alves Barbosa 1, Leandro Rodrigo Macedo da Silva
2, Anselmo Manoel dos
Santos3, Carlos Pinto da Silva Neto
4
1,2, 3, 4Universidade Federal de Alagoas. Maceió, Alagoas, Brasil. E-mail: [email protected]
Received 30 August 2013; received in revised from 07 September 2013: accepted 30 September 2013
Abstract
The Laboratory for Analyzing and Processing Satellite Images (LAPIS) of the University of Alagoas
(UFAL) has been very active in the usage of Meteosat Second Generation (MSG) satellite data and
products since 2007. These data and products are received in near-real time using simple and low
cost ground reception infrastructure. Several examples of the ingest and display process for MSG
satellite data and products are presented. The ingest of these satellite data and products is
accomplished using a McIDAS-V, ILWIS and TerraMA2 tools. It is also shown how these MSG
satellite-based products can be combined with other data. Results show that McIDAS-V, ILWIS and
TerraMA2 are very useful tools to researchers and forecasters in the input and display process for
MSG satellite data and products.
Keywords: Open Source Software, EUMETCast, Meteosat.
1. Introduction
With the drastic advances in
technology over the past decades, the
availability, as well as the quantity, of large
data sets for research in almost every scientific
field has increased dramatically (e.g. Kehrer,
2011; Nocke et al. 2008). More specifically,
the availability of earth observation-based
imagery data and satellite information for
research purposes and practical applications
has grown with many organizations such as
the European Organisation for the Exploitation

Barbosa et al./ Journal of Hyperspectral Remote Sensing v.04, n.01, (2014) 2
of Meteorological Satellites (EUMETSAT),
the National Aeronautics Space
Administration (NASA), the National Oceanic
and Atmospheric administration (NOAA), etc.
For instance, through GEONETCast
systems(EUMETCast, GEONETCast
Américas and CMACast), which are part of
the core Global Earth Observation System of
Systems (GEOSS), the users do not need to
repeatedly build ground receiving stations for
different satellites (Wolf and Williams, 2007).
The additional importance of GEONETCast
systems is that they provide the measurements,
and products for validating the prediction
methodology (non-real-time), and for verifying
the forecasts (near-real-time), including both
the guidance, and the actual forecasts and
warnings (Barbosa, 2013).
Observations from satellites are now
providing quantitative information about how
the Earth system varies on a variety of spatial
and temporal time scales, documenting longer-
term evolution, and providing information that
can inform prediction and enable better policy
and management decisions (Barbosa and
Kumar, 2012). Satellite-based data help
improve understanding not only of how
individual Earth system components
(atmosphere, biosphere, cryosphere, ocean,
Earth surface) evolve but how they interact
with each other and both contribute and
respond to naturally-occurring and human
induced change (UNEP, 2008). As well,
diagnostic products (multi-channel based), and
color enhanced images (e.g. visible, water
vapor, IR) are available to forecasters to
analyze and diagnose the current state of the
atmosphere (Silva Junior, 2010), which in turn
help them to assess the quality of the
numerical weather prediction (NWP) outputs
in representing the current state (McGinley et
al. 1992).
Several variational data visualization
tools or systems are available nowadays but
they are implemented in centres where large
computational resources are available and are
generally used for global analysis (Ouellette,
2013). These sophisticated technologies for
visualization are essential for bridging the gap
between such systems and users. For Kehrer
(2011) typical visualization tasks cover visual
exploration, visual analysis and presentation.
In other words, visualization is concern to
generate static images that can represent
geostationary satellite data. Furthermore,
going beyond the visualization analysis,
complex data manipulation requires solutions
“out-of-core” including hardware and software
techniques (Nocke et al. 2008).
Applicative tools (e.g. ILWIS,
McIDAS-V, TerraMA2) allow the forecaster to
combine data types into single displays. For
instance, Nocke et al. (2008) highlights that
designing intuitive and meaningful visual
representations in climate context faces a
variety of challenges. The first thing to
consider is the heterogeneity and diversity of
climate related data. The most common view
of climate data uses the gridded format. Grids
are used to group data and can aggregate

Barbosa et al./ Journal of Hyperspectral Remote Sensing v.04, n.01, (2014) 3
information just using columns and lines or
adding colors. But this is not the best way to
make spatial and temporal information
understandable. So, using 2D-maps or 3D
objects is a way to represent multivariate and
region-based information.
Currently, there are a variety of
important forecasting tools, or guidance
information that forecasters use, different ones
for different forecasting ranges, and relevance
depends on the climatic regime (polar, mid-
latitudes, tropics). They are largely based on
two kinds of production systems: one kind is
based on data from observational systems, and
the other is based on NWP atmospheric
simulation systems; the latter often provides its
data assimilation sub-system to create
objective precipitation analyses from
observational data, and this is mainly for
amounts (McGinley et al. 1992). These
applications require tools that can integrate
geographic services and modeling based
access real-time data geo-environmental
(meteorological, climatic, atmospheric,
hydrological, geotechnical, socio-
demographic, etc.), available on the connected
server the Internet (Albers, 1995).
The aim of this paper is to implement a
methodology for the ingest and display process
for the MSG satellite data and products into
McIDAS-V, ILWIS, TerraMA2. A simple set
of requirements are formulated. Several
examples of the ingest and display process for
these data and products are also presented.
The paper is organized as follows.
Section 2 defines the requirements for MSG
satellite Data. Section 3 describes the MSG
Satellite Data and Product Formats. Section 4
details products from the Meteorological
Product Extraction Facility (MPEF). Section 5
details products from the Land Surface
Analisys Satellite Application Facility (LSA
SAF). Section 6 details software tools at
LAPIS. Section 6 shows the results and
discussion. Section 7 summarizes and
concludes the paper.
2. Data, Products and Methods
2.1. Requirements for MSG Satellite Data
MSG satellite data and products are
distributed to the user mainly through the
EUMETCast system (EUMETSAT, 2013),
provide the forecaster with a great deal of
information, as shown in the EUMETSAT
Product Navigator
(http://navigator.eumetsat.int). These data and
products can be received using simple and low
cost ground reception infrastructure (Figure
1).The EUMETCast system is destined to the
retransmission to users in various points on the
planet, of codified data and products
originating from meteorological,
oceanographic, and environmental satellites,
via telecommunication commercial
geostationary satellites in different frequencies
(Barbosa, 2013). The concept of this
dissemination service is based on the standard
technology of Digital Video Broadcasting
(DVB) (EUMETSAT, 2005).

Barbosa et al./ Journal of Hyperspectral Remote Sensing v.04, n.01, (2014) 4
Figure 1. Overview of the broadcasting ground
reception and processing system at the
University of Alagoas (UFAL) in Brazil.
The antennas of the EUMETCast
system users are basically divided into two
types, which are destined to the Ku band
reception via the Hotbird-6 satellite, and the
antennas destined to the C band reception via
the AtlanticBird 3 and SES-6 satellites
(EUMETSAT, 2005). The C band transmits
inthe cover areas of Africa and South America.
While the transmission in Ku band is for
Europe. The minimum diameter of the
antennas is in the 2.4 m order for the South
American continent (Barbosa, 2013) and 80
cm for the European continent, in Ku band.
The basic antenna components are a parabolic
reflector of 2.6 meters, supply with LHC
polarization, and a universal LNB amplifier to
amplify the signals of low-level potential, and
cables for connections. To receive the signal,
the antenna is pointed to NSS-806 satellite.
The SES-6 is located at 40.5º west (Silva
Junior, 2010).
The antenna of the user receives the PC
signal and plaque (Technisat SkyStar2 TV PCI
or other DVT plaque) identifies the packages
(Packed ID-PID) which are transmitted in the
MPEG-2 format for the EUMETSAT
application, called T-System Tellicast. The
PIDs are defined in the application of the DVT
plaque, called Setup4PC. And the transmission
of the packages is achieved via the TCP/IP
protocol (Transmission Control
Protocol/Internet Protocol). After the transfer,
the TelliCast verifies if the eToken key
(EUMETCast Key Unit-EKU) is suitable for
the recuperation of the archive (EUMETSAT,
2008)
The system-configuration provides a
low cost alternative to the “non-traditional
meteorological” user community in Brazil
applying the MSG data to a multitude of
important environmental science related
applications (Barbosa et al. 2013). The MSG
capabilities and current favorable data
distribution policy-license agreement of
EUMETSAT, for Research and Education
Institutes like the Federal University of
Alagoas (UFAL), have recently opened the
way for new initiatives (Barbosa, 2013)
The Laboratory for Analyzing and
Processing Satellite Images (LAPIS) of the
UFAL has been very active in the usage of
MSG satellite data and products for over 7
years (Silva Junior, 2010). MSG satellite data
was first introduced in 2007 through the direct
EUMETCast readout system.
2.2. MSG Satellite Data and Product
Formats
To carry the development of the ingest
and display process for MSG satellite data and
products, a simple set of requirements are
formulated. The requirements for these data

Barbosa et al./ Journal of Hyperspectral Remote Sensing v.04, n.01, (2014) 5
and products are: i) Setting up geographic
data; ii) Conversion of data and products into
McIDAS-V, ILWIS, and TerraMA2 tools
compatible format; iii) Automatic ingest of
data and products into these tool database via
low cost ground reception infrastructure; iv)
Ability to display these data and products in a
meaningful way (readout, display, integration
these data and products with other data
available in EUMETCast).
The McIDAS-V, ILWIS and TerraMA2
software tools produce their outputs at MSG
full disk and its products over any areas
defined by the user inside the chosen
geographic window the MSG spatial
resolution ranges approximately from 4 to 5
Km.
To carry on the ingestion of MSG
satellite data into these tools it is necessary to
readout of digital (raw) data. These data
consist of geographical arrays of 3712 × 3712
pixels and a sampling distance of 3 × 3 km2 at
the sub-satellite point (except the HRV
channel), i.e. the point on the Earth’s surface
directly below the satellite. Each pixel contains
10 bit data that represents the radiance value,
expressed in 10-3
Wm-2
sr-1
[cm-1
]-1
, codified in
DC form (EUMETSAT, 2013).
The processing of a full set of data of
all 12 images: (i) Data acquisition stage (via
EUMETCast system), (ii) Data decoding stage
(calibration) and (iii) Data scientific
processing stage (rectification, normalization),
plus extraction of nowcasting products, is
performed within a few minutes so that the
data are available to the weather forecasters in
near real-time. EUMETCast provide MSG
images processed to Level 1.5 (EUMETSAT,
2008), obtained through the processing of
satellite raw data (designated as Level 1.0
data). This processing level corresponds to
image data corrected for radiometric and
geometric effects, geolocated using a standard
projection, finally calibrated.
EUMETSAT uses a variety of formats
for storage and distribution of products. The
most used types are listed below
(EUMETSAT, 2013):
Hierarchical Data Format (HDF)
Hierarchical Data Format, commonly
abbreviated HDF, HDF4 or HDF5, consists of
a library and multi-object file format for
transferring graphical and numerical data
between computers. HDF supports several
different data models, including
multidimensional arrays, raster images, and
tables. Each defines a specific aggregate data
type and provides an API to read, write and
organize data and metadata. New data model
scan be added by the HDF developers or
users. (EUMETSAT, 2013)
General Regularly -distributed Information
in Binary Edition 2 (GRIB – 2)
GRIB (gridded binary) is the binary
WMO standard format for data exchange in
grid. GRIB Edition 2 is an extension of GRIB
with a very high degree of flexibility and
expandability. It is an efficient vehicle for
transmitting large volumes of gridded data to
automated over telecommunication lines with

Barbosa et al./ Journal of Hyperspectral Remote Sensing v.04, n.01, (2014) 6
high speed, using modern protocols centers.
(EUMETSAT, 2013)
Binary Universal Form for the
Representation (BUFR)
A binary data format, maintained by
the World Meteorological Organization
(WMO), based on characters such as SYNOP
(surface observations), TEMP (upper air
soundings) and CLIMAT (monthly
climatological data) codes. The BUFR tables
used by EUMETSAT are established by WMO
and are available on the website
(http://www.wmo.int/pages/prog/www/WMO
Codes.html) (EUMETSAT, 2013).
High Rate Information Transmission
(HRIT)
Low Rate Information Transmission
(LRIT) CGMS standards are agreed between
the satellite operators, for the dissemination of
digital data via direct transmission. Quite
similar to HRIT/LRIT way, the distinction
between the two standards is the data rate
(bandwidth) required to transmit the data
content, with LRIT about 256 Kbps to 10Mbps
and hrit. (EUMETSAT, 2013).
2.3. Products from the Meteorological
Product Extraction Facility (MPEF)
The MPEF parts of the MSG Ground
Segment have the function of meteorological
product generation from image data from the
1.5 level provided by the Image Processing
Facility (IMPF). The products are quality
controlled and coded before being
disseminated to the Data Acquisition and
Dissemination Facility (DADF) for delivery to
users. Moreover, the products generated by
MPEF are transferred to the MSG Unified
Meteorological Archive and Recuperation
Facility (UMARF), where users can retrieve
EUMETCast system online and offline
(EUMETSAT, 2011). See below for reference
product MPEF’s.
Atmospheric Motion Vectors (AMV)
Product generated from the images of
MSG through monitoring of clouds and other
atmospheric components, eg, patterns of water
vapor and ozone in the synoptic scale ( ie, 100
km or larger). (EUMETSAT, 2011)
Cloud Analysis (CLA)
The product analysis of clouds is
generated based on the results of the analysis
of scenes from MSG, also provided in the
synoptic scale (100 km or larger). It is
information about cloud cover, the cloud top
temperature, cloud top pressure and cloud type
phase. (EUMETSAT, 2011)
Cloud Mask (CLM)
Product based from the results of scene
analysis that provide information about cloud
contamination and non- static surface types
(eg, coverage of snow/ice) in a pixel area for
each repeat cycle. (EUMETSAT, 2011)
Multi-sensor Precipitation Estimate (MPE)
Providing product information
precipitation rates estimated by the
instantaneous pixel rain every 15 minutes.
The algorithm is based on the combination
data of passive microwave from the SSM/I
SSMIS instruments and satellite images and

Barbosa et al./ Journal of Hyperspectral Remote Sensing v.04, n.01, (2014) 7
DMSP US- MSG from the data channel and
IR 10.8μm. The p roduct is more suitable for
convective precipitation. (EUMETSAT, 2011)
Normalized Difference Vegetation Index
(NDVI) (Barbosa, 2006)
Product that is part of the processing of
the analysis of scenes based on visible and
near infrared reflectance of VIS 0.6μm and
0.8μm channels, displaying information on
land cover and its seasonal variation.
(EUMETSAT, 2011).
2.4. Products from the Land Surface
Analisys Satellite Application Facility
(LSA SAF)
The LSA SAF
(http://landsaf.meteo.pt/) is part of the
SAF's network, a group of specialized
development and treatment centers in the
service of EUMETSAT. The main goal of
the LSA SAF (LSA SAF, 2013) is to take
full advantage of the remote sensing data,
particularly those available by
EUMETSAT, variables to measure the
earth's surface, which will be used
primarily for applications in meteorology.
Among the products generated by the
LSA SAF, See below for reference product
LSA SAF’s:
Fractional Vegetation Cover (FVC)
Product that is the amount of
vegetation distributed in a horizontal
perspective. The product is based on three
channels (VIS 0.6μm, VIS 0.8μm, NIR
1.6μm), using as input a parameter k0
parametric BRDF (Bi-directional
Reflectance Distribution Function) model
(LSA SAF, 2013)
Land Surface Temperature (LST)
The product are performs
measurements of surface temperature in
regions of clear sky through images thermal
infrared (Channels IR 10.8μm and IR
12.0μm) of MSG. (LSA SAF 2013)
2.5. Software Tools at LAPIS
The software tools presented here is
that currently used in the Laboratory for
Analyzing and Processing Satellite Images
(LAPIS, http://www.lapismet.com).
McIDAS –V software
The Space Science and Engineering
Center (SSEC) and the University of
Wisconsin-Madison have actively developed
the McIDAS since 1973. The McIDAS - V
is available in
http://www.ssec.wisc.edu/mcidas/software/v/
currently in active development. This
system is a set of sophisticated software
packages that perform a variety of functions
for processing images from weather satellites
and other geophysical data in two and three
dimensions, observation data, numerical
predictions, and other geophysical data.
Among these functions, include display,
analysis, interpretation, acquisition and
management of data. (McIDAS, 2013).
McIDAS-V in the processing of any
data type requires local or remote servers,
configured by McIDAS-V Data Explorer. A
local server is configured from a data folder

Barbosa et al./ Journal of Hyperspectral Remote Sensing v.04, n.01, (2014) 8
created on the same computer on which the
program is installed, while the remote server is
configured via a link directory access data
over the Internet. Therefore, for the data to
be inserted in a local server configuration
platform, it is necessary that you know some
specifications as data type and format, just so
you can choose the product to be ingested.
This platform is composed of three tabs
(Figure 2), Data Sources (A), Field Selector
(B) and Layer Controls (C), which correspond
to the configuration of the servers of the data
to be used, selection of what type of
information is generated from the file chosen
and customization of processing results,
respectively. For displaying the results of
processing, McIDAS-V has another interface.
Figure 2. Processing steps of the MSG in McIDAS. ILWIS software
Integrated Land and Water Information
System (ILWIS) is a tool for working with
spatial data that integrates GIS and remote
sensing. Was developed by ITC (Institute for
Aerospace Survey and Earth Sciences), is
available free on the internet in several
versions
(http://52north.org/communities/ilwis/downloa
d). The ILWIS is an open source software
(binaries and source code), and it is understood
a complete package of image processing,
spatial analysis and digital mapping. It is
possible to integrate raster image processing (in
matrix form) and vector.
In ILWIS was used plugin Geonetcast
Toolbox for processing. It allows direct import
of data EUMETCast system and processes
those using ILWIS or other systems for
geospatial analysis (Figure 3). To use the
graphical interface, the settings can be made
from an input directory, another departure and
date of data to be processed.
Figure 3. Interface of the Geonetcast Toolbox.
Terra View and Terra MA2 softwares
For data processing, Terra View 4.0.1
(http://www.dpi.inpe.br/terraview/index.php)
aplication that is associated with the Terra
MA²
(http://www.dpi.inpe.br/terrama2/english/inde
x.php). Was used Terra MA² version 3.0
software and FVC product was used in
ASCII grid format. In figure 4 shows a
schematic overview of the functioning of Terra
MA2 software.

Barbosa et al./ Journal of Hyperspectral Remote Sensing v.04, n.01, (2014) 9
Figure 4. Diagram of the TerraMA2. Source: (http://www.dpi.inpe.br/terrama2/english/arquitetura.php).
The TerraView is an application built
on the library geoprocessing TerraLib that
handles vector (points, lines and polygons) and
raster (grids and images) data, both stored in
DBMS relational or geo-relational market,
including ACCESS, PostgreSQL, MySQL,
Oracle, SQLServer and Firebird
(TERRAVIEW, 2010). All data used for the
analyzes on Terra MA² is first processed on
TerraView.
3. Results and discussion
The ingest of MSG satellite data and
products from LAPIS from direct EUMETCast
readout system is accomplished using a
McIDAS-V, ILWIS, and TerraMA2. A few
examples are shown to highlight how these
data and products can be displayed on
computer screen.
3.1. For MSG satellite data and product
display
In reality McIDAS-V is able to read
and display MSG data. Here McIDAS-V has
been chosen because it includes more general
satellite data (MSG, GOES, etc.) formats that
are standard projections so that it is quite
independent of the specific satellite platform.
Figure 5 shows the MSG full disk images for
display on McIDAS-V in a grey scale and
enhanced colours (on January 29, 2013 at
1200 UTC).
Figure 5. Ingest of MSG satellite data in the
VIS, WV and IR spectral bands in a grey scale
and enhanced colours into the MCIDAS-V
The interpretation of MSG satellite
images can be strongly supported and
facilitated when multispectral image data are
presented in appropriate physical
measurements of atmospheric reflectivity
(VIS_006), the cloud top temperature
(IR_108) and amount of water vapor in the
middle levels of the atmosphere (WV_073), as
shown in Figure 5.
The gridded MSG satellite data have to
set into TerraMA2 tool. This tool is a complex
numerical system conceived to perform
gridded analyses by merging together
numerous data sources. Figure 6 shows MSG
thermal imagery (IR_10.8) ingested into
TerraMA2, expressed in a gray scale image (0
to 255 levels). This image data contains 8-

Barbosa et al./ Journal of Hyperspectral Remote Sensing v.04, n.01, (2014) 10
bits per pixels and thus the adoption of the
TerraMA2 implies a data loss in terms of
radiometric accuracy since MSG data has 10-
bits per pixel. A special script is written that
places the MSG data into input files for the
TerraMA2.
Figure 6. MSG IR_10.8 thermal imagery
ingested into TerraMA2.
Figure 7 shows the ingestion of MPE
product (on January 29, 2013 at 1130 UTC)
into McIDAS-V. This product is classified by
a scale similar to the colors used by
EUMETSAT
(http://oiswww.eumetsat.org/IPPS/html/MSG/
PRODUCTS/MPE/America/index.htm)
ranging from blue (0 mm/hr), green (5
mm/hr), yellow (15 mm/hr), orange (25
mm/hr) and red (35 mm/hr). While MPE
product sub-image extraction for the McIDAS-
V shows the re-projected data over South
America. A vertical cross section at the
latitude of the MPE maximum (that is located
approximately in the top of the figure) is
displayed.
Figure 7. MPE product image ingested into
McIDAS-V.
3.2. For meteorological analysis: clouds
and rainfall
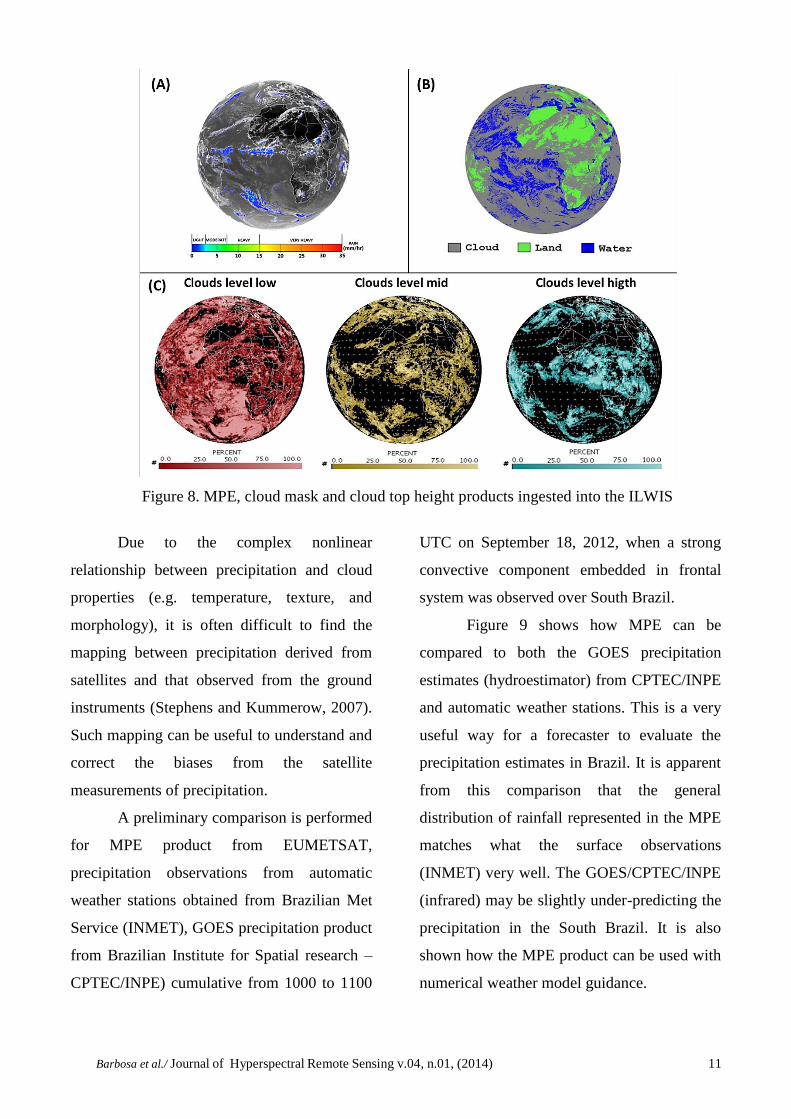
In order to verify the ability of the
ILWIS analysis in reproducing the MSG full
disk imagery on May 19, 2013 to 1145 UTC,
the MPE, cloud mask, cloud top height and
their difference maps are displayed in Figure
8. These products are used extensively during
the rainy season to track precipitation over the
Amazon Basin. Clouds and precipitation
observations (e.g. human observer, automatic
weather stations, radar and satellite systems)
are however very important data to verify
model precipitation forecasts and to validate
its physical processes.
Barbosa et al./ Journal of Hyperspectral Remote Sensing v.04, n.01, (2014) 11
Figure 8. MPE, cloud mask and cloud top height products ingested into the ILWIS
Due to the complex nonlinear
relationship between precipitation and cloud
properties (e.g. temperature, texture, and
morphology), it is often difficult to find the
mapping between precipitation derived from
satellites and that observed from the ground
instruments (Stephens and Kummerow, 2007).
Such mapping can be useful to understand and
correct the biases from the satellite
measurements of precipitation.
A preliminary comparison is performed
for MPE product from EUMETSAT,
precipitation observations from automatic
weather stations obtained from Brazilian Met
Service (INMET), GOES precipitation product
from Brazilian Institute for Spatial research –
CPTEC/INPE) cumulative from 1000 to 1100
UTC on September 18, 2012, when a strong
convective component embedded in frontal
system was observed over South Brazil.
Figure 9 shows how MPE can be
compared to both the GOES precipitation
estimates (hydroestimator) from CPTEC/INPE
and automatic weather stations. This is a very
useful way for a forecaster to evaluate the
precipitation estimates in Brazil. It is apparent
from this comparison that the general
distribution of rainfall represented in the MPE
matches what the surface observations
(INMET) very well. The GOES/CPTEC/INPE
(infrared) may be slightly under-predicting the
precipitation in the South Brazil. It is also
shown how the MPE product can be used with
numerical weather model guidance.

Barbosa et al./ Journal of Hyperspectral Remote Sensing v.04, n.01, (2014) 12
Figure 9. Examples of map cumulative precipitation from 1000 to 1100 UTC on September 18, 2012
over South Brazil estimated by MPE, GOES and automatic weather stations.
Satellite infrared measurements give
marginal accuracy because of the poor
relationships between cloud-top temperature
and the underlying clouds and precipitation
physics (Levizzani et al. 2002). Microwave
measurements are affected by sensitivity to
land surface emissitivity and by similar optical
properties of cloud water and light rainfall. As
a consequence, satellite precipitation estimates
have many limitations vis – a – vis the direct
(point) ground measurements from weather
stations.
3.3. For land–atmosphere interactions:
FVC and MPE products
The sensitivity of TerraMA2 to the
ingestion of FVC (Fraction Vegetation Cover)
and MPE products is displayed. Figure 10
shows FVC and MPE products are
geographically overlapped to generate a
spatial pattern that allows for identifying the
differences in vegetation and rainfall outputs.
The FVC product is the one biophysical
parameter that determines the contribution
partitioning between bare soil and vegetation
for surface evapotranspiration,
photosynthesis, albedo, and other fluxes
crucial to land–atmosphere interactions.
Figure 10. FVC and MPE products ingested
into TerraMA2
Figure 11 shows the spatial variations of the
re-projected FVC product over the
Northeastern Brazil and its municipalities.
The figure clearly indicates high spatial
patterns in FVC variability. This could be due
to the mixing of significant fraction of
observed pixels for the “low FVC values” and
“high FVC values” within the municipalities.
Overall, the FVC product is able to be

Barbosa et al./ Journal of Hyperspectral Remote Sensing v.04, n.01, (2014) 13
ingested into TerraMA2 over the municipalities analysed.
Figure 11. FVC ingested into Terra MA²
In order to verify the ability of the
ILWIS analysis in reproducing the
characteristics of vegetation dynamics over
the Alagoas’ states, FVC and NDVI products
have also been examined. Figure 12 shows
how the vegetation indices (FVC and NDVI
products) can be combined with other data
(SRTM, DEM) data that are available on
ILWIS. The integration process between
NDVI and FVC products occurs in two main
steps. First, for each time step taken into
account, Digital Elevation Model (DEM) and
FVC product are geographically overlapped
to generate a spatial pattern that allows for
separating the topographic effect in vegetation
cover outputs. Two products are used to
quantify the similarities and differences,
which are ingested into ILWIS tools. This
integration of products has proven to be very
useful to the researchers at universities.
Figure 12. F V C , N D V I , D E M a n d
S R T M p r o d u c t s i n g e s t e d i n t o
I L W I S
4. Summary and Conclusion
MSG-based satellite data (e.g. visible,
water vapor, IR spectral bands) and products
(MPE, cloud top height, FVC, NDVI) were
ingested into McIDAS-V, ILWIS and
TerraMA2. To accomplish all of these inputs, a
simple set of requirements were formulated.
The requirements for these data and products
were: i) Setting up geographic data; ii)
Conversion of data and products into
McIDAS-V, ILWIS, and TerraMA2 tools
compatible format; iii) Automatic ingest of
data and products into these tool database via

Barbosa et al./ Journal of Hyperspectral Remote Sensing v.04, n.01, (2014) 15
low cost ground reception infrastructure; iv)
Ability to display these data and products in a
meaningful way (readout, display, integration
these data and products with other data
available in EUMETCast).
Therefore McIDAS-V, ILWIS and
TerraMA2 are very useful tools to researchers
and forecasters in the input and display process
for MSG satellite data and products from
direct EUMETCast readout system.
.
5. Acknowledgment
Thanks to the direction of EUMETSAT
for favoring a policy of free distribution of
MSG satellite data.
6. References
Albers, S., 1995. The LAPS wind analysis.
Weather Forecasting. Cooperative Institute
for Research in the Atmosphere, Colorado
State University, Fort Collins, CO 10, 342-
352. [available from: http://citeseerx.ist.psu.edu/viewdoc/download?doi=1
0.1.1.56.5629&rep=rep1&type=pdf].
Barbosa, H. A. Sistema EUMETCast: Uma
abordagem aplicada dos Meteosat Segunda
Geração. 1ed.Maceió: EDUFAL, 2013, v.
2, 186p.
Barbosa, H. A., Huete, A., Baethgen. 2006. A
20-year study of NDVI variability over the
Northeast region of Brazil, Journal of Arid
Environments, 67, 288-307
Barbosa, H. A., Silva Junior, I. W, Macedo
Silva, L. R. 2011. Experiência da UFAL em
recepção, decodificação e processamento
das imagens do satélite Meteosat segunda
geração (MSG). Mudanças Climáticas.
Editora UFPE. Edição 1. Recife.
Barbosa, H. A.; Kumar, T. L. 2012.
Strengthening Regional Capacities for
Providing Remote Sensing Decision
Support in Drylands in the Context of
Climate Variability & Change. In: Silvern,
S.; Young; S. (Org.). International
Perspectives on Global Environmental
Change. 2ed.Croatia: INTech, v. 1, p. 3-
312.
Barbosa, H. A.; Tote, C. ; Lakshmi Kumar, T.
V.; Bamutaze, Y. 2013. Harnessing Earth
Observation and Satellite Information for
Monitoring Desertification, Drought and
Agricultural Activities in Developing
Countries. In: Silvern, S.; Young; S. (Org.).
Environmental Change and Sustainability.
3ed. Croatia: INTECH, v. 1, p. 3-301.
EUMETSAT, 2008. A simple conversion from
effective radiance back to spectral radiance
for MSG images, document n. 1053.
[available from: http://www.eumetsat.int/idcplg?IdcService=GET_FI
LE&dDocName=pdf_msg_conv_effrad2specrad&R
evisionSelectionMethod=LatestReleased].
EUMETSAT. 2013. About EUMETSAT.
Disponível em:
http://www.eumetsat.int/Home/Main/About
EU METSAT/index.htm?l=en. Data de
acesso: 03/02/2013a
EUMETSAT. 2013. EUMETSAT utilises a
variety of formats for product storage and
distribution. The most commonly used
types are listed below. Disponível em:
http://www.eumetsat.int/website/home/Data
/Pr oducts/Formats/index.html. Data de
acesso: 06/07/2013c.
EUMETSAT. 2013. The atmospheric
information available from our satellites has
wider benefits than its contribution to
weather forecasting. Disponível em:
http://www.eumetsat.int/website/home/Data
/Pr oducts/Atmosphere/index.html. Data de
acesso: 06/07/2013d.
EUMETSAT. MSG 2011. Meteorological
Products Extraction Facility: Algorithm
Specification Document. Disponível em:
http://www.eumetsat.int/Home/Main/DataP
rod ucts/Atmosphere/index.htm. Data de
acesso: 14/03/2013. Germany.

Barbosa et al./ Journal of Hyperspectral Remote Sensing v.04, n.01, (2014) 15
EUMETSAT. MSG: 2005. Meteosat Second
Generation, in orbit – in use. Germany. p1-
37.
ILWIS. 2013. ILWIS, the free user-friendly
raster and vector GIS. Data de acesso:
02/02/2013 [available from:
http://www.ilwis.org/]
Instituto Nacional de Pesquisas Espaciais –
INPE. Plataforma de Monitoramento,
Análise e Alerta – TerraMA2. 2014.
Disponível em:
<http://www.dpi.inpe.br/terrama2/>.
Acesso em: 27 março 2014.
Kehrer, J. 2011. Interactive visual analysis of
multi-faceted scientific data (Doctoral
dissertation, PhD dissertation, Dept. of
Informatics, Univ. of Bergen, Norway).
LSA SAF. 2013. Product User Manual:
Vegetation parameters. Portugal, 2008.
Disponível em:
http://landsaf.meteo.pt/products/prods.jsp.
Data de acesso: 13/03/2013.
McGinley, J. A., Albers, S. C., Stamus, P. A.,
1992. Local data assimilation and analysis
for nowcasting. Adv. Space Res. 12, 179-
188.
Nocke, T., Sterzel, T., Böttinger, M., &
Wrobel, M. 2008. Visualization of climate
and climate change data: An overview.
Digital earth summit on geoinformatics,
226-232.
Ouellette, J. 2013. The Mathematical Shape of
Things to Come - Scientific data sets are
becoming more dynamic, requiring new
mathematical techniques on par with the
invention of calculus In: Quanta Magazine,
October 4.
Silva Junior, I. W. 2010. Desenvolvimento de
aplicações operacionais para o
monitoramento meteorológico, ambiental e
oceanográfico utilizando dados do sistema
EUMETCast. Dissertação (Mestrado em
Meteorologia), UFAL, Maceió.
TERRAVIEW 4.1.0. 2013. Projeto TerraView.
São José dos Campos, SP: INPE, 2010.
Disponível em: www.dpi.inpe.br/terraview.
Acesso em: 24/02/2013.
UNEP. 2008. Climate change strategy, United
Nations Environment Programme.
Wolf L and Williams M. 2008. GEONETCast
- Delivering environmental data to users
worldwide (September 2007). IEEE
Systems Journal, vol. 2, No. 3.