a steady state model for anaerobic digestion of sewage sludges hub documents/water sa...
TRANSCRIPT
Available on website http://www.wrc.org.zaISSN 0378-4738 = Water SA Vol. 31 No. 4 October 2005ISSN 1816-7950 = Water SA (on-line)
511
Introduction
Sötemann et al. (2005a) developed an integrated two-phase (aqueous-gas) mixed weak acid base chemical, physical and bio-logical processes kinetic model for anaerobic digestion (AD) of sewage sludge. The COD, C and N mass balances and continu-ity basis of this model fixes quantitatively, via the interrelated chemical, physical and biological processes, the relationship between all the compounds of the system. Thus for a given sewage sludge COD removal the digester outputs (i.e. effluent COD, TKN, FSA, SCFA, H2CO3* Alk, pH, gaseous CO2 and CH4 production and partial pressures) are governed completely by the input sludge solids (and dissolved) constituents. In this model, the sewage sludge feed is characterised in terms of total COD, its particulate unbiodegradable COD fraction (fPS’up), the short chain fatty acid (SCFA) COD and the CHON content, i.e. X, Y, Z and A in CXHYOZNA of the particulate organics. This approach characterises the sludge in terms of measurable parameters in conformity with the COD, C and N mass balances approach. With this approach, the interactions between the biological processes and weak acid/base chemistry could be correctly predicted for stable steady state operation of anaero-bic digesters. While not validated for dynamic flow and load
conditions, the model has the capability of being applied to such conditions. In this paper this complex dynamic simulation model is simplified to a steady state one for integration into a steady state mass balance model of the whole wastewater treat-ment plant (Sötemann et al., 2005b). Steady state models are based on the slowest process kinetic rate that governs the overall behaviour of the system and relates this process rate to the system design and operating parameters. Therefore, steady state models allow the system design and operating parameters, such as reactor volume and recycle ratios, to be estimated reasonably simply and quickly from system performance criteria specified for the design, such as effluent quality. Once approximate design and operating parameters are known, these can serve as input to the more complex simula-tion models to investigate dynamic behaviour of the system and refine the design and operating parameters. A steady state AD model is therefore useful to:• estimate retention time, reactor volume, gas production and
composition for a required system performance like COD (or VSS) removal,
• investigate the sensitivity of the system performance to the design and operation parameters,
• provide a basis for cross-checking simulation model results, and
• estimate product stream concentrations for design of down- (or up-) stream unit operations of the wastewater treatment plant.
Anaerobic digestion of organics require a consortium of four organism groups (Mosey, 1983; Massé and Droste, 2000;
A steady state model for anaerobic digestion of sewage sludges
SW Sötemann, NE Ristow, MC Wentzel and GA Ekama*Water Research Group, Department of Civil Engineering, University of Cape Town, Rondebosch 7701, Cape Town, South Africa
Abstract
A steady state model for anaerobic digestion of sewage sludge is developed that comprises three sequential parts – a kinetic part from which the % COD removal and methane production are determined for a given retention time; a stoichiometry part from which the gas composition (or partial pressure of CO2), ammonia released and alkalinity generated are calculated from the %COD removal; and a carbonate system weak acid/base chemistry part from which the digester pH is calculated from the partial pressure of CO2 and alkalinity generated. From the stoichiometry and weak acid base chemistry parts of the model, for a given % COD removal, the digester gas composition, ammonia released, alkalinity generated and digester pH are com-pletely defined by the influent sludge composition, i.e. X, Y, Z and A in CXHYOZNA of the hydrolysable organics; volatile fatty acid (VFA) concentration; and pH. For the kinetic part of the model, four hydrolysis kinetic equations were calibrated against 7 to 60 d retention time anaerobic digesters treating two different sewage sludge types, viz. first order; first order specific; Monod; and saturation. Once calibrated against the two sludge type data sets and taking into account experimental error in effluent COD concentration and gas production (i.e. COD mass balance error), each of the four hydrolysis kinetic equa-tions predicted the % COD removal versus retention time equally well, and predicted COD removal and methane production compared well with measured data. For the different sewage sludge types, viz. a primary and humus sludge mixture from a trickling filter plant, and a “pure” primary sludge, different kinetic rate constants were obtained indicating that the “pure” primary sludge hydrolysed faster and had a lower unbiodegradable particulate COD fraction (fPS’up = 0.33) than the primary and humus sludge mixture (0.36). With the %COD removal known from the hydrolysis part of the model, and again taking experimental error into account (i.e. C and N mass balances error), the stoichiometry and weak acid base chemistry parts of the model predicted the gas composition, effluent free and saline ammonia (FSA) concentration, alkalinity generated and digester pH well for a primary and humus sludge composition of C3.5H7O2N0.196. From independent measurement of primary sludge CHON composition, this model estimated composition is within 96%, 100%, 95% and 99% of the average measured composition of C3.65H7O1.97N0.190 lending strong support to the developed steady state model.
Keywords: Anaerobic digestion, steady state model, sewage sludge, hydrolysis kinetics, biodegradability
* To whom all correspondence should be addressed. +27 21 650 2588/0/4; fax: +27 21 689 7471; e-mail: [email protected] 6 December 2004; accepted in revised form 8 August 2005.
512 Available on website http://www.wrc.org.zaISSN 0378-4738 = Water SA Vol. 31 No. 4 October 2005
ISSN 1816-7950 = Water SA (on-line)
Batstone et al., 2002; Sötemann et al., 2005a) viz.: (i) acidogens, which convert complex organics to SCFA acetic
and propionic (HAc, HPr), carbon dioxide (CO2) and hydro-gen (H2),
(ii) acetogens, which convert HPr to HAc and H2, (iii) acetoclastic methanogens, which convert HAc to CO2 and
methane (CH4) and (iv) hydrogenotrophic methanogens, which convert H2 and CO2
to CH4 and water.
The two methanogenic groups are very sensitive to pH and so the acetogens and acetoclastic methanogens must utilise the HAc and HPr respectively as soon as they are produced to maintain a near neutral pH for optimal operation. Because the hydroly-sis/acidogenesis process mediated by the acidogens ((i) above), is the slowest process in the system, high SCFA concentrations and therefore low pH, arise only under unstable and digester upset operating conditions caused by a shock load in organics, a rapid decrease in temperature or a methanogen inhibitor in the influent. A steady state model, therefore, need only consider the kinetics of this process (Vavilin et al., 2001). The processes following hydrolysis/acidogenesis, being much more rapid (usu-ally), can be accepted to reach completion. This implies that in stable AD systems the intermediate products of the processes following after hydrolysis/acidogenesis such as SCFAs and H2, do not build up in the system and their concentrations are suf-ficiently low to be considered negligible. Consequently, in the steady state AD model, the products of hydrolysis/acidogenesis can be dealt with stoichiometrically and converted to digester end products. In effect, it can be assumed that the hydrolysis/ acidogenesis process generates directly the digester end-prod-ucts biomass, CH4, CO2 and water. Thus the steady state anaero-bic digester model developed below considers three aspects: (1) the kinetics of the hydrolysis/acidogenesis process, (2) stoichiometric conversion of the products from (1) to digester
end-products and (3) the effect of the end products on the digester pH (weak acid/
base chemistry).
Hydrolysis/acidogenesis kinetics
Hydrolysis rate equations
Since the hydrolysis/acidogenesis process is the slowest one in the sewage sludge anaerobic digester and does not reach completion within the normal range of the principal digester design parameter of hydraulic retention time, a kinetic expres-sion describing this process rate is required for the steady state model. Sötemann et al. (2005a) considered four kinetic equa-tions for this process, viz.: • first order with respect to the residual biodegradable particu-
late organic (COD) concentration Sbp, • first order with respect to Sbp and the acidogen biomass con-
centration (ZAD) which mediates this process, • Monod kinetics and • saturation (or Contois) kinetics (see Eqs 1 to 4 in Table 1).
All these equations have been used to model various biologi-cal processes for many years; the first to describe the hydroly-sis/acidogenesis of sewage sludge solids in AD (e.g. Henze and Harremoës, 1983, Bryers, 1985, Vavilin et al., 2001), the second for modelling the conversion of readily biodegradable organics to short chain fatty acids in the anaerobic reactor of biologi-cal P removal systems (e.g. Wentzel et al., 1985), and the last
two for the utilisation of soluble readily and particulate slowly biodegradable organics respectively in activated sludge models (Dold et al., 1980; Henze et al., 1987) and hydrolysis of complex organics in AD (e.g. McCarty, 1974 and Vavilin et al., 2001). Sötemann et al. (2005a) were unable to determine which equa-tion was superior for modelling hydrolysis/acidogenesis process in AD because for the experimental data evaluated, the unbiode-gradable particulate COD fraction (fPS’up) of the sewage sludge (primary+humus) organics was not sufficiently well known - by changing fPS’up in a fairly narrow range from 0.32 to 0.36, each of the equations gave a better correlation coefficient than the other equations at different specific fPS’up values. They accepted the saturation kinetics for the integrated model (UCTADM1) because this equation gave a similar fPS’up value (0.36) to O’Rouke (1967) (0.34) working with AD of “pure” primary sludge (no trickling filter humus or waste activated sludge) and has been success-fully used to model hydrolysis/utilisation of the same particulate biodegradable organics in activated sludge kinetic models. In their comparison of first order and saturation (Contois) kinetics for modelling anaerobic hydrolysis, Vavilin et al. (2001) state that the latter is preferable from a modelling perspective (and is another reason these kinetics were included in the dynamic AD model of Sötemann et al., 2005a), but the uncertainty that the unknown unbiodegradable COD fraction of the influent organ-ics casts over hydrolysis kinetics selection is not mentioned. In their evaluation of the four hydrolysis/acidogenesis equations, Sötemann et al. (2005a) included the effect of the acidogen (ZAD) and acetoclastic methanogen (ZAM) biomass formation, because these two organism groups have the highest yield coefficients and so contribute significantly to the effluent organics (COD) concentration and decrease the gas production. In steady state models, detail is not required – in fact, it is undesirable. From the simulation model, sufficient accuracy for a steady state model is obtained by selecting any of the four hydrolysis/acidogenesis equations and increasing the acidogen biomass yield to include the acetoclastic methanogens. The acidogens have the highest yield coefficient (YAC=0.089 gCOD biomass/gCOD substrate hydrolysed) and make up more than 77% of the total biomass formed. Increasing YAD from 0.089 to 0.113 very closely takes into account the biomass formation of the other organism groups (see Fig. 4 of Sötemann et al., 2005a). A consequence of accepting this approach is that in kinetic rate formulations that include the acidogen biomass concentration (first order specific, Monod and saturation), the specific rate constants in the steady state model here will be lower compared with the corresponding values in the dynamic model of Söte-mann et al. (2005a) but the predicted performances (e.g. %COD removal) will be the same. The steady state model will be derived using the COD to quantify the organics and biomass concentrations and the Monod equation for the hydrolysis/acidogenesis rate. However, the model equations for all four hydrolysis kinetics rate expres-sions have been derived and are summarised in Table 1.
Steady state model development – hydrolysis kinetics
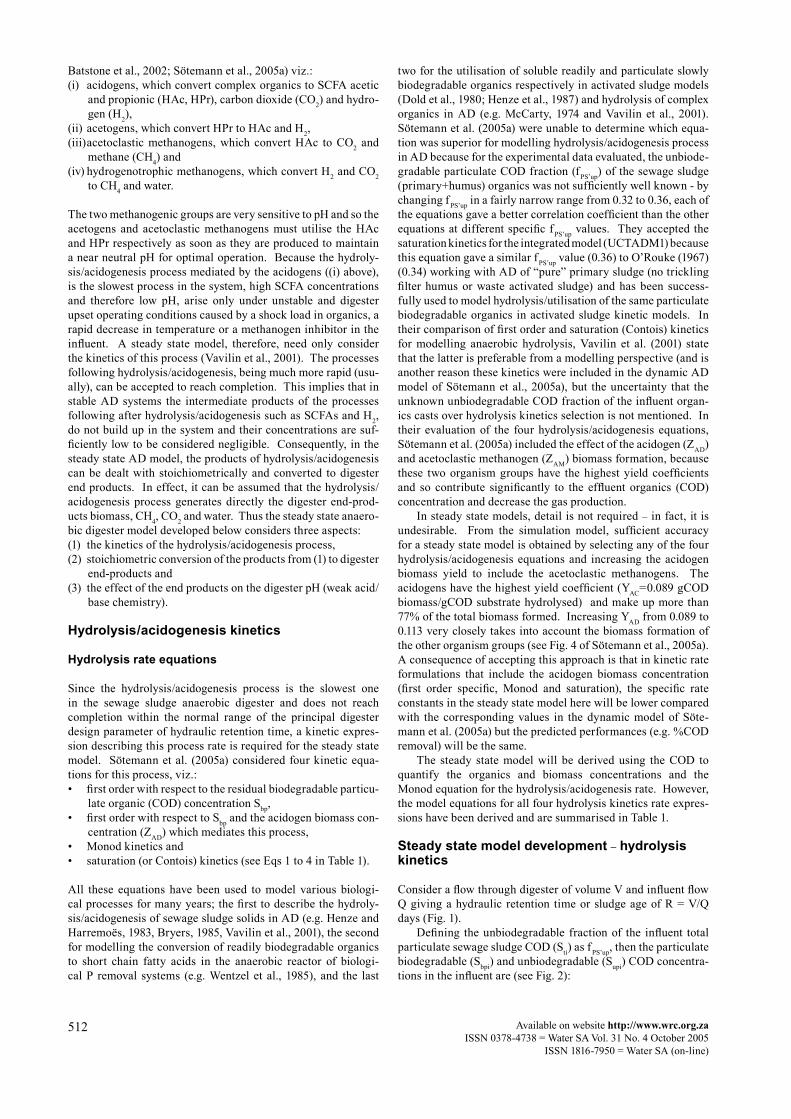
Consider a flow through digester of volume V and influent flow Q giving a hydraulic retention time or sludge age of R = V/Q days (Fig. 1). Defining the unbiodegradable fraction of the influent total particulate sewage sludge COD (Sti) as fPS’up, then the particulate biodegradable (Sbpi) and unbiodegradable (Supi) COD concentra-tions in the influent are (see Fig. 2):
Available on website http://www.wrc.org.zaISSN 0378-4738 = Water SA Vol. 31 No. 4 October 2005ISSN 1816-7950 = Water SA (on-line)
513
(5)
(6)
where: Sbsai = Influent volatile fatty acid (VFA) concentration (mgCOD/ℓ)
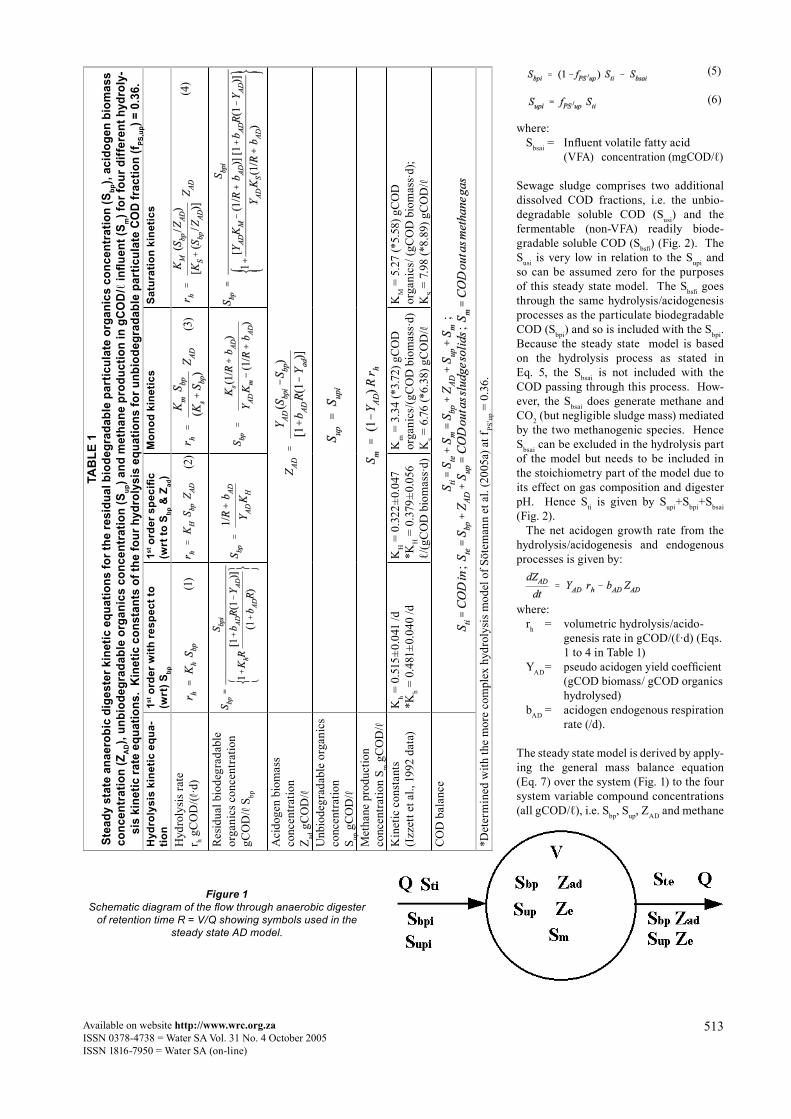
Sewage sludge comprises two additional dissolved COD fractions, i.e. the unbio-degradable soluble COD (Susi) and the fermentable (non-VFA) readily biode-gradable soluble COD (Sbsfi) (Fig. 2). The Susi is very low in relation to the Supi and so can be assumed zero for the purposes of this steady state model. The Sbsfi goes through the same hydrolysis/acidogenesis processes as the particulate biodegradable COD (Sbpi) and so is included with the Sbpi. Because the steady state model is based on the hydrolysis process as stated in Eq. 5, the Sbsai is not included with the COD passing through this process. How-ever, the Sbsai does generate methane and CO2 (but negligible sludge mass) mediated by the two methanogenic species. Hence Sbsai can be excluded in the hydrolysis part of the model but needs to be included in the stoichiometry part of the model due to its effect on gas composition and digester pH. Hence Sti is given by Supi+Sbpi+Sbsai (Fig. 2). The net acidogen growth rate from the hydrolysis/acidogenesis and endogenous processes is given by:
where: rh = volumetric hydrolysis/acido- genesis rate in gCOD/(ℓ·d) (Eqs. 1 to 4 in Table 1) YAD = pseudo acidogen yield coefficient (gCOD biomass/ gCOD organics hydrolysed) bAD = acidogen endogenous respiration rate (/d).
The steady state model is derived by apply-ing the general mass balance equation (Eq. 7) over the system (Fig. 1) to the four system variable compound concentrations (all gCOD/ℓ), i.e. Sbp, Sup, ZAD and methane
TAB
LE 1
Stea
dy s
tate
ana
erob
ic d
iges
ter k
inet
ic e
quat
ions
for t
he re
sidu
al b
iode
grad
able
par
ticul
ate
orga
nics
con
cent
ratio
n (S
bp),
acid
ogen
bio
mas
s co
ncen
trat
ion
(ZA
D),
unbi
odeg
rada
ble
orga
nics
con
cent
ratio
n (S
up) a
nd m
etha
ne p
rodu
ctio
n in
gCO
D/ℓ
influ
ent (
S m) f
or fo
ur d
iffer
ent h
ydro
ly-
sis
kine
tic ra
te e
quat
ions
. K
inet
ic c
onst
ants
of t
he fo
ur h
ydro
lysi
s eq
uatio
ns fo
r unb
iode
grad
able
par
ticul
ate
COD
frac
tion
(f PS,u
p) =
0.36
.H
ydro
lysi
s ki
netic
equ
a-tio
n1st
ord
er w
ith re
spec
t to
(wrt
) Sbp
1st o
rder
spe
cific
(w
rt to
Sbp
& Z
ad)
Mon
od k
inet
ics
Satu
ratio
n ki
netic
s
Hyd
roly
sis r
ate
r h gC
OD
/(·d
)
Res
idua
l bio
degr
adab
le
orga
nics
con
cent
ratio
ngC
OD
/ S bp
Aci
doge
n bi
omas
sco
ncen
trat
ion
Z ad g
CO
D/
Unb
iode
grad
able
org
anic
s co
ncen
trat
ion
S up g
CO
D/
Met
hane
pro
duct
ion
co
ncen
trat
ion
S m g
CO
D/
Kin
etic
con
stan
ts(I
zzet
t et a
l., 1
992
data
)K
h = 0
.515
±0.0
41 /d
*Kh =
0.4
81±0
.040
/dK
H =
0.3
22±0
.047
*K
H =
0.3
79±0
.056
ℓ/
(gC
OD
bio
mas
s·d)
Km =
3.3
4 (*
3.72
) gC
OD
or
gani
cs/(g
CO
D b
iom
ass·
d)K
s = 6
.76
(*6.
38) g
CO
D/
KM
= 5
.27
(*5.
58) g
CO
D
orga
nics
/ (gC
OD
bio
mas
s·d)
;K
S = 7
.98
(*8.
89) g
CO
D/
CO
D b
alan
ce
*Det
erm
ined
with
the
mor
e co
mpl
ex h
ydro
lysi
s mod
el o
f Söt
eman
n et
al.
(200
5a) a
t fPS
’up =
0.3
6.
.....
...1
(1)
(2)
(3)
....4
(4)
;;
;
Figure 1Schematic diagram of the flow through anaerobic digester
of retention time R = V/Q showing symbols used in the steady state AD model.
5
6
514 Available on website http://www.wrc.org.zaISSN 0378-4738 = Water SA Vol. 31 No. 4 October 2005
ISSN 1816-7950 = Water SA (on-line)
(Sm) concentrations. For the flow through system, the effluent compound concentrations are equal to the reactor concentra-tions. For example, the mass balance for Sbp over a time interval dt is:
(7)
(8)
In Eq. 8, the first and second terms on the right hand side are the biodegradable organics flowing in and out of the digester, and the third and fourth terms the decrease in biodegradable organ-ics due to hydrolysis and the increase from the biodegradable part of the acidogen biomass that dies. Dividing Eq. 8 through by Vdt yields:
(9)
Similarly the mass balance on acidogen biomass concentration (ZAD) yields:
Again dividing through by Vdt yields:
(10)
At steady state the transient dZAD/dt in Eq. 10 = 0 and solving for the hydrolysis rate rh yields:
(11)
Setting Eq. 9 = 0 for steady state and solving for rh yields:
(12)
Then substituting Eq. 11 for rh into Eq. 12 and solving for ZAD yields:
(13)
Equation 13 seems to indicate that the acidogen biomass concen-
tration (ZAD) is independent of the hydrolysis kinetic rate (and hence its formulation) because rh does not appear in it. However, it is implicitly dependent on rh because Sbp appears in the equa-tion and Sbp is dependent on the hydrolysis kinetic rate. Equation 13 does show that once Sbp is known, then ZAD can be calculated for any hydrolysis rate equation. Substituting the Monod equation (Eq. 3 in Table 1) for rh into Eq. 11 and solving for Sbp yields:
(14)
Ignoring as negligible the formation of unbiodegradable organ-ics from the acidogens that die (i.e. endogenous residue is zero), the total unbiodegradable organics concentration in the effluent (Sup) is equal to the influent, i.e.
(15)
The methane production in COD units is directly related to the rate of hydrolysis of biodegradable organics. If the methane concentration in the effluent in COD units is Sm, a mass balance on Sm yields:
(16)
where: Sm = methane concentration in the effluent in gCOD/ℓ (if it were dissolved)
Dividing Eq. 16 through by Vdt and setting dSm/dt = 0 and solving for Sm yields:
(17)
Because methane has a COD 64 gCOD/mol and a gas volume at ambient temperature 20oC of 22.4 (293/273) = 24.0 ℓ/mole, the methane gas production Qm is:
(18)
The partial pressure of CO2 in the gas (pCO2) and the CO2 com-position of the gas are numerically equal. Hence, if the par-tial pressure of CO2 or the CO2 gas composition are known (in atmospheres, or volume or mole fractions), then the total gas production at 20oC (Qgas) is:
(19)
A COD mass balance over the digester system (Fig. 1) yields:
(20)
Equation 20 shows that COD exits the digester only as sludge mass in the effluent (Ste) and as methane gas (Sm). Substituting Eq. 13 with Sbp as its subject for Sbp, Eq. 15 for Sup, Eq. 17 for Sm and Eq. 3 for rh into Eq. 20 yields:
Figure 2 Influent primary sludge COD fractionation for the steady state
anaerobic digestion model
7
8
gCOD/(�.d) 9
10
gCOD/(�.d) 11
gCOD/(�.d) 12
gCOD/� 13
gCOD/� 13
gCOD/� 14
gCOD/� 15
16
gCOD/� 17
(� methane/d) /(� influent flow/d) 18
(� methane/d) /(� influent flow/d) 18
(� gas/d)/(� influent flow/d) 19
20
(� gas/d)/(� influent flow/d) 19
Available on website http://www.wrc.org.zaISSN 0378-4738 = Water SA Vol. 31 No. 4 October 2005ISSN 1816-7950 = Water SA (on-line)
515
which on simplifying gives Eq. 14 for Sbp, and therefore proves the input and output COD masses balance exactly. The total (Str) and biodegradable (Sbpr) COD removals and methane production (Sm) are given by: (21)
(22)
The equations for the biodegradable organics (Sbp), acidogen (ZAD), unbiodegradable (Sup) and methane (Sm) concentrations for all four hydrolysis rate formulations are given in Table 1.
Calibration of hydrolysis kinetics
The equations developed above were evaluated and calibrated against data from steady state anaerobic digesters.
Calculating the effluent COD concentration (Ste)
From the steady state COD mass balance equation (Eq. 20), the effluent total particulate COD concentration, Ste is given by:
(23)
Substituting Eq. 15 for Sup, Eq. 6 for Supi and Eq. 13 for ZAD in Eq. 23 yields:
(24)
Solving Eq. 24 for Sbp yields:
(25a)
(25b)
With Ste and Sti known from measurement, Eq. 25 defines Sbp in terms of the unbiodegradable fraction of the primary sludge (fPS’up), the retention time of the digester (R) and the acidogen constants (YAD, bAD). By estimating an unbiodegradable frac-tion of the primary sludge (fPS’up) and selecting acidogen biomass constants (i.e. YAD = 0.113 gCOD biomass/ gCOD organics, bAD = 0.041 /d), Sbp can be calculated with Eq. 25 from experimen-tal data. The yield coefficient of the acidogens (YAD) has been increased from 0.089 to 0.113 to take account of the acetoclastic methanogen biomass that grows in the system. Because aci-dogenesis produces 61% acetic acid (and 39% hydrogen), 61% of the acetoclastic methanogen yield coefficient (YAM = 0.040) was added to YAD. This simplification is acceptable because the endogenous respiration rate is closely the same for these two organism groups (bAD = 0.041 /d and bAM = 0.037 /d). However, as noted above this simplification does influence the values of the constants in the hydrolysis rate equations. The hydrogeno-trophic methanogen yield (YHM) is low enough (0.01 gCODbio-mass/gCOD H2) to be ignored.
Estimating the unbiodegradable COD fraction of primary sludge
For wastewater treatment plant design, the primary sludge (PS) unbiodegradable COD fraction (fPS,up) is entirely dependent on the unbiodegradable particulate COD fractions (fS’up) selected for the raw and settled wastewaters and the fraction of COD removed by primary sedimentation (fpsr). From a COD mass bal-
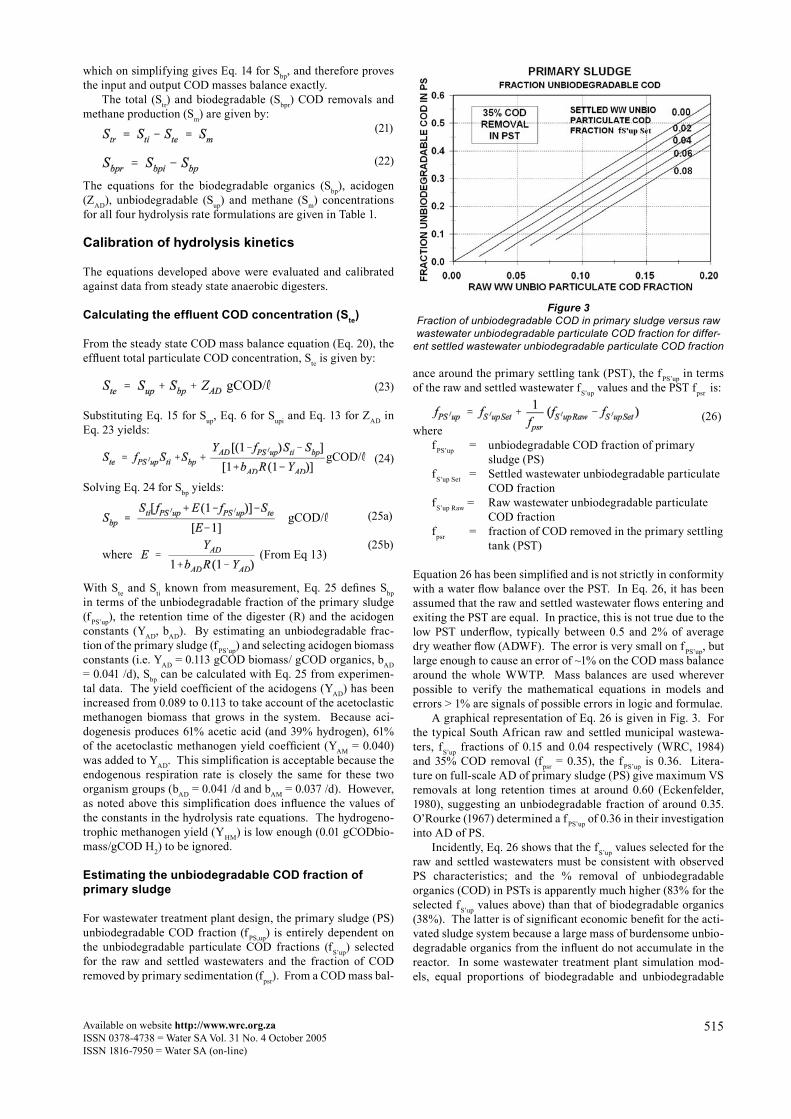
ance around the primary settling tank (PST), the fPS’up in terms of the raw and settled wastewater fS’up values and the PST fpsr is:
(26)where fPS’up = unbiodegradable COD fraction of primary sludge (PS) fS’up Set = Settled wastewater unbiodegradable particulate COD fraction fS’up Raw = Raw wastewater unbiodegradable particulate COD fraction fpsr = fraction of COD removed in the primary settling tank (PST)
Equation 26 has been simplified and is not strictly in conformity with a water flow balance over the PST. In Eq. 26, it has been assumed that the raw and settled wastewater flows entering and exiting the PST are equal. In practice, this is not true due to the low PST underflow, typically between 0.5 and 2% of average dry weather flow (ADWF). The error is very small on fPS’up, but large enough to cause an error of ~1% on the COD mass balance around the whole WWTP. Mass balances are used wherever possible to verify the mathematical equations in models and errors > 1% are signals of possible errors in logic and formulae. A graphical representation of Eq. 26 is given in Fig. 3. For the typical South African raw and settled municipal wastewa-ters, fS’up fractions of 0.15 and 0.04 respectively (WRC, 1984) and 35% COD removal (fpsr = 0.35), the fPS’up is 0.36. Litera-ture on full-scale AD of primary sludge (PS) give maximum VS removals at long retention times at around 0.60 (Eckenfelder, 1980), suggesting an unbiodegradable fraction of around 0.35. O’Rourke (1967) determined a fPS’up of 0.36 in their investigation into AD of PS. Incidently, Eq. 26 shows that the fS’up values selected for the raw and settled wastewaters must be consistent with observed PS characteristics; and the % removal of unbiodegradable organics (COD) in PSTs is apparently much higher (83% for the selected fS’up values above) than that of biodegradable organics (38%). The latter is of significant economic benefit for the acti-vated sludge system because a large mass of burdensome unbio-degradable organics from the influent do not accumulate in the reactor. In some wastewater treatment plant simulation mod-els, equal proportions of biodegradable and unbiodegradable
21
22
Figure 3Fraction of unbiodegradable COD in primary sludge versus raw wastewater unbiodegradable particulate COD fraction for differ-
ent settled wastewater unbiodegradable particulate COD fraction
gCOD/� 23
gCOD/� 24
gCOD/� 25a
where (From Eq 13) 25b
26
516 Available on website http://www.wrc.org.zaISSN 0378-4738 = Water SA Vol. 31 No. 4 October 2005
ISSN 1816-7950 = Water SA (on-line)
particulate organics are removed in the PST. This leads to set-tled wastewater and PS characteristics that deviate significantly from observed values, e.g. if equal proportions of the raw waste-water biodegradable and unbiodegradable particulate COD are
TABLE 2Experimental data measured by Izzett et al. (1992) on 14 ℓ
completely mixed mesophilic (37oC) anaerobic digesters at 7 to 20 d retention time fed a mixture of primary and humus (trickling filter)
sludge from the Potsdam wastewater treatment plant (Milnerton, Cape, South Africa)
Retention time (d) 7 10 12 15 20Influent flow ℓ/d 2.00 1.40 1.17 0.93 0.70 Influent COD gCOD/ℓ 43.286 40.721 39.222 42.367 42.595 Influent VFA mgCOD/ℓ 1871 1961 2872 1824 2249 Influent TKN mgN/ℓ 1105 1100 1028 1075 1171 Influent FSA mgN/ℓ 196 203 235 221 244 Influent Alk mg/ℓ as CaCO3 80 81 90 82 56 Influent pH 5.34 5.34 5.20 5.42 5.28 Effluent COD gCOD/ℓ 23.637 20.521 18.678 19.969 19.005 Effluent VFA mgCOD/ℓ 50 28 28 27 23 Effluent TKN mgN/ℓ 1041 1039 992 976 1157 Effluent FSA mgN/ℓ 511 404 430 404 511 Effluent Alk mg/ℓ as CaCO3 1882 1951 2072 1994 2066 Gas composition %CH4 63.2 62.1 63.3 63.6 63.3 COD removal 19.649 20.200 20.544 22.398 23.590 Gas prod ℓ gas/ℓ influent 13.97 14.33 14.27 15.01 15.79 Gas Composition %CO2 36.8 37.9 36.7 36.4 36.7 FSA released mgN/ℓ 315 201 195 183 267 Measured digester pH 7.12 7.11 7.19 7.14 7.15 “Corrected” digester pH 6.84 6.84 6.88 6.86 6.87COD balance (%) 108.4 108.6 109.1 106.9 107.3Nitrogen balance (%) 94.2 94.5 96.5 90.8 98.8Carbon balance (%)* 99.0 100.0 99.5 101.3 101.4*Based on a sludge composition of C3.5H7O2N0.196 calculated from the influent COD and N masses and effluent C mass in the gas and liquid streams.
TABLE 3Izzett et al. (1992) 7 to 20 d retention time (R) anaerobic digester measured influent* (Sti) and effluent* (Ste) COD
concentrations, influent unbiodegradable (Supi) and biodegradable COD (Sbpi) concentrations for an unbiodegrada-ble COD fraction (fPS’up) of 0.36, calculated residual biodegradable COD concentration (Sbp) (Eq. 25), change in bio-degradable concentration across digester (∆Sbp), observed hydrolysis rate (rh = ∆Sbp/R+bADZAD, Eq. 12), acidogen
biomass concentration (ZAD), specific hydrolysis rate [rh/ZAD)] and the 1st order and 1st order specific hydrolysis rate constants (Kh and KH). All mass units in gCOD.
R *Sti *Ste Supi Sbpi Sbp ∆Sbp rh ZAD rh/ZAD Kh KH
d g/ℓ g/ℓ g/ℓ g/ℓ g/ℓ g/ℓ g/(ℓ·d) g/ℓ gCOD Sbp/(gCOD ZAD·d)
/d ℓ/(gCOD ZAD·d)
7 43.286 23.637 15.583 25.832 6.240 19.59 2.871 1.765 1.586 0.460 0.26110 40.721 20.521 14.660 24.100 4.142 19.96 2.064 1.654 1.207 0.498 0.30112 39.222 18.678 14.120 22.230 3.018 19.21 1.663 1.511 1.059 0.551 0.36515 42.367 19.969 15.252 25.291 3.065 22.23 1.548 1.625 0.912 0.505 0.31120 42.595 19.005 15.334 25.012 2.151 22.86 1.204 1.495 0.764 0.560 0.374
Mean** 0.515 0.322* Measured total unfiltered COD. The VFA concentration was subtracted from this in conformity with Eq. 5 when calculating the ZAD because this concentration is already hydrolysed and produces negligible biomass in the digester. The unbiodegradable soluble COD concentration was assumed zero. The fermentable (non-VFA) soluble COD (Fig. 2) was included in the Sbpi (in conformity with Eq. 5) because these organics pass through the hydrolysis process like the Sbpi. The unbiodegradable COD concentration (Supi) of the sludge was calculated from the influent total unfiltered COD as listed and therefore included the soluble COD. This was done to approximate the unbiodegradable COD concentration of the “pristine” sewage sludge before any acidogenesis commenced. This is approximate because hydrogen is generated and lost in the acidogenesis that takes place in the sludge before feeding to the digester. ** Mean of all five retention time values.
removed and the %COD removal remains at 35%, then the set-tled wastewater fS’up would have to be 0.12 and fPS’up = 0.20. Both these values are considerably different than those observed.
Calculating the constants in the hydrolysis kinetic equations – Izzett et al. (1992) results
Izzett et al. (1992) operated two laboratory-scale mesophilic (37oC) anaerobic digest-ers fed a mixture of primary and humus (trickling filter) sludge from the Potsdam wastewater treatment plant (Milnerton, Cape, South Africa) at 7, 10, 12, 15 and 20 d reten-tion time. The steady state experimental results measured on the systems are listed in Table 2. Accepting fPS’up = 0.36 from Sötemann et al. (2005a) for the Izzett data, the calculated Sbp concentrations from Eq. 25 are listed in Table 3. With Sbp known, ZAD and ∆ Sbp (= Sbpi- Sbp) can be calculated from the meas-ured results (Table 3). Because the hydroly-sis process does not reach completion in the digester, the observed hydrolysis rate rh is given by Eq. 12 and the calculated values are listed in Table 3. With the hydrolysis rate known, the kinetic constants in the various hydrolysis rate equations can be calculated, i.e. for the first order rate with respect to Sbp only (Eq. 1), Kh = rh/Sbp (/d) and for the first order specific rate with respect to Sbp and ZAD (Eq. 2), KH = rh/(SbpZAD) [ℓ/(gCOD biomass·d)]. The calculated Kh and KH rates for the different retention times are listed in Table 3 and plotted versus R in Fig. 4. For a hydroly-sis rate equation to be reasonably general, it should take into account the major factors that influence the rate. If it achieves this, then the
Available on website http://www.wrc.org.zaISSN 0378-4738 = Water SA Vol. 31 No. 4 October 2005ISSN 1816-7950 = Water SA (on-line)
517
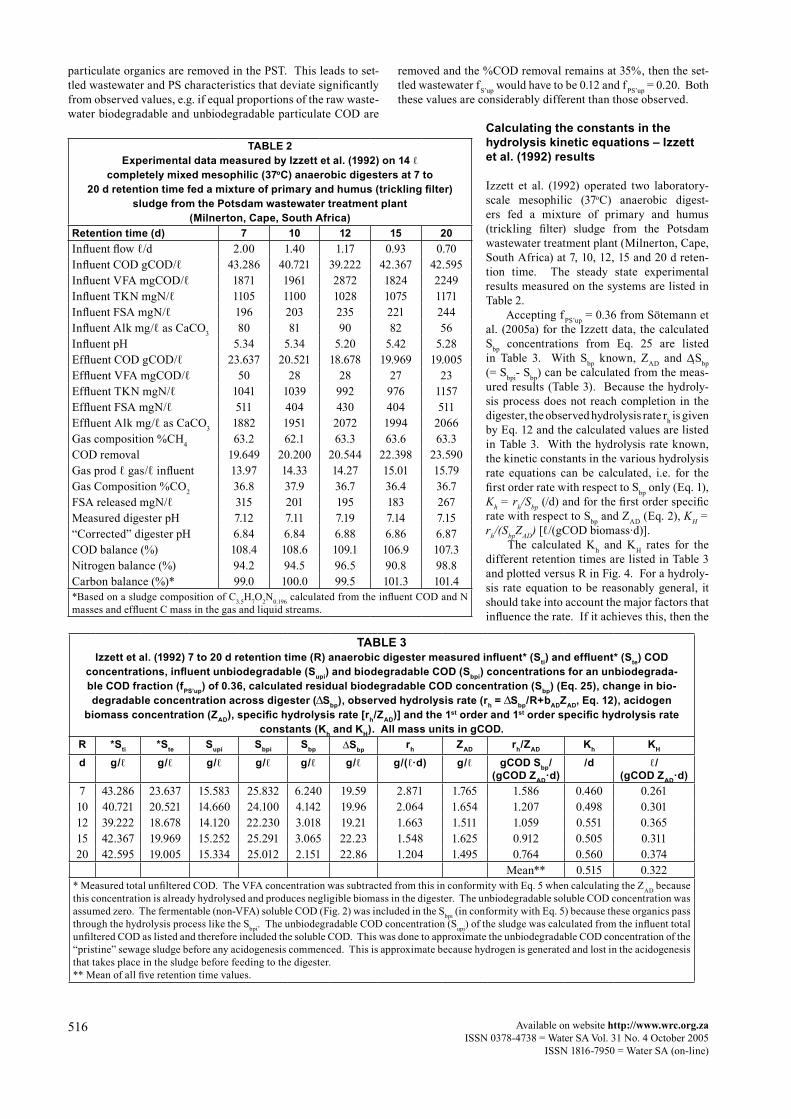
K constants in the rate equation will not change with the prin-cipal design parameters, in this case, hydraulic retention time (or sludge age). For the first order and the first order specific hydrolysis rate equations (Eqs. 1 and 2 in Table 1), it can be seen that this would not appear to be the case (Fig. 4) – both Kh and KH increase with increasing retention time. The average Kh and KH rates over the five retention times are 0.515 /d and 0.322 ℓ/(gCOD biomass·d) respectively (Table 3, see also Table 1). Although these rate equations do not appear to be sufficiently general to describe the change in hydrolysis rate with retention time, the difference in predicted %COD removal based on the average Kh and KH rates compared with experimental results is very small. Determination of the K constants in the Monod and satu-ration kinetic rate equations require linearisation of these rate equations and linear regression over the retention time range of the experimental results, as described by Sötemann et al. (2005a). For the Monod equation, the hydrolysis rate rh is given by Eq. 3 in Table 1, where rh, Sbp and ZAD are calculated from experimental data (Table 3). The linearisation can be done by three methods, viz. (i) Lineweaver-Burke, (ii) inversion and (iii) Eadie-Hofstee, each giving different K values, because each
method emphasises different aspects of the Monod equation. The specific hydrolysis rate (rh /ZAD) versus Sbp graphs obtained for the Monod rate equation with constants derived from the three linearisation methods (listed in Table 4) are shown in Fig. 5, together with the Izzett experimental data. Although method (i) gives the best fit with the data (highest correlation coefficient R2 = 0.948), method (ii) gives margin-ally the best fit at the short retention time (7d). Linearisa-tion method (iii) showed that the 15d retention time data is an outlier and is the reason for the low R2 value (0.688) for all five retention time data. Excluding the 15d data significantly improved the R2 value for method (iii) (0.888). The average Km and Ks values obtained from the three methods, with the 15d retention time data excluded for method (iii), are given in Table 4 (see also Table 1). Figure 5 shows that even though different K values are obtained with the three different meth-ods, the specific hydrolysis rate (rh/ZAD) versus biodegradable COD concentration (Sbp) curves obtained from each and the average are virtually the same and plot very closely to one another.
Figure 4Hydrolysis rate constants for the 1st order (Kh, /d) and 1st order specific [KH, ℓ/(gCOD biomass·d)] hydrolysis kinetic rate equa-tions versus retention time for the Izzett et al. (1992) anaerobic
digester data set
TABLE 4Monod and saturation kinetics K constants and correlation coefficients (R2) for the anaerobic digester data of Izzett et al. (1992) obtained from Lineweaver-Burke (M1), inversion (M2) and
Eadie-Hofstee (M3) linearisation and regression methods, for the Eadie-Hofstee (M3) method with-out the 15 d retention time data (M3S), and the averages of the M1, M2 and M3 and the
M1, M2, and M3S methods for unbiodegradable fraction (fPS’up) of 0.36.
Kinetic rate Monod kinetics Saturation kineticsLinearisation method Km Ks R2 KM KS R2
Units. All mass units in COD
g organics/(g biomass·d)
g organics/ℓ - g organics/(g biomass·d)
g organics/g biomass
-
Method 1 (M1) 3.33 6.81 0.948 5.44 8.35 0.979Method 2 (M2) 3.55 7.49 0.876 5.61 8.69 0.823Method 3 (M3) 2.94 5.55 0.688 4.46 6.44 0.699Method 3S (M3S) 3.14 5.98 0.888 4.77 6.91 0.897Average M1, M2, M3 3.27 6.62 - 5.17 7.82 -Average M1, M2, M3S 3.34 6.76 - 5.27 7.98 -
Figure 5Specific hydrolysis rate [rh /Zad, gCOD organics/(g COD biomass ·d)] versus residual biodegradable organics concentration (Sbp, gCOD/ℓ) calculated for Monod hydrolysis kinetic rate equation with constants determined from the Lineweaver-Burke (M1),
inversion (M2) and Eadie-Hofstee (M3) linearisation and regres-sion methods for the Izzett et al (1992) anaerobic digester data from 7 to 20 d retention time; experimental data () also shown.
518 Available on website http://www.wrc.org.zaISSN 0378-4738 = Water SA Vol. 31 No. 4 October 2005
ISSN 1816-7950 = Water SA (on-line)
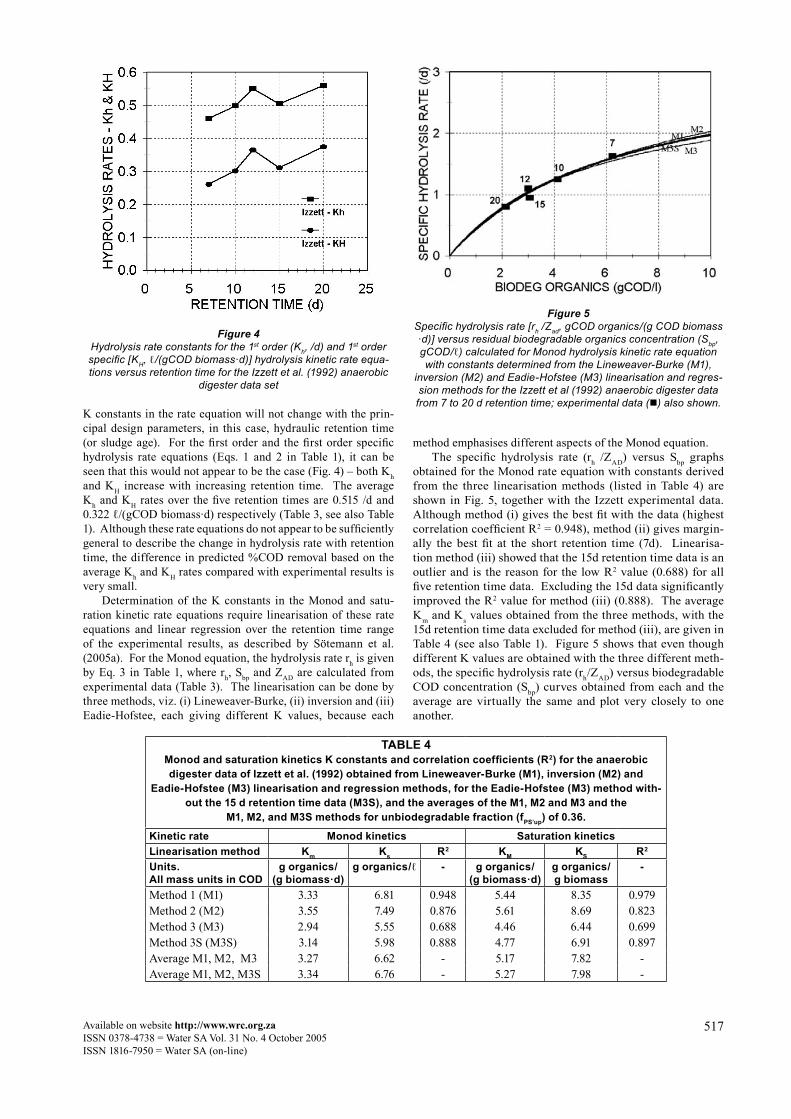
The KM and KS values for the saturation hydrolysis rate equation (Eq. 4 in Table 1) are found by the same linearisation methods, the only difference being that for saturation kinetics, the concentration variable is Sbp/ZAD instead of Sbp. The KM and KS values so obtained are listed in Table 4. The specific hydrolysis rate, rh/ZAD (gCOD organics/ gCOD biomass·d) ver-sus the saturation ratio Sbp/ZAD (gCOD organics/ gCD biomass) graphs obtained for the saturation rate equation from the three linearisation methods are shown in Fig. 6 with the Izzett experi-mental data. As with the Monod kinetics, although method (i) gives the highest R2 (0.979), method (ii) fits the experimental data marginally best at the shortest retention time (7 d). For saturation kinetics also, linearisation method (iii) showed that the 15 d retention time data is an outlier and is the reason for the low R2 value (0.699) for all five retention time data. Excluding the 15 d data significantly improved the R2 value for method (iii) (0.897). The average KM and KS values obtained from the three methods, with the 15 d retention time data excluded for method (iii), are given in Table 4. As with the Monod equations, Fig. 6 shows that even though different K values are obtained with the three different methods, the specific hydrolysis rate (rh/ZAD) versus saturation ratio (Sbp/ZAD) curves obtained from each and the average are virtually the same and plot very closely to one another. Moreover, each of the four different hydrolysis kinetics equations yield near identical specific hydrolysis rate (rh/ZAD) versus biodegradable COD acidogen biomass concen-tration ratio (Sbp/ZAD) curves. The unbiodegradable fraction of sludge (fPS’up) influences the calibration results of the different hydrolysis/acidogenesis rate equations. For their more complex approach, Sötemann et al. (2005a) found the lowest coefficient of variation (Cvar, standard deviation/mean) for the first order (Cvar = 0.017) and first order specific (Cvar = 0.049) hydrolysis equations at fPS’up = 0.34 and 0.32 respectively and the highest correlation coefficient (R2) for the Monod (R2=0.98) and saturation (R2=0.99) equations at fPS’up = 0.36. For this simpler steady state model the results are virtually the same. For the first order and first order specific hydrolysis equations, the lowest coefficient of variation (Cvar) is
at fPS’up = 0.34 (Cvar = 0.040) and 0.32 (Cvar = 0.074) respectively (Fig. 7a) and the highest correlation coefficient (R2) for the Monod (R2=0.945) and saturation (R2=0.972) equations at fPS’up = 0.37 (Fig. 7b). It is clear that the steady state model gives almost the same results as the more complex hydrolysis model derived for UCTADM1. Even though this simpler steady state model yields different K values to the more complex model for reasons describe above, the specific hydrolysis rate (rh/ZAD) versus biodegradable COD concentration (Sbp) curves obtained from the model are virtually the same as for the more complex model, and similarly for the saturation kinetics. With the hydrolysis rate kinetic constants determined from the Izzett et al. experimental results for the four different kinetic hydrolysis rate equations, plots of the %COD removal (i.e. %COD converted to methane, Eq. 21) versus retention time (R) calculated from the four hydrolysis rate equations are shown in Fig. 8. It is clear that the different rate equations give virtually identical results at long retention times (>10 d), but that critical differences between them arise at short retention times (<10 d).
Figure 6Specific hydrolysis rate [rh /Zad, gCOD organics/(g COD biomass ·d)] versus residual biodegradable organics to acidogen biomass concentration ratio (Sbp /Zad , gCOD/gCOD) calculated for satura-
tion hydrolysis kinetic rate equation with constants determined from the Lineweaver-Burke (M1), inversion (M2) and Eadie-Hof-stee (M3) linearisation and regression methods for the Izzett et al (1992) anaerobic digester data from 7 to 20 d retention time;
experimental data () also shown.
Figure 7bRegression correlation coefficient (R2) versus unbiodegradable COD fraction of the primary sludge (fPS’up) for the Lineweaver-Burke (M1), inversion (M2) and Eadie-Hofstee linearisation
methods, with (M3) and without (M3S) the 15 d retention time data, with the Monod hydrolysis rate equation for the Izzett et al.
digester data set.
Figure 7aCoefficient of variation versus unbiodegradable COD fraction of the primary sludge (fPS’up) for the 1st order and 1st order specific
hydrolysis equations for the Izzett et al. digester data set.
Available on website http://www.wrc.org.zaISSN 0378-4738 = Water SA Vol. 31 No. 4 October 2005ISSN 1816-7950 = Water SA (on-line)
519
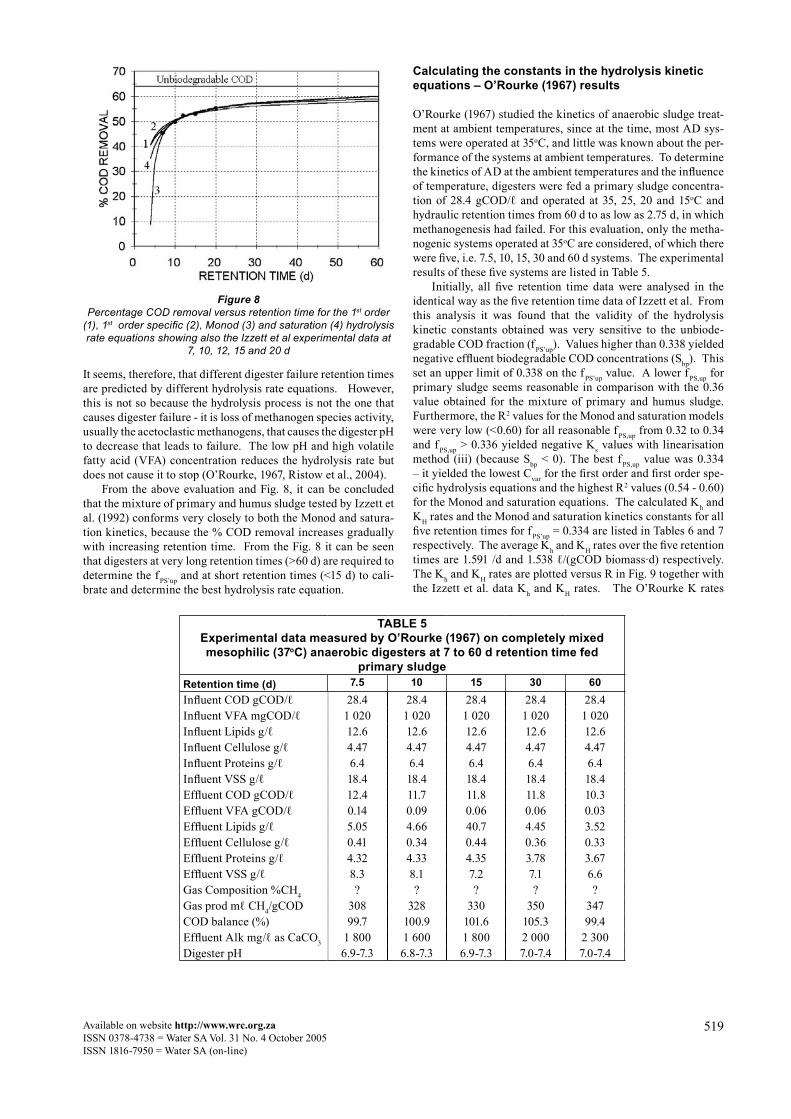
It seems, therefore, that different digester failure retention times are predicted by different hydrolysis rate equations. However, this is not so because the hydrolysis process is not the one that causes digester failure - it is loss of methanogen species activity, usually the acetoclastic methanogens, that causes the digester pH to decrease that leads to failure. The low pH and high volatile fatty acid (VFA) concentration reduces the hydrolysis rate but does not cause it to stop (O’Rourke, 1967, Ristow et al., 2004). From the above evaluation and Fig. 8, it can be concluded that the mixture of primary and humus sludge tested by Izzett et al. (1992) conforms very closely to both the Monod and satura-tion kinetics, because the % COD removal increases gradually with increasing retention time. From the Fig. 8 it can be seen that digesters at very long retention times (>60 d) are required to determine the fPS’up and at short retention times (<15 d) to cali-brate and determine the best hydrolysis rate equation.
Calculating the constants in the hydrolysis kinetic equations – O’Rourke (1967) results
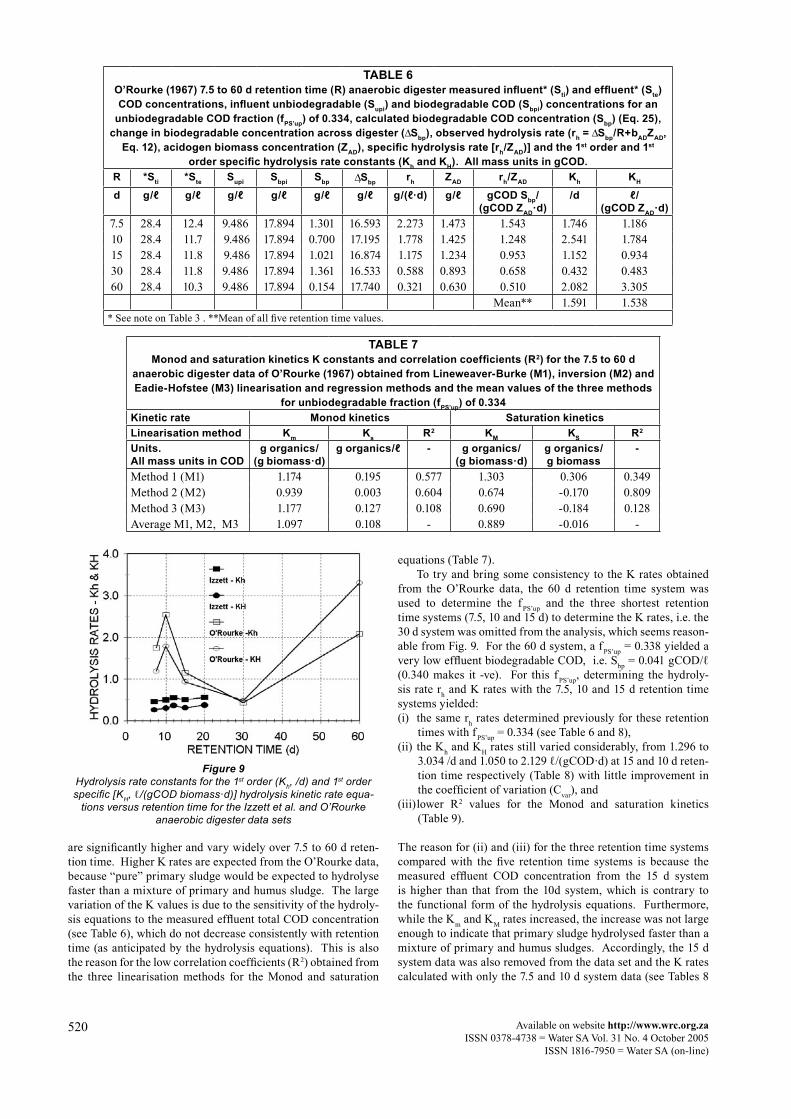
O’Rourke (1967) studied the kinetics of anaerobic sludge treat-ment at ambient temperatures, since at the time, most AD sys-tems were operated at 35oC, and little was known about the per-formance of the systems at ambient temperatures. To determine the kinetics of AD at the ambient temperatures and the influence of temperature, digesters were fed a primary sludge concentra-tion of 28.4 gCOD/ℓ and operated at 35, 25, 20 and 15oC and hydraulic retention times from 60 d to as low as 2.75 d, in which methanogenesis had failed. For this evaluation, only the metha-nogenic systems operated at 35oC are considered, of which there were five, i.e. 7.5, 10, 15, 30 and 60 d systems. The experimental results of these five systems are listed in Table 5. Initially, all five retention time data were analysed in the identical way as the five retention time data of Izzett et al. From this analysis it was found that the validity of the hydrolysis kinetic constants obtained was very sensitive to the unbiode-gradable COD fraction (fPS’up). Values higher than 0.338 yielded negative effluent biodegradable COD concentrations (Sbp). This set an upper limit of 0.338 on the fPS’up value. A lower fPS,up for primary sludge seems reasonable in comparison with the 0.36 value obtained for the mixture of primary and humus sludge. Furthermore, the R2 values for the Monod and saturation models were very low (<0.60) for all reasonable fPS,up from 0.32 to 0.34 and fPS,up > 0.336 yielded negative Ks values with linearisation method (iii) (because Sbp < 0). The best fPS,up value was 0.334 – it yielded the lowest Cvar for the first order and first order spe-cific hydrolysis equations and the highest R2 values (0.54 - 0.60) for the Monod and saturation equations. The calculated Kh and KH rates and the Monod and saturation kinetics constants for all five retention times for fPS’up = 0.334 are listed in Tables 6 and 7 respectively. The average Kh and KH rates over the five retention times are 1.591 /d and 1.538 ℓ/(gCOD biomass·d) respectively. The Kh and KH rates are plotted versus R in Fig. 9 together with the Izzett et al. data Kh and KH rates. The O’Rourke K rates
Figure 8Percentage COD removal versus retention time for the 1st order
(1), 1st order specific (2), Monod (3) and saturation (4) hydrolysis rate equations showing also the Izzett et al experimental data at
7, 10, 12, 15 and 20 d
TABLE 5Experimental data measured by O’Rourke (1967) on completely mixed mesophilic (37oC) anaerobic digesters at 7 to 60 d retention time fed
primary sludgeRetention time (d) 7.5 10 15 30 60Influent COD gCOD/ℓ 28.4 28.4 28.4 28.4 28.4Influent VFA mgCOD/ℓ 1 020 1 020 1 020 1 020 1 020 Influent Lipids g/ℓ 12.6 12.6 12.6 12.6 12.6Influent Cellulose g/ℓ 4.47 4.47 4.47 4.47 4.47Influent Proteins g/ℓ 6.4 6.4 6.4 6.4 6.4Influent VSS g/ℓ 18.4 18.4 18.4 18.4 18.4Effluent COD gCOD/ℓ 12.4 11.7 11.8 11.8 10.3Effluent VFA gCOD/ℓ 0.14 0.09 0.06 0.06 0.03Effluent Lipids g/ℓ 5.05 4.66 40.7 4.45 3.52Effluent Cellulose g/ℓ 0.41 0.34 0.44 0.36 0.33Effluent Proteins g/ℓ 4.32 4.33 4.35 3.78 3.67Effluent VSS g/ℓ 8.3 8.1 7.2 7.1 6.6Gas Composition %CH4 ? ? ? ? ?Gas prod mℓ CH4/gCOD 308 328 330 350 347COD balance (%) 99.7 100.9 101.6 105.3 99.4Effluent Alk mg/ℓ as CaCO3 1 800 1 600 1 800 2 000 2 300Digester pH 6.9-7.3 6.8-7.3 6.9-7.3 7.0-7.4 7.0-7.4
520 Available on website http://www.wrc.org.zaISSN 0378-4738 = Water SA Vol. 31 No. 4 October 2005
ISSN 1816-7950 = Water SA (on-line)
equations (Table 7). To try and bring some consistency to the K rates obtained from the O’Rourke data, the 60 d retention time system was used to determine the fPS’up and the three shortest retention time systems (7.5, 10 and 15 d) to determine the K rates, i.e. the 30 d system was omitted from the analysis, which seems reason-able from Fig. 9. For the 60 d system, a fPS’up = 0.338 yielded a very low effluent biodegradable COD, i.e. Sbp = 0.041 gCOD/ℓ (0.340 makes it -ve). For this fPS’up, determining the hydroly-sis rate rh and K rates with the 7.5, 10 and 15 d retention time systems yielded: (i) the same rh rates determined previously for these retention
times with fPS’up = 0.334 (see Table 6 and 8), (ii) the Kh and KH rates still varied considerably, from 1.296 to
3.034 /d and 1.050 to 2.129 ℓ/(gCOD·d) at 15 and 10 d reten-tion time respectively (Table 8) with little improvement in the coefficient of variation (Cvar), and
(iii) lower R2 values for the Monod and saturation kinetics (Table 9).
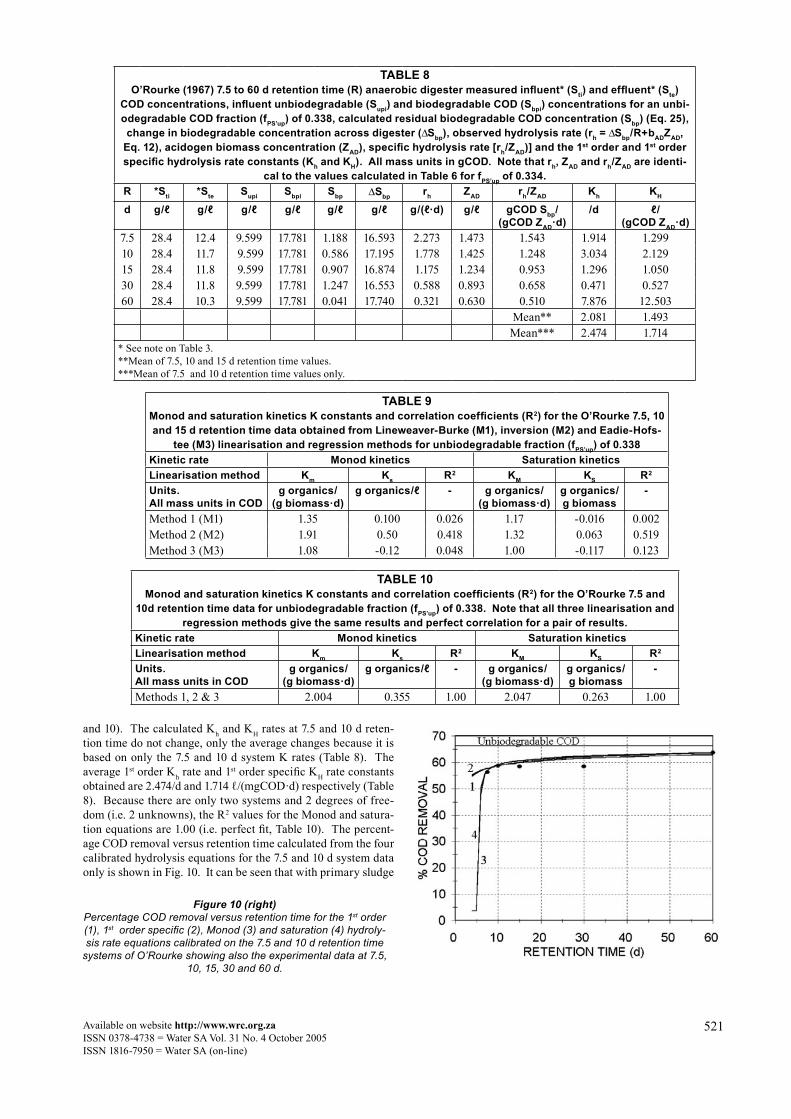
The reason for (ii) and (iii) for the three retention time systems compared with the five retention time systems is because the measured effluent COD concentration from the 15 d system is higher than that from the 10d system, which is contrary to the functional form of the hydrolysis equations. Furthermore, while the Km and KM rates increased, the increase was not large enough to indicate that primary sludge hydrolysed faster than a mixture of primary and humus sludges. Accordingly, the 15 d system data was also removed from the data set and the K rates calculated with only the 7.5 and 10 d system data (see Tables 8
TABLE 6O’Rourke (1967) 7.5 to 60 d retention time (R) anaerobic digester measured influent* (Sti) and effluent* (Ste) COD concentrations, influent unbiodegradable (Supi) and biodegradable COD (Sbpi) concentrations for an
unbiodegradable COD fraction (fPS’up) of 0.334, calculated biodegradable COD concentration (Sbp) (Eq. 25), change in biodegradable concentration across digester (∆Sbp), observed hydrolysis rate (rh = ∆Sbp/R+bADZAD,
Eq. 12), acidogen biomass concentration (ZAD), specific hydrolysis rate [rh/ZAD)] and the 1st order and 1st order specific hydrolysis rate constants (Kh and KH). All mass units in gCOD.
R *Sti *Ste Supi Sbpi Sbp ∆ Sbp rh ZAD rh/ZAD Kh KH
d g/ℓ g/ℓ g/ℓ g/ℓ g/ℓ g/ℓ g/(ℓ·d) g/ℓ gCOD Sbp/(gCOD ZAD·d)
/d ℓ/(gCOD ZAD·d)
7.5 28.4 12.4 9.486 17.894 1.301 16.593 2.273 1.473 1.543 1.746 1.18610 28.4 11.7 9.486 17.894 0.700 17.195 1.778 1.425 1.248 2.541 1.78415 28.4 11.8 9.486 17.894 1.021 16.874 1.175 1.234 0.953 1.152 0.93430 28.4 11.8 9.486 17.894 1.361 16.533 0.588 0.893 0.658 0.432 0.48360 28.4 10.3 9.486 17.894 0.154 17.740 0.321 0.630 0.510 2.082 3.305
Mean** 1.591 1.538* See note on Table 3 . **Mean of all five retention time values.
TABLE 7Monod and saturation kinetics K constants and correlation coefficients (R2) for the 7.5 to 60 d
anaerobic digester data of O’Rourke (1967) obtained from Lineweaver-Burke (M1), inversion (M2) and Eadie-Hofstee (M3) linearisation and regression methods and the mean values of the three methods
for unbiodegradable fraction (fPS’up) of 0.334Kinetic rate Monod kinetics Saturation kineticsLinearisation method Km Ks R2 KM KS R2
Units. All mass units in COD
g organics/(g biomass·d)
g organics/ℓ - g organics/(g biomass·d)
g organics/g biomass
-
Method 1 (M1) 1.174 0.195 0.577 1.303 0.306 0.349Method 2 (M2) 0.939 0.003 0.604 0.674 -0.170 0.809Method 3 (M3) 1.177 0.127 0.108 0.690 -0.184 0.128Average M1, M2, M3 1.097 0.108 - 0.889 -0.016 -
Figure 9Hydrolysis rate constants for the 1st order (Kh, /d) and 1st order specific [KH, ℓ/(gCOD biomass·d)] hydrolysis kinetic rate equa-
tions versus retention time for the Izzett et al. and O’Rourke anaerobic digester data sets
are significantly higher and vary widely over 7.5 to 60 d reten-tion time. Higher K rates are expected from the O’Rourke data, because “pure” primary sludge would be expected to hydrolyse faster than a mixture of primary and humus sludge. The large variation of the K values is due to the sensitivity of the hydroly-sis equations to the measured effluent total COD concentration (see Table 6), which do not decrease consistently with retention time (as anticipated by the hydrolysis equations). This is also the reason for the low correlation coefficients (R2) obtained from the three linearisation methods for the Monod and saturation
Available on website http://www.wrc.org.zaISSN 0378-4738 = Water SA Vol. 31 No. 4 October 2005ISSN 1816-7950 = Water SA (on-line)
521
and 10). The calculated Kh and KH rates at 7.5 and 10 d reten-tion time do not change, only the average changes because it is based on only the 7.5 and 10 d system K rates (Table 8). The average 1st order Kh rate and 1st order specific KH rate constants obtained are 2.474/d and 1.714 ℓ/(mgCOD·d) respectively (Table 8). Because there are only two systems and 2 degrees of free-dom (i.e. 2 unknowns), the R2 values for the Monod and satura-tion equations are 1.00 (i.e. perfect fit, Table 10). The percent-age COD removal versus retention time calculated from the four calibrated hydrolysis equations for the 7.5 and 10 d system data only is shown in Fig. 10. It can be seen that with primary sludge
TABLE 8O’Rourke (1967) 7.5 to 60 d retention time (R) anaerobic digester measured influent* (Sti) and effluent* (Ste)
COD concentrations, influent unbiodegradable (Supi) and biodegradable COD (Sbpi) concentrations for an unbi-odegradable COD fraction (fPS’up) of 0.338, calculated residual biodegradable COD concentration (Sbp) (Eq. 25), change in biodegradable concentration across digester (∆Sbp), observed hydrolysis rate (rh = ∆Sbp/R+bADZAD,
Eq. 12), acidogen biomass concentration (ZAD), specific hydrolysis rate [rh/ZAD)] and the 1st order and 1st order specific hydrolysis rate constants (Kh and KH). All mass units in gCOD. Note that rh, ZAD and rh/ZAD are identi-
cal to the values calculated in Table 6 for fPS’up of 0.334.R *Sti *Ste Supi Sbpi Sbp ∆Sbp rh ZAD rh/ZAD Kh KH
d g/ℓ g/ℓ g/ℓ g/ℓ g/ℓ g/ℓ g/(ℓ·d) g/ℓ gCOD Sbp/(gCOD ZAD·d)
/d ℓ/(gCOD ZAD·d)
7.5 28.4 12.4 9.599 17.781 1.188 16.593 2.273 1.473 1.543 1.914 1.29910 28.4 11.7 9.599 17.781 0.586 17.195 1.778 1.425 1.248 3.034 2.12915 28.4 11.8 9.599 17.781 0.907 16.874 1.175 1.234 0.953 1.296 1.05030 28.4 11.8 9.599 17.781 1.247 16.553 0.588 0.893 0.658 0.471 0.52760 28.4 10.3 9.599 17.781 0.041 17.740 0.321 0.630 0.510 7.876 12.503
Mean** 2.081 1.493Mean*** 2.474 1.714
* See note on Table 3. **Mean of 7.5, 10 and 15 d retention time values. ***Mean of 7.5 and 10 d retention time values only.
TABLE 9Monod and saturation kinetics K constants and correlation coefficients (R2) for the O’Rourke 7.5, 10 and 15 d retention time data obtained from Lineweaver-Burke (M1), inversion (M2) and Eadie-Hofs-
tee (M3) linearisation and regression methods for unbiodegradable fraction (fPS’up) of 0.338Kinetic rate Monod kinetics Saturation kineticsLinearisation method Km Ks R2 KM KS R2
Units. All mass units in COD
g organics/(g biomass·d)
g organics/ℓ - g organics/(g biomass·d)
g organics/g biomass
-
Method 1 (M1) 1.35 0.100 0.026 1.17 -0.016 0.002Method 2 (M2) 1.91 0.50 0.418 1.32 0.063 0.519Method 3 (M3) 1.08 -0.12 0.048 1.00 -0.117 0.123
TABLE 10Monod and saturation kinetics K constants and correlation coefficients (R2) for the O’Rourke 7.5 and
10d retention time data for unbiodegradable fraction (fPS’up) of 0.338. Note that all three linearisation and regression methods give the same results and perfect correlation for a pair of results.
Kinetic rate Monod kinetics Saturation kineticsLinearisation method Km Ks R2 KM KS R2
Units. All mass units in COD
g organics/(g biomass·d)
g organics/ℓ - g organics/(g biomass·d)
g organics/g biomass
-
Methods 1, 2 & 3 2.004 0.355 1.00 2.047 0.263 1.00
Figure 10 (right)Percentage COD removal versus retention time for the 1st order (1), 1st order specific (2), Monod (3) and saturation (4) hydroly-sis rate equations calibrated on the 7.5 and 10 d retention time
systems of O’Rourke showing also the experimental data at 7.5, 10, 15, 30 and 60 d.
522 Available on website http://www.wrc.org.zaISSN 0378-4738 = Water SA Vol. 31 No. 4 October 2005
ISSN 1816-7950 = Water SA (on-line)
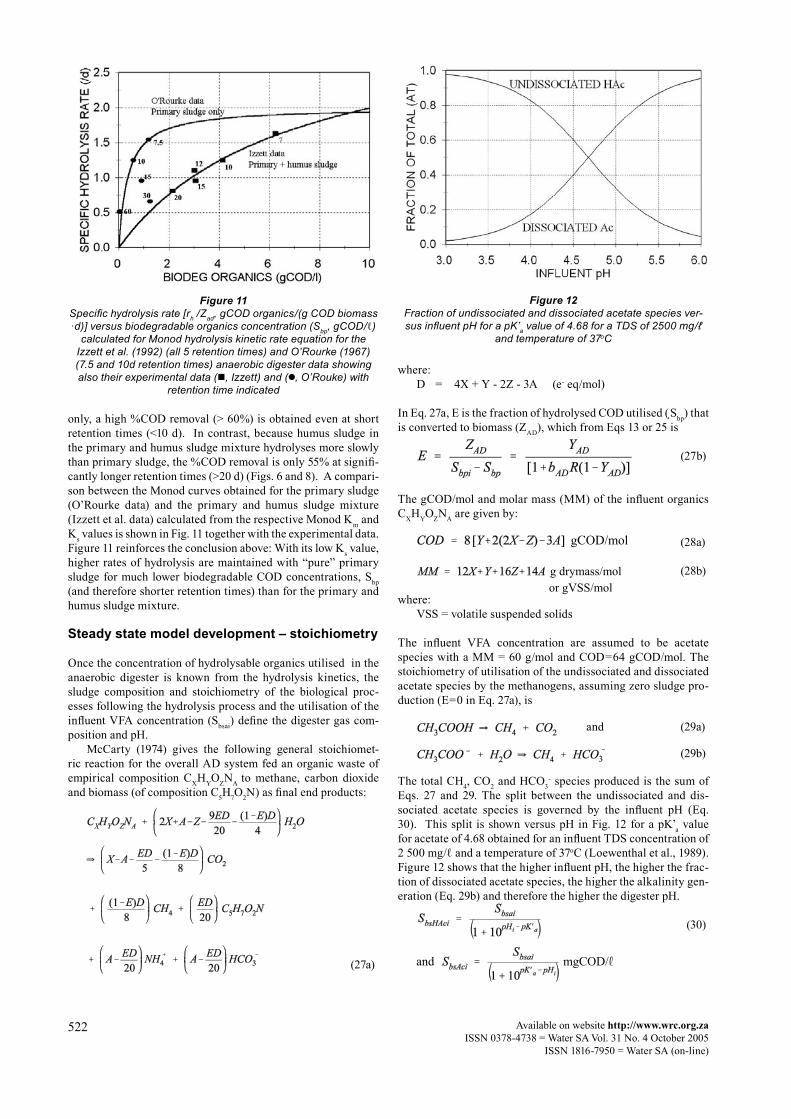
only, a high %COD removal (> 60%) is obtained even at short retention times (<10 d). In contrast, because humus sludge in the primary and humus sludge mixture hydrolyses more slowly than primary sludge, the %COD removal is only 55% at signifi-cantly longer retention times (>20 d) (Figs. 6 and 8). A compari-son between the Monod curves obtained for the primary sludge (O’Rourke data) and the primary and humus sludge mixture (Izzett et al. data) calculated from the respective Monod Km and Ks values is shown in Fig. 11 together with the experimental data. Figure 11 reinforces the conclusion above: With its low Ks value, higher rates of hydrolysis are maintained with “pure” primary sludge for much lower biodegradable COD concentrations, Sbp (and therefore shorter retention times) than for the primary and humus sludge mixture.
Steady state model development – stoichiometry
Once the concentration of hydrolysable organics utilised in the anaerobic digester is known from the hydrolysis kinetics, the sludge composition and stoichiometry of the biological proc-esses following the hydrolysis process and the utilisation of the influent VFA concentration (Sbsai) define the digester gas com-position and pH. McCarty (1974) gives the following general stoichiomet-ric reaction for the overall AD system fed an organic waste of empirical composition CXHYOZNA to methane, carbon dioxide and biomass (of composition C5H7O2N) as final end products:
(27a)
where: D = 4X + Y - 2Z - 3A (e- eq/mol)
In Eq. 27a, E is the fraction of hydrolysed COD utilised ( Sbp) that is converted to biomass (ZAD), which from Eqs 13 or 25 is
(27b)
The gCOD/mol and molar mass (MM) of the influent organics CXHYOZNA are given by:
(28a)
(28b)
where: VSS = volatile suspended solids
The influent VFA concentration are assumed to be acetate species with a MM = 60 g/mol and COD=64 gCOD/mol. The stoichiometry of utilisation of the undissociated and dissociated acetate species by the methanogens, assuming zero sludge pro-duction (E=0 in Eq. 27a), is
and (29a)
(29b)
The total CH4, CO2 and HCO3- species produced is the sum of
Eqs. 27 and 29. The split between the undissociated and dis-sociated acetate species is governed by the influent pH (Eq. 30). This split is shown versus pH in Fig. 12 for a pK’a value for acetate of 4.68 obtained for an influent TDS concentration of 2 500 mg/ℓ and a temperature of 37oC (Loewenthal et al., 1989). Figure 12 shows that the higher influent pH, the higher the frac-tion of dissociated acetate species, the higher the alkalinity gen-eration (Eq. 29b) and therefore the higher the digester pH.
(30)
Figure 11Specific hydrolysis rate [rh /Zad, gCOD organics/(g COD biomass ·d)] versus biodegradable organics concentration (Sbp, gCOD/ℓ)
calculated for Monod hydrolysis kinetic rate equation for the Izzett et al. (1992) (all 5 retention times) and O’Rourke (1967) (7.5 and 10d retention times) anaerobic digester data showing also their experimental data (, Izzett) and (, O’Rouke) with
retention time indicated
Figure 12Fraction of undissociated and dissociated acetate species ver-sus influent pH for a pK’a value of 4.68 for a TDS of 2500 mg/ℓ
and temperature of 37oC
27a
27a 27a
27a
27b
gCOD/mol 28a
g drymass/mol or gVSS/mol 28b g drymass/mol or gVSS/mol 28b
and 29a
29b
and mgCOD/� 30
Available on website http://www.wrc.org.zaISSN 0378-4738 = Water SA Vol. 31 No. 4 October 2005ISSN 1816-7950 = Water SA (on-line)
523
where: pHi is the influent pH and SbsHAci and SbsAci the undissociated and dissociated acetate
species concentration in the influent respectively.
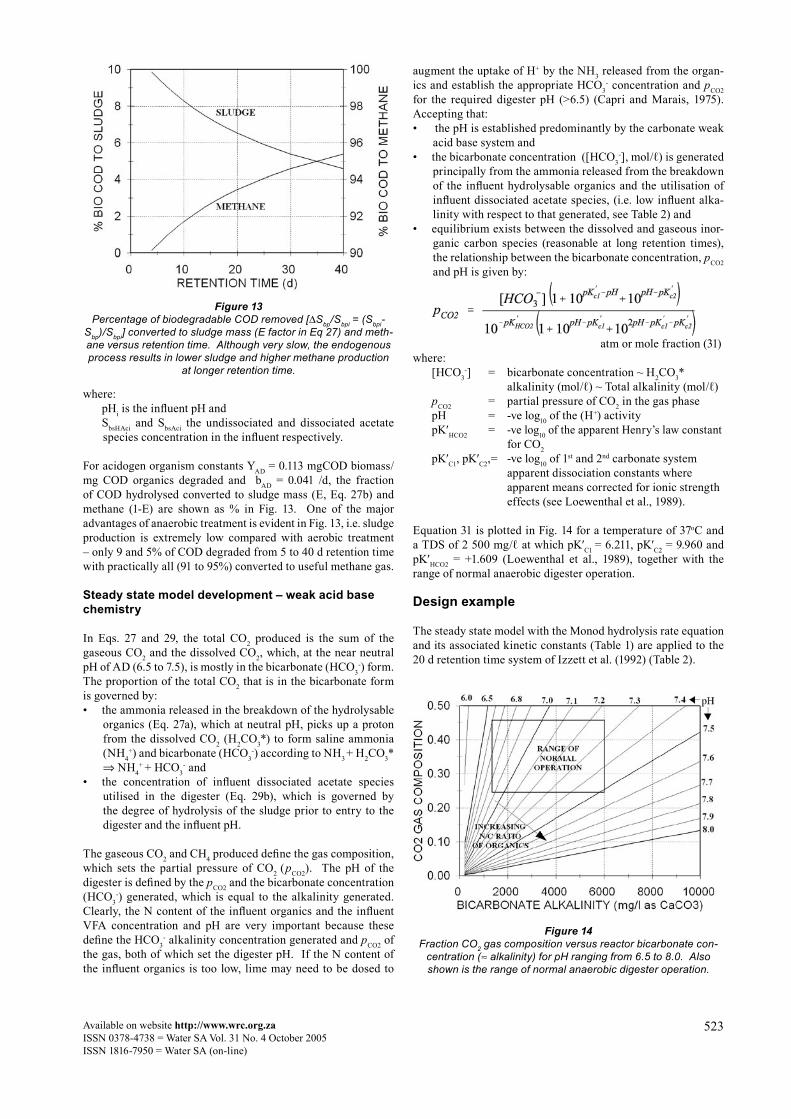
For acidogen organism constants YAD = 0.113 mgCOD biomass/mg COD organics degraded and bAD = 0.041 /d, the fraction of COD hydrolysed converted to sludge mass (E, Eq. 27b) and methane (1-E) are shown as % in Fig. 13. One of the major advantages of anaerobic treatment is evident in Fig. 13, i.e. sludge production is extremely low compared with aerobic treatment – only 9 and 5% of COD degraded from 5 to 40 d retention time with practically all (91 to 95%) converted to useful methane gas.
Steady state model development – weak acid base chemistry
In Eqs. 27 and 29, the total CO2 produced is the sum of the gaseous CO2 and the dissolved CO2, which, at the near neutral pH of AD (6.5 to 7.5), is mostly in the bicarbonate (HCO3
-) form. The proportion of the total CO2 that is in the bicarbonate form is governed by: • the ammonia released in the breakdown of the hydrolysable
organics (Eq. 27a), which at neutral pH, picks up a proton from the dissolved CO2 (H2CO3*) to form saline ammonia (NH4
+) and bicarbonate (HCO3-) according to NH3 + H2CO3*
⇒ NH4+ + HCO3
- and • the concentration of influent dissociated acetate species
utilised in the digester (Eq. 29b), which is governed by the degree of hydrolysis of the sludge prior to entry to the digester and the influent pH.
The gaseous CO2 and CH4 produced define the gas composition, which sets the partial pressure of CO2 (pCO2). The pH of the digester is defined by the pCO2 and the bicarbonate concentration (HCO3
-) generated, which is equal to the alkalinity generated. Clearly, the N content of the influent organics and the influent VFA concentration and pH are very important because these define the HCO3
- alkalinity concentration generated and pCO2 of the gas, both of which set the digester pH. If the N content of the influent organics is too low, lime may need to be dosed to
augment the uptake of H+ by the NH3 released from the organ-ics and establish the appropriate HCO3
- concentration and pCO2 for the required digester pH (>6.5) (Capri and Marais, 1975). Accepting that:• the pH is established predominantly by the carbonate weak
acid base system and • the bicarbonate concentration ([HCO3
-], mol/ℓ) is generated principally from the ammonia released from the breakdown of the influent hydrolysable organics and the utilisation of influent dissociated acetate species, (i.e. low influent alka-linity with respect to that generated, see Table 2) and
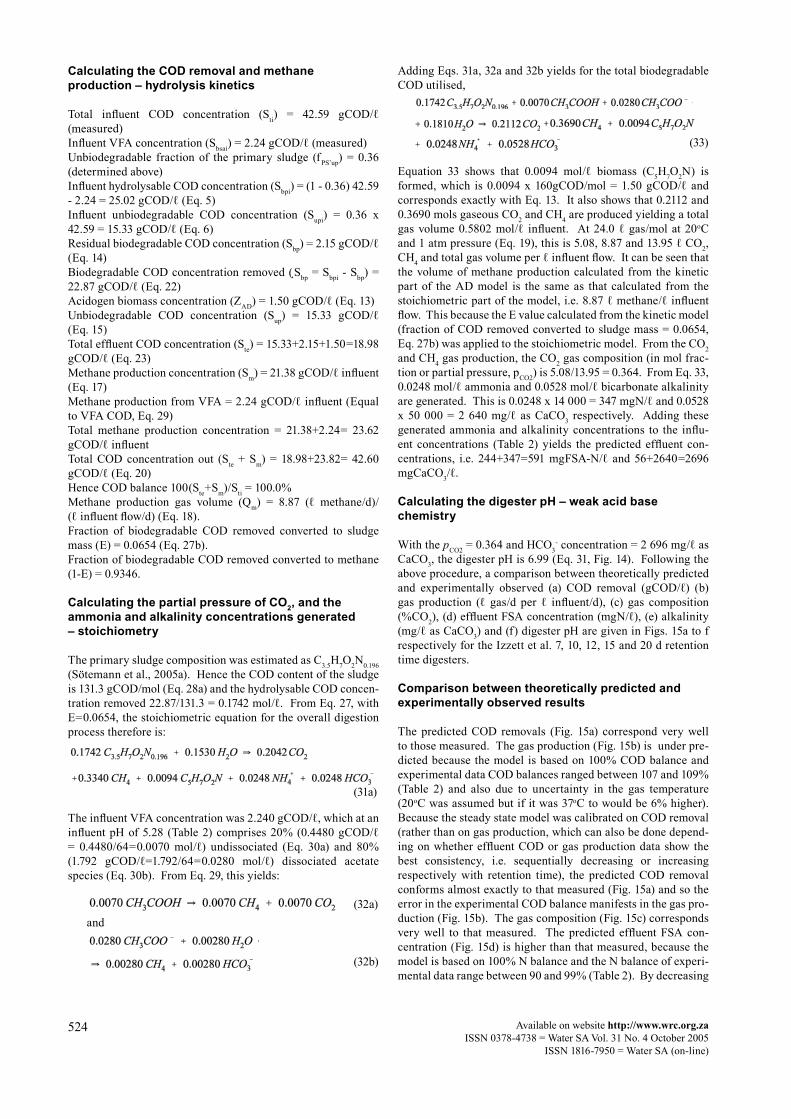
• equilibrium exists between the dissolved and gaseous inor-ganic carbon species (reasonable at long retention times), the relationship between the bicarbonate concentration, pCO2 and pH is given by:
atm or mole fraction (31)where: [HCO3
-] = bicarbonate concentration ~ H2CO3* alkalinity (mol/ℓ) ~ Total alkalinity (mol/ℓ) pCO2 = partial pressure of CO2 in the gas phase pH = -ve log10 of the (H+) activity pK′HCO2 = -ve log10 of the apparent Henry’s law constant for CO2 pK′C1, pK′C2,= -ve log10 of 1st and 2nd carbonate system apparent dissociation constants where apparent means corrected for ionic strength effects (see Loewenthal et al., 1989).
Equation 31 is plotted in Fig. 14 for a temperature of 37oC and a TDS of 2 500 mg/ℓ at which pK′C1 = 6.211, pK′C2 = 9.960 and pK′HCO2 = +1.609 (Loewenthal et al., 1989), together with the range of normal anaerobic digester operation.
Design example
The steady state model with the Monod hydrolysis rate equation and its associated kinetic constants (Table 1) are applied to the 20 d retention time system of Izzett et al. (1992) (Table 2).
Figure 13Percentage of biodegradable COD removed [∆Sbp/Sbpi = (Sbpi-
Sbp)/Sbpi] converted to sludge mass (E factor in Eq 27) and meth-ane versus retention time. Although very slow, the endogenous process results in lower sludge and higher methane production
at longer retention time.
atm or mole fraction 31
Figure 14Fraction CO2 gas composition versus reactor bicarbonate con-
centration (≈ alkalinity) for pH ranging from 6.5 to 8.0. Also shown is the range of normal anaerobic digester operation.
524 Available on website http://www.wrc.org.zaISSN 0378-4738 = Water SA Vol. 31 No. 4 October 2005
ISSN 1816-7950 = Water SA (on-line)
Calculating the COD removal and methane production – hydrolysis kinetics
Total influent COD concentration (Sti) = 42.59 gCOD/ℓ (measured)Influent VFA concentration (Sbsai) = 2.24 gCOD/ℓ (measured)Unbiodegradable fraction of the primary sludge (fPS’up) = 0.36 (determined above)Influent hydrolysable COD concentration (Sbpi) = (1 - 0.36) 42.59 - 2.24 = 25.02 gCOD/ℓ (Eq. 5)Influent unbiodegradable COD concentration (Supi) = 0.36 x 42.59 = 15.33 gCOD/ℓ (Eq. 6)Residual biodegradable COD concentration (Sbp) = 2.15 gCOD/ℓ (Eq. 14)Biodegradable COD concentration removed ( Sbp = Sbpi - Sbp) = 22.87 gCOD/ℓ (Eq. 22)Acidogen biomass concentration (ZAD) = 1.50 gCOD/ℓ (Eq. 13)Unbiodegradable COD concentration (Sup) = 15.33 gCOD/ℓ (Eq. 15)Total effluent COD concentration (Ste) = 15.33+2.15+1.50=18.98 gCOD/ℓ (Eq. 23)Methane production concentration (Sm) = 21.38 gCOD/ℓ influent (Eq. 17)Methane production from VFA = 2.24 gCOD/ℓ influent (Equal to VFA COD, Eq. 29)Total methane production concentration = 21.38+2.24= 23.62 gCOD/ℓ influentTotal COD concentration out (Ste + Sm) = 18.98+23.82= 42.60 gCOD/ℓ (Eq. 20)Hence COD balance 100(Ste+Sm)/Sti = 100.0%Methane production gas volume (Qm) = 8.87 (ℓ methane/d)/ (ℓ influent flow/d) (Eq. 18).Fraction of biodegradable COD removed converted to sludge mass (E) = 0.0654 (Eq. 27b).Fraction of biodegradable COD removed converted to methane (1-E) = 0.9346.
Calculating the partial pressure of CO2, and the ammonia and alkalinity concentrations generated – stoichiometry
The primary sludge composition was estimated as C3.5H7O2N0.196 (Sötemann et al., 2005a). Hence the COD content of the sludge is 131.3 gCOD/mol (Eq. 28a) and the hydrolysable COD concen-tration removed 22.87/131.3 = 0.1742 mol/ℓ. From Eq. 27, with E=0.0654, the stoichiometric equation for the overall digestion process therefore is:
(31a)
The influent VFA concentration was 2.240 gCOD/ℓ, which at an influent pH of 5.28 (Table 2) comprises 20% (0.4480 gCOD/ℓ = 0.4480/64=0.0070 mol/ℓ) undissociated (Eq. 30a) and 80% (1.792 gCOD/ℓ=1.792/64=0.0280 mol/ℓ) dissociated acetate species (Eq. 30b). From Eq. 29, this yields:
(32a) and
(32b)
Adding Eqs. 31a, 32a and 32b yields for the total biodegradable COD utilised,
(33)
Equation 33 shows that 0.0094 mol/ℓ biomass (C5H7O2N) is formed, which is 0.0094 x 160gCOD/mol = 1.50 gCOD/ℓ and corresponds exactly with Eq. 13. It also shows that 0.2112 and 0.3690 mols gaseous CO2 and CH4 are produced yielding a total gas volume 0.5802 mol/ℓ influent. At 24.0 ℓ gas/mol at 20oC and 1 atm pressure (Eq. 19), this is 5.08, 8.87 and 13.95 ℓ CO2, CH4 and total gas volume per ℓ influent flow. It can be seen that the volume of methane production calculated from the kinetic part of the AD model is the same as that calculated from the stoichiometric part of the model, i.e. 8.87 ℓ methane/ℓ influent flow. This because the E value calculated from the kinetic model (fraction of COD removed converted to sludge mass = 0.0654, Eq. 27b) was applied to the stoichiometric model. From the CO2 and CH4 gas production, the CO2 gas composition (in mol frac-tion or partial pressure, pCO2) is 5.08/13.95 = 0.364. From Eq. 33, 0.0248 mol/ℓ ammonia and 0.0528 mol/ℓ bicarbonate alkalinity are generated. This is 0.0248 x 14 000 = 347 mgN/ℓ and 0.0528 x 50 000 = 2 640 mg/ℓ as CaCO3 respectively. Adding these generated ammonia and alkalinity concentrations to the influ-ent concentrations (Table 2) yields the predicted effluent con-centrations, i.e. 244+347=591 mgFSA-N/ℓ and 56+2640=2696 mgCaCO3/ℓ.
Calculating the digester pH – weak acid base chemistry
With the pCO2 = 0.364 and HCO3- concentration = 2 696 mg/ℓ as
CaCO3, the digester pH is 6.99 (Eq. 31, Fig. 14). Following the above procedure, a comparison between theoretically predicted and experimentally observed (a) COD removal (gCOD/ℓ) (b) gas production (ℓ gas/d per ℓ influent/d), (c) gas composition (%CO2), (d) effluent FSA concentration (mgN/ℓ), (e) alkalinity (mg/ℓ as CaCO3) and (f) digester pH are given in Figs. 15a to f respectively for the Izzett et al. 7, 10, 12, 15 and 20 d retention time digesters.
Comparison between theoretically predicted and experimentally observed results
The predicted COD removals (Fig. 15a) correspond very well to those measured. The gas production (Fig. 15b) is under pre-dicted because the model is based on 100% COD balance and experimental data COD balances ranged between 107 and 109% (Table 2) and also due to uncertainty in the gas temperature (20oC was assumed but if it was 37oC to would be 6% higher). Because the steady state model was calibrated on COD removal (rather than on gas production, which can also be done depend-ing on whether effluent COD or gas production data show the best consistency, i.e. sequentially decreasing or increasing respectively with retention time), the predicted COD removal conforms almost exactly to that measured (Fig. 15a) and so the error in the experimental COD balance manifests in the gas pro-duction (Fig. 15b). The gas composition (Fig. 15c) corresponds very well to that measured. The predicted effluent FSA con-centration (Fig. 15d) is higher than that measured, because the model is based on 100% N balance and the N balance of experi-mental data range between 90 and 99% (Table 2). By decreasing
31a
and 32a
32b
32b

Available on website http://www.wrc.org.zaISSN 0378-4738 = Water SA Vol. 31 No. 4 October 2005ISSN 1816-7950 = Water SA (on-line)
525
Figure 15Comparison between steady state (SS) model and integrated simulation (UCTADM1) model predicted (lines) and measured (points)
COD removal (mgCOD/ℓ, Fig. 15a, top left), gas production(ℓ/d, Fig. 15b, top right), gas composition (pCO2, Fig. 15c, middle left), effluent FSA (mgN/ℓ, Fig. 15d, middle right), alkalinity (mg/ℓ as CaCO3, Fig. 15e, bottom left) and digester pH (Fig. 15f, bottom right)
versus retention time for the Izzett et al. data set.
the N content of the hydrolysable organics (A in CXHYOZNA) by a small amount (5% to 0.186), the predicted effluent FSA can be made to closely fit the measured effluent FSA of the 10 to 20d retention time systems. This also will result in an improved cor-relation between predicted and measured alkalinity (Fig. 15e),
because with a lower N content in the sludge, less alkalinity is generated. The lower alkalinity will decrease the predicted digester pH causing it to deviate further (~0.3 pH units) from the actual measured pH but closer to the “corrected” measured pH (Fig. 15f). The actual measured pH data (7.11 to 7.19) show an
a
c
e
b
d
f
526 Available on website http://www.wrc.org.zaISSN 0378-4738 = Water SA Vol. 31 No. 4 October 2005
ISSN 1816-7950 = Water SA (on-line)
inconsistency in that these pH values and the measured alkalin-ity and gas composition do not conform to Eq. 31 – accepting the data that are most reliably measured, i.e. gas composition (Fig. 15c) and alkalinity (Fig. 15e) with the five point titration method of Moosbrugger et al. (1992), the digester pH must be lower than that measured to conform to Eq. 31 (see Table 2 and Fig. 15f). A digester pH lower than that actually meas-ured is quite likely because CO2 loss during sampling and test-ing will increase the pH. Despite the improvement between predicted and measured results that reducing the A value to 0.186 will yield to conform to the measured effluent N mass, the A=0.196 value in CXHYOZNA was retained because it is based in the influent N mass. Further, Sötemann et al. (2005a) show that the C3.5H7O2N0.196 stoichiometry accepted for the primary and humus sludge composition, which was obtained from the COD, C and N mass balances over the Izzett et al. AD systems (Table 2), conforms very closely to independently measured CHON composition measurements on “pure” primary sludge, i.e. within 96%, 100%, 95% and 99% respectively. Consider-ing the complexity of the system and the margin of error in the experimental data, overall the steady state model predicts the anaerobic digester performance over the 7 to 20 d retention time satisfactorily for steady state design. The predictions of the more detailed two phase (aqueous-gas) integrated chemi-cal, physical and biological processes anaerobic digester model (UCTADM1) of Sötemann et al. (2005a) are also shown in Figs. 15a to f and the steady state AD model can be seen to correlate very closely also with UCTADM1. Hence, the steady state AD model provides a reliable basis for cross-checking simulation model results.
Conclusion
A steady state AD model for the treatment of sewage sludge has been developed. It comprises three sequential parts:• a kinetic part with which the influent COD hydrolysed/uti-
lised, gas and biomass production and effluent COD concen-tration are calculated for a given retention time,
• a stoichiometry part with which the gas composition (or par-tial pressure of CO2), ammonia released and alkalinity gen-erated are calculated from the COD utilised and the CHON composition of the hydrolysed COD and
• a carbonate system weak acid base chemistry part with which the digester pH is calculated from the partial pressure of CO2 and alkalinity generated.
This model shows that for a given %COD removal, the partial pressure of CO2 and alkalinity generated, and hence the digester pH, are governed entirely by the influent sludge composition, i.e. X, Y, Z and A in CXHYOZNA and the undissociated volatile fatty acids (VFA) species concentration of the influent. The hydrolysis kinetic part of the model was calibrated against AD data for two types of sewage sludge: • a primary and humus sludge mixture extending over a reten-
tion time range of 7 to 20 d and • a “pure” primary sludge extending over a retention time
range of 7.5 to 60 d.
Also, four hydrolysis kinetic rate (rh) equations were calibrated against both sludge types, viz. • first order (rh = Kh Sbp), • first order specific (rh = KH Sbp ZAD), • Monod [rh = Km Sbp/(Ks + Sbp) ZAD] and • saturation [rh = KM (Sbp/ZAD)/(KS + Sbp/ZAD) ZAD].
Once calibrated against the particular sludge type and taking due account of experimental error, the %COD removals pre-dicted by the four hydrolysis kinetic equations were closely sim-ilar, which made it difficult to select the best kinetic equation. Also, by varying the unbiodegradable COD fraction (fPS’up) of the sewages sludges within a narrow range (~2%) changed the coefficient of variation (Cvar) for the first order and first order specific kinetic equations, and the correlation coefficient (R2) for the Monod and saturation kinetic equations. Within the 2% range in unbiodegradable COD fraction, the different hydrolysis kinetic equations yielded best statistical fits between theoreti-cally predicted and experimentally measured COD removals (or gas production) at different fPS’up values. It is concluded that for both types of sewage sludge, taking due account of experimen-tal error (i.e. COD mass balance errors) each calibrated kinetic equation is equally good for calculating the %COD removal and gas production versus retention time. For each sewage sludge type, different hydrolysis kinetic rates and unbiodegrada-ble COD fractions were obtained which showed that the pure primary sludge hydrolysed significantly faster and had a lower unbiodegradable particulate COD fraction (fPS’up = 0.33) than the primary and humus sludge mixture (fPS’up = 0.36). Anaerobic digesters treating pure primary sludge therefore will achieve higher COD or VSS removals at shorter retention times than digesters treating a primary and humus sludge mixture. Once the COD removal is known from the hydrolysis kinetics part of the model, the CHON composition of the COD removed and the dissociated acetate species concentration in the influent (all utilised in the digester) fixes the gas composition (or partial pressure of CO2), the ammonia released and the bicarbonate gen-erated (equal to alkalinity generated) through the C, H, O and N mass balances based stoichiometry part of the model. From the influent COD, C and N masses of the primary and humus sludge digesters, a sludge composition of C3.5H7O2N0.196 has been deter-mined (Sötemann et al., 2005a). With this sludge composition and measured influent VFA concentration and pH, from which the dissociated acetate species concentration was calculated, the stoichiometry part of the model predicted the experimentally observed gas composition (or CO2 partial pressure), ammonia released and alkalinity generated well, taking due account of experimental error. With the CO2 partial pressure and alkalin-ity generated, the digester pH was calculated from the carbonate system weak acid base chemistry part of the model. The model predicted pH was significantly lower (by ~0.30 pH units) than that experimentally measured. From the observed CO2 partial pressure and alkalinity, which can be measured reliably, there is an error in the measured digester pH, probably due to CO2 gas loss in sampling and measurement. The “corrected” measured pH should be between 6.84 and 6.88 for the 7, 10, 12, 15 and 20 d retention time systems and the predicted pH is 0.08 to 0.12 pH units higher than these corrected values. A significantly closer correlation between theoretically calculated and experi-mentally measured digester effluent FSA, alkalinity and pH can be obtained if the N content of the feed sludge is decreased from 0.196 to 0.186 based on the measured N mass exiting the digesters rather than on that entering the digesters. Taking into consideration experimental error (C and N mass balances errors) it is concluded that the steady state model predicts very well the observed 7 to 20 d retention time primary and humus sludge digester performance. The stoichiometry and carbon-ate system weak acid base chemistry part of the model could not be checked against the “pure” primary sludge digester data set of O’Rourke (1967) because the N concentrations in the effluent were not measured for this data set. The steady state
Available on website http://www.wrc.org.zaISSN 0378-4738 = Water SA Vol. 31 No. 4 October 2005ISSN 1816-7950 = Water SA (on-line)
527
AD model also correlated very closely with the predictions of the two phase (aqueous-gas) integrated chemical, physical and biological processes dynamic simulation anaerobic digester model (UCTADM1) of Sötemann et al. (2005a). Provided the hydrolysis rate of the particulate biodegradable organics is known for a particular sewage sludge, the steady state model is useful to:• estimate retention time, reactor volume, gas production and
composition for a required system performance like COD (or VSS) removal,
• investigate the sensitivity of the system performance to the design and operation parameters,
• provide a basis for cross-checking simulation model results, and
• estimate product stream concentrations for design of down- (or up-) stream unit operations of the wastewater treatment plant.
Acknowledgements
This research was financially supported by the Water Research Commission, the National Research Foundation and the Univer-sity of Cape Town and is published with their permission. Grati-tude is expressed to Eskom (Electricity Supply Commission) for the sludge composition analysis.
References
BATSTONE DJ, KELLER J, ANGELIDAKI I, KALYUZHNYI SV, PAVLOSTATHIS SG, ROZZI A, SANDERS WTM, SIEGRIST H and VAVILIN VA (2002) Anaerobic Digestion Model No 1 (ADM1), Scientific and Technical Report No 9, International Water Associa-tion (IWA), London, UK.
BRYERS JD (1985) Structural modelling of anaerobic digestion of bio-mass particulates. Biotech & Bioeng. 27 638-649.
CAPRI M and MARAIS GvR (1975) pH adjustment in anaerobic digs-tion. Water Research 9 (3) 307-314.
DOLD PL, EKAMA GA and MARAIS GvR (1980) A general model for the activate sludge process. Prog. Wat. Tech. 12 (Tor) 47-77.
ECKENFELDER WW (Jr.) (1980) Principles of Water Quality Man-agement. CBI Publishing Company Inc., Boston, Massachusetts, USA.
HENZE M and HARREMOËS P (1983) Anaerobic treatment of waste-water in fixed film reactors - A literature review. Water. Sci. Tech-nol. 15 1-101.
HENZE M, GRADY CPL (Jnr), GUJER W, MARAIS GvR and MAT-SUO T (1987) Activated sludge model No 1, IWA Scientific and Technical Report No 1, IWA London. ISSN 1010-707X. 33 pp.
IZZETT HB, WENTZEL MC and EKAMA GA (1992) The Effect Of Thermophilic Heat Treatment On The Anaerobic Digestibility Of Primary Sludge. Research Report W76, Univ. of Cape Town, Dept. of Civil Eng. Rondebosch 7701, Cape, South Africa.
LOEWENTHAL RE, EKAMA GA and MARAIS GvR (1989). Mixed weak acid/base systems: Part I - Mixture characterisation. Water SA 15 (1) 3-24.
MASSÉ DI and DROSTE RL (2000) Comprehensive model of anaero-bic digestion of swine manure slurry in a sequencing batch reactor. Water Res. 34 (12) 3087-3106.
McCARTY PL (1974) Anaerobic processes. Presented at International Association of Water Pollution Research (IAWPR, now IWA) short course on Design Aspects of Biological Treatment, Birmingham, UK, 18 Sept. 1974.
MOOSBRUGGER RE, WENTZEL MC, EKAMA GA and MARAIS GvR (1992) Simple Titration Procedures To Determine H2CO3* Alkalinity And Short Chain Fatty Acids In Aqueous Solutions Con-taining Known Concentrations Of Ammonium, Phosphate And Sul-phide Weak Acid Bases. Water Research Commission, Private Bag X03, Gezina, 0031, South Africa. ISBN 1 874858 54 3.
MOSEY FE (1983) Mathematical modelling of the anaerobic digestion process: Regulatory mechanism for the formation of short chain volatile acids from glucose. Water Sci. Technol. 15 (8/9) 209-232.
O’ROURKE JT (1967) Kinetics of Anaerobic Treatment at Reduced Temperatures. PhD dissertation, Department of Civil Engineering, Stanford University.
RISTOW NE, SÖTEMANN SW, LOEWENTHAL RE, WENTZEL MC and EKAMA GA (2004) Hydrolysis of Primary Sludge Under Methanogenic, Acidogenic and Sulphate-reducing Conditions. WRC Report 1216/1/04, Water Research Commission, Private Bag X03, Gezina, 0031, South Africa.
SÖTEMANN SW, VAN RENSBURG P, RISTOW NE, WENTZEL MC, LOEWENTHAL RE and EKAMA GA (2005a) Integrated chemi-cal, physical and biological processes modelling Part 2 - Anaerobic digestion of sewage sludges. Water SA 31 (4) 545-568.
SÖTEMANN SW, MUSVOTO EV, WENTZEL MC and EKAMA GA (2005b) Integrated chemical, physical and biological processes modelling Part 1 - Anoxic-aerobic C and N removal in the activated sludge system. Water SA 31 (4) 529-544.
VAVILIN VA, RYTOV SV, LOKSHINA LY, RINTALA JA and LYBERATOS G (2001) Simplified hydrolysis models for the opti-mal design of two stage anaerobic digestion. Water Research 35 (17) 4247-4251.
WENTZEL MC, DOLD PL, EKAMA GA and MARAIS GvR (1985) Kinetics of biological phosphorus release. Water Sci Technol. 17 57-71.
WRC (1984) Theory, Design and Operation of Nutrient Removal Activated Sludge Processes (Ed. Wiechers HNS), Water Research Commission, Private Bag X03, Gezina 0031, RSA. ISBN 0 908356 13 7.

528 Available on website http://www.wrc.org.zaISSN 0378-4738 = Water SA Vol. 31 No. 4 October 2005
ISSN 1816-7950 = Water SA (on-line)