a state and regional report on the economic … state and regional report on the ... figure 1: value...
TRANSCRIPT
A State and Regional Report on the Economic Contribution of Farms, Forests and Related Industries
Research conducted by Indiana Business Research Center, Kelley School of Business,Indiana University
Beyond the Farm

March 2015
Beyond the Farm:A State and Regional Report on the Economic Contribution of Farms, Forests and Related Industries
Index of Tables and FiguresFigure 1: Value of Agricultural Production by State, 2012 ..................................................................2Table 1: Value of Indiana Agricultural Production by Industry, 2012 ...................................................3Table 2: Indiana Agricultural Production Volume for Select Commodities, 2007 and 2012 ................3Table 3: The Economic Contributions of Agriculture and Forestry to Indiana’s Economy, 2012 .........5Table 4: Agriculture and Forestry’s Contribution to Indiana’s Employment, Top 15 Industries, 2012 ..6Table 5: Agriculture and Forestry’s Contribution to Indiana’s Value Added, Top 15 Industries, 2012 ..7Table 6: Tax Effects of Indiana’s Agriculture and Forestry, 2012 ($ million) .........................................7Figure 2: Indiana’s USDA Crop Reporting Districts .............................................................................8Table 7: Value Added and Employment Effects by Crop Reporting District, 2012 ...............................8Figure 3: Indiana Congressional Districts ............................................................................................9Table 8: Value Added and Employment Effects by Congressional District, 2012 ................................9Table 9: Total Economic and Employment Contributions of Each Agriculture and Forestry Industry, 2012 ..................................................................................................................................................29
Prepared forIndiana Soybean Alliance
By Indiana Business Research Center, Kelley School of Business, Indiana University
Timothy F. Slaper, Ph.D., Director of Economic AnalysisMatt Kinghorn, Economic AnalystGrace Ortuzar, Research Assistant
Cover page: grain bin photo courtesy of the Soybean Checkoff This study was supported by funding from the Soybean Checkoff
ContentsExecutive Summary .........................................................................................1
Key Findings ........................................................................................................................................1
Indiana Agriculture by the Numbers ...............................................................2
Economic Contributions of Agriculture and Forestry ...................................4Summary of Economic Contributions .................................................................................................4Economic Contributions by Industry ....................................................................................................5Contributions to Government Revenues ..............................................................................................6Agriculture’s Impact in Indiana Regions ..............................................................................................7Agriculture’s Impact in Indiana Congressional Districts .......................................................................8Conclusion ...........................................................................................................................................9Notes ...................................................................................................................................................9
Crop Reporting District Fact Sheets .............................................................10
Congressional District Fact Sheets ..............................................................19
Appendix .........................................................................................................28Data Sources .....................................................................................................................................28Defining Agriculture and Forestry .....................................................................................................28Adjustments to the IMPLAN Model ....................................................................................................28Key Terms ..........................................................................................................................................29About IMPLAN Economic Impact Modeling Software ........................................................................30The Economic Theory behind IMPLAN ............................................................................................30
Beyond the Farm, March 2015 4 1
It is easy to see that agriculture and forestry play a major role in Indiana’s economy. A look
at the geographic reach of these activities offers some indication of their importance. The state’s farms combined to cover nearly two-thirds of Indiana’s total land area in 2012, while our forests cover another 20 percent of the state.
The economic contributions of agriculture also extend beyond the farm and forest. Indiana is home to many agriculture-related processing and manufacturing establishments, such as grain milling operations or sawmills. These establishments are found all over the state—from our largest cities to our more rural areas, and they employ nearly 29,000 Hoosiers.
The economic activity generated by these various activities packs a powerful punch, but the full economic contributions of Indiana agriculture are not well known. This report aims to provide comprehensive estimates of the total economic footprint of Indiana agriculture. The analysis includes estimates of the total value of sales, gross domestic product (GDP) and employment directly linked to agriculture-related industries, as well as the economic ripple effects that these activities generate in other industries around the state. The estimates are presented at the state level, as well as for Indiana’s congressional districts and its U.S. Department of Agriculture (USDA) crop reporting districts.
Key Findings• The total direct value of sales for
all Indiana agriculture-related industries was an estimated $31.2 billion in 2012. The economic ripple effects of these sales—which refer to supply chain purchases and the household spending of workers—generated another $12.9 billion in sales. Add these effects together, and agriculture’s total impact on sales was an estimated $44.1 billion in 2012.
• A better way to measure the effect of agriculture on Indiana’s economy is to look its contribution to GDP (or value added). The combined effects of agriculture (i.e., direct effects + ripple effects) generated an estimated $14.9 billion in value added—which accounts for nearly 5 percent of the state’s total GDP.
• The value added multiplier effect was 1.88, meaning that every dollar of GDP created directly by agriculture industries generates another $0.88 in economic activity in other industries in the state.
• The total GDP contributions of agriculture are split almost evenly between agricultural production industries ($7.44 billion) and agriculture-related manufacturing ($7.46 billion).
• The state’s agriculture industries combine to employ more than 107,500 direct workers. Add in the ripple effects, and the total climbs to 188,600 jobs in Indiana. The ratio of direct jobs to total jobs yields a multiplier of 1.8, meaning that every 10 jobs directly related to agriculture support an additional eight jobs in the state.
• Looking at specific industries, grain and oilseed (i.e., soybeans) farming dominate the economic contributions of agriculture. These two industries account for 40 percent of agriculture’s total employment effect and 31 percent of agricultural GDP.
• Indiana ranks 10th among states in crop and livestock production with total sales at $11.2 billion in 2012. The state ranked in the top five in the production of corn, soybeans, and hogs and pigs.
Executive Summary
Every dollar of GDP created directly by agriculture industries generates another $0.88 in economic
activity in other industries in the state.
2 3 Beyond the Farm, March 2015
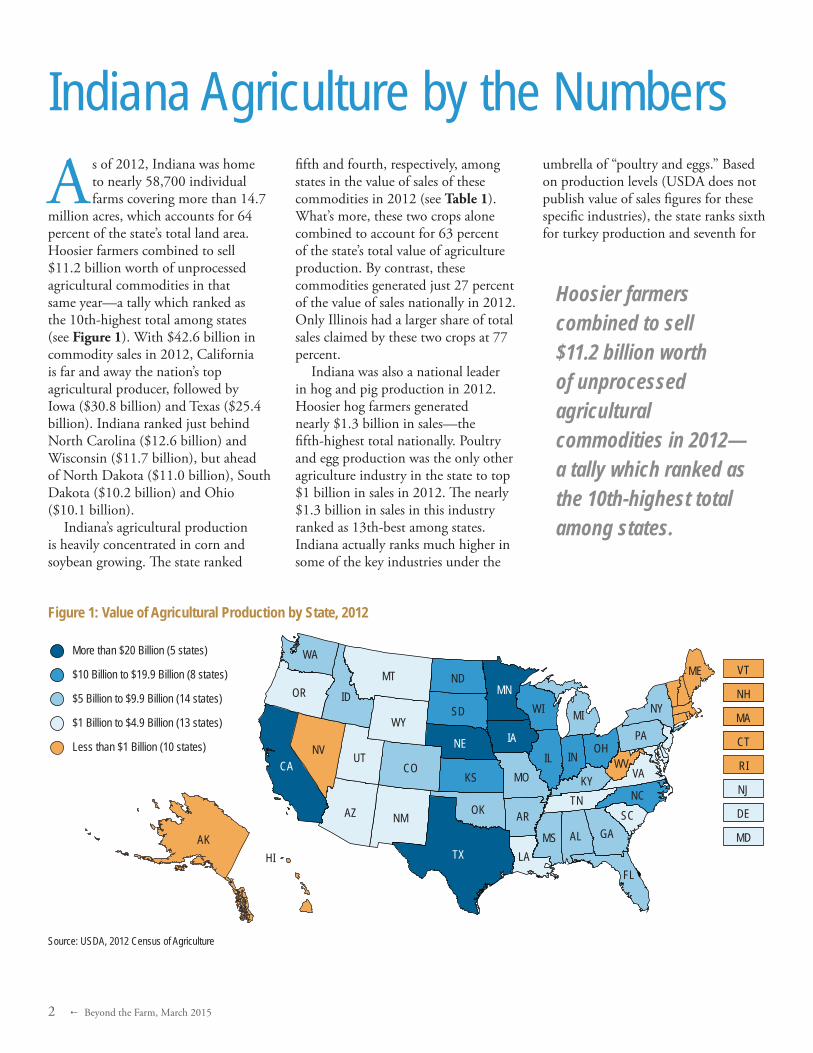
As of 2012, Indiana was home to nearly 58,700 individual farms covering more than 14.7
million acres, which accounts for 64 percent of the state’s total land area. Hoosier farmers combined to sell $11.2 billion worth of unprocessed agricultural commodities in that same year—a tally which ranked as the 10th-highest total among states (see Figure 1). With $42.6 billion in commodity sales in 2012, California is far and away the nation’s top agricultural producer, followed by Iowa ($30.8 billion) and Texas ($25.4 billion). Indiana ranked just behind North Carolina ($12.6 billion) and Wisconsin ($11.7 billion), but ahead of North Dakota ($11.0 billion), South Dakota ($10.2 billion) and Ohio ($10.1 billion).
Indiana’s agricultural production is heavily concentrated in corn and soybean growing. The state ranked
fifth and fourth, respectively, among states in the value of sales of these commodities in 2012 (see Table 1). What’s more, these two crops alone combined to account for 63 percent of the state’s total value of agriculture production. By contrast, these commodities generated just 27 percent of the value of sales nationally in 2012. Only Illinois had a larger share of total sales claimed by these two crops at 77 percent.
Indiana was also a national leader in hog and pig production in 2012. Hoosier hog farmers generated nearly $1.3 billion in sales—the fifth-highest total nationally. Poultry and egg production was the only other agriculture industry in the state to top $1 billion in sales in 2012. The nearly $1.3 billion in sales in this industry ranked as 13th-best among states. Indiana actually ranks much higher in some of the key industries under the
umbrella of “poultry and eggs.” Based on production levels (USDA does not publish value of sales figures for these specific industries), the state ranks sixth for turkey production and seventh for
Indiana Agriculture by the Numbers
Figure 1: Value of Agricultural Production by State, 2012
Source: USDA, 2012 Census of Agriculture
VT
NH
MA
CT
RI
NJ
DE
MD
$5 Billion to $9.9 Billion (14 states)
More than $20 Billion (5 states)
$10 Billion to $19.9 Billion (8 states)
$1 Billion to $4.9 Billion (13 states)
Less than $1 Billion (10 states)
ID
NVCA
MOKS
AR
IN
NY
NE OH
MS
OK
WY
SC
IL
MN
KY
HI
ND
LA
WI
IA
AZ
GA
OR
TX
PA
CO
SD
NM
FL
MT MEWA
AK
VAUT
NC
MI
WV
TN
AL
Hoosier farmers combined to sell $11.2 billion worth of unprocessed agricultural commodities in 2012—a tally which ranked as the 10th-highest total among states.

Beyond the Farm, March 2015 4 3
eggs. Other industries where Indiana ranked in the top 15 states were milk from cows; horses, ponies, etc.; and tobacco.
Table 2 highlights changes in the volume of production for some of Indiana’s key commodities between 2007 and 2012 (the last two USDA Census of Agriculture years). The nearly 40 percent decline in the volume of corn produced for grain certainly leaps out. This drop is due in large part to the severe drought in some regions of the country (including Indiana) in 2012. Other Midwestern states like Missouri and Illinois saw even sharper declines in grain corn production over this period. It is important to point out that Indiana rebounded to tally two consecutive record years for grain corn production in 2013 and 2014. According to the USDA’s annual surveys, Indiana topped 1 billion bushels in each of these years, marking the first time the state has ever eclipsed this mark.
Another factor in this decline was a shift in the types of crops planted in these two years. Comparing 2012 to 2007, Indiana crop farmers dedicated
roughly 326,000 fewer acres of land to grain corn but planted 360,000 more acres in soybeans. This shift helps to explain how the state increased soybean
production during a drought year. The state also saw volume increases in each of its major animal agriculture industries over this period.
Table 2: Indiana Agricultural Production Volume for Select Commodities, 2007 and 2012
*The decline in corn production was driven primarily by the severe drought experienced in Indiana in 2012. The state rebounded to post consecutive record corn harvests in 2013 and 2014.**Values comprise chickens, turkeys, ducks, pheasant, quail, geese and pigeons/squab only. Some poultry commodities are excluded due to data suppression. Source: USDA, 2012 Census of Agriculture
Quantity, 2012 (1,000 units)
Quantity, 2007 (1,000 units)
Change 2007–2012
Corn for grain (bushels) 597,271 959,947 -37.8%*Corn for silage (tons) 1,775 1,956 -9.3%*Soybeans (bushels) 218,928 211,117 3.7%Hogs and pigs (head) 10,551 9,523 10.8%Poultry (head)** 94,728 84,809 11.7%Eggs (dozen eggs) 102,603 96,619 6.2%Milk from cows (1,000 lbs.) 3,713 3,345 11.0%Cattle and calves (head) 665 638 4.2%
Table 1: Value of Indiana Agricultural Production by Industry, 2012
Source: USDA, 2012 Census of Agriculture
Value of Sales ($ million) U.S. Rank
Corn 4,070.2 5Soybeans 2,956.8 4Hogs and pigs 1,273.1 5Poultry and eggs 1,164.2 13Milk from cows 659.3 14Cattle and calves 522.7 29Wheat and all other grains, oilseeds, and dry beans 189.9 21Nursery, greenhouse, floriculture, and sod 110.8 26Vegetables, melons, potatoes, and sweet potatoes 104.4 22Other crops and hay 76.5 39Horses, ponies, mules, burros, and donkeys 23.9 15Other animals and other animal products 22.3 19Fruits, tree nuts, and berries 10.9 36Sheep, goats, wool, mohair, and milk 10.1 25Tobacco 7.7 9Aquaculture 5.1 35Cut Christmas trees and short rotation woody crops 2.0 21

4 3 Beyond the Farm, March 2015
Indiana’s status as a top 10 agricultural producer translates into big business for a host of other
industries in the state. A Hoosier grain farmer, for instance, buys a range of production inputs from other Indiana businesses. From fertilizers and fuels to trucking and accounting services, the ripple effects from these supply chain purchases cascade throughout the state economy. Furthermore, Indiana’s farms and forests support hundreds of agricultural processing and manufacturing establishments in the state, which also engage other Indiana-based suppliers.
This section of the report provides estimates of the full economic contributions of Indiana agriculture. For this analysis, the Indiana Business Research Center (IBRC) research team considered two types of activities: agricultural production and agriculture-dependent processing or manufacturing industries. Production refers to the crop and livestock industries covered in the previous section as well as forestry and agricultural support services. Within the NAICS industry classification scheme, production activities refer to any industry classified in sector 11 with the exception of fishing, hunting and trapping (subsector 114). The processing and manufacturing activities refer to industries that utilize farm and forest production as the key input into their finished goods. All of these industries are classified under NAICS sectors 31 or 32. Examples include fruit and vegetable canning, animal processing, ethanol production, and veneer and plywood manufacturing, to name a few.1
The IBRC research team used the IMPLAN economic modeling software
to estimate the total economic effect of Indiana agriculture and forestry. The IMPLAN model draws from a variety of secondary data sources to provide a detailed account of the Indiana economy. For example, the model indicates that Indiana sawmills purchase nearly 50 percent of their production inputs from other Hoosier establishments. The estimated economic effects of these supply chain purchases are reported in the “indirect effects” columns in the tables. Additionally, workers in the agriculture production and processing industries—as well as employees at supplier firms—spend their earnings on food, housing, health care, entertainment, etc. The estimated ripple effects from this household spending are presented in the “induced effects” columns.2
The research team made some adjustments to the IMPLAN model to eliminate any potential double counting in the following estimates. Without any adjustments, the impact of agriculture could be inflated when the effects of closely related industries are added together. Take the corn production and corn milling industries, for instance. Milling operations buy a portion of Indiana’s corn production, which they use as an input to produce oils, sweeteners, starches, etc. If the IBRC did not adjust the model, then the value of the corn would be counted twice—once as the sale of raw corn and again as an input in the sale of the processed goods. These types of supply linkages are present throughout agriculture and forestry.
The adjustments to the model eliminate these intra-agriculture relationships within Indiana and, thus, avoid the double counting that would otherwise appear in the indirect and induced output effects. These adjustments also allow for valid estimates of all value added effects (which already removes the value of production inputs) and employment effects, but they do not remove the double counting reported in the direct output effects. Therefore, the value added and employment numbers offer the best measures of the industry’s contributions to the Indiana economy.
Summary of Economic Contributions In 2012, Indiana’s agriculture- and forestry-related establishments combined to generate an estimated $31.2 billion in direct economic output—a measure which is analogous to total sales (see Table 3). In addition to these direct effects,
Economic Contributions of Agriculture and Forestry
In 2012, Indiana’s agriculture- and forestry- related establishments
combined to generate an estimated $31.2
billion in direct economic output—a
measure which is analogous to total sales.

Beyond the Farm, March 2015 4 5
the state’s agriculture producers and manufacturers triggered an estimated $8.2 billion in additional economic activity in the state when they purchased inputs from Indiana-based suppliers. The household spending of agricultural employees, as well as that of employees in the supply chain, supported another $4.7 billion in economic output. All told, the total economic output footprint of Indiana’s agriculture and forestry industries was nearly $44.1 billion in 2012.
The multiplier offers a useful way to interpret these ripple effects. The ratio of total effects to direct output yields a multiplier of 1.41, meaning that each dollar of output generated by Indiana’s agriculture and forestry establishments stimulates another $0.41 in economic activity in the state.
With an estimated total output effect of nearly $25.8 billion, the state’s processing and manufacturing industries accounted for nearly 59 percent of Indiana agriculture’s total economic footprint in 2012. While the state’s production industries may have had a smaller contribution to total output, their output multiplier effect of 1.57 was quite a bit stronger.
Economic output estimates are useful “headline numbers” in that they provide an approximate sales total and most people readily understand the concept of a dollar’s worth of sales. That said, the value added metric provides a more meaningful appraisal of agriculture’s contribution to Indiana’s economy because this measure is analogous to the official GDP figures released at the national or state level. As the second section of Table 3 shows, Indiana’s agriculture-related establishments combined to generate an estimated $7.9 billion
in direct value added in 2012. This level of activity triggered nearly $7.0 billion in indirect and induced effects throughout the state to bring the industry’s total value added impact to $14.9 billion. In 2012, the state’s total value added was roughly $306 billion, which means that the combined effects of agriculture and forestry accounted for 4.9 percent of Indiana’s GDP in that year.
As for employment, more than 107,500 jobs in Indiana were directly related to agricultural production and processing in 2012. Nearly 75 percent of these direct jobs were in the state’s agricultural production industries. The purchase of production inputs from Indiana-based suppliers supported an estimated 40,450 additional jobs in the state, while the household
spending of direct and indirect workers accounted for another 40,660 jobs. In all, the total employment footprint of agriculture- and forestry-related industries in the state was an estimated 188,640 jobs in 2012. The ratio of total employment effects to direct employment gives a multiplier of 1.8, meaning that every 10 jobs directly related to Indiana agriculture and forestry supported an additional 8 jobs in the state.
Economic Contributions by IndustryWith Indiana ranking among the top five states in the production of corn, soybeans and hogs, it is no surprise that these three industries dominate the state’s agricultural employment. As of 2012, nearly one-third of Indiana’s
Table 3: The Economic Contributions of Agriculture and Forestry to Indiana’s Economy, 2012
Source: IBRC, using data from the USDA and the IMPLAN economic modeling software
Direct Effects
Indirect Effects
Induced Effects Total Multiplier
Total Output ($ million)
All Agriculture and Forestry 31,162 8,228 4,688 44,078 1.41
Production 11,612 4,058 2,607 18,277 1.57
Processing and Manufacturing 19,550 4,170 2,081 25,801 1.32
Value Added ($ million)
All Agriculture and Forestry 7,930 4,160 2,818 14,908 1.88
Production 3,955 1,924 1,567 7,447 1.88
Processing and Manufacturing 3,975 2,235 1,251 7,461 1.88
Employment
All Agriculture and Forestry 107,530 40,450 40,660 188,640 1.8
Production 78,860 16,400 22,650 117,910 1.5
Processing and Manufacturing 28,670 24,050 18,010 70,730 2.5
6 3 Beyond the Farm, March 2015
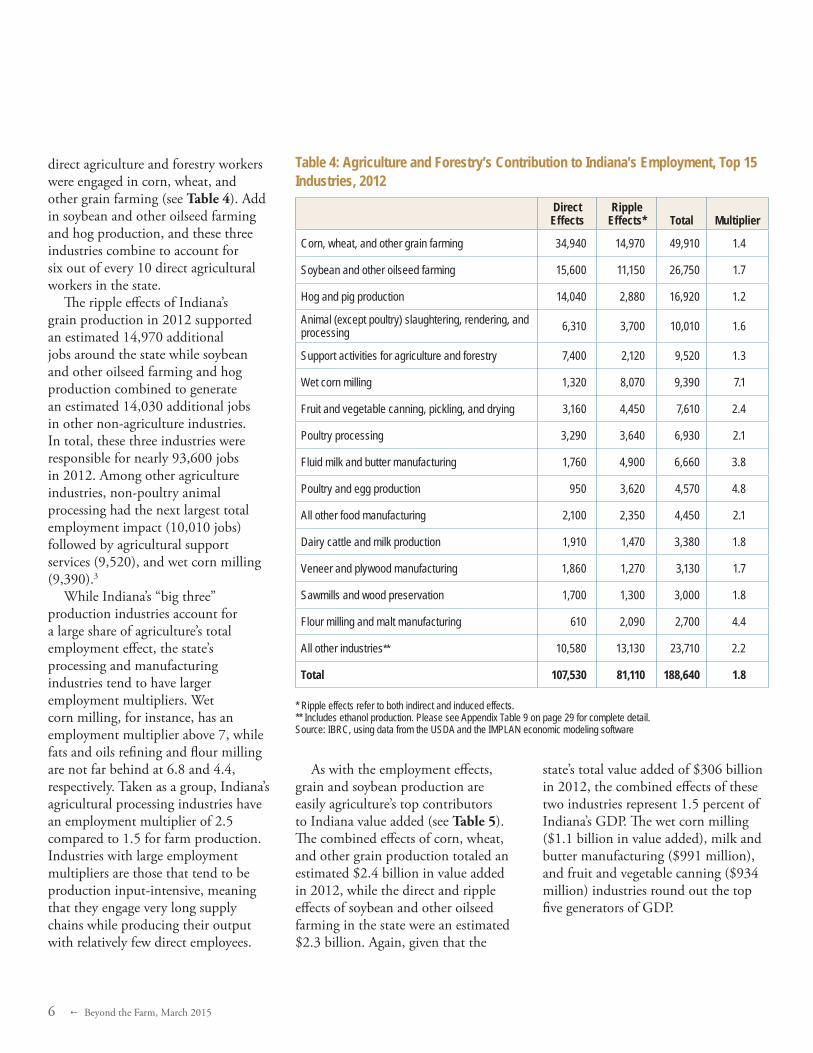
direct agriculture and forestry workers were engaged in corn, wheat, and other grain farming (see Table 4). Add in soybean and other oilseed farming and hog production, and these three industries combine to account for six out of every 10 direct agricultural workers in the state.
The ripple effects of Indiana’s grain production in 2012 supported an estimated 14,970 additional jobs around the state while soybean and other oilseed farming and hog production combined to generate an estimated 14,030 additional jobs in other non-agriculture industries. In total, these three industries were responsible for nearly 93,600 jobs in 2012. Among other agriculture industries, non-poultry animal processing had the next largest total employment impact (10,010 jobs) followed by agricultural support services (9,520), and wet corn milling (9,390).3
While Indiana’s “big three” production industries account for a large share of agriculture’s total employment effect, the state’s processing and manufacturing industries tend to have larger employment multipliers. Wet corn milling, for instance, has an employment multiplier above 7, while fats and oils refining and flour milling are not far behind at 6.8 and 4.4, respectively. Taken as a group, Indiana’s agricultural processing industries have an employment multiplier of 2.5 compared to 1.5 for farm production. Industries with large employment multipliers are those that tend to be production input-intensive, meaning that they engage very long supply chains while producing their output with relatively few direct employees.
As with the employment effects, grain and soybean production are easily agriculture’s top contributors to Indiana value added (see Table 5). The combined effects of corn, wheat, and other grain production totaled an estimated $2.4 billion in value added in 2012, while the direct and ripple effects of soybean and other oilseed farming in the state were an estimated $2.3 billion. Again, given that the
state’s total value added of $306 billion in 2012, the combined effects of these two industries represent 1.5 percent of Indiana’s GDP. The wet corn milling ($1.1 billion in value added), milk and butter manufacturing ($991 million), and fruit and vegetable canning ($934 million) industries round out the top five generators of GDP.
Table 4: Agriculture and Forestry’s Contribution to Indiana’s Employment, Top 15 Industries, 2012
* Ripple effects refer to both indirect and induced effects.** Includes ethanol production. Please see Appendix Table 9 on page 29 for complete detail.Source: IBRC, using data from the USDA and the IMPLAN economic modeling software
Direct Effects
Ripple Effects* Total Multiplier
Corn, wheat, and other grain farming 34,940 14,970 49,910 1.4
Soybean and other oilseed farming 15,600 11,150 26,750 1.7
Hog and pig production 14,040 2,880 16,920 1.2
Animal (except poultry) slaughtering, rendering, and processing 6,310 3,700 10,010 1.6
Support activities for agriculture and forestry 7,400 2,120 9,520 1.3
Wet corn milling 1,320 8,070 9,390 7.1
Fruit and vegetable canning, pickling, and drying 3,160 4,450 7,610 2.4
Poultry processing 3,290 3,640 6,930 2.1
Fluid milk and butter manufacturing 1,760 4,900 6,660 3.8
Poultry and egg production 950 3,620 4,570 4.8
All other food manufacturing 2,100 2,350 4,450 2.1
Dairy cattle and milk production 1,910 1,470 3,380 1.8
Veneer and plywood manufacturing 1,860 1,270 3,130 1.7
Sawmills and wood preservation 1,700 1,300 3,000 1.8
Flour milling and malt manufacturing 610 2,090 2,700 4.4
All other industries** 10,580 13,130 23,710 2.2
Total 107,530 81,110 188,640 1.8

Beyond the Farm, March 2015 4 7
Contributions to Government RevenuesThe economic activity created by Indiana’s agriculture and forestry industries also generates federal, state and local government revenues. The IMPLAN model estimates the tax revenues from corporate profits, indirect business taxes (e.g., sales, property and excise taxes), personal taxes (e.g., income and property taxes), and employer and employee contributions to social insurance. The largest share of federal revenue comes from contributions to social insurance through employee compensation. At the state and local level, indirect business taxes are the largest source of government revenue. As Table 6 shows, the economic activity related to Indiana agriculture and forestry generated an estimated $911 million in state and local revenue in 2012 and over $1.6 billion in federal collections.
Agriculture’s Impact in Indiana RegionsWhen it comes to the economic impacts of agriculture, there is quite a bit of variation between different regions of the state. The Central, North Central and Northeast regions (see Figure 2 for reference) generate the greatest contributions to the Indiana economy. The Southwest region is also a strong contributor, particularly in the agricultural processing and
Table 6: Tax Effects of Indiana’s Agriculture and Forestry, 2012 ($ million)
Source: IBRC, using data from the USDA and the IMPLAN economic modeling software
Employee
CompensationProprietary
IncomeHousehold
ExpendituresEnterprises
(Corporations)Indirect Business
Tax Total
Federal 550.1 101.1 458.7 416.4 95.0 1,621.4
State and Local 5.1 0.0 216.8 42.0 647.5 911.3
Table 5: Agriculture and Forestry’s Contribution to Indiana’s Value Added, Top 15 Industries, 2012
* Ripple effects refer to both indirect and induced effects.** Please see Appendix Table 9 on page 29 for complete detail.Source: IBRC, using data from the USDA and the IMPLAN economic modeling software
Direct Effects
($ million)Ripple Effects*
($ million)Total
($ million) Multiplier
Corn, wheat, and other grain farming 954 1,431 2,385 2.50
Soybean and other oilseed farming 1,323 941 2,264 1.71
Wet corn milling 440 695 1,135 2.58
Fluid milk and butter manufacturing 593 398 991 1.67
Fruit and vegetable canning, pickling, and drying 540 394 934 1.73
Hog and pig production 668 239 907 1.36
Poultry processing 396 286 681 1.72
Poultry and egg production 223 343 566 2.54
Fats and oils refining and blending 344 179 523 1.52
Animal (except poultry) slaughtering, rendering, and processing 229 277 506 2.21
All other food manufacturing 266 187 453 1.70
Dairy cattle and milk production 262 145 407 1.55
Support activities for agriculture and forestry 214 155 370 1.72
Flour milling and malt manufacturing 142 190 332 2.34
Ethanol production 176 94 270 1.54
All other industries** 1,160 1,024 2,184 1.88
Total 7,930 6,978 14,908 1.88

8 3 Beyond the Farm, March 2015
manufacturing industries. Meanwhile, with a relative lack of high-quality farmland, the South Central and Southeast regions are the least agriculturally productive regions of the state.
Table 7 presents the value added and employment effects of agriculture in each USDA-defined crop reporting district. The Central region leads all areas in both categories, contributing slightly more than $4.3 billion in total GDP to the district and supporting an estimated 43,840 total jobs. Not only is the Central region a strong agricultural producer, but it’s also the state’s most populous and economically diverse area, which explains the large multiplier effects. The North Central and Northeast regions place second and third, respectively, in each measure. Together, these top three regions account for 58 percent of the value added that agriculture generates in Indiana and 56 percent of the jobs.
For a more complete look at the impact of agriculture in each region, see the district-specific fact sheets beginning on page 10 of this report.
Agriculture’s Impact in Indiana Congressional DistrictsAs with the crop reporting districts, there are wide disparities in the economic contributions of agriculture in Indiana’s congressional districts. The combined effects of agriculture in the state’s District 4 (see Figure 3 for reference) produce nearly $2.7 billion in value added and support roughly 33,600 jobs. Both of these estimates rank at the top of Indiana’s congressional districts (see Table 8). District 8 provides the second-largest contribution to GDP, while District 3 boasts the second-highest jobs tally. As largely urban districts, Districts 1 and 7 rank near the bottom in both categories, although
Table 7: Value Added and Employment Effects by Crop Reporting District, 2012
Source: IBRC, using data from the USDA and the IMPLAN economic modeling software
Value Added ($ million) Employment
Region (CRD)Direct Effects
Total Effects Multiplier
Direct Effects
Total Effects Multiplier
Northwest (10) 841 1,413 1.68 9,850 16,589 1.7
North Central (20) 1,206 2,038 1.69 18,880 29,287 1.6
Northeast (30) 1,042 1,738 1.67 16,720 25,519 1.5
West (40) 606 1,018 1.68 8,280 13,450 1.6
Central (50) 2,203 4,327 1.96 20,360 43,844 2.2
East (60) 505 958 1.90 6,610 11,565 1.7
Southwest (70) 972 1,656 1.70 11,950 20,256 1.7
South Central (80) 293 438 1.49 7,210 9,240 1.3
Southeast (90) 242 351 1.45 6,010 7,410 1.2
Figure 2: Indiana’s USDA Crop Reporting Districts
Central(CRD 50)
Southwest(CRD 70)
Northwest(CRD 10)
West(CRD 40)
SouthCentral(CRD 80)
NorthCentral(CRD 20)
Northeast(CRD 30)
Southeast(CRD 90)
East(CRD 60)
Source: USDA

Beyond the Farm, March 2015 4 9
the manufacturing-heavy nature of agricultural activities in District 7 produces a large employment multiplier effect for that area.
The congressional district fact sheets, which begin on page 19, provide an in-depth look at the economic effects of agriculture in each area.
ConclusionThe importance of agriculture to the Indiana economy is clear. The combined effects of agriculture industries support an estimated 188,600 jobs in the state and create $14.9 billion in value added—an amount equal to nearly 5 percent of Indiana’s total GDP. Keep in mind that Indiana’s farmers and agriculture-related manufacturers generated these impressive numbers during a tough year plagued by a severe drought. These impacts would likely be higher during a more typical year.
The findings in this report demonstrate that efforts to support, or even expand, Indiana’s agricultural production and processing can have positive ripple effects throughout the state’s economy. This is especially true in regions of the state that are facing declines in other key industries. Therefore, the degree to which agriculture is able to contribute to Indiana’s economic growth going forward will be an important economic indicator for the state.
Notes1. See “Defining Agriculture and Forestry” on
page 28 in the appendix for an explanation of how the research team selected the processing and manufacturing industries included in this analysis.
2. See “Key Terms” on page 29 in the appendix for a more detailed explanation of some of the terminology used in this report.
3. See “Table 9: Total Economic and Employment Contributions of Each Agriculture and Forestry Industry, 2012” on page 29 for a listing of total economic and employment contributions for each industry considered in this analysis.
Table 8: Value Added and Employment Effects by Congressional District, 2012
Source: IBRC, using data from the USDA and the IMPLAN economic modeling software
Value Added ($ million) Employment
Congressional DistrictDirect Effects
Total Effects Multiplier
Direct Effects
Total Effects Multiplier
District 1 284 509 1.80 3,140 5,840 1.9
District 2 1,077 1,763 1.64 15,290 23,808 1.6
District 3 1,141 1,855 1.63 18,740 27,915 1.5
District 4 1,541 2,664 1.73 19,640 33,606 1.7
District 5 892 1,540 1.73 7,630 14,485 1.9
District 6 879 1,348 1.53 15,720 21,901 1.4
District 7 551 1,010 1.83 2,610 7,190 2.8
District 8 1,136 1,942 1.71 15,850 25,850 1.6
District 9 422 682 1.62 9,780 13,330 1.4
Figure 3: Indiana Congressional Districts
Source: Indiana Business Research Center
8
4
6
9
32
5
1
7

10 3 Beyond the Farm, March 2015
Economic contributions of AgriculturE
The agriculture- and forestry-related establishments in Indiana’s Crop Reporting
District 10 generated an estimated $3.2 billion in direct economic output (i.e., sales) in 2012. Approximately 57 percent of this total was generated by commodity production from the district’s farms and forests, while agriculture-related processing and manufacturing accounted for the remaining 43 percent of direct output. Adding in the economic ripple effects initiated by the sale of agricultural products, the total economic footprint of agriculture and forestry industries in the district was $4.3 billion.
In 2012, agricultural activities in District 10 generated an estimated total of $1.4 billion in value added—a measure that highlights agriculture’s contribution to GDP. The ratio of total value added to the direct effect yields a multiplier of 1.68, meaning that every dollar of GDP directly related to agriculture in District 10 generates an additional $0.68 in economic activity elsewhere in the district.
As for employment, more than 16,580 jobs in District 10 were supported either directly or
indirectly by agriculture in 2012. The employment multiplier of 1.7 indicates that every 10 agricultural jobs in District 10 generate another seven jobs in other industries in the area.
Among individual agricultural industries, corn, wheat, and other grain farming supported the greatest number of jobs in District 10 at an estimated 6,950 in 2012, which accounted for nearly 42 percent of agriculture’s total employment impact in the district.
Soybean and other oilseed farming was the district’s second-largest job producer with a total impact of 2,240 jobs. Corn, wheat, and other grain farming generated the largest contribution to GDP in District 10 with an estimated total value added impact of $389 million.
Direct Effects Ripple Effects Total MultiplierTotal Output ($ million)All Agriculture and Forestry 3,173 1,142 4,315 1.36
Production 1,819 827 2,646 1.45 Processing and Manufacturing 1,354 315 1,669 1.23
Value Added ($ million)All Agriculture and Forestry 841 571 1,413 1.68
Production 588 395 983 1.67 Processing and Manufacturing 254 176 430 1.70
EmploymentAll Agriculture and Forestry 9,850 6,739 16,589 1.7
Production 8,370 4,620 12,990 1.6 Processing and Manufacturing 1,480 2,119 3,599 2.4
Crop Reporting District 10
The Economic Contributions of Agriculture and Forestry to Indiana’s Crop Reporting District 10, 2012
Industry
Employment Effects Value Added Effects ($ million)
Direct Effects
Ripple Effects Total Multiplier
Direct Effects
Ripple Effects Total Multiplier
Corn, wheat, and other grain farming 4,730 2,220 6,950 1.5 191 199 389 2.04Soybean and other oilseed farming 1,200 1,040 2,240 1.9 158 80 238 1.51Hog and pig production 1,038 336 1,374 1.3 83 26 109 1.32Wet corn milling 260 1,090 1,350 5.2 87 94 181 2.08Support activities for agriculture and forestry 860 130 990 1.2 13 9 22 1.73All other industries 1,762 1,923 3,685 2.1 311 163 474 1.53
Agriculture and Forestry’s Economic Contribution in Crop Reporting District 10, 2012, Top 5 Industries
Source: IBRC, using data from the USDA and the IMPLAN economic modeling software
Source: IBRC, using data from the USDA and the IMPLAN economic modeling software
Beyond the Farm, March 2015 4 11
Economic contributions of AgriculturE
The agriculture- and forestry-related establishments in Indiana’s Crop Reporting
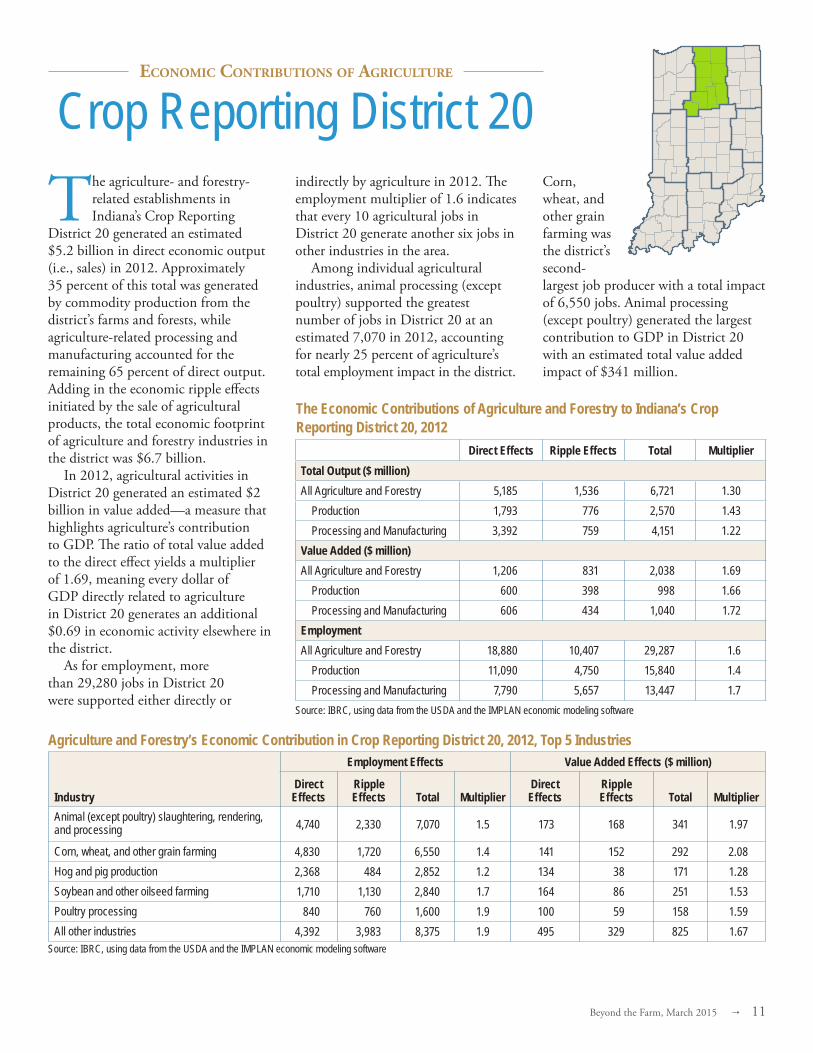
District 20 generated an estimated $5.2 billion in direct economic output (i.e., sales) in 2012. Approximately 35 percent of this total was generated by commodity production from the district’s farms and forests, while agriculture-related processing and manufacturing accounted for the remaining 65 percent of direct output. Adding in the economic ripple effects initiated by the sale of agricultural products, the total economic footprint of agriculture and forestry industries in the district was $6.7 billion.
In 2012, agricultural activities in District 20 generated an estimated $2 billion in value added—a measure that highlights agriculture’s contribution to GDP. The ratio of total value added to the direct effect yields a multiplier of 1.69, meaning every dollar of GDP directly related to agriculture in District 20 generates an additional $0.69 in economic activity elsewhere in the district.
As for employment, more than 29,280 jobs in District 20 were supported either directly or
indirectly by agriculture in 2012. The employment multiplier of 1.6 indicates that every 10 agricultural jobs in District 20 generate another six jobs in other industries in the area.
Among individual agricultural industries, animal processing (except poultry) supported the greatest number of jobs in District 20 at an estimated 7,070 in 2012, accounting for nearly 25 percent of agriculture’s total employment impact in the district.
Corn, wheat, and other grain farming was the district’s second-largest job producer with a total impact of 6,550 jobs. Animal processing (except poultry) generated the largest contribution to GDP in District 20 with an estimated total value added impact of $341 million.
Direct Effects Ripple Effects Total MultiplierTotal Output ($ million)All Agriculture and Forestry 5,185 1,536 6,721 1.30
Production 1,793 776 2,570 1.43 Processing and Manufacturing 3,392 759 4,151 1.22
Value Added ($ million)All Agriculture and Forestry 1,206 831 2,038 1.69
Production 600 398 998 1.66 Processing and Manufacturing 606 434 1,040 1.72
EmploymentAll Agriculture and Forestry 18,880 10,407 29,287 1.6
Production 11,090 4,750 15,840 1.4 Processing and Manufacturing 7,790 5,657 13,447 1.7
Crop Reporting District 20
The Economic Contributions of Agriculture and Forestry to Indiana’s Crop Reporting District 20, 2012
Industry
Employment Effects Value Added Effects ($ million)
Direct Effects
Ripple Effects Total Multiplier
Direct Effects
Ripple Effects Total Multiplier
Animal (except poultry) slaughtering, rendering, and processing 4,740 2,330 7,070 1.5 173 168 341 1.97
Corn, wheat, and other grain farming 4,830 1,720 6,550 1.4 141 152 292 2.08Hog and pig production 2,368 484 2,852 1.2 134 38 171 1.28Soybean and other oilseed farming 1,710 1,130 2,840 1.7 164 86 251 1.53Poultry processing 840 760 1,600 1.9 100 59 158 1.59All other industries 4,392 3,983 8,375 1.9 495 329 825 1.67
Agriculture and Forestry’s Economic Contribution in Crop Reporting District 20, 2012, Top 5 Industries
Source: IBRC, using data from the USDA and the IMPLAN economic modeling software
Source: IBRC, using data from the USDA and the IMPLAN economic modeling software
12 3 Beyond the Farm, March 2015
Economic contributions of AgriculturE
The agriculture- and forestry-related establishments in Indiana’s Crop Reporting
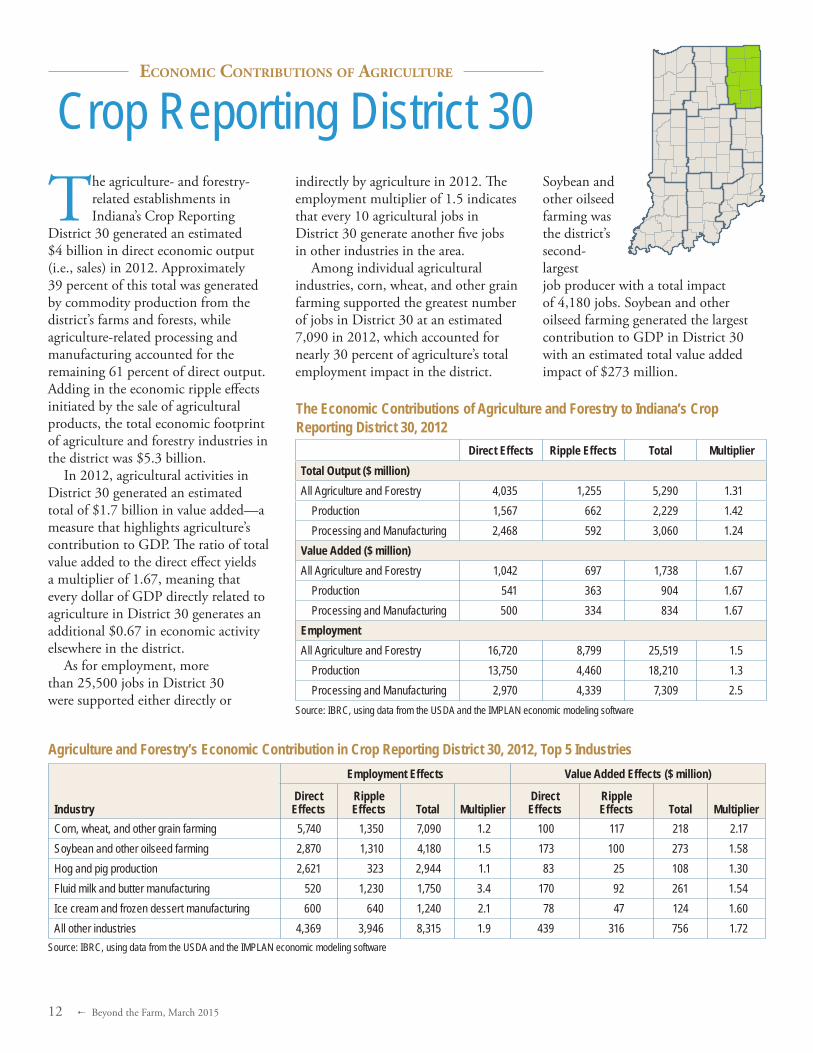
District 30 generated an estimated $4 billion in direct economic output (i.e., sales) in 2012. Approximately 39 percent of this total was generated by commodity production from the district’s farms and forests, while agriculture-related processing and manufacturing accounted for the remaining 61 percent of direct output. Adding in the economic ripple effects initiated by the sale of agricultural products, the total economic footprint of agriculture and forestry industries in the district was $5.3 billion.
In 2012, agricultural activities in District 30 generated an estimated total of $1.7 billion in value added—a measure that highlights agriculture’s contribution to GDP. The ratio of total value added to the direct effect yields a multiplier of 1.67, meaning that every dollar of GDP directly related to agriculture in District 30 generates an additional $0.67 in economic activity elsewhere in the district.
As for employment, more than 25,500 jobs in District 30 were supported either directly or
indirectly by agriculture in 2012. The employment multiplier of 1.5 indicates that every 10 agricultural jobs in District 30 generate another five jobs in other industries in the area.
Among individual agricultural industries, corn, wheat, and other grain farming supported the greatest number of jobs in District 30 at an estimated 7,090 in 2012, which accounted for nearly 30 percent of agriculture’s total employment impact in the district.
Soybean and other oilseed farming was the district’s second-largest job producer with a total impact of 4,180 jobs. Soybean and other oilseed farming generated the largest contribution to GDP in District 30 with an estimated total value added impact of $273 million.
Direct Effects Ripple Effects Total MultiplierTotal Output ($ million)All Agriculture and Forestry 4,035 1,255 5,290 1.31
Production 1,567 662 2,229 1.42 Processing and Manufacturing 2,468 592 3,060 1.24
Value Added ($ million)All Agriculture and Forestry 1,042 697 1,738 1.67
Production 541 363 904 1.67 Processing and Manufacturing 500 334 834 1.67
EmploymentAll Agriculture and Forestry 16,720 8,799 25,519 1.5
Production 13,750 4,460 18,210 1.3 Processing and Manufacturing 2,970 4,339 7,309 2.5
Crop Reporting District 30
The Economic Contributions of Agriculture and Forestry to Indiana’s Crop Reporting District 30, 2012
Industry
Employment Effects Value Added Effects ($ million)
Direct Effects
Ripple Effects Total Multiplier
Direct Effects
Ripple Effects Total Multiplier
Corn, wheat, and other grain farming 5,740 1,350 7,090 1.2 100 117 218 2.17Soybean and other oilseed farming 2,870 1,310 4,180 1.5 173 100 273 1.58Hog and pig production 2,621 323 2,944 1.1 83 25 108 1.30Fluid milk and butter manufacturing 520 1,230 1,750 3.4 170 92 261 1.54Ice cream and frozen dessert manufacturing 600 640 1,240 2.1 78 47 124 1.60All other industries 4,369 3,946 8,315 1.9 439 316 756 1.72
Agriculture and Forestry’s Economic Contribution in Crop Reporting District 30, 2012, Top 5 Industries
Source: IBRC, using data from the USDA and the IMPLAN economic modeling software
Source: IBRC, using data from the USDA and the IMPLAN economic modeling software

Beyond the Farm, March 2015 4 13
Economic contributions of AgriculturE
The agriculture- and forestry-related establishments in Indiana’s Crop Reporting
District 40 generated an estimated $2.9 billion in direct economic output (i.e., sales) in 2012. Approximately 32 percent of this total was generated by commodity production from the district’s farms and forests, while agriculture-related processing and manufacturing accounted for the remaining 68 percent of direct output. Adding in the economic ripple effects initiated by the sale of agricultural products, the total economic footprint of agriculture and forestry industries in the district was $3.6 billion.
In 2012, agricultural activities in District 40 generated an estimated total of $1 billion in value added—a measure that highlights agriculture’s contribution to GDP. The ratio of total value added to the direct effect yields a multiplier of 1.68, meaning that every dollar of GDP directly related to agriculture in District 40 generates an additional $0.68 in economic activity elsewhere in the district.
As for employment, more than 13,400 jobs in District 40 were supported either directly or
indirectly by agriculture in 2012. The employment multiplier of 1.6 indicates that every 10 agricultural jobs in District 40 generate another six jobs in other industries in the area.
Among individual agricultural industries, corn, wheat, and other grain farming supported the greatest number of jobs in District 40 at an estimated 4,510 in 2012, which accounted for more than 30 percent of agriculture’s total employment impact in the
district. Soybean and other oilseed farming was the district’s second-largest job producer with a total impact of 2,300 jobs. Wet corn milling generated the largest contribution to GDP in District 40 with an estimated total value added impact of $303 million.
Direct Effects Ripple Effects Total MultiplierTotal Output ($ million)All Agriculture and Forestry 2,850 701 3,551 1.25
Production 908 314 1,222 1.35 Processing and Manufacturing 1,942 387 2,329 1.20
Value Added ($ million)All Agriculture and Forestry 606 412 1,018 1.68
Production 314 193 507 1.62 Processing and Manufacturing 292 219 511 1.75
EmploymentAll Agriculture and Forestry 8,280 5,170 13,450 1.6
Production 6,330 2,370 8,700 1.4 Processing and Manufacturing 1,950 2,800 4,750 2.4
Crop Reporting District 40
The Economic Contributions of Agriculture and Forestry to Indiana’s Crop Reporting District 40, 2012
Industry
Employment Effects Value Added Effects ($ million)
Direct Effects
Ripple Effects Total Multiplier
Direct Effects
Ripple Effects Total Multiplier
Corn, wheat, and other grain farming 3,380 1,130 4,510 1.3 101 98 200 1.97Soybean and other oilseed farming 1,420 880 2,300 1.6 139 67 206 1.49Wet corn milling 480 1,790 2,270 4.7 158 144 303 1.91Support activities for agriculture and forestry 680 120 800 1.2 14 8 22 1.57Hog and pig production 658 114 772 1.2 35 9 44 1.26All other industries 1,662 1,136 2,798 1.7 158 85 244 1.54
Agriculture and Forestry’s Economic Contribution in Crop Reporting District 40, 2012, Top 5 Industries
Source: IBRC, using data from the USDA and the IMPLAN economic modeling software
Source: IBRC, using data from the USDA and the IMPLAN economic modeling software

14 3 Beyond the Farm, March 2015
Economic contributions of AgriculturE
The agriculture- and forestry-related establishments in Indiana’s Crop Reporting
District 50 generated an estimated $8.7 billion in direct economic output (i.e., sales) in 2012. Approximately 24 percent of this total was generated by commodity production from the district’s farms and forests, while agriculture-related processing and manufacturing accounted for the remaining 76 percent of direct output. Adding in the economic ripple effects initiated by the sale of agricultural products, the total economic footprint of agriculture and forestry industries in the district was $12.2 billion.
In 2012, agricultural activities in District 50 generated an estimated total of $4.3 billion in value added—a measure that highlights agriculture’s contribution to GDP. The ratio of total value added to the direct effect yields a multiplier of 1.96, meaning that every dollar of GDP directly related to agriculture in District 50 generates an additional $0.96 in economic activity elsewhere in the district.
As for employment, more than 43,840 jobs in District 50 were supported either directly or
indirectly by agriculture in 2012. The employment multiplier of 2.2 indicates that every 10 agricultural jobs in District 50 generate another 12 jobs in other industries in the area.
Among individual agricultural industries, corn, wheat, and other grain farming supported the greatest number of jobs in District 50 at an estimated 9,700 in 2012, which accounted for more than 20 percent of agriculture’s total employment impact in the
district. Soybean and other oilseed farming was the district’s second-largest job producer with a total impact of 5,830 jobs. Soybean and other oilseed farming generated the largest contribution to GDP in District 50 with an estimated total value added impact of $557 million.
Direct Effects Ripple Effects Total MultiplierTotal Output ($ million)All Agriculture and Forestry 8,657 3,583 12,240 1.41
Production 2,101 1,261 3,362 1.60 Processing and Manufacturing 6,556 2,322 8,877 1.35
Value Added ($ million)All Agriculture and Forestry 2,203 2,123 4,327 1.96
Production 780 754 1,534 1.97 Processing and Manufacturing 1,424 1,369 2,793 1.96
EmploymentAll Agriculture and Forestry 20,360 23,484 43,844 2.2
Production 13,380 8,240 21,620 1.6 Processing and Manufacturing 6,980 15,244 22,224 3.2
Crop Reporting District 50
The Economic Contributions of Agriculture and Forestry to Indiana’s Crop Reporting District 50, 2012
Industry
Employment Effects Value Added Effects ($ million)
Direct Effects
Ripple Effects Total Multiplier
Direct Effects
Ripple Effects Total Multiplier
Corn, wheat, and other grain farming 6,220 3,480 9,700 1.6 194 339 533 2.75Soybean and other oilseed farming 3,020 2,810 5,830 1.9 308 249 557 1.81Wet corn milling 510 3,580 4,090 8.0 172 327 499 2.90Fruit and vegetable canning, pickling, and drying 1,460 2,320 3,780 2.6 260 222 481 1.85Fluid milk and butter manufacturing 730 2,320 3,050 4.2 258 200 458 1.78All other industries 8,420 8,974 17,394 2.1 1,012 786 1,799 1.78
Agriculture and Forestry’s Economic Contribution in Crop Reporting District 50, 2012, Top 5 Industries
Source: IBRC, using data from the USDA and the IMPLAN economic modeling software
Source: IBRC, using data from the USDA and the IMPLAN economic modeling software

Beyond the Farm, March 2015 4 15
Economic contributions of AgriculturE
The agriculture- and forestry-related establishments in Indiana’s Crop Reporting
District 60 generated an estimated $1.6 billion in direct economic output (i.e., sales) in 2012. Approximately 62 percent of this total was generated by commodity production from the district’s farms and forests, while agriculture-related processing and manufacturing accounted for the remaining 38 percent of direct output. Adding in the economic ripple effects initiated by the sale of agricultural products, the total economic footprint of agriculture and forestry industries in the district was $2.1 billion.
In 2012, agricultural activities in District 60 generated an estimated total of $763 million in value added—a measure that highlights agriculture’s contribution to GDP. The ratio of total value added to the direct effect yields a multiplier of 1.51, meaning that every dollar of GDP directly related to agriculture in District 60 generates an additional $0.51 in economic activity elsewhere in the district.
As for employment, more than 10,850 jobs in District 60 were supported either directly or
indirectly by agriculture in 2012. The employment multiplier of 1.5 indicates that every 10 agricultural jobs in District 60 generate another five jobs in other industries in the area.
Among individual agricultural industries, corn, wheat, and other grain farming supported the greatest number of jobs in District 60 at an estimated 3,530 in 2012, which accounted for 30 percent of agriculture’s total employment impact in the district.
Soybean and other oilseed farming was the district’s second-largest job producer with a total impact of 2,380 jobs. Soybean and other oilseed farming generated the largest contribution to GDP in District 60 with an estimated total value added impact of $190 million.
Direct Effects Ripple Effects Total MultiplierTotal Output ($ million)All Agriculture and Forestry 1,638 487 2,125 1.30
Production 1,022 370 1,392 1.36 Processing and Manufacturing 616 117 733 1.19
Value Added ($ million)All Agriculture and Forestry 504 259 763 1.51
Production 372 197 569 1.53 Processing and Manufacturing 132 62 194 1.48
EmploymentAll Agriculture and Forestry 7,490 3,365 10,855 1.5
Production 6,570 2,520 9,090 1.4 Processing and Manufacturing 920 845 1,765 1.9
Crop Reporting District 60
The Economic Contributions of Agriculture and Forestry to Indiana’s Crop Reporting District 60, 2012
Industry
Employment Effects Value Added Effects ($ million)
Direct Effects
Ripple Effects Total Multiplier
Direct Effects
Ripple Effects Total Multiplier
Corn, wheat, and other grain farming 2,800 730 3,530 1.3 70 59 129 1.85Soybean and other oilseed farming 1,560 820 2,380 1.5 132 58 190 1.44Hog and pig production 1,380 424 1,804 1.3 93 37 129 1.39Support activities for agriculture and forestry 530 140 670 1.3 20 9 29 1.46Fluid milk and butter manufacturing 150 270 420 2.8 50 20 69 1.40All other industries 1,070 981 2,051 1.9 140 76 216 1.55
Agriculture and Forestry’s Economic Contribution in Crop Reporting District 60, 2012, Top 5 Industries
Source: IBRC, using data from the USDA and the IMPLAN economic modeling software
Source: IBRC, using data from the USDA and the IMPLAN economic modeling software
16 3 Beyond the Farm, March 2015
Economic contributions of AgriculturE
The agriculture- and forestry-related establishments in Indiana’s Crop Reporting
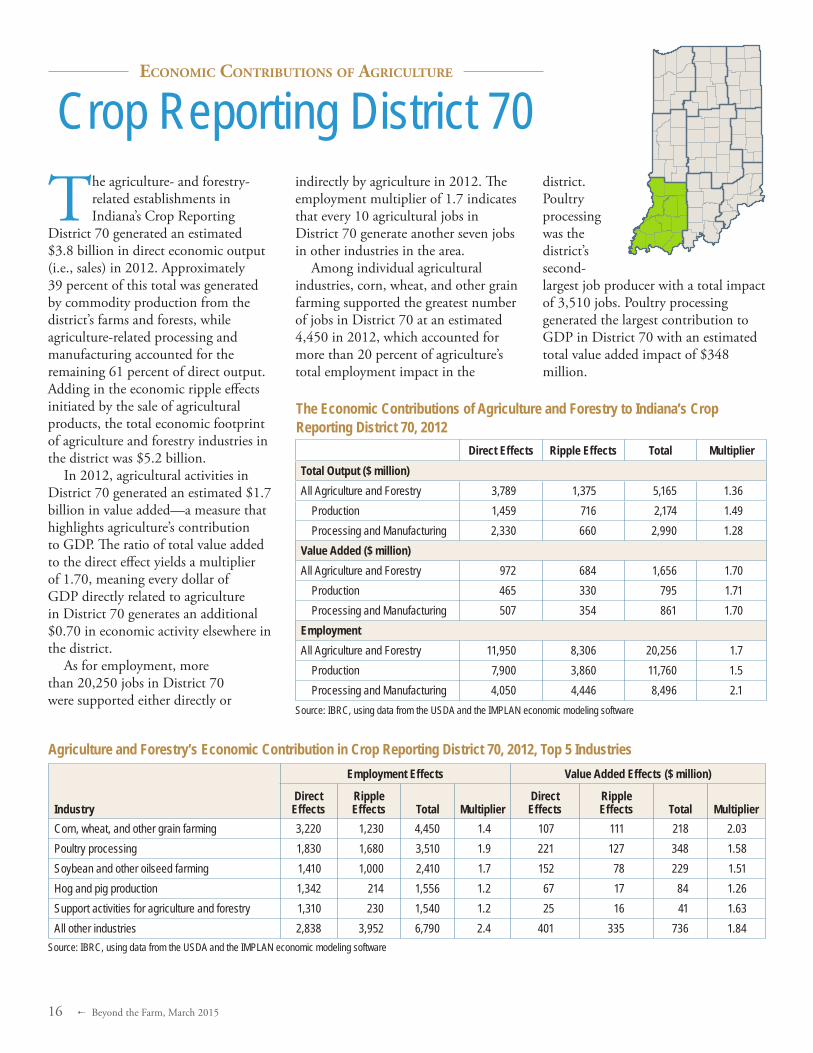
District 70 generated an estimated $3.8 billion in direct economic output (i.e., sales) in 2012. Approximately 39 percent of this total was generated by commodity production from the district’s farms and forests, while agriculture-related processing and manufacturing accounted for the remaining 61 percent of direct output. Adding in the economic ripple effects initiated by the sale of agricultural products, the total economic footprint of agriculture and forestry industries in the district was $5.2 billion.
In 2012, agricultural activities in District 70 generated an estimated $1.7 billion in value added—a measure that highlights agriculture’s contribution to GDP. The ratio of total value added to the direct effect yields a multiplier of 1.70, meaning every dollar of GDP directly related to agriculture in District 70 generates an additional $0.70 in economic activity elsewhere in the district.
As for employment, more than 20,250 jobs in District 70 were supported either directly or
indirectly by agriculture in 2012. The employment multiplier of 1.7 indicates that every 10 agricultural jobs in District 70 generate another seven jobs in other industries in the area.
Among individual agricultural industries, corn, wheat, and other grain farming supported the greatest number of jobs in District 70 at an estimated 4,450 in 2012, which accounted for more than 20 percent of agriculture’s total employment impact in the
district. Poultry processing was the district’s second-largest job producer with a total impact of 3,510 jobs. Poultry processing generated the largest contribution to GDP in District 70 with an estimated total value added impact of $348 million.
Direct Effects Ripple Effects Total MultiplierTotal Output ($ million)All Agriculture and Forestry 3,789 1,375 5,165 1.36
Production 1,459 716 2,174 1.49 Processing and Manufacturing 2,330 660 2,990 1.28
Value Added ($ million)All Agriculture and Forestry 972 684 1,656 1.70
Production 465 330 795 1.71 Processing and Manufacturing 507 354 861 1.70
EmploymentAll Agriculture and Forestry 11,950 8,306 20,256 1.7
Production 7,900 3,860 11,760 1.5 Processing and Manufacturing 4,050 4,446 8,496 2.1
Crop Reporting District 70
The Economic Contributions of Agriculture and Forestry to Indiana’s Crop Reporting District 70, 2012
Industry
Employment Effects Value Added Effects ($ million)
Direct Effects
Ripple Effects Total Multiplier
Direct Effects
Ripple Effects Total Multiplier
Corn, wheat, and other grain farming 3,220 1,230 4,450 1.4 107 111 218 2.03Poultry processing 1,830 1,680 3,510 1.9 221 127 348 1.58Soybean and other oilseed farming 1,410 1,000 2,410 1.7 152 78 229 1.51Hog and pig production 1,342 214 1,556 1.2 67 17 84 1.26Support activities for agriculture and forestry 1,310 230 1,540 1.2 25 16 41 1.63All other industries 2,838 3,952 6,790 2.4 401 335 736 1.84
Agriculture and Forestry’s Economic Contribution in Crop Reporting District 70, 2012, Top 5 Industries
Source: IBRC, using data from the USDA and the IMPLAN economic modeling software
Source: IBRC, using data from the USDA and the IMPLAN economic modeling software

Beyond the Farm, March 2015 4 17
Economic contributions of AgriculturE
The agriculture- and forestry-related establishments in Indiana’s Crop Reporting
District 80 generated an estimated $1.1 billion in direct economic output (i.e., sales) in 2012. Approximately 52 percent of this total was generated by commodity production from the district’s farms and forests, while agriculture-related processing and manufacturing accounted for the remaining 48 percent of direct output. Adding in the economic ripple effects initiated by the sale of agricultural products, the total economic footprint of agriculture and forestry industries in the district was $1.3 billion.
In 2012, agricultural activities in District 80 generated an estimated total of $438 million in value added—a measure that highlights agriculture’s contribution to GDP. The ratio of total value added to the direct effect yields a multiplier of 1.49, meaning that every dollar of GDP directly related to agriculture in District 80 generates an additional $0.49 in economic activity elsewhere in the district.
As for employment, more than 9,200 jobs in District 80 were supported either directly or
indirectly by agriculture in 2012. The employment multiplier of 1.3 indicates that every 10 agricultural jobs in District 80 generate another three jobs in other industries in the area.
Among individual agricultural industries, corn, wheat, and other grain farming supported the greatest number of jobs in District 80 at an estimated 2,060 in 2012, which accounted for more than 20 percent of agriculture’s total employment impact in the
district. Soybean and other oilseed farming was the district’s second-largest job producer with a total impact of 1,390 jobs. Soybean and other oilseed farming generated the largest contribution to GDP in District 80 with an estimated total value added impact of $64 million.
Direct Effects Ripple Effects Total MultiplierTotal Output ($ million)All Agriculture and Forestry 1,057 257 1,314 1.24
Production 554 147 701 1.26 Processing and Manufacturing 503 110 613 1.22
Value Added ($ million)All Agriculture and Forestry 293 145 438 1.49
Production 162 82 245 1.51 Processing and Manufacturing 131 63 193 1.48
EmploymentAll Agriculture and Forestry 7,210 2,030 9,240 1.3
Production 5,610 1,130 6,740 1.2 Processing and Manufacturing 1,600 900 2,500 1.6
Crop Reporting District 80
The Economic Contributions of Agriculture and Forestry to Indiana’s Crop Reporting District 80, 2012
Industry
Employment Effects Value Added Effects ($ million)
Direct Effects
Ripple Effects Total Multiplier
Direct Effects
Ripple Effects Total Multiplier
Corn, wheat, and other grain farming 1,820 240 2,060 1.1 23 20 43 1.88Soybean and other oilseed farming 1,120 270 1,390 1.2 45 19 64 1.43Hog and pig production 1,186 57 1,243 1.0 24 4 28 1.17Veneer and plywood manufacturing 490 240 730 1.5 36 17 52 1.47Poultry processing 340 240 580 1.7 41 17 57 1.41All other industries 2,254 983 3,237 1.4 125 68 193 1.54
Agriculture and Forestry’s Economic Contribution in Crop Reporting District 80, 2012, Top 5 Industries
Source: IBRC, using data from the USDA and the IMPLAN economic modeling software
Source: IBRC, using data from the USDA and the IMPLAN economic modeling software
18 3 Beyond the Farm, March 2015
Economic contributions of AgriculturE
The agriculture- and forestry-related establishments in Indiana’s Crop Reporting
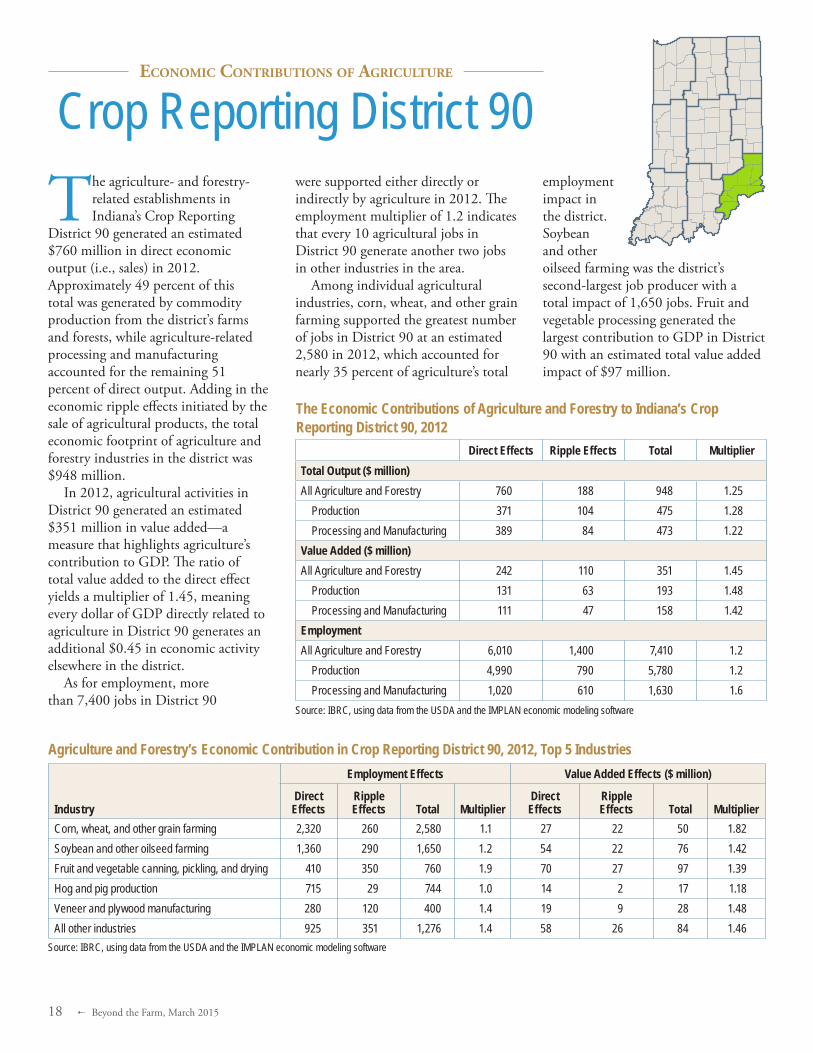
District 90 generated an estimated $760 million in direct economic output (i.e., sales) in 2012. Approximately 49 percent of this total was generated by commodity production from the district’s farms and forests, while agriculture-related processing and manufacturing accounted for the remaining 51 percent of direct output. Adding in the economic ripple effects initiated by the sale of agricultural products, the total economic footprint of agriculture and forestry industries in the district was $948 million.
In 2012, agricultural activities in District 90 generated an estimated $351 million in value added—a measure that highlights agriculture’s contribution to GDP. The ratio of total value added to the direct effect yields a multiplier of 1.45, meaning every dollar of GDP directly related to agriculture in District 90 generates an additional $0.45 in economic activity elsewhere in the district.
As for employment, more than 7,400 jobs in District 90
were supported either directly or indirectly by agriculture in 2012. The employment multiplier of 1.2 indicates that every 10 agricultural jobs in District 90 generate another two jobs in other industries in the area.
Among individual agricultural industries, corn, wheat, and other grain farming supported the greatest number of jobs in District 90 at an estimated 2,580 in 2012, which accounted for nearly 35 percent of agriculture’s total
employment impact in the district. Soybean and other oilseed farming was the district’s second-largest job producer with a total impact of 1,650 jobs. Fruit and vegetable processing generated the largest contribution to GDP in District 90 with an estimated total value added impact of $97 million.
Direct Effects Ripple Effects Total MultiplierTotal Output ($ million)All Agriculture and Forestry 760 188 948 1.25
Production 371 104 475 1.28 Processing and Manufacturing 389 84 473 1.22
Value Added ($ million)All Agriculture and Forestry 242 110 351 1.45
Production 131 63 193 1.48 Processing and Manufacturing 111 47 158 1.42
EmploymentAll Agriculture and Forestry 6,010 1,400 7,410 1.2
Production 4,990 790 5,780 1.2 Processing and Manufacturing 1,020 610 1,630 1.6
Crop Reporting District 90
The Economic Contributions of Agriculture and Forestry to Indiana’s Crop Reporting District 90, 2012
Industry
Employment Effects Value Added Effects ($ million)
Direct Effects
Ripple Effects Total Multiplier
Direct Effects
Ripple Effects Total Multiplier
Corn, wheat, and other grain farming 2,320 260 2,580 1.1 27 22 50 1.82Soybean and other oilseed farming 1,360 290 1,650 1.2 54 22 76 1.42Fruit and vegetable canning, pickling, and drying 410 350 760 1.9 70 27 97 1.39Hog and pig production 715 29 744 1.0 14 2 17 1.18Veneer and plywood manufacturing 280 120 400 1.4 19 9 28 1.48All other industries 925 351 1,276 1.4 58 26 84 1.46
Agriculture and Forestry’s Economic Contribution in Crop Reporting District 90, 2012, Top 5 Industries
Source: IBRC, using data from the USDA and the IMPLAN economic modeling software
Source: IBRC, using data from the USDA and the IMPLAN economic modeling software

Beyond the Farm, March 2015 4 19
Economic contributions of AgriculturE
The agriculture- and forestry-related establishments in Indiana’s Congressional District
1 generated an estimated $1.3 billion in direct economic output (i.e., sales) in 2012. Approximately 24 percent of this total was generated by commodity production from the district’s farms and forests, while agriculture-related processing and manufacturing accounted for the remaining 76 percent of direct output. Adding in the economic ripple effects initiated by the sale of agricultural products, the total economic footprint of agriculture and forestry industries in the district was $1.7 billion.
In 2012, agricultural activities in District 1 generated an estimated total of $509 million in value added—a measure that highlights agriculture’s contribution to GDP. The ratio of total value added to the direct effect yields a multiplier of 1.80, meaning that every dollar of GDP directly related to agriculture in District 1 generates an additional $0.80 in economic activity elsewhere in the district.
As for employment, more than 5,800 jobs in District 1 were supported either directly or indirectly by
agriculture in 2012. The employment multiplier of 1.9 indicates that every 10 agricultural jobs in District 1 generate another nine jobs in other industries in the area.
Among individual agricultural industries, corn, wheat, and other grain farming supported the greatest number of jobs in District 1 at an estimated 1,720 in 2012, which accounted for nearly 30 percent of agriculture’s total employment impact in the district.
Wet corn milling was the district’s second-largest job producer with a total impact of 1,440 jobs. Wet corn milling generated the largest contribution to GDP in District 1 with an estimated total value added impact of $190 million.
Direct Effects Ripple Effects Total MultiplierTotal Output ($ million)All Agriculture and Forestry 1,277 419 1,697 1.33
Production 311 137 448 1.44 Processing and Manufacturing 967 282 1,249 1.29
Value Added ($ million)All Agriculture and Forestry 284 226 509 1.80
Production 104 73 177 1.70 Processing and Manufacturing 180 153 332 1.85
EmploymentAll Agriculture and Forestry 3,140 2,700 5,840 1.9
Production 2,320 920 3,240 1.4 Processing and Manufacturing 820 1,780 2,600 3.2
Congressional District 1
The Economic Contributions of Agriculture and Forestry to Indiana’s Congressional District 1, 2012
Industry
Employment Effects Value Added Effects ($ million)
Direct Effects
Ripple Effects Total Multiplier
Direct Effects
Ripple Effects Total Multiplier
Corn, wheat, and other grain farming 1,290 430 1,720 1.3 36 37 73 2.02Wet corn milling 260 1,180 1,440 5.5 87 103 190 2.18Soybean and other oilseed farming 460 290 750 1.6 43 22 65 1.52Non-chocolate confectionery manufacturing 320 300 620 1.9 50 25 75 1.51Support activities for agriculture and forestry 370 60 430 1.2 5 4 9 1.78All other industries 440 440 880 2.0 64 35 98 1.55
Agriculture and Forestry’s Economic Contribution in Congressional District 1, 2012, Top 5 Industries
Source: IBRC, using data from the USDA and the IMPLAN economic modeling software
Source: IBRC, using data from the USDA and the IMPLAN economic modeling software
20 3 Beyond the Farm, March 2015
Economic contributions of AgriculturE
The agriculture- and forestry-related establishments in Indiana’s Congressional District
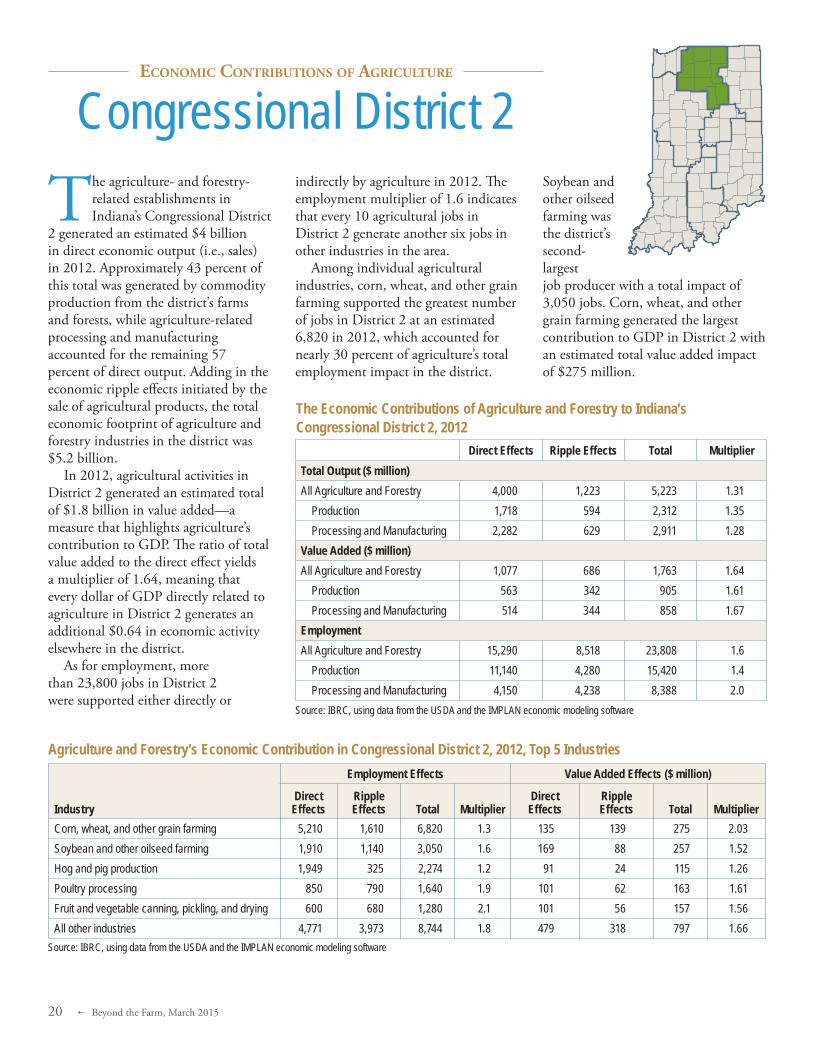
2 generated an estimated $4 billion in direct economic output (i.e., sales) in 2012. Approximately 43 percent of this total was generated by commodity production from the district’s farms and forests, while agriculture-related processing and manufacturing accounted for the remaining 57 percent of direct output. Adding in the economic ripple effects initiated by the sale of agricultural products, the total economic footprint of agriculture and forestry industries in the district was $5.2 billion.
In 2012, agricultural activities in District 2 generated an estimated total of $1.8 billion in value added—a measure that highlights agriculture’s contribution to GDP. The ratio of total value added to the direct effect yields a multiplier of 1.64, meaning that every dollar of GDP directly related to agriculture in District 2 generates an additional $0.64 in economic activity elsewhere in the district.
As for employment, more than 23,800 jobs in District 2 were supported either directly or
indirectly by agriculture in 2012. The employment multiplier of 1.6 indicates that every 10 agricultural jobs in District 2 generate another six jobs in other industries in the area.
Among individual agricultural industries, corn, wheat, and other grain farming supported the greatest number of jobs in District 2 at an estimated 6,820 in 2012, which accounted for nearly 30 percent of agriculture’s total employment impact in the district.
Soybean and other oilseed farming was the district’s second-largest job producer with a total impact of 3,050 jobs. Corn, wheat, and other grain farming generated the largest contribution to GDP in District 2 with an estimated total value added impact of $275 million.
Direct Effects Ripple Effects Total MultiplierTotal Output ($ million)All Agriculture and Forestry 4,000 1,223 5,223 1.31
Production 1,718 594 2,312 1.35 Processing and Manufacturing 2,282 629 2,911 1.28
Value Added ($ million)All Agriculture and Forestry 1,077 686 1,763 1.64
Production 563 342 905 1.61 Processing and Manufacturing 514 344 858 1.67
EmploymentAll Agriculture and Forestry 15,290 8,518 23,808 1.6
Production 11,140 4,280 15,420 1.4 Processing and Manufacturing 4,150 4,238 8,388 2.0
Congressional District 2
The Economic Contributions of Agriculture and Forestry to Indiana’s Congressional District 2, 2012
Industry
Employment Effects Value Added Effects ($ million)
Direct Effects
Ripple Effects Total Multiplier
Direct Effects
Ripple Effects Total Multiplier
Corn, wheat, and other grain farming 5,210 1,610 6,820 1.3 135 139 275 2.03Soybean and other oilseed farming 1,910 1,140 3,050 1.6 169 88 257 1.52Hog and pig production 1,949 325 2,274 1.2 91 24 115 1.26Poultry processing 850 790 1,640 1.9 101 62 163 1.61Fruit and vegetable canning, pickling, and drying 600 680 1,280 2.1 101 56 157 1.56All other industries 4,771 3,973 8,744 1.8 479 318 797 1.66
Agriculture and Forestry’s Economic Contribution in Congressional District 2, 2012, Top 5 Industries
Source: IBRC, using data from the USDA and the IMPLAN economic modeling software
Source: IBRC, using data from the USDA and the IMPLAN economic modeling software
Beyond the Farm, March 2015 4 21
Economic contributions of AgriculturE
The agriculture- and forestry-related establishments in Indiana’s Congressional District
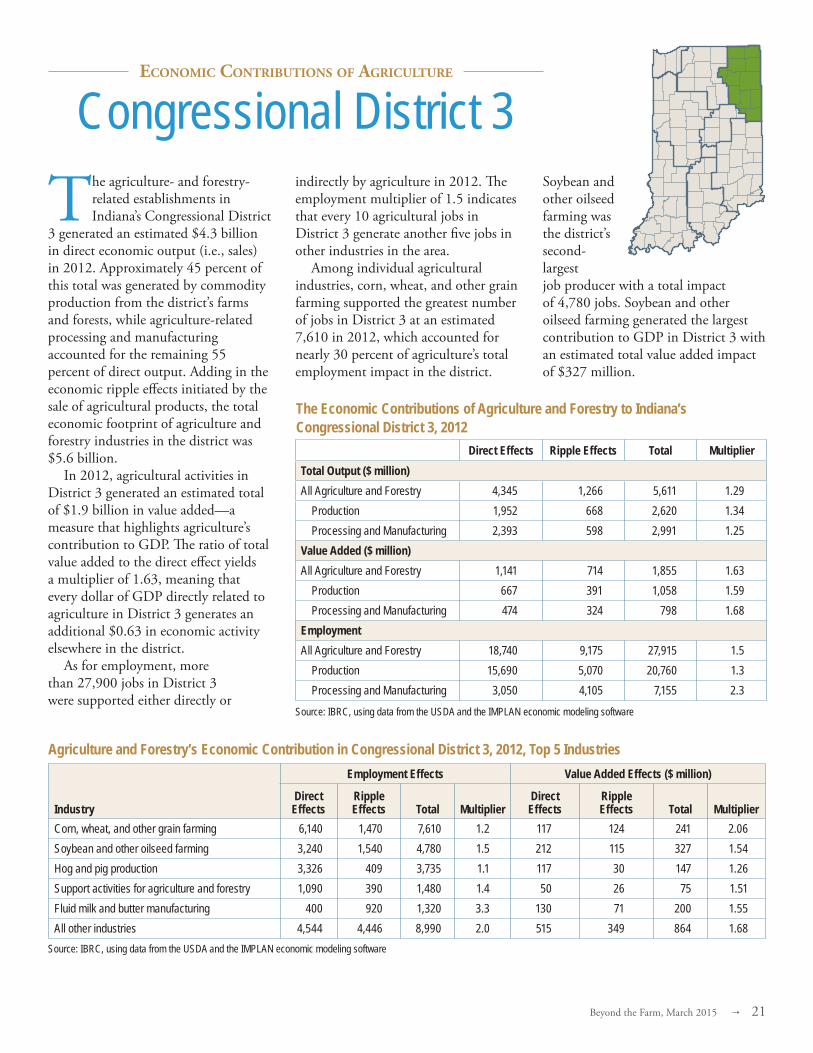
3 generated an estimated $4.3 billion in direct economic output (i.e., sales) in 2012. Approximately 45 percent of this total was generated by commodity production from the district’s farms and forests, while agriculture-related processing and manufacturing accounted for the remaining 55 percent of direct output. Adding in the economic ripple effects initiated by the sale of agricultural products, the total economic footprint of agriculture and forestry industries in the district was $5.6 billion.
In 2012, agricultural activities in District 3 generated an estimated total of $1.9 billion in value added—a measure that highlights agriculture’s contribution to GDP. The ratio of total value added to the direct effect yields a multiplier of 1.63, meaning that every dollar of GDP directly related to agriculture in District 3 generates an additional $0.63 in economic activity elsewhere in the district.
As for employment, more than 27,900 jobs in District 3 were supported either directly or
indirectly by agriculture in 2012. The employment multiplier of 1.5 indicates that every 10 agricultural jobs in District 3 generate another five jobs in other industries in the area.
Among individual agricultural industries, corn, wheat, and other grain farming supported the greatest number of jobs in District 3 at an estimated 7,610 in 2012, which accounted for nearly 30 percent of agriculture’s total employment impact in the district.
Soybean and other oilseed farming was the district’s second-largest job producer with a total impact of 4,780 jobs. Soybean and other oilseed farming generated the largest contribution to GDP in District 3 with an estimated total value added impact of $327 million.
Direct Effects Ripple Effects Total MultiplierTotal Output ($ million)All Agriculture and Forestry 4,345 1,266 5,611 1.29
Production 1,952 668 2,620 1.34 Processing and Manufacturing 2,393 598 2,991 1.25
Value Added ($ million)All Agriculture and Forestry 1,141 714 1,855 1.63
Production 667 391 1,058 1.59 Processing and Manufacturing 474 324 798 1.68
EmploymentAll Agriculture and Forestry 18,740 9,175 27,915 1.5
Production 15,690 5,070 20,760 1.3 Processing and Manufacturing 3,050 4,105 7,155 2.3
Congressional District 3
The Economic Contributions of Agriculture and Forestry to Indiana’s Congressional District 3, 2012
Industry
Employment Effects Value Added Effects ($ million)
Direct Effects
Ripple Effects Total Multiplier
Direct Effects
Ripple Effects Total Multiplier
Corn, wheat, and other grain farming 6,140 1,470 7,610 1.2 117 124 241 2.06Soybean and other oilseed farming 3,240 1,540 4,780 1.5 212 115 327 1.54Hog and pig production 3,326 409 3,735 1.1 117 30 147 1.26Support activities for agriculture and forestry 1,090 390 1,480 1.4 50 26 75 1.51Fluid milk and butter manufacturing 400 920 1,320 3.3 130 71 200 1.55All other industries 4,544 4,446 8,990 2.0 515 349 864 1.68
Agriculture and Forestry’s Economic Contribution in Congressional District 3, 2012, Top 5 Industries
Source: IBRC, using data from the USDA and the IMPLAN economic modeling software
Source: IBRC, using data from the USDA and the IMPLAN economic modeling software
22 3 Beyond the Farm, March 2015
Economic contributions of AgriculturE
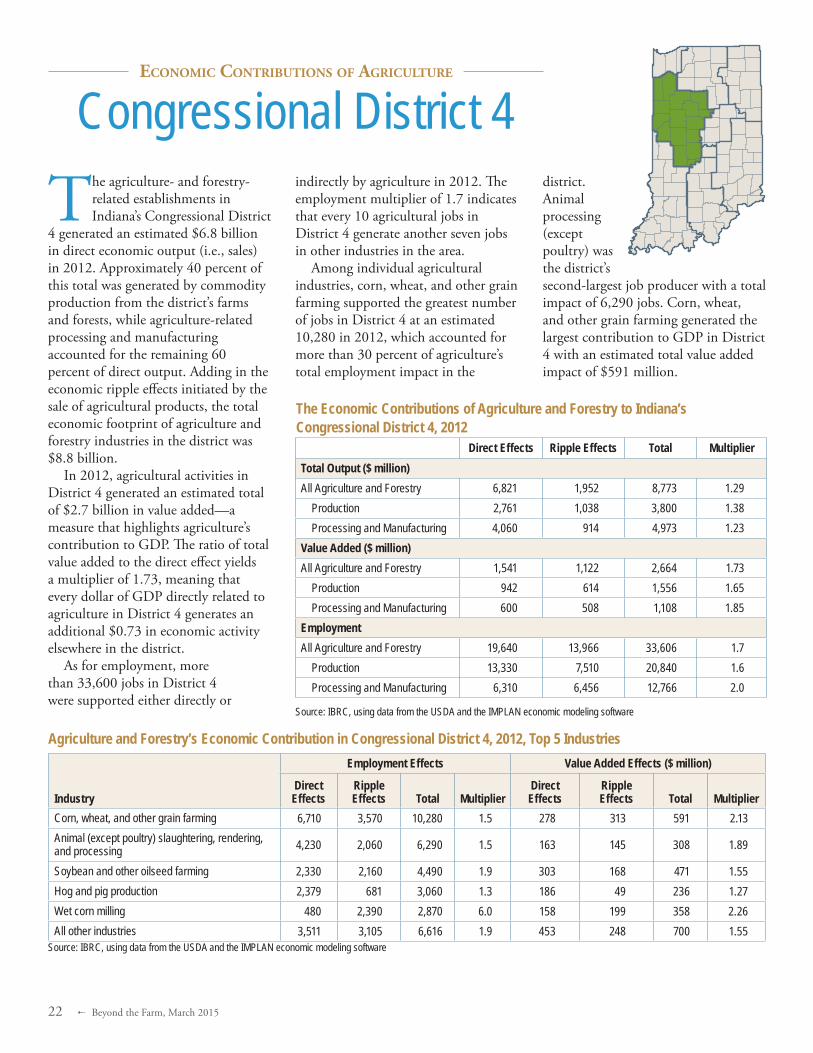
The agriculture- and forestry-related establishments in Indiana’s Congressional District
4 generated an estimated $6.8 billion in direct economic output (i.e., sales) in 2012. Approximately 40 percent of this total was generated by commodity production from the district’s farms and forests, while agriculture-related processing and manufacturing accounted for the remaining 60 percent of direct output. Adding in the economic ripple effects initiated by the sale of agricultural products, the total economic footprint of agriculture and forestry industries in the district was $8.8 billion.
In 2012, agricultural activities in District 4 generated an estimated total of $2.7 billion in value added—a measure that highlights agriculture’s contribution to GDP. The ratio of total value added to the direct effect yields a multiplier of 1.73, meaning that every dollar of GDP directly related to agriculture in District 4 generates an additional $0.73 in economic activity elsewhere in the district.
As for employment, more than 33,600 jobs in District 4 were supported either directly or
indirectly by agriculture in 2012. The employment multiplier of 1.7 indicates that every 10 agricultural jobs in District 4 generate another seven jobs in other industries in the area.
Among individual agricultural industries, corn, wheat, and other grain farming supported the greatest number of jobs in District 4 at an estimated 10,280 in 2012, which accounted for more than 30 percent of agriculture’s total employment impact in the
district. Animal processing (except poultry) was the district’s second-largest job producer with a total impact of 6,290 jobs. Corn, wheat, and other grain farming generated the largest contribution to GDP in District 4 with an estimated total value added impact of $591 million.
Direct Effects Ripple Effects Total MultiplierTotal Output ($ million)All Agriculture and Forestry 6,821 1,952 8,773 1.29
Production 2,761 1,038 3,800 1.38 Processing and Manufacturing 4,060 914 4,973 1.23
Value Added ($ million)All Agriculture and Forestry 1,541 1,122 2,664 1.73
Production 942 614 1,556 1.65 Processing and Manufacturing 600 508 1,108 1.85
EmploymentAll Agriculture and Forestry 19,640 13,966 33,606 1.7
Production 13,330 7,510 20,840 1.6 Processing and Manufacturing 6,310 6,456 12,766 2.0
Congressional District 4
The Economic Contributions of Agriculture and Forestry to Indiana’s Congressional District 4, 2012
Industry
Employment Effects Value Added Effects ($ million)
Direct Effects
Ripple Effects Total Multiplier
Direct Effects
Ripple Effects Total Multiplier
Corn, wheat, and other grain farming 6,710 3,570 10,280 1.5 278 313 591 2.13Animal (except poultry) slaughtering, rendering, and processing 4,230 2,060 6,290 1.5 163 145 308 1.89
Soybean and other oilseed farming 2,330 2,160 4,490 1.9 303 168 471 1.55Hog and pig production 2,379 681 3,060 1.3 186 49 236 1.27Wet corn milling 480 2,390 2,870 6.0 158 199 358 2.26All other industries 3,511 3,105 6,616 1.9 453 248 700 1.55
Agriculture and Forestry’s Economic Contribution in Congressional District 4, 2012, Top 5 Industries
Source: IBRC, using data from the USDA and the IMPLAN economic modeling software
Source: IBRC, using data from the USDA and the IMPLAN economic modeling software

Beyond the Farm, March 2015 4 23
Economic contributions of AgriculturE
The agriculture- and forestry-related establishments in Indiana’s Congressional District
5 generated an estimated $3.1 billion in direct economic output (i.e., sales) in 2012. Approximately 24 percent of this total was generated by commodity production from the district’s farms and forests, while agriculture-related processing and manufacturing accounted for the remaining 76 percent of direct output. Adding in the economic ripple effects initiated by the sale of agricultural products, the total economic footprint of agriculture and forestry industries in the district was $4.2 billion.
In 2012, agricultural activities in District 5 generated an estimated total of $1.5 billion in value added—a measure that highlights agriculture’s contribution to GDP. The ratio of total value added to the direct effect yields a multiplier of 1.73, meaning that every dollar of GDP directly related to agriculture in District 5 generates an additional $0.73 in economic activity elsewhere in the district.
As for employment, more than 14,480 jobs in District 5 were supported either directly or
indirectly by agriculture in 2012. The employment multiplier of 1.9 indicates that every 10 agricultural jobs in District 5 generate another nine jobs in other industries in the area.
Among individual agricultural industries, corn, wheat, and other grain farming supported the greatest number of jobs in District 5 at an estimated 3,330 in 2012, which accounted for more than 20 percent of agriculture’s total employment impact in the
district. Fruit and vegetable processing was the district’s second-largest job producer with a total impact of 3,330 jobs. Fruit and vegetable processing also generated the largest contribution to GDP in District 5 with an estimated total value added impact of $463 million.
Direct Effects Ripple Effects Total MultiplierTotal Output ($ million)All Agriculture and Forestry 3,090 1,069 4,159 1.35
Production 732 336 1,067 1.46 Processing and Manufacturing 2,359 734 3,092 1.31
Value Added ($ million)All Agriculture and Forestry 892 648 1,540 1.73
Production 278 211 489 1.76 Processing and Manufacturing 614 437 1,051 1.71
EmploymentAll Agriculture and Forestry 7,630 6,855 14,485 1.9
Production 4,550 2,440 6,990 1.5 Processing and Manufacturing 3,080 4,415 7,495 2.4
Congressional District 5
The Economic Contributions of Agriculture and Forestry to Indiana’s Congressional District 5, 2012
Industry
Employment Effects Value Added Effects ($ million)
Direct Effects
Ripple Effects Total Multiplier
Direct Effects
Ripple Effects Total Multiplier
Corn, wheat, and other grain farming 2,370 960 3,330 1.4 71 90 161 2.27Fruit and vegetable canning, pickling, and drying 1,450 1,880 3,330 2.3 257 205 463 1.80Soybean and other oilseed farming 1,140 810 1,950 1.7 113 69 182 1.61Fats and oils refining and blending 140 790 930 6.6 134 73 207 1.54All other food manufacturing 440 450 890 2.0 57 40 97 1.71All other industries 2,090 1,965 4,055 1.9 261 170 431 1.65
Agriculture and Forestry’s Economic Contribution in Congressional District 5, 2012, Top 5 Industries
Source: IBRC, using data from the USDA and the IMPLAN economic modeling software
Source: IBRC, using data from the USDA and the IMPLAN economic modeling software
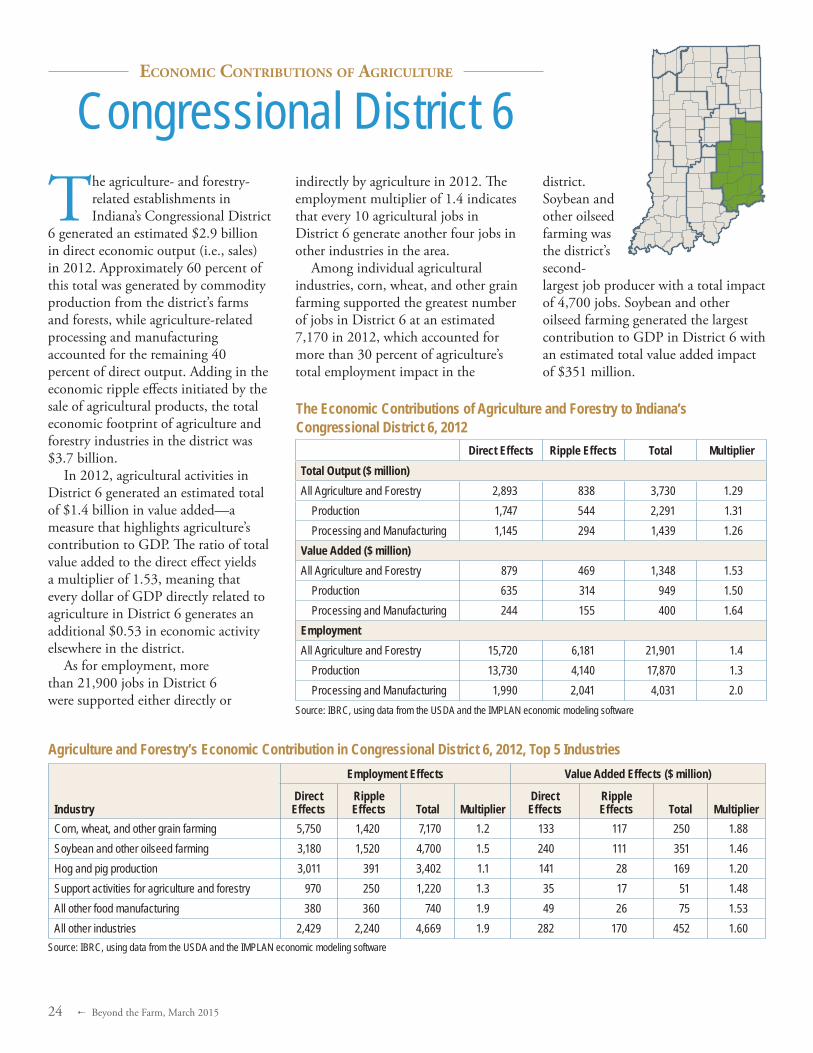
24 3 Beyond the Farm, March 2015
Economic contributions of AgriculturE
The agriculture- and forestry-related establishments in Indiana’s Congressional District
6 generated an estimated $2.9 billion in direct economic output (i.e., sales) in 2012. Approximately 60 percent of this total was generated by commodity production from the district’s farms and forests, while agriculture-related processing and manufacturing accounted for the remaining 40 percent of direct output. Adding in the economic ripple effects initiated by the sale of agricultural products, the total economic footprint of agriculture and forestry industries in the district was $3.7 billion.
In 2012, agricultural activities in District 6 generated an estimated total of $1.4 billion in value added—a measure that highlights agriculture’s contribution to GDP. The ratio of total value added to the direct effect yields a multiplier of 1.53, meaning that every dollar of GDP directly related to agriculture in District 6 generates an additional $0.53 in economic activity elsewhere in the district.
As for employment, more than 21,900 jobs in District 6 were supported either directly or
indirectly by agriculture in 2012. The employment multiplier of 1.4 indicates that every 10 agricultural jobs in District 6 generate another four jobs in other industries in the area.
Among individual agricultural industries, corn, wheat, and other grain farming supported the greatest number of jobs in District 6 at an estimated 7,170 in 2012, which accounted for more than 30 percent of agriculture’s total employment impact in the
district. Soybean and other oilseed farming was the district’s second-largest job producer with a total impact of 4,700 jobs. Soybean and other oilseed farming generated the largest contribution to GDP in District 6 with an estimated total value added impact of $351 million.
Direct Effects Ripple Effects Total MultiplierTotal Output ($ million)All Agriculture and Forestry 2,893 838 3,730 1.29
Production 1,747 544 2,291 1.31 Processing and Manufacturing 1,145 294 1,439 1.26
Value Added ($ million)All Agriculture and Forestry 879 469 1,348 1.53
Production 635 314 949 1.50 Processing and Manufacturing 244 155 400 1.64
EmploymentAll Agriculture and Forestry 15,720 6,181 21,901 1.4
Production 13,730 4,140 17,870 1.3 Processing and Manufacturing 1,990 2,041 4,031 2.0
Congressional District 6
The Economic Contributions of Agriculture and Forestry to Indiana’s Congressional District 6, 2012
Industry
Employment Effects Value Added Effects ($ million)
Direct Effects
Ripple Effects Total Multiplier
Direct Effects
Ripple Effects Total Multiplier
Corn, wheat, and other grain farming 5,750 1,420 7,170 1.2 133 117 250 1.88Soybean and other oilseed farming 3,180 1,520 4,700 1.5 240 111 351 1.46Hog and pig production 3,011 391 3,402 1.1 141 28 169 1.20Support activities for agriculture and forestry 970 250 1,220 1.3 35 17 51 1.48All other food manufacturing 380 360 740 1.9 49 26 75 1.53All other industries 2,429 2,240 4,669 1.9 282 170 452 1.60
Agriculture and Forestry’s Economic Contribution in Congressional District 6, 2012, Top 5 Industries
Source: IBRC, using data from the USDA and the IMPLAN economic modeling software
Source: IBRC, using data from the USDA and the IMPLAN economic modeling software

Beyond the Farm, March 2015 4 25
Economic contributions of AgriculturE
The agriculture- and forestry-related establishments in Indiana’s Congressional District
7 generated an estimated $2.9 billion in direct economic output (i.e., sales) in 2012. Approximately 1 percent of this total was generated by commodity production from the district’s farms and forests, while agriculture-related processing and manufacturing accounted for the remaining 99 percent of direct output. Adding in the economic ripple effects initiated by the sale of agricultural products, the total economic footprint of agriculture and forestry industries in the district was $3.7 billion.
In 2012, agricultural activities in District 7 generated an estimated total of $1 billion in value added—a measure that highlights agriculture’s contribution to GDP. The ratio of total value added to the direct effect yields a multiplier of 1.83, meaning that every dollar of GDP directly related to agriculture in District 7 generates an additional $0.83 in economic activity elsewhere in the district.
As for employment, almost 7,200 jobs in District 7 were supported either directly or indirectly by agriculture in
2012. The employment multiplier of 2.8 indicates that every 10 agricultural jobs in District 7 generate another 18 jobs in other industries in the area.
Among individual agricultural industries, wet corn milling supported the greatest number of jobs in District 7 at an estimated 2,810 in 2012, which accounted for nearly 40 percent of agriculture’s total employment impact in the district. Fluid milk and butter manufacturing was the district’s second-
largest job producer with a total impact of 1,460 jobs. Wet corn milling generated the largest contribution to GDP in District 7 with an estimated total value added impact of $411 million.
Direct Effects Ripple Effects Total MultiplierTotal Output ($ million)All Agriculture and Forestry 2,939 783 3,721 1.27
Production 32 14 47 1.45 Processing and Manufacturing 2,906 768 3,675 1.26
Value Added ($ million)All Agriculture and Forestry 551 459 1,010 1.83
Production 19 9 28 1.50 Processing and Manufacturing 533 449 982 1.84
EmploymentAll Agriculture and Forestry 2,610 4,580 7,190 2.8
Production 970 90 1,060 1.1 Processing and Manufacturing 1,640 4,490 6,130 3.7
Congressional District 7
The Economic Contributions of Agriculture and Forestry to Indiana’s Congressional District 7, 2012
Industry
Employment Effects Value Added Effects ($ million)
Direct Effects
Ripple Effects Total Multiplier
Direct Effects
Ripple Effects Total Multiplier
Wet corn milling 510 2,300 2,810 5.5 172 239 411 2.39Fluid milk and butter manufacturing 490 970 1,460 3.0 169 91 261 1.54Fats and oils refining and blending 140 630 770 5.5 134 63 197 1.47All other animal production 714 39 753 1.1 8 3 11 1.37Flour milling and malt manufacturing 140 380 520 3.7 32 41 74 2.27All other industries 616 261 877 1.4 36 21 57 1.59
Agriculture and Forestry’s Economic Contribution in Congressional District 7, 2012, Top 5 Industries
Source: IBRC, using data from the USDA and the IMPLAN economic modeling software
Source: IBRC, using data from the USDA and the IMPLAN economic modeling software

26 3 Beyond the Farm, March 2015
Economic contributions of AgriculturE
The agriculture- and forestry-related establishments in Indiana’s Congressional District
8 generated an estimated $4.3 billion in direct economic output (i.e., sales) in 2012. Approximately 40 percent of this total was generated by commodity production from the district’s farms and forests, while agriculture-related processing and manufacturing accounted for the remaining 60 percent of direct output. Adding in the economic ripple effects initiated by the sale of agricultural products, the total economic footprint of agriculture and forestry industries in the district was $5.9 billion.
In 2012, agricultural activities in District 8 generated an estimated total of $1.9 billion in value added—a measure that highlights agriculture’s contribution to GDP. The ratio of total value added to the direct effect yields a multiplier of 1.71, meaning that every dollar of GDP directly related to agriculture in District 8 generates an additional $0.71 in economic activity elsewhere in the district.
As for employment, more than 25,800 jobs in District 8 were supported either directly or
indirectly by agriculture in 2012. The employment multiplier of 1.6 indicates that every 10 agricultural jobs in District 8 generate another six jobs in other industries in the area.
Among individual agricultural industries, corn, wheat, and other grain farming supported the greatest number of jobs in District 8 at an estimated 6,560 in 2012, which accounted for 25 percent of agriculture’s total employment impact in the district.
Poultry processing was the district’s second-largest job producer with a total impact of 3,590 jobs. Poultry processing generated the largest contribution to GDP in District 8 with an estimated total value added impact of $355 million.
Direct Effects Ripple Effects Total MultiplierTotal Output ($ million)All Agriculture and Forestry 4,346 1,576 5,922 1.36
Production 1,755 757 2,511 1.43 Processing and Manufacturing 2,591 820 3,411 1.32
Value Added ($ million)All Agriculture and Forestry 1,136 807 1,942 1.71
Production 559 380 939 1.68 Processing and Manufacturing 577 427 1,003 1.74
EmploymentAll Agriculture and Forestry 15,850 10,000 25,850 1.6
Production 10,850 4,660 15,510 1.4 Processing and Manufacturing 5,000 5,340 10,340 2.1
Congressional District 8
The Economic Contributions of Agriculture and Forestry to Indiana’s Congressional District 8, 2012
Industry
Employment Effects Value Added Effects ($ million)
Direct Effects
Ripple Effects Total Multiplier
Direct Effects
Ripple Effects Total Multiplier
Corn, wheat, and other grain farming 4,800 1,760 6,560 1.4 144 157 301 2.10Poultry processing 1,830 1,760 3,590 2.0 221 134 355 1.61Soybean and other oilseed farming 1,860 1,250 3,110 1.7 177 98 275 1.55Hog and pig production 1,811 253 2,064 1.1 79 19 98 1.24Support activities for agriculture and forestry 1,520 290 1,810 1.2 30 21 51 1.69All other industries 4,029 4,687 8,716 2.2 485 378 863 1.78
Agriculture and Forestry’s Economic Contribution in Congressional District 8, 2012, Top 5 Industries
Source: IBRC, using data from the USDA and the IMPLAN economic modeling software
Source: IBRC, using data from the USDA and the IMPLAN economic modeling software
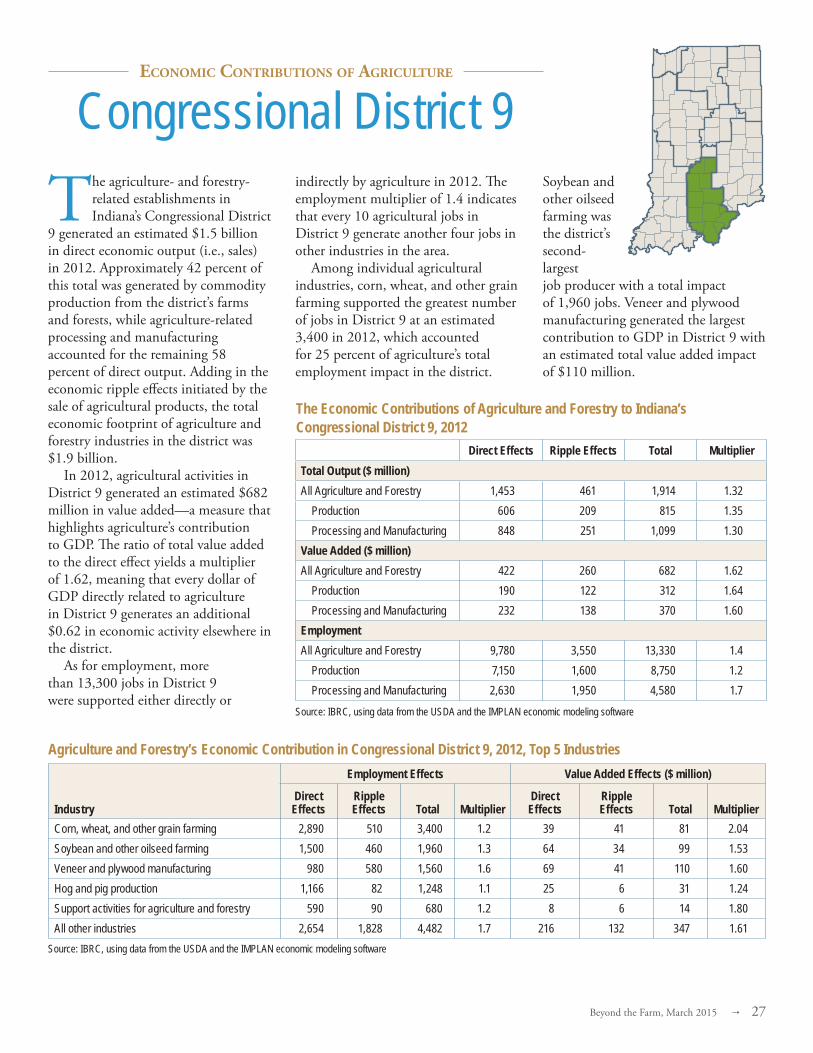
Beyond the Farm, March 2015 4 27
Economic contributions of AgriculturE
The agriculture- and forestry-related establishments in Indiana’s Congressional District
9 generated an estimated $1.5 billion in direct economic output (i.e., sales) in 2012. Approximately 42 percent of this total was generated by commodity production from the district’s farms and forests, while agriculture-related processing and manufacturing accounted for the remaining 58 percent of direct output. Adding in the economic ripple effects initiated by the sale of agricultural products, the total economic footprint of agriculture and forestry industries in the district was $1.9 billion.
In 2012, agricultural activities in District 9 generated an estimated $682 million in value added—a measure that highlights agriculture’s contribution to GDP. The ratio of total value added to the direct effect yields a multiplier of 1.62, meaning that every dollar of GDP directly related to agriculture in District 9 generates an additional $0.62 in economic activity elsewhere in the district.
As for employment, more than 13,300 jobs in District 9 were supported either directly or
indirectly by agriculture in 2012. The employment multiplier of 1.4 indicates that every 10 agricultural jobs in District 9 generate another four jobs in other industries in the area.
Among individual agricultural industries, corn, wheat, and other grain farming supported the greatest number of jobs in District 9 at an estimated 3,400 in 2012, which accounted for 25 percent of agriculture’s total employment impact in the district.
Soybean and other oilseed farming was the district’s second-largest job producer with a total impact of 1,960 jobs. Veneer and plywood manufacturing generated the largest contribution to GDP in District 9 with an estimated total value added impact of $110 million.
Direct Effects Ripple Effects Total MultiplierTotal Output ($ million)All Agriculture and Forestry 1,453 461 1,914 1.32
Production 606 209 815 1.35 Processing and Manufacturing 848 251 1,099 1.30
Value Added ($ million)All Agriculture and Forestry 422 260 682 1.62
Production 190 122 312 1.64 Processing and Manufacturing 232 138 370 1.60
EmploymentAll Agriculture and Forestry 9,780 3,550 13,330 1.4
Production 7,150 1,600 8,750 1.2 Processing and Manufacturing 2,630 1,950 4,580 1.7
Congressional District 9
The Economic Contributions of Agriculture and Forestry to Indiana’s Congressional District 9, 2012
Industry
Employment Effects Value Added Effects ($ million)
Direct Effects
Ripple Effects Total Multiplier
Direct Effects
Ripple Effects Total Multiplier
Corn, wheat, and other grain farming 2,890 510 3,400 1.2 39 41 81 2.04Soybean and other oilseed farming 1,500 460 1,960 1.3 64 34 99 1.53Veneer and plywood manufacturing 980 580 1,560 1.6 69 41 110 1.60Hog and pig production 1,166 82 1,248 1.1 25 6 31 1.24Support activities for agriculture and forestry 590 90 680 1.2 8 6 14 1.80All other industries 2,654 1,828 4,482 1.7 216 132 347 1.61
Agriculture and Forestry’s Economic Contribution in Congressional District 9, 2012, Top 5 Industries
Source: IBRC, using data from the USDA and the IMPLAN economic modeling software
Source: IBRC, using data from the USDA and the IMPLAN economic modeling software

28 3 Beyond the Farm, March 2015
Data SourcesThe IBRC performed the analysis of the crop and livestock production industries using data from the USDA’s 2012 Census of Agriculture. The USDA conducts the Census of Agriculture every five years, and the first of the 2012 data were released in early 2014. Results from the census are available for several different levels of geography, including states, congressional districts and counties. The IBRC aggregated county-level data to create estimates for the crop reporting districts.
In cases where a single farm or establishment is the dominant producer in a specific industry in a given geographic area, the USDA will suppress the data for that industry in that geographic area so that they don’t reveal information about individual producers. Data suppression can be common in smaller industries and in smaller counties. For this analysis, IBRC researchers estimated values for any suppressed data cells. The basic estimation approach was to sum the actual reported values for each Indiana county in a given industry and then find the difference, or residual, between that total and the state total in the same industry. The residual was then allocated proportionally to each suppressed county based on these county’s output estimates in the corresponding industry in their IMPLAN models for 2012. In some cases, the USDA would publish county rankings for suppressed industries, which the research team could use to determine if the estimates we generated were reasonable, and to make adjustments if not. The estimated data were then controlled to county and state totals.
For the analysis of processing and manufacturing industries, the research team relied on the output estimates for each industry in each geographic area found in the 2012 IMPLAN models.
IMPLAN derives these numbers primarily from Bureau of Economic Analysis and USDA data, and they cover both wage and salary workers and the self-employed.
Defining Agriculture and Forestry One challenge in this analysis was deciding which collection of industries properly defines agriculture and forestry. The selection of production industries is straightforward; the research team simply included all industries in sector 11 of the NAICS industry classification scheme with the exception of fishing, hunting and trapping (subsector 114). The NAICS subsectors for production included in this study are crop production, animal production, forestry and logging, and support activities for agriculture and forestry.
The selection of processing and manufacturing industries was trickier. There have been several studies similar to this one conducted in other states. Some have used very broad definitions of agriculture that include nearly all types of food, fabric and wood product manufacturing, while others have attempted to focus their analysis on processing industries that are most closely tied to the farm or forest. The IBRC research team selected the latter approach so as not to inflate the impact estimates with industries that have little direct link to Indiana agriculture.
The research team used the IMPLAN model to help distinguish which industries it considered primary agricultural processing and manufacturing. The IMPLAN model features production functions for each industry, which are akin to a recipe of the production inputs that each industry needs to produce its output. These production functions also include regional purchase coefficients (RPCs), which are estimates of the share of each production input that is supplied by other Indiana firms.
The research team used the RPCs to calculate for each industry the share of production inputs that are sourced from Indiana. A large share of the inputs for Indiana’s cheese makers, for instance, come from Indiana-based agriculture production, while only a tiny share of the inputs for local tortilla makers come directly from state agriculture production.
The research team settled on a 7 percent threshold, meaning that a processing or manufacturing industry is considered part of agriculture and forestry if at least 7 percent of its production inputs come directly from Hoosier farms or forests. We chose this threshold for two reasons: there was a large break in the values of the ranked list of industries at this point and it began to make intuitive sense to exclude the industries just below this level. Table 9 lists each industry that was included in this analysis along with each industry’s total contribution to Indiana output, value added and employment (total effects = direct + indirect + induced effects).
Adjustments to the IMPLAN ModelAs mentioned in the body of the report, the research team adjusted the IMPLAN model to eliminate double counting in the estimates of indirect and induced effects. Without adjustments, the economic activity and employment related agricultural industries would be double counted when these industries supply production inputs to one another. Researchers followed the procedures outlined by the IMPLAN Group to avoid double counting when conducting multi-industry contribution analysis. These adjustment procedures are online at “Multi-Industry Contribution Analysis” (https://implan.com/index.php?option=com_content&view=article&id=467). Note that there is still some double counting
Appendix

Beyond the Farm, March 2015 4 29
when the direct output of multiple industries is added together because the value of production inputs is embedded in the output figures.
Key TermsDirect Effects: Refers to the increase in final demand or employment in Indiana that can be attributed specifically to agriculture or forestry.
Indirect Effects: A measure of the change in dollars or employment caused when agricultural producers increase their purchases of goods and services from suppliers and, in turn, those suppliers purchase more inputs and so on throughout the economy. A corn milling operation, for instance, will buy inputs from a supplier. Those suppliers buy electricity to power their plants, buy material inputs for their products, and employ people to run the equipment. These transactions are the indirect ripple effects associated with the corn milling operation’s purchases.
Induced Effects: These reflect the changes—whether in dollars or employment—that result from the household spending of agricultural employees and their suppliers. Induced spending will increase or decrease as output changes along the economic supply chain. For example, as a farm’s production and sales increase, the output of its supply chain increases correspondingly. Those output changes also result in changes in household income and spending of suppliers’ employees. Induced effects represent the change in overall economic output and employment resulting from such household spending changes.
Total Effects: The total of all economic effects is the size of the economic impact and is the sum of the direct, indirect and induced effects.
Tax Effects: The IMPLAN model tracks the tax effects associated with all the transactions and economic activity associated with the direct and ripple effects. For example, household spending at retailers generates state sales tax. In addition, those retailers pay property taxes to local governments. As a result, this analysis was also able
Table 9: Total Economic and Employment Contributions of Each Agriculture and Forestry Industry, 2012
Source: IBRC, using data from the USDA and the IMPLAN economic modeling software
DescriptionTotal Output
($ million)Total Value
Added ($ million)Total
EmploymentSoybean and other oilseed farming 4,596 2,264 26,750Corn, wheat, and other grain farming 6,836 2,385 49,910Vegetable and melon farming 183 99 770Fruit farming 19 11 80Greenhouse, nursery, and floriculture production 193 120 980Tobacco farming 8 0 0All other crop farming 125 51 450Cattle ranching and farming 666 167 2,480Dairy cattle and milk production 1,008 407 3,380Poultry and egg production 2,076 566 4,570Hog and pig production 1,762 907 16,920All other animal production 85 44 820Forest nurseries, forest products, and timber tracts 50 23 180Logging 96 33 1,110Support activities for agriculture and forestry 574 370 9,520Flour milling and malt manufacturing 1,163 332 2,700Wet corn milling 4,472 1,135 9,390Soybean and other oilseed processing 1,507 223 2,310Fats and oils refining and blending 2,126 523 2,530Chocolate and confectionery manufacturing from cacao beans 8 2 20
Confectionery manufacturing from purchased chocolate 488 191 1,780
Non-chocolate confectionery manufacturing 651 258 2,210Frozen food manufacturing 197 63 820Fruit and vegetable canning, pickling, and drying 2,464 934 7,610Fluid milk and butter manufacturing 3,073 991 6,660Cheese manufacturing 202 29 470Dry, condensed, and evaporated dairy product manufacturing 372 100 940
Ice cream and frozen dessert manufacturing 549 210 2,040Animal (except poultry) slaughtering, rendering, and processing 2,503 506 10,010
Poultry processing 2,045 681 6,930Seafood product preparation and packaging 12 3 40All other food manufacturing 1,090 453 4,450Sawmills and wood preservation 581 174 3,000Veneer and plywood manufacturing 603 227 3,130Engineered wood member and truss manufacturing 358 157 2,060
Ethanol production 1,337 270 1,630Total 44,078 14,908 188,640

30 3 Beyond the Farm, March 2015
to estimate the federal, state and local government tax flows.
Multiplier: The multiplier is the magnitude of the economic response in a particular geographic area associated with a change—either an increase or a decrease—in the direct effects. For example, multiply every dollar of agricultural and forestry output by 1.41 to find an estimate of the total contribution of this activity to Indiana’s economy. Another way to look at it is that every dollar of output supports $0.41 in additional economic activity in the state.
Output: The value of an industry’s total production. Output includes both the price of production inputs and the value added of the industry.
Value Added: Also known as gross domestic product (GDP), value added is the difference between an industry’s total output and the cost of its production inputs. Value added consists of four components: employee compensation, proprietor income, other property income and indirect business tax.
About IMPLAN Economic Impact Modeling SoftwareMIG, Inc. (formerly the Minnesota IMPLAN Group) is the company responsible for developing IMPLAN data and software. Using classic input-output (I-O) analysis, IMPLAN can be used to measure the economic effects of an economic event, such as a factory closing or a new plant opening, or the size of the economic footprint of an economic entity like a production facility, headquarters or university.
The Economic Theory behind IMPLAN IMPLAN is built on a mathematical I-O model that expresses relationships between sectors of the economy in a chosen geographic location. In expressing the flow of dollars through a regional economy, the I-O model assumes fixed relationships between producers and their suppliers based on demand. It also omits any dollars spent
outside of the regional economy—say, by producers who import raw goods from another area or by employees who commute and do their household spending elsewhere.
The idea behind input-output modeling is that the inter-industry relationships within a region largely determine how that economy will respond to economic changes. In an I-O model, the increase in demand for a certain product or service causes a multiplier effect, layers of effect that come in a chain reaction. Increased demand for a product affects the producer of the product, the producer’s employees, the producer’s suppliers, the supplier’s employees, and so on, ultimately generating a total effect in the economy that is greater than the initial change in demand. Say demand for Andersen Windows’ wood window products increases. Sales grow, so Andersen has to hire more people, and the company may buy more from local vendors, and those vendors in turn have to hire more people … who in turn buy more groceries. The ratio of that overall effect to the initial change is called a regional multiplier and can be expressed like this:
(Direct Effect + Indirect Effects + Induced Effects) / (Direct Effect) = Multiplier
Multipliers are industry and region specific. Each industry has a unique output multiplier, because each industry has a different pattern of purchases from firms inside and outside of the regional economy. (The output multiplier is in turn used to calculate income and employment multipliers.)
Estimating a multiplier is not the end goal of IMPLAN users. Most wish to estimate other numbers and get the answers to the following questions: How many jobs will this new firm produce? How much will the local economy be affected by this plant closing? What will the effects be of an increase in product demand? Based on those user choices, IMPLAN software constructs “social accounts” to measure
the flow of dollars from purchasers to producers within the region. The data in those social accounts will set up the precise equations needed to finally answer those questions users have—about the impact of a new company, a plant closing or greater product demand—and yield the answers.
IMPLAN constructs its I-O model using aggregated production, employment and trade data from local, regional and national sources, such as the U.S. Census Bureau’s annual County Business Patterns report and the U.S. Bureau of Labor Statistics’ annual report called Covered Employment and Wages. In addition to gathering enormous amounts of data from government sources, the company also estimates some data where they haven’t been reported at the level of detail needed (county-level production data, for instance), or where detail is omitted in government reports to protect the confidentiality of individual companies whose data would be easily recognized due to a sparse population of businesses in the area.
IMPLAN’s accessibility and ease of use also make it a target of criticism by some economists, who charge that in the wrong hands, the software—or any input-output model—will produce inflated results at best, and at worst, completely ridiculous projections. Anyone can point and click their way to an outcome without fully understanding the economics in which the tool is grounded and without knowing how to look at data sets with a nuanced eye. The IBRC has two analysts that have attended advanced training in the use of the IMPLAN modeling software. The estimates that the IBRC analysts generate are pressure-tested and triple-checked to ensure that they are accurate and reflect the most trustworthy application of the modeling software. In all instances, the most conservative estimation assumptions and procedures are used to produce the IMPLAN results.