a soil compaction control technology assessment and...
TRANSCRIPT

PresentationAPWA International Public Works Congress
September 19-22, 1999
A Soil Compaction Control TechnologyAssessment and Demonstration
PROJECT TEAMPrincipal Investigator: Prof. Ilan Juran
Consultant: Pascal BocherelProject Manager: Philippe SchaackResearch Engineer: Alexis Rousset
SPONSORSNYC Department of Environmental Protection
NYC Department of TransportationBrooklyn Union
Sol Solution FranceUS Gas Tech
September 7, 1999
Urban Utility Center, Polytechnic University, 6 MetroTech Ctr, Brooklyn NY 11201Tel: (718) 260-3099, Fax: (718) 260-3433, Email: [email protected]
A Soil Compaction Control Technology Assessment and Demonstration 1
AbstractThe effectiveness of soil compaction control technologies and the reliability of
quality control test results are among the major factors that impact reinstatement ofutility cuts and the performance of the pavement restored. Therefore, in order toevaluate the compaction control testing procedures currently available and mostfrequently used, the New York City Department of Environmental Protection(NYCDEP) in collaboration with New York City Department Of Transportation(NYCDOT) and Brooklyn Union - A KeySpan Energy Corporation, have co-sponsoreda site demonstration and technology assessment project on a selected NYCDEP site.
This project involved compaction control tests with three techniques generally used inthe New York metropolitan area, including: The Gamma Densitometer, The DynamicCone Penetrometer, and the more recently developed Soil Compaction Meter. Theproject also included the assessment of the PANDA - a French developed soilcompaction control technology. The tests were conducted in six different trenches withtypical sandy backfill material compacted under different pre-selected site conditions.
Analysis of the test results demonstrated the reliability, efficiency, as well as the mainadvantages and limitations of each testing procedure. In particular, it wasdemonstrated that the PANDA provides a highly reliable tool for post-constructioncompaction quality control, which, due to its user-friendly software, is practicallyoperator independent.
This report briefly presents the main field test data along with site observations andsummary of the main features, technical performance and cost details related to eachtesting procedure.
AcknowledgmentsThis demonstration project was conducted by the Urban Utility Center in collaborationwith Soil Solution France which provided the PANDA and technical assistance for fieldtests, USGasTech which provided support for technology transfer and Brooklyn Unionwhich conducted the Gamma Densitometer and Dynamic Cone Penetration tests. TheUrban Utility Center would like in particular to thank Mr. Mike Krysko, DeputyDirector Operations of NYCDEP, and Mr. Burton Most, Director of R&D and QualityControl of NYCDOT, for their effective assistance and guidance during thisdemonstration project.

A Soil Compaction Control Technology Assessment and Demonstration 2
Table of Contents
1. OBJECTIVES...................................................................................................................... 4
2. SITE DESCRIPTION......................................................................................................... 4
3. BACKFILL MATERIALS................................................................................................. 5
4. TRENCHES DESCRIPTION ............................................................................................ 7
5. TESTING PROGRAM....................................................................................................... 8
6. THE PANDA (FRENCH STANDARD XP P 94-105)...................................................... 96.1. TESTING PROCEDURE ...................................................................................................... 96.2. PRE-CALIBRATION AND INTERPRETATION ....................................................................... 9
7. THE GAMMA DENSITOMETER (ASTM D 3017-88/2922-91) ................................... 97.1. TESTING PROCEDURE ...................................................................................................... 97.2. INTERPRETATION ........................................................................................................... 11
8. THE SOIL COMPACTION METER (NO STANDARDS).......................................... 118.1. TESTING PROCEDURE .................................................................................................... 118.2. PRE-CALIBRATION AND INTERPRETATION ..................................................................... 11
9. THE DYNAMIC CONE PENETROMETER (NO STANDARDS) ............................. 149.1. TESTING PROCEDURE .................................................................................................... 149.2. PRE-CALIBRATION AND INTERPRETATION ..................................................................... 14
10. INTERPRETATION ..................................................................................................... 1610.1. TRENCH 1................................................................................................................... 1610.2. TRENCH 2................................................................................................................... 1610.4 TRENCH 3 ................................................................................................................... 2110.4. TRENCH 4................................................................................................................... 2110.5 TRENCH 5 ................................................................................................................... 2610.6 TRENCH 6 ................................................................................................................... 26
11. TECHNICAL PERFORMANCE ASSESSMENT ..................................................... 32
12. CONCLUSION .............................................................................................................. 35

A Soil Compaction Control Technology Assessment and Demonstration 3
List of figuresFigure 1 – Site Plan 4Figure 2 – The four soil compaction control technologies 5Figure 3 – Grain Size Distribution 6Figure 4 – Proctor test 6Figure 5 – Trenches description 7Figure 6 – The principle of the PANDA 10Figure 7 – PANDA Penetrograms and Reference Curves 10Figure 8 – The principle of the Gamma Densitometer 10Figure 9 – Gamma Densitometer test data and reference values for compaction control 10Figure 10 – Principle of the SCM 13Figure 11 – SCM test data 13Figure 12 – The Dynamic Cone Penetrometer 15Figure 13 – DCP test data and reference values 15Figure 14 – The PANDA results – Trench 1 17Figure 15 – The Gamma Densitometer results – Trench 1 17Figure 16 – The Soil Compaction Meter results – Trench 1 18Figure 17 – The Dynamic Cone Penetrometer results – Trench 1 18Figure 18 – The PANDA results – Trench 2 19Figure 19 – The Gamma Densitometer results – Trench 2 19Figure 20 – The Soil Compaction Meter results – Trench 2 20Figure 21 – The Dynamic Cone Penetrometer results – Trench 2 20Figure 22 – The PANDA results – Trench 3 21Figure 23 – The Gamma Densitometer results – Trench 3 21Figure 24 – The Soil Compaction Meter results – Trench 3 23Figure 25 – The Dynamic Cone Penetrometer results – Trench 3 23Figure 26 – The PANDA results – Trench 4 24Figure 27 – The Gamma Densitometer results – Trench 4 24Figure 28 – The Soil Compaction Meter results – Tench 4 25Figure 29 – The Dynamic Cone Penetrometer results – Trench 4 25Figure 30 – The PANDA results – Trench 5 27Figure 31 – The Gamma Densitometer results – Trench 5 27Figure 32 – The Soil Compaction Meter results – Trench 5 28Figure 33 – The Dynamic Cone Penetrometer results – Trench 5 28Figure 34 – The PANDA results – Trench 6 29Figure 35 – The Gamma Densitometer results – Trench 6 29Figure 36 – The Soil Compaction Meter results – Trench 6 30Figure 37 – The Dynamic Cone Penetrometer results – Trench 6 30
List of tablesTable 1 – Testing Program 4Table 2 – Information Quality Reliability 31Table 3 – Efficiency and safety 32Table 4 – Data acquisition, reduction and analysis 32Table 5 – Cost study 33Table 6 – Summary – Main Advantages and Disadvantages 34

A Soil Compaction Control Technology Assessment and Demonstration 4
A Soil Compaction Control Technology Assessment andDemonstration
ByIlan JURAN(*) and Alexis ROUSSET(**)
1. ObjectivesThe objective of this study is to compare the reliability and efficiency of four soil compactioncontrol testing procedures.The PANDA.The Gamma Densitometer.The Soil Compaction Meter.The Dynamic Cone Penetrometer.Soil compaction control tests were conducted under conditions typical to trenches. The resultsare briefly presented below.
2. Site Description
Site location: DEP Repair Center, 855 REMSEN Avenue, Brooklyn, NY, US.Date: 15th - 16th of June 1999.
A
10 m or 32 ft
A 20 m or 64 ft
A – A 1.5m or 5 ft
7m or 35 ft
Figure 1 – Site Plan
(*) Professor; Director of the Urban Utility Center(**) Graduate student
6 5 4 3 2 1

A Soil Compaction Control Technology Assessment and Demonstration 5
3. Backfill Materials
DEP has provided the backfill materials, including Sand and RAP (Recycled AsphaltPavement). Figures 3 and 4 show respectively the Grain Size Distribution and the Proctor TestResults for the selected sand.
SandThe Sieve Analysis yields:Soil Classification:American Classification: A1 – b (ASTM D3282 – 93)French Classification: D1 (NF P 11-300)The Proctor Test Results yield:The Optimum Moisture Content: 6.3%The Maximum Dry Density: 16.4 KN/ m3
Site specification requires 95 % of γdmax at wopt (±2%)
RAP (Recycled Asphalt Pavement)The RAP is Recycled Asphalt Pavement coming from the renovation of street. This backfillmaterial is used mixed with sand (1 volume of each). This mixture has been used to assess theefficiency of the testing procedure in evaluating the in-situ compacted performance of thismaterial.
Figure 2 – The four soil compaction control technologies

A Soil Compaction Control Technology Assessment and Demonstration 6
15.815.916.016.1
16.216.316.416.5
2 3 4 5 6 7 8 9 10
Figure 3 – Grain Size Distribution
Figure 4 – Proctor test
100
0
20
40
60
80
0.01 0.1 1 10
Pass
ing
by w
eigh
t (%
)
Sieve opening (mm)
Dry
Den
sity
(kN
/m3 )
Moisture content (%)
A Soil Compaction Control Technology Assessment and D
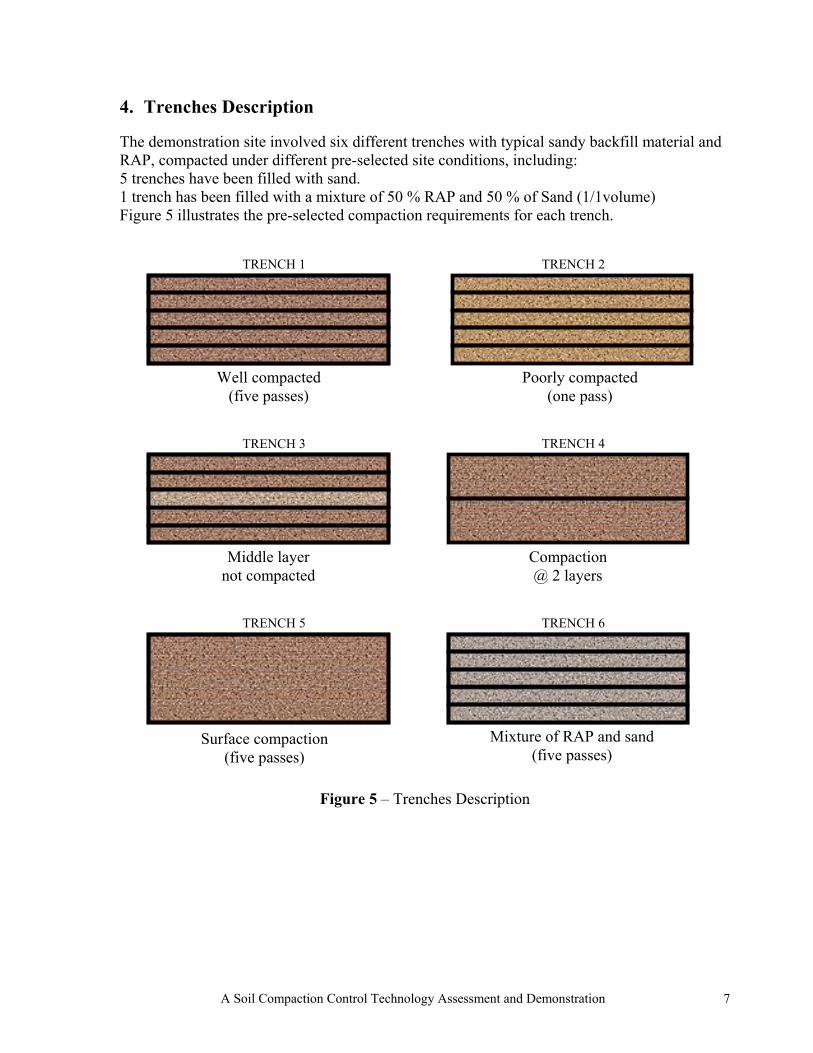
4. Trenches Description
The demonstration site involved six different trenches with typical sandy backfill material andRAP, compacted under different pre-selected site conditions, including:5 trenches have been filled with sand.1 trench has been filled with a mixture of 50 % RAP and 50 % of Sand (1/1volume)Figure 5 illustrates the pre-selected compaction requirements for each trench.
Figure 5 – Trenches Description
Well compacted(five passes)
TRENCH 1
Poorly compacted(one pass)
TRENCH 2
TRENCH 3
C
Surface compaction(five passes)
Mixtur(
Middle layernot compacted
TRENCH 4
ompaction@ 2 layers
TRENCH 5
TRENCH 6emonstration 7
e of RAP and sandfive passes)

A Soil Compaction Control Technology Assessment and Demonstration 8
5. Testing Program
A total of 269 compaction control tests were conducted. Table 1 presents the testing programfor each trench.
Table 1 – Testing Program
Testing Programfor each Trench
PANDA GammaDensitometer
DCP SCM Total
Trench 1Layer 1;2;3;4;5
Full depth3/layer
33/layer
02/layer
03/layer
058
Trench 2Layer 1;2;3;4;5
Full depth3/layer
33/layer
02/layer
03/layer
058
Trench 3Layer 1;2;4;5
Layer 3Full depth
3/layer3/layer
3
3/layer3/layer
0
2/layer00
3/layer3/layer
056
Trench 4 (2 layers)Layer 1;2Full depth
3/layer3
3/layer0
2/layer0
3/layer0
25
Trench 5 (1 layer)Layer 1
Full depth3/layer
33/layer
02/layer
03/layer
014
Trench 6Layer 1;2;3;4;5
Full depth3/layer
33/layer
02/layer
03/layer
058
Total 87 69 44 69 269

A Soil Compaction Control Technology Assessment and Demonstration 9
6. The PANDA (French standard XP P 94-105).
6.1. Testing Procedure
The test is done by driving a cone (of 2, 4, or 10 cm2) into the soil with rods by blowing astandard hammer on the head of the piston. For each blow, an electronic box records the speedof impact, which allows establishing the driving energy, the masses being known.Simultaneously the other sensor measures the settlement and the recorder yields theaccumulated driving depth of the cone. The principle of the PANDA testing is illustrated inFigure 6. For each blow using the measured data, the computer calculates the dynamic coneresistance qd from the Dutch formula and records the values of qd and the correspondingdepths.
6.2. Pre-calibration and Interpretation
For a selected material and compaction energy level, pre-calibration tests need to be conductedin order to establish the reference curves. Sol Solution France has conducted an extensiveseries of pre-calibration tests on standard backfill materials (NF P 11-300) and thecorresponding reference curves are available in the PANDA database. For the purpose of thisdemonstration project the selected sand was identified as D1 (French classification) and therelevant reference curves have been retrieved from this database. The software yields refusaland reference curves.
Studies, conducted in France, have demonstrated the reliability of the results obtained ascompared to standard in situ tests. All the test data can be transferred to a microcomputer P.C.and analyzed with the PANDA Windows software. The software allows to printout these dataand compare the site specific penetrograms obtained with the reference curves. For thepurpose of compaction control, test results obtained with the PANDA are compared with thepre-calibrated reference curves. Figure 7 illustrates the PANDA penetrograms obtained forTrench 1 and the reference curves established for D1 sand.
7. The Gamma Densitometer (ASTM D 3017-88/2922-91)
7.1. Testing Procedure
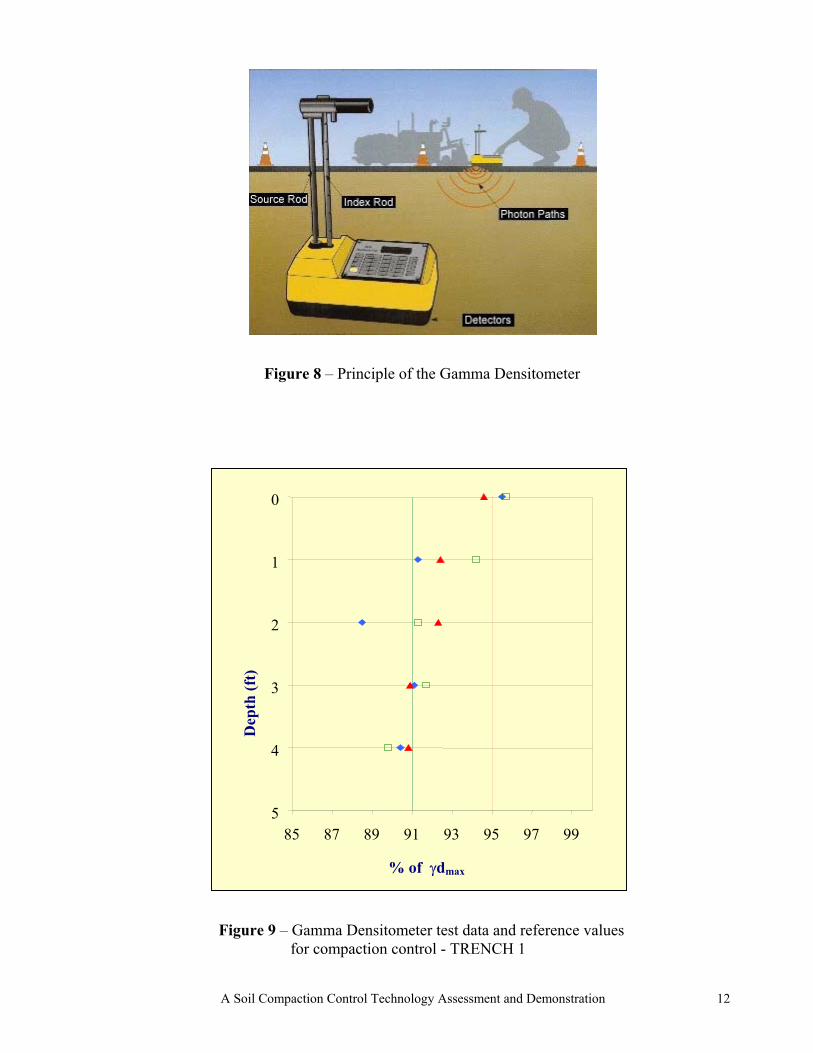
This method operates either in drilled holes or from the ground surface. For densitymeasurements a radioactive source such as Cesium 137 emits gamma rays. Geiger-Mullertubes are used to detect how many gamma rays photons are reflected to the surface (backscattermode) or are transmitted from the depth source to the surface (direct transmission mode) ratherthan being absorbed by the soil during a standard test period of 1 minute. For moisture contentmeasurements a source of high-velocity neutrons, such as americium 241, is employed in thebackscatter mode. The principle of the Gamma Densitometer testing is schematicallyillustrated in Figure 8.

A Soil Compaction Control Technology Assessment and Demonstration 10
Dynamic Cone Resistance (MPa)
Accepted
Refused
0
1
2
3
4
5
0.1 1 10 100
Dep
th (f
t)
Figure 7 – PANDA Penetrograms and Reference CurvesTRENCH 1
Figure 6 – Principle of the PANDA

A Soil Compaction Control Technology Assessment and Demonstration 11
The gamma ray absorption law yields directly for the two selected radioactive sources the drydensity and the moisture content. The mass absorption coefficient has been established soil andno further pre-calibration tests are required.
7.2. Interpretation
For a selected material a Standard Proctor Test is performed in order to established theMaximum Dry Density as a reference value for compaction control. The on-site StandardProctor Test yielded the following:
Optimum Moisture Content: 3.4%Maximum Dry Density: 17.9 KN/ m3
Figure 9 illustrates the variation of the Gamma Densitometer test data obtained at the level ofeach layer for Trench 1, as a function of the layer grade (i.e. depth below final surface grade).Also plotted for reference are the required compaction level of 95% of the maximum drydensity obtained from the Proctor tests.
8. The Soil Compaction Meter (no standards)
8.1. Testing Procedure
The Soil Compaction Meter (SCM) is a small, hand-held, battery operated, electronic device,which indicates to the tamper operator when maximum compaction has been achieved for agiven soil layer. Workers place layers and compacts each one until the stoplight indicates thatthe desired density has been reached. When the back filling is completed, the sensor wire iscut, leaving the disposable sensor in the compacted soil.
8.2. Pre-calibration and Interpretation
A disposable piezoelectric sensor produces voltage proportional to the pressure waveamplitude that is transmitted through progressively denser soil. Signals are fed into a meter thatcalculates a continuously refined maximum theoretical soil density for each layers and tracksactual density relative to the maximum as the layer is compacted. When a factory-set cutoffpoint is reached, a stoplight goes on. It is not dependent upon matching field backfill soils to aspecific "sample" used for laboratory reference.
The principle of the SCM testing is schematically illustrated in figure 10. Figure 11 illustratesthe variation of the SCM test data obtained at the level of each layer (i.e. the number of rollerpasses required to achieve the specified compaction level) for trench 1, as a function of thelayer grade (i.e. depth below final surface grade).
A Soil Compaction Control Technology Assessment and Demonstration 12
0
1
2
3
4
585 87 89 91 93 95 97 99
% of γdmax
Dep
th (f
t)
Figure 9 – Gamma Densitometer test data and reference values for compaction control - TRENCH 1
Figure 8 – Principle of the Gamma Densitometer

A Soil Compaction Control Technology Assessment and Demonstration 13
Figure 10 – Principle of the SCM
2
3
1
0
4
50 1 2 3 4 5 6 7 8
Number of passes
Figure 11 – SCM test data - TRENCH 1
Dep
th (f
t)
A Soil Compaction Control Technology Assessment and Demonstration 14
9. The Dynamic Cone Penetrometer (no standards)
9.1. Testing Procedure
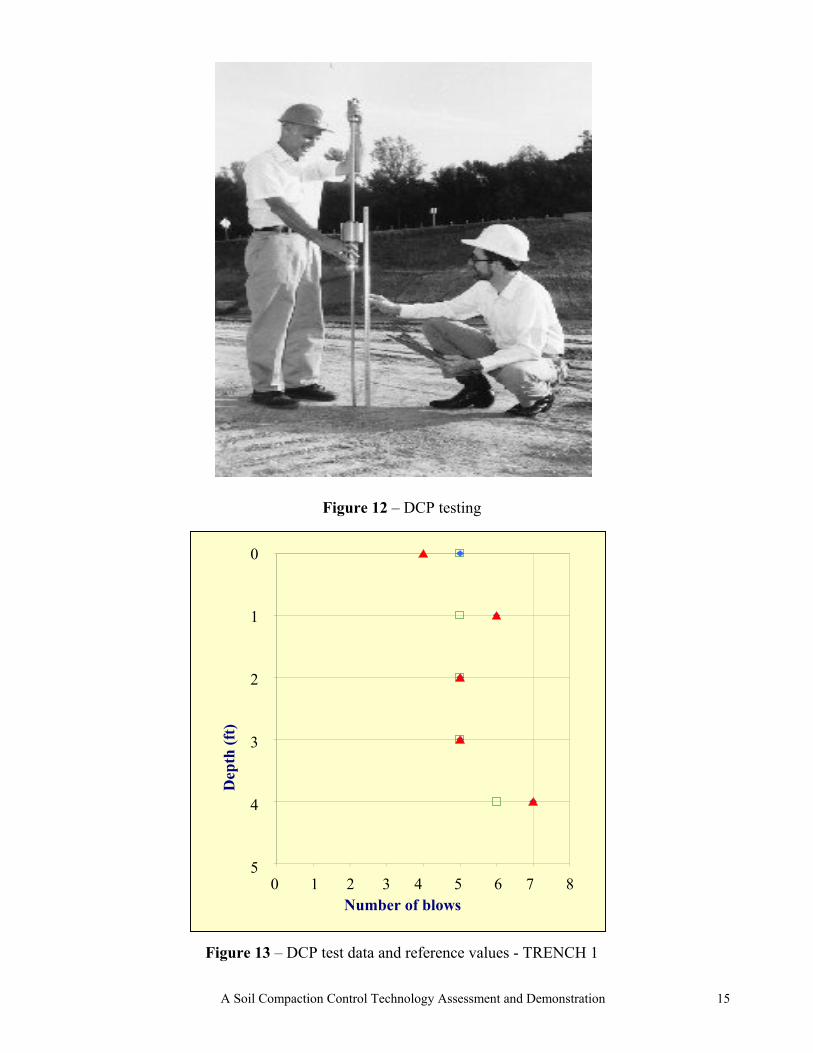
The Dynamic Cone Penetrometer (DCP) consists of a steel rod with a cone attached to one end.The cone is driven into the soil by dropping a hammer onto an anvil located on the rod. Thedevice penetrates soils to depths of 6.5 inches. Test results are the number of blows needed todrive the rod from 3.25 inches to 6.5. A DCP test can usually be conducted in less than tenminutes
9.2. Pre-calibration and Interpretation
For the purpose of soil compaction control the number of blows obtained is compared with areference value. This reference value depends on the soil type, the moisture content and therequired dry density of the material. It is established by precalibration tests. Considering theselected site conditions (sand, dry density required: 95 % of γdmax) and in reference to theBrooklyn Union Standard, the reference value is 7 blows.
Figures 12 and 13 illustrate respectively the equipment and the variation of the DCP test dataobtained at the level of each layer (i.e. the number of hammer blows required to achieve thedepth of 6.5 inches) for Trench 1, as a function of the layer grade (i.e. depth below finalsurface grade).
A Soil Compaction Control Technology Assessment and Demonstration 15
0
1
2
3
4
50 1 2 3 4 5 7 86
Number of blows
Dep
th (f
t)
Figure 13 – DCP test data and reference values - TRENCH 1
Figure 12 – DCP testing

A Soil Compaction Control Technology Assessment and Demonstration 16
10. Interpretation
10.1. Trench 1
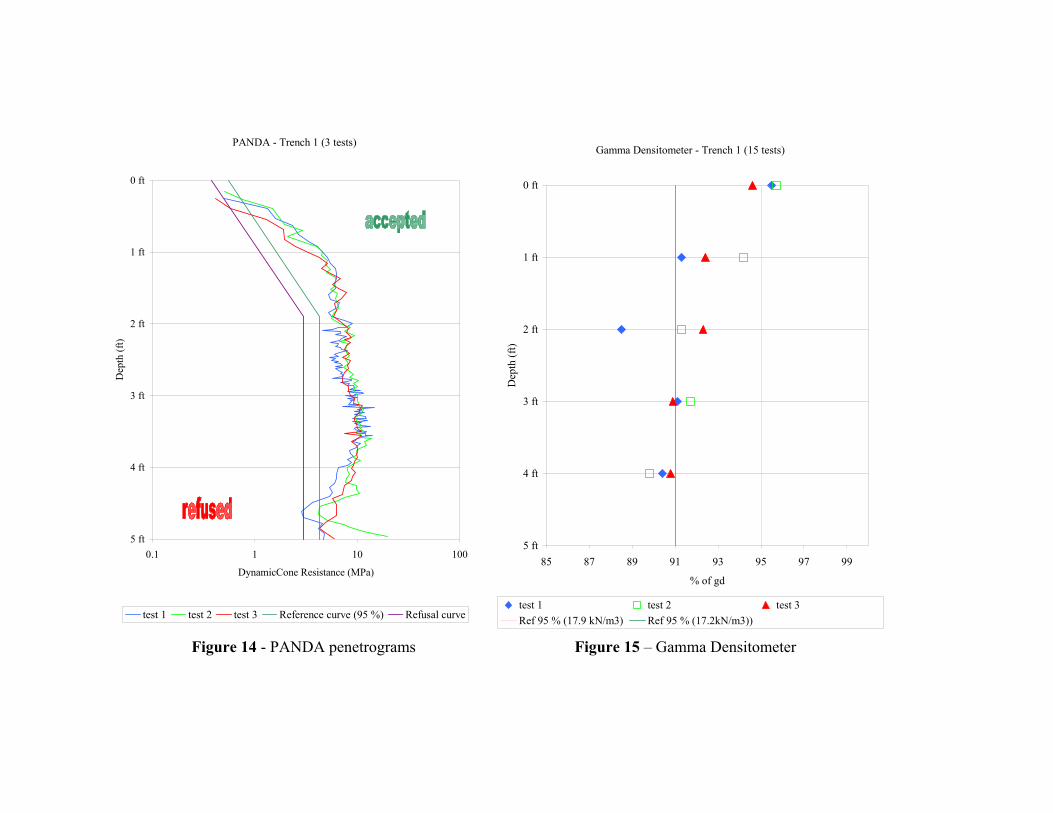
Figures 14 to 17 present the test results obtained for this trench, illustrating the following:
The PANDA penetrograms indicate that control test results are higher than the reference curve.The compaction meets site specifications. (*)The Gamma Densitometer indicates that 4 test results over 5 reach an average value of 91%to 93% and are therefore lower than 93% of γdmax. The compaction doesn’t meet sitespecifications. (**)The Soil Compaction Meter stoplight is turned on after two passes of the vibro tamper. Thecompaction meets site specifications.The Dynamic Cone Penetrometer control test results are lower than the reference curve. Thecompaction doesn’t meet site specifications.
10.2. Trench 2
Figures 18 to 21 present the test results obtained for this trench, illustrating the following:
Two of the three PANDA penetrograms indicate that control test results are higher than thereference curve. The compaction meets site specifications. (*)The Gamma Densitometer indicates that 4 test results over 5 reach an average value of 89%to 93% and are therefore are lower than 93% of γdmax. The compaction doesn’t meet sitespecifications. (**)The Soil Compaction Meter stoplight is turned on after one passe of the vibro tamper. Thecompaction meets site specificationsThe Dynamic Cone Penetrometer control test results are lower than the reference curve. Thecompaction doesn’t meet site specifications.
*Note: The Panda test is performed when the compaction of all the backfill layers is completed, while all the othertests, including the Gamma Densitometer are conducted after compaction of each layer. Therefore the PANDApenetrograms represent the final state of compaction at each layer, which is significantly improved through thecompaction process as compared with results obtained with other tests, Gamma Densitometer included.**Note: On-site Standard Proctor Tests conducted for the Gamma Densitometer yield a maximum dry density of17.9 kN/m3, which is significantly higher than the average maximum dry density value of 17.2 kN/m3 establishedby the laboratory Standard Proctor Test for the PANDA reference curves. The difference in maximum dry densitymay explain the differences in the compaction control evaluation.
PANDA - Trench 1 (3 tests)
0 ft
1 ft
2 ft
3 ft
4 ft
5 ft0.1 1 10 100
DynamicCone Resistance (MPa)
Dep
th (f
t)
test 1 test 2 test 3 Reference curve (95 %) Refusal curve
Gamma Densitometer - Trench 1 (15 tests)
0 ft
1 ft
2 ft
3 ft
4 ft
5 ft85 87 89 91 93 95 97 99
% of gd
Dep
th (f
t)
test 1 test 2 test 3Ref 95 % (17.9 kN/m3) Ref 95 % (17.2kN/m3))
Figure 14 - PANDA penetrograms Figure 15 – Gamma Densitometer

The Soil Compaction Meter - Trench 1 (10 tests)
0 ft
1 ft
2 ft
3 ft
4 ft
5 ft0 1 2 3 4 5 6 7 8
Number of passes
Dep
th (f
t)
test 1test 2
The Dynamic Cone Penetrometer - Trench 1 (15 tests)
0 ft
1 ft
2 ft
3 ft
4 ft
5 ft0 1 2 3 4 5 6 7 8
Number of blows
Dep
th (f
t) test 1test 2test 3Ref 95 %
Figure 16 – The soil compaction meter Figure 17 – The Dynamic Cone Penetrometer

PANDA - Trench 2 (3 tests)
0 ft
1 ft
2 ft
3 ft
4 ft
5 ft0.1 1 10 100
DynamicCone Resistance (MPa)
Dep
th (f
t)
test 1 test 2 test 3 Reference curve 95 % Refusal curve
Gamma Densitometer - Trench 2 (15 tests)
0 ft
1 ft
2 ft
3 ft
4 ft
5 ft85 87 89 91 93 95 97 99
% of gd
Dep
th (f
t)
test 1 test 2 test 3 Ref 95 % (17.9 kN/m3) Ref 95 % (17.2 kN/m3)
Figure 18 - PANDA penetrograms Figure 19 – Gamma Densitometer

The Soil Compaction Meter - Trench 2 (10 tests)
0 ft
1 ft
2 ft
3 ft
4 ft
5 ft0 1 2 3 4
Number of passes
Dep
th (f
t)
test 1test 2
The Dynamic Cone Penetrometer - Trench 2 (15 tests)
0 ft
1 ft
2 ft
3 ft
4 ft
5 ft0 1 2 3 4 5 6 7 8
Number of blows
Dep
th (f
t) test 1test 2test 3Ref 95 %
Figure 20 – The soil compaction meter Figure 21 – The Dynamic Cone Penetrometer

A Soil Compaction Control Technology Assessment and Demonstration 21
10.3. Trench 3
Figures 22 to 25 present the test results obtained for this trench, illustrating the following:
The PANDA penetrograms indicate that at the depth of 75 cm, for about 20 cm, the test resultsare lower than the reference curve. The compaction, in the middle layer, doesn’t meet sitespecifications.The Gamma Densitometer indicates that for the third layer we have reached less than 86 % ofγdmax. The compaction doesn’t meet site specifications. (*) (**)The Soil Compaction Meter, for the third non-compacted layer and the fourth layer, indicatesno compaction (no stop light turned on). The compaction doesn’t meet site specifications.For the fifth layer, The Soil Compaction Meter stoplight is turned on after two passes of thevibro tamper.The Dynamic Cone Penetrometer control test results are lower than the reference curve. Thecompaction doesn’t meet site specifications.
10.4. Trench 4
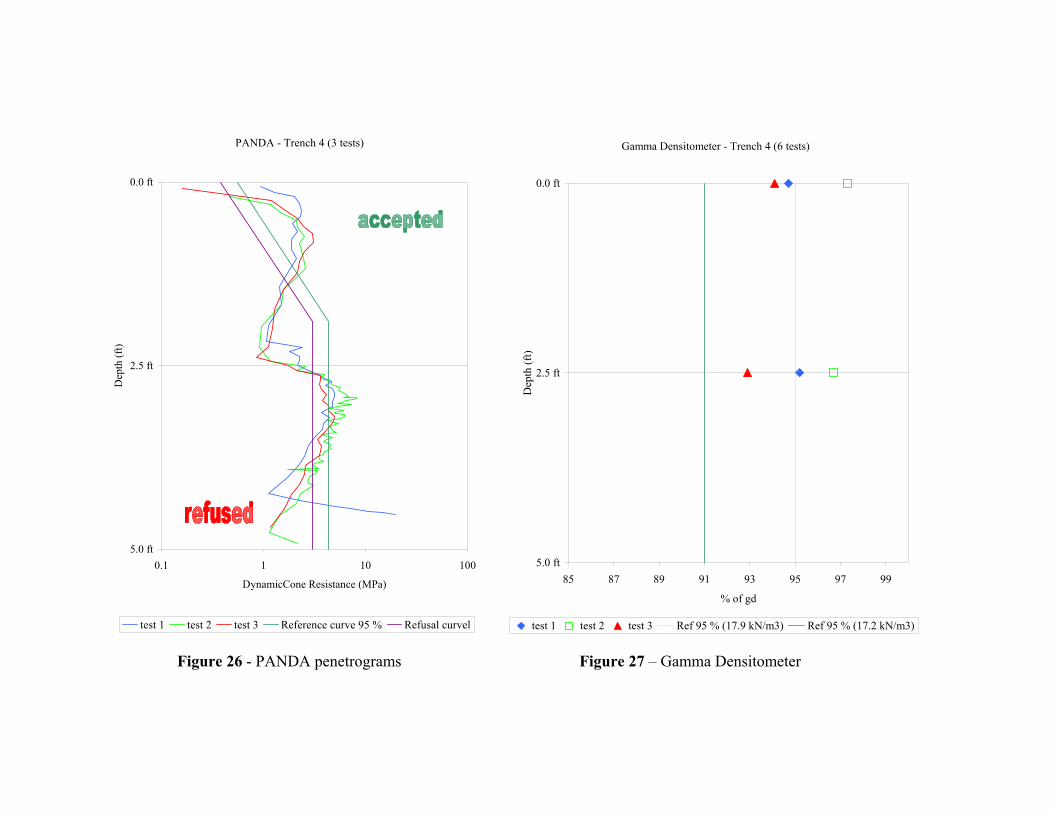
Figures 26 to 29 present the test results obtained for this trench, illustrating the following:
The PANDA penetrograms indicate that, between the depth of 50 cm and 75cm, the test resultsare lower than the reference curve. The same remark can be made for the depths of 110 cm and150 cm. The compaction doesn’t meet site specifications.The Gamma Densitometer indicates the test results are close to 95 % of γdmax. Thecompaction meets site specifications. (*) (**)The stop light of the Soil Compaction Meter is turned on after two passes of vibro tamper.The compaction meets site specifications.The Dynamic Cone Penetrometer control test results are higher than the reference curve. Thecompaction meets site specifications.

PANDA - Trench 3 (3 tests)
0 ft
1 ft
2 ft
3 ft
4 ft
5 ft0.1 1 10 100
DynamicCone Resistance (MPa)
Dep
th (f
t)
test 1 test 2 test 3 Reference curve 95 % Refusal curvel
Gamma Densitometer - Trench 3 (15 tests)
0 ft
1 ft
2 ft
3 ft
4 ft
5 ft85 87 89 91 93 95 97 99
% of gd
Dep
th (f
t)
test 1 test 2 test 3Ref 95 % (17.9 kN/m3) Ref 95 % (17.2 kN/m3)
Figure 22 - PANDA penetrograms Figure 23 – Gamma Densitometer

The Soil Compaction Meter - Trench 3 (8 tests)
0 ft
1 ft
2 ft
3 ft
4 ft
5 ft0 1 2 3 4
Number of passes
Dep
th (f
t)
test 1test 2
The Dynamic Cone Penetrometer - Trench 3 (15 tests)
0 ft
1 ft
2 ft
3 ft
4 ft
5 ft0 1 2 3 4 5 6 7 8
Number of blows
Dep
th (f
t) test 1test 2test 3Ref 95 %
Figure 24 – The soil compaction meter Figure 25 – The Dynamic Cone Penetrometer
PANDA - Trench 4 (3 tests)
0.0 ft
2.5 ft
5.0 ft0.1 1 10 100
DynamicCone Resistance (MPa)
Dep
th (f
t)
test 1 test 2 test 3 Reference curve 95 % Refusal curvel
Gamma Densitometer - Trench 4 (6 tests)
0.0 ft
2.5 ft
5.0 ft85 87 89 91 93 95 97 99
% of gd
Dep
th (f
t)
test 1 test 2 test 3 Ref 95 % (17.9 kN/m3) Ref 95 % (17.2 kN/m3)
Figure 26 - PANDA penetrograms Figure 27 – Gamma Densitometer

The Soil Compaction Meter - Trench 4 (5 tests)
0.0 ft
2.5 ft
5.0 ft0 1 2 3 4
Number of passes
Dep
th (f
t)
test 1test 2
The Dynamic Cone Penetrometer - Trench 4 (6 tests)
0 ft
3 ft
5 ft0 1 2 3 4 5 6 7 8 9 10 11 12
Number of blows
Dep
th (f
t) test 1test 2test 3Ref 95 %
Figure 28 – The soil compaction meter Figure 29 – The Dynamic Cone Penetrometer

A Soil Compaction Control Technology Assessment and Demonstration 26
10.5. Trench 5
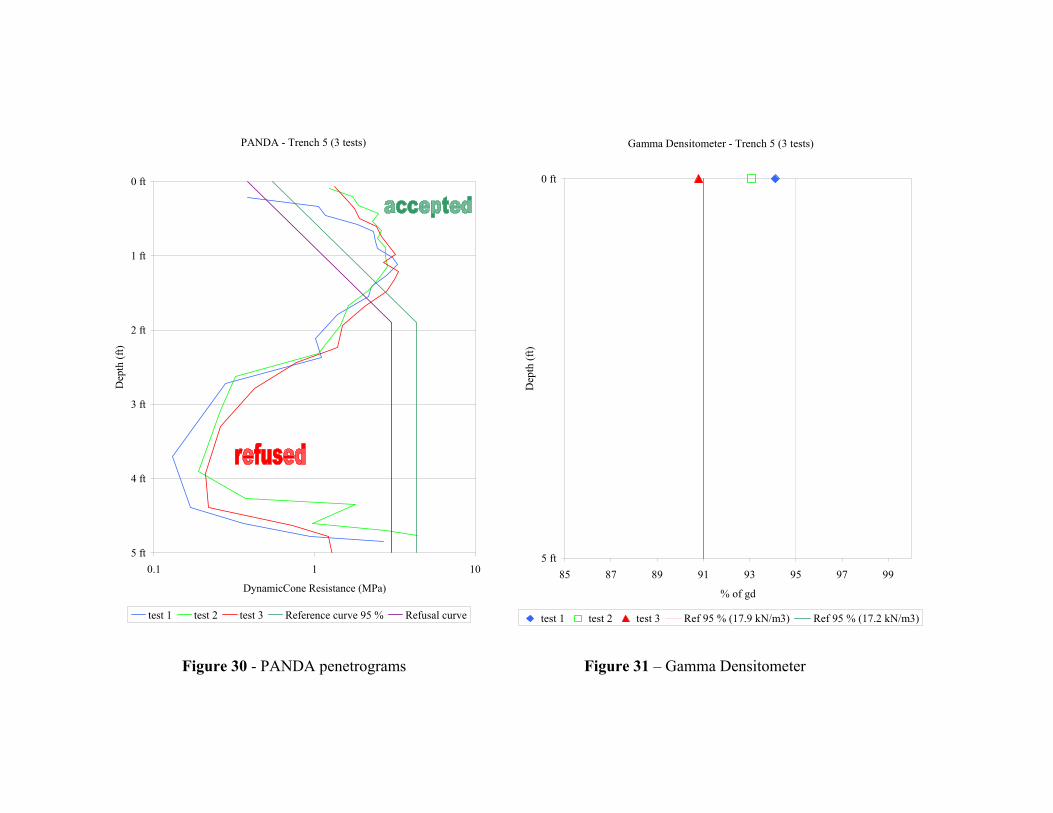
Figures 30 to 33 present the test results obtained for this trench, illustrating the following:
The Panda penetrograms indicate that at a depth exceeding 50 cm control test results are lowerthan the reference curve. The compaction doesn’t meet site specificationsThe Gamma Densitometer indicates that we have reached a value of 92% of γdmax. Thecompaction doesn’t meet site specifications. (*) (**)The Soil Compaction Meter stoplight is turned on after four passes of the vibro tamper. Thecompaction meets site specifications.The Dynamic Cone Penetrometer control test results are lower than the reference curve. Thecompaction doesn’t meet site specifications.
10.6. Trench 6
Figures 34 to 37 present the test results obtained for this trench, illustrating the following:
The Panda penetrograms indicate that control test results are higher than the reference curve.The compaction meets site specifications.The Gamma Densitometer indicates that we have reached an average value of 92% of γdmax.The compaction doesn’t meet site specifications. (*) (**)The stop light of the Soil Compaction Meter light after two passes of the vibro tamper. Thecompaction meets site specifications.The Dynamic Cone Penetrometer control test results are higher than the reference curve. Thecompaction doesn’t meet site specifications.
PANDA - Trench 5 (3 tests)
0 ft
1 ft
2 ft
3 ft
4 ft
5 ft0.1 1 10
DynamicCone Resistance (MPa)
Dep
th (f
t)
test 1 test 2 test 3 Reference curve 95 % Refusal curve
Gamma Densitometer - Trench 5 (3 tests)
0 ft
5 ft85 87 89 91 93 95 97 99
% of gd
Dep
th (f
t)
test 1 test 2 test 3 Ref 95 % (17.9 kN/m3) Ref 95 % (17.2 kN/m3)
Figure 30 - PANDA penetrograms Figure 31 – Gamma Densitometer

The Soil Compaction Meter - Trench 5 (2 tests)
0.0 ft
5.0 ft0 1 2 3 4 5
Number of passes
Dep
th (f
t)
test 1test2
The Dynamic Cone Penetrometer - Trench 5 (3 tests)
0 ft
5 ft0 1 2 3 4 5 6 7 8
Number of blows
Dep
th (f
t) test 1test 2test 3Ref 95 %
Figure 32 – The soil compaction meter Figure 33 – The Dynamic Cone Penetrometer

PANDA - Trench 6 (3 tests)
0 ft
1 ft
2 ft
3 ft
4 ft
5 ft0.1 1 10 100
DynamicCone Resistance (MPa)
Dep
th (f
t)
test 1 test 2 test 3 Reference curve 95 % Refusal curve
Gamma Densitometer - Trench 6 (15 tests)
0 ft
1 ft
2 ft
3 ft
4 ft
5 ft85 87 89 91 93 95 97 99
% of gd
Dep
th (f
t)
test 1 test 2 test 3 Ref 95 % (17.9 kN/m3) Ref 95 % (17.2 kN/m3)
Figure 34 - PANDA penetrograms Figure 35 – Gamma Densitometer
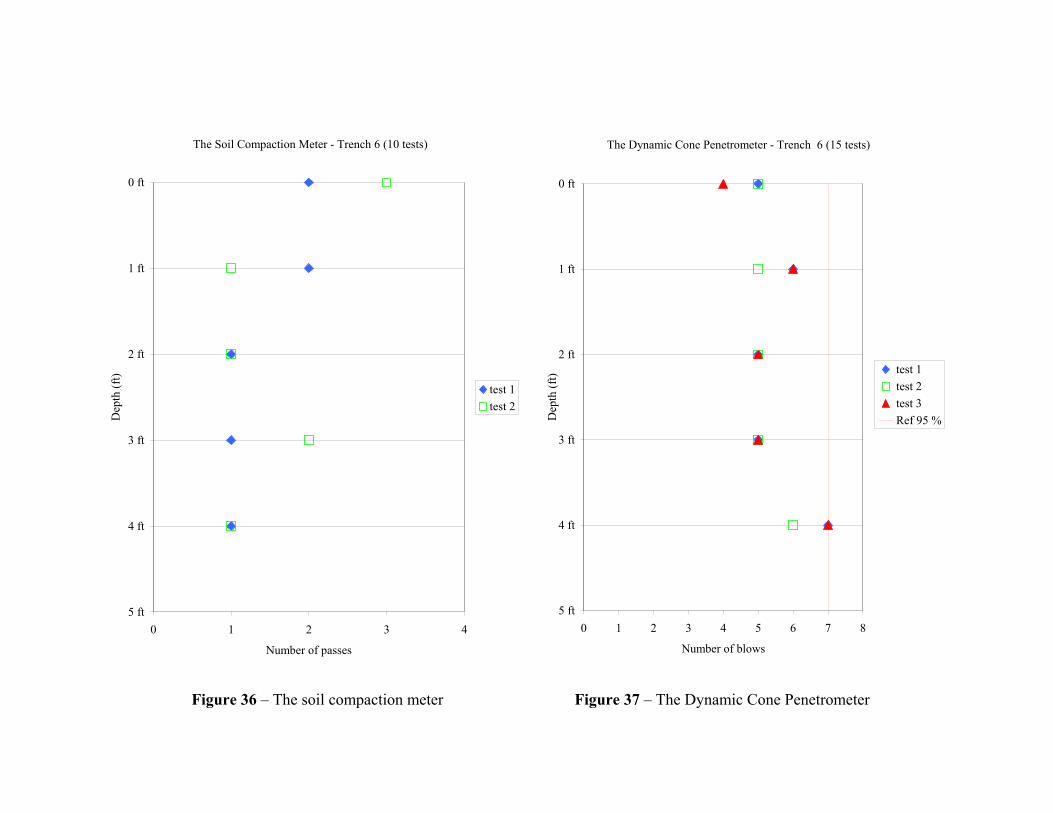
The Soil Compaction Meter - Trench 6 (10 tests)
0 ft
1 ft
2 ft
3 ft
4 ft
5 ft0 1 2 3 4
Number of passes
Dep
th (f
t)
test 1test 2
The Dynamic Cone Penetrometer - Trench 6 (15 tests)
0 ft
1 ft
2 ft
3 ft
4 ft
5 ft0 1 2 3 4 5 6 7 8
Number of blows
Dep
th (f
t) test 1test 2test 3Ref 95 %
Figure 36 – The soil compaction meter Figure 37 – The Dynamic Cone Penetrometer

A Soil Compaction Control Technology Assessment and Demonstration 32
11. Technical Performance Assessment
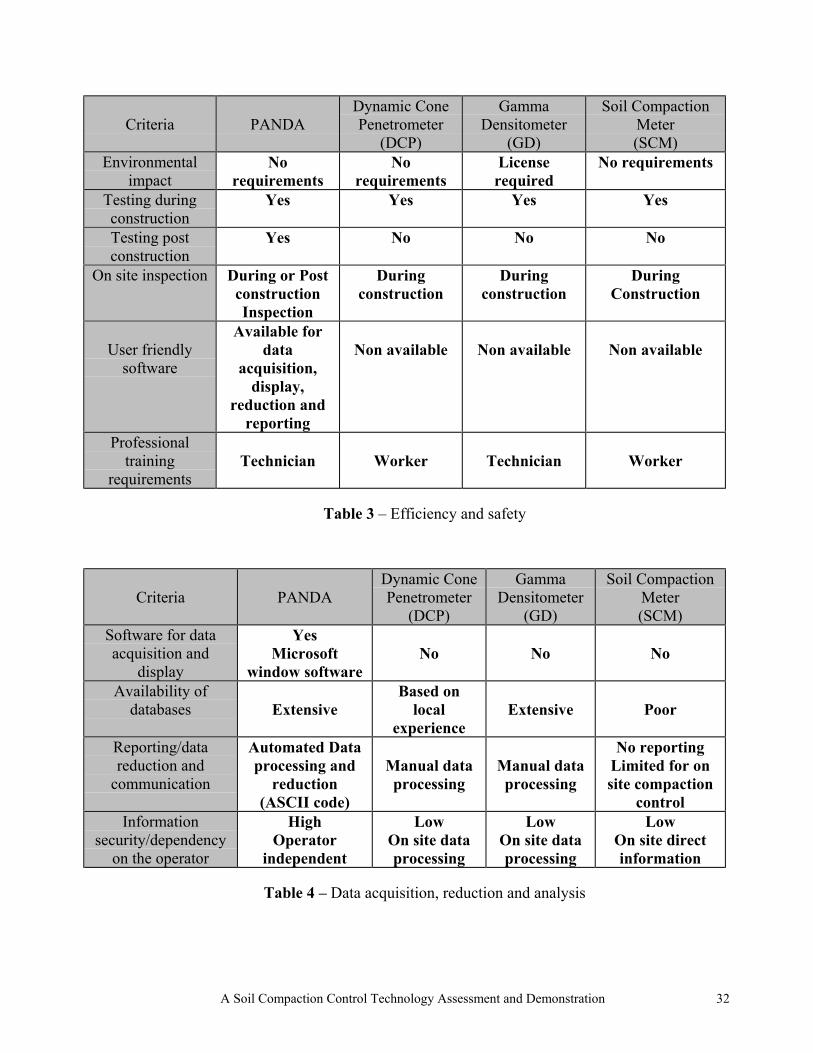
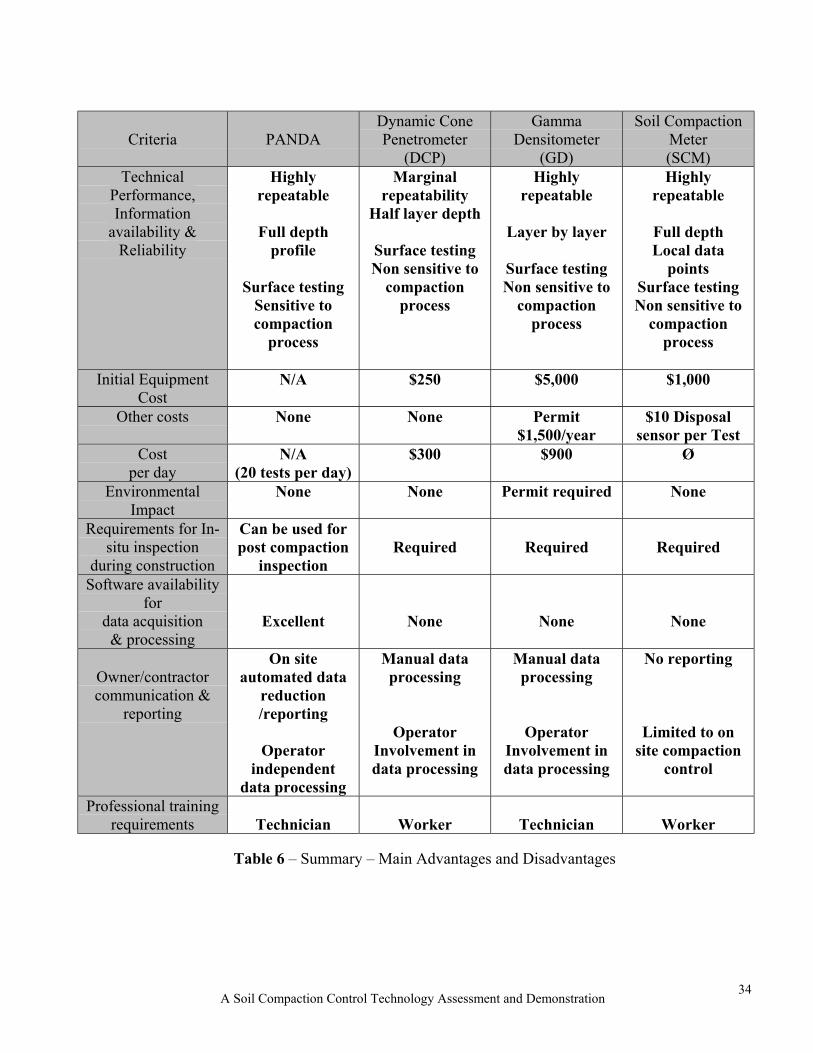
Tables 2 to 5 present a preliminary comparative assessment of the different testing techniquesunder consideration. This comparative assessment involves primarily (i) technical performanceevaluation, (ii) efficiency and safety, (iii) user friendly data acquisition and reduction software,and (iv) cost and required technical level. Table 6 briefly summarizes the main features underconsideration.
Criteria PANDADynamic ConePenetrometer
(DCP)
GammaDensitometer
(GD)
Soil CompactionMeter(SCM)
Availability ofNational and/or
Regional Standards
French standard (XPP 94-105)
No standardsIndustryspecific
ASTM D3017-88 / D
2922-91
No standardsManufactures
guidelinesAccuracy and
Repeatability (*)Highly repeatable RI = 60%
(Marginal)RI = 80%
(Good)Highly
repeatableDependency on
equipmentLow High Low Low
Precalibration forcompaction control
Laboratory tests forreference curves
LocalExperience
On siteProctor Tests
Manufacturedata
Dependency onoperator
Low High Low Low
Sensitivity to theCompaction Process
forPost Construction
Inspection
High
(Full soil profile)
Low
(Half a layer)
Low
(one footlayer)
Low
(Surface localdata)
Soil profile versusLocal Data per Layer
Soil Profile Local data Local data Local data
Depth affected Full Trench 6.5 inches(half a layer)
One foot layer Full Trench
Parameters for SoilCompaction Control
Operationindependent
measurements of qd.Empirical
correlations with soildensity for
compaction control.
Localcorrelations
for soilcompaction
control.
Directmeasurementof dry densityand moisture
content.
Yes/Nofor preset
compactioncontrol criteria.
Table 2 – Information Quality and Reliability
(*) Qualitative repeatability index RI= 1-(MV/ER)MV (Maximum Variation): Maximum variation between measured values for a given layer.ER (Expected Range): The variation between the maximum measured value and the value obtained for the non-compacted layer.
31
A Soil Compaction Control Technology Assessment and Demonstration 32
Criteria PANDADynamic ConePenetrometer
(DCP)
GammaDensitometer
(GD)
Soil CompactionMeter(SCM)
Environmentalimpact
Norequirements
Norequirements
Licenserequired
No requirements
Testing duringconstruction
Yes Yes Yes Yes
Testing postconstruction
Yes No No No
On site inspection During or PostconstructionInspection
Duringconstruction
Duringconstruction
DuringConstruction
User friendlysoftware
Available fordata
acquisition,display,
reduction andreporting
Non available Non available Non available
Professionaltraining
requirementsTechnician Worker Technician Worker
Table 3 – Efficiency and safety
Criteria PANDADynamic ConePenetrometer
(DCP)
GammaDensitometer
(GD)
Soil CompactionMeter(SCM)
Software for dataacquisition and
display
YesMicrosoft
window softwareNo No No
Availability ofdatabases Extensive
Based onlocal
experienceExtensive Poor
Reporting/datareduction and
communication
Automated Dataprocessing and
reduction(ASCII code)
Manual dataprocessing
Manual dataprocessing
No reportingLimited for onsite compaction
controlInformation
security/dependencyon the operator
HighOperator
independent
LowOn site dataprocessing
LowOn site dataprocessing
LowOn site directinformation
Table 4 – Data acquisition, reduction and analysis

A Soil Compaction Control Technology Assessment and Demonstration
Criteria PANDADynamic ConePenetrometer
(DCP)
GammaDensitometer
(GD)
Soil Compaction Meter(SCM)
Equipment N/A $250 $5,000 $1,000Permits andDisposableEquipment
N/A N/ALicense
$1,500 / year$10
disposable sensor pertest
Mob /Demob. None None
safetyrequirements for
transportationNone
Person x time pertest
1/15 minutes 1/5minutes 1/15 minutes 1/rapid
Cost/day N/A(20 tests per day)
$300 $900 Ø
Table 5 – Cost study
33
A Soil Compaction Control Technology Assessment and Demonstration
Criteria PANDADynamic ConePenetrometer
(DCP)
GammaDensitometer
(GD)
Soil CompactionMeter(SCM)
TechnicalPerformance,Information
availability &Reliability
Highlyrepeatable
Full depthprofile
Surface testingSensitive tocompaction
process
Marginalrepeatability
Half layer depth
Surface testingNon sensitive to
compactionprocess
Highlyrepeatable
Layer by layer
Surface testingNon sensitive to
compactionprocess
Highlyrepeatable
Full depthLocal data
pointsSurface testingNon sensitive to
compactionprocess
Initial EquipmentCost
N/A $250 $5,000 $1,000
Other costs None None Permit$1,500/year
$10 Disposalsensor per Test
Costper day
N/A(20 tests per day)
$300 $900 Ø
EnvironmentalImpact
None None Permit required None
Requirements for In-situ inspection
during construction
Can be used forpost compaction
inspectionRequired Required Required
Software availabilityfor
data acquisition& processing
Excellent None None None
Owner/contractorcommunication &
reporting
On siteautomated data
reduction/reporting
Operatorindependent
data processing
Manual dataprocessing
OperatorInvolvement indata processing
Manual dataprocessing
OperatorInvolvement indata processing
No reporting
Limited to onsite compaction
control
Professional trainingrequirements Technician Worker Technician Worker
Table 6 – Summary – Main Advantages and Disadvantages
34

A Soil Compaction Control Technology Assessment and Demonstration
12. Conclusion
The demonstration project has illustrated the critical need for a reliable soilcompaction control technology, capable of establishing the compaction processthroughout the full depth of the compacted backfill material.
The PANDA seems to provide a most effective and user-friendly tool for addressingthis critical need. It yields highly repeatable results and an engineering parameter qd,which is practically operator independent. With its user-friendly software, the PANDAallows an on-site data acquisition, processing, display and reporting.
The other three soil compaction control technologies: Gamma Densitometer, SoilCompaction Meter and Dynamic Cone Penetrometer, provide useful tools for on-sitecompaction control. However, data acquisition, processing and reporting is manuallydone and is therefore dependent on the operator. These tests do not provide full depthprofiles and therefore cannot be used for post-construction compaction control.
The PANDA can be most effectively used for post–construction site inspection as ityields a full depth compacted soil profile and, thereby, detects any anomaly/deviation inthe compaction process. With a relevant enforcement policy the PANDA could becomehighly cost effective, minimizing the need for on site inspection during the construction.
35