a society’s economic level and activity can be measured by using various indicators
TRANSCRIPT
A society’s economic level and activity
can be measured by using various
indicators.

Those indicators allow us to measure if a country is developed, developing, or
under-developed.
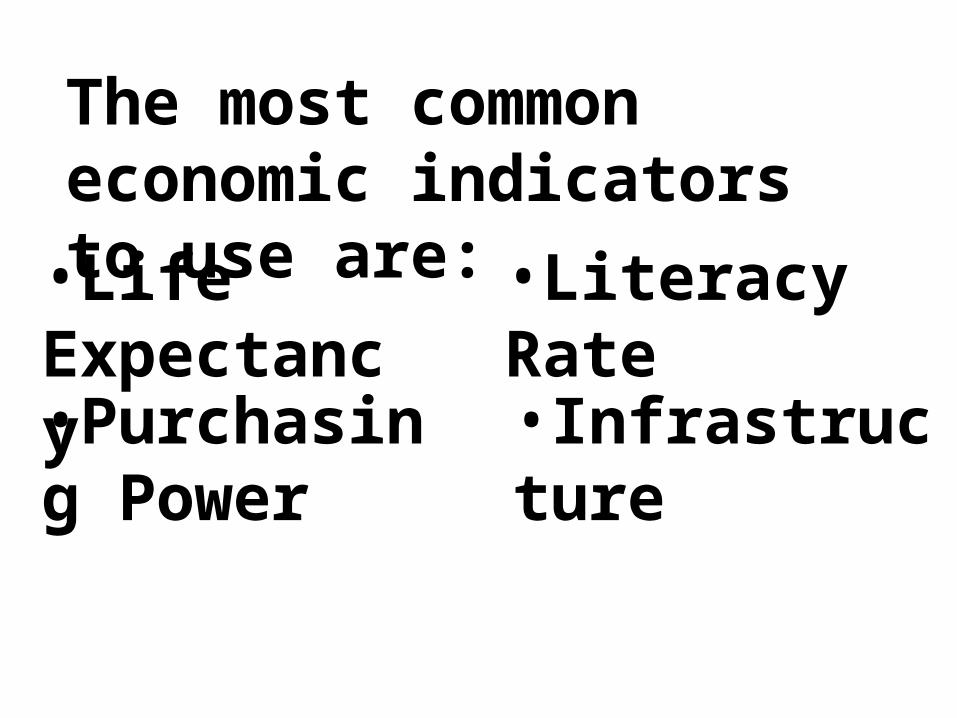
The most common economic indicators to use are:
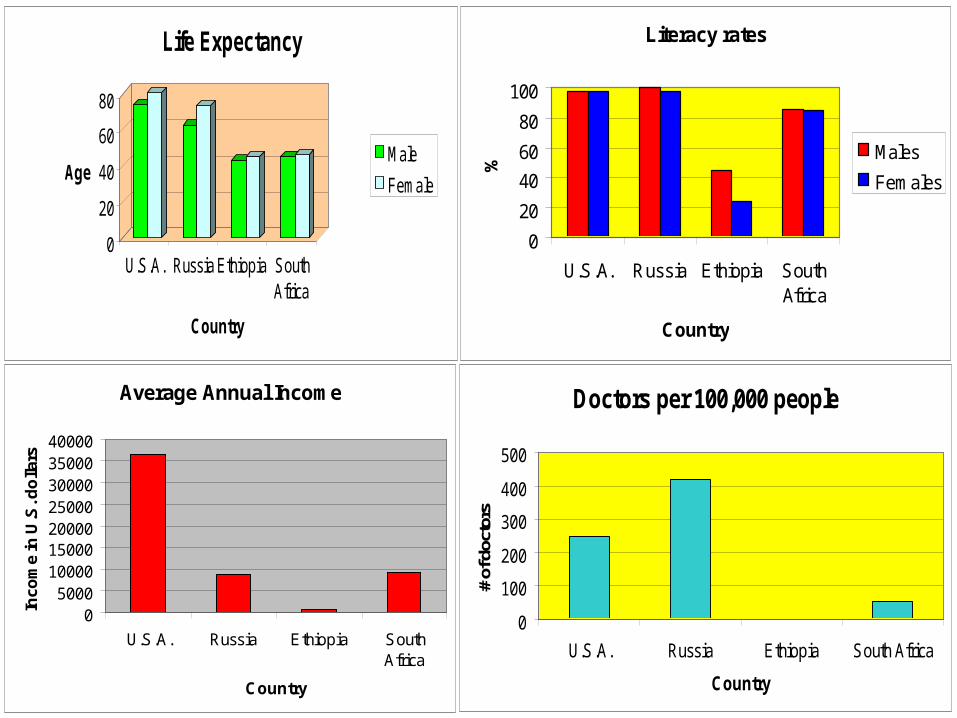
•Life Expectancy
•Literacy Rate
•Purchasing Power
•Infrastructure

Let’s look at each one and what it means.


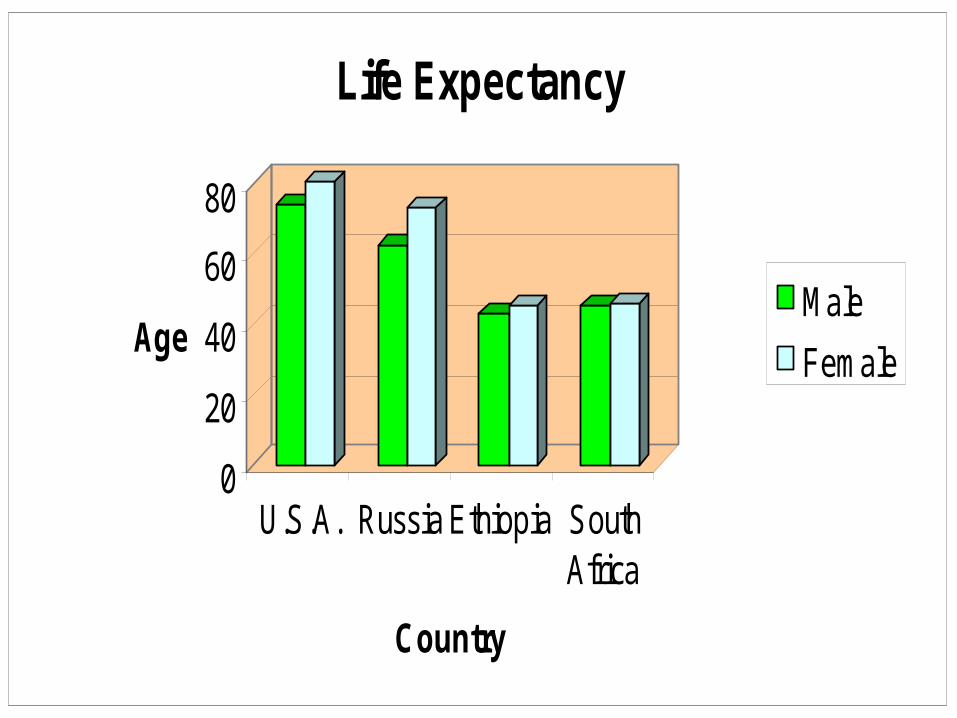
Life Expectancy: average number of years a person lives
What could be some reasons why a countries life expectancy is low?
0
20
40
60
80
Age
U.S.A. Russia Ethiopia SouthAfrica
Country
Life Expectancy
Male
Female

Literacy Rate: The ability to read and write.
How could a low literacy rate affect the economy of a country?

Literacy rates
0
20
40
60
80
100
U.S.A. Russia Ethiopia SouthAfrica
Country
%
Males
Females


Gross Domestic Product (GDP): The total value of the goods and services produced in a country during a given time period.
Which is better—a high GDP or a low GDP?

Gross Domestic Product
0
2
4
6
8
10
12
U.S.A. Russia Ethiopia South Africa
Country
$'s
gro
sse
d i
n t
rill
ion
s


Annual Income: Average income of a person for a year.
What factors could affect the average income of a person?

Average Annual Income
05000
10000150002000025000300003500040000
U.S.A. Russia Ethiopia SouthAfrica
Country
Inc
om
e in
U.S
. do
llars


Infrastructure: The basic facilities, services, and installations needed for the functioning of a community or society.
What do you consider to be basic services a country needs to function?

Doctors per 100,000 people
0
100
200
300
400
500
U.S.A. Russia Ethiopia South Africa
Country
# of
doc
tors


The different economic indicators you saw help you to determine if a country is developing, developed or under-developed.

Here’s what those words mean:
•Developed: high literacy rate, life expectancy; strong infrastructure

• Developing: Countries with few jobs, poor services, low literacy rate and life expectancy but the country is working to improve its peoples lives.

Under-developed:country that hasn’t yet started to improve the life of its people.


•Push factors: problems in an area that cause people to emigrate, or move away from, an area. i.e. war, famine, poverty, schooling, political or cultural oppression•Pull factors: advantages that cause people to immigrate, or move to, an area. i.e. higher standard of living, freedom, peace, educational opportunities, safety

Push factor countries
Pull factor countries
•Iraq
•Ethiopia
•Rwanda
•Cuba
•Mexico
•U.S.A.
•Australia
•Canada
•United Kingdom


0
20
40
60
80
Age
U.S.A. Russia Ethiopia SouthAfrica
Country
Life Expectancy
Male
Female
Literacy rates
0
20
40
60
80
100
U.S.A. Russia Ethiopia SouthAfrica
Country
%
Males
Females
Average Annual Income
05000
10000150002000025000300003500040000
U.S.A. Russia Ethiopia SouthAfrica
Country
Inco
me
in U
.S. d
olla
rs
Doctors per 100,000 people
0
100
200
300
400
500
U.S.A. Russia Ethiopia South Africa
Country
# of
doc
tors