a smarter way to score life insurance risk
TRANSCRIPT

Introduction
A smarter way to scorelife insurance risk

The model was built using MassMutual’s consolidated record of applications for which a laboratory test was ordered from 20 years of data. records exposure years observed deaths
1.5M 12M 23K
The attributes in the dataset cover:
Laboratory test results
Personal &family health history
Policy &underwriting information
Mortality outcome as of end of 2019
biophysical measurements (e.g., build, blood pressure)
liver function tests
kidney function tests
lipids
blood proteins
urine proteins
blood sugars
several indicators (e.g., cocaine)
Includes applications for policies placed, policies offered and not taken, and declined.
What’s in the lab data?
LifeScore Med360 is a predictive model that generates a mortality risk score based on an individual's personal and family health, and laboratory test results. The model was developed using machine learning applied to a massive underwriting data set that includes lab results and health and behavioral questionnaire for applicants going back 20 years. The result is a mortality risk model that has outperformed traditional underwriting.
ABOUT LIFESCORE MED360
Most underwriting models are trained to replicate underwriters’ decisions, so their optimal performance, if achieved, would match the quality of the decisions underwriters made in the past. Other models estimate risk based on alternate data sources that do not offer the protective value that a paramedical exam provides.
LifeScore Med360 was developed on the same underwriting data that have been proven in the industry for decades – medical history, medical exam and lab values. By using advanced machine learning techniques, the LifeScore Med360 model captures non-linear relationships and non-parametric interactions between variables. As a result, it is better at finding hidden risks and the ‘hidden healthy’ than rules-based and traditional underwriting processes.
LifeScore Labs is making this advanced scoring model available to all underwriters. Carriers can simply submit anonymized labs and application data through an API and immediately get a mortality risk score returned to the underwriter’s workbench or rules engine. Companies can improve their underwriting process with LifeScore Med360.
BETTER DATA MAKES A BETTER MODELLifeScore Med360 was developed by applying machine learning to a large and comprehensive underwriting data set from LifeScore Labs’ parent company, MassMutual.
With LifeScore Med360, carriers can:
Improve risk selection(reduced mortality losses)
Increase operational efficiency(faster decision with lower cost)

THE DATA SCIENCE BEHIND LIFESCORE MED360
Built for life insurance
LifeScore Med360 Key Facts
In the life insurance underwriting context, age, gender, and smoking status are among the biggest drivers of mortality risk; products, pricing, and underwriting guidelines are all built for cohorts defined by these variables. Our data scientists were challenged to maximize the predictive value of the inputs to stratify the risk associated with applicants within these cohorts.
For a deeper dive, review our white paper published on AI Magazine at: https://www.lifescorelabs.com/products/life-score-med360/. Some highlights are shown below.
LifeScore Med360 was built using a Random Survival Forest (RSF) method
Armed with training data that contains ground truth mortality outcomes and 49 underwriting inputs, RSF has a very high theoretical performance limit. And sure enough, it worked better than everything else we tried.
LifeScore Med360 went through a rigorous testing and validation process
LifeScore Med360 is updated to reflect health trends and with more data gets better overtime
Machine learning is only as good as the data on which it’s trained. To optimize performance, our data scientists tested and validated on multiple dimensions to guard against overfitting.
The data asset grows every year with:
feature selection variable transformation hyperparameter tuning sampling techniques
Extensive experiments iterated on:
Tree 1 Tree B
Consider cholesterol. Consistent with medical research, we observed that applicant cholesterol levels trended lower across time. We control for these temporal differences by applying a statistical adjustment to translate values to a consistent range. New applicant data
More exposure years
More observed deaths
By retraining the underlying model regularly, LifeScore Med360’s performance has improved with time.
A highly flexible and accurate ensemble method combining decisions trees, bagging, & random selection extended to survival data
Advantages Adaptively models non-linear effects & interactionsHandles mixed data typesEmbeds feature selectionCan provide out-of-bag estimates
Disadvantages Computationally intensive Challenging to interpret
<
< =
=
=
< <
= =
0.0009
0.0006
0.0003
0.0000
100 150 200 250 300
Cholesterol
Den
sity
Year Interval
1999-20022003-20062007-20102011-20142015-2019

PERFORMANCE OVERVIEW
We developed simulated underwriting decisions using LifeScore Med360 on historical applications to compare to the decisions reached by underwriters. In those comparisons, actuarial reviews demonstrated that:
LifeScore Med360 produced a best class (ultra-preferred) with 9% fewer deaths at 15 years.
Overall mortality experience improved by 10.5%. We've tried to estimate the effect of additional rules by over-riding the model decision if underwriters assigned substandard or decline.
LifeScore Med360 has been compared to traditional underwriting
Validation Process
Results:
We scored our historical applicants using LifeScore Med360.
We created a synthetic book of business to mirror the historical book such that the number of placements by risk class was equal for each year/cohort combination.
We conducted an experience study on the two books of business to compare actual to expected mortality (A/E).
LifeScore Med360 score was used to reassign risk class placements on an actual book of business. Some applicant profiles in the synthetic book of business were assigned to different classes than they had been assigned by underwriters, and some applicant profiles that had previously been declined by some underwriters were placed into one of the available risk classes.
LifeScore Med360 produced preferred risk classes with fewer deaths compared to underwriters’ historical decisions.
Standard and sub-standard/decline pools saw higher mortality rates, indicating that the model appropri-ately placed higher-risk applicants into higher-priced risk pools.
Findings: LifeScore Med360 produced preferred risk classes with fewer deaths compared to underwriters’ historical decisions.
Non-tobacco placement comparison. The mortality rate was normalized by the underwriter ultra-preferred A/E at 100.
Comparison of 850,000 applications received by MassMutual from 2000-2016.
HistoricalPlacementDecision
Med360PlacementDecision
Ultra-preferred 100 92
117119Select Preferred
168160Standard
367363Substandard/decline
1
2
3
4
LifeScore Med360 outperformed traditional underwriting, despite having fewer data sources available to it. Underwrit-ers screen for financial suitability, review prescription drug history, check MIB records, etc. for a more complete view of an applicant, yet LifeScore Med360 still outperformed traditional underwriting in our historical analysis without this additional information. As a result, these estimates of performance improvement are conservative.
LIFESCORE MED360 USE CASES – FROM SIMPLE TO ADVANCED
Use LifeScore Med360 to score your cases retroactively to assess the quality and consistency of your underwriting program.
Let LifeScore Med360 identify hidden risk – identify risky applicants to ensure that they are properly placed.
Use LifeScore Med360 to determine placement for applicants that meet your preferred class criteria.
Let LifeScore Med360 underpin your algorithmic underwriting process.
1
2
3
4
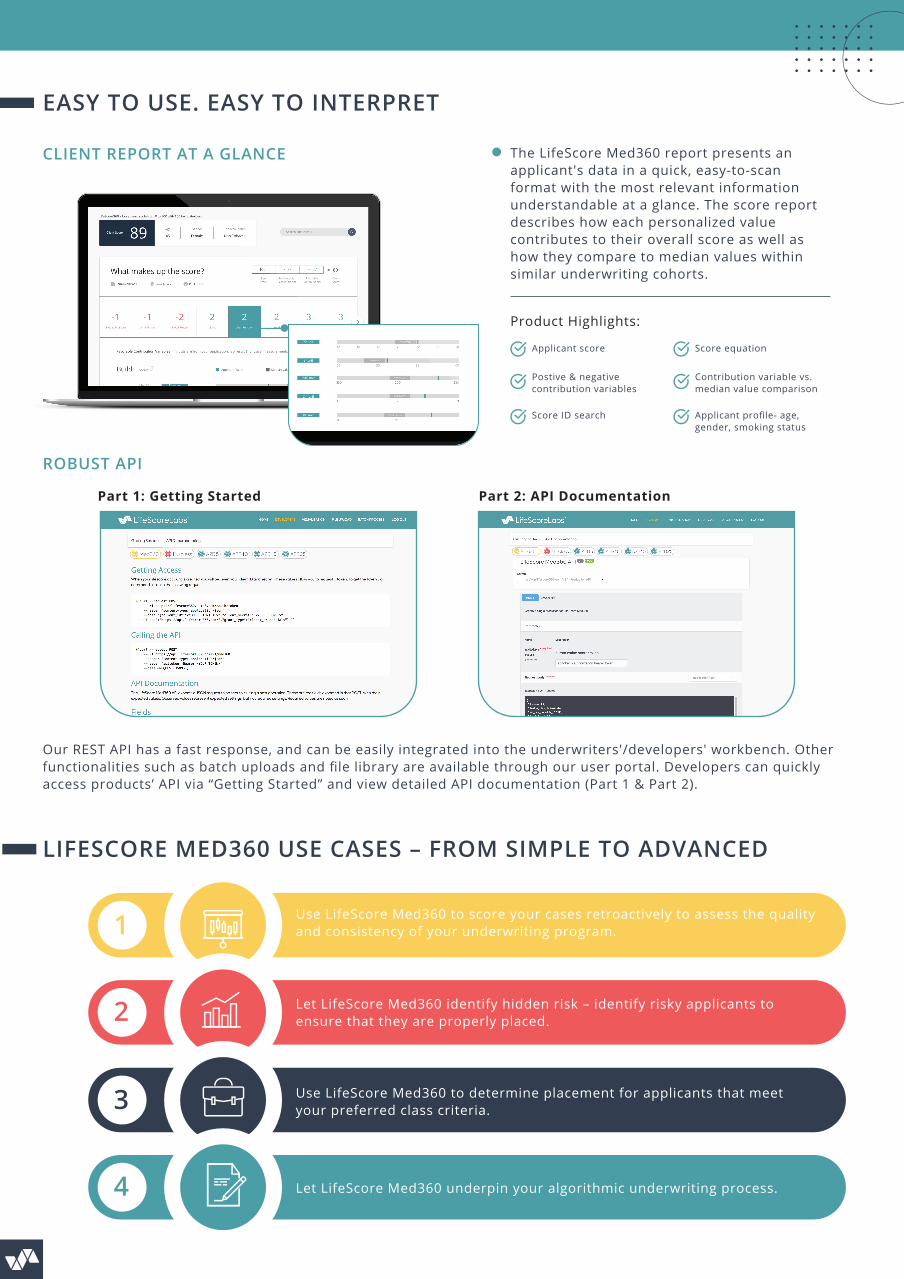
EASY TO USE. EASY TO INTERPRET
The LifeScore Med360 report presents an applicant's data in a quick, easy-to-scan format with the most relevant information understandable at a glance. The score report describes how each personalized value contributes to their overall score as well as how they compare to median values within similar underwriting cohorts.
Applicant score
CLIENT REPORT AT A GLANCE
ROBUST API
Product Highlights:
Applicant profile- age,gender, smoking status
Score equation
Postive & negative contribution variables
Score ID search
Contribution variable vs. median value comparison
Our REST API has a fast response, and can be easily integrated into the underwriters'/developers' workbench. Other functionalities such as batch uploads and file library are available through our user portal. Developers can quickly access products’ API via “Getting Started” and view detailed API documentation (Part 1 & Part 2).
Part 1: Getting Started Part 2: API Documentation

©LifeScore Labs, LLC 470 Atlantic Avenue, Boston, MA 02210. All rights reserved. CRN202205-265676
READY TO TALK?
[email protected] www.lifescorelabs.com