a small-scale response of urban bat activity to tree cover
TRANSCRIPT

A small-scale response of urban bat activity to tree cover
Lauren Moretto1& Lenore Fahrig1
& Adam C. Smith2& Charles M. Francis2
Published online: 26 March 2019# Springer Science+Business Media, LLC, part of Springer Nature 2019
AbstractBats in urban areas depend on trees, and bat activity increases with tree cover. To effectively manage bat habitat in cities, it isimportant to know the distance to which tree cover most strongly influences bats (i.e., the ‘scale of effect’). The aim of this studywas to estimate the scale of effect of tree cover on bats in Toronto, Canada. To achieve this, we measured bat activity at 52sampling sites across the city. We then examined the relationships between bat activity and percent tree cover measured withineach of 19 scales, 0.025 to 3.5 km in radius, surrounding each sampling site. We found that the scale of effect of percent tree coveron total bat and individual species activity ranged from 0.025 to 0.25 km among species. Our results suggest that adding orremoving urban trees influences bats up to 0.25 km away. Urban tree management decisions should consider the impacts to batsbeyond the site of management and within the surrounding landscape of a 250 m-radius scale.
Keywords Bats . Chiroptera . Cities . Tree canopy . Habitat management . Urbanization
Introduction
Areas of primarily natural or semi-natural land cover, evenvery small ones, provide habitat for wildlife in urban areas,containing resources for feeding, nesting, and refuge fromhuman disturbance (Dixon 2012; Pardee and Philpott 2014;Ferenec et al. 2014; Smith et al. 2014). Although large parks,including ravine systems or woodlots, contain the greatestbiodiversity in urban environments (Blair and Launer 1997;Cornelis and Hermy 2004; Avila-Flores and Fenton 2005;Beninde et al. 2015), natural habitat need not be a large, con-tiguous area to be important. In an urban area, a collection ofmany small areas of natural habitat can be just as valuable towildlife as a single large area of the same total size (Fahrig2017). For example, Smith et al. (2014) found that bird diver-sity responded as strongly to small residential green spaces
(e.g., backyards) as to larger non-residential green spaces, ona per-area basis. In other words, the summed effect of a largenumber of small green spaces was equivalent to the effect of alarge green space of the same total area.
Since areas of natural habitat in urban environments areoften small, many species access habitat over a large area toobtain sufficient resources. For example, white-striped free-tailed bat (Tadarida australis) in Brisbane, Australia commutenightly between day roosts in tree hollows to feeding areasabove floodplains and communal night roosts (Rhodes andCatterall 2008). Big brown bat (Eptesicus fuscus) in urbanGeorgia rely on parcels of forest and various buildings or treesto provide areas for foraging and roosting, respectively(Menzel et al. 2001). The network of nesting sites and forag-ing grounds between which birds and mammals commute inurban areas often changes seasonally due to changing resourceneeds or availability. This increases the total area of habitatupon which they rely throughout the year (Law and Dickman1998). For instance, Menzel et al. (2001) observed that femalebig brown bat in Georgia foraged in pine forests close tobuilding roosts during parturition, but foraged in hardwoodforests with higher prey densities but farther from roosts dur-ing lactation to satisfy increased energetic demands.Furthermore, the use of multiple areas of natural habitat byurban species means that adding or removing habitat in anurban landscape may influence species some distance away.For instance, Clark et al. (2007) found that the total amount ofgreen space and number of flowering plants within thesurrounding 1 km in urban environments positively affected
Electronic supplementary material The online version of this article(https://doi.org/10.1007/s11252-019-00846-w) contains supplementarymaterial, which is available to authorized users.
* Lauren [email protected]
1 Department of Biology, Carleton University, Ottawa, ON K1S 5B6,Canada
2 Canadian Wildlife Service, Environment and Climate ChangeCanada, National Wildlife Research Centre, Ottawa, ON K1A 0H3,Canada
Urban Ecosystems (2019) 22:795–805https://doi.org/10.1007/s11252-019-00846-w

butterfly species richness. Similarly, Melles et al. (2003)found that urban green space influenced ground- and shrub-nesting bird species occurrence up to 1 km away.
Tree cover comprises a large proportion of the natural hab-itat in urban environments and is important to urban species,providing food, shelter, and other resources (Dixon 2012;Pardee and Philpott 2014; Ferenec et al. 2014; Smith et al.2014). Furthermore, knowing the distance to which tree coverinfluences urban species is informative for management. Forexample, Pardee and Philpott (2014) found that the totalamount of tree cover in the surrounding 500 m and 2 km ofbackyard gardens positively influenced the abundance ofcavity- and ground-nesting bee species, respectively.Similarly, Ferenec et al. (2014) found that species richnessof birds at sampling sites was positively related to the propor-tion of tree cover within 500 m of those sites.
Many urban bats rely on trees to satisfy their requirementsfor roosts and foraging (van Zyll de Jong 1985). These treesare found throughout cities, in parks, along streets, and onprivate property such as in front and back yards. Bats movebetween trees in cities because they often forage some dis-tance away from their roosts (Duchamp et al. 2004;Duchamp and Swihart 2008; Dixon 2012). The resource re-quirements of bats also change seasonally, so theymay rely ondifferent trees throughout the year (Law and Dickman 1998).While a tree in the yard of a residential property may providean adequate summer roost, a tree in a parcel of forest with lessambient disturbance may be preferred for hibernation. Evenbats that roost in buildings commute to trees to forage aroundtheir canopies, and may also rely on them to provide an alter-nate roosting space (Evelyn et al. 2004).
To maintain bat populations in urban areas, it is important toknow the spatial extent over which tree cover in the surround-ing landscape influences bat activity at a site, that is, the ‘scaleof effect’ (Jackson and Fahrig 2012). When possible, estimat-ing species-specific scales of effect of tree cover can also pro-vide valuable information for management, considering differ-ences between species in life histories and home range sizes(van Zyll de Jong 1985). However, the scale of effect of treecover on temperate urban bats is not well known. Landscape-scale studies on urban bats often select only a single landscapescale for study, leading to uncertainty that the selected scale isin fact the scale of effect (e.g., Duchamp and Swihart 2008;Threlfall et al. 2012). Some previous studies suggest scales ofeffect between 0.1 and 3 km for urban bats, but they onlycompared a small number of scales (i.e., three or fewer; e.g.,Dixon 2012; Bazelman 2016; Gallo et al. 2018). Although oneEuropean study (Lintott 2015) measured habitat features withinseven landscape scales, the scale of effect was not estimated. Todate, Fabianek et al. (2011) and Ethier and Fahrig (2011) pro-vide the most precise estimates of the scale of effect for bats inNorth America, by measuring the relationship between batactivity and land cover within five or more scales. In
Montréal, Fabianek et al. (2011) found a 0.1 km scale of effectof forest and non-woody plant cover on urban bats, which wasalso the smallest landscape scale that they examined. In agri-cultural eastern Ontario, Ethier and Fahrig (2011) found scalesof effect of forest amount on bats of 1 – 5 km, depending on thespecies. The goal of this study was to estimate the scale ofeffect of tree cover on bat activity in Toronto, Canada’s largestcity, to quantify the spatial scale at which bat habitat manage-ment may be most effective.
Methods
We estimated the scale of effect of tree cover on totalbat activity and on the activity of individual speciesusing bat recorders at 52 sampling sites acrossToronto. We measured the percent tree cover within 19landscape scales with radii from 0.025 – 3.5 km thatwere centred on each sampling site. We then modelledthe relationship between bat activity and percent treecover at each spatial extent. We estimated the scale ofeffect as the radius with both a strong modelled rela-tionship between bat activity and percent tree cover anda strong model goodness-of-fit measure.
Tree cover as bat habitat
We defined bat habitat as the area covered by tree canopies of2m2 or larger. Trees of this size are used as habitat by all sevenbat species previously documented in Toronto. Some speciesroost among the foliage [eastern red bat (Lasiurus borealis),hoary bat (Lasiurus cinereus), and tri-colored bat (Perimyotissubflavus)], while others roost in cavities or under loose bark[big brown bat (Eptesicus fuscus), little brown myotis (Myotislucifigus), northern myotis (Myotis septentrionalis), andsilver-haired bat (Lasionycteris noctivagans) (van Zyll deJong 1985)]. All species also forage for insects either amongtrees or above the tree canopy (van Zyll de Jong 1985).Measuring tree cover of trees with a canopy of at least 2m2
excluded isolated saplings that we postulated would be toosmall to provide roosting space for bats (van Zyll de Jong1985; Kalcounis-Rüppell et al. 2005).
Buildings can be considered habitat for bat species that alsoroost in artificial structures [big brown bat, little brownmyotis, northern myotis, and silver-haired bat (van Zyll deJong 1985; Whitaker et al. 2006; Geluso and Mink 2009)].However, our objective was to estimate the scale of effect oftree cover on bats. Therefore, we controlled for percent build-ing cover in site selection (below). Depending on model fit,we also added an additional statistical control for percentbuilding cover to the models of species that roost in buildings.
796 Urban Ecosyst (2019) 22:795–805

Sampling site selection and measurement of percenttree cover
The overall objective of site selection was to simultaneouslymaximize the total number of sampling sites and the range ofpercent tree cover in the surrounding landscapes across sam-pling sites, at each of the 19 scales. To achieve this, we firstmapped percent tree cover in Toronto using the city’s Forestand Land Cover raster dataset (City of Toronto 2009) at a 2 mresolution. We then examined the range in percent tree coveracross the city by conducting a moving window analysis inArcGIS 10.3.1 (ESRI 2015), which calculated percent treecover around each pixel in the raster dataset for a given win-dow size. For this step, we used a circular window with aradius of 3.5 km, the largest landscape scale we considered.To maximize the range of percent tree cover across sites, wefirst identified pixels (potential sampling sites) having thehighest and lowest percent tree cover in the surrounding3.5 km-radius landscapes. We considered only pixels in resi-dential backyards with similar local characteristics (i.e., un-paved, with some trees, and without large, artificial structures,including swimming pools). We then verified that these po-tential sampling sites also maximized the range of percent treecover at smaller scales. To achieve this, we performed movingwindow analyses at 1 km and 2 km-radius landscape scales.
The next step in sampling site selection was to add poten-tial sites with intermediate percent tree cover. These were se-lected such that the number of sites in total was maximized,within the constraint that all selected sites were at least 1.8 kmapart to limit spatial autocorrelation in the bat responses.Although other species in our study area are known to travellonger distances while foraging, 1.8 km is the mean commut-ing distance of big brown bat, which is the most commonspecies in our study area (Brigham 1991). Following this,we adjusted site locations at a fine scale in ArcGIS to ensurethat all sites were at least 200 m from major arterial roads andhighways. This was to minimize the negative influences ofmajor roads, heavy traffic, and traffic noise on bat activityimmediately surrounding the sampling sites (Bennett andZurcher 2013; Kitzes and Merenlender 2014).
Lastly, we eliminated some sampling sites and fine-tunedthe position of the remaining sampling sites in ArcGIS to limitthe range in percent building cover in the surrounding land-scapes across sampling sites, thus controlling for buildingroost availability. This resulted in the elimination of thousandsof potential sites, since site selection was originally based onthe percent tree cover surrounding pixels and there were thou-sands of pixels in the raster dataset. Older buildings with larg-er footprints are commonly used by bats for roosting (Soperand Fenton 2007; Neubaum et al. 2007). Our goal was to limitthe range in availability of these buildings, but there was noavailable dataset for building age across the City of Toronto.However, Li and Wilkins (2014) documented a positive
relationship between overall building density and bat activity.Therefore, we used percent building cover as a proxy of build-ing roost availability, mapped with the Toronto BuildingOutlines shapefile (City of Toronto 2014a). We measured per-cent building cover by converting the building outline poly-gons into 2 m resolution raster datasets and conducting amoving window analysis with a 3.5 km-radius, circular win-dow to examine the range in percent building cover across thecity. We adjusted the sampling site locations such that thesurrounding landscapes had a narrow range in building cover,from 14 to 19% of the total landscape, at the 3.5 km-radiusscale. This range in percent building cover prevented siteplacement in the downtown urban core, where building den-sity is very high, and in non-urban areas, such as an agricul-tural area in the east end of the city.
The site selection process resulted in a final set of 52 sam-pling sites (Fig. 1), dispersed across the City of Toronto with awide range in percent tree cover (15–49%) and a narrow rangein percent building cover (14–19%) in the surrounding3.5 km-radius landscapes. We visited each site to verify thesimilarity among sites in local characteristics and to obtain theapproval of homeowners to set up sampling equipment.
After confirming the sampling site locations, we measuredpercent tree cover in 19 circular landscape scales in ArcGIS,centered around each site (i.e., 0.025, 0.05, 0.1, 0.2, 0.25, 0.5,0.75, 1, 1.25, 1.5, 1.75, 2, 2.25, 2.5, 2.75, 3, 3.25, and 3.5 km;Fig. 2a, b) using the Forest and LandCover raster dataset (Cityof Toronto 2009). To measure percent tree cover around eachsite at each landscape scale, we divided the measured numberof tree cover pixels in a circular landscape surrounding eachsite by the maximum possible number of pixels within thatlandscape scale, and multiplied this value by 100. We alsoverified that the range of percent tree cover across sites wassimilar among the 19 scales by using a boxplot to visuallycompare the ranges among scales (Fig. 1S).
Bat surveys
We surveyed bat activity at each of the 52 sampling sites byrecording bat calls using Wildlife Acoustic SM2+ recorderswith SMX-U1 microphones. Calls were recorded betweenMay 30 and August 8, 2017, the period of summer residencyfor Ontario bat species (van Zyll de Jong 1985). At each site, wepositioned one recorder two meters above the ground with itsmicrophone angled 45° downwards to protect the microphonesfrom potential rain. We recorded bat calls continuously fromsunset to sunrise over two, non-consecutive nights per site.
To ensure that the date of sampling did not confound theeffects of tree cover, we sampled bat activity at four samplingsites per night that varied in percent tree cover in the surround-ing landscapes. The combination of four sites sampled eachnight contained one site with low percent tree cover, one sitewith high percent tree cover, and two sites with intermediate
Urban Ecosyst (2019) 22:795–805 797

percent tree cover at both the 1 km and 3.5 km-radius land-scape scales (Fig. 2c–e). After all sites were sampled once, webegan a second round of sampling on June 21, 2017. Weensured that each night’s combination of sites visited in thesecond round was different from that of the first round.
Potential confounding variables
The main objective of the study was to identify the scale ofeffect of tree cover on bat activity in an urban environment.However, bat activity around a recorder is likely to be influ-enced by variables other than tree cover, which might obscurethe relationship between bat activity and surrounding tree cov-er. We controlled for this by collecting data only during goodweather (i.e., no rain, average wind speed below 20 km/h,average wind gusts below 25 km/h, and average nightly tem-perature above 9 °C), and by ensuring minimal human distur-bance during data collection (i.e., avoiding sampling over-night on Fridays, Saturdays, and holidays). At each site, we
also deployed one Onset HOBO Pendant Temperature andLight Data Logger and one Digi-Sense Data Logging LightMeter to measure temperature (°C) and light intensity (lux) at10 min increments during the recording period.
Although we had tried to minimize variation in the surround-ing building cover among sampling sites during site selection,there was a greater range in percent building cover at smallerlandscape scales than at larger landscape scales (Fig. 1S).Percent building cover was also negatively correlated (r = 0 to−0.65) with percent tree cover (Fig. 2S). Because both buildingcover and tree cover may be habitat for many bat species, andthey were negatively correlated in our sample, we included per-cent building cover to avoid biasing our estimate of the effect oftree cover (i.e., suppressor effects, see Smith et al. 2009).
Quantifying bat activity and identifying bat species
Bat activity was indexed as the number of bat passes persampling site. A bat pass is a grouping of echolocation pulses
Fig. 1 Locations of 52 bat sampling sites in Toronto, Canada. Samplingsites are indicated as black points. Circles around each site are not to scale,but represent percent tree cover in the surrounding, circular landscape
with a 3.5 km radius. Note that percent tree cover was analyzed as acontinuous variable in models
798 Urban Ecosyst (2019) 22:795–805

separated by at least one second of silence from the next pulse(Coleman and Barclay 2012; Griffin et al. 1960; seesupplementary material Fig. 3S for more information).
Bats can be identified to species using the acoustic charac-teristics of the echolocation pulses. To identify each pass tospecies, we compared the results of two identification soft-ware programs to account for discrepancies in their identifica-tion algorithms (Lemen et al. 2015), and reviewed each passmanually to confirm the identity. These were the Bats of NorthAmerica 3.1.0 classifier package in Kaleidoscope Pro 3.1.1.(Wildlife Acoustics 2015) and a quadratic discriminate func-tion analysis model (QDFA) created by Ethier and Fahrig(2011), which used reference calls from the Fenton
Laboratory (Hooton and Adams, unpublished data,University of Western Ontario). We included only the sevenspecies of bats that have been documented in Toronto as pos-sible outcomes for each program [i.e., big brown bat(Eptesicus fuscus), eastern red bat (Lasiurus borealis), hoarybat (Lasiurus cinereus), silver-haired bat (Lasionycterisnoctivagans), little brown myotis (Myotis lucifugus), northernmyotis (Myotis septentrionalis), and tri-colored bat(Perimyotis subflavus)].
We analysed bat activity for all bats combined, as tree coveris used by all of the species in our study, and the aim of ourstudy was to provide information about the scale at which treecover might be managed for bats. The activity of all species
Fig. 2 (a) An example sampling site surrounded by the 19 circularlandscapes in which percent tree cover was measured. Landscapesranged between 0.025 km and 3.5 km in radius. (b) A closeup of thesmallest landscape scales in (a) measuring between 0.025 km and
0.25 km in radius. Examples of landscapes with (c) low, (d) medium,and (e) high percent tree cover within 1 km of the sampling site, and lessthan 20% of tree cover in parks
Urban Ecosyst (2019) 22:795–805 799

combined is also a relevant measure for bat conservation, as itmay be an index of arthropod suppression by bats, an impor-tant ecosystem service that they provide (Kunz et al. 2011). Inaddition, by using total bat activity we were able to includeunidentified passes in the analysis. We also analysed the ac-tivity of two individual species (big brown bat and eastern redbat), and a species group containing passes of hoary bat andsilver-haired bat.We were conservative in our identification ofbat passes to species, and did not identify a pass unless wewere confident in its identity. We combined hoary bat andsilver-haired bat because we had difficulty discriminating theirpasses in our recordings, as they were often not confidentlyidentified by the identification software programs (A. Adams,personal communication). We note that they have often beengrouped in previous studies due to similar features of their lowfrequency calls (Humbolt State University Bat Lab 2011;Baerwald and Barclay 2011; Nagorsen et al. 2014), and bothspecies commonly use trees as roosts (van Zyll de Jong 1985).Due to the low numbers of calls identified to little brownmyotis, northern myotis, and tri-colored bat, these specieswere only included in the analyses of total bat activity.
Statistical analysis
We used generalized linear mixed models (GLMM) to estimatethe relationship between each of the four bat activity responsevariables (total bat activity and activity of each of the speciesand species group) and percent tree covermeasuredwithin eachof the 19 spatial scales. Therefore, for each bat response vari-able there were 19 models, one for each landscape scale. Sincebat activity was surveyed twice at each sampling site, modelscontained a random effect of site, to account for repeated sam-pling within sites. Each model also contained the potential con-founding effects of standardized mean nightly temperature (°C)and Julian date. The light-intensity loggers did not register anyvariance in light intensity (lux) among sites and nights, so luxwas not included in any models. We included percent buildingcover at the 1 km-radius landscape scale in the GLMM as astatistical control based on both model fit and the roostingbehaviour of each species. Firstly, we controlled for percentbuilding cover at the 1 km-radius scale because the AIC valuesof the 19models with building cover included at this scale werelower overall than those with percent building cover included atother scales (e.g., 0.5 km or 1.5 km). Then, for each bat activityresponse variable, we compared AIC values of the 19 modelswith and without the control for percent building cover at the1 km scale. AIC values were lower in models without percentbuilding cover for eastern red bat, a species that does not roostin buildings, so percent building cover was not included infurther analyses for this species. We modeled bat activity witha negative binomial error and a log link function, based on thedistributions of the response variables in histograms and resid-ual plots.
Then, we estimated the scale of effect of percent tree coverfor each response variable by evaluating both the model fit(AIC values) and the strength of the relationship between a batactivity response variable and percent tree cover (regressioncoefficients) of each model. AIC values were examined firstand indicated the scales at which the data best fit the model.All scales with a ΔAIC of 2 or less were identified as impor-tant scales (Burnham and Anderson 2004), but the scale withthe largest regression coefficient was deemed the scale of ef-fect. We examined the regression coefficient to verify that theselected model also showed a strong relationship between abat activity response variable and percent tree cover. We usedMoran’s I tests to determine whether the residuals of themodels were spatially autocorrelated. All analyses were con-ducted in R version 3.4.1. (R Core Team 2017), using theMASS, glmmADMB (Bolker et al. 2012), ape (Paradis et al.2017), psych (Revelle 2017), ggplot2 (Wickham and Chang2016), dplyr (Wickham et al. 2017), and corrplot (Wei et al.2017) packages.
Finally, we evaluated the importance of park trees to totalbat activity at the scale of effect of percent tree cover. Toachieve this, we used Toronto’s Zoning By-law layer (Cityof Toronto 2014b) to measure the percent tree cover withinparks around each sampling site at the scale of effect inArcGIS, and correlated this to total bat activity.
Results
We recorded 7593 bat passes. Forty-nine percent of these wereidentified as big brown bat (Eptesicus fuscus), 6% as easternred bat (Lasiurus borealis), 21% as hoary bat (Lasiuruscinereus)/ silver-haired bat (Lasionycteris noctivagans), and1% as little brown myotis (Myotis lucifugus)/ northern myotis(Myotis septentrionalis)/ tri-colored bat (Perimyotissubflavus). Twenty-three percent of passes (i.e., 1741 passes)could not be identified to species or species group. The aver-age number of bat passes per sampling site was 73 (range 7–296), with an average of 8.1 passes per hour (range 0.8–31.6).IncludingMyotis species and tri-colored bat, on average, therewere 3 species and/or species groups per site (range 1–4).
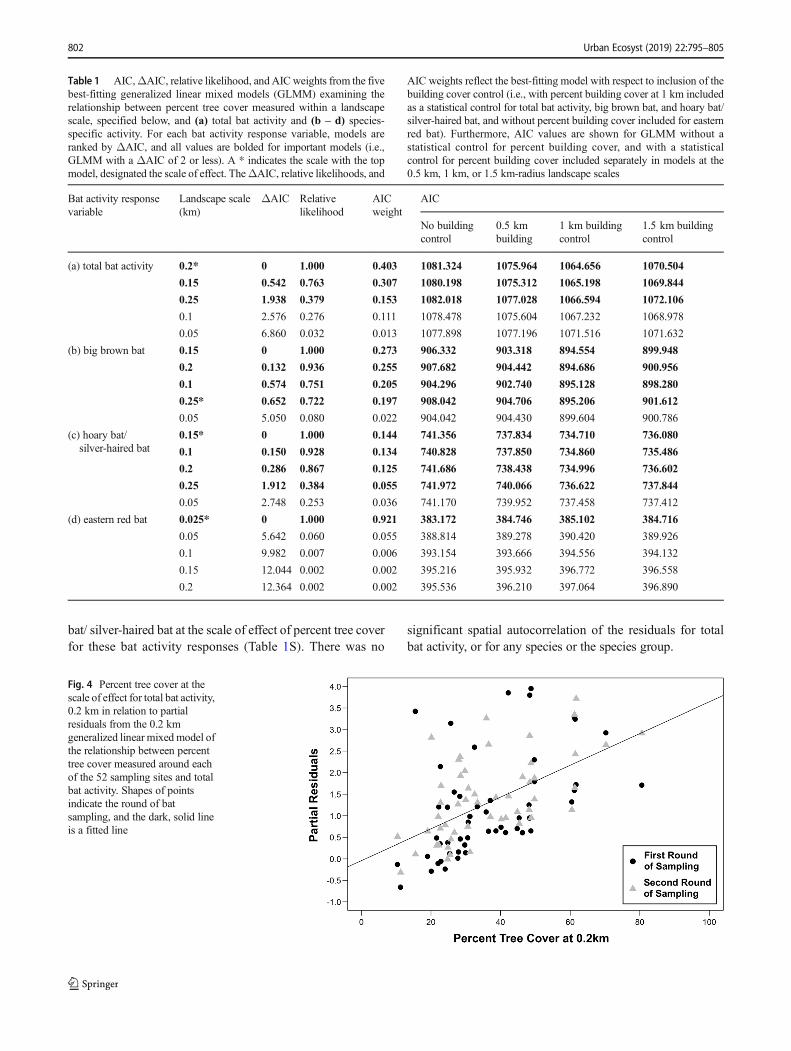
Total bat activity most strongly related to percent tree coverwithin the 0.2 km-radius landscape scale, though tree coverwas also important at the 0.15 and 0.25 km-radius scales (Fig.3a, Table 1, 1S). Total bat activity increased by 44% for each10% increase in tree cover, with the predicted total number ofpasses ranging from 22 to 287. Including site-level randomeffects and percent building cover at the 1 km scale in themodels strengthened the relationship between total bat activityand percent tree cover at this scale of effect (i.e., 0.2 km) whencompared to this relationship without these variables included(Fig. 4). The scale of effect of percent tree cover differedamong species/ species groups. Big brown bat and hoary
800 Urban Ecosyst (2019) 22:795–805

bat/ silver-haired bat showed strongest relationships at0.25 km and 0.15 km, respectively (Fig. 3b, c), although treecover was generally important between 0.1 and 0.25 km-radi-us landscapes for these species. Eastern red bat had a smaller
scale of effect at 0.025 km (Fig. 3d), the only landscape scaleat which tree cover was important to this species. There wasalso a positive effect of percent building cover within a 1 km-radius landscape on total bat activity, big brown bat, and hoary
Fig. 3 Regression coefficients(black dots) ± SE (vertical lines)and ΔAIC values (red dots) fromgeneralized linear mixed modelsof the relationship between thepercent tree cover in landscapesand (a) total bat, (b) big brownbat, (c) hoary bat/ silver-hairedbat, and (d) eastern red batactivity. Bat activity wasmeasured at 52 sampling sitesdistributed across Toronto,Canada. Percent tree cover wasmeasured within each of 19circular landscape scales withradii between 0.025 km and3.5 km surrounding the samplingsites. The scale of effect (verticaldashed line) was selected basedon the model AIC value andregression coefficient of percenttree cover
Urban Ecosyst (2019) 22:795–805 801
bat/ silver-haired bat at the scale of effect of percent tree coverfor these bat activity responses (Table 1S). There was no
significant spatial autocorrelation of the residuals for totalbat activity, or for any species or the species group.
Table 1 AIC,ΔAIC, relative likelihood, andAICweights from the fivebest-fitting generalized linear mixed models (GLMM) examining therelationship between percent tree cover measured within a landscapescale, specified below, and (a) total bat activity and (b – d) species-specific activity. For each bat activity response variable, models areranked by ΔAIC, and all values are bolded for important models (i.e.,GLMM with a ΔAIC of 2 or less). A * indicates the scale with the topmodel, designated the scale of effect. TheΔAIC, relative likelihoods, and
AIC weights reflect the best-fitting model with respect to inclusion of thebuilding cover control (i.e., with percent building cover at 1 km includedas a statistical control for total bat activity, big brown bat, and hoary bat/silver-haired bat, and without percent building cover included for easternred bat). Furthermore, AIC values are shown for GLMM without astatistical control for percent building cover, and with a statisticalcontrol for percent building cover included separately in models at the0.5 km, 1 km, or 1.5 km-radius landscape scales
Bat activity responsevariable
Landscape scale(km)
ΔAIC Relativelikelihood
AICweight
AIC
No buildingcontrol
0.5 kmbuilding
1 km buildingcontrol
1.5 km buildingcontrol
(a) total bat activity 0.2* 0 1.000 0.403 1081.324 1075.964 1064.656 1070.504
0.15 0.542 0.763 0.307 1080.198 1075.312 1065.198 1069.844
0.25 1.938 0.379 0.153 1082.018 1077.028 1066.594 1072.106
0.1 2.576 0.276 0.111 1078.478 1075.604 1067.232 1068.978
0.05 6.860 0.032 0.013 1077.898 1077.196 1071.516 1071.632
(b) big brown bat 0.15 0 1.000 0.273 906.332 903.318 894.554 899.948
0.2 0.132 0.936 0.255 907.682 904.442 894.686 900.956
0.1 0.574 0.751 0.205 904.296 902.740 895.128 898.280
0.25* 0.652 0.722 0.197 908.042 904.706 895.206 901.612
0.05 5.050 0.080 0.022 904.042 904.430 899.604 900.786
(c) hoary bat/silver-haired bat
0.15* 0 1.000 0.144 741.356 737.834 734.710 736.080
0.1 0.150 0.928 0.134 740.828 737.850 734.860 735.486
0.2 0.286 0.867 0.125 741.686 738.438 734.996 736.602
0.25 1.912 0.384 0.055 741.972 740.066 736.622 737.844
0.05 2.748 0.253 0.036 741.170 739.952 737.458 737.412
(d) eastern red bat 0.025* 0 1.000 0.921 383.172 384.746 385.102 384.716
0.05 5.642 0.060 0.055 388.814 389.278 390.420 389.926
0.1 9.982 0.007 0.006 393.154 393.666 394.556 394.132
0.15 12.044 0.002 0.002 395.216 395.932 396.772 396.558
0.2 12.364 0.002 0.002 395.536 396.210 397.064 396.890
Fig. 4 Percent tree cover at thescale of effect for total bat activity,0.2 km in relation to partialresiduals from the 0.2 kmgeneralized linear mixed model ofthe relationship between percenttree cover measured around eachof the 52 sampling sites and totalbat activity. Shapes of pointsindicate the round of batsampling, and the dark, solid lineis a fitted line
802 Urban Ecosyst (2019) 22:795–805

At the scale of effect of percent tree cover on total batactivity (0.2 km), we found that greater than 70% of tree coverwas located outside of parks for 48 of 52 sampling sites, andthere was no tree cover in parks around 17 of those sites. Inaddition, there was only a weak correlation between total batactivity and the percent tree cover within parks at the 0.2 kmscale (r = 0.02).
Discussion
We found that percent tree cover most strongly influenced theactivity of urban bats over a small landscape scale. Percenttree cover within 0.2 km from our sampling sites (i.e., the scaleof effect) had the strongest influence on total bat activity,though tree cover was also important between 0.15 and0.25 km. Previously documented scales of effect for temperatebats ranged from 0.1 – 5 km (Ethier and Fahrig 2011;Fabianek et al. 2011; Dixon 2012; Bazelman 2016; Galloet al. 2018), although 0.1 km was the smallest scale measuredin two of those studies (Fabianek et al. 2011; Dixon 2012).
It is possible that the small scale response of urban bats totree cover reflects the general influence of urban environmentson bat activity and life histories. Since urban infrastructure,such as major roads, heavy traffic, and artificial lighting, candisrupt the movement of bats (Russell et al. 2009; Bennett andZurcher 2013; Moretto and Francis 2017), this could confinebat foraging activity, and reduce the scale over which tree coverinfluences bat activity. It is also possible that the tendency ofinsects to aggregate in urban environments (e.g., around treesor lights) drives localized bat foraging activity. Insectivorousbats frequently forage around insect aggregations (Müller et al.2012), and most bats in Toronto forage within 40 m of treecanopies (Janzen and Fenton 2013). Street trees and trees onprivate property in cities are often spaced for aesthetics, pro-viding ample area for insects to aggregate and bats to forage.Tree cover farther away may not be as important to bats if treecover in the vicinity is sufficient to provide insects. Futureresearch should evaluate how insect distributions influencethe small-scale response of bats to tree cover in urban areas.
Individual species also showed small-scale responses topercent tree cover, mostly ranging between 0.1 and 0.25 km.Eastern red bat showed an even smaller-scale response to per-cent tree cover, with a scale of effect at 0.025 km. We specu-late that the differences in scale of response to tree coveramong species may relate to different uses of habitat featuresin urban environments. Both big brown bat and silver-hairedbat roost in artificial structures (van Zyll de Jong 1985;Whitaker et al. Whitaker et al. 2006; Geluso and Mink2009), and we found a strong, positive influence of percentbuilding cover within 1 km of our sampling sites for thesespecies (Table 1). These were also the species with thelargest-scale responses to percent tree cover. It is possible that
this larger-scale influence of tree cover reflects their use of thelandscape over a larger extent, perhaps commuting betweenroosts in buildings and trees for foraging or alternative roosts.Eastern red bat do not roost in buildings, so it is possible theirsmaller scale of effect reflects a shorter commute between treeroosts and foraging grounds. Hoary bat are also tree-roostingobligates and silver-haired bat commonly roost in trees (vanZyll de Jong 1985), which may have contributed to the slight-ly smaller scale of effect for hoary bat/ silver-haired bat(0.15 km) in comparison to big brown bat (0.25 km). Thestrong influence of building cover on the activity ofbuilding-roosting species also suggests that buildings maybe critical habitat features to bats in urban environments.
Although not the primary goal of this study, our results alsosuggest that the total urban tree cover, not just that in parks,influences bats within 0.2 km. All sampling sites in this studywere in residential backyards, surrounded mostly by trees out-side of parks at the 0.2 km scale (i.e., > 70% of tree cover wasoutside of parks for 48 of 52 sites). We found a weak correlation(r = 0.02) between total bat activity and the percent tree coverwithin parks at this scale. This suggests that non-park trees (i.e.,street trees and trees on private property) are the main drivers ofthe overall positive relationship between tree cover and batactivity.
Although there are no North American studies that directlycompare the importance of trees within parks and outside ofparks to bats, our results are supported by other studies thathave noted the importance of all local tree and vegetationcover in residential neighbourhoods to invertebrates, amphib-ians, birds, and other wildlife (Fernandez-Juricic 2000;Sperling and Lortie 2010; Lerman and Warren 2011;Scheffers and Paszkowski 2013; Pardee and Philpott 2014;Belaire et al. 2014; Smith et al. 2014). Conversely, one studyin Vitória, Brazil that compared the influence of parks to othertreed space on urban bat diversity found a much strongereffect of parks than wooded streets (Opera et al. 2009). Thisdifference might be because most of the captured bats (92%)in their study were not insectivores, while all of the bat speciesin our study are insectivores. Resources for insectivorous batsare often more abundant throughout urban environments thanare resources for other bats (Bredt and Uieda 1996; Silva et al.1996). It is possible that resources for non-insectivorous batswere concentrated in urban parks in Vitória.
This study provides information useful for the managementof bat habitat in cities. Firstly, the small scale responses of batsto tree cover suggests that land management decisions shouldconsider the impacts of the addition or removal of tree covernot just at the site of addition or removal, but within approx-imately the surrounding two residential city blocks. To sup-plement our understanding of the small-scale responses of batsto tree cover, future research should examine the influence ofprey distributions on bat activity in urban areas. Furthermore,while our study was not designed to evaluate the influence of
Urban Ecosyst (2019) 22:795–805 803

building cover on bats, our finding of a strong, positive effectof building cover for two species (i.e., big brown bat andsilver-haired bat) suggests that building roosts may be a lim-iting factor for these species. Artificial roosts could be ex-plored for enhancing urban habitat for these species.Previous studies (e.g., Soper and Fenton 2007; Neubaumet al. 2007) have identified ideal characteristics of artificialroosts, but additional research is needed to evaluate their op-timal placement and effectiveness in urban areas. Lastly, ourresults suggest that all urban trees, including privately-ownedtrees and street trees, and not just trees in parks, are importantfor bats. Private and public trees are often managed separately,and management of urban trees often occurs on a tree-by-treebasis (Carreiro et al. 2008). As the landscapes in our studyprimarily included privately-owned trees in residentialneighbourhoods, this emphasizes the potential for smallgroups of property owners (e.g., the houses on a single resi-dential street) to increase local bat activity. Management forbats in cities could therefore include education of propertyowners about the value of bats themselves and of their treesfor bats, and could even include a requirement for permissionto remove trees on their property, as is the case in some juris-dictions (e.g., City of Toronto by-law No. 248–2013; City ofOttawa by-law No. 2009–200).
Acknowledgements We thank two anonymous reviewers for their valu-able suggestions and comments.We also thank E. Pervin, K.Mufarrij, M.El-Saadi, S. Guenette, K. Maki, S. Potter, and J. Evans for their field andlab assistance; the supportive team at GLEL (including past and presentmembers: D. Bert, J. Put, L. Monck-Whipp, and K. Ethier), J. Kerr, andM. Long for their advice and assistance with project logistics; and thehomeowners in Toronto for providing access to their properties for thisresearch. We are grateful to M. Anissimoff, R. Zimmerling, K. Patriquin,C. Guy, and M. B. Fenton for their advice regarding bat echolocation callsampling, processing, and identification, and to J. Pasher and D. Boyesfor their assistance with analyses in ArcGIS.We also thank L. Hooton andA. Adams for the reference library of bat calls. This research was sup-ported by a Natural Sciences and Engineering Research Council ofCanada (NSERC) scholarship and an Ontario Graduate Scholarship(OGS) to L. Moretto, and by grants to L. Fahrig from NSERC and theCanada Foundation for Innovation.
References
Avila-Flores R, Fenton MB (2005) Use of spatial features by foraginginsectivorous bats in a large urban landscape. J Mammal 86:1193–1204
Baerwald EF, Barclay RMR (2011) Patterns of activity and fatality ofmigratory bats at a wind energy facility in Alberta, Canada. JWildl Manag 75:1103–1114
Bazelman TC (2016) Effects of urbanization on bat habitat use in thePhoenix metropolitan region, Arizona, USA: a multi-scale land-scape analysis. M.S. thesis, Arizona State University
Belaire JA, Whelan CJ, Minor ES (2014) Having our yards and sharingthem too: the collective effects of yards on native bird species in anurban landscape. Ecol Appl 24:2132–2143
Beninde J, Veith M, Hochkirch A (2015) Biodiversity in cities needsspace: a meta-analysis of factors determining intra-urban biodiver-sity variation. Ecol Lett 18:581–592
Bennett VJ, Zurcher AA (2013) When corridors collide: road-relateddisturbance in commuting bats. J Wildl Manag 77:93–101
Blair RB, Launer AE (1997) Butterfly diversity and human land use:species assemblages along an urban gradient. Biol Conserv 80:113–125
Bolker B, Skaug H, Magnusson A, and Nielsen A (2012) glmmADMB.Version 8.3.3
Bredt A, Uieda W (1996) Bats from urban and rural environments ofDistrito Federal, mid-western Brazil. Chiroptera Neotropical 2:54–57
Brigham RM (1991) Flexibility in foraging and roosting behavior by thebig brown bat (Eptesicus fuscus). Can J Zool 69:171–121
BurnhamKP, Anderson DR (2004) Multimodel inference: understandingAIC and BIC in model selection. Sociol Methods Res 33:261–304
Carreiro MM, Song YC, Wu J (2008) Ecology, planning and manage-ment of urban forests. Springer, New York
City of Toronto (2009) Forest and Land Cover. https://www.toronto.ca/city-government/data-research-maps/open-data/open-data-catalogue/environment/#808bc73a-df10-284d-9df7-e60dc97b45ae.Accessed Dec 2017
City of Toronto (2014a) Toronto Building Outlines. https://library.carleton.ca/find/gis/geospatial-data/toronto-geospatial-data.Accessed 15 Dec 2017
City of Toronto (2014b) Zoning By-law. https://www.toronto.ca/city-government/data-research-maps/open-data/open-data-catalogue/locations-and-mapping/#8fef077c-9a14-e922-0c57-f390cd68b8a0.Accessed 8 March 2018
Clark PJ, Reed JM, Chew FS (2007) Effects of urbanization on butterflyspecies richness, guild structure, and rarity. Urban Ecosyst 10:321–337
Coleman JL, Barclay RMR (2012) Urbanization and the abundance anddiversity of prairie bats. Urban Ecosyst 15:87–102
Cornelis J, Hermy M (2004) Biodiversity relationships in urban and sub-urban parks in Flanders. Landsc Urban Plan 69:385–401
DixonMD (2012) Relationship between land cover and insectivorous batactivity in an urban landscape. Urban Ecosyst 15:683–695
Duchamp JE, Swihart RK (2008) Shifts in bat community structure re-lated to evolved traits and features of human-altered landscapes.Landsc Ecol 23:849–860
Duchamp JE, Sparks DW, Whitaker JO Jr (2004) Foraging-habitat selec-tion by bats at an urban-rural interface: comparison between a suc-cessful and a less successful species. Can J Zool 82:1157–1164
ESRI (2015) ArcMap 10.3.1. Environmental Systems Research Institute:Redlands, California
Ethier K, Fahrig L (2011) Positive effects of forest fragmentation, inde-pendent of forest amount, on bat abundance in eastern Ontario,Canada. Landsc Ecol 26:865–876
Evelyn MJ, Stiles DA, Young RA (2004) Conservation of bats in subur-ban landscapes: roost selection by Myotis yumanensis in a residen-tial area in California. Biol Conserv 115:463–473
Fabianek F, Gagnon D, DelormeM (2011) Bat distribution and activity inMontréal Island green spaces: responses to multi-scale habitat ef-fects in a densely urbanized area. Écoscience 18:9–17
Fahrig L (2017) Ecological responses to habitat fragmentation per se.Annu Rev Ecol Evol Syst 48:1–23
Ferenec M, Sedláček O, Fuchs R (2014) How to improve urbangreenspace for woodland birds: site and local-scale determinantsof bird species richness. Urban Ecosyst 17:625–640
Fernandez-Juricic E (2000) Avifaunal use of wooded streets in an urbanlandscape. Conserv Biol 14:513–521
Gallo T, Lehrer EW, Fidino M, Kilgour RJ, Wolff PJ, Magle SB (2018)Need for multiscale planning for conservation of urban bats.Conserv Biol 32:638–647
804 Urban Ecosyst (2019) 22:795–805

Geluso K, Mink JN (2009) Use of bridges by bats (Mammalia:Chiroptera) in the Rio Grande Valley, New Mexico. SouthwestNat 54:421–429
Griffin D,Webster F,Michael C (1960) The echolocation of flying insectsby bats. Animal Behav 8:141–154
Jackson HB, Fahrig L (2012) What is a biologically relevant landscape?Landsc Ecol 27:929–941
Janzen MK, Fenton MB (2013) The depth of edge influence amonginsectivorous bats at forest-field interfaces. Can J Zool 91:287–292
Kalcounis-Rüppell MC, Psyllakis JM, Brigham RM (2005) Tree roostselection by bats: an empirical synthesis using meta-analysis. WildlSoc Bull 33:1123–1132
Kitzes J, Merenlender A (2014) Large roads reduce bat activity acrossmultiple species. PLoS One 9:e96341
Kunz TH, Braun de Torrez E, Bauer D, Lobova T, Fleming TH (2011)Ecosystem services provided by bats. Ann N YAcad Sci 1223:1–38
Law BS, Dickman CR (1998) The use of habitat mosaics by terrestrialvertebrate fauna: implications for conservation and management.Biodivers Conserv 7:323–333
Lemen C, Freeman PW, White JA, Andersen BR (2015) The problem oflow agreement among automated identification programs for acous-tical surveys of bats. West N Am Nat 75:218–225
Lerman SB, Warren PS (2011) The conservation value of residentialyards: linking birds and people. Ecol Appl 21:1327–1339
Li H, Wilkins KT (2014) Patch or mosaic: bat activity responds to fine-scale urban heterogeneity in a medium-sized city in the UnitedStates. Urban Ecosyst 17:1013–1031
Lintott P (2015) The distribution and habitat preferences of bats in atemperate urban landscape. Dissertation, University of Sterling
Melles S, Glenn S, Martin K (2003) Urban bird diversity and landscapecomplexity: species-environment associations along a multiscalehabitat gradient. Conserv Ecol 7(5)
Menzel MA, Carter TC, Jablonowski LR, Mitchell BL, Menzel JM,Chapman BR (2001) Home range size and habitat use of big brownbats (Eptesicus fuscus) in a maternity colony located on a rural-urban interface in the southeast. J ElishaMitchell Sci Soc 117:36–45
Moretto L, Francis CM (2017) What factors limit bat abundance anddiversity in temperate, north American urban environments? JUrban Ecol 2017:1–9
Müller J, Mehr M, Fenton MB, Hothorn T, Pretzsch H, Klemmt H-J,Brandl R (2012) Aggregative response in bats: prey abundance ver-sus habitat. Oecologia 169:673–684
Nagorsen DW, Robertson I, Sarell M (2014) Pre-construction bat activityat four wind energy sites in northeastern British Colombia.Northwest Nat 95:300–311
Neubaum DJ, Wilson KR, O’Shea TJ (2007) Urban maternity-roost se-lection by big brown bats in Colorado. J Wildl Manag 71:728–736
Opera M, Mendes P, Vieira TB, Ditchfield AD (2009) Do wooded streetsprovide connectivity for bats in an urban landscape? BiodiversConserv 18:2361–2173
Paradis E, Blomberg S, Bolker B, Brown J, Claude J, Cuong HS, DesperR, Didier G, Durand B, Dutheil J, Ewing RJ, Gascuel O, Heibl C,Ives A, Jones B, Krah F, Lawson D, Lefort V, Legendre P, Lemon J,McCloskey R, Nylander J, Opgen-Rhein R, Popescu A-A, Royer-
Carenzi M, Schliep K, Strimmer K, de Vienne D (2017) ape:Analysis of Phylogenetics and Evolution. Written for R packageversion 3.4.3
Pardee GL, Philpott SM (2014) Native plants are the bee’s knees: localand landscape predictors of bee richness and abundance in backyardgardens. Urban Ecosyst 17:641–659
R Core Team (2017) R: A Language and Environment for StatisticalComputing. Vienna, Austria
Revelle W (2017) Psych: procedures for psychological, Psychometric,and Personality Research. Written for R package version 3.4.2
Rhodes M, Catterall C (2008) Spatial foraging behaviour and use of anurban landscape by a fast-flying bat, the Molossid Tadaridaaustralis. J Mammal 89:34–42
Russell AL, Butchkoski C, Saidak L, McCracken GF (2009) Road-killedbats, highway design, and the community ecology of bats. EndangerSpecies Res 8:49–60
Scheffers BR, Paszkowski CA (2013) Amphibian use of urbanstormwater wetlands: the role of natural habitat features. LandscUrban Plan 113:139–149
Silva MMS, Harmani NMS, Gonçalves EBF, Uieda W (1996) Bats fromthe metropolitan region of São Paulo, southeastern Brazil.Chiroptera Neotropical 2:39–41
Smith AC, Koper N, Francis CM, Fahrig L (2009) Confronting collin-earity: comparing methods for disentangling the effects of habitatloss and fragmentation. Landsc Ecol 24:1271–1285
Smith AC, Francis CM, Fahrig L (2014) Similar effects of residential andnon-residential vegetation on bird diversity in suburbanneighbourhoods. Urban Ecosyst 17:27–44
Soper KD, Fenton MB (2007) Availability of building roosts for bats infour towns in southwestern Ontario, Canada. Acta Chiropterol 9:542–546
Sperling CD, Lortie CJ (2010) The importance of urban backgardens onplant and invertebrate recruitment: a field microcosm experiment.Urban Ecosyst 13:223–235
Threlfall CG, Law B, Banks PB (2012) Sensitivity on insectivorous batsto urbanization: implications for suburban conservation planning.Biol Conserv 146:41–52
van Zyll de Jong CG (1985) Handbook of Canadian Mammals II, Bats.National Museums of Canada, Ottawa
Wei T, Simko V, Levy M, Xie Y, Jin Y, Zemla J (2017) corrplot:Visualization of a CorrelationMatrix. Written for R package version3.4.2
Whitaker JO Jr, Sparks DW, Brack V Jr (2006) Use of artificial rooststructures by bats at the Indianapolis international airport. EnvironManag 38:28–36
Wickham H, Chang W (2016) ggplot2: create elegant data Visualisationsusing the grammar of graphics. Written for R package version 3.4.2
Wickham H, Francois R, Henry L, Müller K (2017) dplyr: a grammar ofdata manipulation. Written for R package version 3.4.2
Wildlife Acoustics (2015) Kaleidoscope Pro 3. Maynard, Massachusetts
Urban Ecosyst (2019) 22:795–805 805