a semi-supervised clustering method based on graph contraction
TRANSCRIPT

0
A Semi-Supervised Clustering Method Based onGraph Contraction and Spectral Graph Theory
Tetsuya YoshidaGraduate School of Information Science and Technology, Hokkaido University
Japan
1. Introduction
Semi-supervised learning is a machine learning framework where learning from data isconducted by utilizing a small amount of labeled data as well as a large amount of unlabeleddata (Chapelle et al., 2006). It has been intensively studied in data mining and machinelearning communities recently. One of the reasons is that, it can alleviate the time-consumingeffort to collect “ground truth” labeled data while sustaining relatively high performanceby exploiting a large amount of unlabeled data. (Blum & Mitchell, 1998) showed the PAClearnability of semi-supervised learning, especially in classification problem.
On the other hand, data clustering, also called unsupervised learning, is a method of creatinggroups of objects, or clusters, in such a way that objects in one cluster are very similarand objects in different clusters are quite distinct. Clustering is one of the most frequentlyperformed analysis (Jain et al., 1999). For example, in web activity logs, clusters can indicatenavigation patterns of different user groups. Another direct application could be clustering ofgene expression data so that genes within a same group evinces similar behavior.
Although labeled data is not required in clustering, sometimes constraints on data assignmentmight be available as domain knowledge about the data to be clustered. In such a situation, itis desirable to utilize the available constraints as semi-supervised information and to improvethe performance of clustering (Basu et al., 2008). By regarding constraints on data assignmentas supervised information, various research efforts have been conducted on semi-supervisedclustering (Basu et al., 2004; 2008; Li et al., 2008; Tang et al., 2007; Xing et al., 2003). Althoughvarious forms of constraints can be considered, based on the previous work (Li et al., 2008;Tang et al., 2007; Wagstaff et al., 2001; Xing et al., 2003), we deal with the following two kindsof pairwise constraints in this paper: must-link constraints and cannot-link constraints. In thischapter, the former is also called as must-links, and the latter as cannot-links.
When similarities among data instances are specified, by connecting each pair of instanceswith an edge with the corresponding similarity, the entire data instances can be represented asan edge-weighted graph. In this chapter we present our semi-supervised clustering methodbased on graph contraction in general graph theory and graph Laplacian in spectral graphtheory. Graph representation enables to deal with two kinds of pairwise constraints as well aspairwise similarities over a unified representation. Then, the graph is modified by contractionin graph theory (Diestel, 2006) and graph Laplacian in spectral graph theory (Chung, 1997;von Luxburg, 2007) to reflect the pairwise constraints.
5
www.intechopen.com
2 Graph Theory
Representing the relations (both pairwise constraints and similarities) among instances as anedge-weighted graph and modifying the graph structure based on the specified constraintsenable to enhancing semi-supervised clustering. In our approach, the entire data instancesare projected onto a subspace which is constructed with respect to the modified graphstructure, and clustering is conducted over the projected data representation of instances.Although our approach utilizes graph Laplacian as in (Belkin & Niyogi, 2002), our approachdiffers from previous ones since pairwise constraints for semi-supervised clustering are alsoutilized in our approach for constructing the projected data representation (Yoshida, 2010;Yoshida & Okatani, 2010).
We report the performance evaluation of our approach, and compare it with otherstate-of-the-art semi-supervised clustering methods in terms of accuracy and running time.Extensive experiments are conducted over real-world datasets. The results are encouragingand indicate the effectiveness of our approach. Especially, our approach can leverage smallamount of pairwise constraints to increase the performance. We believe that this is a goodproperty in the semi-supervised learning setting.
The rest of this chapter is organized as follows. Section 2 explains the framework ofsemi-supervised clustering. Section 3 explains the details of our approach for clustering underpairwise constraints. Section 4 reports the performance evaluation over various documentdatasets. Section 5 discusses the effectiveness of our approach. Section 6 summarizes ourcontributions and suggests future directions.
2. Semi-supervised clustering
2.1 Preliminaries
Let X be a set of instances. For a set X , |X| represents its cardinality.
A graph G = (V , E) consists of a finite set of vertices V , a set of edges E over V × V . The set Ecan be interpreted as representing a binary relation over V . A pair of vertices (vi, vj) is in the
binary relation defined by a graph G = (V , E) if and only if the pair (vi, vj) ∈ E.
An edge-weighted graph G = (V , E, W) is defined as a graph G = (V , E) with a weight oneach edge in E. When |V | = n, i.e., the number of vertices in a graph is n, the weights in W
can be represented as an n by n matrix W 1, where wij in W stands for the weight on the edge
for the pair (vi, vj) ∈ E. Wij also stands for the element wij in the matrix. We set wij = 0
for pairs (vi, vj) �∈ E. In addition, we assume that G = (V , E, W) is an undirected, simplegraph without self-loops. Thus, the weight matrix W is symmetric and its diagonal elementsare zeros.
2.2 Clustering
In general, clustering methods can be divided into two approaches: hierarchical methods andpartitioning methods. (Jain et al., 1999). Hierarchical methods construct a cluster hierarchy,or a tree of clusters (called a dendrogram), whose leaves are the data points and whoseinternal nodes represent nested clusters of various sizes (Guha et al., 1998). Hierarchicalmethods can be further subdivided into agglomerative and divisive ones. On the other hand,partitioning methods return a single partition of the entire data under a fixed parameters(number of clusters, thresholds, etc.). Each cluster can be represented by its centroid
1 A bold italic symbol W denotes a set, while a bold symbol W denotes a matrix.
104 New Frontiers in Graph Theory
www.intechopen.com
A Semi-Supervised Clustering Method Based on Graph Contraction and Spectral Graph Theory 3
(k-means algorithms (Hartigan & Wong, 1979)), or by one of its instances located near itscenter (k-medoid algorithms (Ng & Han, 2002)). For a recent overview of various clusteringmethods, please refer to (Jain et al., 1999).
When pairwise similarities among instances are specified, the entire data can be represented asan edge-weighted graph. Various graph-theoretic clustering approaches have been proposedto find subsets of vertices in a graph based on the edges among the vertices. Several methodsutilizes graph coloring techniques (Guënoche et al., 1991; Yoshida & Ogino, 2011). Othermethods are based on the flow or cut in graph, such as spectral clustering (von Luxburg, 2007).Graph-based spectral approach is also utilized in information-theoretic clustering (Yoshida,2011).
2.3 Semi-supervised clustering
When the auxiliary or side information for data assignment in clustering is represented as aset of constraints, the semi-supervised clustering problem is (informally) described as follows.
Problem 1 (Semi-Supervised Clustering). For a given set of data X and specified constraints, finda partition (a set of clusters) T = {t1, . . . , tk} which satisfies the specified constraints.
There can be various forms of constraints. Based on the previous work (Li et al., 2008;Tang et al., 2007; Wagstaff et al., 2001; Xing et al., 2003), we consider the following two kindsof constraints defined in (Wagstaff et al., 2001):
Definition 1 (Pairwise Constraints). For a given data instances X and a partition (a set of clusters)C = {c1, . . . , ck}, must-link constraints CML and cannot-link constraints CCL are sets of pairs suchthat:
∃(xi, xj) ∈ CML ⇒ ∃c ∈ C, (xi ∈ c ∧ xj ∈ c) (1)
∃(xi, xj) ∈ CML ⇒ ∃ca, cb ∈ C, ca �= cb, (xi ∈ ca ∧ xj ∈ cb) (2)
Intuitively, must-link constraints (also called must-links in this paper) specifies the pairs ofinstances in the same cluster, and cannot-link constraints (also called cannot-links) specifiesthe pairs of instances in different clusters.
3. Graph-based semi-supervised clustering
3.1 A graph-based approach
By assuming that some similarity measure for the pairs of instances is specified, wehave proposed a graph-based approach for constrained clustering problem (Yoshida, 2010;Yoshida & Okatani, 2010). Based on the similarities, the entire data instances X can berepresented as an edge-weighted graph G = (V , E, W) where wij represents the similarity
between a pair (xi, xj). In our approach, each data instance x ∈ X corresponds to a vertex v ∈V in G. Thus, we abuse the symbol X to denote the set of vertices in G in the rest of the paper.Also, we assume that all wij is non-negative.
Definition 1 specifies two kinds of constraints. For must-link constraints, our approach utilizesa method based on graph contraction in general graph theory (Diestel, 2006) and treat it ashard constraints (Sections 3.2); for cannot-link constraints, our approach utilizes a methodbased on graph Laplacian in spectral graph theory (Chung, 1997; von Luxburg, 2007) and
105A Semi-Supervised Clustering Method Based on Graph Contraction and Spectral Graph Theory
www.intechopen.com
4 Graph Theory
Contraction
For must-link
(X’,W’)
Must-Link
Cannot-Link
(X,W) (X’,W’’)
(X’,W’’)
Graph Laplacian
for cannot-linkclustering
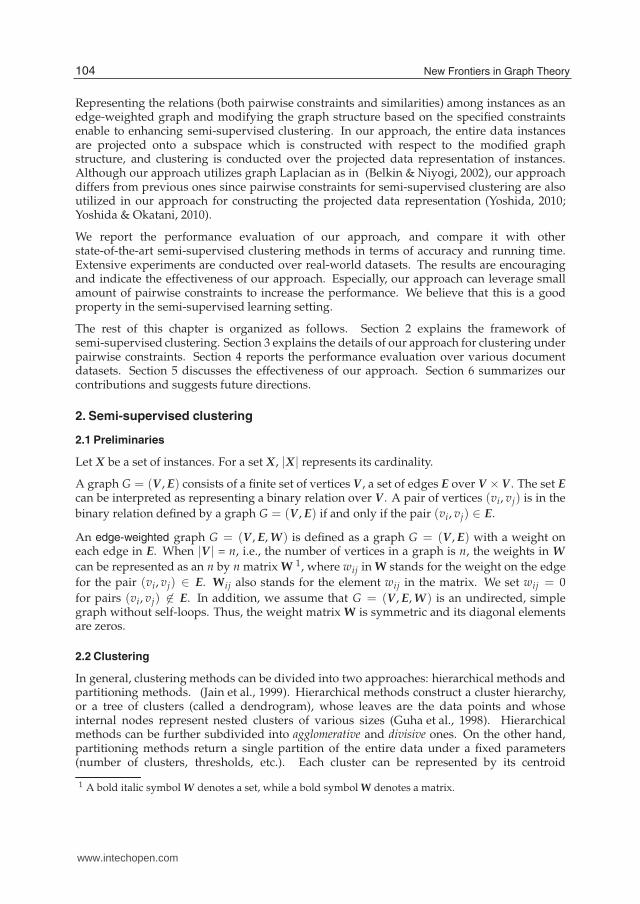
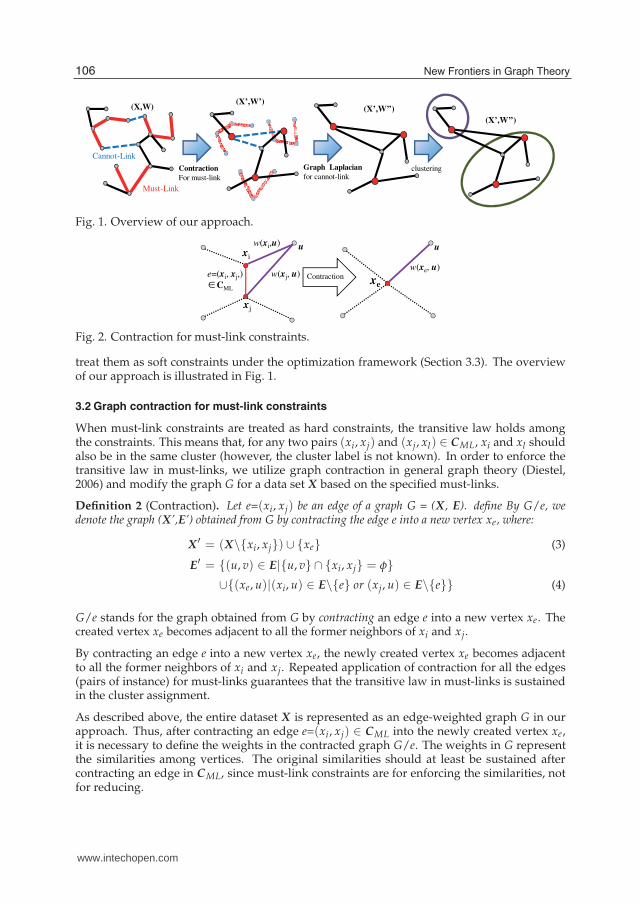
Fig. 1. Overview of our approach.
e=(xi, xj,)
CML
Contraction
xi
xj
xe
w(xe, u)
w(xi,u)
w(xj, u)
∈
u u
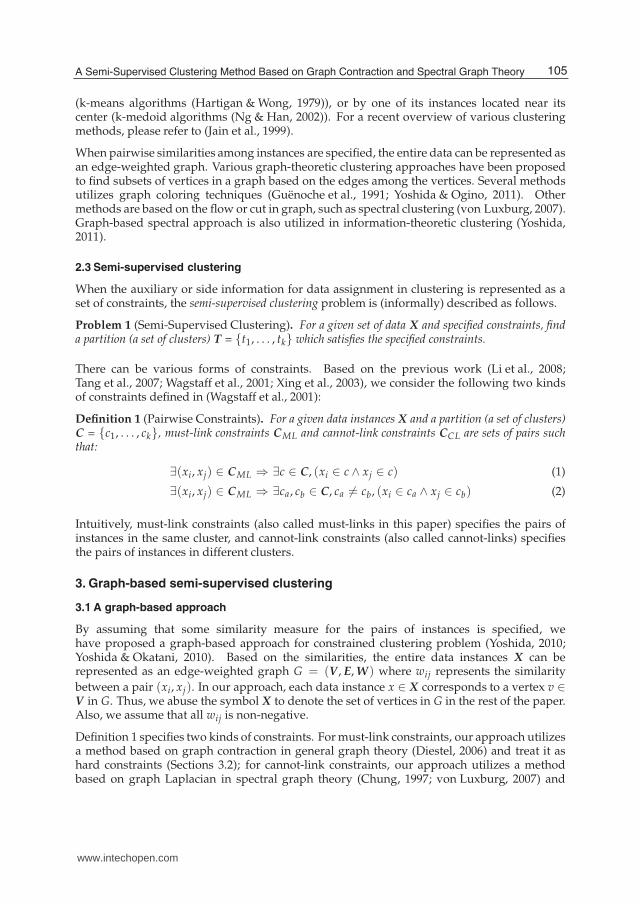
Fig. 2. Contraction for must-link constraints.
treat them as soft constraints under the optimization framework (Section 3.3). The overviewof our approach is illustrated in Fig. 1.
3.2 Graph contraction for must-link constraints
When must-link constraints are treated as hard constraints, the transitive law holds amongthe constraints. This means that, for any two pairs (xi, xj) and (xj, xl) ∈ CML, xi and xl shouldalso be in the same cluster (however, the cluster label is not known). In order to enforce thetransitive law in must-links, we utilize graph contraction in general graph theory (Diestel,2006) and modify the graph G for a data set X based on the specified must-links.
Definition 2 (Contraction). Let e=(xi, xj) be an edge of a graph G = (X, E). define By G/e, wedenote the graph (X’,E’) obtained from G by contracting the edge e into a new vertex xe, where:
X ′ = (X\{xi, xj}) ∪ {xe} (3)
E′ = {(u, v) ∈ E|{u, v} ∩ {xi, xj} = φ}
∪{(xe, u)|(xi, u) ∈ E\{e} or (xj, u) ∈ E\{e}} (4)
G/e stands for the graph obtained from G by contracting an edge e into a new vertex xe. Thecreated vertex xe becomes adjacent to all the former neighbors of xi and xj.
By contracting an edge e into a new vertex xe, the newly created vertex xe becomes adjacentto all the former neighbors of xi and xj. Repeated application of contraction for all the edges(pairs of instance) for must-links guarantees that the transitive law in must-links is sustainedin the cluster assignment.
As described above, the entire dataset X is represented as an edge-weighted graph G in ourapproach. Thus, after contracting an edge e=(xi , xj) ∈ CML into the newly created vertex xe,it is necessary to define the weights in the contracted graph G/e. The weights in G representthe similarities among vertices. The original similarities should at least be sustained aftercontracting an edge in CML, since must-link constraints are for enforcing the similarities, notfor reducing.
106 New Frontiers in Graph Theory
www.intechopen.com
A Semi-Supervised Clustering Method Based on Graph Contraction and Spectral Graph Theory 5
Based on the above observation, we define the weights in the contracted graph G/e as:
w(xe, u)′ = max(w(xi, u), w(xj, u)) i f (xi, u) ∈ E or(xj, u) ∈ E (5)
w(u, v)′ = w(u, v) otherwise (6)
where w(·, ·)′ stands for the weight in the contracted graph G/e. In eq.(5), the function max
realizes the above requirement, and guarantees the non-decreasing properties of similarities(weights) after contraction of an edge. On the other hand, the original weight is preserved ineq.(6).
For each pair of edges in must-links, we apply graph contraction and define weights in thecontracted graph based on eq.(5) and eq.(6). This results in modifying the original graph G
into another graph G′= (X
′, E
′, W
′) (as illustrated in Fig. 2). The number of vertices in the
contracted graph G′ is denoted as n′= |X
′|. Note that the originally specified cannot-links
also need to be modified during graph contraction with respect to must-links. The updatedcannot-links over the created graph G′ is denoted as C′
CL.
3.3 Graph Laplacian for cannot-link constraints
3.3.1 Spectral clustering
The objective of clustering is to assign similar instances to the same cluster and dissimilarones to different clusters. To realize this, we utilize spectral clustering, which is based onthe minimum cut of a graph. In spectral clustering (Ng et al., 2001; von Luxburg, 2007), dataclustering is realized by seeking a function f : X →R over the dataset X such that the learnedfunction assigns similar values for similar instances and vice versa. The values assigned forthe entire dataset can be represented as a vector. By denoting the assigned value for the i-thdata instance as fi, data clustering can be formalized as an optimization problem to find thevector f which minimizes the following objective function :
J0 = f tL f (7)
where f t is a transpose of vector f , and the matrix L is defined as:
D = diag(d1, . . . , dn) (di =n
∑j=1
wij) (8)
L = D − W (9)
where diag() in eq.(8) represents a diagonal matrix with the specified diagonal elements. Thematrix D in eq.(8) is the degree matrix of a graph, and is calculated based on the weightsin the graph. The matrix L in eq.(9) is called graph Laplacian (Chung, 1997; Ng et al., 2001;von Luxburg, 2007). Some clustering method, such as kmeans (Hartigan & Wong, 1979) or
spherical kmeans (skmeans) (Dhillon & Modha, 2001)2, is applied to the constructed datarepresentation of instances (Ng et al., 2001; von Luxburg, 2007).
3.3.2 Graph Laplacian for cannot-link constraints
We utilized the framework of spectral clustering in Section 3.3.1. Furthermore, to reflectcannot-link constraints in the clustering process, we formalize the clustering under constraints
2 skmeans is a standard clustering algorithm for high-dimensional sparse data.
107A Semi-Supervised Clustering Method Based on Graph Contraction and Spectral Graph Theory
www.intechopen.com

6 Graph Theory
as an optimization problem, and consider the minimization of the following objectivefunction:
J =1
2{∑
i,j
w′
ij|| fi − f j||2 − λ ∑
u,v∈C′CL
w′
uv|| fu − fv||2} (10)
where i and j sum over the vertices in the contracted graph G′, and C
′
CL stands for the
cannot-link constraints over G′. λ ∈ [0, 1] is a hyper-parameter in our approach. The first
term corresponds to the smoothness of the assigned values in spectral graph theory, and thesecond term represents the influence of cannot-links in optimization. Note that by settingλ ∈ [0, 1], the objective function in (10) is guaranteed to be a convex function.
From the above objective function in eq.(10), we can derive the following unnormalized graph
Laplacian L′′
which incorporates cannot-links as:
J =1
2{∑
i,j
w′
ij|| fi − f j||2 − λ ∑
u,v∈C′CL
w′
uv|| fu − fv||2} = f tL
′′f (11)
The matrix L′′
is defined based on the following matrices:
(C′)uv =
{
1 (xu , xv) ∈ C′
CL0 otherwise
(12)
Wc = C′⊙ W
′, W
′′= W
′− λWc (13)
di =n′
∑j=1
w′
ij, dci =
n′
∑j=1
wcij (14)
D′′= diag(d
′′
1, . . . , d′′
n′ ), d′′
i = di − λdci (15)
L′′= D
′′− W
′′(16)
where ⊙ stands for the Hadamard product (element-wise multiplication) of two matrices.
The above process amounts to modifying the representation of the contracted graph G′
into
another graph G′′, with the modified weights W
′′in eq.(13). Thus, as illustrated in Fig. 1,
our approach modifies the original graph G into the contracted graph G′
with must-link
constraints, and then into another graph G′′
with cannot-link constraints and similarities.
It is known that some form “balancing” among clusters needs to be considered for obtainingmeaningful results (von Luxburg, 2007). Based on eq.(14) and eq.(16), we utilize the followingnormalized objective function:
Jsym = ∑i,j
w′′
ij||fi
√
d′′
i
−f j
√
d′′
j
||2 (17)
over the graph G′′. Minimizing Jsym in eq.(17) amounts to solving the generalized
eigen-problem L′′
f = αD′′
f , where α corresponds to an eigenvalue and f corresponds tothe generalized eigenvector with the eigenvalue.
108 New Frontiers in Graph Theory
www.intechopen.com

A Semi-Supervised Clustering Method Based on Graph Contraction and Spectral Graph Theory 7
Algorithm 1 graph-based semi-supervised clustering (GBSSC)
Require: G = (X, E, W); //an edge-weighted graphRequire: CML; //must-link constraintsRequire: CCL; //cannot-link constraintsRequire: l; //the number of generalized eigenvectorsRequire: k; //the number of clusters
1: for each e ∈ CML do2: contract e and create the contracted graph G/e;3: end for
// Let G′= (X
′, E
′, W
′) be the contracted graph.
4: create C′
uv, Wc, W′′, D
′′as eq.(12) ∼ eq.(15).
5: L′′
sym = I − D′′− 1
2 W′′D
′′− 12
6: Find l eigenvectors F = { f 1, . . . , f l} for L′′
sym, with the smallest non-zero eigenvalues.7: Conduct clustering of data which are represented as F and construct clusters.8: return clusters
Furthermore, the number of generalized eigenvectors can be extended to more than one. Inthat case, the generalized eigenvectors with positive eigenvalues are selected with ascendingorder of eigenvalues. The generalized eigenvectors with respect to the modified graphcorresponds to the embeeded representation of the whole data instances.
3.4 Algorithm
The graph-based semi-supervised clustering method (called GBSSC) is summarized in
Algorithm 1. The contracted graph G′
is constructed from lines 1 to 3 based on the specifiedmust-links. Lines 4 to 6 conduct the minimization of Jsym in eq.(17), which is represented as
the normalized graph Laplacian L′′
sym at line 5.
These correspond to the spectral embedding of the entire data instances X onto the subspace
spanned by F = { f 1, . . . , f l} (Belkin & Niyogi, 2002). Note that pairwise constraintsfor semi-supervised clustering are also utilized on the construction of the embeddedrepresentation in our approach and thus differs from (Belkin & Niyogi, 2002). Some clusteringmethod is applied to the data at line 7 and the constructed clusters are returned. Currentlyspherical kmeans (skmeans) (Dhillon & Modha, 2001) is utilized at line 7.
4. Evaluations
4.1 Experimental settings
4.1.1 Datasets
Based on the previous work (Dhillon et al., 2003; Tang et al., 2007), we evaluated our approach
on 20 Newsgroup dataset (hereafter, called 20NG) 3 and TREC datasets 4. Clustering ofthese datasets corresponds to document clustering, and each document is represented in thestandard vector space model based on the occurrences of terms. Since the number of terms are
3 http://people.csail.mit.edu/˜jrennie/20Newsgroups/. (20news-18828 was utilized)4 http://glaros.dtc.umn.edu/gkhome/cluto/cluto/download
109A Semi-Supervised Clustering Method Based on Graph Contraction and Spectral Graph Theory
www.intechopen.com

8 Graph Theory
dataset included groupsMulti5 comp.graphics, rec.motorcycles,rec.sport.baseball, sci.space talk.politics.mideast
Multi10 alt.atheism, comp.sys.mac.hardware,misc.forsale, rec.autos,rec.sport.hockey,sci.crypt,sci.med, sci.electronics,sci.space,talk.politics.guns
Multi15 alt.atheism, comp.graphics, comp.sys.mac.hardware, misc.forsale, rec.autos,rec.motorcycles, rec.sport.baseball, rec.sport.hockey, sci.crypt, sci.electronics,sci.med, sci.space, talk.politics.guns, talk.politics.mideast, talk.politics.misc
Table 1. Datasets from 20 Newsgroup dataset
dataset #attributes #classes #datahitech 126372 6 2301
reviews 126372 5 4069
sports 126372 7 8580la1 31372 6 3204
la2 31372 6 3075la2 31372 6 6279
k1b 21839 6 2340
ohscal 11465 10 11162fbis 2000 17 2463
Table 2. TREC datasets (original representation)
huge in general, these are high-dimensional sparse datasets. Please note that our approach isgeneric and not specific to document clustering.
As in (Dhillon et al., 2003; Tang et al., 2007), 50 documents were sampled from each group(cluster) in order to create a sample for one dataset, and 10 samples were created for
each dataset. For each sample, we conducted stemming using porter stemmer 5 and
MontyTagger 6, removed stop words, and selected 2,000 words with descending order ofmutual information (Cover & Thomas, 2006).
For TREC datasets, we utilized 9 datasets in Table 2. We followed the same procedure in 20NG
and created 10 samples for each dataset7. Since these datasets are already preprocessed andrepresented as count data, we did not conduct stemming or tagging.
4.1.2 Evaluation measures
For each dataset, the cluster assignment was evaluated with respect to Normalized Mutual
Information (NMI) (Strehl & Ghosh, 2002; Tang et al., 2007). Let C, C stand for randomvariables over the true and assigned clusters. NMI is defined as
NMI =I(C; C)
(H(C) + H(C))/2(18)
5 http://www.tartarus.org/˜martin/PorterStemmer6 http://web.media.mit.edu/˜hugo/montytagger7 On fbis, 35 data were sampled for each class.
110 New Frontiers in Graph Theory
www.intechopen.com
A Semi-Supervised Clustering Method Based on Graph Contraction and Spectral Graph Theory 9
where H(·) is Shannon Entropy, and I(·; ·) is Mutual Information among the random variables
C and C. NMI corresponds to the accuracy of assignment. Thus, the larger NMI is, the betterthe cluster assignment is with respect to the “ground-truth” labels in each dataset.
All the compared methods first construct the representation for clustering and then applysome clustering method (e.g., skmeans). The running time (CPU time in second) forrepresentation construction was measured on a computer with Debian/GNU Linux, IntelXeon W5590, 36 GB memory. All the methods were implemented with R language and Rpackages.
4.1.3 Comparison
We compared our approach with SCREEN (Tang et al., 2007) and PCP (Li et al., 2008) (detailsare described in Section 5.2). Since all the compared methods are partitioning based clusteringmethods, we assume that the number of clusters k in each dataset is available.
SCREEN (Tang et al., 2007) conducts semi-supervised clustering by projecting the givendata instances onto the subspace where the covariance with respect to the given datarepresentation is maximized. To realize this, the covariance matrix with respect to the originaldata representation is constructed and their eigenvectors are utilized for projection. Forhigh-dimensional data such as documents, this process is rather expensive, since the numberof attributes (e.g., terms) gets large. To alleviate this problem, PCA (Principal ComponentAnalysis) was first utilized as pre-processing to reduce the number of dimension in the datarepresentation. We followed the same process in (Tang et al., 2007) and pre-processed databy PCA using 100 eigenvectors, and SCREEN was applied to the pre-processed data as in(Tang et al., 2007).
PCP (Li et al., 2008) first conducts metric learning based on the semi-definite programming,and then kernel k-means clustering is conducted over the learned metric. Some package(e.g. Csdp) is utilized to solve the semi-definite programming based on the specified pairwiseconstraints and similarities.
4.1.4 Parameters
The parameters under the pairwise constraints in Definition 1 are:
1) the number of constraints
2) the pairs of instances for constraints
As for 2), pairs of instances were randomly sampled from each dataset to generate theconstraints. Thus, the main parameter is 1), the number of constraints, for must-links andcannot-links. We set the numbers of these two types of constrains to be the same, and variedthe number of constraints.
Each data instance x in a dataset was normalized such that xtx = 1, and Euclidian distance wasutilized for SCREEN as in (Tang et al., 2007). With this normalization, cosine similarity, whichis widely utilized as the standard similarity measure in document processing, was utilized forGBSSC and PCP, and the initial edge-weighted graph for each dataset was constructed withthe similarities. The number of generalized eigenvectors l was set to the number of clustersk. In addition, following the procedure in (Li et al., 2008), m-nearest neighbor graph wasconstructed for PCP (m was set to 10 in the experiment). The hyper-parameter λ in eq.(10)was set to 0.5, since GBSSC is robust to this value as reported in Section 4.2.
111A Semi-Supervised Clustering Method Based on Graph Contraction and Spectral Graph Theory
www.intechopen.com

10 Graph Theory
4.1.5 Evaluation procedure
For each number of constraints, the pairwise constraints (must-links and cannot-links) weregenerated randomly based on the ground-truth labels in the datasets, and clustering wasconducted with the generated constraints. Clustering with the same number of constraintswas repeated 10 times with different initial configuration in clustering. In addition, the aboveprocess was also repeated 10 times for each number of constraints. Thus, for each dataset andthe number of constraints, 100 runs were conducted. Furthermore, this process was repeatedover 10 samples for each dataset. Thus, the average of 1,000 runs is reported for each dataset.
4.2 Evaluation of graph-based approach
Our approach modifies the data representation in a dataset according to the specifiedconstraints. Especially, the similarities among instances (weights in a graph) are modified.The other possible approach would be to set the weights (similarities) as:
i) each pair (xi , xj) ∈ CML to the maximum similarity
ii) each pair (xi, xj) ∈ CCL to the minimum similarity
20 40 60 80 100
0.5
20
.54
0.5
60
.58
Must−Link (Multi10)
Number of constraints
NM
I
GBSSC
max
min
max&min
20 40 60 80 100
0.4
30
.44
0.4
50
.46
0.4
70
.48
Must−Link (Multi15)
Number of constraints
NM
I
Fig. 3. Weight medication comparison.
0.0 0.2 0.4 0.6 0.8 1.0
0.5
20.5
40.5
60.5
8
Multi10
lambda
NM
I
10
20
30
40
50
60
70
80
90
100
0.0 0.2 0.4 0.6 0.8 1.0
0.4
40.4
60.4
8
Multi15
lambda
NM
I
10
20
30
40
50
60
70
80
90
100
Fig. 4. Influence of λ.
First, we compared our approach for the handling of must-links in Section 3.2 with the aboveapproaches on Multi10 and Multi15 datasets. The results are summarized in Fig. 3. In Fig. 3,horizontal axis corresponds to the number of constraints; vertical one corresponds to NMI.In the legend, max (black lines with boxes) stands for i), min (blue dotted lines with circles)stands for ii), and max&min (green dashed lines with crosses) stands for when both i) and ii)are employed. GBSSC (red solid lines with circles) stands for our approach.
The results in Fig. 3 show that GBSSC outperformed others and that it is effective in terms ofthe weight modification in a graph. One of the reasons for the results in Fig. 3 is that, wheni) (max) is utilized, only the instances connected with must-links are affected, and thus theytend to be collected into a smaller “isolated” cluster. Creating rather small clusters makes the
112 New Frontiers in Graph Theory
www.intechopen.com
A Semi-Supervised Clustering Method Based on Graph Contraction and Spectral Graph Theory 11
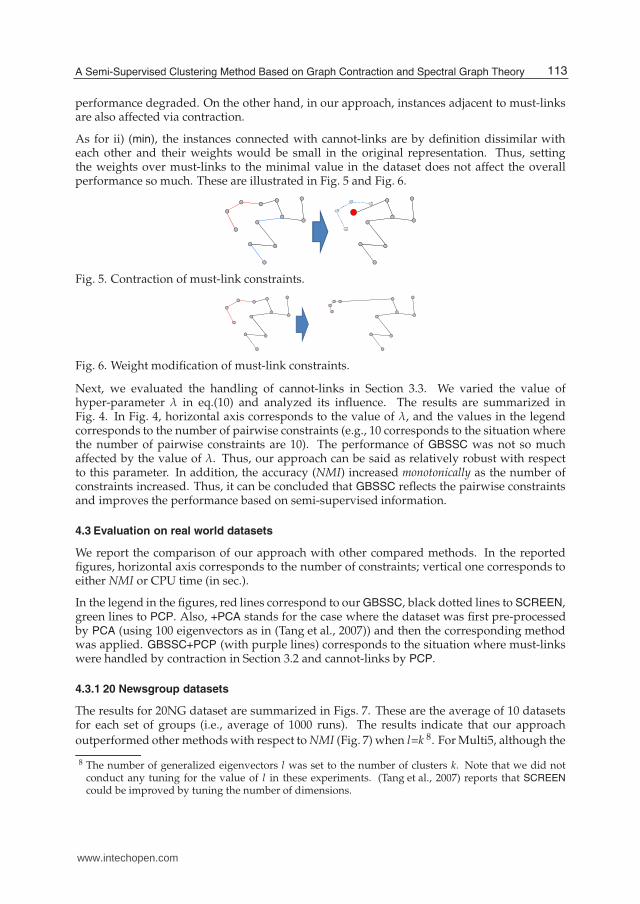
performance degraded. On the other hand, in our approach, instances adjacent to must-linksare also affected via contraction.
As for ii) (min), the instances connected with cannot-links are by definition dissimilar witheach other and their weights would be small in the original representation. Thus, settingthe weights over must-links to the minimal value in the dataset does not affect the overallperformance so much. These are illustrated in Fig. 5 and Fig. 6.
Fig. 5. Contraction of must-link constraints.
Fig. 6. Weight modification of must-link constraints.
Next, we evaluated the handling of cannot-links in Section 3.3. We varied the value ofhyper-parameter λ in eq.(10) and analyzed its influence. The results are summarized inFig. 4. In Fig. 4, horizontal axis corresponds to the value of λ, and the values in the legendcorresponds to the number of pairwise constraints (e.g., 10 corresponds to the situation wherethe number of pairwise constraints are 10). The performance of GBSSC was not so muchaffected by the value of λ. Thus, our approach can be said as relatively robust with respectto this parameter. In addition, the accuracy (NMI) increased monotonically as the number ofconstraints increased. Thus, it can be concluded that GBSSC reflects the pairwise constraintsand improves the performance based on semi-supervised information.
4.3 Evaluation on real world datasets
We report the comparison of our approach with other compared methods. In the reportedfigures, horizontal axis corresponds to the number of constraints; vertical one corresponds toeither NMI or CPU time (in sec.).
In the legend in the figures, red lines correspond to our GBSSC, black dotted lines to SCREEN,green lines to PCP. Also, +PCA stands for the case where the dataset was first pre-processedby PCA (using 100 eigenvectors as in (Tang et al., 2007)) and then the corresponding methodwas applied. GBSSC+PCP (with purple lines) corresponds to the situation where must-linkswere handled by contraction in Section 3.2 and cannot-links by PCP.
4.3.1 20 Newsgroup datasets
The results for 20NG dataset are summarized in Figs. 7. These are the average of 10 datasetsfor each set of groups (i.e., average of 1000 runs). The results indicate that our approach
outperformed other methods with respect to NMI (Fig. 7) when l=k 8. For Multi5, although the
8 The number of generalized eigenvectors l was set to the number of clusters k. Note that we did notconduct any tuning for the value of l in these experiments. (Tang et al., 2007) reports that SCREEN
could be improved by tuning the number of dimensions.
113A Semi-Supervised Clustering Method Based on Graph Contraction and Spectral Graph Theory
www.intechopen.com

12 Graph Theory
20 40 60 80 100
0.0
0.2
0.4
0.6
0.8
Multi5
Number of constraints
NM
I
GBSSC
GBSSC+PCA
GBSSC+PCP
SCREEN
SCREEN+PCA
PCP
20 40 60 80 100
0.2
50.3
50.4
50.5
5
Multi10
Number of constraints
NM
I
20 40 60 80 100
0.2
50.3
00.3
50.4
00.4
5
Multi15
Number of constraints
NM
I
20 40 60 80 100
0.0
20.1
00.5
02.0
010.0
050.0
0
Multi5
Number of constraints
CP
U(s
ec)
20 40 60 80 100
0.1
0.5
5.0
50.0
500.0
Multi10
Number of constraints
CP
U(s
ec)
20 40 60 80 100
5e−
01
5e+
00
5e+
01
5e+
02
Multi15
Number of constraints
CP
U(s
ec)
Fig. 7. Results on 20-Newsgroup
performance of PCP got close to that of GBSSC as the number of constraints increased, GBSSC
was faster more than two orders of magnitude (100 times faster). Likewise, GBSSC+PCP andPCP were almost the same with respect to NMI, but the former was faster with more than oneorder (10 times faster). Although SCREEN+PCA was two to five times faster than GBSSC,it was inferior with respect to NMI. Utilization of PCA as the pre-processing enables thisspeed-up for SCREEN, in compensation for the accuracy (NMI).
Dimensionality reduction with PCA was effective for the speed-up of SCREEN, but it was notfor GBSSC. On the other hand, it deteriorated their performance with respect to NMI. Thus,it is not necessary to utilize pre-processing such as PCA for GBSSC, and still our approachshowed better performance.
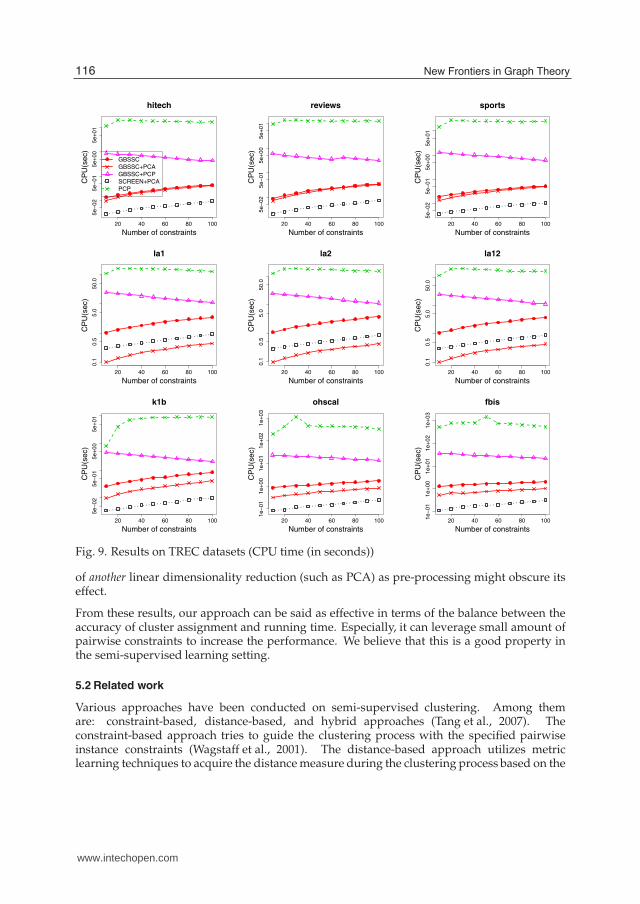
4.3.2 TREC datasets
The results for TREC datasets are summarized in Fig. 8 and Fig. 9. As shown in Table 2,the number of dimensions (attributes) are huge in TREC datasets. Since calculating theeigenvalues of the covariance matrix with large number of attributes takes too muchtime, when SCREEN was applied to non-preprocessed data with PCA, it was too slow.Thus, SCREEN was applied only to the pre-processed data in TREC datasets. (shown asSCREEN+PCA).
On the whole, the results were quite similar to those in 20NG. Our approach outperformedSCREEN (in TREC datasets, SCREEN+PCA) with respect to NMI. It also outperformedPCP in most datasets, however, as the number of constraints increased, the latter showedbetter performance for review and sports datasets. In addition, PCP seems to improve theperformance as the number of constraints increase. When GBSSC is utilized with PCP
114 New Frontiers in Graph Theory
www.intechopen.com

A Semi-Supervised Clustering Method Based on Graph Contraction and Spectral Graph Theory 13
20 40 60 80 100
0.2
00.2
50.3
00.3
50.4
0
hitech
Number of constraints
NM
I
GBSSC
GBSSC+PCA
GBSSC+PCP
SCREEN+PCA
PCP
20 40 60 80 100
0.4
0.5
0.6
0.7
0.8
reviews
Number of constraints
NM
I
20 40 60 80 100
0.4
0.5
0.6
0.7
0.8
sports
Number of constraints
NM
I
20 40 60 80 100
0.2
00.3
00.4
00.5
0
la1
Number of constraints
NM
I
20 40 60 80 100
0.2
00.3
00.4
00.5
0la2
Number of constraints
NM
I
20 40 60 80 100
0.2
00.3
00.4
00.5
0
la12
Number of constraints
NM
I
20 40 60 80 100
0.5
50.6
50.7
5
k1b
Number of constraints
NM
I
20 40 60 80 100
0.2
50.3
00.3
5
ohscal
Number of constraints
NM
I
20 40 60 80 100
0.4
00.4
50.5
00.5
50.6
0
fbis
Number of constraints
NM
I
Fig. 8. Results on TREC datasets (NMI)
(denoted as GBSSC+PCP in the figure), it showed almost equivalent performance with respectto NMI, but the former was faster with more than one order.
5. Discussions
5.1 Effectiveness
The reported results show that our approach is effective in terms of the accuracy of clusterassignment (NMI). GBSSC outperformed SCREEN in all the datasets. Although it didnot outperformed PCP in some TREC datasets with respect to NMI, but it was faster morethan two orders of magnitude. Utilization of PCA as data pre-processing for dimensionalityreduction enables the speed-up of SCREEN, in compensation for the accuracy of clusterassignment. On the other hand, PCP showed better performance in some datasets withrespect to accuracy of cluster assignment, in compensation for the running time. Besides, sinceSCREEN originally conducts linear dimensionality reduction based on constraints, utilization
115A Semi-Supervised Clustering Method Based on Graph Contraction and Spectral Graph Theory
www.intechopen.com
14 Graph Theory
20 40 60 80 100
5e−
02
5e−
01
5e+
00
5e+
01
hitech
Number of constraints
CP
U(s
ec)
GBSSC
GBSSC+PCA
GBSSC+PCP
SCREEN+PCA
PCP
20 40 60 80 100
5e−
02
5e−
01
5e+
00
5e+
01
reviews
Number of constraints
CP
U(s
ec)
20 40 60 80 100
5e−
02
5e−
01
5e+
00
5e+
01
sports
Number of constraints
CP
U(s
ec)
20 40 60 80 100
0.1
0.5
5.0
50.0
la1
Number of constraints
CP
U(s
ec)
20 40 60 80 100
0.1
0.5
5.0
50.0
la2
Number of constraints
CP
U(s
ec)
20 40 60 80 100
0.1
0.5
5.0
50.0
la12
Number of constraints
CP
U(s
ec)
20 40 60 80 100
5e−
02
5e−
01
5e+
00
5e+
01
k1b
Number of constraints
CP
U(s
ec)
20 40 60 80 100
1e−
01
1e+
00
1e+
01
1e+
02
1e+
03
ohscal
Number of constraints
CP
U(s
ec)
20 40 60 80 1001e−
01
1e+
00
1e+
01
1e+
02
1e+
03
fbis
Number of constraints
CP
U(s
ec)
Fig. 9. Results on TREC datasets (CPU time (in seconds))
of another linear dimensionality reduction (such as PCA) as pre-processing might obscure itseffect.
From these results, our approach can be said as effective in terms of the balance between theaccuracy of cluster assignment and running time. Especially, it can leverage small amount ofpairwise constraints to increase the performance. We believe that this is a good property inthe semi-supervised learning setting.
5.2 Related work
Various approaches have been conducted on semi-supervised clustering. Among themare: constraint-based, distance-based, and hybrid approaches (Tang et al., 2007). Theconstraint-based approach tries to guide the clustering process with the specified pairwiseinstance constraints (Wagstaff et al., 2001). The distance-based approach utilizes metriclearning techniques to acquire the distance measure during the clustering process based on the
116 New Frontiers in Graph Theory
www.intechopen.com

A Semi-Supervised Clustering Method Based on Graph Contraction and Spectral Graph Theory 15
specified pairwise instance constraints (Li et al., 2008; Xing et al., 2003). The hybrid approachcombines these two approaches under a probabilistic framework (Basu et al., 2004).
As for the semi-supervised clustering problem, (Wagstaff et al., 2001) proposed a clusteringalgorithm called COP-kmeans based on the famous kmeans algorithm. When assigningeach data item to the cluster with minimum distance as in kmeans, COP-kmeans checks theconstraint satisfaction and assigns each data item only to the admissible cluster (which doesnot violate the constraints).
SCREEN (Tang et al., 2007) first converts the data representation based on must-link constraintsand removes the constraints. This process corresponds to contraction in our approach, but theweight definition is different. After that, based on cannot-link constraints, it finds out the linearmapping (linear projection) to a subspace where the variance among the data is maximized.Finally, clustering of the mapped data is conducted on the subspace.
PCP (Li et al., 2008) deals with the semi-supervised clustering problem by finding a mappingonto a space where the specified constraints are reflected. Using the specified constraints,it conducts metric learning based on the semi-definite programming and learn the kernelmatrix on the mapped space. Although the explicit representation of the mapping or thedata representation on the mapped space is not learned, kernel k-means clustering (Girolami,2002) is conducted over the learned metric.
6. Conclusion
In this chapter we presented our semi-supervised clustering method based on graphcontraction in general graph theory and graph Laplacian in spectral graph theory. Ourapproach can exploit a small amount of pairwise constraints as well as pairwise relations(similarities) among the data instances. Utilization of graph representation of instancesenables to deal with the pairwise constraints as well as pairwise similarities over a unifiedrepresentation. In order to reflect the pairwise constraints on the clustering process, thegraph structure for the entire data instances is modified by graph contraction in generalgraph theory (Diestel, 2006) and graph Laplacian in spectral graph theory (Chung, 1997;von Luxburg, 2007).
We reported the performance of our approach over two real-world datasets with respect tothe type of constraints as well as the number of constraints. We also compared with otherstate-of-the-art semi-supervised clustering methods in terms of accuracy of cluster assignmentand running time. The experimental results indicate that our approach is effective in terms ofthe balance between the accuracy of cluster assignment and running time. Especially, it couldleverage a small amount of pairwise constraints to improve the clustering performance. Weplan to continue this line of research and to improve the presented approach in future.
7. Acknowledgments
The author is grateful to Mr. Okatani and Mr. Ogino for their help on implementation.
8. References
Basu, S., Bilenko, M. & Mooney, R. J. (2004). A probabilistic framework for semi-supervisedclustering, KDD-04, pp. 59–68.
Basu, S., Davidson, I. & Wagstaff, K. (eds) (2008). Constrained Clustering: Advances inAlgorithms, Theory, and Applications, Chapman & Hall/CRC Press.
117A Semi-Supervised Clustering Method Based on Graph Contraction and Spectral Graph Theory
www.intechopen.com
16 Graph Theory
Belkin, M. & Niyogi, P. (2002). Laplacian eigenmaps for dimensionality reduction and datarepresentation, Neural Computation 15: 1373–1396.
Blum, A. & Mitchell, T. (1998). Combining labeled and unlabeled data with to-training, Proc.11th Computational Learning Theory, pp. 92–100.
Chapelle, O., Schölkopf, B. & Zien, A. (eds) (2006). Semi-Supervised Learning, MIT Press.Chung, F. (1997). Spectral Graph Theory, American Mathematical Society.Cover, T. & Thomas, J. (2006). Elements of Information Theory, Wiley.Dhillon, J., Mallela, S. & Modha, D. (2003). Information-theoretic co-clustering, Proc. KDD’03,
pp. 89–98.Dhillon, J. & Modha, D. (2001). Concept decompositions for large sparse text data using
clustering, Machine Learning 42: 143–175.Diestel, R. (2006). Graph Theory, Springer.Girolami, M. (2002). Mercer kernel-based clustering in feature space, IEEE Transactions on
Neural Networks 13(3): 780–784.Guënoche, A., Hansen, P. & Jaumard, B. (1991). Efficient algorithms for divisive hierarchical
clustering with the diameter criterion, J. of Classification 8: 5–30.Guha, S., Rastogi, R. & Shim, K. (1998). Cure: An efficient clustering algorithm for large
databases, Proc. the ACM SIGMOD Conference, pp. 73–84.Hartigan, J. & Wong, M. (1979). Algorithm AS136: A k-means clustering algorithm, Journal of
Applied Statistics 28: 100–108.Jain, A., Murty, M. & P.J., F. (1999). Data clustering: A review, ACM Computing Surveys
31: 264–323.Li, Z., Liu, J. & Tang, X. (2008). Pairwise constraint propagation by semidefinite programming
for semi-supervised classification, ICML-08, pp. 576–583.Ng, A. Y., Jordan, M. I. & Weiss, Y. (2001). On Spectral Clustering: Analysis and an algorithm,
Proc. NIPS 14, pp. 849–856.Ng, R. & Han, J. (2002). Clarans: a method for clustering objects for spatial data mining, IEEE
Transactions on Knowledge and Data Engineering 14(5): 1003–1016.Strehl, A. & Ghosh, J. (2002). Cluster Ensembles -A Knowledge Reuse Framework for
Combining Multiple Partitions, J. Machine Learning Research 3(3): 583–617.Tang, W., Xiong, H., Zhong, S. & Wu, J. (2007). Enhancing semi-supervised clustering : A
feature projection perspective, Proc. KDD’07, pp. 707–716.von Luxburg, U. (2007). A tutorial on spectral clustering, Statistics and Computing
17(4): 395–416.Wagstaff, K., Cardie, C., Rogers, S. & Schroedl, S. (2001). Constrained k-means clustering with
background knowledge, In ICML01, pp. 577–584.Xing, E. P., Ng, A. Y., Jordan, M. I. & Russell, S. (2003). Distance metric learning, with
application to clustering with side-information, NIPS 15, pp. 505–512.Yoshida, T. (2010). Performance Evaluation of Constraints in Graph-based Semi-Supervised
Clustering, Proc. AMT-2010, LNAI 6335, pp. 138–149.Yoshida, T. (2011). A graph model for mutual information based clustering, Journal of
Intelligent Information Systems 37(2): 187–216.Yoshida, T. & Ogino, H. (2011). A re-coloring approach for graph b-coloring based clustering,
International Journal of Knowledge-Based & Intelligent Engineering Systems . accepted.Yoshida, T. & Okatani, K. (2010). A Graph-based projection approach for Semi-Supervised
Clustering, Proc. PKAW-2010, LNAI 6232, pp. 1–13.
118 New Frontiers in Graph Theory
www.intechopen.com

New Frontiers in Graph TheoryEdited by Dr. Yagang Zhang
ISBN 978-953-51-0115-4Hard cover, 526 pagesPublisher InTechPublished online 02, March, 2012Published in print edition March, 2012
InTech EuropeUniversity Campus STeP Ri Slavka Krautzeka 83/A 51000 Rijeka, Croatia Phone: +385 (51) 770 447 Fax: +385 (51) 686 166www.intechopen.com
InTech ChinaUnit 405, Office Block, Hotel Equatorial Shanghai No.65, Yan An Road (West), Shanghai, 200040, China
Phone: +86-21-62489820 Fax: +86-21-62489821
Nowadays, graph theory is an important analysis tool in mathematics and computer science. Because of theinherent simplicity of graph theory, it can be used to model many different physical and abstract systems suchas transportation and communication networks, models for business administration, political science, andpsychology and so on. The purpose of this book is not only to present the latest state and developmenttendencies of graph theory, but to bring the reader far enough along the way to enable him to embark on theresearch problems of his own. Taking into account the large amount of knowledge about graph theory andpractice presented in the book, it has two major parts: theoretical researches and applications. The book isalso intended for both graduate and postgraduate students in fields such as mathematics, computer science,system sciences, biology, engineering, cybernetics, and social sciences, and as a reference for softwareprofessionals and practitioners.
How to referenceIn order to correctly reference this scholarly work, feel free to copy and paste the following:
Tetsuya Yoshida (2012). A Semi-Supervised Clustering Method Based on Graph Contraction and SpectralGraph Theory, New Frontiers in Graph Theory, Dr. Yagang Zhang (Ed.), ISBN: 978-953-51-0115-4, InTech,Available from: http://www.intechopen.com/books/new-frontiers-in-graph-theory/a-semi-supervised-clustering-method-based-on-graph-contraction-and-spectral-graph-theory

© 2012 The Author(s). Licensee IntechOpen. This is an open access articledistributed under the terms of the Creative Commons Attribution 3.0License, which permits unrestricted use, distribution, and reproduction inany medium, provided the original work is properly cited.