a seismic-driven 3d model of rock mechanical facies: an
TRANSCRIPT

A seismic-driven 3D model of rock mechanical facies: an example from the Asmari Reservoir, SW Iran
Sajjad Gharecheloua, Sepideh Sohrabia, Ali Kadkhodaie-Illkhchib,e*, Hossain Rahimpour-Bonaba, Javad Honarmandc, Gholamhossein Montazerid
aSchool of Geology, College of Science, University of Tehran, Tehran, Iran ([email protected]; [email protected]; [email protected])
b* Department of Geology, University of Tabriz, Tabriz, Iran ([email protected])
cResearch Institute of Petroleum Industry, Petroleum Geology Dept., Tehran, Iran ([email protected])
dHead of petroleum engineering at ICOFC ([email protected])
eDepartment of Petroleum Engineering, Curtin University, Western Australia ([email protected])
Abstract
Asmari Formation is one of the most prolific and important hydrocarbon reservoirs in Iran. This formation
in the Cheshmeh-Khosh oilfield shows mixed carbonate-siliciclastic lithology and its elastic modulus
changes are correlatable with facies changes. To address these changes, we investigated the relation
between sedimentary environment (facies) and texture with various elastic moduli. The Young’s modulus
shows higher correlation with the facies changes.
Data from three wells are analyzed and used for the construction of rock mechanical facies. Based on
elastic properties, facies and texture changes as well as petrophysical characteristics seven rock mechanical
facies (RMFs) are recognized in the studied formation. To predict RMFs at inter-well spaces more
efficiently and capturing the lateral formation property variationsa 3D rock mechanical facies model is
constructed based on seismic attributes. In this method, RMFs are correlatable between the studied wells
and mappable by seismic attribute in the field scale. Finally, the distribution of RMFs and their related
properties is investigated in the studied field.
Key words: Rock mechanic, Young’s modulus, facies, seismic attribute, Asmari reservoir

1. Introduction
The elastic properties of reservoir rocks are key factors in reservoir rock characterization. Understanding
these properties can decrease development costs and risks involved in optimizing field development plans,
refining drilling program and making reasonable predictions of production rate. Furthermore, seismic
reflectivity modeling, interpreting seismic data and evaluation of reservoir compaction are some of the most
important aspects of determination of rock elastic properties (Ghazvinian et al., 2012; Brahma and Sircar,
2014).
The main reservoir rock in the Zagros area, southwest Iran, is the Asmari Formation which hosts
numerous giant and supergiant hydrocarbon reserves. The studied field, which is located in the Dezful
Embayment, is composed of mixed carbonate-siliciclastic lithology. Here, the upper part of the unit
(Miocene) is dominated by carbonate but the lower part (Oligocene) is mainly composed of siliciclastics.
Facies changes in this formation are very sharp and considerable.
A number of authors including Shakoor and Brown (1996), Topal and Doyuran (1997), Bell et al. (1999),
Chatterjee and Mukhopadhyay (2001), Jeng et al. (2004) Hussain et al. (2006), Williams et al. (2012) and
Fournier et al. (2014) have discussed the relationships between sedimentological characteristics with the
geomechanical properties of reservoir rocks. Largely, several geological factors including porosity, grain
size, mineralogy, and cement control the rock elastic properties (Hussain et al., 2006). These parameters
are strongly controlled by the facies texture and overprinted diagenetic features.
Generally, description of formation properties and rock mechanical parameters with higher accuracy
results in reasonable wellbore stability predictions for any locations in a field prior to drilling. Actually, a
good estimation of formation elastic properties will lead to an accurate stress analysis that could prevent
future financial losses (Dehghani et al., 2014). The present study evaluates the rock elastic properties based
on Young’s modulus and facies textures in the Asmari Formation, aiming to define the rock mechanical
facies (RMF). Accordingly, the relationships between changes in the facies and elastic properties are
investigated. Thus, the main objective of the present study is to evaluate rock elastic changes (Young’s
modulus) in the framework of depositional environments (facies) and their related characteristics. By
creating a relation between facies and elastic modulus it is possible to determine the elastic modulus
continuously along the wellbores and formulate it in a geologic framework. Furthermore, unlike the
previous works, in this method results are not limited to the cored interval and cover all intervals in the
interested unit. Also by this approach, the results would be useful for inter-wells correlation and extending
the results from the well- scale to the field-scale.
The idea of using multiple seismic attributes to predict log properties was first proposed by Schultz,
Ronen, Hattori and Corbett in a series of three articles in the Leading Edge and Hampson et al 2001. Our
study extends this concept to rock mechanical properties. The logic behind relies on this fact that there is
an inverse relation between porosity and acoustic impedance. As rock strength is dependent on porosity so
it is expected to find relations between geomechanical facies and seismic attributes. This enables us for
full-field rock mechanic simulation of the studied reservoir and to aid understanding the reservoir
operational practices within different segments of the field. To achieve such goals, it is important to define
the RMFs and link them to seismic attributes.
2. Geological setting
The Asmari Formation is the youngest and most prolific reservoir horizon in SW Iran. This formation in
the Zagros fold belt is diachronous as its base aged the Early Rupelian in a NW–SE trending basin and was
followed in mid-Burdigalian time by the deposition of evaporates and marls of the Gachsaran Formation
(Motiei, 1993). This productive fractured reservoir produces more than 80% of total Iranian crude oil. The
Oligo-Miocene cyclic successions of South West Iran (Asmari Formation) in Cheshmeh-Khoshoilfield are
composed of mixed carbonate-siliciclastic rocks.

The studied field is located in the southwest of Zagros Mountains and in the northwestern edge of the
Dezful Embayment (figure 1). The Dezful Embayment structural zone is characterized by a low elevation
and few outcrops of the Asmari Formation and it contains most of the Iranian oilfield (Cenozoic). This area
in the southwest Iran is one of the most prolific oil provinces in the Middle East (e.g. Haynes and
McQuillan, 1974; Wennberg et al., 2006). This structural embayment is located in the central Zagros fold-
thrust belt, SW Iran, a belt locating in the Alpine-Himalayan orogeny and is the result of the Tertiary
continental collision between the Arabian Plate and Iranian blocks (Berberian and King, 1981).
In the studied field, the Asmari Formation shows variable lithological and facies characteristics and is
generally composed of limestone, dolomite, anhydrite and sandstone. Such important lithological variations
led to observed temporal and special heterogeneity in the elastic properties and reservoir quality. The upper
and lower contacts of the Asmari with its overlaying the Gachsaran (anhydrite cap rock) and underlying
Pabdeh formations (shale and marl source rock) are unconformable.
3. Materials and methods
In order to determine the controlling geological parameters on the elastic properties, the Asmari reservoir
at three wells of the Cheshmeh-Khosh oilfield is investigated. The main available data in this study include
thin sections from cores, well logs, check-shot data, formation tops and 3D post stack seismic data.
High resolution petrographic studies along with image analysis technique were employed to determine
rock components (grains, particles and mud or cement), texture (e.g. Dunham, 1962) and finally
depositional facies (Wilson, 1975; Buxton and Pedley, 1989; Pettijohn et al., 1987; Flugel, 1982 and 2010).
Accordingly, a detailed petrographic analysis of 1550 thin sections carried out to investigate the various
textures, facies variation and distribution along with pore typing in both carbonate and clastic intervals of
the Asmari Formation.
The elastic properties (i.e., dynamic Young’s modulus) were calculated from wireline logs continuously
along the wellbore. Observed disparities in the determined Young’s modulus are correlated and related to
the inconsistency in the facies and their textures. After determining the rock elastic parameters for each
facies, RMFs are defined and mapped in the field scale. For this purpose, 3D seismic volume is used to map
the RMFs distribution throughout the field. The seismic data in this field includes 773 in-lines and 256
cross-lines in the surveyed area of about 130 Km2.
4. Facies description
The Asmari Formation that deposited on a tropical ramp covering SW Iran in Oligo-Miocene (Henson,
1951; Dunnington, 1958, 1967; James and Wynd, 1965) shows a high variability from lithological point of
view. Accordingly, its main lithology in the Dezful Embayment and the studied field comprises carbonate,
mixed carbonate-evaporate and mixed carbonate-siliciclastic rocks (Van Buchem et al., 2010).
Facies analysis of the Asmari Formation resulted in the recognition of 12 microfacies, which can be
grouped into five facies associations in the carbonate intervals and 5 sedimentary facies in the siliciclastic
interval (figure 2). A mixed carbonate-siliciclastic environment model is proposed for the Asmari
Formation in the studied oilfield (Honarmand, 2013). The carbonate interval (Aquitanian and Burdigalian)
deposited in a homoclinal ramp. The siliciclastic interval (Rupelian and Chattian) of this formation formed
in Coastal plain to terrestrial/fluvial environment; distal deltaic and subtidal environment and offshore
marine to basin (Van Buchem et al., 2010; Honarmand, 2013). Seemingly, the latter part is correlated with
Ghar Formation in Kuwait whose clastic inputs is believed to have been derived from the pre-rift uplift of
the Red Sea to the west (Alsharhan and Nairn, 1997). This formation sourced most sandstones where the
exposed Arabian Shield shed large amounts of clastics onto the eastern Arabian plate (e.g. Sharland et al.,
2001). Clastics mainly deposited during lowst and, whereas carbonate deposition dominated during
highstands.
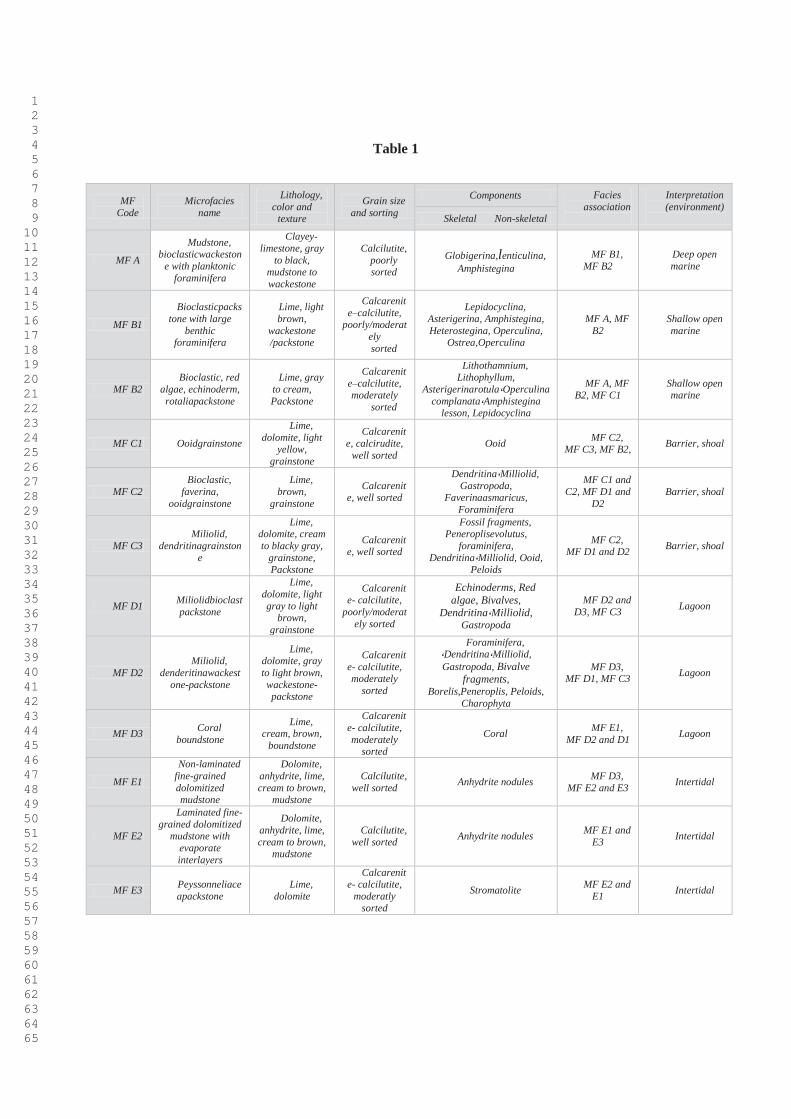
Based on detailed petrography and facies analysis using thin sections and core description, 12
microfacies types were identified for the Asmari Formation in the studied carbonate intervals (Table 1).
Accordingly, they are classified into five main facies associations (belts) representing a Homoclinal ramp
system. These facies associations include deep open marine (MF A), shallow open marine (MF B1 & B2),
barrier/shoal (MF C1, C2 & C3), lagoon (MF D1, D2 & D3) and intertidal (MF E1, E2 & E3). This ramp
depositional model corresponds to Eocene and Miocene ramp models published by Brandano and
Corda(2002), Corda and Brandano(2003) (figure 2a, Table 1).
Thin-section study and core description of the clastic intervals resulted in identification of 5facies (F,
G, H, I & J). These facies from offshore to coastal plain respectively includes: Facies F: Bioturbated fine-
grained sandstone; Facies G: Conglomerate and coarse to medium-grained sandstone; Facies H: Shaly/silty
sand; Facies I: well-sorted sandstone; Facies J: Sandstones along with shale/silt interlaminates (figure 2b).
Figures 2 and 5 show rock texture and facies position of carbonate and clastic parts of the Asmari Formation
in the studied wells.
5. Rock mechanical facies
The relationships between lithological and stratigraphical properties of the reservoir rocks and their
mechanical characterizations have been investigated by British Petroleum (BP) in the 1990’s (Williams et
al., 2012). Understanding the reservoir rock mechanical behavior, beside their facies changes, could lead
us in predicting complex reservoir properties, fracture susceptibility and diagnosis as well as calibration of
static and dynamic flow properties. This understanding is important in the applied geomechanical purposes
such as hydraulic fracturing design, analysis of wellbore stability and rock failure, determination of in situ
stress, assessment of the response of reservoirs and surrounding rocks to changes in pore pressure and stress
calculation of Young’s modulus and Poisson’s ratios (PR) (Brahma and Sircar, 2014). Rock elastic
properties are directly linked to the lithology, pore type and elastic moduli of pore fluids (Zhang and
Bentley, 2003). Moreover, facies type, texture and diagenetic imprints generally affect the rock elastic
properties (Verwer et al., 2008; Brigaud et al., 2010; Fournier et al., 2011). It means that sedimentary
environment and the subsequent diagenetic overprints control general physical and chemical properties of
reservoir rock.
In this study, rock mechanical properties are calculated by using log data (dynamic modulus) because
these data are continuous along the wellbore and correlatable between wells. In addition, for reservoir
characterization by seismic attributes, we need a continuous parameter along the wellbore (i.e. log nature).
In reservoir rock, porosity is the main petrophysical parameter that strongly is controlled by facies and
diagenetic processes (Ahr, 2008; Esrafili-Dizaji and Rahimpour-Bonab, 2009).The amount of porosity
versus each facies of carbonate and clastic part of the formation are shown in figure 3. Sedimentary features
and depositional textures are reflected in the effect of porosity on the elastic parameters, therefore these
parameters are also affected by porosity (Weger et al., 2009; Fabricius et al., 2010; Fournier et al., 2011;
Fournier et al., 2014). Analyzing the cross plot of porosity (in different facies) versus elastic parameters
(Young’s, Bulk, Shear and Poisson’s), it could be concluded that the Young’s modulus showsa higher
correlation with porosity and facies (figure 4). Among the elastic parameters, Young’s modulus has the
highest relationship with the texture and particle or grain to cement or mud ratio changes. However,
lithology changes specially anhydrite in this study can strongly influence the Poisson’s ratio in each texture
(Abdlmutalib et al., 2015). Actually, lithology changes can create discrepancy on PR without considerable
texture changes. For example, anhydrite can increase the PR independent from texture changes while the
goal of this study is rock elastic changes in the framework of facies and depositional texture. The Asmari
Formation in the studied field shows a variable lithology from limestone, dolomite, limy dolostone,
dolomitic limestone, anhydrite limestone, anhydrite, sandstone to sandy/silty shale. Seemingly, the
observed lithological variations and their related diagenesis along with changes in the facies and texture are
responsible for discrepancy in the Poisson’s ratio. Considering the results of the current study, Young’s
modulus shows a higher correlation with the porosity and facies and so is selected for RMF investigation.
Formation elastic properties i.e. Young’s modulus are calculated by using equation below (Kowalski,
1975; Castagna, 1985):
E(psi) = �ρb∆tS2
� �3∆tS2 − 4∆tP2
∆tS2 − ∆tP2�1.34 × 10¹⁰

Where EDyn is the dynamic Young’s modulus (psi), ρb is rock bulk density (g/cm3), ∆tS is S-wave travel
time or shear slowness (µs/f) and ∆tP is P-wave travel time or compressional slowness(µs/f). By this
equation, sonic and density logs can continuously evaluate formation elastic properties along the wellbore.
The deformation behavior of sedimentary rocks is characterized by elastic modulus as Young’s modulus.
Water saturation, depositional texture and pore space affect the elastic moduli (Fabricius et al., 2010).
Furthermore, the previous studies show that the elastic properties of sedimentary rocks are strongly
controlled by pore type architecture that is created by both depositional and diagenetic processes (e.g.
Anselmetti and Eberli, 1993; Eberli et al., 2003; Weger et al., 2009, Fournier et al., 2014).
The Young’s modulus changes and sedimentological characteristics (facies, texture and pore type) are
investigated in three key wells. In each facies, rock mechanical parameters and petrophysical as well as
sedimentological properties are determined (figure 5). According to the results, rock mechanical facies are
defined in the Asmari reservoir at Cheshmeh-Khosh oilfield. In this study, RMFs are defined on the base
of sedimentary environment, facies, texture, pore type, petrophysical properties and Young’s modulus. The
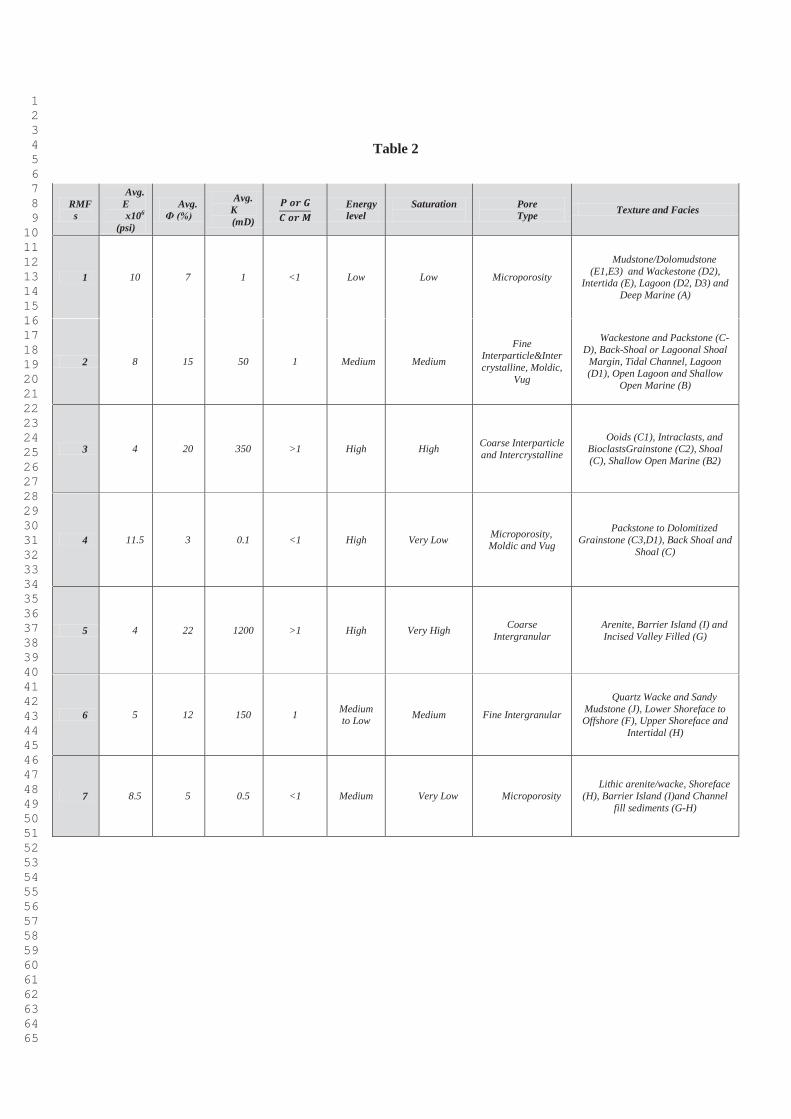
Asmari Formation in the studied oil field is subdivided into seven RMFs (Table 2) which are described as
follows. RMFs 1 to 4 are defined in the carbonate interval but RMFs 5 to 7 are distinguished in the clastic
interval.
RMF1
RMF1 consists of fine-grained microcrystalline limestone and dolomite (dolomudstone) associated with
anhydrite patches (figure 6a). Dominant sedimentary texture in this RMF is mudstone, wackestone and
rarely cemented coralline boundstone. The predominance of mud-dominated facies indicates low energy
environment (Tucker and Wright, 1990) with low water turbulence (Geel, 2000). RMF1 deposited in
intertidal, lagoon (D2 and D3) and open marine environments with dominance of microporosity. Thus, the
porosity and saturation value is low and Young’s modulus is high (Table 2).
RMF2
RMF2 is deposited in a higher energy environment and its common rock component is skeletal fragments
and intraclasts that in some cases recrystallized to dolomite. The particles with poor to medium sorting are
fine to medium in size and vary from sub-angular to rounded with packstone to rarely grainstone and coral
boundstone texture (figure 6b). Inner ramp deposits represent a wider spectrum of marginal marine deposits,
indicative of a medium to high energy. RMF2 is deposited in back-shoal or lagoonal shoal margins, tidal
channel, lagoon (D1), open lagoon and shallow open marine. Common pore types include micropore and
mesopore interparticle, micropore and mesopore intercrystaline (c.f. Lønøy, 2006), intraparticle and vug.
These pore types in some cases are plugged by calcite cement and rarely by anhydrite cement in
dolostonefacies. The amount of Young’s modulus, porosity and saturation in this RMF is medium (Table
2).
RMF3
RMF3 consists of medium to thick bedded grainstone and rarely packstone (figure 6c). The ooid grains are
well sorted fine- to coarse-sand size. It is interpreted to have been deposited under shallow-water, high-to
moderate energy and above the fair weather wave base condition based on grainy texture, ooids, intraclasts,
miliolids bioclasts and well-sorted components. Although the interparticle porosity is the main pore type,
dolomite with macropore intercrystalline porosity (c.f. Lønøy, 2006) is also present due to sporadic ooids
recrystallization to dolomite. Very well sorted ooid grainstone in shoal facies is dominant in RMF3. Well-
connected interparticle pore type led to high properm values. Dominant rock texture in this RMF are
grainstone to packstone. The amount of Young’s elastic modulus in this RMF is low and porosity and
saturation is high (Table 2).
RMF4
RMF4 is similar to RMF3 but interparticle and intercrystalline pore space is plugged by blocky anhydrite
and calcite cements (figure 6d). In some samples ooids completely recrystallized to dolomite
(dolograinstone with micro and mesopore porosity). Dissolution and cementation are common diagenetic
processes that led to creation of oomoldic and vuggy porosities in the shoal and back-shoal facies. Porosity
and permeability strongly are reduced due to cementation. Besides, the value of Young’s elastic modulus
is very high and saturation is very low (Table 2).
RMF5
RMF5 includes medium to coarse sand and gravels (figure 6e). Such clean sands are lose and not cemented.
Moreover, these arenites are well-sorted but not well-rounded. These sedimentological features suggest
deposition in a barrier island and incised valley fill. Well-connected intergranular pore type creates porous
and permeable facies. The values of Young’s elastic modulus in RMF5 is low and saturation is very high
(Table 2).
RMF6
Shalysilty sand with fine intergranular porosity is the main rock fabric in RMF6 (figure 6f). The
depositional texture is quartz wacke and sandy mudstone (Pettijohn et al., 1987). Sand grains are not
cemented but infiltrated or diagenetic clay filled the pore space between the sand grains. Silty fine sand
with thin inter layer shale suggest deposition in three environments including lower shoreface to offshore,
upper shoreface and intertidal. Fine sand and muddy matrix reduced the properm value in RMF6. The value
of Young’s elastic modulus and saturation in this RMF is medium (Table 2).
RMF7
Cemented sandstone in the siliciclastic interval of the Asmari is associated with very low thickness (figure
6g). This facies is restricted to the margins of the basin with lithic arenite/wacke texture. Only two cement
types (calcite and dolomite) occurred in the sandstones. Stratigraphical position shows sandstones with
dolomite cement are in the shoreface and barrier but sandstones with calcite cement commonly occur in the
base of channels. Such cements occlude the pore space in the sandstones and reduce the reservoir quality.
The magnitude of Young’s modulus in this facies is higher than RMF6 and saturation value is very low

(Table 2). In some facies, Young’s modulus show anomalous values especially in carbonate intervals which
could be justified by the presence of the fractures that generally reduces the Young’s modulus. In figure 5
distribution of seven RMFs and their properties in one of the studied wells are shown.
Generally, the elastic properties of sedimentary rocks show inverse relations with the porosity values
(Fabricius et al., 2010). Plot of the Young’s modulus versus porosity in each RMF (figure 4a&a’) reflects
different depositional facies, textures and pore types. Acoustic velocity in sedimentary rocks, especially in
carbonates, is dependent on pore type (Anselmetti and Eberli, 1999; Kenter et al., 2002;Eberli et al., 2003;
Weger et al., 2009), hence, the pore type affect the elastic moduli (Verwer; 2010). Distribution of RMFs in
one of the studied wells is graphically illustrated in figure 5. As illustrated for each RMFs texture, facies,
ratio of particle or grain to cement or mud, saturation, pore type, porosity and Young’s modulus are
determined. This integrated approach for RMFs classification indicates the sedimentological, petrophysical
and elastic properties of reservoir rock.
6. 3D model of rock mechanical facies
Most mechanical parameters, even today, are one-dimensional (1D), based on well and drilling data alone.
The concept of using seismically derived horizons and velocities to extend the rock mechanical parameters
into 3D space was introduced in recent years. Seismic attributes can estimate the rock-mechanical properties
from seismic in a physically meaningful way. An important step in creation of a realistic 3D geomechanical
model is definition of mechanical properties as a function of formation and position (Zee et al., 2012). In
this study, statistical methods are used for exploration of well information guided by seismic information
to construct 3D volume of the RMF. In addition to the rock mechanical parameters, porosity is also
predicted by seismic attributes as it strongly affects the rock elastic properties (Fabricius et al., 2010).
Log-derived RMFs (Dynamic Young’s modulus) led to predictive capability for application of RMFs in
the field by allowing RMF classes to be determined from log data. Linking the seismic attribute to dynamic
elastic modulus (calculated from logs) is used for defining the dynamic elastic parameters measured in the
field.
Using high-quality seismic data serves as a favorable method for the assessment of rock mechanical
parameters (Young’s modulus) in the field scale with geophysical approach. Checkshot data, post-stack 3D
seismic data and target logs (Young’s modulus and porosity) along with the sonic and density logs were
available for three wells. Well log data were correlated with seismic data through the construction of
synthetic seismograms (figure 7). The seismic synthesis record can be expressed as the convolution of the
seismic wavelet and reflection coefficient. The seismic wavelet is obtained through the multi-trace seismic
statistical method and the reflection coefficient is obtained mainly through the acoustic log data (the
acoustic velocities from the sonic logs are multiplied by the bulk density values from density logs). Depth-
to-time conversion of the well logs was accomplished by applying checkshot data supplied for wells CK#5
and CK#3. It was necessary to create synthetic seismogram and extract the wavelets repeated for the
placement of the log data in time. This depth-to-time process allowed for a comparison of the well logs,
and their associated tops, with the seismic data in time. After the initial quality control (depth shifting, spike
deleting, bad data deleting) of the input data, the well data is correlated with the seismic data and a zero
phase wavelet is extracted. The amplitude, phase and frequency spectrum of the final wavelet used for the
inversion of seismic data to acoustic impedance is shown in figure 8.
6.1. 3D acoustic impedance inversion
For acoustic impedance inversion, first, an initial model is built from the low frequency component of the
well log. The inversion process is applied at each well location and the inversion parameters are determined.
The inversion process is then applied to the entire dataset in target window (between top & base of the
Asmari Formation).
Among the several algorithms for inversions, the model-based inversion algorithm is preferred here
because of lower error and higher cross validation (Brown, 1996). The model-based inversion method is a
generalized linear inversion (GLI) algorithm, in which each trace of synthetic seismogram is calculated by
the initial predicted impedance and a known wavelet. During the inversion, impedance is progressively
modified, until the resulting synthetic trace matches the real trace with acceptable level. The operator
controls how far the algorithm may move from the initial guess in order to match the real data. This
parameter defines how the algorithm is constrained in moving from the initial guess to the last answer. The
mean correlation between synthetic seismogram and composite trace at the well locations of the studying
formation is calculated as high as 0.9. Therefore, the model-based inversion method with the GLI algorithm
was found effective for the seismic data inversion. The initial inversion model is constructed by
interpolating and extrapolating the log data in the 3D seismic volume. Afterwards, a cube of full band
acoustic impedance was obtained that serves as the most important attribute for the Young’s modulus and
porosity estimation (figure 9). The inversion result in target horizon is quality controlled by applying time
slices of a window centered (Yematawork et al., 2010).
6.2. Selection of optimal seismic attributes
The inverted acoustic impedance data together with other seismic attributes were used for mapping seismic
data into rock mechanical parameters and porosity. Uncertainty of the 3D models was reduced when a valid
relationship was established between seismic measurements and target logs at well locations. The
relationships between input (seismic attributes) and output data (target logs) are investigated through the
statistic and intelligent methods. In multi-attribute regression method, among all seismic attributes, the first
attribute is chosen based on lowest average error and higher correlation with the target log. The stepwise
regression technique is implemented to define the best combination of attributes with the lowest prediction
error. The convolution algorithm is adopted to eliminate the difference in the frequency of the log and
seismic attributes. Then the single sampling point on the log-seismic attributes is expanded to the adjacent
multiple sampling points to correlate with the target log. The weighted average of the sampling points group
on each attributes is selected to calculate a point on the predictive log, which has almost the same resolution
with target log. Also determination of optimal operator length for any given set of attributes is caused to
higher correlation between the actual target logs and the predicted target logs. In this study for Young’s
modulus prediction stepwise regression find the combination of 2 attributes (Acoustic Impedance and
Instantaneous Phase) out of the total list of attributes for given operator length 7. Furthermore Porosity is
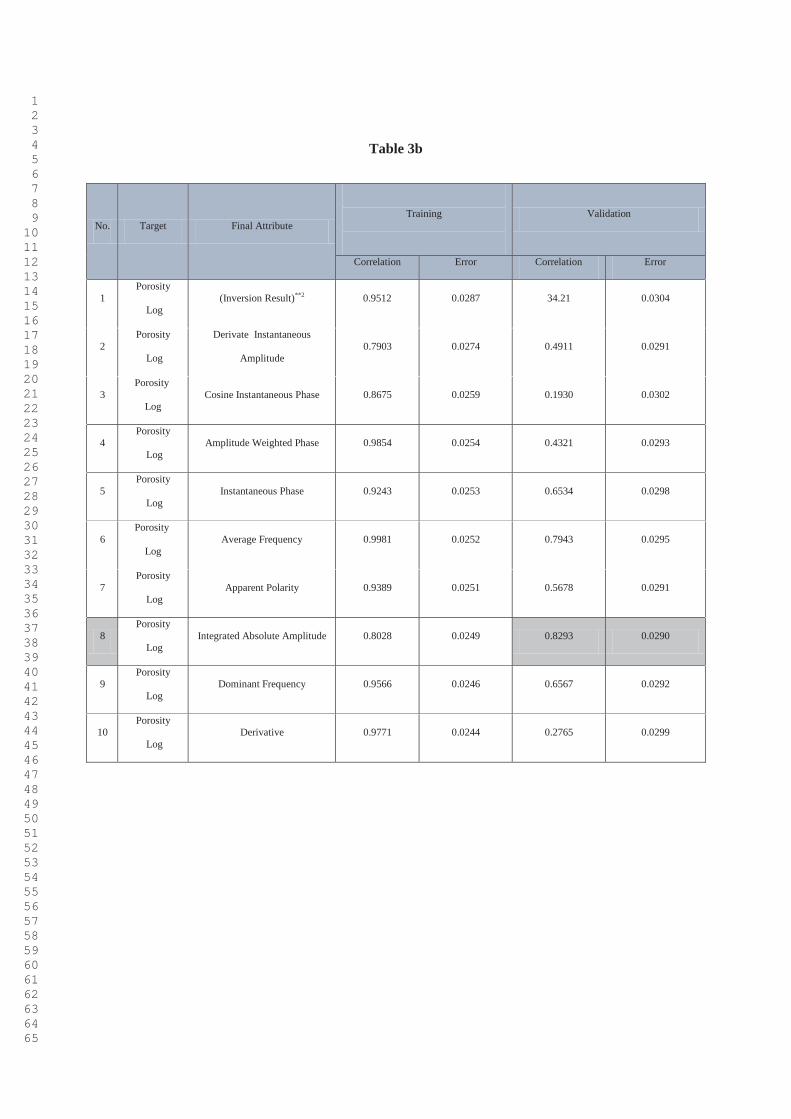
estimated with combination of 8 attributes and with operator length 3. Table 3 represents the multi-attribute
list to formulate seismic data to Young’s modulus and porosity. The first attribute that have relation with
Young’s modulus and porosity is Inversion Result or Acoustic Impedance. Acoustic impedance is a product
of sonic velocity and bulk density. There is an inverse relationship between velocity and bulk density.
Accordingly, porosity is an inverse function of acoustic impedance. Also, Instantaneous Phase and
Integrated Absolute Amplitude among the all attributes are the highest correlation with Young’s modulus
and Porosity respectively. Instantaneous Phase attribute have close relation with porosity and lithology
changes also Young’s modulus changes is dependent on porosity and facies variation. Integrated Absolute
amplitude is sum of all the trace amplitudes within the window interval. As with the integrate attribute, it
can indicate amplitude anomalies as a result of lithology and porosity variations (Chen and Sidney, 1997).
Stepwise regression determined the best attributes to have the closest relation with the target logs but an
attempt is made to map seismic attributes into target logs by using a neural network method. Three neural
network algorithms including probabilistic (PNN), multilayer feed forward (MLFN) and radial basis
function (RBF) were utilized for final estimation of target logs cube from a set of predefined seismic
attributes. The probabilistic neural network (PNN) with correlation of 0.9000 and mean error of 819480 psi
and correlation 0.8015 and mean error of 0.02553 in the validation set was found to have the best
performance to predict respectively for Young’s and Porosity (Table 4). The estimated log from seismic
attributes was found very comparable to the original log in the well location (Figure 10) due to the non-
linear nature of the neural network and the complex and non-linear relation between seismic attribute and
target parameter (Kadkhodaie-Ilkhchi et al., 2009). Results of the propagated Young’s modulus and
porosity from seismic attributes and intelligent method in both carbonate and clastic parts of the Asmari
reservoir are illustrated in figures 11 and 12, respectively.
7. Discussion
In the previous researches, the relation between elastic moduli and porosity, pore type, fluid substitution
and saturation were studied (Baechle et al., 2005; Baechle et al., 2009; Verwer et al. 2010;Fabricious 2010).
In sedimentary rocks, microstructure is an important factor influencing the elastic moduli (Khazanehdri and
Sothcott, 2003). In this paper, our attempt was to create a relationship between facies, texture and elastic
modulus. In each facies sedimentological and petrophysical features such as texture, sedimentary
environment, pore type, porosity, permeability and cement or mud were considered. Based on these
characteristics and elastic modulus rock mechanical facies were defined. The results obtained in this study
support the earlier findings so that the changes in elastic modulus are in relation to facies changes. We
propose that such changes are in relation to the sedimentary features variations in the studied wells.
In a recent study, facies in carbonate and clastic intervals of the Asmari Formation are described and
determined in ten wells of the studied field (Honarmand, 2013). Three wells from the field are selected for
determination and correlation of RMFs (figure 13). Twelve facies in carbonate and five facies in clastic
intervals of the oil field were determined. In sedimentary rocks, elastic properties and permeability are
known to be strongly influenced by the particle or grain to cement or mud ratio (Castagna et al., 1985; Best
and katsube, 1995). Also, cementation is the most important diagenetic feature that affected elastic
properties. Actually, this ratio reflects the energy level in the depositional environments. By increasing such
a ratio, Young’s modulus decreases (softening) and vice versa (stiffening) (figure 5).
In the carbonate part of the Asmari formation within high energy shoal facies (ParticleCement
> 1) elastic
modulus decreases. (RMF3). In some intervals, where shoal facies are cemented by anhydrite and calcite
(i.e. ParticleCement
< 1), elastic modulus tends to increase (RMF4). In relatively high to medium energy facies
such as wackestones and packstones of lagoon margin and shoal whereParticleCement
= 1, the Young’s modulus
shows a moderate distribution (RMF2). Finally, in low energy facies such as tight dolomudstone and muddy
facies within intertidal, restricted lagoon and open marine environments, Young’s modulus shows higher
values (RMF1). In clastic part of the formation, well-sorted coarse grained sandstone in barrier island and
filled incised valley with ratio GrainMud
> 1have higher elastic modulus (RMF5) than the quartz wacke and
sandy mudstone with GrainMud
≥ 1(RMF6) in Lower shoreface to offshore and upper shoreface to intertidal
environments. In some intervals, in the clastic succession, sandstones cemented by calcite and dolomite
with ratio GrainCement
< 1that strongly damaged the porosity. Also elastic modulus in this RMF is very high
because high cemented sandstone show a stiff behavior (RMF7). According to the results, seven RMFs are
recognized in the studied formation for which a very good agreement is available between studied wells
(figure 13). This study shows that RMF concept is an applicable method for reservoir characterization and
correlation of mechanical properties between wells in the field scale (figure 13).
With the advancement of seismic interpretation and intelligent system, the lateral variation of the
formation properties can be characterized with seismic data and geological modeling. A 3D RMF modeling
shows lateral variation of RMF over the studied formation. A slice from the Young’s modulus distribution
with average window of 30 milliseconds below the Asmari horizon in the carbonate interval represents
distribution of four RMFs in the carbonate part of the formation (figure 11(A)). Moreover, a slice from the
clastic part of the Asmari formation with average window of 40 milliseconds above the Pabdeh horizon
represents distribution of three RMFs (figure 11(B)). Since a good agreement is seen between elastic
modulus and porosity (an inverse trend) (Baechle et al 2009;Fabricious et al., 2010; Jensen et al., 2011;
Fournier et al., 2014), porosity distribution slices from the formation show the same trend of RMFs over
the Asmari formation (figure 12 A and B). The Young’s modulus and porosity maps show the distribution
of RMFs and their related properties in the field scale. Described RMFs in this paper with predictive use of
interpreted mechanical stratigraphy is now providing and supplying insights into field development
programs. Moreover, the seismic driven 3D geomechanical model can be used for analyzing multiple well-
trajectories for optimal well-placement.
8. Conclusion
Comparison of facies analysis, sedimentary environments, textures, saturation, pore types, porosity, the
ratio of grain to cement or mud and porosity with changes in the ultrasonic Young’s elastic modulus yielded
the useful information from the Asmari reservoir. Accordingly, seven RMFs are defined in the studied
formation. These RMFs are found as an effective tool for correlation of elastic modulus between wells and
propagation of the results from wells to the field scale. This paper shows that Young’s modulus is strongly
controlled and correlated to sedimentary properties of reservoir rocks. In the carbonate intervals of the
formation, generally, by increasing energy level in depositional environments from mudstone to grainstone
texture (RMF1 to RMF3) Young’s modulus increases. Also, in some intervals anhydrite and calcite cements
in high energy shoal facies strongly increased the Young’s modulus values (RMF4). Moreover, in clastic
intervals by decrease in the energy level of depositional environments (i.e. coarse sands to muddy and fine
sands) (RMF5 to RMF6) Young’s modulus tends to increase. In the clastic part of the formation, coarse
sandstones are highly cemented by calcite and dolomite causing strong increase in the Young’s modulus
(RMF7).
Through defining the RMFs, a better understanding from the distribution of sedimentological,
petrophysical and mechanical properties of the formation can be obtained from wells to field scale.
Investigation of RMFs mapped by seismic attributes led to propagation of the results and interpretation of
anomalies over the reservoir when simulation predictions and well behavior are compared in the field. It is
expected that the integrated approach introduced in this study will help in highlighting the stiff and soft
zones over the Asmari reservoir rocks.
9. Acknowledgment
The authors acknowledge the Iranian Central Oilfields Company (ICOFC) for sponsoring, data preparation
and permission for publication of the data. Vice-President of Research and Technology of the University
of Tehran is thanked for partial financial support of this study.
10. Reference

Abdlmutalib, A., Abdullatif, O., Korvin G., Abdulraheem, A., 2015, The relationship between lithological and geomechanical properties of tight carbonate rocks from Upper Jubaila and Arab-D Member outcrop analog, Central Saudi Arabia. Arab J Geoscience. Ahr, W.M., 2008. Geology of carbonate reservoirs, John Wiley and Sons, 296 p..
Alsharhan, A.S., Nairn, A.E.M., 1997. Sedimentary Basins and Petroleum Geology of the Middle East. Elsevier, Netherlands.
Anselmetti, F.S., Eberli, G.P., 1993. Controls on sonic velocity in carbonates, Pure and Applied Geophysics141,287-323.
Anselmetti, F.S., Eberli, G.P., 1999. Velocity deviation log: a tool to predict pore type and permeability trends in carbonate drill holes from sonic and porosity or density logs. AAPG Bull. 83, 450-466.
Baechle, G.T., Weger, R.J.,Eberli, G.P., Massafero, J.L., Sun, Y.F., 2005. Changes of shear moduli in
carbonate rocks: Implications for Gassmann applicability. The Leading Edge 24, 507–511.
Baechle, G.T., Eberli, G.T., Weger, R.J., Massaferro, J.L., 2009. Changes in dynamic shear moduli of carbonate rocks with fluid substitution. Geophysics 74 (3), 135-147.
Bell, F.G., Culshaw, M.G., Cripps, J.C., 1999. A review of selected engineering geological characteristics of English chalk. Engineering Geology 47, 237–269.
Berberian, M., King, G., 1981. Towards a paleogeography and tectonic evolution of Iran. Canadian J. earth sci. 18(2), 210-265.
Best, M.E., Katsube, T.J., 1995. Shale permeability and its significance on hydrocarbon exploration. The Leading Edge 14 (3), 165-170.
Brahma, J., Sircar, A., 2014. Estimation of the effect of anisotropy on Young’s moduli and Poisson’s ratios of sedimentary rocks using core samples in western and central part of Tripura. India International Journal of Geoscience5, 184-195.
Brandano, M., Corda, L., 2002. Nutrients, sea level and tectonics: constrains for the facies architecture of a Miocene carbonate ramp in central Italy. Terra Nova 14, 257–262.
Brigaud, B., Vincent, B., Durlet, C., Deconinck, J.-F., Blanc, P., Trouiller, A., 2010. Acousticproperties of ancient shallow-marine carbonates: Effects of depositional environment and diagenetic processes (Middle Jurassic, Paris Basin , France). Journal of Sedimentary Research 80, 791–807.
Brown, A.R., 1996. Seismic attribute and their classification. The Leading Edge, 15, 1090.
Buxton, M.W.N., Pedley, M., 1989. Short paper: a standardized model for Tethyan Tertiary carbonate ramps. Journal of the Geological Society, London 146, 746-748.
Castagna, J.P., Batzle, M.L., Eastwood, R.L., 1985. Relation between compressional-wave and shear-wave velocities in clastic silicate rocks. Geophysics 50 (4), 571-581.
Chatterjee, R., Mukhopadhyay, M., 2001. Petrophysical and geomechanical properties of rocks from the oilfields of the Krishna–Godavari and Cauvery basins, India. Bulletin of Engineering Geology and Environment 61, 169–178.
Chen, Q., Sidney, S., 1997. Seismic attribute technology for reservoir forecasting and monitoring. The Leading Edge 16 (5), 445–456.
Corda, L., Brandano, M., 2003. Aphotic zone carbonate production on a Miocene ramp Central Apennines, Italy. Sedimentary Geology 61, 55–70.
Dehghani, M.H., Shadizadeh, S.R.,Roozbehani, B., 2014.Geomechanical Modeling Using Well Logs: A Case Study of an Iranian Heterogeneous Carbonate Reservoir. Energy Sources, part A 36, 1555-1570.
Dunham, R.J., 1962. Classification of carbonate rocks according to depositional texture. AAPG Mem. 1, 108–121.
Dunnington, H.V., 1958. Generation, migration, accumulation and dissipation of oil in northern Iraq. In: Weeks, L.G. (Ed.), AAPG Bull. Habitat of Oil, 1194-1251.
Dunnington, H.V., 1967. Stratigraphic distribution of oilfields in the Iraq-Iran- Arabia Basin. Journal of the Institute of Petroleum 53, 129-161.
Eberli, G.P., Baechle, G.T., Anselmetti, F.S.,Incze, M.L., 2003. Factors controlling elastic properties in carbonate sediments and rocks. The Leading Edge 22, 654-660.
Esrafili-Dizaji, B.,Rahimpour-Bonab, H., 2009. Effects of depositional and diagenetic characteristics on carbonate reservoir quality: a case study from the South Pars gas field in the Persian Gulf. Petroleum Geoscience 15, 325–344.
Fabricius, I.L., Bachle, G.T.,Eberli, G.P., 2010. Elastic moduli of dry and water-saturated – effect of depositional texture porosity and permeability. Geophysics 75(3), 65-78.
Flugel, E., 1982.Microfacies analysis oflimestones. Springer, Berlin, 633 p..
Flugel, E., 2010.Microfacies of carbonate rocks: analysis, interpretation and application. 2nd edn., Springer, Berlin, 984 p..
Fournier, F., Leonide, P., Biscarrat, K., Gallois, A., Borgomano, J., Foubert, A., 2011. Elasticproperties of microporous cemented grainstones. Geophysics 76, 211–226.
Fournier, F., Léonide, P., Kleipool, K., Toullec, R., Reijmer, J.G., Borgomano, J., Klootwijk, T., Van Der Molen, J., 2014. Pore space evolution and elastic properties of platform carbonates (Urgonian limestone, arremian–Aptian, SE France). Sedimentary geology 308, 1-17.
Geel, T., 2000. Recognition of Stratigraphic sequence in carbonate platform and slope deposits: empirical models based on microfacies analyses of palaeogene deposits in southeastern Spain. Palaeogeogr Palaeoclimatol Palaeoecol 155, 211–238.
Ghazvinian, A., Nejati, H.R., Saemi, M., 2012. Reliability and uncertainty of prediction of dynamic elastic constants in reservoir rock SPE paper no. 155503.

Haynes, S.J., McQuillan, H., 1974. Evolution of the Zagros suture zone, southern Iran. Geological Society of America Bulletin 85, 739-744.
Henson, F.R.S., 1951. Observations on the geology and petroleum occurrences of the Middle East. Proc. 3rd World Petroleum Congress, 1, 118-140.
Honarmand, J., 2013.Sedimentological and diagenetic controls on reservoir properties of the Asmari formation, Cheshmeh-Khosh field, northern part of Dezful Embayment, SW Iran. Ph.D. thesis University of Tehran Tehran 308 p..
Hussain, M., El Hassan, W.M.,Abdulraheem, A., 2006. Controls of grain-size distribution on geomechanical properties of reservoir rock—A case study: Cretaceous Khafji Member, Zuluf Field, offshore Arabian Gulf. Marine and Petroleum Geology 23, 703-713.
James, G.A.,Wynd, J.G., 1965. Stratigraphical nomenclature of Iranian Consortium Agreement Area. AAPG Bull.49, 2182-2245.
Jeng, F.S., Weng, M.C., Lin, M.L., Huang, T.H., 2004. Influence of petrographic parameters on geotechnical properties of Tertiary sandstones from Taiwan. Engineering Geology 73, 71–91.
Jensen, E.H., Andersen, C.F., Johansen, T.A., 2011. Estimation of elastic moduli of mixed porous composites Geophysics 76 (1), 9-20.
Kadkhodaie‐Ilkhchi, Rezaee, M.R.,Rahimpour-Bonab, H., Chehrazi, A., 2009. Petrophysical data prediction from seismic attributes using committee fuzzy inference system.Computer and Geoscience35, 2314–2330.
Kenter, J.A.M., Anselmetti, F.S., Kramer, P.H., Westphal, H., Vandamme, M.G.M., 2002. Acoustic properties of “young” carbonate rocks, ODP Leg 166 and boreholes Clino and Unda, Western Great Bahama Bank. Journal of Sedimentary Research 72, 129–137.
Khazanehdari, J.,Sothcott, J., 2003. Variation in dynamic elastic shear modulus of sandstone upon fluid saturation and substitution, Geophysics 68, 472–481.
Kowalski, J., 1975. Formation Strength Parameters from Well Logs. SPWLA 16th Ann. Logging Symp., Society of Petrophysicists and Well-Log Analysts.
Lønøy, A., 2006. Making sense of carbonate pore systems, AAPG Bull. 90, 1381–405.
Motiei, H., 1993. Geology of Iran, the Stratigraphy of Zagros. (Tehran, Geological Survey of Iran), 572 p. (in Persian).
Pettijohn, F.J., Potter, P.E., Siever, R., 1987. Sand and Sandstone, Springer-Verlag, 553 p..
Shakoor, A., Brown, C.L., 1996. Development of a quantitative relationship between unconfined compressive strength and Los Angeles abrasion loss for carbonate rocks. Bulletin of InternationalAssociation of Engineering Geology 53, 97–103.

Sharland, P.R., Archer, R., Casey, D.M., 2001. Arabian Plate sequence stratigraphy. GeoArabia Special Publication, 2.
Topal, T., Doyuran, V., 1997. Engineering geological properties and durability assessment of the Cappadocian tuff. Engineering Geology 47, 175–187.
Tucker, M. E., Wright, V.P., 1990. Carbonate Sedimentology, Blackwell, Oxford, 482 p.
Van Buchem, F.S.P., Allen, T.,Lausen, G.V.,Lotfpour, M.,Moallemi, A.,Monibi, S.,Motiei, H., Pickard, N.,Tahmasbi, A.R.,Vedrenne, V., Vincent, B., 2010. Sequence stratigraphy and Sr isotope stratigraphy of the Oligo-Miocene deposits in the Dezful Embayment (Asmari and Pabdeh Formations, SW Iran)-implications for reservoir characterization.1st International Petroleum Conference European Association of Geoscientists and Engineers (EAGE) 4-6 May Shiraz Iran.
Verwer, K., Braaksma, H., Kenter, J.A.M., 2008. Acoustic properties of carbonates: Effects of rock texture and implications for fluid substitution. Geophysics 73, B51–B65.
Verwer, K., Eberli, G., Baechle, G.,Weger, R., 2010. Effect of carbonate pore structure on dynamic shear moduli. Geophysics 75(1), 1-8.
Weger, R.J., Eberli, G.P., Baechle, G.T., Massaferro, J.L., Sun, Y.F., 2009. Quantification of pore structure and its effect on sonic velocity and permeability in carbonates. AAPG Bulletin 93, 1297–1317.
Wennberg, O.P., Svånå, T., Azizzadeh, M., Aqrawi, A.M.M., Brockbank, P., Lyslo, K.B., Ogilvie, S., 2006. Fracture intensity vs. mechanical stratigraphy in platform top carbonates: the Aquitanian of the Asmari Formation, Khaviz Anticline, Zagros, SW Iran.Petroleum Geoscience 12(3), 235 – 246.
Williams, M.P., Edwards, H.E.,Bratli, R.K., 2012. Rock mechanical facies; classification and use in carbonate reservoirs, Offshore Abu Dhabi. SPE paper no. 161524.
Wilson, J.L., 1975. Carbonate facies in geologic history. Springer, New York, 471 p..
Yematawork, A., Raven, B., Estoque, M., Norgard, J., 2010. Seismic Inversion-A Work Flow For Model-Based Inversion. GeoCanada-Working with the Earth, Calgary.
Zee, W., Hughes, B., Taylor, J.,Brudy, M., 2012. Improving sub salt wellbore srability predictions using 3D geomechanical simulations. SPE paper no. 162313.
Zhang, J., Bently, L.R., 2003.Crewes research report. Vol 15 Calgary Canada: university of Canada. In Rehman, F.,Rehman, S.,Ullah, M.F., Kashif, M., Ahsan, N., Abbas, M., 2014. Conjecturing gross lithologic information using elastic moduli obsessed by rock physics as tool. A case study for khewrasandstone, Fortabbas Area, Pakistan. Energy Sources, Part A 36, 1786-1792.
Table captions
Table 1. Microfacies description and facies associations (facies belts) of the Asmari carbonate intervals in
the studied wells.
Table 2. Comparative descriptive data of the seven RMFs in the studied formation. In each RMF mean of
parameters and brief facies/texture descriptions are shown.
Table 3. Multi attribute table showing combination of ten attributes for estimation of Young’s modulus and
porosity. As shown after adding first two attributes for Young’s modulus and eight attributes for porosity
to the prediction list, training error decreases while validation error starts to increase.
Table 4. Probabilistic neural network with highest correlation and lowest error in training and validation
set to predict target logs (upper: Young’s modulus, lower: Porosity) from seismic attributes.
Figure captions
Figure 1. A location map of studied oilfield in the NW of Dezful Embayment and distribution of Asmari
Reservoir in the south of Iran.
Figure 2. Conceptual depositional model for carbonate (upper) and clastic (lower) intervals of the Asmari
Formation in the studied oilfield. The location of the microfacies determined the main energy surfaces (fair
weather wave base and storm wave base) and microfacies illustrations for the main facies belts are shown
(modified from Honarmand 2013).
Figure 3. Plot showing range of porosity values within facies of Asmari Formation.
Figure 4. Correlation between dynamic elastic parameters and porosity in different carbonate (A to E) and
clastic (F to J) facies. Young’s modulus shows a higher correlation with porosity.
Figure 5. Distribution of seven RMFs in one of the studied wells. In each RMF ratio of grain to mud or
cement (energy level of sedimentary environment), pore types and saturation are determined.
Figure 6. Photomicrographs of RMFs (RMF1 to RMF7) from the Asmari Formation in the studied oil fields.
a) Mudstone: RMF1; b) Wackestone: RMF2; c) Grainstone: RMF3; d) Cemented and dissolved grainstone:
RMF 4; e) Coarse and clean sandatone: RMF5; f) Fine and dirty sandstone: RMF6; g) Cemented sandstone:
RMF7.
Figure 7. A window of well to seismic tie in well CK#5 by synthetic seismogram.
Figure 8. Amplitude (left), frequency and phase (right) spectra of the final wavelet used for inversion of
seismic data to acoustic impedance.
Figure 9. Inverted acoustic impedance section in the Asmari Formation of Cheshmeh-Khoshoilfield.
Figure 10. Statistically and graphically good correlation and low average error between estimated target
logs (red color) and original logs (black color) from probabilistic neural network method are shown for two
target logs (right: porosity; left: Young’s modulus).
Figure 11. A) A slice of Young’s modulus with average window of 30 millisecond below the Asmari
horizon. This map shows the distribution of 4 RMFs in carbonate part of the formation. B) A slice of
Young’s modulus with average window of 40 millisecond above the Pabdeh horizon. This map shows the
distribution of 3 RMFs in clastic part of the formation.
Figure 12. A Slice of porosity with average window of 30 millisecond below the Asmari horizon (A) and
40 millisecond above the Pabdeh horizon (B). These maps indicates inverse relation of Young’s modulus
and porosity
Figure 13. Main panel shows good correlation of rock mechanical facies (RMFs) identified using texture,
facies, 𝑃𝑃 𝑜𝑜𝑜𝑜 𝐺𝐺𝐶𝐶 𝑜𝑜𝑜𝑜 𝑀𝑀
ration and amount of Young’s modulus between wells CK#3, CK#1 and CK#2 of Cheshmeh-
Khosh oilfield.
1 2 3 4 5 6 7 8 9 1011121314151617181920212223242526272829303132333435363738394041424344454647484950515253545556575859606162636465
Table 1
MF Code
Microfacies name
Lithology, color and
texture
Grain size and sorting
Components Facies association
Interpretation (environment)
Skeletal Non-skeletal
MF A
Mudstone, bioclasticwackeston
e with planktonic foraminifera
Clayey-limestone, gray
to black, mudstone to wackestone
Calcilutite, poorly sorted
Globigerina,lenticulina, Amphistegina
MF B1, MF B2
Deep open marine
MF B1
Bioclasticpackstone with large
benthic foraminifera
Lime, light brown,
wackestone /packstone
Calcarenite–calcilutite,
poorly/moderately sorted
Lepidocyclina, Asterigerina, Amphistegina, Heterostegina, Operculina,
Ostrea,Operculina
MF A, MF B2
Shallow open marine
MF B2 Bioclastic, red
algae, echinoderm, rotaliapackstone
Lime, gray to cream, Packstone
Calcarenite–calcilutite, moderately
sorted
Lithothamnium, Lithophyllum,
Asterigerinarotula،Operculinacomplanata،Amphistegina
lesson, Lepidocyclina
MF A, MF B2, MF C1
Shallow open marine
MF C1 Ooidgrainstone
Lime, dolomite, light
yellow, grainstone
Calcarenite, calcirudite,
well sorted Ooid MF C2,
MF C3, MF B2, Barrier, shoal
MF C2 Bioclastic,
faverina, ooidgrainstone
Lime, brown,
grainstone
Calcarenite, well sorted
Dendritina،Milliolid, Gastropoda,
Faverinaasmaricus, Foraminifera
MF C1 and C2, MF D1 and
D2 Barrier, shoal
MF C3 Miliolid,
dendritinagrainstone
Lime, dolomite, cream to blacky gray,
grainstone, Packstone
Calcarenite, well sorted
Fossil fragments, Peneroplisevolutus,
foraminifera, Dendritina،Milliolid, Ooid,
Peloids
MF C2, MF D1 and D2 Barrier, shoal
MF D1 Miliolidbioclastpackstone
Lime, dolomite, light gray to light
brown, grainstone
Calcarenite- calcilutite,
poorly/moderately sorted
Echinoderms, Red algae, Bivalves,
Dendritina،Milliolid, Gastropoda
MF D2 and D3, MF C3 Lagoon
MF D2 Miliolid,
denderitinawackestone-packstone
Lime, dolomite, gray to light brown, wackestone-packstone
Calcarenite- calcilutite, moderately
sorted
Foraminifera, ،Dendritina،Milliolid, Gastropoda, Bivalve
fragments, Borelis,Peneroplis, Peloids,
Charophyta
MF D3, MF D1, MF C3 Lagoon
MF D3 Coral boundstone
Lime, cream, brown,
boundstone
Calcarenite- calcilutite, moderately
sorted
Coral MF E1, MF D2 and D1 Lagoon
MF E1
Non-laminated fine-grained dolomitized mudstone
Dolomite, anhydrite, lime, cream to brown,
mudstone
Calcilutite, well sorted Anhydrite nodules MF D3,
MF E2 and E3 Intertidal
MF E2
Laminated fine-grained dolomitized
mudstone with evaporate interlayers
Dolomite, anhydrite, lime, cream to brown,
mudstone
Calcilutite, well sorted Anhydrite nodules MF E1 and
E3 Intertidal
MF E3 Peyssonneliaceapackstone
Lime, dolomite
Calcarenite- calcilutite,
moderatly sorted
Stromatolite MF E2 and E1 Intertidal
1 2 3 4 5 6 7 8 9 1011121314151617181920212223242526272829303132333435363738394041424344454647484950515253545556575859606162636465
Table 2
RMFs
Avg. E x106
(psi)
Avg. Ф (%)
Avg. K (mD)
Energy level
Saturation
Pore Type Texture and Facies
1 10 7 1 <1 Low Low Microporosity
Mudstone/Dolomudstone (E1,E3) and Wackestone (D2),
Intertida (E), Lagoon (D2, D3) and Deep Marine (A)
2 8 15 50 1 Medium Medium
Fine Interparticle&Intercrystalline, Moldic,
Vug
Wackestone and Packstone (C-D), Back-Shoal or Lagoonal Shoal
Margin, Tidal Channel, Lagoon (D1), Open Lagoon and Shallow
Open Marine (B)
3 4 20 350 >1 High High Coarse Interparticle and Intercrystalline
Ooids (C1), Intraclasts, and BioclastsGrainstone (C2), Shoal (C), Shallow Open Marine (B2)
4 11.5 3 0.1 <1 High Very Low Microporosity, Moldic and Vug
Packstone to Dolomitized Grainstone (C3,D1), Back Shoal and
Shoal (C)
5 4 22 1200 >1 High Very High Coarse Intergranular
Arenite, Barrier Island (I) and Incised Valley Filled (G)
6 5 12 150 1 Medium to Low Medium Fine Intergranular
Quartz Wacke and Sandy Mudstone (J), Lower Shoreface to Offshore (F), Upper Shoreface and
Intertidal (H)
7 8.5 5 0.5 <1 Medium Very Low Microporosity Lithic arenite/wacke, Shoreface
(H), Barrier Island (I)and Channel fill sediments (G-H)

1 2 3 4 5 6 7 8 9 1011121314151617181920212223242526272829303132333435363738394041424344454647484950515253545556575859606162636465
Table 3a
Validation
Training
Final Attribute Target No.
Error Correlation Error Correlation
870413.2044 0.8378 801390.3299 0.9264 (Inversion Result)**2 Sqrt(Young’s
Modulus) 1
867266.1076 0.8791 738414.4071 0.9137 Instantaneous Phase Sqrt(Young’s
Modulus) 2
1492949.6887 0.8167 649507.5951 0.9619 Instantaneous Frequency Sqrt(Young’s
Modulus) 3
1643057.9806 0.6276 609365.8821 0.9689 Integrated Absolute Amplitude Sqrt(Young’s
Modulus) 4
6036391.5273 0.3159 577390.0753 0.9774 Dominant Frequency Sqrt(Young’s
Modulus) 5
3241220.5542 0.1293 541330.4981 0.9834 Average Frequency Sqrt(Young’s
Modulus) 6
3249612.4392 0.3589 514184.8522 0.9854 Apparent Polarity Sqrt(Young’s
Modulus) 7
3578807.1620 0.3781 482283.9835 0.9877 Second Derivative
Instantaneous Amplitude
Sqrt(Young’s
Modulus) 8
24653830.5388 0.4901 450526.2589 0.9911 Integrate Sqrt(Young’s
Modulus) 9
25780861.7820 0.4696 435227.1189 0.9946 Amplitude Weighted Phase Sqrt(Young’s
Modulus) 10
1 2 3 4 5 6 7 8 9 1011121314151617181920212223242526272829303132333435363738394041424344454647484950515253545556575859606162636465
Table 3b
Validation
Training
Final Attribute Target No.
Error Correlation Error Correlation
0.0304 34.21 0.0287 0.9512 (Inversion Result)**2 Porosity
Log 1
0.0291 0.4911 0.0274 0.7903 Derivate Instantaneous
Amplitude
Porosity
Log 2
0.0302 0.1930 0.0259 0.8675 Cosine Instantaneous Phase Porosity
Log 3
0.0293 0.4321 0.0254 0.9854 Amplitude Weighted Phase Porosity
Log 4
0.0298 0.6534 0.0253 0.9243 Instantaneous Phase Porosity
Log 5
0.0295 0.7943 0.0252 0.9981 Average Frequency Porosity
Log 6
0.0291 0.5678 0.0251 0.9389 Apparent Polarity Porosity
Log 7
0.0290 0.8293 0.0249 0.8028 Integrated Absolute Amplitude Porosity
Log 8
0.0292 0.6567 0.0246 0.9566 Dominant Frequency Porosity
Log 9
0.0299 0.2765 0.0244 0.9771 Derivative Porosity
Log 10

1 2 3 4 5 6 7 8 9 1011121314151617181920212223242526272829303132333435363738394041424344454647484950515253545556575859606162636465
Table 4a
Validation
Training
Final Attribute Network
Error Correlation Error Correlation
819480 0.9000 729989 0.9325 Instantaneous Phase
5 Number of layer
PNN
11 Number of neurons in the hidden layer
48 Maximum epochs in ANN
Table 4b
Validation
Training
Final Attribute Network
Error Correlation Error Correlation
0.0253 0.8015 0.0125 0.9552 Integrated Absolute Amplitude
4 Number of layer
PNN
8 Number of neurons in the hidden layer
34 Maximum epochs in PNN

Research highlights
Studying the connection between facies distribution and elastic modulus
Introduction of Rock Mechanical Facies(RMF) concept
Relation between grain to matrix ratio with Young’s modulus
Construction of 3D model RMFs
Correlation of RMFs concept among the wells.
*Highlights
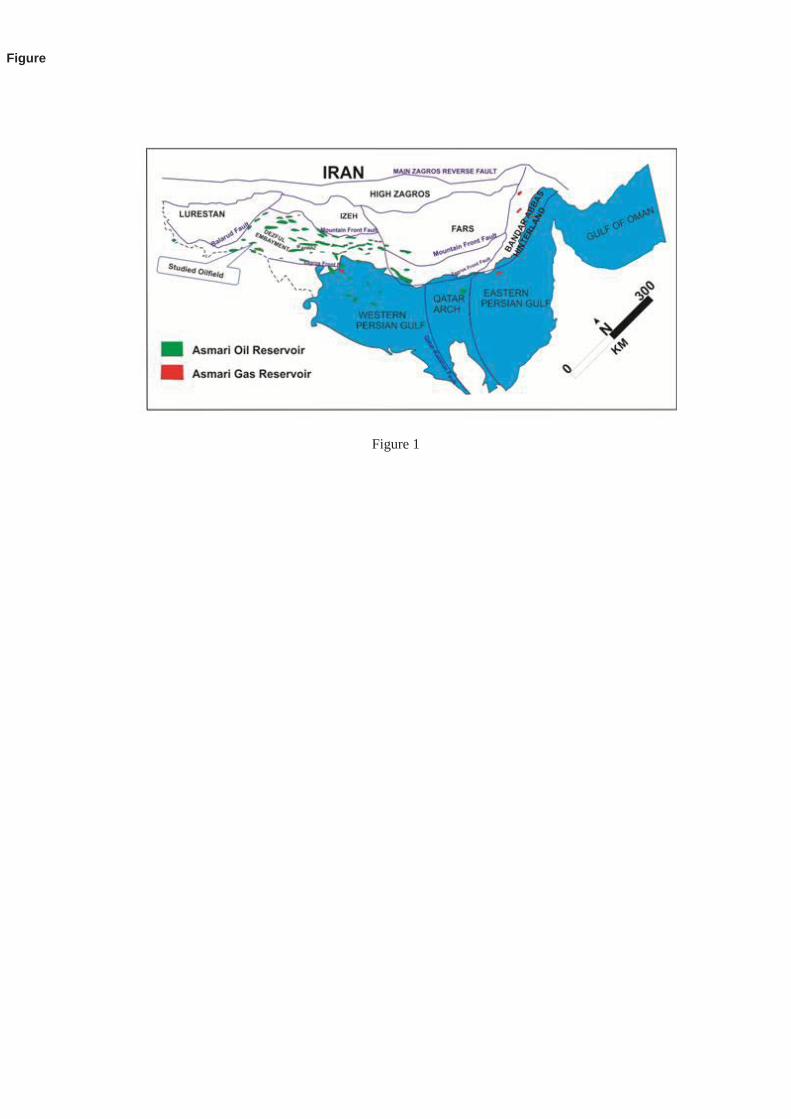
Figure 1
Figure
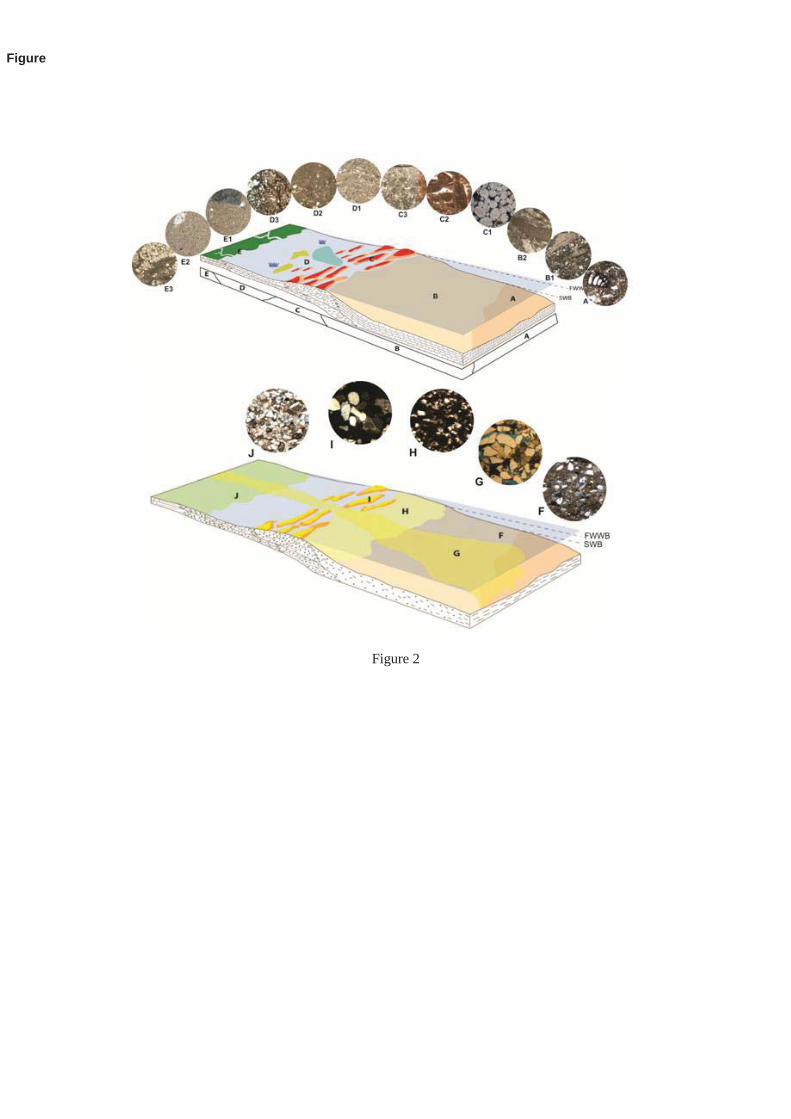
Figure 2
Figure

Figure 3
Figure

FigureClick here to download high resolution image
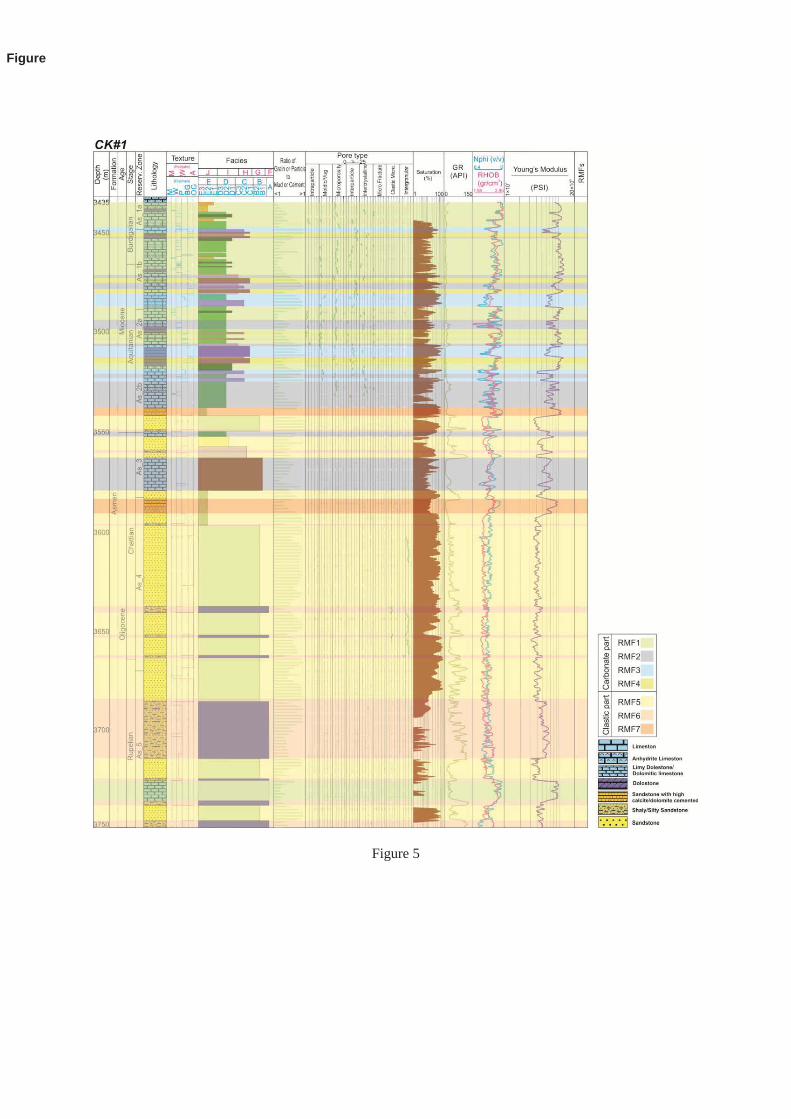
Figure 5
Figure
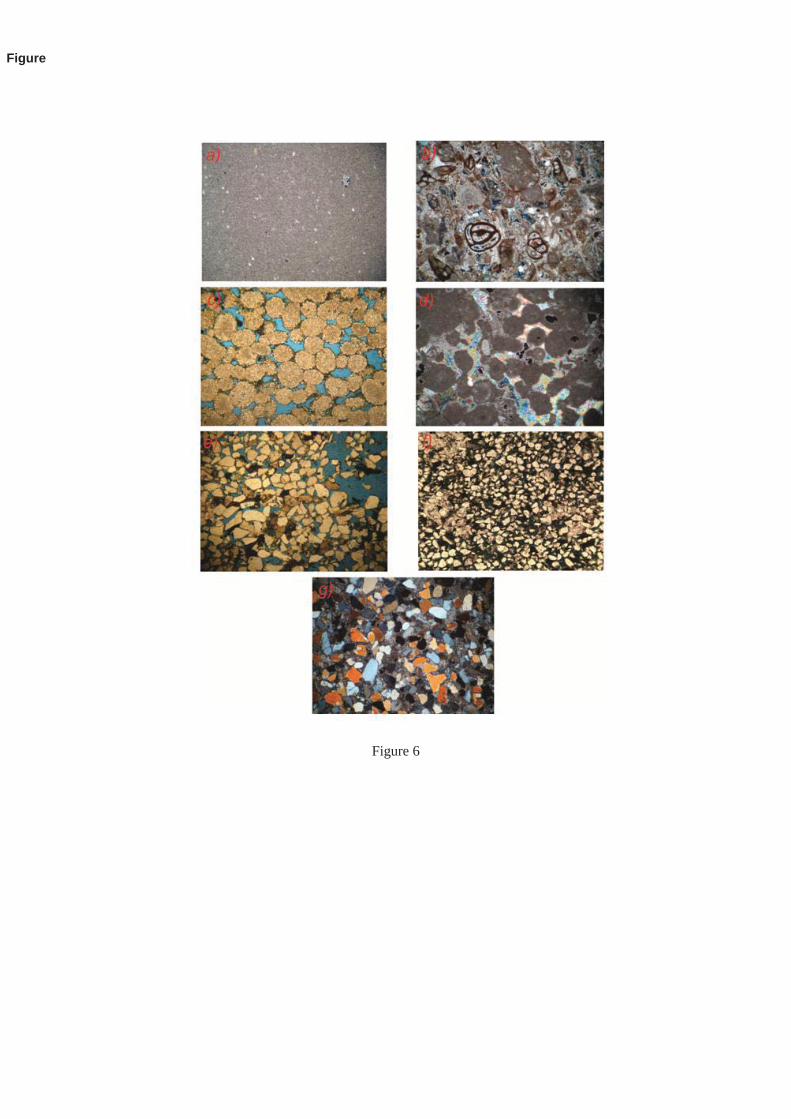
Figure 6
Figure
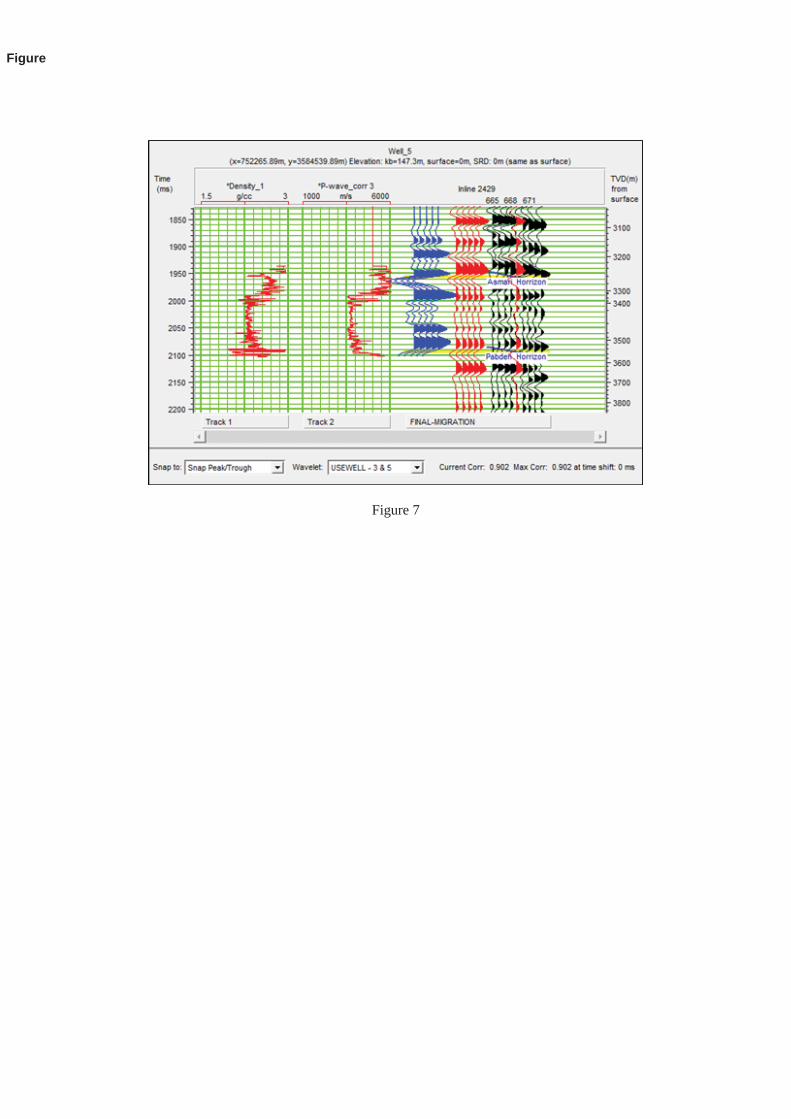
Figure 7
Figure
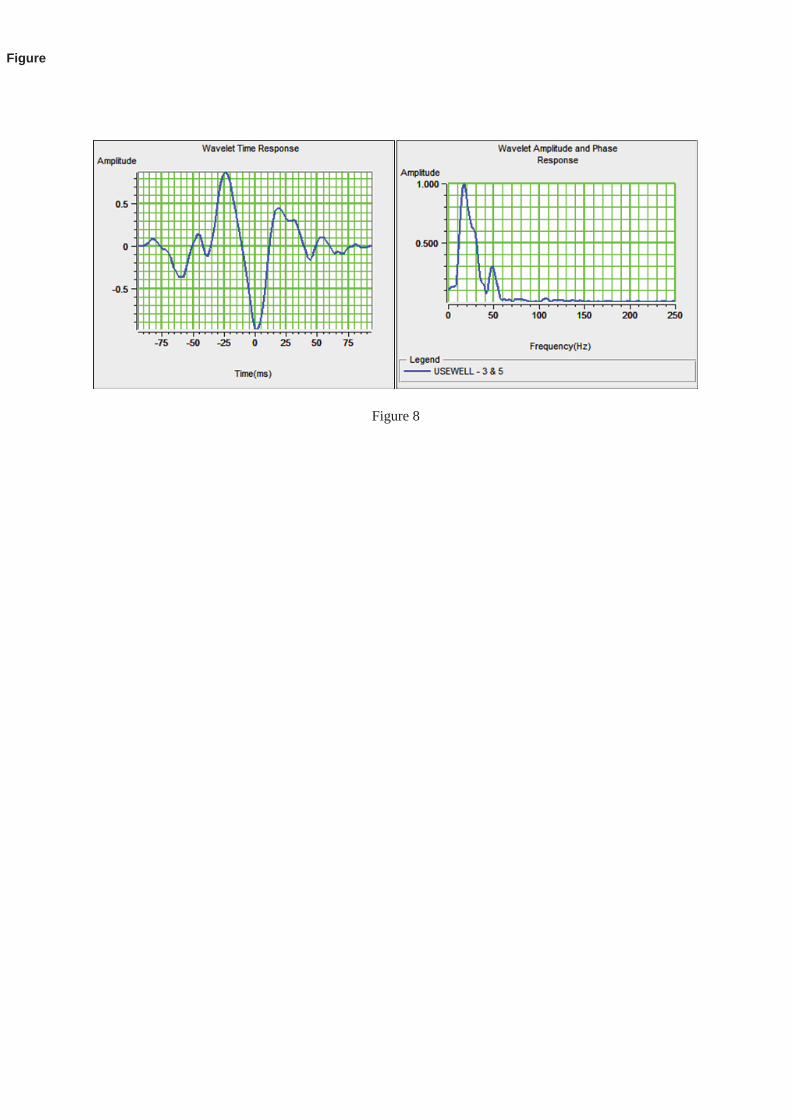
Figure 8
Figure
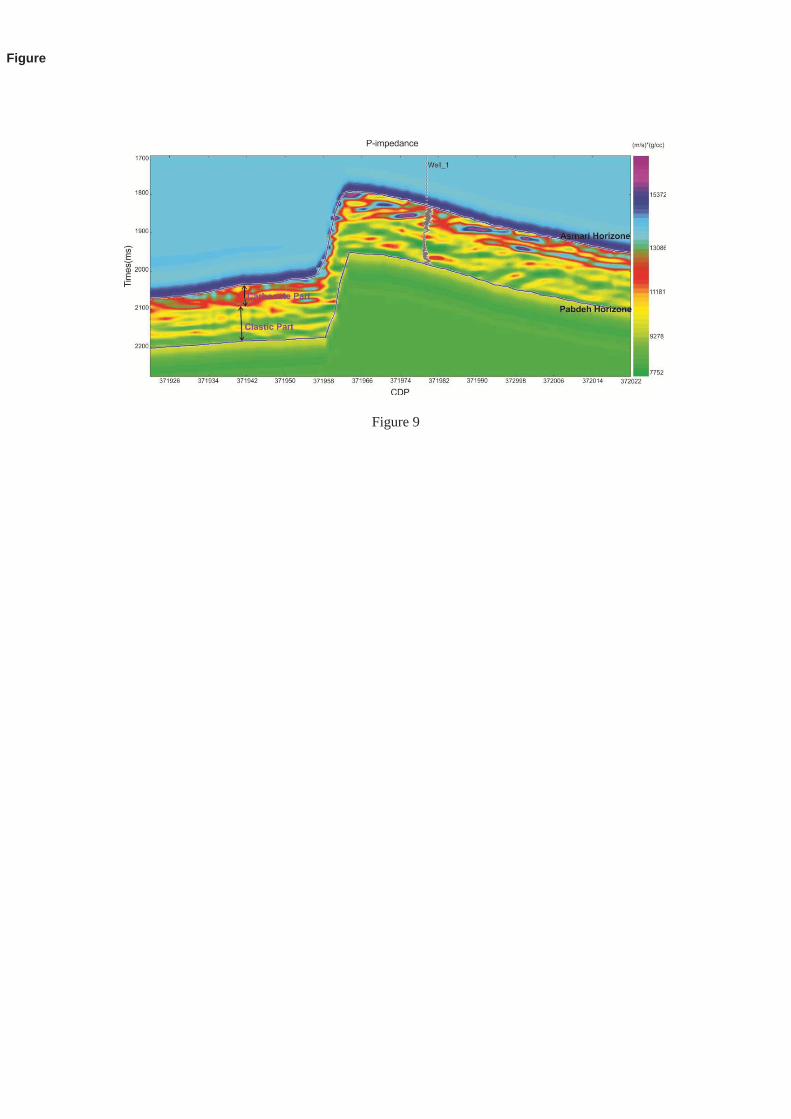
Figure 9
Figure

Figure 10
Figure
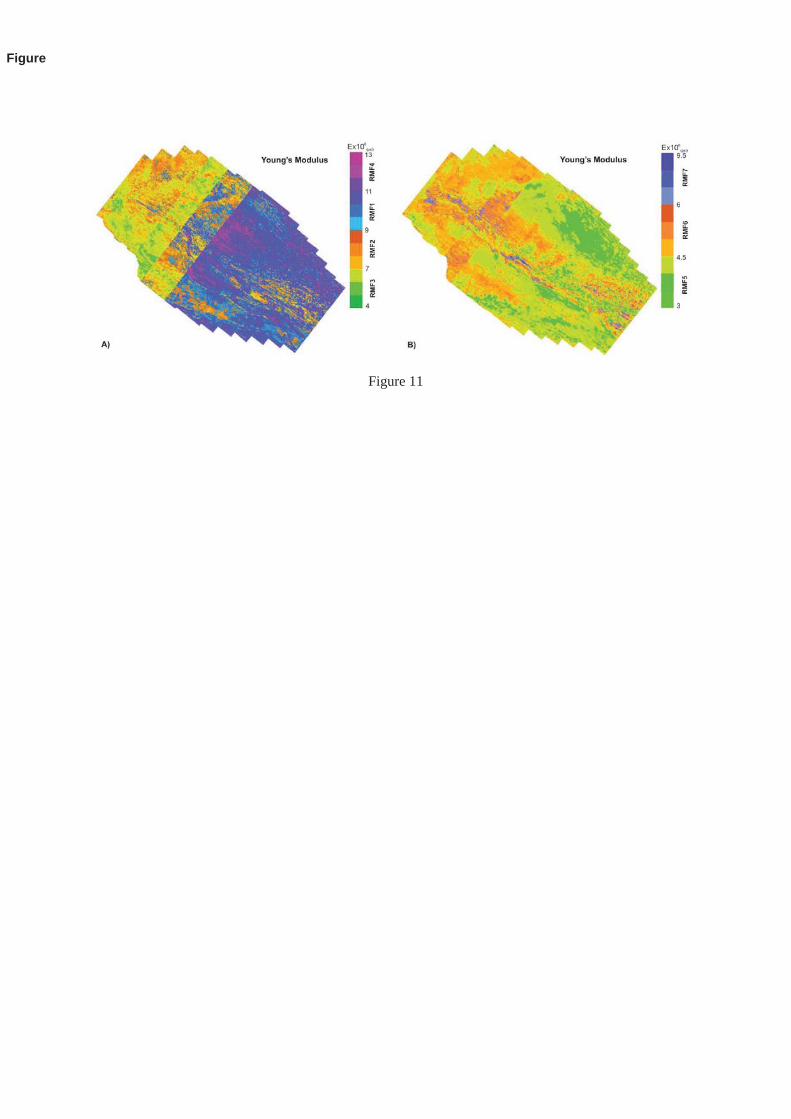
Figure 11
Figure
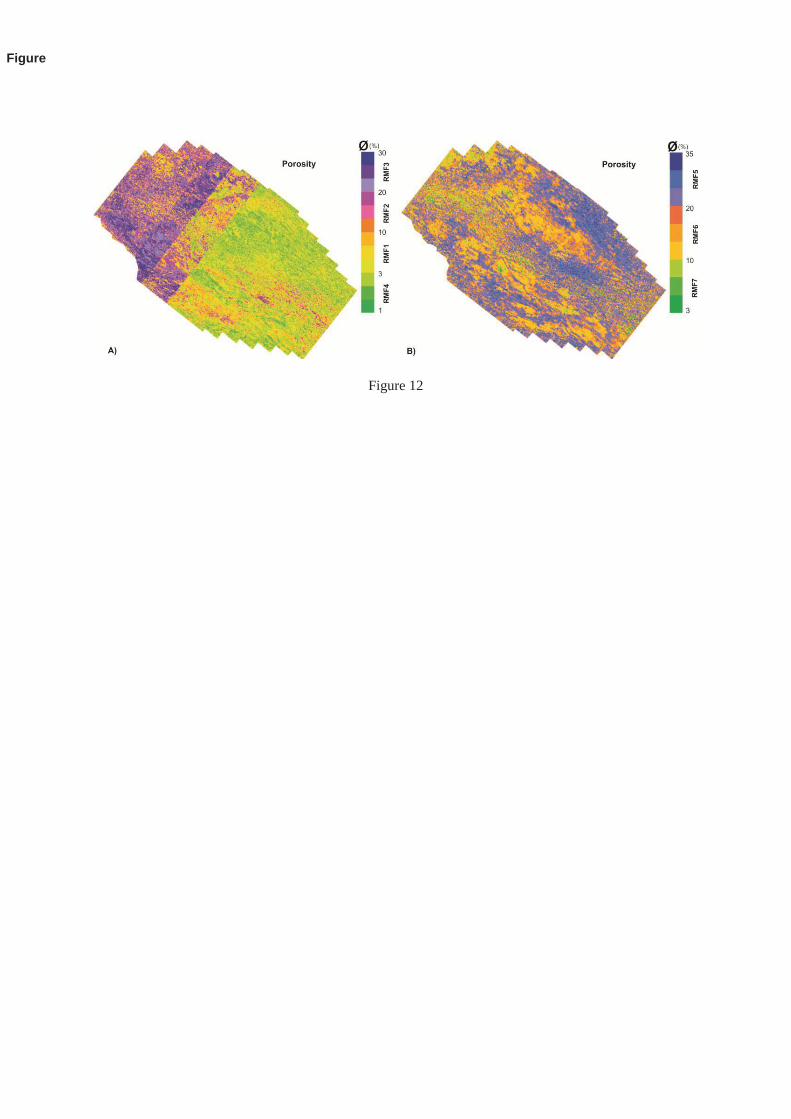
Figure 12
Figure
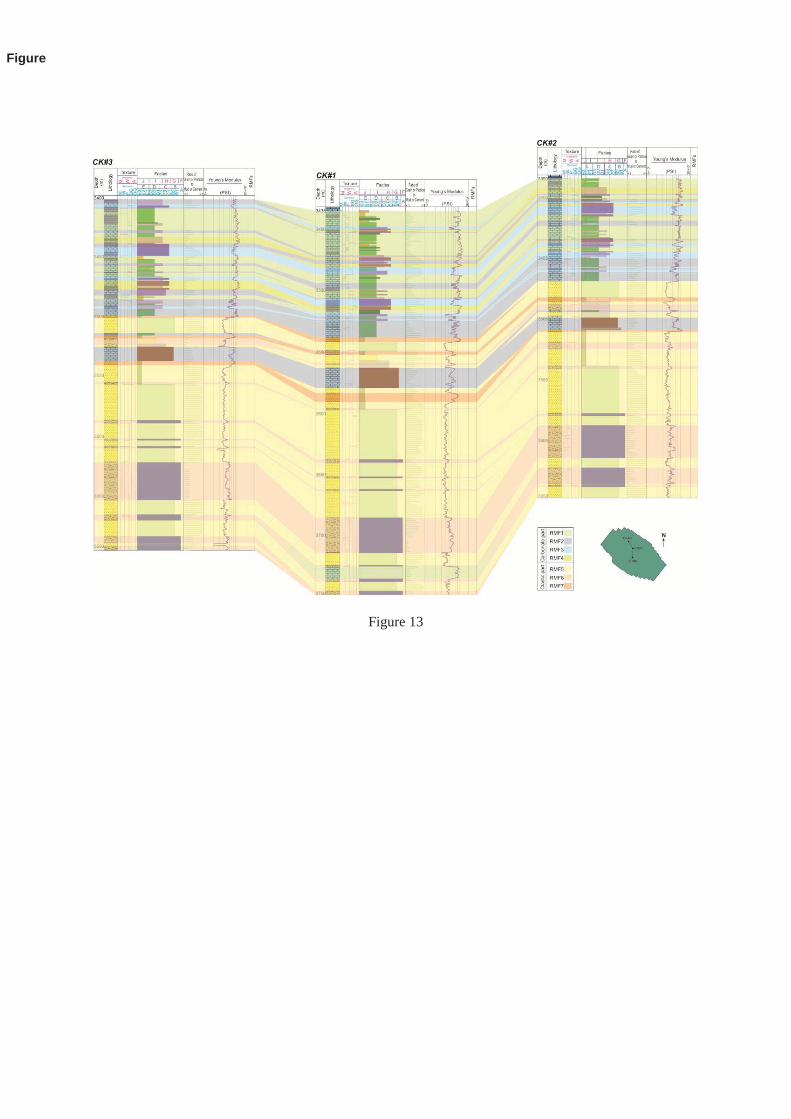
Figure 13
Figure