a sector analysis of the industry ofbusiness process outsourcing (bpo) industry ... 5.5 employee...
TRANSCRIPT
A baseline sector analysis of the
Business Process Outsourcing (BPO) industry
of Sri Lanka
Report prepared by
LIRNEasia www.lirneasia.net [email protected]
Draft report not for circulation Version 3.1
21 August, 2006
Information and Communication Technology Association (ICTA) of Sri Lanka
The Information and Communication Technology Agency of Sri Lanka (ICTA), which became operational in July 2003 under the Information and Communication Technology Act, is the implementing organization for ʹe‐Sri Lankaʹ. To fulfil its mandate, ICTA will implement programmes in: 1) ICT Policy, Leadership, and Institutional Development, 2) building the National Information Infrastructure, 3) Re‐engineering Government, 4) ICT Investment and Private Sector Development and 5) e‐Society. Through the implementation of ʹe‐Sri Lankaʹ, an enabling environment will be created, where partnerships will be developed between public sector, private sector, and civil society to: ʹtake the dividends of ICT to every village, to every citizen, to every business and to transform the way government thinks and worksʹ.
In lieu of the dearth of quantitative and qualitative data on the Business Process Outsourcing (BPO) sector in the country, ICTA commissioned a study to conduct a baseline sector analysis of the BPO industry in Sri Lanka.

LIRNEasia
LIRNEasia is the Asian affiliate of LIRNE.NET. It is a regional ICT [information and communication technologies] policy and regulation capacity building organization, incorporated as a non‐profit organization under section 21 of the Companies Act, No. 17 of 1982 of Sri Lanka in 2004 and funded at present by the IDRC and infoDev, a unit of the World Bank. Its primary functions are research, training and informed intervention in policy and regulatory processes. Its current projects include research in South as well as South East Asia.
LIRNEasia aims to improve the lives the people of Asia – by making it easier to make use of the information and communication technologies by facilitating the changing of laws, policies and regulations to enable those uses; by building Asia‐based human capacity through research, training, consulting and advocacy.
Dilshani Samaraweera, Harsha de Silva and Sriganesh Lokanathan from LIRNEasia worked on this report.
Contact
LIRNEasia 12 Balcombe Place Colombo 08 Sri Lanka
Phone: +94 11 493 992 Fax: +94 11 494 0290 Email: [email protected] www.lirneasia.net
1
Table of contents
1.0 Introduction to the project 3 1.1 Definition of a BPO receiver 4 1.2 Survey methodology 4
1.2.1 Selection of study sample 5 1.2.2 Administration of the interviews 5
2.0 Summary of findings 7 2.1 Investments 8 2.2 Service offerings 9 2.3 Labour 9 2.4 Major obstacles to growth 10 2.4.1 Domestic stability 10 2.4.2 Transport 11 2.4.3 Telecommunications 11 2.5 Expansion 11 3.0 An overview of Sri Lanka’s BPO sector 12
3.1 Sector composition 13 3.2 Reasons for locating in Sri lanka 15 3.3 BPO investments in Sri Lanka 16 3.4 Services 17 3.5 Export markets 19 3.6 Marketing Sri Lanka as a BPO destination 19 3.7 BPO operating costs 20
4.0 Impacts of domestic infrastructure on the BPO sector 23 4.1 Transport 23 4.2 Telecommunications 24 4.3 Electricity 27 4.4 Losses due to infrastructure failure 27
5.0 BPO sector management and workers 28 5.1 BPO top management 28 5.2 Sector employment 28 5.3 Workforce characteristics 30 5.4 Salaries and incentives 31 5.5 Employee turnover and recruitment 33
2
5.5.1 Turnover 33 5.5.2 Recruitment 33 5.6 Skills in demand 34 5.7 Skills development and training 36 5.8 Employment growth 37
6.0 Government relations and industry bodies 38 6.1 Regulations and taxes 39 6.2 Stability of operating environment 40 6.3 Government incentives 41 6.4 Sector representation 42
7.0 Growth prospects of the BPO sector 44 8.0 Conclusions 46 8.1 Capacity constraints 46 8.2 Regulatory and procedural constraints 47 8.3 Marketing and sector promotion 48 Annex A: List of BPO operators targeted by the baseline survey 49 Annex B: List of tables and charts 50

3
1.0 Introduction
The current potential global Business Process Outsourcing industry (BPO) market of
USD 11.5 billion is expected to grow ten‐fold to around USD 120‐150 billion in the near
future1. However, Sri Lanka only recently started emerging as a potential destination for
outsourced work. The baseline sector analysis of the BPO industry in Sri Lanka was
conducted to fill the knowledge gaps regarding this emerging service sector. The study
identifies factors that attract BPO‐related investments into Sri Lanka and also potential
constraints to such investment growth. Although not designed to be a policy document
but a nuts‐and‐bolts study of an emerging industry, the findings are useful to
understand the broad requirements of BPO service providers and facilities necessary to
create an enabling environment for further growth of the sector.
Specific objectives of the study include:
• Obtaining information on the range of BPO services offered in Sri Lanka
• Identifying factors that have made BPO companies locate in Sri Lanka
• Identifying the requirements and constraints posed by infrastructure and human
resources to expand business prospects
• Identifying direct and indirect impacts on employment generation in Sri Lanka
• Identifying potential legislative and regulatory changes that are needed to promote
the sector.
1 The Nasscom‐McKinsey Study (2005), Extending Indiaʹs leadership of the global IT and BPO industries, National Association of Software and Services Companies, New Delhi
4
1.1 Definition of a BPO receiver
For the purpose of this study BPO is defined as the act of outsourcing to a third party
the responsibility of running a business process that would otherwise be conducted
internally. The receiver of the outsourced process administers the process based on a
defined and measurable performance matrix. The receiver is also an independent legal
entity maintaining its own accounting systems. For this study, outsourced services are
limited to the category of Information Technology Enables Services (ITES).
In this study BPO receiving companies are broadly classified as falling under one or
more of the following segments;
An offshore BPO: When a business process or processes are outsourced to a company in
Sri Lanka by a company located in another country.
An onshore BPO: When a company located in Sri Lanka outsources a business process
or processes, to another company that is also located in Sri Lanka.
A captive BPO: The parent company that is outsourcing the business process owns the
company that is set up to receive the outsourced work and the receiving company
services only the parent company.
A non‐captive BPO: An independent, third party receiver of outsourced business
processes. These companies take on outsourced work from any other company
including parent companies.
1.2 Survey Methodology
The study was conducted through a series of in‐depth interviews of senior management
of BPO receiving companies in Sri Lanka based on a semi‐structured questionnaire.
5
The questionnaire developed for the study aimed to capture information necessary to
reach the specific objectives outlined above. The questions covered general information
about the firm: availability, quality and cost of infrastructure; labour market conditions;
marketing and sales methods; extent of industry cooperation; business‐government
relations and growth prospects.
1.2.1 Selection of study sample
The total number of companies that came within the definition of BPOs, as set by this
study, was 25. All the identified companies were contacted instead of using a sample.
The companies were selected from three sources: the members’ list of the Information
Technology Enabled Services Association (ITESA), a list of BPO service providers from
the Board of Investment (BOI) of Sri Lanka and a list of companies from the Information
Communication Technology Agency (ICTA) of Sri Lanka.
Software exporting companies and IT service providers were excluded, as they did not
come within the definition of a BPO receiving company set by this study.
The 25 companies identified as BPO receivers comprised a mix of onshore, offshore,
captive and non‐captive operators. The attempt to conduct a census yielded an industry
participation of 84% with 21 out of 25 identified companies taking part. A complete list
of the companies can be found in Annex A.
1.2.2 Administration of the interviews
To maintain confidentiality and impartiality, the services of market research firm, A. C.
Nielsen Lanka (Pvt.) Ltd, was obtained to conduct the interviews. Pilot studies were
conducted to fine‐tune the questionnaire during the first week of March 2006. The

6
interviews targeting top managers of BPO facilities in Sri Lanka, based on the finalised
questionnaire, were conducted over a 5 week period from May to June 2006.
7
2.0 Summary of Findings
Although the first BPO unit, an offshore US operation, was set up in Sri Lanka in 1983,
the findings indicate that the BPO sector started emerging only from year‐2000. BPO
investments gained momentum in 2004 with the commencement of 5 companies.
Growth continued in 2005 with 8 additional new entrants. By mid 2006 one more BPO
receiving facility had initiated operations and more were pending commercial
operations2.
Salient points that emerged from the baseline study
BPO industry
• The BPO sector captured by the study comprised of more offshore companies (52%)
than onshore companies (38%). Those that are both offshore and onshore were 10%.
• The industry is split equally between non‐captive operators (48%) and captive BPO
units (48%).
• A majority of the companies (86%) are established under the Board of Investment of
Sri Lanka.
• Sri Lanka’s primary attraction for BPOs is low labour and low operating costs.
• The main export markets for Sri Lankan based BPOs are the US and the UK
Employment at BPOs
• Employment numbers are higher among offshore BPOs (average of 265 employees)
than onshore units (average of 78 employees).
• Employment at non‐captive BPOs is lower (average of 134) than at captive BPOs
(average of 228 employees).
• Average yearly turnover of employees is 6%. Turnover is higher at non‐captive units
than at captive BPOs.
2 According to the Information Communication Technology Agency (ICTA), 6 companies had applied to set up BPO operations in 2006.
8
• A majority of BPO operators (95%) plan to increase employment in the near future.
Growth plans and constraints
• Most companies (76%) are planning expansion, including physical expansion and
market development.
• Civil and political instability is considered the leading threat to the industry (67%).
• The mass transport service is considered the leading infrastructure bottleneck to
BPO operations and growth (57%).
• Telecommunications facilities is the second most frequently cited infrastructure
constraint (48%) and 38% expressed dissatisfaction with leased line facilities.
• Electricity is not generally considered an obstacle to growth as a majority of BPOs
(86%) have invested in generators.
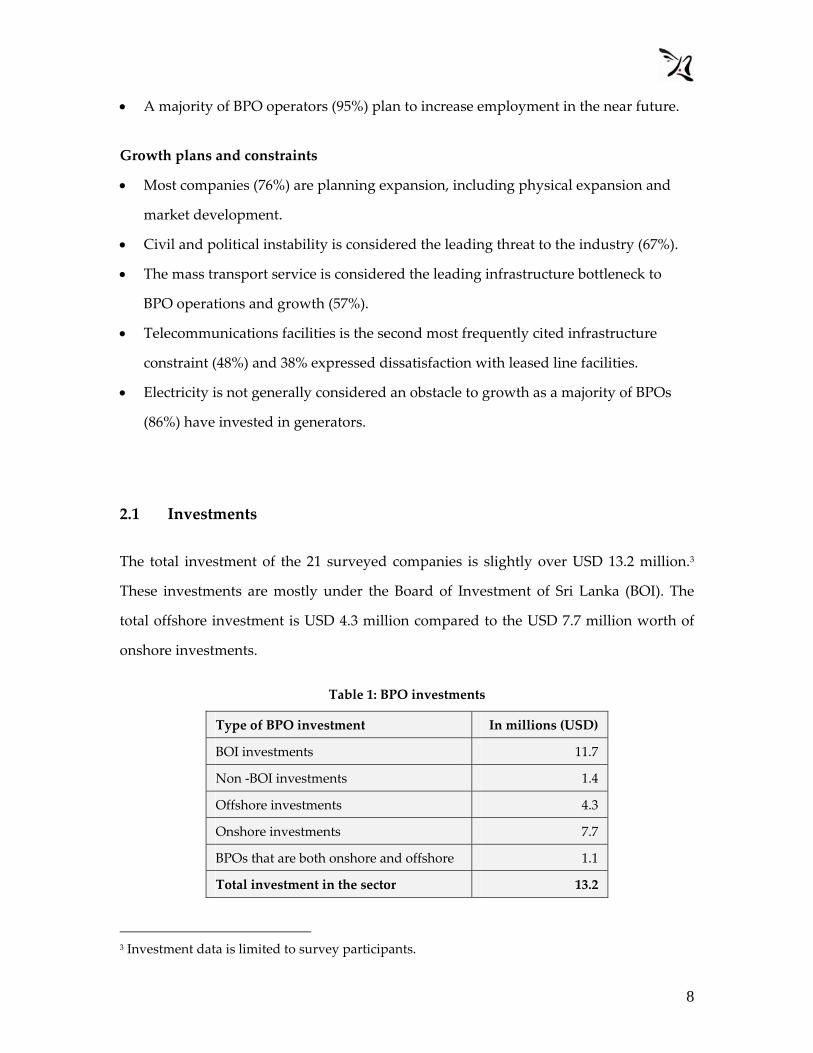
2.1 Investments
The total investment of the 21 surveyed companies is slightly over USD 13.2 million.3
These investments are mostly under the Board of Investment of Sri Lanka (BOI). The
total offshore investment is USD 4.3 million compared to the USD 7.7 million worth of
onshore investments.
Table 1: BPO investments
Type of BPO investment In millions (USD)
BOI investments 11.7
Non ‐BOI investments 1.4
Offshore investments 4.3
Onshore investments 7.7
BPOs that are both onshore and offshore 1.1
Total investment in the sector 13.2
3 Investment data is limited to survey participants.
9
2.2 Service Offerings
Accounting services is the most popular type of work undertaken in Sri Lanka with 43%
of the surveyed companies listing this as one of their main service offerings, followed by
call centre services (19%) and medical insurance processing (14%).
2.3 Labour
The total workforce of the 21 surveyed companies is 3,700 persons.4 Employment is
expected to increase by over 30% during 2006‐2007 due to expansion plans of existing
companies and new entrants.
Over half (56%) the persons engaged in providing BPO services in Sri Lanka are
between the ages of 18‐24 and the growth in employment can be expected primarily in
this age demographic. Fifty one percent of BPO workers have an Advanced Level
certificate as their main qualification. However, 15% of the BPO workforce comprises
graduates and BPO companies cited ‘fresh graduates’ as an industry requirement.
The leading skill requirement in the BPO labour market is for English language skills.
Almost all BPOs (95%), including companies that are engaged in providing services
other than call centre services, considered the ability to communicate in English, the
most important skill requirement for their work.
Although employment prospects are opening up in the BPO sector, the survey findings
indicate that BPOs are experiencing difficulties finding suitable personnel. Nearly half
the BPO employers (43%) expressed dissatisfaction with the supply of skilled personnel
and 38% expressed dissatisfaction with the quality of available persons. However,
4 Including companies that didn’t participate in the survey, anecdotal evidence suggests that overall employment may be slightly over 4,000
10
nearly all BPOs (95%) invest in compulsory and/or non‐compulsory training of
employees to meet skill and quality shortfalls.
2.4 Major obstacles to growth
67%
57%
48%
0%
10%
20%
30%
40%
50%
60%
70%
Civil/politicalinstability
Publictransportation
Telecommunications
Infrastructure and services
% o
f com
pani
es
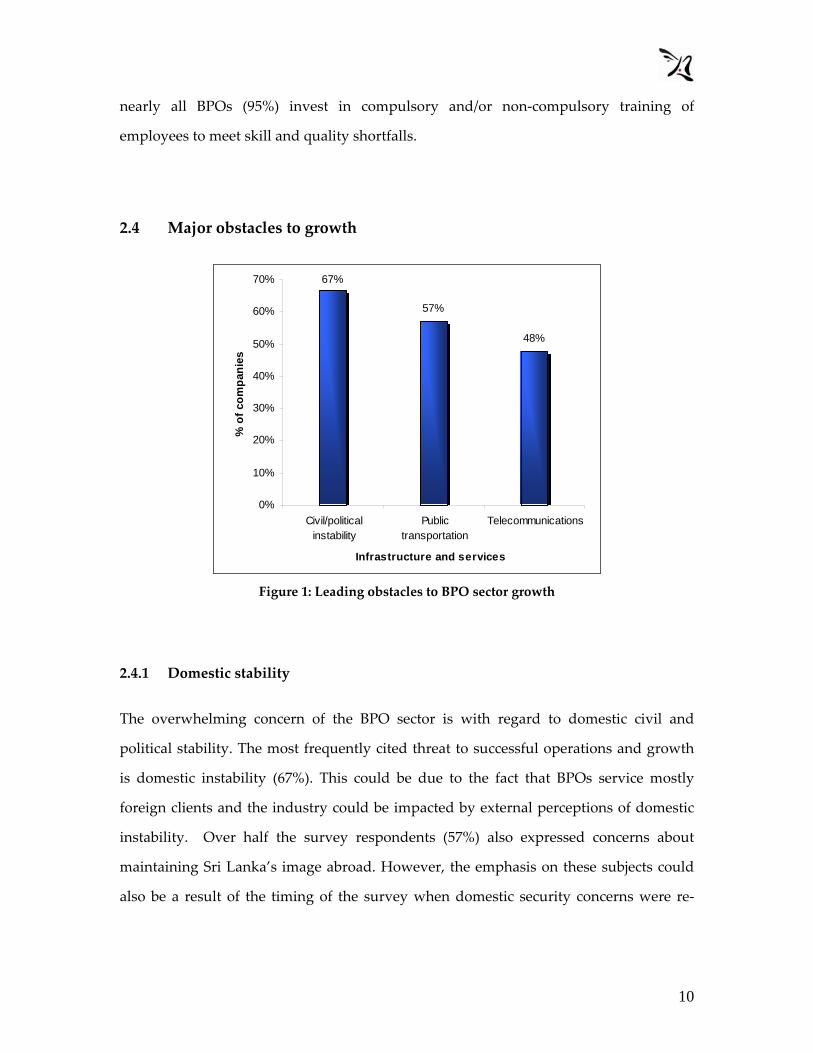
Figure 1: Leading obstacles to BPO sector growth
2.4.1 Domestic stability
The overwhelming concern of the BPO sector is with regard to domestic civil and
political stability. The most frequently cited threat to successful operations and growth
is domestic instability (67%). This could be due to the fact that BPOs service mostly
foreign clients and the industry could be impacted by external perceptions of domestic
instability. Over half the survey respondents (57%) also expressed concerns about
maintaining Sri Lanka’s image abroad. However, the emphasis on these subjects could
also be a result of the timing of the survey when domestic security concerns were re‐
11
emerging strongly and wide international media coverage was focused on the peace
process and ceasefire violations.
2.4.2 Transport
After domestic instability the second most frequently cited industry impediment is Sri
Lanka’s mass transport service. Over half the respondents (57%) considered commuter
services an ‘obstacle’ to routine operations and to growth. Transport infrastructure on
the other hand, is not perceived so unfavourably and only 38% of the companies cited
this as an obstacle.
2.4.3 Telecommunications
Telecommunications services, although an essential component in the provision of IT
enabled BPO services, is perceived as a growth constraint. Nearly half the respondents
(48%) maintained that telecommunications services are an ‘obstacle’ to operations and
growth. This perception could be due to factors related to leased line services, as a
majority of companies (71%) are satisfied with standard telephone services but a
significant number (38%) are not satisfied (i.e. ‘unreliable’) with the quality of leased line
services. Only 29% classified leased line services as reliable.
2.5 Expansion
Despite the various difficulties faced by BPO service providers the sector is set to expand
in the near future, which would lead to growth in employment in the sector and
increased BPO service exports.
12
3.0 An overview of Sri Lanka’s BPO sector
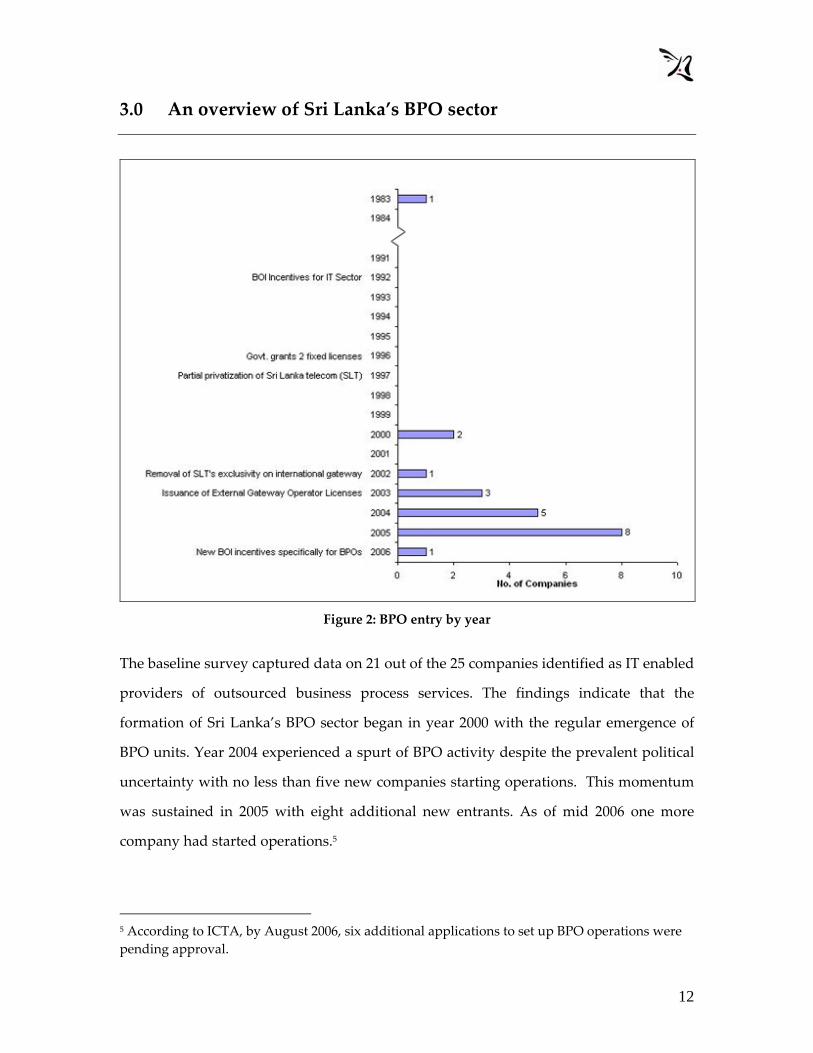
Figure 2: BPO entry by year
The baseline survey captured data on 21 out of the 25 companies identified as IT enabled
providers of outsourced business process services. The findings indicate that the
formation of Sri Lanka’s BPO sector began in year 2000 with the regular emergence of
BPO units. Year 2004 experienced a spurt of BPO activity despite the prevalent political
uncertainty with no less than five new companies starting operations. This momentum
was sustained in 2005 with eight additional new entrants. As of mid 2006 one more
company had started operations.5
5 According to ICTA, by August 2006, six additional applications to set up BPO operations were pending approval.
13
Given the high dependency of BPO establishments on telecommunications
infrastructure, developments in the local telecommunications landscape could have had
a direct bearing on the growth of the BPO sector. Of these recent changes, the most
significant is the ending of Sri Lanka Telecom’s exclusivity on international connectivity
in August 2002 and the subsequent issuance of External Gateway Operator (EGO)
Licenses from March 2003 onwards. A prominent BPO obtaining access to seamless
connectivity through an undersea cable in February 2004 based on these liberalizations
was a significant landmark. It is understood that the bandwidth utilised since then has
grown by many fold6.
In addition to the telecommunications liberalisations, tax incentives introduced in the
early ’90s to pull in IT related investments, may have also had spill over effects on the
BPO sector.
3.1 Sector composition
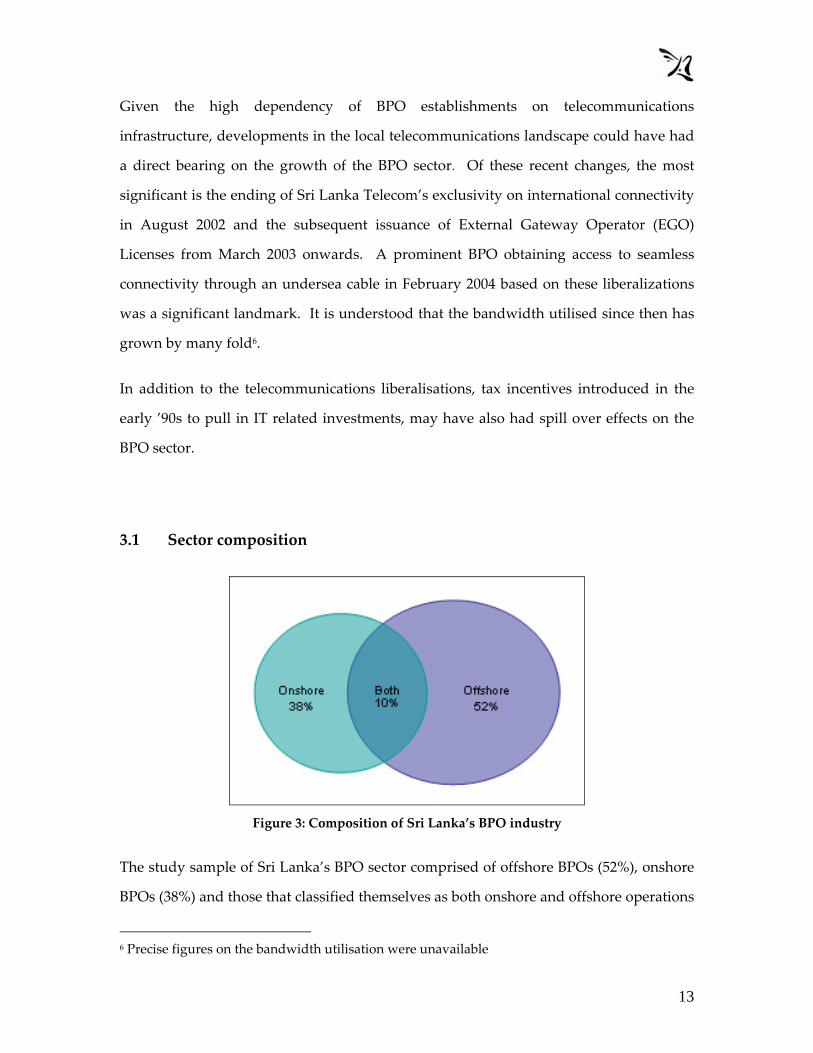
Figure 3: Composition of Sri Lanka’s BPO industry
The study sample of Sri Lanka’s BPO sector comprised of offshore BPOs (52%), onshore
BPOs (38%) and those that classified themselves as both onshore and offshore operations
6 Precise figures on the bandwidth utilisation were unavailable
14
(10%). The largest number of offshore investments is from the US with four BPO units in
Sri Lanka set up by principals in the US.
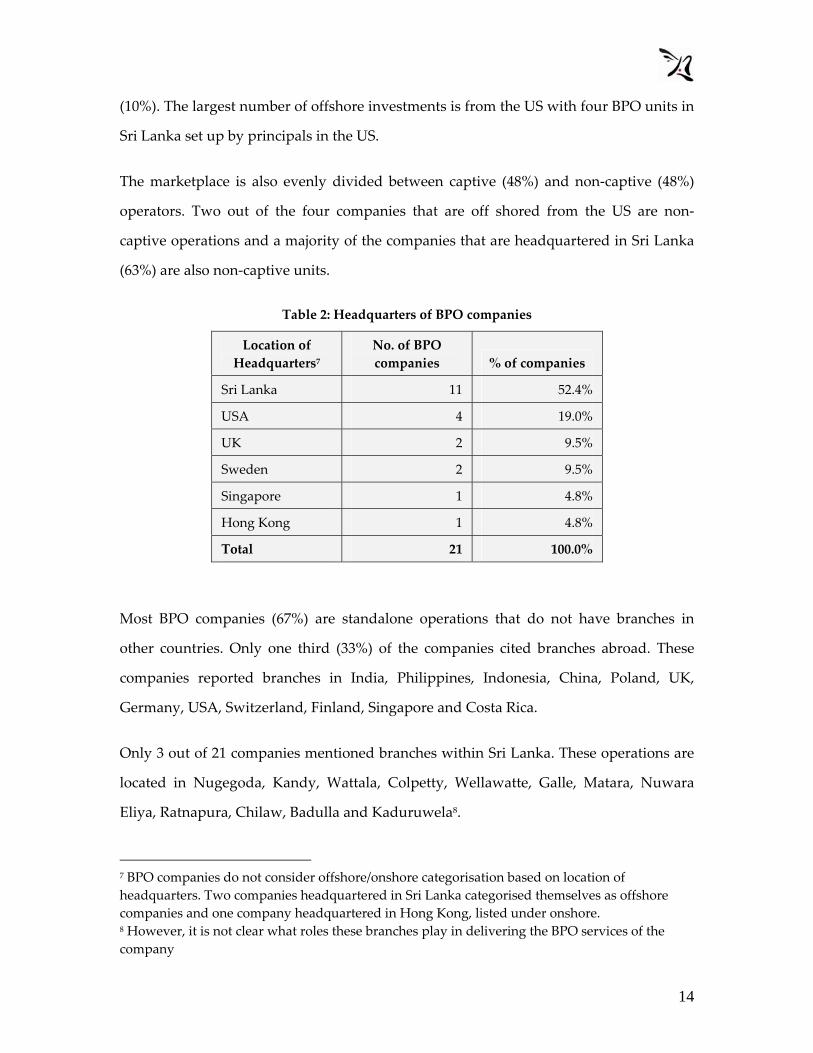
The marketplace is also evenly divided between captive (48%) and non‐captive (48%)
operators. Two out of the four companies that are off shored from the US are non‐
captive operations and a majority of the companies that are headquartered in Sri Lanka
(63%) are also non‐captive units.
Table 2: Headquarters of BPO companies
Location of Headquarters7
No. of BPO companies % of companies
Sri Lanka 11 52.4%
USA 4 19.0%
UK 2 9.5%
Sweden 2 9.5%
Singapore 1 4.8%
Hong Kong 1 4.8%
Total 21 100.0%
Most BPO companies (67%) are standalone operations that do not have branches in
other countries. Only one third (33%) of the companies cited branches abroad. These
companies reported branches in India, Philippines, Indonesia, China, Poland, UK,
Germany, USA, Switzerland, Finland, Singapore and Costa Rica.
Only 3 out of 21 companies mentioned branches within Sri Lanka. These operations are
located in Nugegoda, Kandy, Wattala, Colpetty, Wellawatte, Galle, Matara, Nuwara
Eliya, Ratnapura, Chilaw, Badulla and Kaduruwela8.
7 BPO companies do not consider offshore/onshore categorisation based on location of headquarters. Two companies headquartered in Sri Lanka categorised themselves as offshore companies and one company headquartered in Hong Kong, listed under onshore. 8 However, it is not clear what roles these branches play in delivering the BPO services of the company
15
3.2 Reasons for locating in Sri Lanka
71%67%
48%
38%
29%
10%
0%
10%
20%
30%
40%
50%
60%
70%
80%
Low er labourcost
Low eroperatational
cost
Tax incentives Time / distanceadvantage
Dutyexemption oncapital goods
CulturalSimilarity
Reasons
% o
f com
pani
es
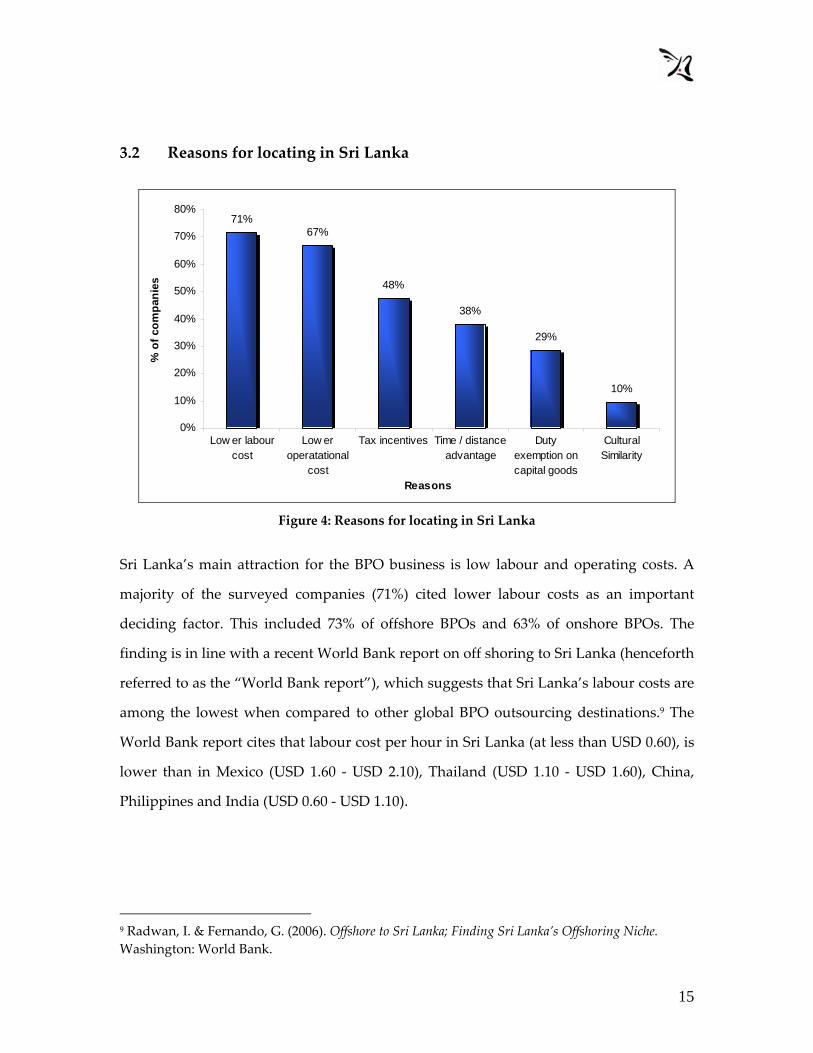
Figure 4: Reasons for locating in Sri Lanka
Sri Lanka’s main attraction for the BPO business is low labour and operating costs. A
majority of the surveyed companies (71%) cited lower labour costs as an important
deciding factor. This included 73% of offshore BPOs and 63% of onshore BPOs. The
finding is in line with a recent World Bank report on off shoring to Sri Lanka (henceforth
referred to as the “World Bank report”), which suggests that Sri Lanka’s labour costs are
among the lowest when compared to other global BPO outsourcing destinations.9 The
World Bank report cites that labour cost per hour in Sri Lanka (at less than USD 0.60), is
lower than in Mexico (USD 1.60 ‐ USD 2.10), Thailand (USD 1.10 ‐ USD 1.60), China,
Philippines and India (USD 0.60 ‐ USD 1.10).
9 Radwan, I. & Fernando, G. (2006). Offshore to Sri Lanka; Finding Sri Lanka’s Offshoring Niche. Washington: World Bank.
16
The second most frequently cited reason for selecting Sri Lanka to set up a BPO unit is
the lower costs of conducting operations. This was mentioned by 67% of the respondents
(73% of offshore BPOs and 50% of onshore BPOs).
Tax incentives is the third most common reason for locating BPOs in Sri Lanka (48%)
indicating that government incentives are successful in attracting BPO investments,
particularly foreign investments. Almost two thirds (64%) of offshore companies cited
tax incentives as important, compared to the 25% of onshore companies.
Over one third of the companies (38%) cited the time/distance advantage due to Sri
Lanka’s geographic situation as a deciding factor. This is of importance mainly to
offshore operators. Over half (55%) the offshore companies cited time and distance as a
deciding factor compared to only 13% of onshore companies.
A little over one fourth (29%) of the companies cited duty exemptions on capital goods
(another government incentive), as significant when deciding to locate a BPO operation
in Sri Lanka. This included 27% of offshore companies and 25% of onshore companies.
Most BPO operators (90%) did not think cultural similarity is a significant factor.
3.3 BPO investments in Sri Lanka
Investment flows into Sri Lanka’s BPO sector is relatively regular since year‐2000. The
inflow is in all three forms: foreign investments, local investments and joint ventures.
Foreign investments in joint ventures ranged from 30% to 95%. Most BPO investments
(86%) are under the Board of Investment of Sri Lanka.
The total investment value of the surveyed companies established during 2000 to 2006 is
about USD 13.2 million. The value of individual BPO investments ranged from USD
15,000 to USD 3.5 million. The survey results also indicate that investments by offshore
BPOs (USD 4.3 million) are lower than onshore investments (USD 7.7 million). This
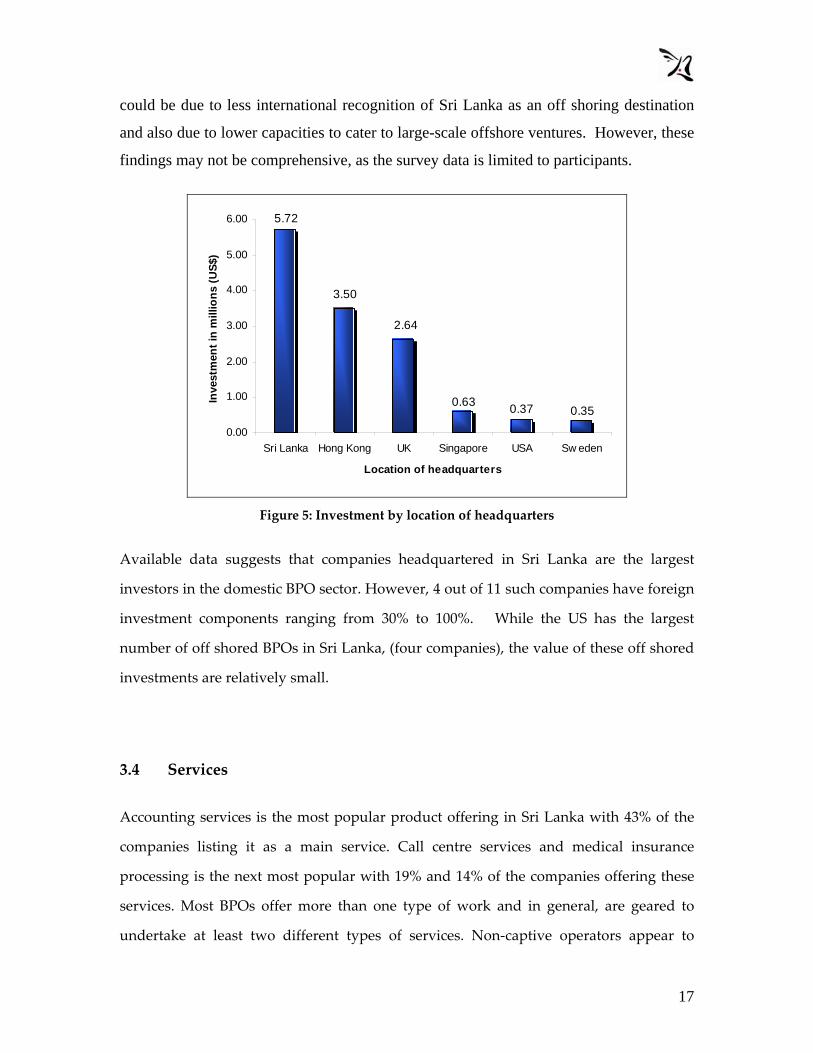
17
could be due to less international recognition of Sri Lanka as an off shoring destination
and also due to lower capacities to cater to large-scale offshore ventures. However, these
findings may not be comprehensive, as the survey data is limited to participants.
0.350.370.63
2.64
3.50
5.72
0.00
1.00
2.00
3.00
4.00
5.00
6.00
Sri Lanka Hong Kong UK Singapore USA Sw eden
Location of headquarters
Inve
stm
ent i
n m
illio
ns (U
S$)
Figure 5: Investment by location of headquarters
Available data suggests that companies headquartered in Sri Lanka are the largest
investors in the domestic BPO sector. However, 4 out of 11 such companies have foreign
investment components ranging from 30% to 100%. While the US has the largest
number of off shored BPOs in Sri Lanka, (four companies), the value of these off shored
investments are relatively small.
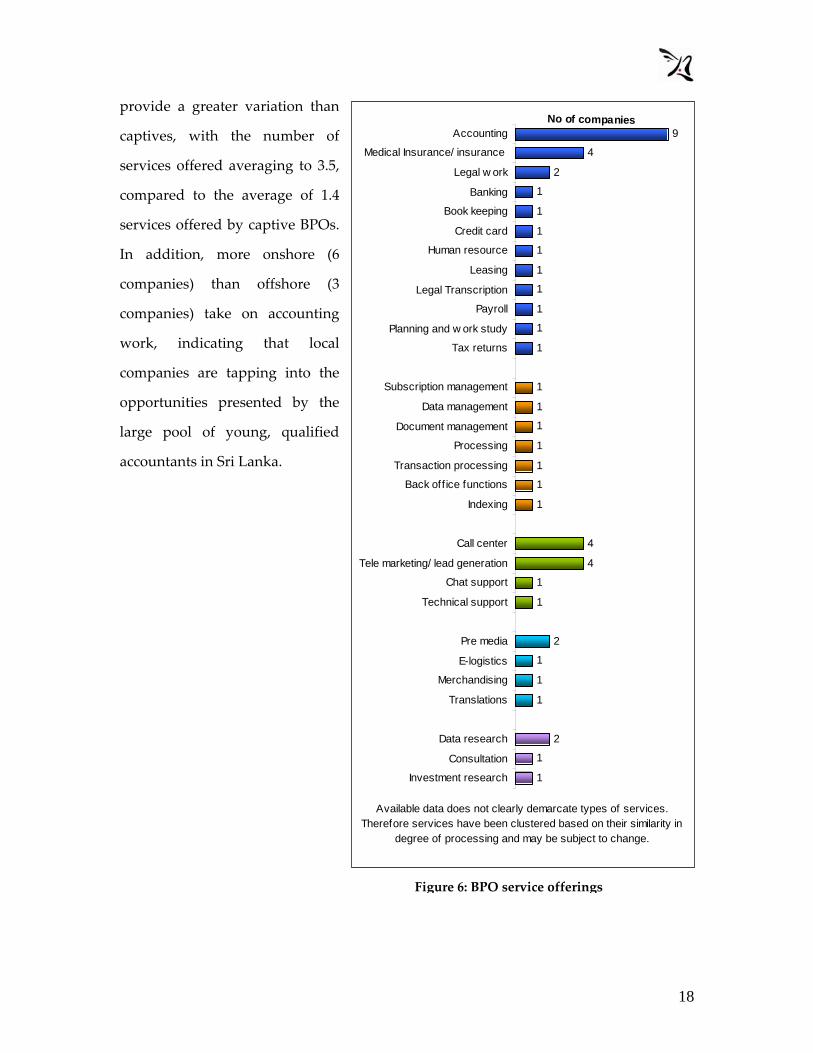
3.4 Services
Accounting services is the most popular product offering in Sri Lanka with 43% of the
companies listing it as a main service. Call centre services and medical insurance
processing is the next most popular with 19% and 14% of the companies offering these
services. Most BPOs offer more than one type of work and in general, are geared to
undertake at least two different types of services. Non‐captive operators appear to
18
provide a greater variation than
captives, with the number of
services offered averaging to 3.5,
compared to the average of 1.4
services offered by captive BPOs.
In addition, more onshore (6
companies) than offshore (3
companies) take on accounting
work, indicating that local
companies are tapping into the
opportunities presented by the
large pool of young, qualified
accountants in Sri Lanka.
Figure 6: BPO service offerings
9
4
2
1
1
1
1
1
1
1
1
1
1
1
1
1
1
1
1
4
4
1
1
2
1
1
1
2
1
1
Accounting
Medical Insurance/ insurance
Legal w ork
Banking
Book keeping
Credit card
Human resource
Leasing
Legal Transcription
Payroll
Planning and w ork study
Tax returns
Subscription management
Data management
Document management
Processing
Transaction processing
Back off ice functions
Indexing
Call center
Tele marketing/ lead generation
Chat support
Technical support
Pre media
E-logistics
Merchandising
Translations
Data research
Consultation
Investment research
No of companies
Available data does not clearly demarcate types of services. Therefore services have been clustered based on their similarity in
degree of processing and may be subject to change.
19
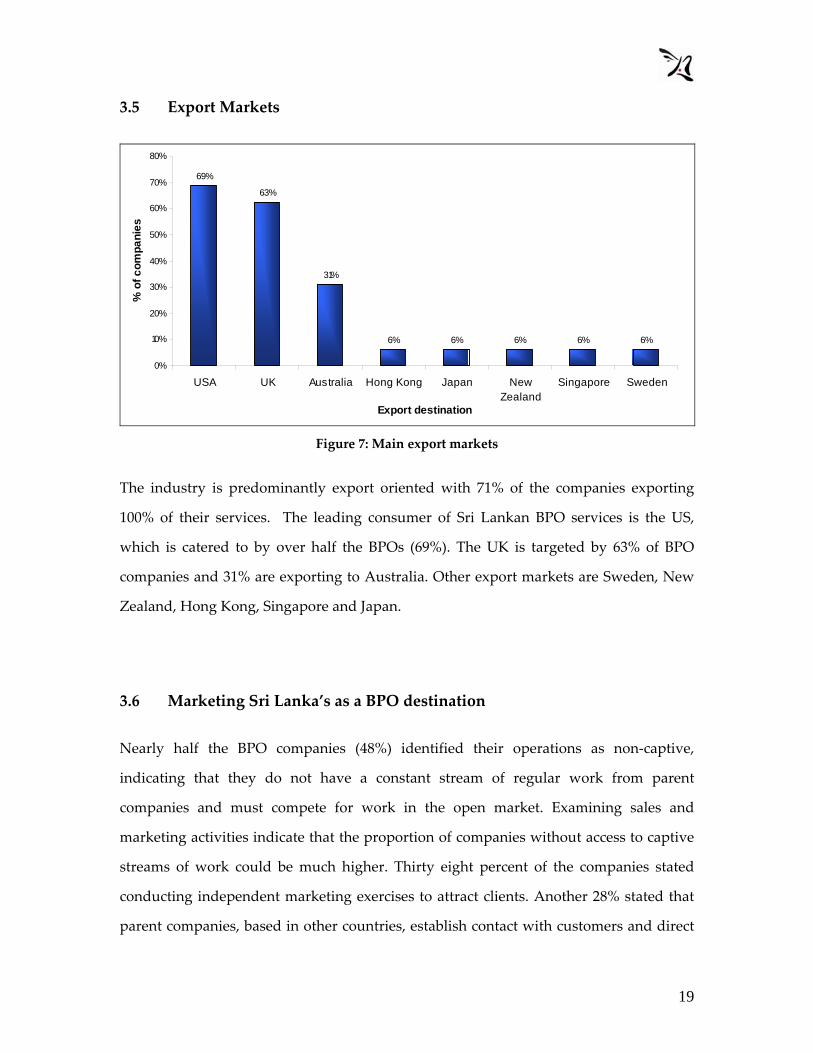
3.5 Export Markets
69%
63%
31%
6% 6% 6% 6% 6%
0%
10%
20%
30%
40%
50%
60%
70%
80%
USA UK Australia Hong Kong Japan NewZealand
Singapore Sweden
Export destination
% o
f com
pani
es
Figure 7: Main export markets
The industry is predominantly export oriented with 71% of the companies exporting
100% of their services. The leading consumer of Sri Lankan BPO services is the US,
which is catered to by over half the BPOs (69%). The UK is targeted by 63% of BPO
companies and 31% are exporting to Australia. Other export markets are Sweden, New
Zealand, Hong Kong, Singapore and Japan.
3.6 Marketing Sri Lanka’s as a BPO destination
Nearly half the BPO companies (48%) identified their operations as non‐captive,
indicating that they do not have a constant stream of regular work from parent
companies and must compete for work in the open market. Examining sales and
marketing activities indicate that the proportion of companies without access to captive
streams of work could be much higher. Thirty eight percent of the companies stated
conducting independent marketing exercises to attract clients. Another 28% stated that
parent companies, based in other countries, establish contact with customers and direct

20
outsourced work into Sri Lanka. In both cases, work does not stem from a single source
and must be obtained on a competitive basis. Only 28% of the companies said they
receive fixed volumes of work from either a client, a joint venture partner or a sub‐
contractor.
The above situation could explain the high degree of concern evinced by BPOs on
maintaining Sri Lanka’s image internationally and the emphasis on domestic civil and
political stability. Given that outsourced work must be attracted into Sri Lanka BPOs
may be concerned that external perceptions of domestic instability could reduce inflows
of outsourced work. A majority of companies, 67%, identified civil and political
instability as the leading threat to the industry while 57% expressed dissatisfaction with
government efficiency at maintaining Sri Lanka’s image abroad.
3.7 BPO operating costs
Labour44%
Other26%
Telecom22%
Electricity8%
Figure 8: Operating costs of BPOs.
The total operating costs for a BPO unit averages to around LKR 4.9 million per month
(approximately USD 48,000). Due to the high labour intensive nature of BPO services,
21
labour costs account for the largest share of overheads averaging to about 44% of total
operating costs. On average, labour costs at an offshore BPO unit is about 51% of total
costs as compared to 35% at an onshore BPO.
Training and development, on average, account for about 8% of the total operating
expenditure of a BPO. The survey findings also indicate that offshore BPOs spend more
on training and labour than onshore units. This could be due to the fact that both
average employment numbers as well as average salaries are higher at offshore BPOs
than onshore BPOs.10 However, the price of labour is not considered a cause for concern
by most BPO establishments and only 14% of the companies cited labour costs as a
potential industry constraint.
After human resources, the second highest expense faced by a BPO is for
telecommunications, with costs averaging to around 22% of total monthly costs. The
electricity expense is a much lower 8% of operating costs on average.
In terms of office space, the World Bank report found that rents in Colombo on average,
are lower than in other major Asian cities.11 The average monthly cost per square metre
is estimated at around USD 11.60 in Colombo compared to USD 15.45 to USD 26.15 in
New Delhi while the price of office space in Shanghai, is nearly three times the cost in
Colombo.
10 Refer to Section 5.2 and Section 5.4 which respectively analyses employment and salary characteristics of the BPO industry. 11 Ibid 9
22
4%6%
18%
45%
12%10%
26%
49%
2%5%
15%
NA*0
10
20
30
40
50
60
Avg. labourcost
Avg. telcomcost
Avg.electrcity
cost
Avg. trainingcost
Type of cost
% o
f ope
ratin
g co
st
Captive BPOs
Non-captive BPOs
Neither*
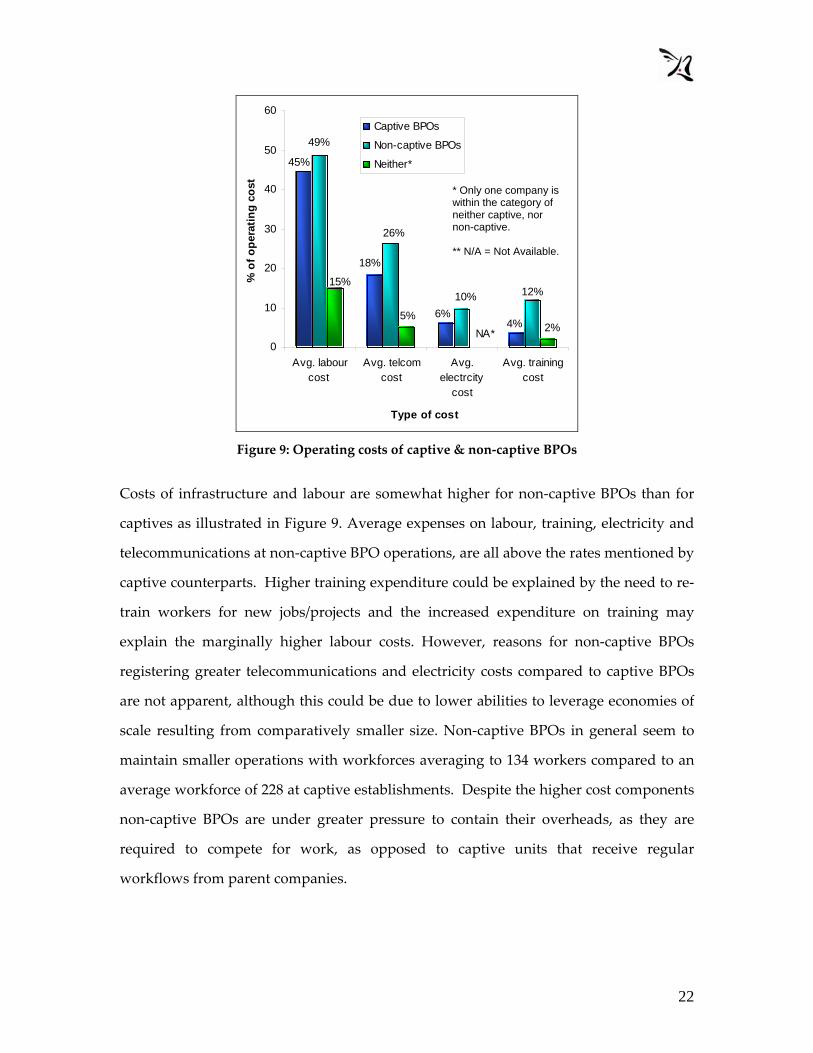
Figure 9: Operating costs of captive & non‐captive BPOs
Costs of infrastructure and labour are somewhat higher for non‐captive BPOs than for
captives as illustrated in Figure 9. Average expenses on labour, training, electricity and
telecommunications at non‐captive BPO operations, are all above the rates mentioned by
captive counterparts. Higher training expenditure could be explained by the need to re‐
train workers for new jobs/projects and the increased expenditure on training may
explain the marginally higher labour costs. However, reasons for non‐captive BPOs
registering greater telecommunications and electricity costs compared to captive BPOs
are not apparent, although this could be due to lower abilities to leverage economies of
scale resulting from comparatively smaller size. Non‐captive BPOs in general seem to
maintain smaller operations with workforces averaging to 134 workers compared to an
average workforce of 228 at captive establishments. Despite the higher cost components
non‐captive BPOs are under greater pressure to contain their overheads, as they are
required to compete for work, as opposed to captive units that receive regular
workflows from parent companies.
* Only one company is within the category of neither captive, nor non-captive. ** N/A = Not Available.

23
4.0 Impacts of domestic infrastructure on the BPO sector
Transport, telecommunications and electricity are the three facilities primarily examined
through the baseline study to gain an understanding of the infrastructure support
systems available for BPO activities in Sri Lanka. Transport infrastructure and mass
transport services were examined mainly due to impacts on labour mobility, given that
many BPOs operate during unconventional working hours to provide real time services
to different time zones. Reliable and cost‐effective telecommunications and electricity
services on the other hand, are prerequisites for operational efficiency of BPOs.
48%
24%
38%
57%
38%33%
38%
24%24%19%
29%29%
0%
10%
20%
30%
40%
50%
60%
Telecommunications Electricity TransportationInfrastructure
Public transportationServices
Type of infrastructure
% o
f com
pani
es
Obstacle
Neutral
Not an obstacle
Figure 10: Impacts of domestic infrastructure on the BPO sector
4.1 Transport
BPO companies consider mass transport services as the greatest infrastructure related
bottleneck to BPO activities. As is seen by figure 10 above, 57% of the companies cited
mass transportation services as an obstacle to operations. Furthermore 71% of the
companies are also dissatisfied with the delivery efficiency of transport services,
classifying the service as ‘highly inefficient’ or ‘inefficient’. However, transportation
infrastructure itself is not considered as severe an industry constraint as transport
services and only 38% of the companies cited transport infrastructure as an obstacle to
24
operations. This maybe partly explained by the fact that many BPOs operate during
non‐traditional work hours, thus escaping the traffic and road congestion that exist
during peak hours of normal working days.
Most BPO service providers (61%) work in shifts and an even larger proportion (81%),
provide transport for employees. However, transport facilities provided by BPO
companies to employees is mainly one‐way transport during non‐traditional work times
or when employees are required to work late after normal work hours. Out of the
companies that provide transport, 83% mentioned that employees are transported ‘from
office when they work late’ and 11% stated that transport is provided for employees
when ‘they have to come early to work’. A few companies (6%) provide transport
facilities when public transport is not available.
4.2 Telecommunications
On an average, BPOs spend about 22% of their operational costs on telecommunication
services. Among essential infrastructure facilities, telecommunications is the second
most frequently cited obstacle to growth and operations. Nearly half the companies
(48%), cited telecommunications as an ‘obstacle’ to operations and growth.
The use of telecommunications in the BPO sector ranges from common amenities such
as telephone, email and Internet, to VOIP and other types of facilities. Over a third of the
companies (38%) are using VOIP and another 9% use other unspecified services.
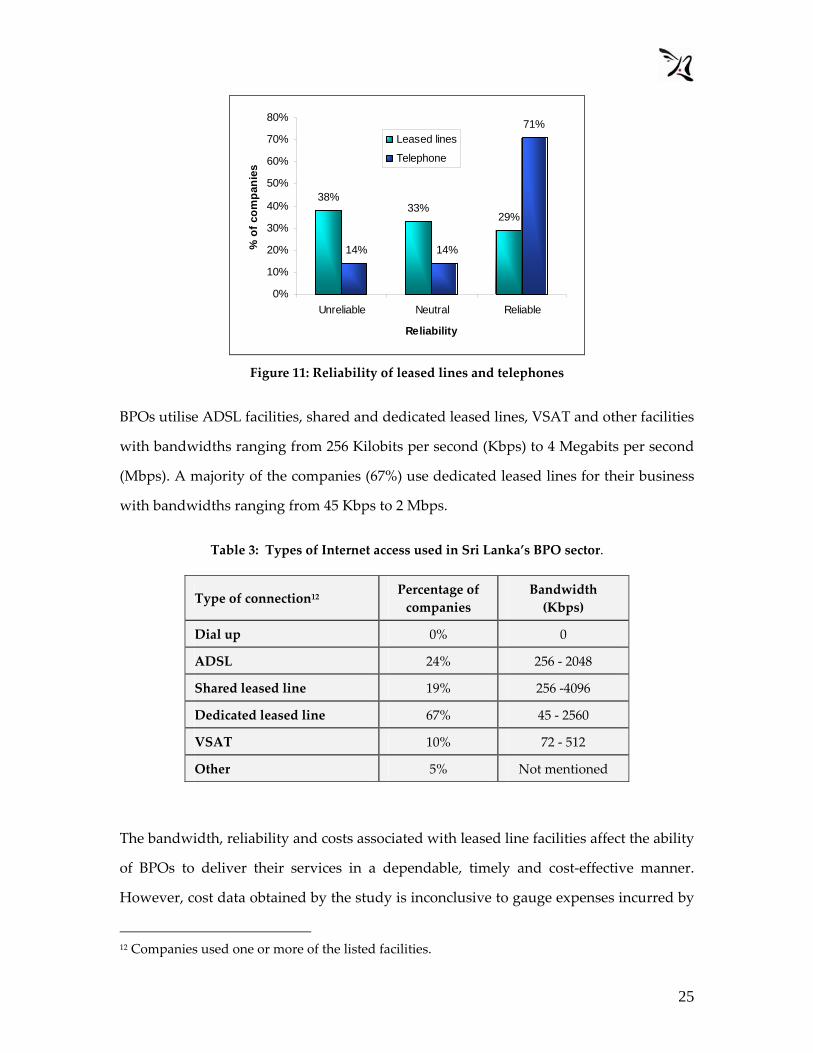
A majority of BPO service providers (71%) are satisfied with the reliability of telephone
services in Sri Lanka rating them as ‘very reliable’ or ‘reliable’. However, BPO
companies are less satisfied with the quality of leased lines. Only 29% felt that leased
line connections were dependable and 38% classified them as ‘unreliable’ although IT
enabled outsourcing service providers are heavily dependent on leased lines to deliver
their services.
25
38%33%
29%
71%
14%14%
0%
10%
20%
30%
40%
50%
60%
70%
80%
Unreliable Neutral Reliable
Reliability
% o
f com
pani
es
Leased lines
Telephone
Figure 11: Reliability of leased lines and telephones
BPOs utilise ADSL facilities, shared and dedicated leased lines, VSAT and other facilities
with bandwidths ranging from 256 Kilobits per second (Kbps) to 4 Megabits per second
(Mbps). A majority of the companies (67%) use dedicated leased lines for their business
with bandwidths ranging from 45 Kbps to 2 Mbps.
Table 3: Types of Internet access used in Sri Lanka’s BPO sector.
Type of connection12 Percentage of companies
Bandwidth (Kbps)
Dial up 0% 0
ADSL 24% 256 ‐ 2048
Shared leased line 19% 256 ‐4096
Dedicated leased line 67% 45 ‐ 2560
VSAT 10% 72 ‐ 512
Other 5% Not mentioned
The bandwidth, reliability and costs associated with leased line facilities affect the ability
of BPOs to deliver their services in a dependable, timely and cost‐effective manner.
However, cost data obtained by the study is inconclusive to gauge expenses incurred by
12 Companies used one or more of the listed facilities.
26
BPO operators on leased line facilities. An independent study on regional domestic
leased line costs on the other hand, suggests that costs in Sri Lanka are considerably
higher compared to other countries of the region like India and Pakistan.13 Sri Lanka’s
Domestic Private Leased Circuit (DPLC) prices for 2 Mbit/s is around USD 6,518 for a 2
km distance and around USD 7,901 for a 100 km distance.14 Comparative DPLC costs in
India are USD 376 and USD 3,899 and in Pakistan the prices are USD 1,598 and USD
6,948.
The high costs and low penetration of leased line services could adversely impact
expansion of BPO activity. Given that leased line penetration is low outside of the
greater Colombo area, BPO businesses are restricted in their ability to expand service
centres outside Colombo and thus leverage potentially lower labour costs. Only two of
the surveyed companies reported branches outside the greater Colombo area. One of the
companies reported branches in Kandy while the other reported branches in Kandy,
Galle, Matara, Nuwara Eliya, Ratnapura, Chilaw, Badulla and Kaduruwela.15
13 The leased line costs incurred by a company is related to costs associated with the international portion of the leased line (i.e. an International Private Leased Circuit which connects the foreign client or branch to the landing station of the IPLC in Sri Lanka) plus the domestic portion of the leased line (i.e. DPLC which connects the company to the landing station for the IPLC). IPLC costs for Sri Lanka were unavailable. 14 Lokanathan, S. (2005). A Preliminary Methodology for the Comparative Analysis of Domestic Leased Lines Tariffs in the South Asian region. Available at http://www.lirneasia.net/2005/08/comparative‐analysis‐of‐leased‐line‐tariffs/ 15 As noted earlier, it is not clear what roles these branches play in delivering the BPO services of the company
27
4.3 Electricity
Electricity costs as compared to telecommunications and labour costs represent a smaller
share of operating expenditure (8%) and most BPOs do not consider electricity an
obstacle to daily operations and future growth. Only 24% of the surveyed companies
viewed electricity as an obstacle to sector growth. There were also no reports of frequent
power outages as most BPO companies (86%) have invested in generators. This could
explain why 48% of the companies considered electricity supply dependable, classifying
it as either ‘reliable’ or ‘very reliable’
However, a comparable number of BPO operators (48%) expressed dissatisfaction with
electricity prices. Sri Lanka’s electricity tariffs at nearly USD 0.08 per kilowatt‐hour are
noted as among the highest in the world for business operations due to cross
subsidisation of domestic consumers.16 Businesses in Sri Lanka pay more for electricity
than companies located in many East Asian countries and companies in the US.
Indonesia, India and the US charge electricity rates below USD 0.06 per kilowatt‐hour
while electricity tariffs are below USD 0.07 in Thailand.17
4.4 Losses due to infrastructure failure
Nearly half the surveyed companies (48%) have not experienced losses due to
infrastructure failure. Only four companies (19%) reported losses ranging from LKR
120,000 to LKR 1 million per year. However, 33% percent of surveyed companies did
not respond to the question. It is not clear whether the damages reported by some of the
surveyed companies are due to electricity or telecommunications failures but the low
frequency of reporting such incidents and the investments in back up systems suggest that
companies rarely experience large-scale losses due to infrastructure failure.
16 Ibid 9 17 Ibid 9
28
5.0 BPO sector management and workers
Sri Lanka’s BPO sector only recently acquired critical mass to gain recognition as an
export oriented service distinct from the island’s IT and software export industries. As
such, the sector is much smaller in size and the total workforce of the 21 companies that
participated in the survey amounted to 3,700. Inclusive of those few companies that did
not participate in the survey, the total BPO workforce is currently estimated to be
slightly over 4,000. However, the sector is expanding, offering new opportunities for
young Sri Lankans.
5.1 BPO top management
The survey found that 43% of the top managers have no prior experience in the BPO
business. However, 57% of top managers reported previous work experience in BPO,
either in a domestic company or in a foreign firm. Out of these experienced company
heads, 42% reported experience of 10 years and above while the balance reported two to
six years of prior experience in the BPO business. Half the company heads (50%) with
prior BPO work experience reported working with foreign BPO firms from two to 10
years.
Slightly over half (52%) of the top managers have a post‐graduate qualification, while
19% have either professional qualifications or undergraduate degrees.
5.2 Sector employment
Employment in BPO companies ranges from as small a number as three persons, up to
1,700 persons. Half the companies employ less than or equal to 62 workers (the median).
Twenty‐five percent maintain less than 25 employees and 25 percent have at least 120
29
employees. The large deviation is a result of the much higher employment numbers
reported by the two largest employers.
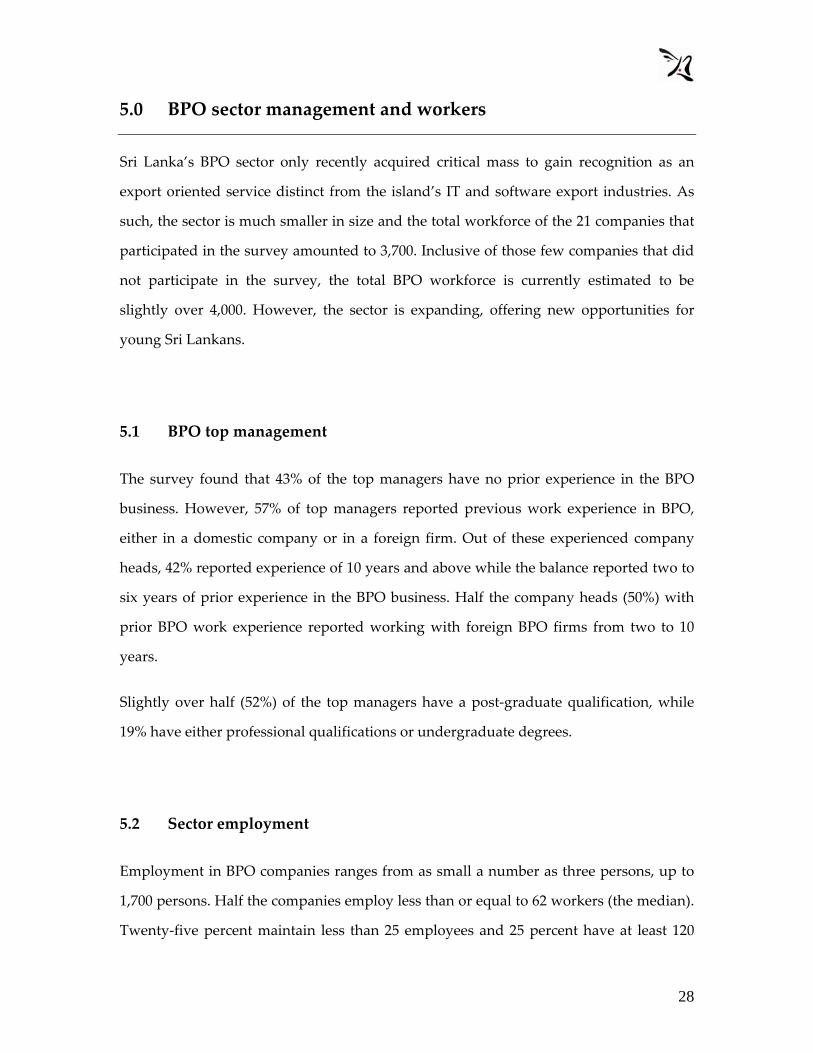
Employment also varies according to the type of BPO operation. Employment is higher
amongst offshore operations than among onshore BPOs. The average workforce at
offshore BPOs is about 265 employees while average workforce is about 78 persons at
onshore units and at BPOs that are both onshore and offshore operations. In addition,
captive BPOs displayed higher average employment numbers (228) than non‐captive
operations (134).
307
110
215
37
7875
0
50
100
150
200
250
300
350
Offshore Onshore Both offshore & onshore
Type of BPO
Avg
. Em
ploy
men
t
Captive
Non-captive
Neither
Figure 12: Average employment in BPOs
The BPO sector is not unionised and 95% of the managers did not think trade union
formation in the sector is likely. Despite a relative young workforce, part time work is
still extremely rare in the sector. Most of the companies (90%) stated that all their
employees work full time and only 10% reported having a few part time employees.
30
5.3 Workforce characteristics
The following analysis excludes employment data from the largest BPO employer, as
this company is an outlier in terms of the overall sector numbers (and represents nearly
half the total number of employees in the sector). Inclusion of their data would have
significantly skewed the results of the analysis. Therefore, an analysis of this largest
employer is presented separately.
59%
8%
30%
3% 18-24 years25-35 years 36-45 years45+ years
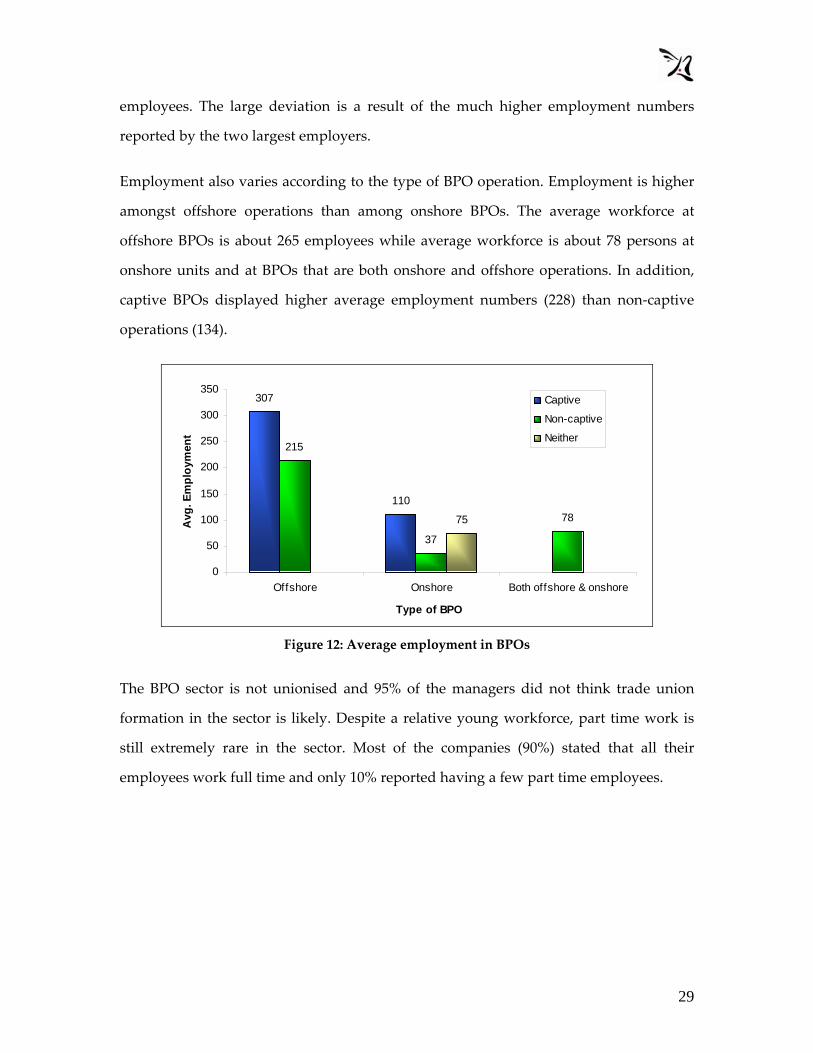
Figure 13: Age distribution amongst BPO workers
Excluding the largest surveyed BPO, the average workforce per company is about 100.
The employees are predominantly young with 59% of all employees in the 18‐24 age
group and another 30% in the 25‐35 age bracket. The average age of a BPO employee is
around 25 years.
Post grads2%
Professional qualif . holders
13%
Other3%
O/L holders7%
A/L holders51%
Diploma holders
9%
Graduates15%
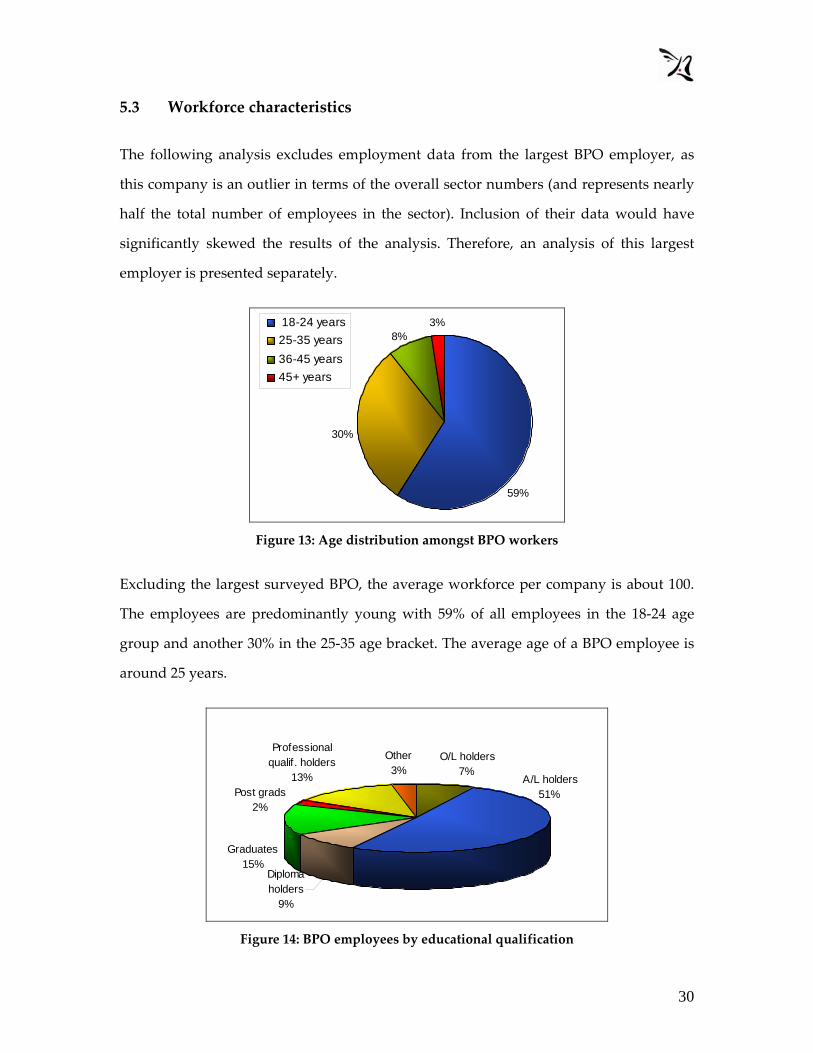
Figure 14: BPO employees by educational qualification
31
Half the BPO employees (51%) have the GCE Advanced Level as their highest
qualification, 15% are graduates, 9% are diploma holders and about 7% have an
Ordinary Level qualification. Despite the trend towards a large intake of Advanced
Level holders BPO companies cited ‘fresh graduates’ as an industry requirement.
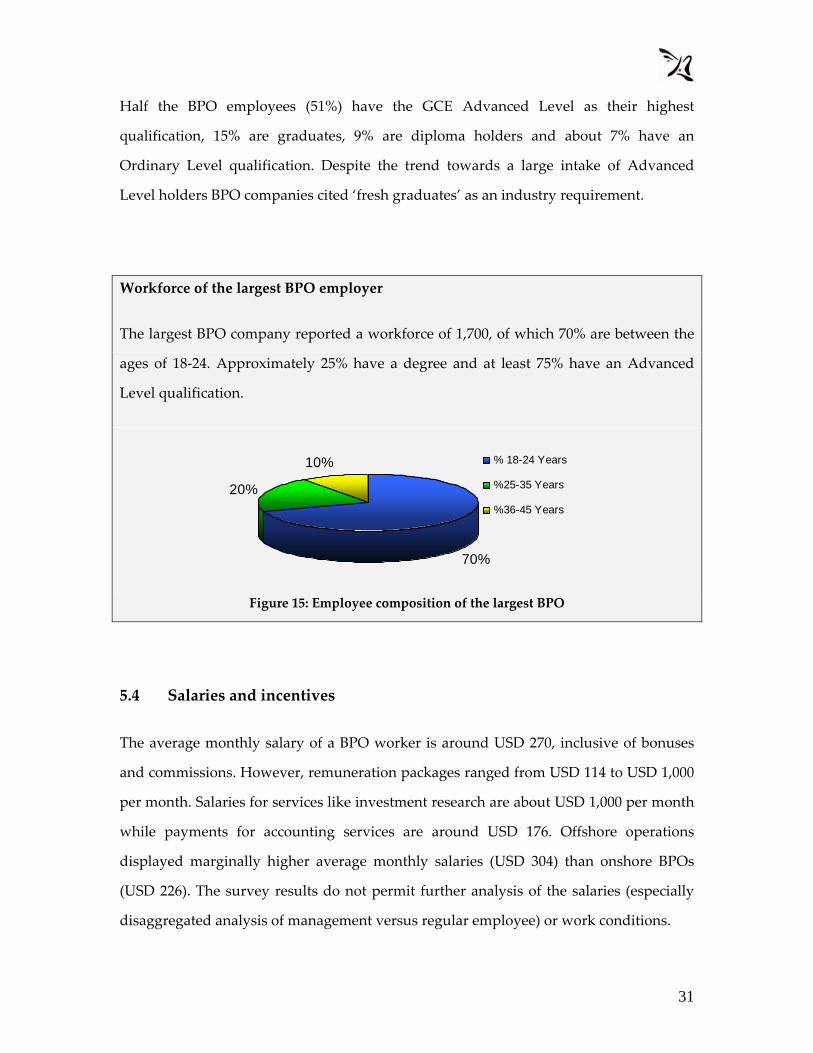
Workforce of the largest BPO employer
The largest BPO company reported a workforce of 1,700, of which 70% are between the
ages of 18‐24. Approximately 25% have a degree and at least 75% have an Advanced
Level qualification.
70%
20%
10% % 18-24 Years
%25-35 Years
%36-45 Years
Figure 15: Employee composition of the largest BPO
5.4 Salaries and incentives
The average monthly salary of a BPO worker is around USD 270, inclusive of bonuses
and commissions. However, remuneration packages ranged from USD 114 to USD 1,000
per month. Salaries for services like investment research are about USD 1,000 per month
while payments for accounting services are around USD 176. Offshore operations
displayed marginally higher average monthly salaries (USD 304) than onshore BPOs
(USD 226). The survey results do not permit further analysis of the salaries (especially
disaggregated analysis of management versus regular employee) or work conditions.
32
The surveyed companies reported a range of employee incentives from project based
salary add‐ons to seasonal incentives. Non‐financial incentives are for the most part
provided in the form of transport and food during non‐traditional hours of work, and
medical insurance coverage. Most BPOs (61%), work in shifts and 81% provide transport
for employees, mostly during night and early morning shifts. Many companies 76%
provide medical and/or other types of insurance for workers. Roughly 30% provide food
and beverage at work, possibly for those on duty during the night shifts and a few
(19%), have welfare and worker compensation provisions. Very few (5%) reported
providing internal loan facilities for employees.
Companies also listed conveniences like club membership, professional subscriptions,
overseas trips and cars but most likely some of these incentives (e.g. cars) are geared
towards management.
Most BPOs do not consider labour costs in Sri Lanka as a problem that would affect
future growth prospects or current operations. Nearly half the companies (43%) claimed
that the cost of labour is not an obstacle to company growth and another 43% were
neutral. Only 14% of the companies felt labour costs were a concern.
33
5.5 Employee turnover and recruitment
5.5.1 Turnover
5%
1%
6%
2%
10%
4%
0
2
4
6
8
10
12
Captive BPOs Noncaptive BPOs
Type of BPO
Ave
rage
turn
over
3 month turnover
6 month turnover
1 year turnover
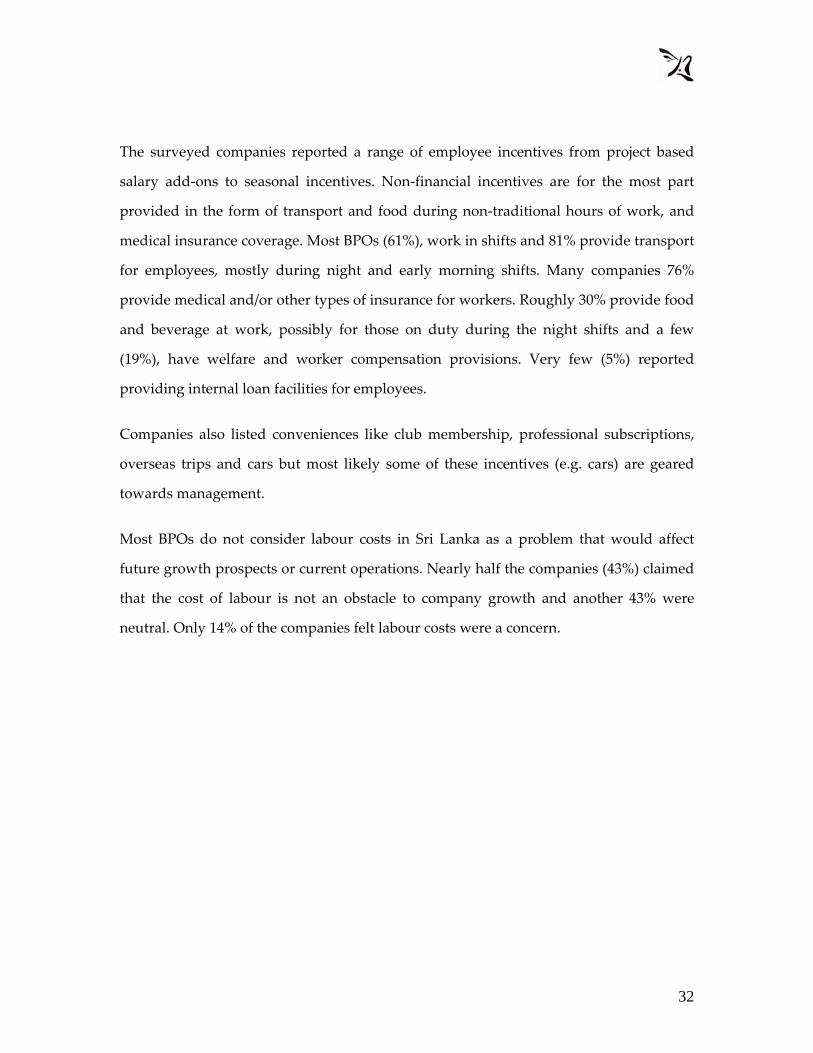
Figure 16: Turnover in 3, 6 and 12 months
The average employee turnover for the industry is 6% per year. The average turnovers
for six and three months are 4% and 3% respectively. However, turnovers show wide
variation, with some companies reporting employee high turnovers while some
reporting zero turnovers. Average turnover at captive BPOs is lower than at non‐captive
BPOs. The average non‐captive turnover could be a result of the project/contract based
nature of the operations rather than due to attrition (i.e. employees quitting and/or being
fired). However, available data does not allow specific conclusions.
5.5.2 Recruitment
BPOs compete for talent in the labour pool through most of the regular recruitment
channels. The most popular method of hiring employees is conventional advertisements
in newspapers with 71% of the companies utilising this method. Although Internet
usage in Sri Lanka is increasing, only 5% of the companies claimed to use this medium
to recruit new employees. Informal channels, such as ‘head‐hunting’ and the ‘grapevine’

34
are more popular than Internet usage. Almost half the companies (48%) reported using
references and a further 19% reported using ‘word of mouth’ in their recruitment
activities.
71%
48%
19%
5%
0%
10%
20%
30%
40%
50%
60%
70%
80%
Advertisements References Word of mouth Through the w eb
Recruitment methods
% o
f com
pani
es
Figure 17: BPO recruitment methods
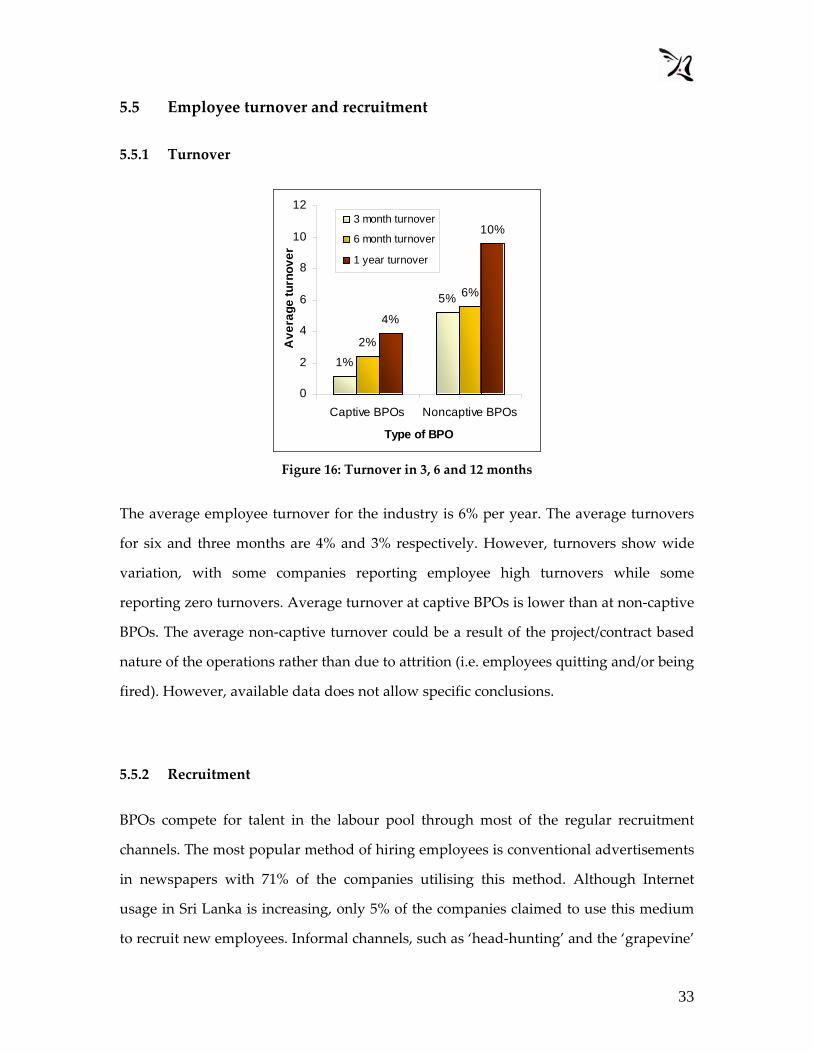
5.6 Skills in demand
In recruiting potential employees, BPOs look for both domain skills in their offered
service areas as well as personality attributes. The primary set of domain skills in
demand is language and communication skills (57%), accounting knowledge (19%) and
technical knowledge (5%). English and computer literacy are in demand across the
board. Almost all the managers participating in the survey (95%) considered the ability
to speak in English an important requirement for BPO work. English writing is
considered important by about 66% of the companies. Speaking and writing skills in
Sinhala and Tamil is considered ‘not important’ by a majority (over 60%) of BPO
managers which is not surprising as the sector is primarily export oriented. Personality
attributes like attitude, professionalism, discipline and motivation are also considered
primary skills.
35
19%
5%
57%
19%
Accountingknow ledgeTechnical know ledge
Language/ speech/communi.Other
Figure 18: No 1 set of skills demanded by BPOs
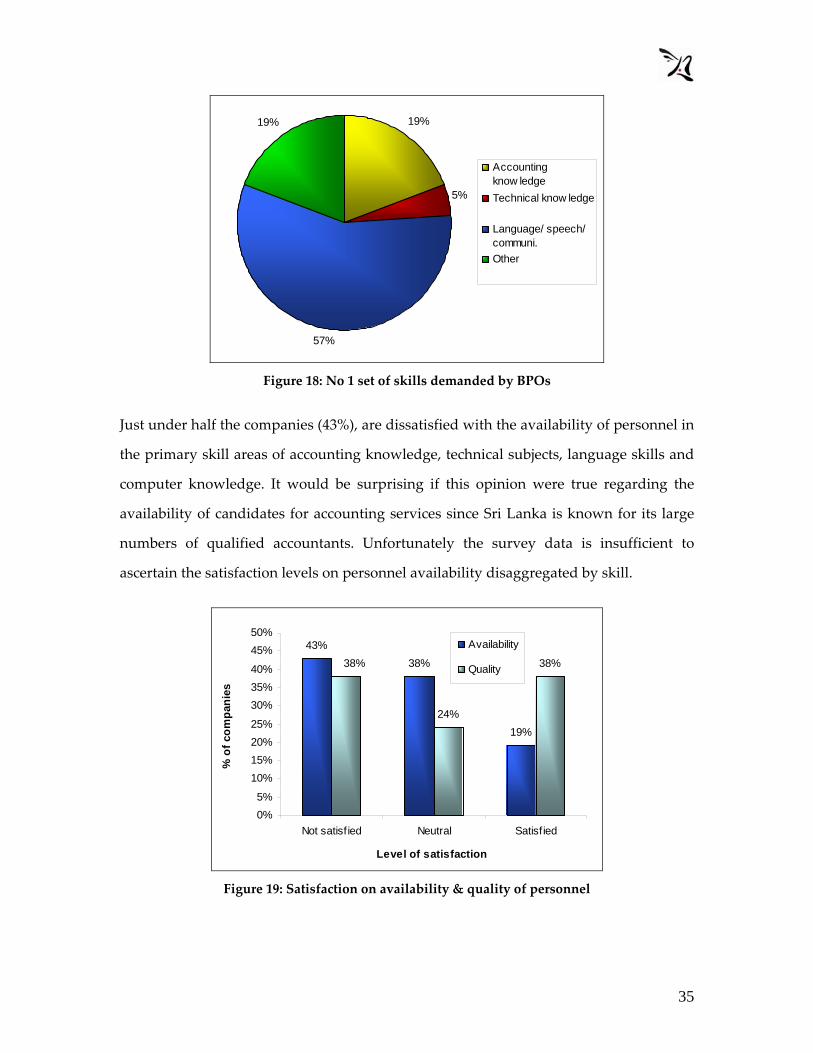
Just under half the companies (43%), are dissatisfied with the availability of personnel in
the primary skill areas of accounting knowledge, technical subjects, language skills and
computer knowledge. It would be surprising if this opinion were true regarding the
availability of candidates for accounting services since Sri Lanka is known for its large
numbers of qualified accountants. Unfortunately the survey data is insufficient to
ascertain the satisfaction levels on personnel availability disaggregated by skill.
43%38%
19%24%
38%38%
0%5%
10%15%20%25%
30%35%40%
45%50%
Not satisf ied Neutral Satisf ied
Level of satisfaction
% o
f com
pani
es
Availability
Quality
Figure 19: Satisfaction on availability & quality of personnel

36
The quality of available personnel for the above primary skills is not as much a concern
as their supply. Only 38% of the companies are not satisfied with quality of available
candidates and an equal proportion (38%) are satisfied with the quality of available
talent.
However, BPOs also require employees with proficiencies outside of those identified as
domain skills. Managers expressed the need for persons qualified and proficient in areas
such as marketing and management.
In addition, one third (33%) of the companies cited that overall skills and education of
available employees, are an obstacle to operations and growth. Nearly half the
companies (48%) maintained that education services are inefficient and a quarter of the
companies (24%) cited improving skilled personnel as a priority area that requires
immediate attention for the development of the sector.
Therefore, the findings could indicate the need for a supply expansion of skilled persons
for the BPO sector. Although the available pool of talent may be adequate at present to
meet the requirements of the existing small number of BPO operations, it may not be
sufficient in the case of sector development. Supply limitations of human resources
could also restrict the growth and competitiveness of the sector.
5.7 Skills development and training
Almost all the surveyed BPO establishments (95%) provide compulsory and non‐
compulsory training for employees. The cost of such training programmes on average is
about 8% of total monthly operating costs and training duration ranges from a few days
up to six months based on the type of training.
Although the most commonly offered service by Sri Lankan BPOs is accounting services,
the most frequently reported employee training is speech training with half (50%) the
37
companies investing in this. This highlights the importance BPOs place on
communication skills, whatever the type of services being exported. Many companies
(40%) stated they provide training in soft skills but did not specify what these are.
5.8 Employment growth
Almost all the surveyed companies (95%) plan to increase their workforce in the short
term. The survey results suggest that sector employment should grow by 30% during
2006 ‐ 2007. In the case of many BPO companies however, expansion in employment will
take place over a fairly low base. As explained previously half the companies maintain
up to 62 employees and 25% have less than 25 employees.
38
6.0 Government relations and industry bodies
Sri Lanka’s BPO sector has strong links with the state, with almost the entire trade
coming under the purview of the Board of Investment of Sri Lanka (BOI). Eighty six
percent of surveyed BPOs are registered under the BOI and are recipients of various BOI
incentives. The BOI’s current (2006) plans to provide BPO‐specific incentives for the first
time clearly indicate the importance that the government is placing on the sector.18
Previously BPOs were classified under IT and IT related services and was not promoted
as an independent investment category.
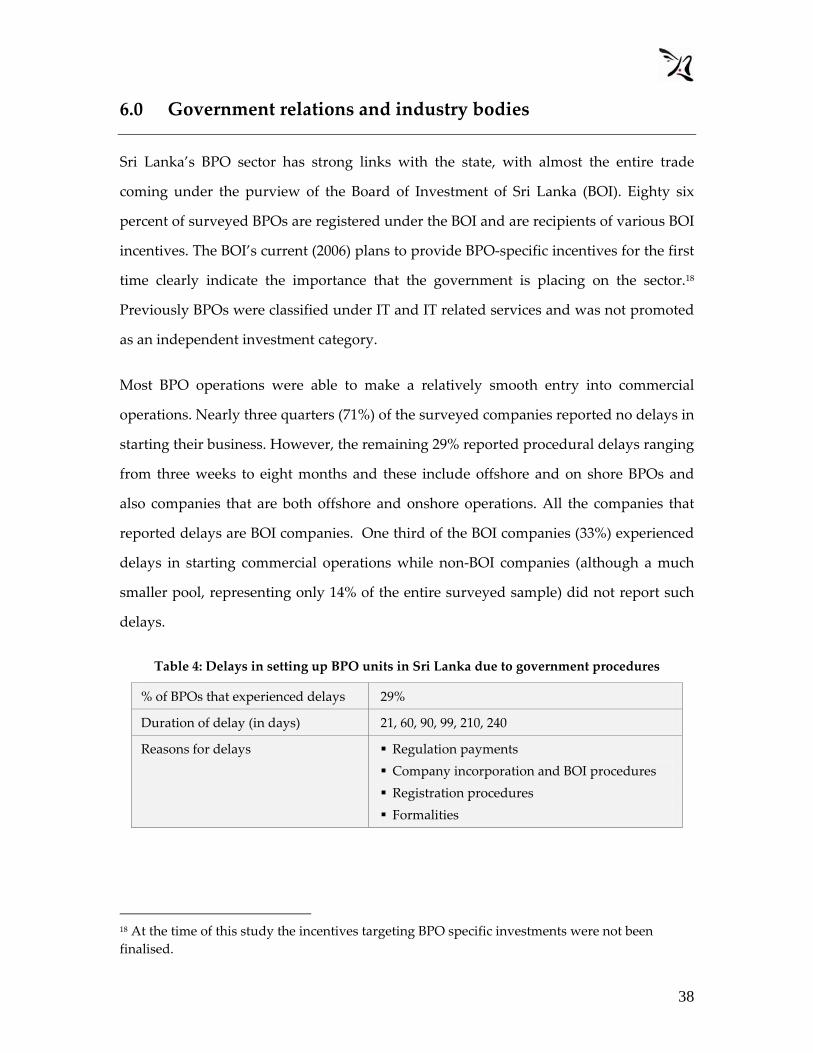
Most BPO operations were able to make a relatively smooth entry into commercial
operations. Nearly three quarters (71%) of the surveyed companies reported no delays in
starting their business. However, the remaining 29% reported procedural delays ranging
from three weeks to eight months and these include offshore and on shore BPOs and
also companies that are both offshore and onshore operations. All the companies that
reported delays are BOI companies. One third of the BOI companies (33%) experienced
delays in starting commercial operations while non‐BOI companies (although a much
smaller pool, representing only 14% of the entire surveyed sample) did not report such
delays.
Table 4: Delays in setting up BPO units in Sri Lanka due to government procedures
% of BPOs that experienced delays 29%
Duration of delay (in days) 21, 60, 90, 99, 210, 240
Reasons for delays Regulation payments Company incorporation and BOI procedures Registration procedures Formalities
18 At the time of this study the incentives targeting BPO specific investments were not been finalised.
39
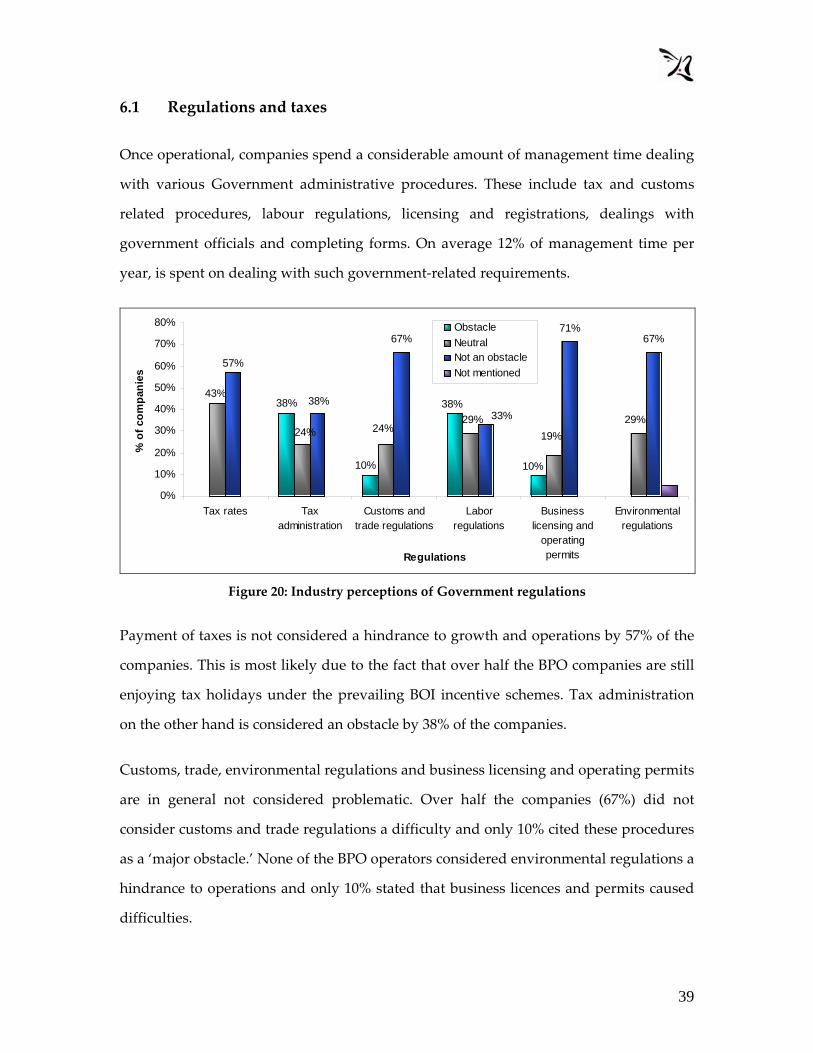
6.1 Regulations and taxes
Once operational, companies spend a considerable amount of management time dealing
with various Government administrative procedures. These include tax and customs
related procedures, labour regulations, licensing and registrations, dealings with
government officials and completing forms. On average 12% of management time per
year, is spent on dealing with such government‐related requirements.
67%71%
67%
10%
38%
10%
38%29%
19%29%
24%24%
43%
57%
38%33%
0%
10%
20%
30%
40%
50%
60%
70%
80%
Tax rates Taxadministration
Customs andtrade regulations
Laborregulations
Businesslicensing and
operatingpermits
Environmentalregulations
Regulations
% o
f com
pani
es
ObstacleNeutralNot an obstacle Not mentioned
Figure 20: Industry perceptions of Government regulations
Payment of taxes is not considered a hindrance to growth and operations by 57% of the
companies. This is most likely due to the fact that over half the BPO companies are still
enjoying tax holidays under the prevailing BOI incentive schemes. Tax administration
on the other hand is considered an obstacle by 38% of the companies.
Customs, trade, environmental regulations and business licensing and operating permits
are in general not considered problematic. Over half the companies (67%) did not
consider customs and trade regulations a difficulty and only 10% cited these procedures
as a ‘major obstacle.’ None of the BPO operators considered environmental regulations a
hindrance to operations and only 10% stated that business licences and permits caused
difficulties.

40
Over one third of surveyed companies (38%) stated that labour laws are an ‘obstacle’ to
growth and operations. As the World Bank report suggests, the cost and procedures
associated with termination of employment could be the most serious barrier.19
However, almost an equal proportion (33%), did not consider labour laws an obstacle to
their operations.
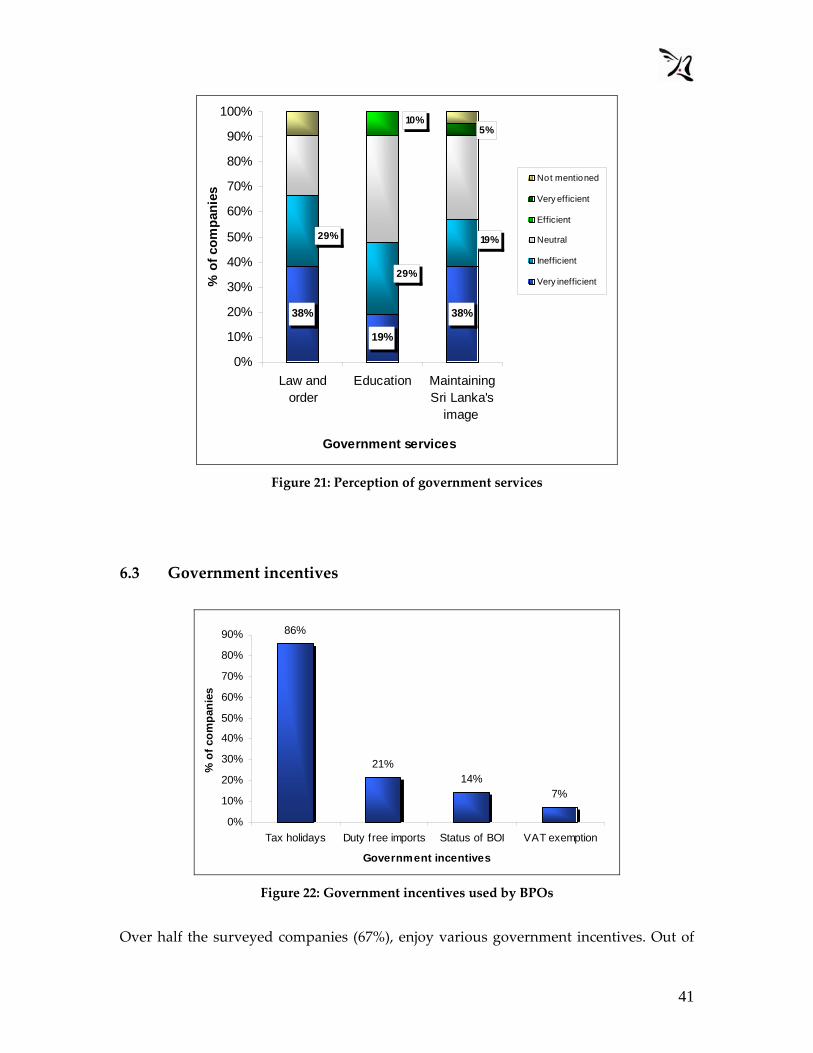
6.2 Stability of operating environment
One third (33%) of the BPOs did not agree with the statement that ‘Interpretations of
regulations affecting my establishment are consistent and predictable’. An equal
proportion (33%) was non‐committal and only 29% agreed that regulations were
consistent and predictable.
Over half the surveyed companies (57%) are not satisfied with government efforts at
upholding Sri Lanka’s national image among the rest of the world. An even larger
proportion (67%) expressed concerns about the state of law and order and ranked
maintenance of law and order as either ‘inefficient’ or ‘very inefficient’. Education
services too, are considered either ‘very inefficient’ or “inefficient’ by almost half the
surveyed companies (48%).
19 Ibid 9
41
38%
19%
38%
29%
19%29%
10%5%
0%
10%
20%
30%
40%
50%
60%
70%
80%
90%
100%
Law andorder
Education MaintainingSri Lanka's
image
Government services
% o
f com
pani
es
Not mentioned
Very efficient
Efficient
Neutral
Inefficient
Very inefficient
Figure 21: Perception of government services
6.3 Government incentives
86%
21%14%
7%
0%
10%
20%
30%
40%
50%
60%
70%
80%
90%
Tax holidays Duty free imports Status of BOI VAT exemption
Government incentives
% o
f com
pani
es
Figure 22: Government incentives used by BPOs
Over half the surveyed companies (67%), enjoy various government incentives. Out of

42
these companies 86% enjoy tax holidays and 7% have VAT exemptions while 21% utilise
duty free import facilities. BPOs could also be using tax concessions to suppliment price
competition against large, established, low cost BPO service destinations like India. This
would also explain why a majoirity of BPO investments come under the BOI despite the
reported delays caused by time consuming procedures.
6.4 Sector representation
Despite its small size and relative youth, over half the BPO sector is already organised
within private‐sector trade bodies. Sixty six percent of the companies belong to a directly
BPO related business association or a general trade chamber. The findings indicate that
BPO companies are utilising these trade affiliations in different ways but the extent of
benefits and ability to influence national policy, are unclear.
83% 83%
50% 50%
33%25%
0%
10%
20%
30%
40%50%
60%
70%
80%
90%
Info. onregulations
Accreditingstandards
Internationalproducts and
markets
Lobbyinggovernment
Domesticproducts &
markets
Disputeresolution
Type of service
% o
f com
pani
es
Figure 23: Value of services offered by trade chambers
Out of the BPO companies that belong to a trade body, a majority (83%) cited that
information on government regulations and information on accrediting standards are
two of the most valuable services provided by trade chambers. Information and
contracts on international products and input markets, and lobbying government, are

43
also mentioned as valuable activities of trade bodies by 50% of the companies. Thirty
three percent cited information on domestic products and input markets, as helpful.
Dispute resolution is considered useful, although not to the extent of other activities,
and only 25% said this was a valuable service.
44
7.0 Growth prospects of the BPO sector
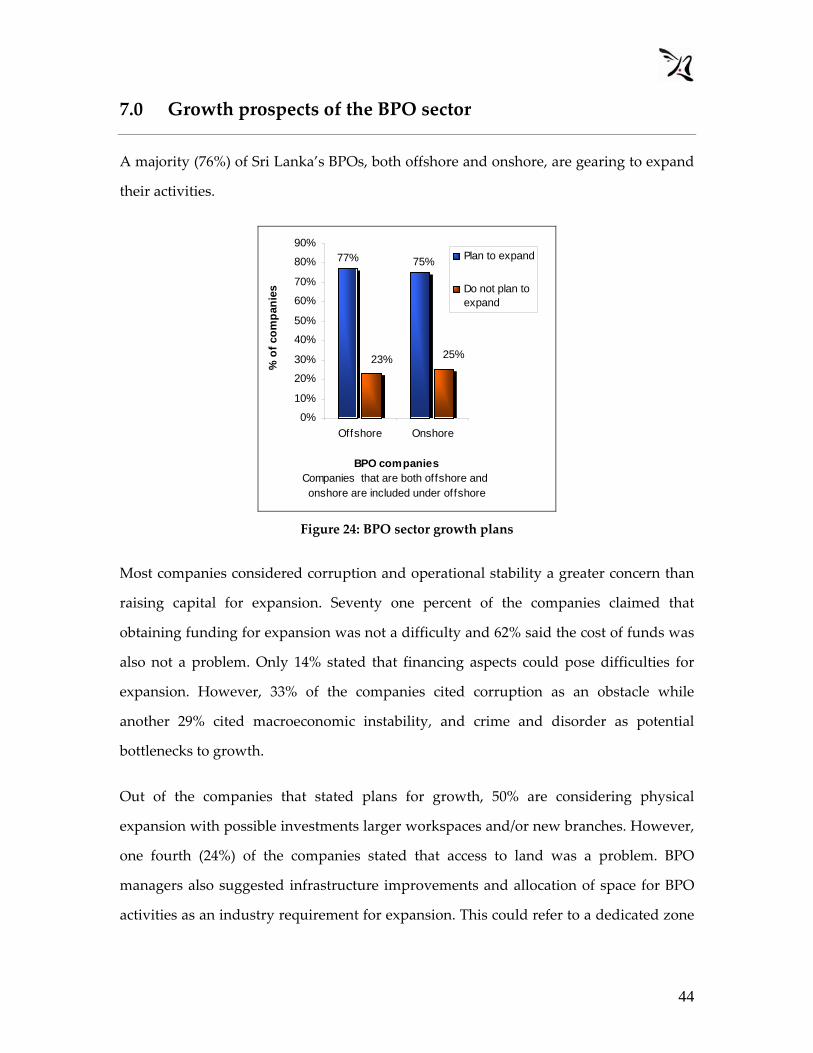
A majority (76%) of Sri Lanka’s BPOs, both offshore and onshore, are gearing to expand
their activities.
75%77%
23% 25%
0%
10%
20%
30%
40%
50%
60%
70%
80%
90%
Offshore Onshore
BPO companiesCompanies that are both offshore and onshore are included under offshore
% o
f com
pani
esPlan to expand
Do not plan toexpand
Figure 24: BPO sector growth plans
Most companies considered corruption and operational stability a greater concern than
raising capital for expansion. Seventy one percent of the companies claimed that
obtaining funding for expansion was not a difficulty and 62% said the cost of funds was
also not a problem. Only 14% stated that financing aspects could pose difficulties for
expansion. However, 33% of the companies cited corruption as an obstacle while
another 29% cited macroeconomic instability, and crime and disorder as potential
bottlenecks to growth.
Out of the companies that stated plans for growth, 50% are considering physical
expansion with possible investments larger workspaces and/or new branches. However,
one fourth (24%) of the companies stated that access to land was a problem. BPO
managers also suggested infrastructure improvements and allocation of space for BPO
activities as an industry requirement for expansion. This could refer to a dedicated zone
45
for IT enabled service providers with land and infrastructure specifically structured to
cater to industry needs.
About 13% of the BPOs that are considering growth are targeting market development
in the Asia‐Pacific region. Another 6% are considering expansion through the formation
of new partnerships that would lead to overall growth. However, companies were
reluctant to divulge details on expansion strategies and new ventures.
Almost half the BPO companies (42%) that participated in the survey stated plans to
change existing sales and marketing strategies. These companies stated various tactics
such as increasing marketing activities, targeting clients directly instead of through third
parties and changing the corporate brand or modifying the current service package.
BPO companies also expressed the opinion that national level marketing and
promotional activities to position Sri Lanka as an outsourcing destination, should be
augmented to support individual and industry level efforts.
46
8.0 Conclusions
Following accelerated telecommunications liberalisations in 2002‐03, Sri Lanka’s BPO
sector is expanding both in terms of increased activities of existing players, as well as
new entrants. This growth of BPO activity has so far been fuelled through low labour
and operating costs. Government incentives and telecommunications reforms too, seem
to have been successful in encouraging BPO investments. However, Sri Lanka needs to
address capacity constraints in the three areas of English, telecommunications
infrastructure (specifically leased line facilities), and public transport, for any significant
expansion of BPO activity to occur.
8.1 Capacity constraints
The survey reveals that Sri Lanka requires further investments in education, especially
in English communications skills, which is essential given the export‐oriented nature of
the BPO industry. Such measures should primarily target the youth, as the BPO sector is
an emerging opportunity for this demographic.
Telecommunications liberalisations, especially the opening of the international gateway
to competition in 2002, may have stimulated BPO sector growth. However, the relatively
higher costs associated with leased lines and their relative unreliability (as evidenced by
the high percentage of surveyed companies that consider the telecommunications sector
an obstacle), suggests that more needs to be done. Improvements in the domestic leased
line market could promote the expansion of BPO facilities outside the greater Colombo
area.
Improvements in the telecommunications landscape must be coupled with easy access
to land. One forth of the companies (24%) mentioned access to land as a growth
constraint. Therefore land or suitable operating space, equipped with support
47
infrastructure facilities required for BPO activities could promote faster sector
expansion.
While the irregular work hours and company‐funded transport provided by BPO
establishments may help to somewhat minimize the effects of the poor transportation
infrastructure, surveyed companies clearly conveyed the need for improvements in
transport services.
In lieu of the sector’s emerging potential, the government should assess the feasibility of
setting up a dedicated BPO zone with enhanced transport and telecommunications
infrastructure.
8.2 Regulatory and procedural constraints
Complex regulatory procedures not only lead to delays in realising investments but also
add to operating costs. Over one fourth (29%) of the companies experienced start up
delays due to government procedures and once operational on average, 12% of
management time per year, is spent on dealing with government‐related requirements.
In addition, one third of the BPO operators (33%) felt that the applicable regulatory
environment was inconsistent. These findings indicate the need to streamline
regulations that govern the industry to facilitate the process of setting up and
conducting BPO operations.
Given the limitations of the baseline survey, this report does not make recommendations
on changes to specific laws and procedures. It is noteworthy however, that labour laws
are viewed unfavourably by over one third (38%) of the BPO operators. As the
government is already in the process of addressing restrictions on working times of
women employees, the labour laws are probably considered problematic due to costs
and procedures associated with employment terminations. However a more in‐depth
study is required to gauge impacts of labour and industry related legislation on BPO
48
activity.
8.3 Marketing and sector promotion
Successfully leveraging Sri Lanka competitive advantages in the BPO industry requires
strong promotional and branding exercises that would benefit from greater government
participation. Over half the respondents (57%) expressed concerns about maintaining Sri
Lanka’s image abroad, suggesting that more needs to be done to promote Sri Lanka as a
viable outsourcing destination. Therefore national promotional campaigns could attract
further offshore investments and also encourage non‐captive operators by attracting
outsourced workflows. However, other domestic factors need to be addressed in
parallel, for promotional campaigns to show adequate results. Although large, captive,
offshore BPOs tend to be more cost effective, generate higher employment and may also
provide greater employment stability, promotional activities to draw such investments
must be accompanied by measures to address capacity constraints to successfully
supply operational needs of BPOs.
Other factors such as civil and political stability, and law and order, also seem to directly
impact BPO activity. Over half the surveyed companies stressed the need to uphold
national image and maintain law and order. These factors are of particular importance
for non‐captive operators as external perceptions of domestic instability could adversely
impact inflow of outsourced work. Perceptions of domestic instability and security
concerns could also discourage further offshore investments.
Overall, greater attention and facilitation by national decision makers is necessary to
nurture and realise the potential of the BPO sector at this nascent stage.
49
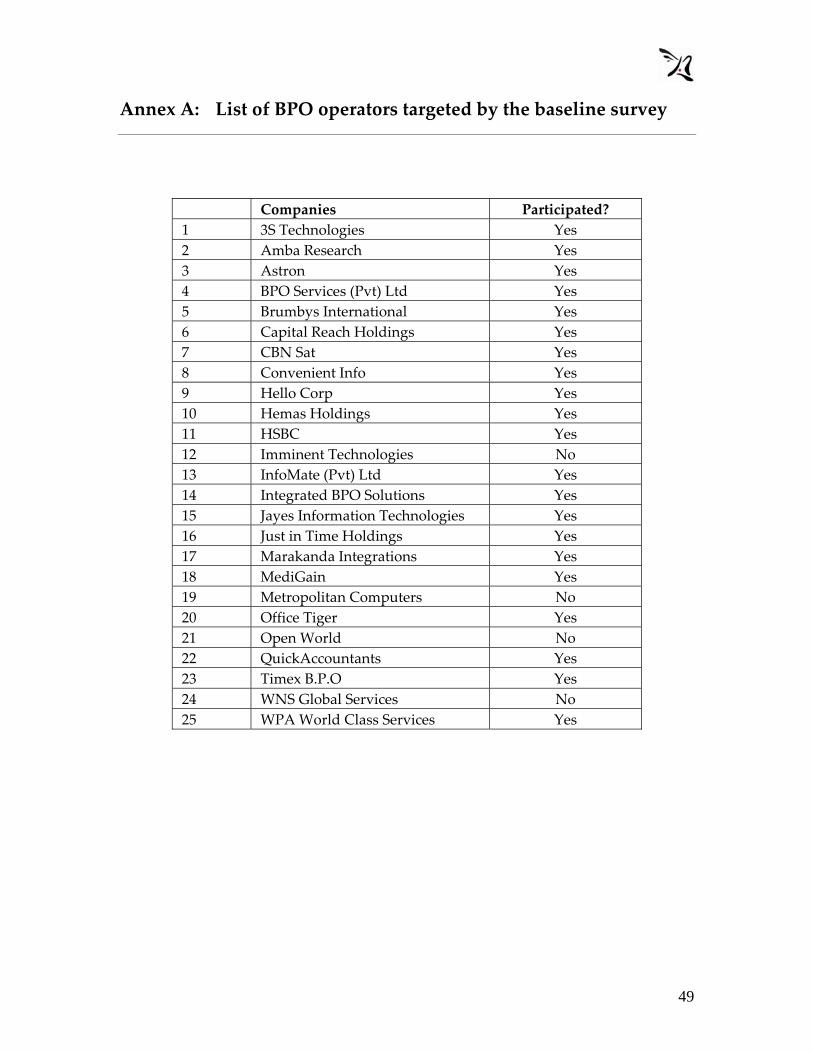
Annex A: List of BPO operators targeted by the baseline survey
Companies Participated? 1 3S Technologies Yes 2 Amba Research Yes 3 Astron Yes 4 BPO Services (Pvt) Ltd Yes 5 Brumbys International Yes 6 Capital Reach Holdings Yes 7 CBN Sat Yes 8 Convenient Info Yes 9 Hello Corp Yes 10 Hemas Holdings Yes 11 HSBC Yes 12 Imminent Technologies No 13 InfoMate (Pvt) Ltd Yes 14 Integrated BPO Solutions Yes 15 Jayes Information Technologies Yes 16 Just in Time Holdings Yes 17 Marakanda Integrations Yes 18 MediGain Yes 19 Metropolitan Computers No 20 Office Tiger Yes 21 Open World No 22 QuickAccountants Yes 23 Timex B.P.O Yes 24 WNS Global Services No 25 WPA World Class Services Yes
50
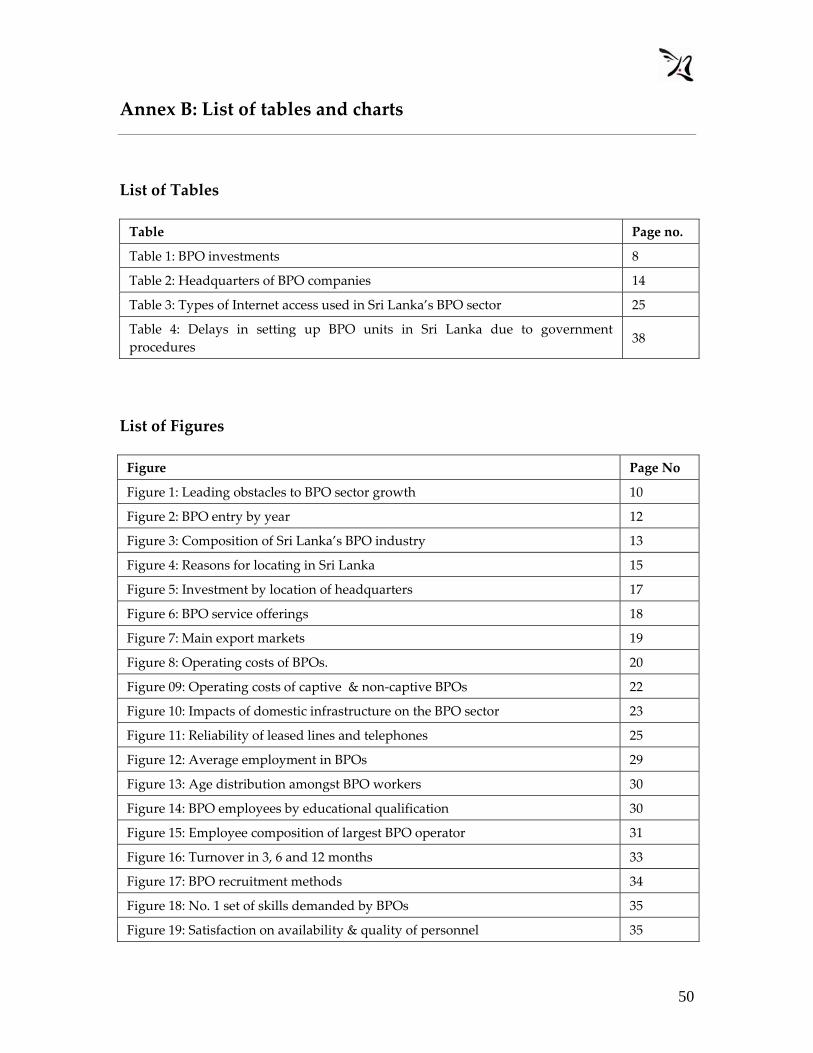
Annex B: List of tables and charts
List of Tables
Table Page no.
Table 1: BPO investments 8
Table 2: Headquarters of BPO companies 14
Table 3: Types of Internet access used in Sri Lanka’s BPO sector 25
Table 4: Delays in setting up BPO units in Sri Lanka due to government procedures
38
List of Figures
Figure Page No
Figure 1: Leading obstacles to BPO sector growth 10
Figure 2: BPO entry by year 12
Figure 3: Composition of Sri Lanka’s BPO industry 13
Figure 4: Reasons for locating in Sri Lanka 15
Figure 5: Investment by location of headquarters 17
Figure 6: BPO service offerings 18
Figure 7: Main export markets 19
Figure 8: Operating costs of BPOs. 20
Figure 09: Operating costs of captive & non‐captive BPOs 22
Figure 10: Impacts of domestic infrastructure on the BPO sector 23
Figure 11: Reliability of leased lines and telephones 25
Figure 12: Average employment in BPOs 29
Figure 13: Age distribution amongst BPO workers 30
Figure 14: BPO employees by educational qualification 30
Figure 15: Employee composition of largest BPO operator 31
Figure 16: Turnover in 3, 6 and 12 months 33
Figure 17: BPO recruitment methods 34
Figure 18: No. 1 set of skills demanded by BPOs 35
Figure 19: Satisfaction on availability & quality of personnel 35

51
Figure 20: Industry perceptions of Government regulations 39
Figure 21: Perception of Government services 41
Figure 22: Government incentives used by BPOs 41
Figure 23: Value of services offered by trade chambers 42
Figure 24: BPO sector growth plans 44