a scientometric analysis of research in recommender systems · · 2016-06-10area of...
TRANSCRIPT

J Scientometric Res. | Jan–Apr 2016 | Vol 5 | Issue 1 71
R E S E A R C H A R T I C L EJ S C I R E S
ABSTRACT
This paper presents analytical outcomes of scientometric mapping of research work done on the important emerging area of ‘Recommender Systems. Research on ‘Recommender Systems’ started during last few years and within a short span of time has gained tremendous momentum. It is now considered as important emerging areas of research in computational sciences and related disciplines. We have analyzed the research output data on ‘Recommender Systems’ during 1991-2015 indexed in the Web of Knowledge. The analysis maps comprehensively the parameters of total output, growth of output, authorship and country-level collaboration patterns, major contributors (countries, institutions and individuals), top publication sources, thematic trends and emerging topics in the field. The paper presents an elaborate and first of its kind scientometric mapping of research on ‘Recommender Systems’.
Key words: Bibliometric analysis, Collaborative filtering, Recommender system, Scientrometrics.
A Scientometric Analysis of Research in Recommender Systems
Pranav Waila1, Vivek Kumar Singh2 and Manoj Kumar Singh1
1Interdisciplinary Mathematical Sciences, Banaras Hindu University, Varanasi, INDIA.2Department of Computer Science, Banaras Hindu University, Varanasi, INDIA.
heuristics. A Recommender system makes suggestions with certain goals, which may be a combination of profit maximization, user satisfaction, exposure of long tail of relevant products to a user, impressing a user by surprise etc. In present day internet ecosystem, recommender systems are an essential part of commercial websites. Recommendations are the major market boosters and crowd attractors. In fact certain e-commerce giants are market leaders because of their recommendation power. Recommender system is a promising research area in artificial intalligence because of the industrial importance and need of cutting edge algorithm development to utilize swiftly growing user generated data.
During the past 20 years recommender system evolved as a special interest topic. This paper we did a scientriometric analysis of research trend on recommender system literature. The objective of this research is to explore the recom-mendation system literature in a computational way to evaluate how this research started, progressed and who are the authorities in this research area. We did a thorough analysis of research growth on extended SCI journal articles to identify the methods, institutions, various areas, themes and productivity levels of various institutions and identify stalwarts of this research area. We used text
*Address for correspondence:Dr Vivek Kumar Singh, Department of Computer Science, Banaras Hindu University, Varanasi, INDIA.
Phone no: +91-9971995005
E-mail: [email protected].
INTRODUCTION
Web 2.0 has transformed the internet ecosystem in to a global dynamic cooperative environment where each and everyone have freedom to express opinion & rate services or products available online. On the basis feedbacks new web surfer can be benefitted with to the point sugges-tions for his needs based on certain heuristics. Recom-mender systems are such application software which suggests item/product or a group of item/products to its user. These suggestions may be based on user’s previous transactions, similar user’s transactions or some other
Access this article onlineOfficial Publication of
Website: www.jscires.org
DOI:10.5530/jscires.5.1.10

Pranav Waila et al.: Scientometric Analysis of Recommender Systems Research
72 J Scientometric Res. | Jan–Apr 2016 | Vol 5 | Issue 1
analysis approaches and standard scientometric methods for analytical mapping of Recommender system research output for more than 2 dacades starting from 1992 to April 2015. Analysis presents comprehensive summariza-tion of the research in Recommender System. It gives a comprehensive list of top publication sources and contri-butions of those SCI Expended sources.
The rest of the paper is organized as follows: The section 2 presents some related work about scientometric analysis on different narrow research themes that helped us in formulating the research plan. Section 3 describes the data collection and methodology used. Section 4 describes the analytical outcomes on quantification and growth of research output and section 5 presents the analytical outcomes on authorship and collaboration patterns. The section 6 illustrates the major contributors (countries, institutions, individuals and publication sources). Section 7 describes the main disciplines related to the ‘Recommender System’ research. The paper concludes in, section 8, with a short summary and usefulness of this work.
Overview and Related Work
Scientometrics mapping is defined as quantitive study of science, Plenty of research work on scientometric mapping of research work in a narrow research theme is already available. Though we could only find a few previous work that tried to do scientometric analysis of “Recommender system” theme. Our study is more comprehensive and detailed relatively. Previous work on other disciplines and particular narrow themes has helped us to formulate the research methodology.
In previous works we have encountered 3 main directions of studies. (1) scientometric mapping of a subject in country. (2) Global trend and publication output for a theme. (3) comparative study of research in one or more domains for measuring competitive countries or institu-tions.[1,2] presented scientometric analysis of CS domain. Comparative study on research growth of computer science among India and China was presented by.[3] A scient ometric analysis on Indian Computer Science research output was performed by.[4] for the period of 10 years from 1999 to 2008. They mapped research growth with the use of different indicators like total research output, citation impact, distribution of internationally collaborative papers. In a recently published work,[5] authors tried to map the information technology knowledge and research infrastructure in the South Asian region during 1989-2013.
Many authors have focused in specialized research topics instead of working on broader themes.[6] Compared stem cell research in India with other countries.[7-9] Explored Nanoscience and Nanotechnology research in terms of research output in India, Temporal relations and citation & co-citation network respectively.[10,11] Presented scien-tometric analysis of emerging fields of business and management information system respectively.[12-14]
Mapped research output of fisheries in different aspects.[15]explored narrow research area of green chemistry in India whereas[16] worked on plant genetics and breeding science. The only research works we found on “Recom-mender Systems” worth mentioning which explores the accomplished studies and presents good literature survey in order to quantify the research output was made by[17,18] has reviewed 210 research articles and classified them in terms of algorithmic techniques and application domain. This detailed study also highlights the potential journals and their contribution on the selected research paper corpus. Though the corpus selected is very small, we can see the major boom in the Recommender system research after 2010.[18] Has done a scientometric review on emerging trends in Recommender system. Study was conducted on Web of Knowledge (WoK) core and expanded biblio-graphic records.[24-18] presents top keywords with their strength on core dataset, topic clusters and top 50 cited references. The present work is different from previous works in various dimensions. We have manually prepro-cessed the WoK core dataset records and calculated scen-tiometric majors for authors, institutions from the starting date to current date. Our results are depicting over the period evolution of the literature. This study is performed in well established quantitative and text analytics standards.
Data Collection & Methodology
For measuring research outcome of Recommender system we collected data from Web of Knowledge (WoK) for the period of 25 publication years 1991–2015. In WoK we found total of 2451 records with the search query [TS=(“Recommend* System” OR “Collaborative Filter*” OR “Movie Recommend*” OR “Product* Recommend*” OR “Item* Recommend” OR “Content Based Recom-mend*” OR “Group Recommend*” OR “Content-based filtering” OR “Netflix Prize”)]. Data collection com-prises of records of the type article. Each record in WoK data contains 60 fields containing meta-data about the records, such as paper title (TI), author address (C1), citation references (Z9) etc. We have used the information contained in different fields for a standard scientometric and a text-based analysis.
Pranav Waila et al.: Scientometric Analysis of Recommender Systems Research
J Scientometric Res. | Jan–Apr 2016 | Vol 5 | Issue 1 73
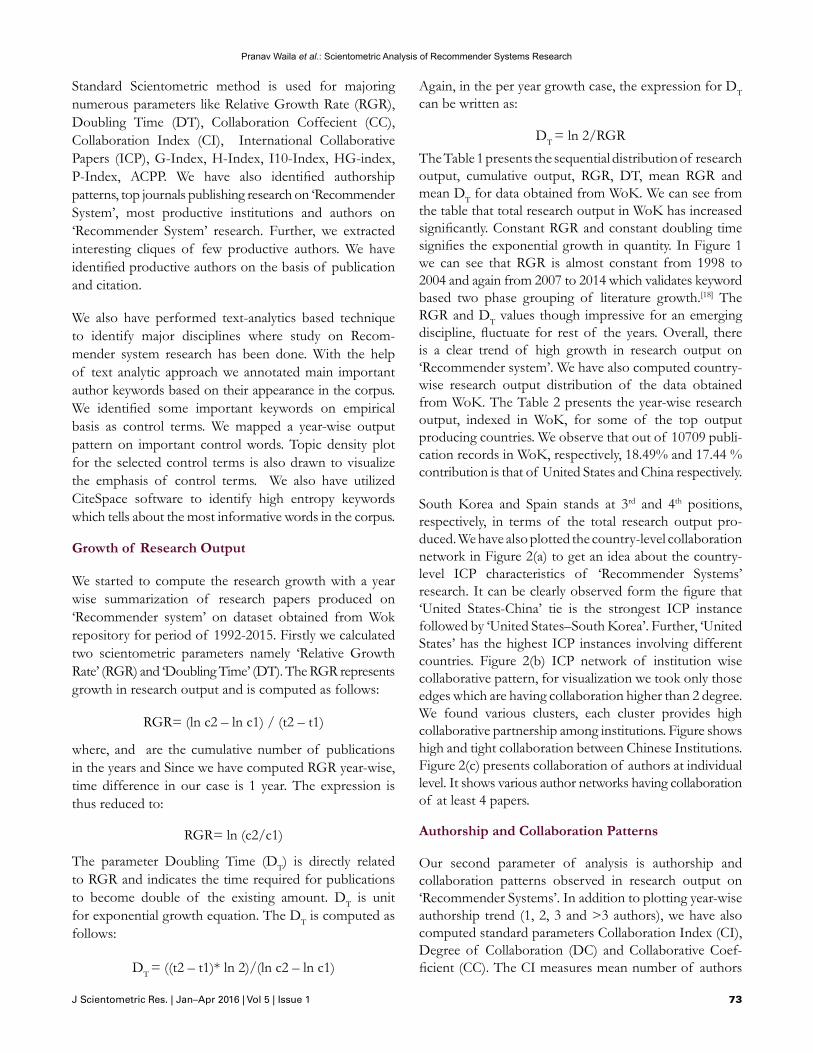
Standard Scientometric method is used for majoring numerous parameters like Relative Growth Rate (RGR), Doubling Time (DT), Collaboration Coffecient (CC), Collaboration Index (CI), International Collaborative Papers (ICP), G-Index, H-Index, I10-Index, HG-index, P-Index, ACPP. We have also identified authorship patterns, top journals publishing research on ‘Recommender System’, most productive institutions and authors on ‘Recommender System’ research. Further, we extracted interesting cliques of few productive authors. We have identified productive authors on the basis of publication and citation.
We also have performed text-analytics based technique to identify major disciplines where study on Recom-mender system research has been done. With the help of text analytic approach we annotated main important author keywords based on their appearance in the corpus. We identified some important keywords on empirical basis as control terms. We mapped a year-wise output pattern on important control words. Topic density plot for the selected control terms is also drawn to visualize the emphasis of control terms. We also have utilized CiteSpace software to identify high entropy keywords which tells about the most informative words in the corpus.
Growth of Research Output
We started to compute the research growth with a year wise summarization of research papers produced on ‘Recommender system’ on dataset obtained from Wok repository for period of 1992-2015. Firstly we calculated two scientometric parameters namely ‘Relative Growth Rate’ (RGR) and ‘Doubling Time’ (DT). The RGR represents growth in research output and is computed as follows:
RGR= (ln c2 – ln c1) / (t2 – t1)
where, and are the cumulative number of publications in the years and Since we have computed RGR year-wise, time difference in our case is 1 year. The expression is thus reduced to:
RGR= ln (c2/c1)
The parameter Doubling Time (DT) is directly related to RGR and indicates the time required for publications to become double of the existing amount. DT is unit for exponential growth equation. The DT is computed as follows:
DT = ((t2 – t1)* ln 2)/(ln c2 – ln c1)
Again, in the per year growth case, the expression for DT can be written as:
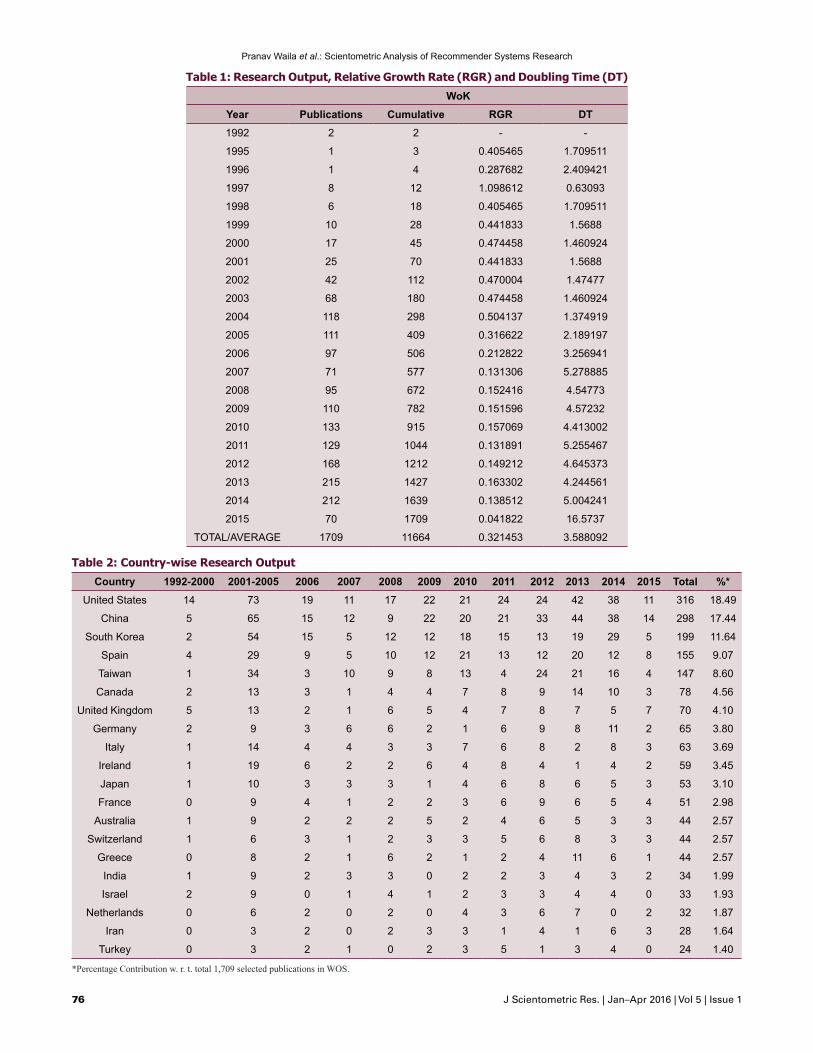
DT = ln 2/RGRThe Table 1 presents the sequential distribution of research output, cumulative output, RGR, DT, mean RGR and mean DT for data obtained from WoK. We can see from the table that total research output in WoK has increased significantly. Constant RGR and constant doubling time signifies the exponential growth in quantity. In Figure 1 we can see that RGR is almost constant from 1998 to 2004 and again from 2007 to 2014 which validates keyword based two phase grouping of literature growth.[18] The RGR and DT values though impressive for an emerging discipline, fluctuate for rest of the years. Overall, there is a clear trend of high growth in research output on ‘Recommender system’. We have also computed country-wise research output distribution of the data obtained from WoK. The Table 2 presents the year-wise research output, indexed in WoK, for some of the top output producing countries. We observe that out of 10709 publi-cation records in WoK, respectively, 18.49% and 17.44 % contribution is that of United States and China respectively.
South Korea and Spain stands at 3rd and 4th positions, respectively, in terms of the total research output pro-duced. We have also plotted the country-level collaboration network in Figure 2(a) to get an idea about the country-level ICP characteristics of ‘Recommender Systems’ research. It can be clearly observed form the figure that ‘United States-China’ tie is the strongest ICP instance followed by ‘United States–South Korea’. Further, ‘United States’ has the highest ICP instances involving different countries. Figure 2(b) ICP network of institution wise collaborative pattern, for visualization we took only those edges which are having collaboration higher than 2 degree. We found various clusters, each cluster provides high collaborative partnership among institutions. Figure shows high and tight collaboration between Chinese Institutions. Figure 2(c) presents collaboration of authors at individual level. It shows various author networks having collaboration of at least 4 papers.
Authorship and Collaboration Patterns
Our second parameter of analysis is authorship and colla boration patterns observed in research output on ‘Recom mender Systems’. In addition to plotting year-wise authorship trend (1, 2, 3 and >3 authors), we have also computed standard parameters Collaboration Index (CI), Degree of Collaboration (DC) and Collaborative Coef-ficient (CC). The CI measures mean number of authors
Pranav Waila et al.: Scientometric Analysis of Recommender Systems Research
74 J Scientometric Res. | Jan–Apr 2016 | Vol 5 | Issue 1
per paper[19] and DC measures the proportion of multi-authored papers. [20] The CC parameter is a single measure, which states that quantification of collaboration should have a value between 0 and 1, where 0 corresponds to all output being single authored and 1 represents all papers being maximally authored.[21] We define the notations and expressions used for these computations as follows:
fj Number of Research papers in a given discipline hav-ing j authors
N Number of Research papers in a given disciplinek Maximum number of collaborating authors for a
paper in a given discipline
The Collaboration Index (CI) can be computed as:
1kj jjf
CIN
This index results mean number of authors per paper. This index has no upper limit, hence cannot be interpreted as degree. Further, it gives a non-zero weight to single authored papers i.e. non collaborative papers. Therefore, other parameters are also computed. The Degree of Collaboration (DC) can be computed as:
where, f1 is the number of single authored papers. This index can be interpreted as degree as its value lies between ‘0’ and ‘1’ and it gives ‘0’ weight to single authored papers and value ‘1’ for maximum collaboration. It ranks higher a discipline with higher number of multi authored papers but doesn’t differentiate between the multiple authorship levels. The Collaborative Coefficient (CC) is a relatively more robust measure of collaboration and can be com-puted as:
11fDCN
Here, every paper contains a definite amount of credit. Each author gets 1/j credit for a paper with j authors. The value of CC lies between 0 and 1. This parameter has both the upper bound and the distinguishing capacity between various multi-authored papers. We have com-puted all these parameters for the data. The table 3 shows the year-wise distribution of number of papers having 1, 2, 3and >3 authors and the CI, DC, and CC values, for WoK data. We observe that in general there is a trend towards more multi-authored papers.
Major Contributors
Our major contribution in this study is to identify highly productive institutions, authors, countries. We firstly preprocessed web of knowledge data and identified the most important journals that published high amount of research paper on ‘Recommender Systems’. On the collected corpus we have quantified H-index,[22] Total Citations (TC) and Average Citation Per Paper (ACPP) values for each of these journals. The table 4 shows the top journals (arranged according to Total Papers (TP) in WoK) that published research on ‘Recommender Systems’ during 1992-2015. We observed that ‘Expert System and Application’ tops the list with 178 papers with ACCP .006 and aggregate H-index 29 in terms of number of publication. This is followed by ‘Lecture Notes in Computer Science’ with 174 papers and ‘Lecture Notes on Artificial Intelligence’ with 127 papers. Some other prominent publication sources are ‘Information Sciences’, ‘Knowledge-Based Systems’ and ‘Decision Support System’. Interestingly ‘Journal of Machine Learning Research’ tops the list in terms of most cited source in terms of total citation with 3221 total citations.
After identifying top publication sources, we moved to identify the major institutions having significant amount of research published on ‘Recommender Systems’. We analyzed the data and identified the top contributing institutions to the ‘Recommender Systems’ research for collected corpus. We have computed scientometric indicators TP, TC, ACPP, H-index, G-index, I10-index, HG-index and P-index values for the data corresponding to each of these institutions. The, G-index,[23] is calculated based on the distribution of citations received by a given researcher’s publications:
“Given a set of articles ranked in decreasing order of the number of citations that they received, the G-index is the (unique) largest number such that the top g articles received (together) at least G2 citations.”
The HG-index,[24] is computed as:
*HG H G
and the P-index,[25]is computed as:
1/3
.C
P CP
where, P is total number of papers and C is total citations. The P-index gives perfect stability between quality (C/P) and quantity C. The Table 5 shows the top 15 contributing
Pranav Waila et al.: Scientometric Analysis of Recommender Systems Research
J Scientometric Res. | Jan–Apr 2016 | Vol 5 | Issue 1 75
institutions to the ‘Recommender Systems’ research as measured in WoK corpus sorted in terms of total citation. The ‘University of Minnesota’ stands at first place in terms of total citation with 3679 citation where as ‘Inha University’ and ‘National Chiao Tung University’ tops the list in terms of total published papers with 29 papers. Different institutions, however, rank differently on different parameters.
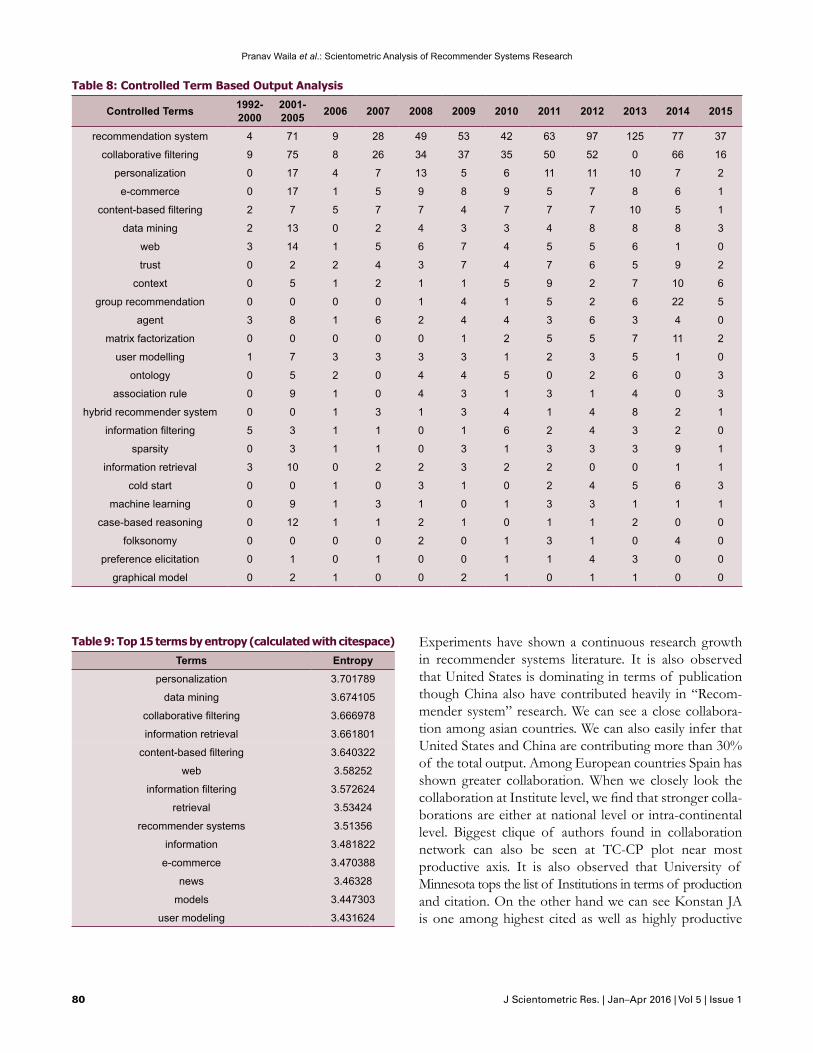
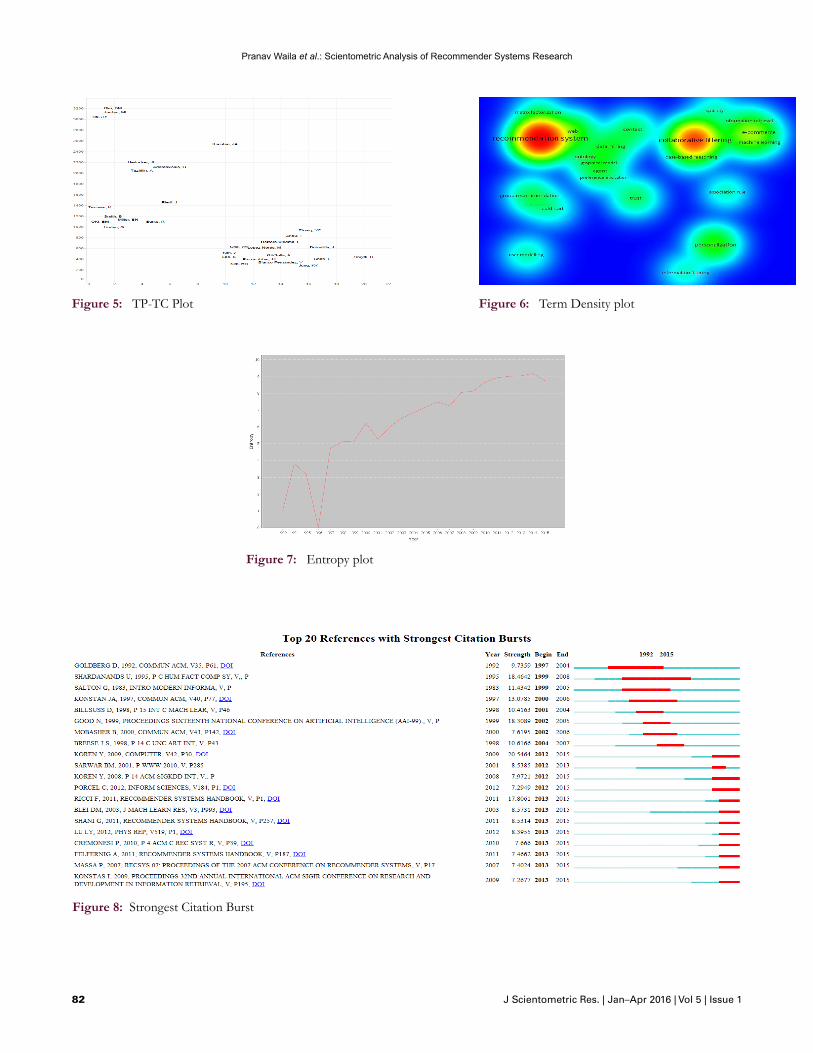
In the WoK ‘Recommender System’ corpus we have identified most productive authors of the subject. Table 6 presents 10 most productive author in dataset and 10 most cited author in WoK dataset, for each author we have displayed TP and TC values. We observed ‘Smith B’ as most productive author followed by ‘Liu, DR’ in terms of TP value with 20 and 18 papers respectively. Most cited co-authors are ‘Blei, DM’, ‘Ng, AY’ and ‘Jordan, MI’ for the paper named ‘Latent Dirichlet allocation’ with 2793 citation. We have also identified the co-authorship cliques for the top authors. The Figures 3 shows the clique for most productive author and figure 4 shows the co-author-ship clique for most cited authors. Further, we have also provided visualization for most productive as well as most cited authors on a TP-TC plot in figure 5. We observed that none of the authors ranked in both most productive and most cited lists on WOK data, although Konstan, JA is one of highly cited as well as high productive author with a powerful authorship network.
Discipline Wise Output Analysis
The research on ‘Recommender systems’ is not confined to Computer Science only. Many disciplines have con-tributed to different aspects of ‘Recommender system’ research. We have tried to identify the discipline-wise research output for ‘Recommender system’ from the WoK corpus. The number and details of disciplines used is described in the Appendix. We mapped multiple subject classes of WoK to broader representative areas. The Table 7 presents the number of research publications in 10 different disciplines along with their percentage contri-bution to the total research output indexed in WoK for 24-year period. We observe that Artificial Intelligence contributes a total of 766 out of 1,709 publications, which constitutes approximately 50% of the total output. Thus, contrary to what one may believe, about 50% of the ‘Recommender systems’ research output is from disciplines other than Artificial Intelligence. Information systems, Engineering, Electrical and Electronics, Theory & methods and Operation research are some of the major contributing disciplines to ‘Recommender systems’ research. A research publication may belong to more than
one discipline (due to interdisciplinary outputs) and hence the total percentage value can be greater than 100.
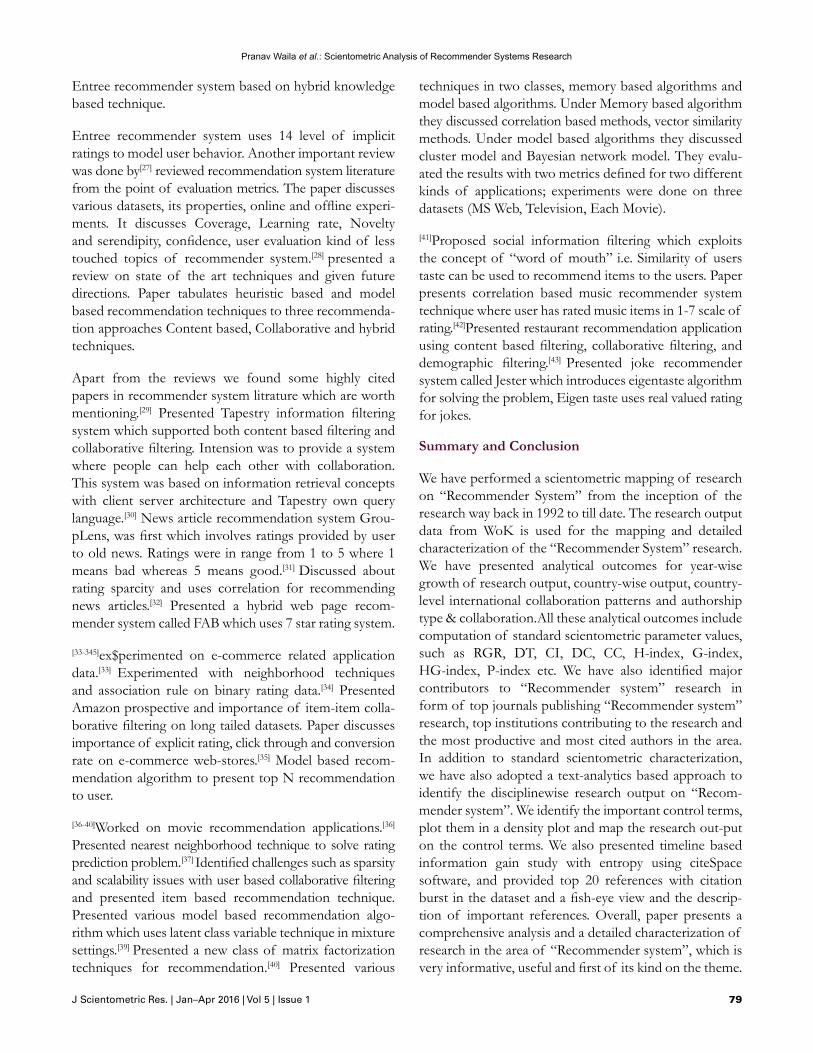
The second major text-analytics based outcome that we tried to derive is about the major research themes/ topics in ‘Recommender systems’ research. For this purpose, first of all we extracted all distinct author keywords in the WoK research output data. The occurrence frequencies for all the distinct author keywords are computed and the author keywords are arranged according to descending order of their occurrence frequencies. Thereafter, we identified high-frequency important terms (hereafter called control terms) and identified the number of research papers on that keyword. The Table 8 shows the year-wise distri-bution of selected control terms. We see that ‘Recom-mender system’, ‘Collaborative filtering’, ‘Personalization’, ‘E-commerce’, ‘content-based filtering’, ‘data mining’ are some of the prominent control terms. A significant amount of research output is on the selected control terms that happen to be the major themes of research in ‘Recom-mender systems’ field. We have also plotted the some control terms on a density plot in figure 6 using VOSviewer,[1] where size of a term is proportional to its occurrence frequency in WoK data. The density plot also shows the prominent research themes/topics in ‘Recommender system’ research. We have also tried to plot information entropy to depict diversity in dataset. Entropy plot in Figure 7 which is generated by CiteSpace2 software depicts information diversity on WoK data. CiteSpace calculates information entropy based on noun phrase. There is some downfall on information gain during 1995-1996 but in rest of the years it shows prominent growth. Table 9 shows top 15 terms by entropy which is calculated by CiteSpace. Using CiteSpace software we have plotted top 20 references with strongest citation burst in WoK dataset displayed in Figure 8. We have also plotted fisheye-timeline visualization Figure 9 for top cited references.
Detailed Analysis of Some Important Papers
On the basis of experiments we found few important works, which are presented in Figure 9. Among these works we found 3 important reviews from different angles on recommendation system literature.[26] Presented a review and discussed various algorithms on broad cate-gories such as collaborative, content based, Demographic, Utility based, Knowledge based recommendation and various possible hybrid methods studied in past on weighted, switching, mixed, feature combination, cascade, feature augmentation and meta-level categories. This paper discusses
1. http://www.vosviewer.com/Home2. http://cluster.ischool.drexel.edu/~cchen/citespace/
Pranav Waila et al.: Scientometric Analysis of Recommender Systems Research
76 J Scientometric Res. | Jan–Apr 2016 | Vol 5 | Issue 1
Table 1: Research Output, Relative Growth Rate (RGR) and Doubling Time (DT)
WoKYear Publications Cumulative RGR DT1992 2 2 - -
1995 1 3 0.405465 1.709511
1996 1 4 0.287682 2.409421
1997 8 12 1.098612 0.63093
1998 6 18 0.405465 1.709511
1999 10 28 0.441833 1.5688
2000 17 45 0.474458 1.460924
2001 25 70 0.441833 1.5688
2002 42 112 0.470004 1.47477
2003 68 180 0.474458 1.460924
2004 118 298 0.504137 1.374919
2005 111 409 0.316622 2.189197
2006 97 506 0.212822 3.256941
2007 71 577 0.131306 5.278885
2008 95 672 0.152416 4.54773
2009 110 782 0.151596 4.57232
2010 133 915 0.157069 4.413002
2011 129 1044 0.131891 5.255467
2012 168 1212 0.149212 4.645373
2013 215 1427 0.163302 4.244561
2014 212 1639 0.138512 5.004241
2015 70 1709 0.041822 16.5737
TOTAL/AVERAGE 1709 11664 0.321453 3.588092
Table 2: Country-wise Research Output
Country 1992-2000 2001-2005 2006 2007 2008 2009 2010 2011 2012 2013 2014 2015 Total %*United States 14 73 19 11 17 22 21 24 24 42 38 11 316 18.49
China 5 65 15 12 9 22 20 21 33 44 38 14 298 17.44
South Korea 2 54 15 5 12 12 18 15 13 19 29 5 199 11.64
Spain 4 29 9 5 10 12 21 13 12 20 12 8 155 9.07
Taiwan 1 34 3 10 9 8 13 4 24 21 16 4 147 8.60
Canada 2 13 3 1 4 4 7 8 9 14 10 3 78 4.56
United Kingdom 5 13 2 1 6 5 4 7 8 7 5 7 70 4.10
Germany 2 9 3 6 6 2 1 6 9 8 11 2 65 3.80
Italy 1 14 4 4 3 3 7 6 8 2 8 3 63 3.69
Ireland 1 19 6 2 2 6 4 8 4 1 4 2 59 3.45
Japan 1 10 3 3 3 1 4 6 8 6 5 3 53 3.10
France 0 9 4 1 2 2 3 6 9 6 5 4 51 2.98
Australia 1 9 2 2 2 5 2 4 6 5 3 3 44 2.57
Switzerland 1 6 3 1 2 3 3 5 6 8 3 3 44 2.57
Greece 0 8 2 1 6 2 1 2 4 11 6 1 44 2.57
India 1 9 2 3 3 0 2 2 3 4 3 2 34 1.99
Israel 2 9 0 1 4 1 2 3 3 4 4 0 33 1.93
Netherlands 0 6 2 0 2 0 4 3 6 7 0 2 32 1.87
Iran 0 3 2 0 2 3 3 1 4 1 6 3 28 1.64
Turkey 0 3 2 1 0 2 3 5 1 3 4 0 24 1.40
*Percentage Contribution w. r. t. total 1,709 selected publications in WOS.

Pranav Waila et al.: Scientometric Analysis of Recommender Systems Research
J Scientometric Res. | Jan–Apr 2016 | Vol 5 | Issue 1 77
Table 3: Authorship and Collaboration Patterns
No. of Authors/ Year
WoK1 2 3 >3 CI DC CC
1992 0 1 0 1 3 1 0.625
1995 0 0 1 0 3 1 0.666667
1996 1 0 0 0 1 0 0
1997 3 0 2 3 6.125 0.625 0.485417
1998 0 3 3 0 2.5 1 0.583333
1999 4 3 2 1 2.2 0.6 0.366667
2000 2 5 3 7 3.470588 0.882353 0.590731
2001 7 8 5 5 2.56 0.72 0.452333
2002 4 11 9 18 3.190476 0.904762 0.603515
2003 10 18 26 14 2.823529 0.852941 0.55
2004 9 46 31 32 2.966102 0.923729 0.579668
2005 17 41 26 27 2.621622 0.846847 0.5253
2006 9 30 28 30 3.030928 0.907216 0.588463
2007 3 26 28 14 3.014085 0.957746 0.603432
2008 4 34 26 31 3.084211 0.957895 0.613216
2009 6 32 35 37 3.218182 0.945455 0.621429
2010 11 30 39 53 3.24812 0.917293 0.618421
2011 6 32 36 55 3.27907 0.953488 0.638557
2012 6 50 48 64 3.279762 0.964286 0.636742
2013 9 45 60 101 3.493023 0.95814 0.655192
2014 13 43 62 94 3.443396 0.938679 0.641117
2015 3 17 14 36 3.528571 0.957143 0.655204
Table 4: Top Publication Sources For Recommender System Research
Publication SourceWoK
TP TC H-Index ACPPEXPERT SYSTEMS WITH APPLICATIONS 178 2549 29 0.006
LECTURE NOTES COMPUTER SCIENCE 174 810 13 0.006
LECTURE NOTES ON ARTIFICIAL INTELLIGENCE 127 408 9 0.008
INFORMATION SCIENCES 58 896 18 0.017
KNOWLEDGE-BASED SYSTEMS 52 588 15 0.019
DECISION SUPPORT SYSTEM 37 1352 14 0.027
USER MODELING AND USER-ADAPTED INTERECTION 30 1212 15 0.033
MULTIMEDIA TOOLS AND APPLICATIONS 26 122 7 0.038
IEEE TRANSACTION ON CONSUMERELECTRONICS 23 149 8 0.043
INFORMATION PROCESS MANAGEMENT 21 156 7 0.048
ACM TRANSACTIONS ON INTELLIGENT SYSTEM AND TECHNOLOGY 20 55 4 0.050
ACM TRANSACTIONS ON INFORMATION SYSTEM 18 2786 10 0.056
IEEE TRANSACTIONS ON KNOWLEDGE AND DATA ENGINEERING 18 1817 8 0.056
JOURNAL OF MACHINE LEARNING RESEARCH 16 3221 11 0.063
JOURNAL OF UNIVERSAL COMPUTER SCIENCE 16 63 4 0.063
PHYSICA A 16 163 7 0.063
ARTIFICIAL INTELLIGENCE REVIEW 14 660 7 0.071
JOURNAL OF COMPUTER SCIENCE AND TECHNOLOGY 14 34 3 0.071
ELECTRONIC COMMERCE RESEARCH AND APPLICATIONS 13 159 6 0.077
IEICE TRANSACTIONS ON INFORMATION AND SYSTEMS 13 58 4 0.077

Pranav Waila et al.: Scientometric Analysis of Recommender Systems Research
78 J Scientometric Res. | Jan–Apr 2016 | Vol 5 | Issue 1
Table 5: Most Productive Institutions on Recommender System Research
Institution TP TC ACPP H-Index G-Index I.10-Index
HG-Index P Index
UNIVERSITY MINNESOTA 17 3679 216.41 8 17 8 11.66 92.68
UNIVERSITY CALIFORNIA BERKELEY 12 3341 278.42 5 12 5 7.75 97.62
STANFORD UNIVERSITY 17 3210 188.82 8 17 7 11.66 84.63
STERN SCHOOL BUSINESS 1 1585 1585 1 1 1 1.00 135.94
OREGON STATE UNIVERSITY 5 1328 265.60 3 5 3 3.87 70.65
TEKNEKRON SOFTWARE SYSTEMS INC 1 844 844.00 1 1 1 1.00 89.31
CARNEGIE MELLON UNIVERSITY 11 810 73.64 5 11 4 7.42 39.07
TAMPERE UNIV TECHNOLOGY 1 779 779 1 1 1 1.00 84.66
NET PERCEPT INCORPORATION 1 759 759 1 1 1 1.00 83.21
UNIVERSITY OF FRIBOURG 24 740 30.83 12 24 15 16.97 28.36
UNIVERSITY OF QUEENSLAND 5 734 146.80 3 5 1 3.87 47.59
CALIFORNIA STATE UNIVERSITY FULLERTON 2 732 366.00 2 2 1 2.00 64.47
UNIVERSITY OF SCIENCE & TECHNOLOGY CHINA 24 602 25.08 11 24 12 16.25 24.72
UNIVERSITY OF ELECTRONICS SCI & TECH CHINA 22 534 24.27 9 22 9 14.07 23.49
MASSACHUSETTS INSTITUTE OF TECHNOLOGY 8 498 62.25 5 8 5 6.32 31.41
Table 6: Most Productive and Most Cited Authors
Productive author by publication Productive author by citation
Author Name Total Publication Total Citation Author Name Total Citation Total Publication
Smyth, B 20 216 Blei, DM 2793 1
Liu, DR 18 291 Ng, AY 2793 1
Bobadilla, J 17 272 Jordan, MI 2793 1
Chen, L 17 91 Konstan, JA 2206 10
Polat, H 16 122 Riedl, JT 2189 6
Lee, JH 16 66 Herlocker, JL 2085 5
Jung, KY 16 55 Adomavicius, G 1849 6
Zhou, T 15 638 Tuzhilin, A 1827 4
Zhang, YC 15 582 Terveen, K 1160 1
Hernando, A 15 238 Miller, BN 848 2
Table 7: Discipline-wise Distribution of Research Output
Discipline Publications Cumulative Percentage Contribution*
Artificial Intelligence 766 766 44.82
Information Systems 392 1158 22.94
Engineering, Electrical & Electronic 301 1459 17.61
Theory & Methods 287 1746 16.79
Computer Engineering 255 2001 14.92
Operations Research & Management Science 242 2243 14.16
Software Engineering 178 2421 10.42
Telecommunications 86 2507 5.03
Interdisciplinary Applications 85 2592 4.97
Information Science & Library Science 75 2667 4.39
*Percentage of Contribution w. r. t. total 1,709 publications in WOS
Pranav Waila et al.: Scientometric Analysis of Recommender Systems Research
J Scientometric Res. | Jan–Apr 2016 | Vol 5 | Issue 1 79
Entree recommender system based on hybrid knowledge based technique.
Entree recommender system uses 14 level of implicit ratings to model user behavior. Another important review was done by[27] reviewed recommendation system literature from the point of evaluation metrics. The paper discusses various datasets, its properties, online and offline experi-ments. It discusses Coverage, Learning rate, Novelty and serendipity, confidence, user evaluation kind of less touched topics of recommender system.[28] presented a review on state of the art techniques and given future directions. Paper tabulates heuristic based and model based recommendation techniques to three recommenda-tion approaches Content based, Collaborative and hybrid techniques.
Apart from the reviews we found some highly cited papers in recommender system litrature which are worth mentioning.[29] Presented Tapestry information filtering system which supported both content based filtering and collaborative filtering. Intension was to provide a system where people can help each other with collaboration. This system was based on information retrieval concepts with client server architecture and Tapestry own query language.[30] News article recommendation system Grou-pLens, was first which involves ratings provided by user to old news. Ratings were in range from 1 to 5 where 1 means bad whereas 5 means good.[31] Discussed about rating sparcity and uses correlation for recommending news articles.[32] Presented a hybrid web page recom-mender system called FAB which uses 7 star rating system.
[33-345]ex$perimented on e-commerce related application data.[33] Experimented with neighborhood techniques and association rule on binary rating data.[34] Presented Amazon prospective and importance of item-item colla-borative filtering on long tailed datasets. Paper discusses importance of explicit rating, click through and conversion rate on e-commerce web-stores.[35] Model based recom-mendation algorithm to present top N recommendation to user.
[36-40]Worked on movie recommendation applications.[36] Presented nearest neighborhood technique to solve rating prediction problem.[37] Identified challenges such as sparsity and scalability issues with user based collaborative filtering and presented item based recommendation technique.Presented various model based recommendation algo-rithm which uses latent class variable technique in mixture settings.[39] Presented a new class of matrix factorization techniques for recommendation.[40] Presented various
techniques in two classes, memory based algorithms and model based algorithms. Under Memory based algorithm they discussed correlation based methods, vector similarity methods. Under model based algorithms they discussed cluster model and Bayesian network model. They evalu-ated the results with two metrics defined for two different kinds of applications; experiments were done on three datasets (MS Web, Television, Each Movie).
[41]Proposed social information filtering which exploits the concept of “word of mouth” i.e. Similarity of users taste can be used to recommend items to the users. Paper presents correlation based music recommender system technique where user has rated music items in 1-7 scale of rating.[42]Presented restaurant recommendation application using content based filtering, collaborative filtering, and demographic filtering.[43] Presented joke recommender system called Jester which introduces eigentaste algorithm for solving the problem, Eigen taste uses real valued rating for jokes.
Summary and Conclusion
We have performed a scientometric mapping of research on “Recommender System” from the inception of the research way back in 1992 to till date. The research output data from WoK is used for the mapping and detailed characterization of the “Recommender System” research. We have presented analytical outcomes for year-wise growth of research output, country-wise output, country-level international collaboration patterns and authorship type & collaboration.All these analytical outcomes include computation of standard scientometric parameter values, such as RGR, DT, CI, DC, CC, H-index, G-index, HG-index, P-index etc. We have also identified major contributors to “Recommender system” research in form of top journals publishing “Recommender system” research, top institutions contributing to the research and the most productive and most cited authors in the area. In addition to standard scientometric characterization, we have also adopted a text-analytics based approach to identify the disciplinewise research output on “Recom-mender system”. We identify the important control terms, plot them in a density plot and map the research out-put on the control terms. We also presented timeline based information gain study with entropy using citeSpace software, and provided top 20 references with citation burst in the dataset and a fish-eye view and the descrip-tion of important references. Overall, paper presents a comprehensive analysis and a detailed characterization of research in the area of “Recommender system”, which is very informative, useful and first of its kind on the theme.
Pranav Waila et al.: Scientometric Analysis of Recommender Systems Research
80 J Scientometric Res. | Jan–Apr 2016 | Vol 5 | Issue 1
Table 8: Controlled Term Based Output Analysis
Controlled Terms 1992-2000
2001-2005 2006 2007 2008 2009 2010 2011 2012 2013 2014 2015
recommendation system 4 71 9 28 49 53 42 63 97 125 77 37
collaborative filtering 9 75 8 26 34 37 35 50 52 0 66 16
personalization 0 17 4 7 13 5 6 11 11 10 7 2
e-commerce 0 17 1 5 9 8 9 5 7 8 6 1
content-based filtering 2 7 5 7 7 4 7 7 7 10 5 1
data mining 2 13 0 2 4 3 3 4 8 8 8 3
web 3 14 1 5 6 7 4 5 5 6 1 0
trust 0 2 2 4 3 7 4 7 6 5 9 2
context 0 5 1 2 1 1 5 9 2 7 10 6
group recommendation 0 0 0 0 1 4 1 5 2 6 22 5
agent 3 8 1 6 2 4 4 3 6 3 4 0
matrix factorization 0 0 0 0 0 1 2 5 5 7 11 2
user modelling 1 7 3 3 3 3 1 2 3 5 1 0
ontology 0 5 2 0 4 4 5 0 2 6 0 3
association rule 0 9 1 0 4 3 1 3 1 4 0 3
hybrid recommender system 0 0 1 3 1 3 4 1 4 8 2 1
information filtering 5 3 1 1 0 1 6 2 4 3 2 0
sparsity 0 3 1 1 0 3 1 3 3 3 9 1
information retrieval 3 10 0 2 2 3 2 2 0 0 1 1
cold start 0 0 1 0 3 1 0 2 4 5 6 3
machine learning 0 9 1 3 1 0 1 3 3 1 1 1
case-based reasoning 0 12 1 1 2 1 0 1 1 2 0 0
folksonomy 0 0 0 0 2 0 1 3 1 0 4 0
preference elicitation 0 1 0 1 0 0 1 1 4 3 0 0
graphical model 0 2 1 0 0 2 1 0 1 1 0 0
Table 9: Top 15 terms by entropy (calculated with citespace)
Terms Entropypersonalization 3.701789
data mining 3.674105
collaborative filtering 3.666978
information retrieval 3.661801
content-based filtering 3.640322
web 3.58252
information filtering 3.572624
retrieval 3.53424
recommender systems 3.51356
information 3.481822
e-commerce 3.470388
news 3.46328
models 3.447303
user modeling 3.431624
Experiments have shown a continuous research growth in recommender systems literature. It is also observed that United States is dominating in terms of publication though China also have contributed heavily in “Recom-mender system” research. We can see a close collabora-tion among asian countries. We can also easily infer that United States and China are contributing more than 30% of the total output. Among European countries Spain has shown greater collaboration. When we closely look the collaboration at Institute level, we find that stronger colla-borations are either at national level or intra-continental level. Biggest clique of authors found in collaboration network can also be seen at TC-CP plot near most productive axis. It is also observed that University of Minnesota tops the list of Institutions in terms of production and citation. On the other hand we can see Konstan JA is one among highest cited as well as highly productive

Pranav Waila et al.: Scientometric Analysis of Recommender Systems Research
J Scientometric Res. | Jan–Apr 2016 | Vol 5 | Issue 1 81
Figure 1: Research Output Trend
Figure 2(b): ICP Network from WOS Data (edges kept re-stricted to weight >3) (Institution)
Figure 2(a): ICP Network from WOS Data (edges kept re-stricted to weight >3) (Country)
Figure 2(c): ICP Network from WOS Data (edges kept re-stricted to weight > 3) (Author)
Figure 3: Most Productive Author Figure 4: Most Cited Author
Pranav Waila et al.: Scientometric Analysis of Recommender Systems Research
82 J Scientometric Res. | Jan–Apr 2016 | Vol 5 | Issue 1
Figure 7: Entropy plot
Figure 5: TP-TC Plot Figure 6: Term Density plot
Figure 8: Strongest Citation Burst

Pranav Waila et al.: Scientometric Analysis of Recommender Systems Research
J Scientometric Res. | Jan–Apr 2016 | Vol 5 | Issue 1 83
author who is affiliated with University of Minnesota. It is observed that “Agent”, “Case based Reasoning” and “Association rule” were more frequent controlled terms in initial days. In more recent literature of Recommender systems, “Group Recommendation”, “Trust”, “Matrix Factorization” and “Cold start” are more prominent words. The trend of control terms shows that the focus is shifting from restricted set of rule based approaches to challenges of high dimensionality and recommendation on bigger datasets. Overall the paper presents a compre-hensive mapping of research output in “Recommender system” research along with a detailed analysis and inferences.
ACKNOWLEDGEMENTS
Authors would like to thank DST-CIMS, BHU, Varanasi, for providing the facility to carry-out the research work.
CONFLICT OF INTEREST
There are no conflicts of interest.
REFERENCES
1. Ashraf Uddin and Vivek Kumar Singh. Mapping the computer science research in saarc countries. IETE Technical Review. 2014;31(4):287-96.
2. Ruimin Ma, Chaoqun Ni, and Junping Qiu. Scientific research competitiveness of world universities in computer science. Scientometrics. 2008;76(2):245-60.
3. Suresh Kumar and KC Garg. Scientometrics of computer science research in india and china. Scientometrics. 2005;64(2):121-32.
4. BM Gupta, Avinash Kshitij and Charu Verma. Mapping of indian computer science research output, 1999-2008. Scientometrics. 2010;86(2):261-83.
5. K Singhal, Banshal SK, Uddin A and Singh VK. The information technology knowledge infrastructure and research in south asia. Journal of Scientometric Research. 2014;3(3):134.
6. Karpagam R, Gopalakrishnan S, Ramesh BB, Natarajan M. Scientometric analysis of stem cell research: A comparative study of india and other countries. Collnet Journal of Scientometrics and Information Management. 2012;6(2):229-52.
7. Karpagam R, Gopalakrishnan S, Natarajan M, Ramesh BB. Mapping of nanoscience and nanotechnology research in india: a scientometric analysis, 1990-2009. Scientometrics. 2011;89(2):501-22.
8. Finardi U. Time relations between scientific production and patenting of knowledge: the case of nanotechnologies. Scientometrics. 2011;89(1):37-50.
9. Selen O, Zeid A, Sagar K. The structure and analysis of nanotechnology co-author and citation networks. Scientometrics. 2011;89(1):119-38.
10. Peter WL, Lars H, Sara LM, Stuart M, Julia C. The evolution of the international business field: a scientometric investigation of articles published in its premier journal. Scientometrics. 2011;88(1):17-42.
11. Mihail C, Alexander S, Ofir T. Exploring the management information systems discipline: a scientometric study of icis, pacis and asac. Scientometrics. 2011;87(1):1-16.
12. Diego CA, Minte-Vera CV. Scientometric analysis of freshwater fisheries in brazil: repeating past errors?. Reviews in Fish Biology and Fisheries. 2013;23(1):113-26.
13. Ivan J, Gorcin C, Knezevic-Jaric J, Mirjana L. Trends in fisheries science from 2000 to 2009: A bibliometric study. Reviews in Fisheries Science. 2012;20(2):70-9.
14. Jayashree B, Subbiah A. Mapping fish research in india. Current Science. 2000;79(5):613-20.
15. Ranganathan C, Balasubramani R. Mapping of green chemistry re-search in india: a scientometric analysis. Journal of Advances in Library and Information Science. 2013;2(4):221-9.
16. Garg KC, Kumar S, Bhatia VK, Ramasubramanian V, Amrender K, Jyoti K. Plant genetics and breeding research: Scientometric profile of selected countries with special reference to india. Annals of Library and Information Studies. 2011;58(2):184-97.
17. Deuk HP, Hyea KK, Il Young C, Jae KK. A literature review and classification of recommender systems research. Expert Systems with Applications. 2012;39(11):10059-72.
18. Meen CK, Chaomei C. A scientometric review of emerging trends and new developments in recommendation systems. Scientometrics. 2015;104:239-63.
19. Lawani SM. Quality, collaboration and citations in cancer research: A bibliometric study [phd thesis]. Florida: School of library science, Florida State University, 1980.
20. Krishnappa S. Bibliometric studies of research collaboration: A review. Journal of information Science. 1983;6(1):33-8.
21. Isola A, Burell Q, Jean T. Collaborative coefficient: A single measure of the degree of collaboration in research. Scientometrics. 1988;14(5-6):421-33.
22. Jorge EH. An index to quantify an individual’s scientific research output. Proceedings of the National academy of Sciences of the United States of America. 2005;102(46):16569-72.
23. Egghe L. Theory and practise of the g-index. Scientometrics. 2006;69(1):131-52.
24. Sergio A, Cabrerizo F, Herrera-Viedma E, Francisco H. hg-index: A new index to characterize the scientific output of researchers based on the h-and g-indices. Scientometrics. 2009;82(2):391-400.
25. Gangan P. The 100 most prolific economists using the p-index. Scientometrics. 2009;84(1):167-72.
26. Robin B. Hybrid recommender systems: Survey and experiments. User Modeling and User-Adapted Interaction. 2002;12(4):331-70.
27. Jonathan L H, Joseph AK, Loren GT, John TR. Evaluating collaborative filtering recommender systems. ACM Transactions on Information Systems (TOIS). 2004;22(1):5-53.
28. Gediminas A, Alexander T. Toward the next generation of recommender systems: A survey of the state-of-the-art and
Figure 9: Fisheye timeline for top cited references

Pranav Waila et al.: Scientometric Analysis of Recommender Systems Research
84 J Scientometric Res. | Jan–Apr 2016 | Vol 5 | Issue 1
possible extensions. Knowledge and Data Engineering, IEEE Transactions on. 2005;17(6):734-49.
29. David G, David N, Brian MO, Douglas T. Using collaborative filtering to weave an information tapestry. Communications of the ACM. 1992;35(12):61-70.
30. Paul R, Neophytos I, Mitesh S, Peter B, John R. Grouplens: an open architecture for collaborative filtering of netnews. In Proceedings of the 1994 ACM conference on Computer supported cooperative work, 175-186. ACM, 1994.
31. Joseph AK, Bradley NM, David M, Jonathan LH, Lee RG, John R. Grouplens: applying collaborative filtering to usenet news. Communications of the ACM. 1997;40(3):77-87.
32. Marko B, Yoav S. Fab: content-based, collaborative recomm-endation. Communications of the ACM. 1997;40(3):66-72.
33. Badrul S, George K, Joseph K, John R. Application of dimen-sionality reduction in recommender system - a case study. Technical report DTIC Document. 2000.
34. Greg L, Brent S, Jeremy Y. Amazon. com recommendations: Item-to-item collaborative filtering. Internet Computing IEEE. 2003;7(1):76-80.
35. Mukund D, George K. Item-based top-n recommendation algorithms. ACM Transactions on Information Systems (TOIS). 2004;22(1):143-77.
36. Jonathan LH, Joseph AK, Al Borchers, John R. An algorithmic framework for performing collaborative filtering. In Proceedings of
the 22nd annual international ACM SIGIR conference on Research and development in information retrieval, ACM, 230-237, 1999.
37. Badrul S, George K, Joseph K, John R. Item-based collaborative filtering recommendation algorithms. In Proceedings of the 10th international conference on World Wide Web. 285-295. ACM, 2001.
38. Thomas H. Latent semantic models for collaborative filtering. ACM Transactions on Information Systems (TOIS). 2004;22(1):89-115.
39. Yehuda K, Robert B, Chris V. Matrix factorization techniques for recommender systems. Computer. 2009;(8):30-7.
40. John SB, David H, Carl K. Empirical analysis of predictive algorithms for collaborative filtering. In Proceedings of the Fourteenth conference on Uncertainty in artificial intelligence. Morgan Kaufmann Publishers Inc. 1998;43-52.
41. Upendra S, Pattie M. Social information filtering: algorithms for automating word of mouth. In Proceedings of the SIGCHI conference on Human factors in computing systems, ACM Press/Addison-Wesley Publishing Co., 210-217, 1995.
42. Michael JP. A framework for collaborative, content-based and demo graphic filtering. Artificial Intelligence Review. 1999;13(5-6):393-408.
43. Goldberg K, Theresa R, Dhruv G, Chris P. Eigen-taste: A constant time collaborative filtering algorithm. Information Retrieval. 2001;4(2):133-51.
How to cite this article: Waila P, Singh VK and Singh MK. A Scientometric Analysis of Research in Recommender Systems. J Scientometric Res. 2016;5(1):71-84. Full text available at http://www.jscires.org/v5/i1