a sampling of emissions analysis techniques for ... · a sampling of emissions analysis techniques...
TRANSCRIPT

finalrep
A Sampling of EmissionsAnalysis Techniquesfor TransportationControl Measures
ortprepared for
Federal Highway Administration
prepared by
Cambridge Systematics, Inc.
under subcontract to
Louis Berger Associates
October 2000

final report
A Sampling of Emissions AnalysisTechniques for TransportationControl Measures
prepared for
Federal Highway Administration
prepared by
Cambridge Systematics, Inc.150 CambridgePark Drive, Suite 4000Cambridge, Massachusetts 02140
under subcontract to
Louis Berger Associates
October 2000

A Sampling of Emissions Analysis Techniques for Transportation Control Measures i
Table of Contents
1.0 Introduction .................................................................................................................... 1-11.1 Purpose and Motivation........................................................................................ 1-11.2 Structure of Report ................................................................................................. 1-2
2.0 Forecasting Approaches................................................................................................ 2-12.1 How CMAQ Projects Affect Emissions............................................................... 2-12.2 Standard Travel and Emissions Forecasting Models ........................................ 2-32.3 Forecasting Travel Impacts ................................................................................... 2-62.4 Forecasting Emissions Impacts............................................................................. 2-8
3.0 Selecting a Method ........................................................................................................ 3-1
4.0 Descriptions of Available Methods ........................................................................... 4-1
5.0 Key Inputs and Outputs for Each Method................................................................ 5-1
6.0 References ....................................................................................................................... 6-16.1 General Resources .................................................................................................. 6-16.2 Other Emissions Estimation Methodologies ...................................................... 6-16.3 Information on CMAQ/TCM Strategy Effectiveness ....................................... 6-2
7.0 List of Acronyms ............................................................................................................ 7-1

A Sampling of Emissions Analysis Techniques for Transportation Control Measures ii
List of Tables
2.1 Sample Emission Benefits of CMAQ-Type Projects in California ........................... 2-9
3.1 Summary of Methods Included .................................................................................... 3-3
3.2 Methods by Strategy Addressed .................................................................................. 3-4
3.3 Methods by Key Characteristic..................................................................................... 3-6
List of Figures
2.1 Analytical Process for Evaluating CMAQ Projects .................................................... 2-2
2.2 Distribution of VOC Emission Reductions, 1997 CMAQ Projects........................... 2-4
2.3 Distribution of CO Emission Reductions, 1997 CMAQ Projects.............................. 2-5
2.4 Distribution of NOx Emission Reductions, 1997 CMAQ Projects ........................... 2-5

A Sampling of Emissions Analysis Techniques for Transportation Control Measures 1-1
1.0 Introduction
���� 1.1 Purpose and Motivation
The Congestion Mitigation and Air Quality improvement (CMAQ) program, establishedunder the Intermodal Surface Transportation Efficiency Act of 1991 (ISTEA), is designedto assist regions in attaining ambient air quality standards by funding transportation proj-ects and programs to improve air quality.1 CMAQ funding is apportioned annually tostates, which then allocate funds to eligible areas within the state. The Federal HighwayAdministration (FHWA) and Federal Transit Administration (FTA) publish guidance onthe CMAQ program.2
CMAQ funds are intended to support projects that result in measurable reductions inemissions of carbon monoxide (CO), ozone precursors including volatile organic com-pounds (VOCs) and oxides of nitrogen (NOx), or particulate matter (PM). To show thatair quality objectives are being met, state and local governments must demonstrate thebenefits of individual CMAQ projects. An annual report is required from each state whichspecifies how CMAQ funds have been spent and the expected air quality benefits. Whilequantitative analysis is required whenever possible, a qualitative analysis is also consid-ered acceptable when project benefits cannot be quantified. Groups of projects may bealso analyzed in conjunction with each other when appropriate.3
This report describes modeling tools and other methods that can be used to assess theemissions benefits of projects applying for CMAQ funds. The methods described in thereport may be used by state and local planners to compare alternative projects to assist inselecting the most effective or cost-effective projects. They may also be used to quantifythe benefits of implemented projects for the purposes of CMAQ reporting.
The report is intended primarily for state or local air quality/transportation programanalysts, as well as for others interested in estimating the emissions benefits of CMAQprojects. Most of the methods in the report do not require an extensive background intravel or emissions modeling. A familiarity with basic transportation data sources, how-ever, can be helpful.
1 Specifically, the CMAQ program is designed under ISTEA to assist areas designated “non-attainment” or “maintenance” for ambient ozone and carbon monoxide levels, and is expandedunder TEA-21 to include areas with similar designations for particulate matter.
2“The Congestion Mitigation and Air Quality Improvement (CMAQ) Program Under theTransportation Efficiency Act for the 21st Century (TEA-21): Program Guidance.” Federal HighwayAdministration and Federal Transit Administration (April 1999). Internet: http://www.fhwa.dot.gov/environment/cmaq.htm.
3 Federal Register, February 23, 2000, p. 9052.
A Sampling of Emissions Analysis Techniques for Transportation Control Measures 1-2
The report includes a brief overview of 19 methods. The methods include pre-packagedand customizable software tools as well as worksheets or other procedures for calculatingbenefits. They collectively address a wide range of potential CMAQ projects, includingtravel demand management, traffic flow improvements, and vehicle and fuel technologystrategies. The report also includes references to other sources of information on CMAQprogram effectiveness.
Although project sponsors have been able to quantify benefits for a significant number ofCMAQ projects, in many cases appropriate data and modeling tools to quantify benefitsare not readily available. Nearly all of the public comments received on interim guidancefor the CMAQ program under TEA-21 emphasized the need for project evaluation andselection criteria that could quantify air quality benefits more accurately and encouragethe selection of the most cost-effective projects.4 This report is a response to the expressedneed for more widespread knowledge of methods to estimate the benefits of CMAQ projects.
A number of disclaimers are in order. First, inclusion of a particular method in thereport does not constitute its endorsement by FHWA or FTA. Conversely, failure toinclude a method does not imply that the method is not valid or should not be used. Theavailable methods vary in their technical approaches, assumptions, and underlying data.Limitations in existing data and the uncertainties inherent in both travel and emissionsforecasting mean that any analysis method should be applied carefully and judiciously.Care should be taken to utilize a method whose accuracy and required resources arecommensurate with the scale of the particular measure or measures being analyzed andthe magnitude of impacts expected.
���� 1.2 Structure of Report
Section 2.0 contains a review of forecasting approaches and issues in evaluating CMAQemissions benefits.
Section 3.0 is designed to assist the user in selecting a method. Methods are identified bythe types of CMAQ strategies addressed and by key characteristics such as level of effort.
Section 4.0 contains a brief overview of 19 specific forecasting methods. The overviewcovers data requirements, outputs, advantages, disadvantages, typical applications,related models, and the availability of each method.
Section 5.0 contains a listing of methods organized by strategy type, along with the pri-mary data inputs required and outputs produced for each strategy type.
Section 6.0 contains references that provide additional information on forecasting tech-niques or on evidence related to CMAQ project impacts.
Section 7.0 provides a list of acronyms referenced in the document. 4 Ibid.

A Sampling of Emissions Analysis Techniques for Transportation Control Measures 2-1
2.0 Forecasting Approaches
This section provides a basic overview of travel and emissions forecasting approaches.The overview is intended to assist the user in understanding the various analyticalapproaches that underlie the methods described in the document. The section firstreviews the effects of CMAQ strategies that lead to changes in emissions. Next, travel andemissions models commonly used in metropolitan transportation planning are discussed.These models represent the state of practice in travel and emissions forecasting at aregional level, and often serve as a source of data for other forecasting methods. Alterna-tive analytical approaches to forecasting travel and emissions impacts are then described.The methods documented in Section 4.0 typically utilize one or more of these analyticalapproaches.
���� 2.1 How CMAQ Projects Affect Emissions
The implementation of a CMAQ project (or any other transportation-related project) has aseries of effects, as shown in Figure 2.1. The effects depend upon the nature of the CMAQproject. A CMAQ project may be primarily: 1) a travel demand management (TDM) proj-ect affecting travel behavior (e.g., ridesharing, transit incentives); 2) a transportation sys-tems management (TSM) project affecting traffic flow (e.g., traffic signal timing, freewayramp metering); or 3) a strategy affecting vehicle or fuel technology (e.g., alternative-fuelvehicles).
For a TDM project, the effects can be described as follows:
1. The CMAQ project creates changes in trip patterns (e.g., total person-trips, origins anddestinations, mode share, time of day of travel);
2. Changes in trip patterns lead to changes in vehicle activity (e.g., total vehicle-trips,vehicle-miles of travel (VMT));
3. Changes in vehicle activity affect traffic flow characteristics, including travel speedsand acceleration characteristics; and
4. Changes in vehicle activity and traffic flow characteristics lead to changes in overallemissions.

A Sampling of Emissions Analysis Techniques for Transportation Control Measures 2-2
Figu
re 2
.1A
naly
tical
Pro
cess
for E
valu
atin
g C
MA
Q P
roje
cts
Stra
tegi
es
Trav
el D
eman
d M
anag
emen
t
Trip
Pat
tern
s (m
ode,
leng
th,
time
of d
ay…
)
Veh
icle
Act
ivity
(veh
icle
-trip
s,
vehi
cle-
mile
s of t
rave
l…)
Traf
fic F
low
(spe
ed, a
ccel
erat
ion)
Emis
sion
s
Tran
spor
tatio
n Sy
stem
s M
anag
emen
tEm
issi
ons
Traf
fic F
low
(spe
ed, a
ccel
erat
ion)
Veh
icle
/Fue
l Te
chno
logy
Emis
sion
s
Out
com
es

A Sampling of Emissions Analysis Techniques for Transportation Control Measures 2-3
For a TSM project, the resulting effects are as follows:
1. The CMAQ project affects traffic flow characteristics, such as speed and acceleration; and
2. The resulting changes in vehicle speed and acceleration in turn affect the emissionrates of vehicles.
For example, a signal coordination project can smooth vehicular flow, thus reducingacceleration and deceleration, which in turn reduces emissions.
Vehicle and fuel technology-based CMAQ strategies do not affect travel demand or trafficflow, but instead affect overall emission levels by changing the emissions characteristics ofvehicles.
Some of the methods documented in this report use various assumptions to simplify theanalysis procedure, such as estimating vehicle trip and VMT changes directly from CMAQproject implementation, or ignoring any changes in traffic flow characteristics that mayresult from demand management strategies. Other methods have a limited focus in thatthey only estimate travel impacts or only convert travel into emissions impacts. Thesemethods are documented because they provide a valid analytical approach that canreadily be applied in conjunction with other approaches. For example, the FHWA TDMEvaluation model provides a sound methodology for estimating VMT changes from TDMprojects, but does not estimate emissions changes. To estimate emissions changes, theuser would apply trip and/or VMT-based emission factors to the model output.
���� 2.2 Standard Travel and Emissions Forecasting Models
The “benchmark” for travel forecasting in regional transportation planning is an analysistool known as the “four-step model” or “regional travel model.” Most metropolitan plan-ning organizations (MPOs) have a travel model that is specifically developed for theirregion. The basis for the regional travel model is the division of the urban area into trafficanalysis zones (TAZs), and the definition of a network of transportation facilities con-necting the zones. The network is described by the time and cost of travel, for each mode,between each pair of zones. Inputs include proposed future transportation networks andforecast population and employment characteristics by zone. Travel survey data andmathematical models are then used to predict the number of trips generated in each zone,the distribution of these trips (origin and destination zones), modal shares, and the routestaken for trips.
Travel models are typically used in developing an area’s long-range transportation plan topredict future traffic volumes, based on changes in development and travel patterns, andto compare forecast volumes to roadway capacities to identify deficiencies and needs.They are good for predicting the results of major projects such as new or expanded facili-ties, but are not well-suited for analyzing small-scale operational projects such as inter-section improvements.

A Sampling of Emissions Analysis Techniques for Transportation Control Measures 2-4
Range of Emission Reductions from CMAQ Projects
The reported benefits from past CMAQ projects can illustrate the range of emissionreductions that may be expected. Figure 2.2 shows the frequency distribution of VOCreductions for CMAQ projects funded in 1997. (These are self-reported benefits; also,some projects did not report quantitative benefits and are not reflected in this figure.) Themajority of projects resulted in VOC reductions of less than 10 kilograms per day(kg/day), with most of the remainder falling between 10 and 100 kg/day. The medianbenefit was 5.2 kg/day. Figures 2.3 and 2.4 illustrate the range of benefits for CO andNOx. The median reported benefits were 37 and 4.0 kg/day, respectively. CO benefitsare typically higher because CO emission rates from vehicles are higher than for VOC orNOx.
For a metropolitan area with a population of one million, total daily VOC emissions frommobile sources might be on the order of 25,000 to 30,000 kg. The regional impact of anindividual “median” CMAQ project would therefore be on the order of 0.02 percent. Thisis not to diminish the benefit of the CMAQ project, but rather to place it in a regional per-spective. Multiple projects, or projects with a broader scope, would of course result in alarger percentage reduction in regional emissions.
Figure 2.2 Distribution of VOC Emission Reductions, 1997 CMAQ Projects*
Emission Reductions (kg/day)
0
50
100
150
200
250
300
350
< = 1 >1 - 10 >10 - 100 >100 - 1,000 >1,000 - 10,000 > 10,000
Number of Projects
*Note: Emission benefits are self-reported. Only projects reporting quantitative benefits are included.

A Sampling of Emissions Analysis Techniques for Transportation Control Measures 2-5
Figure 2.3 Distribution of CO Emission Reductions, 1997 CMAQ Projects*
Number of Projects
0
50
100
150
200
< = 1 >1 - 10 >10 - 100 >100 - 1,000 >1,000 - 10,000 > 10,000
Emission Reductions (kg/day)
*Note: Emission benefits are self-reported. Only projects reporting quantitative benefits are included.
Figure 2.4 Distribution of NOx Emission Reductions, 1997 CMAQ Projects*
0
50
100
150
200
250
< = 1 >1 - 10 >10 - 100 >100 - 1,000
>1,000 - 10,000
> 10,000
Emission Reductions (kg/day)
Number of Projects
*Note: Emission benefits are self-reported. Only projects reporting quantitative benefits are included.

A Sampling of Emissions Analysis Techniques for Transportation Control Measures 2-6
CMAQ strategies that can be translated into changes in the number of vehicle-trips byTAZ (i.e., an area-wide employer trip reduction strategy) or changes in transportationnetwork characteristics (i.e., new transit service between two points) can be analyzedusing the MPO’s standard regional travel model. This requires working with the MPOtravel forecasting staff and also may require a significant level of effort to develop appro-priate inputs and run the model. The advantage of this approach is that changes in vehi-cle miles of travel and speeds are identified across the entire transportation network.
Once outputs of the travel model are obtained, emission factors (expressed in grams permile or grams per trip) can be applied to VMT and/or vehicle-trips by vehicle type andspeed. The standard model used to develop emission factors is EPA’s MOBILE model. (Arelated EPA model, PART5, is used to develop emission factors for particulate matter. InCalifornia, the Air Resources Board’s EMFAC model is used in place of MOBILE.) Emis-sion factors are typically developed by the State DOT, MPO, and/or air quality agencyusing locality-specific data describing the mix of vehicles, fuel characteristics, inspectionand maintenance (I/M) program, and other factors that influence emissions. MOBILEfactors can be applied to travel model output using a spreadsheet; software programshave also been written to automate the processing of travel model outputs and emissionfactors.1
Even if they are not used directly in assessing CMAQ strategy benefits, data and method-ologies from regional travel and emission models play an important role in CMAQevaluation strategies. For example, the Metropolitan Washington Council of Governmentshas used its mode choice model independently of the four-step model to analyze a rangeof TCM strategies (FHWA, 1995). Elasticities are sometimes obtained from model coeffi-cients. Trip tables and network data from the regional travel model can be used to obtainaverage trip lengths for a particular area.
CMAQ evaluation methods that calculate emissions should be able to incorporate locality-specific emission factors as developed using MOBILE or EMFAC. These locality-specificemission factors generally can be obtained from the MPO, state DOT, or state environ-mental agency.
���� 2.3 Forecasting Travel Impacts
Forecasting travel behavior impacts is typically the most difficult part of CMAQ projectanalysis. A TDM strategy in particular can have a wide range of effectiveness based onthe details of the strategy and its implementation context. The analyst should carefullyconsider the underlying data and analytical approaches utilized in the chosen method(s).
1 Examples include the Post Processor for Air Quality (PPAQ) model developed by GarmenAssociates for the New Jersey DOT, and the Surface Transportation Efficiency Analysis Model(STEAM) developed by FHWA.

A Sampling of Emissions Analysis Techniques for Transportation Control Measures 2-7
Typical approaches to estimating travel behavior and demand impacts include:
• Surveys that assess the likely or actual impacts of a CMAQ project. For example, asurvey of employees at a suburban employment site may be performed to determinehow many people expect to use or have actually used a rideshare matching service.Surveys that provide adequate data for forecasting purposes are difficult to conduct.On the other hand, pre- and post-implementation surveys of actual travel behavior areoften both feasible and necessary if the effectiveness of a CMAQ project is to be evalu-ated retrospectively.
• Experience from other areas. For example, a study may have found that five percentof office workers will telecommute one day a week if provided the opportunity. This isthe simplest methodology to apply and can be used to assess programs that cannot bedescribed in a quantitative manner (i.e., travel time and cost changes). It involves con-siderable risks, however, in assuming that results can be transferred from one situationto another.
• Elasticities. An elasticity says that an X percent change of an input variable (e.g., thecost of parking) produces a Y percent change of an output variable (e.g., drive-alonemode share). Elasticities may be developed from direct observation or from coeffi-cients of a model such as a mode choice model. While they can account for differentlevels of the input variable, they are not necessarily valid outside the range for whichthey were developed. For example, an increase in the cost of parking from $0.00 to$1.00 is an infinite percentage change, producing meaningless results. Also, elasticitiesdeveloped in one setting cannot necessarily be assumed accurate in another setting.
• Logit or pivot-point model. The logit model is a mathematical equation that predicts aparticular choice (i.e., auto versus transit mode) as a function of differences in time,cost, or other quantifiable variables affecting travel. Logit mode choice models aretypically developed from travel survey data as part of the four-step travel forecastingprocess. The pivot-point model is a derivative of the logit model with simpler inputdata requirements. The pivot-point model has the advantage that it requires only aknowledge of baseline mode shares and changes in travel time and cost. (Baseline traveltime and cost information is not required because this information is fully reflected inthe baseline mode share.) Logit-based models can account for the interaction of multi-ple factors, i.e., changing the time and cost of travel simultaneously.
Beyond the direct travel impacts of a CMAQ strategy, induced and offsetting travel mayalso be of interest to the analyst. Under some circumstances, the total travel and emissionreductions resulting from CMAQ strategies may be less than the nominal reductionsbased on the specific vehicle-trips eliminated. Offsetting travel increases may come fromtwo primary sources. The first is additional vehicle-travel by the same traveler or othermembers of the household. For example, a telecommuter may make an additional tripfrom home during the day to run an errand they would normally have run in conjunctionwith a work trip. The second is a “general” induced demand effect, in which reductions innetwork travel times (as a result of reduced vehicle-trips or improved traffic flow) arepartially offset by additional travel resulting from the improved network performance.Induced travel may therefore occur as a result of TSM as well as TDM measures. A few of

A Sampling of Emissions Analysis Techniques for Transportation Control Measures 2-8
the models in this guidebook include factors to account for various types of induced andoffsetting travel. Appropriate data on these factors, however, can be difficult to develop.
Another important consideration is interaction among strategies. Some strategies maycomplement each other (e.g., parking management and ridesharing incentives), leading tocumulative effects greater than the sum of the effects of the strategies if applied individu-ally. Conversely, in some cases the effects of multiple programs may be smaller than thesum of their individual effects. For example, some TDM projects may compete for thesame market of travelers, thus leading to diminishing returns as more projects are imple-mented. Except where noted, the methods described in this report typically do notaccount for the interactive effects of multiple strategies.
���� 2.4 Forecasting Emissions Impacts
To translate travel changes into emissions changes, emission factors (i.e., grams per mileor grams per trip) are typically applied to changes in VMT and vehicle-trips. In somemethods, emission factors may vary according to vehicle speed and/or vehicle type.
A number of important analytical issues arise in translating travel impacts into emissionsimpacts, or in forecasting the emissions impacts of traffic flow improvements. Some of themost noteworthy include:
• Trip-end versus VMT (distance)-based emission factors. Emissions at the beginningof a vehicle-trip are typically much higher than emissions later in the trip when thevehicle has warmed up. Therefore, some emission forecasting approaches applyseparate trip-based and VMT (distance)-based emission factors. EPA’s MOBILE5model – the current source of emission factors in most areas – does not calculate tripand VMT-based emission factors separately; instead, cold-start and hot-start emissionsare embodied in the VMT-based factor. As a result, the use of standard MOBILE emis-sion factors will overestimate the benefits of strategies that do not reduce trips, but onlyaffect trip lengths (i.e., park-and-ride), and conversely, will underestimate the benefitsof strategies that reduce short trips (i.e., bicycle/pedestrian facilities). CARB’s EMFACmodel produces both trip-based and VMT-based emission factors, as will EPA’supcoming MOBILE6 model. Procedures have also been developed for identifyingseparate trip and VMT-based factors from MOBILE5. A few methodologies also con-sider emissions from work and non-work trips separately, under the assumption thathot versus cold start percentages differ between the two types of trips.
• Traffic speed/flow impacts on emissions. CMAQ strategies such as signal timing andramp metering affect the speeds at which vehicles travel on different facilities or affectother characteristics of traffic flow such as idle times and acceleration rates. The way inwhich a vehicle is operated can have a significant effect on emissions. Vehicles typi-cally emit pollution at higher rates (in grams per mile) at extremely low or high speedsor under hard acceleration.

A Sampling of Emissions Analysis Techniques for Transportation Control Measures 2-9
Speed changes are typically assessed through equations relating traffic speed to vol-umes and facility characteristics such as capacity. Such equations are embodied withinthe regional travel model (see Section 2.2), and may also be applied independently forfacility-level analysis. As an alternative, some sketch-planning approaches apply elas-ticities of average travel speed versus total area-wide VMT. Standard emission factormodels such as MOBILE and EMFAC produce emission rates as a function of vehiclespeed.2 By applying speed-based emission factors, the emission impacts of strategiesaffecting traffic flow can be estimated to some extent.
The speed-based approach, however, does not account for changes in acceleration oridle characteristics, as might be expected from (for example) a signal timing project. Tomodel traffic flow and emission impacts with greater precision, traffic simulation mod-els are typically used. These models, which simulate actual traffic flows, incorporateemission factors that are based on both speed and acceleration rates.
• Time-of-day shifting. Some TDM strategies, notably shifted work hours and tele-commuting, may affect the time during which trips are taken as well as the total num-ber of vehicle-trips. Shifting trips from the peak to off-peak periods can affect totalemissions by changing the speeds at which these trips are taken. Modeling of the emis-sions impacts of strategies that affect the time of travel requires a knowledge of thespeed characteristics of vehicular travel during the peak and off-peak periods (as dis-cussed above).
• Vehicle type. In addition to fleet-average factors, MOBILE and EMFAC produce emis-sion factors for different types of vehicles, such as passenger cars, light trucks, andheavy trucks. Emission factors are typically higher for heavier classes of vehicles.While some CMAQ strategies, such as traffic flow improvements, will affect all types ofvehicles, others, including most travel demand management strategies, will primarilyaffect passenger car and light truck travel. Emission factors used in the CMAQ analysisshould reflect the general composition of the vehicle fleet affected by the strategy.
2 These rates are meant to represent emissions from a typical driving cycle performed at a givenaverage speed, rather than operation of the vehicle at a constant speed.

A Sampling of Emissions Analysis Techniques for Transportation Control Measures 2-10
3 ROG (reactive organic gases) is similar to VOC (volatile organic compounds).
Example: California Air Resources Board Project Evaluation
In 1995, the California Air Resources Board (CARB) evaluated a number of emissionreduction projects funded by state motor vehicle registration fees. The projects ana-lyzed are similar to the types of projects commonly implemented under the CMAQprogram. TDM projects were evaluated using transit or workplace-based surveydata, in conjunction with the “California standardized methodology” described inthis report. TSM projects were evaluated based on before and after travel speeds.Alternative fuel vehicle projects were evaluated based on various assumptions aboutemission rates and vehicle utilization.
The estimated VOC emission reductions for various types of strategies are shown inTable 2.1. Average benefits for the 18 projects are roughly 6.0 kg/day for reactiveorganic gases (ROG)3 and 9.0 kg/day for NOx. The evaluation report illustrates thata range of emission benefits might be expected, even for similar types of projects,depending upon the specific details of the project. While these results illustrate theorder of magnitude of emission reductions that might be expected, it should be notedthat overall effectiveness may not correspond directly to cost-effectiveness. Forexample, a project with low total emission reductions could be cost-effective if totalcosts were also low.
Table 2.1 Sample Emission Benefits of CMAQ-Type Projects in California
Average Benefits (kg/day)Project Type Number of Projects ROG NOx
Alternative Fuel Buses 3 1 36
Bicycle Facilities 2 1 0
Electric Vehicles 2 0 2
Employer Trip Reduction 3 16 14
Telecommunications 3 1 1
Traffic Signal Timing 2 13 2
Transit (Shuttle) 3 6 2
All Projects 18 6 9
Source: California Air Resources Board. “Evaluation of Selected Projects Funded by MotorVehicle Registration Fees.” Sacramento, CA (1995). Annual benefits from this reportwere converted to daily benefits using an annualization factor of 260, since mostprojects are worksite-based.

A Sampling of Emissions Analysis Techniques for Transportation Control Measures 3-1
3.0 Selecting a Method
This section provides summary information on each method that should assist the user inselecting an appropriate method. The methods are loosely placed in four groups, asfollows:
1. Off-the-shelf TDM/TCM analysis software. These are software packages that can beacquired for free or at a low cost. They have been designed to analyze a variety ofstrategies aimed at reducing travel impacts (TDM programs) and/or reducing emis-sions (TCM programs). While the software itself is readily available, the user mustgenerally obtain locality-specific data from the MPO.
2. Customized TDM/TCM analysis software. These software packages have similarobjectives as those in category 1, but require some customization of the software toapply locally. As a result, a greater initial investment is required to develop themodel. The benefits may include greater accuracy and ease of use, since the modelscan be tailored to local data and needs.
3. Sketch-plan workbook approaches. These are not software packages, but instead areworksheets or examples of calculations by other agencies to assess the emissionimpacts of CMAQ-type projects. They may cover strategies not addressed by existingsoftware packages, but they can become cumbersome to apply for multiple projects.
4. Specialized software tools and methods. These are software packages or methodsdesigned to analyze one or more specific strategy types. While the methods addressonly a limited set of CMAQ strategies, they generally address these strategies withgreater depth and accuracy than more general models. The range of customizationand level of effort in this group varies significantly.
Table 3.1 summarizes each of the 19 methods. Table 3.2 identifies the types of CMAQstrategies addressed by each method. Table 3.3 provides a summary analysis of some keycharacteristics of each method, including:
• Availability, or the cost and level of effort in obtaining the model in a format that canbe applied locally to analyze strategies;
• Ease of application, or the level of effort in using the model and in obtaining any datanecessary to analyze specific programs;
• Technical robustness, or the validity or accuracy of the underlying data and computa-tional techniques embedded in the model;
• Range of strategies addressed, or the extent to which a single model is capable of ana-lyzing a broad range of CMAQ strategies; and

A Sampling of Emissions Analysis Techniques for Transportation Control Measures 3-2
• Self-sufficiency, or the extent to which the method is capable of addressing the variousanalytical steps required, including the estimation of both travel benefits and resultingemission changes as a result of project implementation.
To further assist the user of this report, Section 5.0 provides a listing of methods by type ofstrategy addressed. For each method, the basic inputs required to describe the strategyare identified (e.g., for transit service, percent change in transit fare or frequency of serv-ice). This should assist the user in identifying whether the model is capable of evaluatingthe specific strategies proposed for CMAQ funding.

A Sampling of Emissions Analysis Techniques for Transportation Control Measures 3-3
Table 3.1 Summary of Methods Included*
Method Description
Off-the-Shelf TDM/TCM Analysis SoftwareTDM Evaluation Model Software to predict trip and VMT impacts of employer-based TDM
strategies.TCM/Commuter Choice Model Spreadsheet software based on TDM Evaluation Model; also calculates
emissions.TCM Analyst Spreadsheet software to estimate travel and emission impacts of TCMs.CM/AQ Evaluation Model Software for estimating emission benefits and cost-effectiveness of
potential CMAQ projects and for ranking projects.CUTR_AVR (Center for Urban Transportation Research Average Vehicle Ridership
model) Model to predict AVR impacts of workplace-based TDMprograms.
Customized TDM/TCM Analysis SoftwareTCM Tools Spreadsheet model for screening and sensitivity testing of a wide
range of TCM strategies at an area-wide level.Off-Net/PAQONE Models to predict emissions impacts of various transit, non-motorized
travel, and traffic flow strategies.ECO/Regulation XV Software Software to help employers predict benefits of and track participation
in Employee Commute Options (ECO) programs.Sketch-Plan Workbook ApproachesCalifornia Standardized Methodology Calculation steps to estimate emissions reductions and cost-
effectiveness of TDM programs, based on survey data on mode shares.RAQC Workbook Workbook to estimate potential benefits of various TDM strategies
applied at a regional level.MWCOG Sketch-Planning Methods Sample calculations by the Metropolitan Washington Council of
Governments (MWCOG) for various TCM strategies.NCTCOG Sketch-Planning Methods Sample calculations and empirical data from North Central Texas
Council of Governments (NCTCOG) for TDM and traffic flowstrategies.
Specialized MethodsQuick HOV Procedures and software to analyze impacts of HOV facilities.IDAS (Intelligent Transportation Systems (ITS) Deployment Analysis
System) Software to analyze travel and emissions impacts of over 60ITS strategies, based on regional travel model data.
SMART (Simplified Model for the Assessment of Regional Travel) Software toestimate air quality impacts of highway and transit networkimprovements.
Traffic Simulation Models Commercial software for analyzing traffic flow and emissions impactsof intersection and roadway operational improvements.
AirCred Model for estimating emissions benefits of alternative fuel light-dutyand transit vehicles.
Bus Replacement Spreadsheet Spreadsheet for analyzing replacements of older buses with newdiesel or alternative fuel buses.
Freight Air Quality Analysis Procedures Report containing methods and procedures for assessing emissionsimpacts of freight strategies.
* See Section 7.0 for a list of acronyms.

A Sampling of Emissions Analysis Techniques for Transportation Control Measures 3-4
Tabl
e 3.
2M
etho
ds b
y St
rate
gy A
ddre
ssed
*
Dem
and
Man
agem
ent
Met
hod
Tran
sit
HO
VLa
nes
Park
’n’
Rid
eC
ar/V
anPo
olEm
p-ba
sed
TDM
Bike
&Pe
d.Tr
avel
erIn
foTe
leco
m/
Wor
k H
rs.
Pric
ing/
Subs
idy
Land
Use
Park
ing
Mgm
t.
Off-
the-
Shel
f TD
M/T
CM A
naly
sis
Soft
war
eTD
M E
valu
atio
n M
odel
XX
XX
XX
TCM
/Com
mut
er C
hoic
e M
odel
XX
XX
XX
XTC
M A
naly
stX
XX
XX
XC
M/A
Q E
valu
atio
n M
odel
XX
XX
XX
XX
XC
UTR
_AV
RX
XX
Cust
omiz
ed T
DM
/TCM
Ana
lysi
s So
ftw
are
TCM
Too
lsX
XX
XX
XX
XX
OffN
et/P
AQ
ON
EX
XX
ECO
/Reg
ulat
ion
XV S
oftw
are
XX
XX
XX
Sket
ch-P
lan
Wor
kboo
k A
ppro
ache
sC
alifo
rnia
Std
. Met
hodo
logy
XX
XX
XX
RAQ
C W
orkb
ook
XX
XX
XX
XX
XM
WC
OG
Ske
tch-
Plan
ning
Met
hods
XX
XX
XX
XN
CTC
OG
Ske
tch-
Plan
ning
Met
hods
XX
XX
XSp
ecia
lized
Met
hods
Qui
ck H
OV
XID
AS
XSM
ART
XX
XX
Traf
fic S
imul
atio
n M
odel
sA
irC
red
Bus
Repl
acem
ent S
prea
dshe
etFr
eigh
t Air
Qua
lity
Ana
lysi
s Pro
cedu
res
* N
ote:
Incl
usio
n of
any
par
ticul
ar s
trat
egy
in t
his
tabl
e, o
r el
sew
here
in t
his
repo
rt, d
oes
not
nece
ssar
ily im
ply
that
the
str
ateg
y is
elig
ible
for
CM
AQ
pro
ject
fund
ing.

A Sampling of Emissions Analysis Techniques for Transportation Control Measures 3-5
Tabl
e 3.
2M
etho
ds b
y St
rate
gy A
ddre
ssed
* (c
ontin
ued)
Traf
fic
Flow
and
Veh
icle
/Fue
l Tec
hnol
ogy
Met
hod
Traf
fic
Flow
Inci
dent
Mgm
t.Fr
eigh
t/Int
erm
odal
Traf
fic
Cal
min
gId
le C
ontr
olA
lt. F
uel V
ehic
les
Off-
the-
Shel
f TD
M/T
CM A
naly
sis
Soft
war
eTD
M E
valu
atio
n M
odel
TCM
/Com
mut
er C
hoic
e M
odel
TCM
Ana
lyst
XC
M/A
Q E
valu
atio
n M
odel
XX
XX
XX
CU
TR_A
VR
Cust
omiz
ed T
DM
/TCM
Ana
lysi
s So
ftw
are
TCM
Too
lsX
OffN
et/P
AQ
ON
EX
ECO
/Reg
ulat
ion
XV S
oftw
are
Sket
ch-P
lan
Wor
kboo
k A
ppro
ache
sC
alifo
rnia
Std
. Met
hodo
logy
RAQ
C W
orkb
ook
MW
CO
G S
ketc
h-Pl
anni
ng M
etho
dsX
NC
TCO
G S
ketc
h-Pl
anni
ng M
etho
dsX
XSp
ecia
lized
Met
hods
Qui
ck H
OV
XID
AS
XX
SMA
RTX
Traf
fic S
imul
atio
n M
odel
sX
Air
Cre
dX
Bus
Repl
acem
ent S
prea
dshe
etX
Frei
ght A
ir Q
ualit
y A
naly
sis P
roce
dure
sX
* N
ote:
Incl
usio
n of
any
par
ticul
ar s
trat
egy
in t
his
tabl
e, o
r el
sew
here
in t
his
repo
rt, d
oes
not
nece
ssar
ily im
ply
that
the
str
ateg
y is
elig
ible
for
CM
AQ
pro
ject
fund
ing.

A Sampling of Emissions Analysis Techniques for Transportation Control Measures 3-6
Tabl
e 3.
3M
etho
ds b
y K
ey C
hara
cter
istic
*
Met
hod
Ava
ilabi
lity
Ease
of
App
licat
ion
Tech
nica
lR
obus
tnes
sR
ange
of
Stra
tegi
esSe
lf-s
uffi
cien
cy
Off-
the-
Shel
f TD
M/T
CM
Ana
lysi
s So
ftw
are
TDM
Eva
luat
ion
Mod
el4
34
42
TCM
/Com
mut
er C
hoic
e M
odel
54
34
5TC
M A
naly
st4
22
44
CM
/AQ
Eva
luat
ion
Mod
el4
42
54
CU
TR_A
VR
55
42
2C
usto
miz
ed T
DM
/TC
M A
naly
sis
Soft
war
eTC
M T
ools
34
25
4O
ff-N
et/P
AQ
ON
E3
43
45
ECO
/Reg
ulat
ion
XV S
oftw
are
13
44
2Sk
etch
-Pla
n W
orkb
ook
App
roac
hes
Cal
iforn
ia S
tand
ardi
zed
Met
hodo
logy
44
34
2RA
QC
Wor
kboo
k4
32
55
MW
CO
G S
ketc
h-Pl
anni
ng M
etho
ds4
32
54
NC
TCO
G S
ketc
h-Pl
anni
ng M
etho
ds4
32
44
Spec
ializ
ed M
etho
dsQ
uick
-HO
V4
25
15
IDA
S4
15
25
SMA
RT1
25
25
Traf
fic S
imul
atio
n M
odel
s3
15
25
Air
Cre
d5
54
15
Bus
Repl
acem
ent S
prea
dshe
et5
44
15
Frei
ght A
ir Q
ualit
y A
naly
sis
Proc
edur
es5
14
13
* N
ote:
5 =
Hig
h/G
ood,
1 =
Low
/Poo
r.

A Sampling of Emissions Analysis Techniques for Transportation Control Measures 4-1
4.0 Descriptions of AvailableMethods
This section provides a one- to two-page description of the following 19 methods. Refer toTable 3.1 for a one-sentence overview of each method.
Method Page Number
Off-the-Shelf TDM/TCM Analysis SoftwareTDM Evaluation Model 4-2TCM/Commuter Choice Model 4-3TCM Analyst 4-4CM/AQ Evaluation Model 4-6CUTR_AVR 4-7
Customized TDM/TCM Analysis SoftwareTCM Tools 4-8Off-Net/PAQONE 4-9ECO/Regulation XV Software 4-10
Sketch-Plan Workbook ApproachesCalifornia Standardized Methodology 4-11RAQC Workbook 4-12MWCOG Sketch-Planning Methods 4-13NCTCOG Sketch-Planning Methods 4-14
Specialized MethodsQuick HOV 4-15IDAS 4-16SMART 4-17Traffic Simulation Models 4-18AirCred 4-20Bus Replacement Spreadsheet 4-21Freight Air Quality Analysis Procedures 4-22

A Sampling of Emissions Analysis Techniques for Transportation Control Measures 4-2
TDM Evaluation Model
Overview – The TDM Evaluation Model is asoftware program that analyzes the vehicle-trip reduction effects of a wide range oftravel demand management strategies. TheTDM model has been widely appliedthroughout the U.S. for the purpose of ana-lyzing Transportation Control Measures orother TDM programs.
Strategies Addressed – Improved transit;HOV lanes; carpooling and vanpooling promotion; telecommute and work hour strate-gies; pricing and subsidies.
Methodology – Strategies that affect the time and/or cost of travel are evaluated using a“pivot-point” mode choice model. The pivot point model is a derivative of the logit modechoice model commonly used in four-step travel demand models. It requires informationon baseline mode shares and changes in travel time or cost. Other strategies, such asemployer-based support programs and work hour shifts, are evaluated using lookuptables based on empirical evidence.
Data Requirements – Baseline travel data requirements include zone-to-zone person andvehicle trip tables for the analysis area (these may be derived from the regional travelmodel or constructed from employee commute survey data), or total person and vehicletrips for an individual site/area. Other data requirements include impacts of strategies ontravel time and cost by mode and descriptions of other (non-time/cost-based) TDM pro-grams. The user has the option to change default parameters affecting strategy effectiveness.
Outputs – Changes in modal share, vehicle-trips, VMT, average vehicle occupancy andridership.
Level of Effort – The TDM model is easy-to-use, off-the-shelf software. Some effort isrequired to develop inputs in the form of matrices showing the number of trips by modeand the distance between each pair of zones.
Advantages – The logit-based pivot point mode choice approach is theoretically sound,consistent with common practice in travel demand forecasting, and capable of analyzingthe joint impacts of time and cost-based strategies. The empirical lookup tables allow fordifferences in impacts by size and type of employer. Trip-table inputs allow “marketsegmentation” by origin/destination, and impacts vary for each “market” dependingupon trip lengths and starting mode shares.
Limitations – The TDM model does not estimate emissions benefits directly. The usermust apply VMT and/or trip-based emission factors. The default coefficients and data onstrategy effectiveness in the TDM model date from around 1990 or earlier.
Source/Availability – The TDM Evaluation Model is a DOS-based software program. It isdistributed by McTrans (352-392-0378, [email protected]) at a cost of $250.
Low High
AvailabilityEase of applicationTechnical robustnessRange of strategiesSelf-sufficiency

A Sampling of Emissions Analysis Techniques for Transportation Control Measures 4-3
TCM/Commuter Choice Model
Overview – The TCM/Commuter ChoiceModel is a spreadsheet-based software pro-gram developed for the EPA. It is designedspecifically to analyze the travel and emis-sion impacts of employer-based voluntarytravel demand management strategies.
Strategies Addressed – Improved transit;HOV lanes; carpooling and vanpoolingpromotion; bicycle and pedestrian programs;telecommute and work hour strategies; pricing and subsidies.
Methodology – The data and methodologies used to estimate travel impacts are similar tothose in the TDM Evaluation Model. Strategies that affect the time and/or cost of travelare evaluated using a “pivot-point” mode choice model. Other strategies, such asemployer-based support programs and work hour shifts, are evaluated using lookuptables based on empirical evidence. Emission changes are based on changes in trips,VMT, and speed, using lookup tables derived from MOBILE5a.
Data Requirements – Total persons affected, baseline mode shares, and average triplengths by mode for an individual site or area; impacts of the strategy on changes in traveltime and cost by mode; and description of other (non-time/cost-based) TDM programs.The user has the option to change default parameters.
Outputs – Changes in modal share, vehicle-trips, VMT, and emissions.
Level of Effort – The TCM/Commuter Choice Model is easy-to-use, off-the-shelf soft-ware. Some effort may be required to identify reasonable assumptions on baseline modeshares, trip lengths, and affected employment for the analysis area.
Advantages – The logit-based pivot point mode choice approach is theoretically sound,consistent with common practice in travel demand forecasting, and capable of analyzingthe joint impacts of multiple strategies. The empirical lookup tables allow for differencesin impacts by size and type of employer.
Limitations – Some of the default data on strategy effectiveness date from around 1990 orearlier. The model is not directly capable of analyzing multiple “market segments.” Theability of the software to manage scenarios is limited.
Source/Availability – The EPA TCM/Commuter Choice Model was developed in 1998. Itcan be downloaded at no charge from the EPA’s Office of Transportation and Air Qualityweb site (http://www.epa.gov/oms/transp.htm).
Low High
AvailabilityEase of applicationTechnical robustnessRange of strategiesSelf-sufficiency

A Sampling of Emissions Analysis Techniques for Transportation Control Measures 4-4
TCM Analyst/EPA TCM Methodology
Overview – The TCM Analyst is a spread-sheet-based sketch-planning tool developedby the Texas Transportation Institute (TTI) toestimate the emissions benefits of TCMs. It isbased on methodologies previously devel-oped for the U.S. Environmental ProtectionAgency (“EPA TCM Methodology”).
Strategies Addressed – Improved transit;HOV lanes; carpooling and vanpooling pro-motion; telecommute and work hour strategies; traffic flow improvements.
Methodology – All calculations are performed in a Microsoft Excel workbook. Elasticitiesare used to relate changes in cost or time to travel changes, and to relate VMT changes tospeed changes. The calculations account for trip lengths, prior mode of travel, etc.MOBILE emission factors by component (hot start, cold start, running, etc.) are applied tothe outputs of the travel calculations. The methods typically use regionwide estimates ofexisting travel characteristics and calculate regional-scale effects, but they can also beapplied at the corridor, facility, or zonal level.
Data Requirements – Data required for the analysis area include travel data (e.g., totalperson and vehicle-trips, trip distances, speeds for peak and off-peak periods); data onexisting TCM implementation (e.g., average carpool size); census data (e.g., number ofworkers, persons per household, vehicle ownership); potential number of users; andMOBILE emission factors by speed, type, and operating mode. Various assumptionsregarding elasticities or participation rates are also required for some strategies.
Outputs – Changes in trips, VMT, average travel speeds, and emissions.
Level of Effort – The baseline regional-level data requirements are fairly extensive andnot all inputs will be readily available. Emission factors from over 400 MOBILE scenariosmust be copied into the spreadsheet. The user may need to make other assumptionsregarding participation levels, elasticities, induced trip-making, etc.
Advantages – By automating calculations, the spreadsheet format greatly simplifies theuse of the EPA’s methodologies. The methodologies provide a detailed accounting ofimpacts by emission component, vehicle type, work versus non-work trips, and peak ver-sus off-peak travel. They also include factors to account for prior mode of travel,substitution effects (i.e., increased non-work driving by telecommuters), induced demand,and changes in trip lengths.
Limitations – Baseline regional travel data and emission factors can be somewhat cumber-some to develop. For some strategies, participation rates must be assumed by the user.Some effort may also be required to identify appropriate elasticities or other assumptions.
Source/Availability – The TCM Analyst 1.0 User’s Guide and Software are available fromthe Texas Transportation Institute (979-845-4853, http://tti.tamu.edu/).
Low High
AvailabilityEase of applicationTechnical robustnessRange of strategiesSelf-sufficiency

A Sampling of Emissions Analysis Techniques for Transportation Control Measures 4-5
Reference: TCM Analyst 1.0 User’s Guide. Research Report 1279-7, Texas TransportationInstitute, College Station, TX (November 1994).
The following documents describe the underlying methodologies developed for EPA andprovide examples of their application:
ICF Incorporated. Benefits Estimates for Selected TCM Programs. Prepared for U.S. EPA,publication no. EPA420-R-98-002, March 1999. Provides examples of the methodologiesapplied to six operating TCM programs. Internet: http://www.epa.gov/oms/transp/publicat/pub_tcms.htm.
Austin, et al. Methodologies for Estimating Emission and Travel Activity Effects of TCMs.Prepared by Systems Applications International for U.S. EPA, publication no. EPA420-R-94-002, July 1994. Available from the National Technical Information Service (NTIS) at800-553-6847. Reference NTIS No. PB92-172566/REB.

A Sampling of Emissions Analysis Techniques for Transportation Control Measures 4-6
CM/AQ Evaluation Model
Overview – The Congestion Mitigation/AirQuality (CM/AQ) Evaluation Model is asoftware program designed to calculate theemissions benefits of candidate CMAQ proj-ects and to rate projects based on variouseffectiveness criteria.Strategies Addressed – Improved transit;HOV lanes; park and ride; carpooling andvanpooling promotion; bicycle and pedestrianfacilities; traveler information; telecommuting/work hours; pricing/subsidies; parking man-agement; traffic flow improvements; intermodal freight; traffic calming; idle control; coldstart; alternative fuel vehicles (total of 59 individual strategies).Methodology – The model is a menu-driven custom application designed within theParadox database software. The methodologies to estimate travel changes are similar tothose employed in the TCM Tools model. For some strategies, travel changes are esti-mated based on elasticities; for others, program participation must be estimated by theuser. Emission reductions are estimated based on changes in travel characteristics (VMT,trips, and speed) and user-entered emission factors. The model also estimates cost-effectiveness and provides an overall ranking of projects, based on user-defined weightingfactors.Data Requirements – User inputs include baseline travel characteristics (e.g., number ofperson-trips, percent of trips in peak period) and behavioral assumptions (elasticities orparticipation) for the strategy being analyzed. Local emission factors from the MOBILEand PART5 models are also required. Default values are provided for many of theparameters, although local data are preferred.Outputs – Changes in trips, VMT, speed, and idling time for peak and off-peak periods.Level of Effort – The model is relatively easy to use, but requires a basic knowledge ofParadox and also requires local data such as MOBILE emission factors and baseline travelcharacteristics.Advantages – The CM/AQ Evaluation Model covers a wide range of potential CMAQstrategies. The cost-effectiveness and criteria weighting modules provide capabilitiesbeyond most CMAQ and TCM evaluation packages, allowing users to rank projects basedon various effectiveness criteria. The model accounts for the impacts of reduced idlingand cold-start and hot-start trips as well as reduced VMT.Limitations – The model is limited in its ability to forecast the travel impacts of TDMstrategies. Many strategies require the user to estimate participation rates (e.g., telecom-muting participants, number of new walkers/bicyclists), as well as to make otherassumptions that affect the magnitude of travel impacts.Source/Availability – The model was originally developed for the Denver RegionalCouncil of Governments by JHK Associates, and was adopted in 1995 by the TexasTransportation Institute for use by metropolitan areas in Texas. The CM/AQ EvaluationModel and User’s Guide are available from the Texas Transportation Institute (979-845-4853, http://tti.tamu.edu/).Reference: TTI CM/AQ Evaluation Model User’s Guide and Workshop Training Materials.Research Report 1358-1, Texas Transportation Institute, College Station, TX (August 1995).
Low High
AvailabilityEase of applicationTechnical robustnessRange of strategiesSelf-sufficiency
A Sampling of Emissions Analysis Techniques for Transportation Control Measures 4-7
CUTR_AVR Model
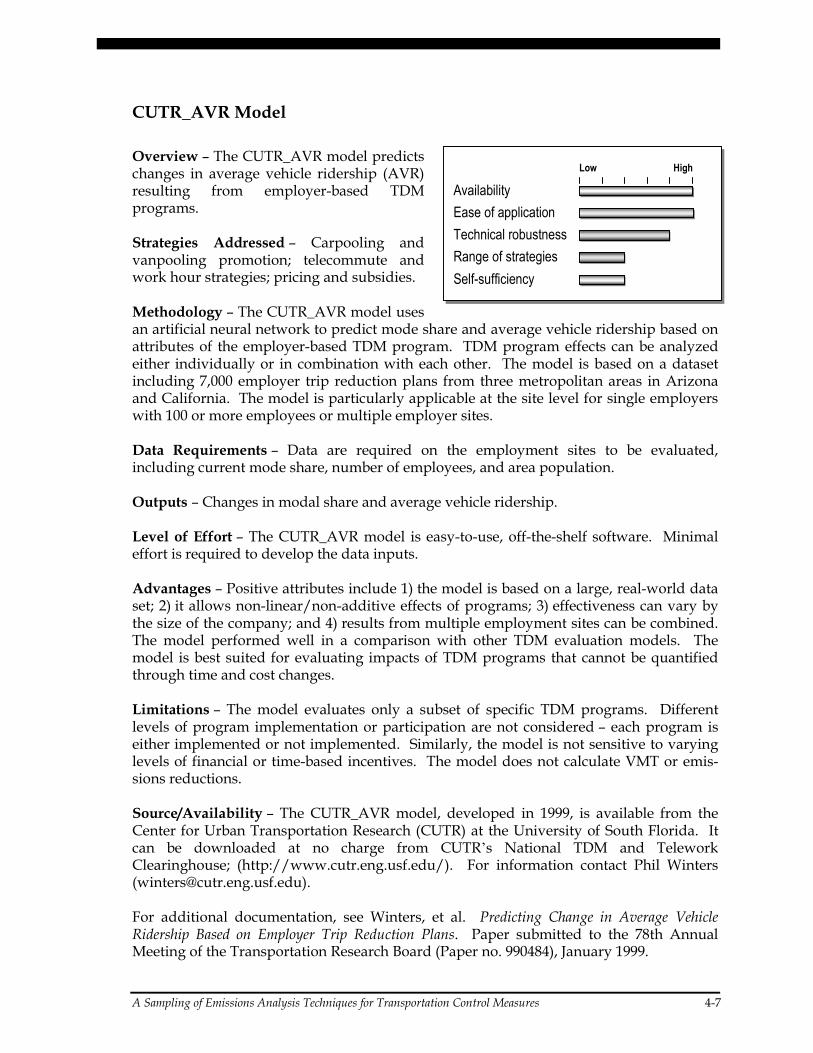
Overview – The CUTR_AVR model predictschanges in average vehicle ridership (AVR)resulting from employer-based TDMprograms.
Strategies Addressed – Carpooling andvanpooling promotion; telecommute andwork hour strategies; pricing and subsidies.
Methodology – The CUTR_AVR model usesan artificial neural network to predict mode share and average vehicle ridership based onattributes of the employer-based TDM program. TDM program effects can be analyzedeither individually or in combination with each other. The model is based on a datasetincluding 7,000 employer trip reduction plans from three metropolitan areas in Arizonaand California. The model is particularly applicable at the site level for single employerswith 100 or more employees or multiple employer sites.
Data Requirements – Data are required on the employment sites to be evaluated,including current mode share, number of employees, and area population.
Outputs – Changes in modal share and average vehicle ridership.
Level of Effort – The CUTR_AVR model is easy-to-use, off-the-shelf software. Minimaleffort is required to develop the data inputs.
Advantages – Positive attributes include 1) the model is based on a large, real-world dataset; 2) it allows non-linear/non-additive effects of programs; 3) effectiveness can vary bythe size of the company; and 4) results from multiple employment sites can be combined.The model performed well in a comparison with other TDM evaluation models. Themodel is best suited for evaluating impacts of TDM programs that cannot be quantifiedthrough time and cost changes.
Limitations – The model evaluates only a subset of specific TDM programs. Differentlevels of program implementation or participation are not considered – each program iseither implemented or not implemented. Similarly, the model is not sensitive to varyinglevels of financial or time-based incentives. The model does not calculate VMT or emis-sions reductions.
Source/Availability – The CUTR_AVR model, developed in 1999, is available from theCenter for Urban Transportation Research (CUTR) at the University of South Florida. Itcan be downloaded at no charge from CUTR’s National TDM and TeleworkClearinghouse; (http://www.cutr.eng.usf.edu/). For information contact Phil Winters([email protected]).
For additional documentation, see Winters, et al. Predicting Change in Average VehicleRidership Based on Employer Trip Reduction Plans. Paper submitted to the 78th AnnualMeeting of the Transportation Research Board (Paper no. 990484), January 1999.
Low High
AvailabilityEase of applicationTechnical robustnessRange of strategiesSelf-sufficiency

A Sampling of Emissions Analysis Techniques for Transportation Control Measures 4-8
TCM Tools
Overview – TCM Tools is a sketch-planningmodel designed to calculate the cost-effectiveness of a wide range of TCM meas-ures at achieving emissions reductions. Ithas been applied in a number of metropoli-tan areas such as San Diego, Houston, andTucson.
Strategies Addressed – Improved transit;HOV lanes; park and ride; carpooling andvanpooling promotion; employer-based TDM;bicycle and pedestrian facilities; telecommuting/work hours; pricing/subsidies; land use.
Methodology – TCM Tools is intended for the analysis of strategies employed at aregionwide level. The Transportation Module, a spreadsheet application, calculateschanges in peak and off-peak vehicle trips, VMT, and vehicle speeds on an area-widebasis. For some strategies, travel changes are estimated based on elasticities; for others,program participation must be estimated by the user. The Emissions Module, a Fortranprogram, estimates reductions in emissions based on changes in travel characteristics(VMT, trips, and speed) and MOBILE or EMFAC emission factors.
Data Requirements – User inputs to the Transportation Module include baseline travelcharacteristics (number of person-trips, percent of trips in peak period, etc.) and behav-ioral assumptions (elasticities or participation) for the strategy being analyzed. TheEmissions Module requires data on VMT and speeds by six facility types, along with otherdata (such as vehicle registration distributions and ambient temperatures) that are typi-cally developed for analyses using MOBILE.
Outputs – Changes in mode share, vehicle-trips, VMT, average travel speed, and emissions.
Level of Effort – The Transportation Module is relatively easy to apply. Running theEmissions Module in conjunction with the Transportation Module is a multi-step process,and requires some initial effort to develop inputs.
Advantages – The strength of the model is as a calculation aid, in which the user can inputvarious assumptions regarding program characteristics, behavioral responses, and costs,and can compare the magnitude of impacts for different strategies and assumptions.
Limitations – The model is limited in its ability to forecast the travel impacts of TDMstrategies; many strategies require the user to estimate participation rates (e.g., telecom-muting participants, number of new walkers/bicyclists), as well as to make otherassumptions that affect the magnitude of travel impacts. The ability of the software tomanage scenarios is limited.
Source/Availability – TCM Tools was developed in the early 1990s by Sierra Researchwith assistance from JHK Associates, and has since been customized for applications invarious areas. For more information, contact Cecilia Ho, FHWA Office of NaturalEnvironment (202-366-9862); or Bob Dulla, Sierra Research (916-444-6666).
Low High
AvailabilityEase of applicationTechnical robustnessRange of strategiesSelf-sufficiency

A Sampling of Emissions Analysis Techniques for Transportation Control Measures 4-9
Off-Net/PAQONE
Overview – The Off-Network Tool Set (Off-Net) and PAQONE are similar sketch-planning tools designed to estimate theemissions benefits of TCMs that cannot bereadily analyzed using traditional transpor-tation models.Strategies Addressed – Improved transit;park and ride; employer-based TDM; bicycleand pedestrian facilities; traveler informa-tion; traffic flow improvements; incidentmanagement.Methodology – A variety of methodologies are used, including sketch-planning analysis,elasticities, and highway/traffic engineering principles from the Highway CapacityManual. Vehicle-trips are distributed by time of day and work versus non-work trips.VMT changes are distributed by time of day, facility type, and area type. A stand-aloneemissions module runs MOBILE to develop emission factors. Project and scenario dataare stored in a Microsoft Access database.Data Requirements – A variety of different inputs are required, depending on the strat-egy analyzed. These include factors such as existing transit boardings on affected routes,population of transit or bicycle route service areas, baseline speeds and volumes onaffected roadways, and changes in transit, bicycle, or roadway service characteristics.Travel outputs are designed for use in conjunction with VMT and speeds by facility type,as can be obtained from regional travel model output.Outputs – Vehicle-trips, VMT, emissions.Level of Effort – The models are Windows-based applications that are easy to use. Thesoftware includes a scenario management function. Some effort is required to developbaseline data and assumptions.Advantages – The models are designed to analyze a variety of transit, non-motorizedtravel, and roadway improvements that cannot readily be analyzed through other means,or in a sketch-planning fashion with limited data requirements. The use of VMT andspeed data by facility type is designed to make the model output consistent with emis-sions estimates for conformity analysis based on travel demand models.Limitations – A number of the assumptions in the model that determine strategy effective-ness are based on judgment or rules of thumb. Appropriate assumptions may vary fromplace to place, and impacts may vary locally based on factors not included in the model.Source/Availability – The underlying methodologies were originally developed for thePennsylvania DOT by COMSIS Corporation in 1993. They have recently been adopted forIllinois DOT by Cambridge Systematics, Inc. with Michael Baker Associates and E.H.Pechan into a Windows-based software package known as Off-Net. PAQONE is a similarpackage developed by Michael Baker Associates for PennDOT to include additionalemployer-based and regionwide TDM strategies, to assist MPOs with CMAQ analysis. Theoriginal PennDOT procedures have been applied by other states for CMAQ and conformityanalysis. The models could be adapted for use by other areas with minor modification.Contacts – Illinois DOT – Tim Milam (217-524-9067) or Susan Stitt (217-782-2863).Cambridge Systematics, Inc. – Don Vary (202-466-5542) or Dan Beagan (617-354-0167).PennDOT – Mike Baker (Program Center) (717-772-0796). Michael Baker Associates –Robert Kaiser or Jim Frazier (410-571-8706).
Low High
AvailabilityEase of applicationTechnical robustnessRange of strategiesSelf-sufficiency

A Sampling of Emissions Analysis Techniques for Transportation Control Measures 4-10
ECO/Regulation XV Software
Overview – The ECO (Employee CommuteOptions) software suite was developed forthe Oregon Department of EnvironmentalQuality (DEQ) to help Portland areaemployers comply with ECO rules. TheECO Software is based closely on the “TDM”model developed for the South Coast AirQuality Management District (SCAQMD) tosupport the Regulation XV program inCalifornia.
Strategies Addressed – Improved transit; HOV lanes; carpooling and vanpooling promo-tion; employer-based TDM; bicycle and pedestrian facilities; telecommute and work hourstrategies; pricing and subsidies.
Methodology – The ECO software is intended for application at the level of single ormultiple employer sites. Strategies are evaluated using a “pivot-point” mode choicemodel, similar to the FHWA TDM Evaluation Model. In addition to time and cost strate-gies, the mode choice model includes coefficients for a number of other strategies such asprovision of bicycle facilities and various ridesharing incentives. The coefficients weredeveloped from the Regulation XV employer dataset in Southern California. The modelmakes adjustments to effectiveness based on the extent of marketing and awareness pro-grams. The software includes additional features, notably a module for managingemployer surveys and data, and a module for tracking program participation.
Data Requirements – Baseline mode shares, other travel characteristics, and characteris-tics of the employment sites; provision of and eligibility for various programs; amount ofcosts or subsidies for various modes.
Outputs – Changes in modal share, vehicle-trips, VMT, average vehicle occupancy, andridership.
Level of Effort – The ECO software is Windows-based and easy-to-use. However, itwould require customization to develop appropriate model coefficients for local application.Also, it requires survey data on baseline employee travel characteristics at affected sites.
Advantages – The logit-based pivot point mode choice approach is theoretically sound,consistent with common practice in travel demand forecasting, and capable of analyzingthe joint impacts of multiple strategies. The mode choice model includes a range ofemployer-based strategies in addition to time and cost-based strategies. The awarenesssubmodel provides a unique adjustment for marketing and promotional efforts.
Limitations – The software does not estimate emissions benefits directly, so the user mustapply VMT and/or trip-based emission factors. Many of the default coefficients and datawere derived from a dataset in Southern California and their validity in other areas hasnot been tested. The software would need to be customized for use in other areas.
Source/Availability – The Regulation XV software was developed for SCAQMD byCOMSIS corporation. The ECO software was developed for Portland DEQ in 1998 byCambridge Systematics, Inc. For more information, contact Susan Christensen (503-229-5518) or Sandra Hall (503-229-6154) in the Oregon Department of Environmental Quality(2020 SW Fourth Avenue; Portland OR 97201); or Steve Decker at Cambridge Systematics(510-873-8700).
Low High
AvailabilityEase of applicationTechnical robustnessRange of strategiesSelf-sufficiency

A Sampling of Emissions Analysis Techniques for Transportation Control Measures 4-11
California Standardized Cost-Effectiveness Methodology
Overview – The “California standardizedcost-effectiveness methodology” outlines aseries of calculation steps for translating thenumber of participants in a TDM programinto travel changes, emissions benefits, andcost-effectiveness. The California AirResources Board (CARB) has applied themethodology to assess the impacts of proj-ects funded by motor vehicle registrationfees. The Los Angeles Metropolitan Trans-portation Authority (LAMTA) has applied to the methodology to assess the cost-effectiveness of TDM programs in the Los Angeles region. The methodology is genericand could be applied outside of California.
Strategies Addressed – Improved transit; carpooling and vanpooling promotion;employer-based TDM; telecommuting/work hours; pricing/subsidies.
Methodology – A series of worksheet steps is provided for converting the number of par-ticipants in a TDM program into travel changes, emissions benefits, and cost-effectiveness.The methodology is applied at the level at which the strategy is applied (worksite,employment center, etc.). While the methodology was designed for ex-post programevaluations in which user surveys have been conducted, it can also be used in conjunctionwith pre-implementation surveys or mode shift forecasts to provide forecasts of emissionsreductions.
Data Requirements – Number of participants in TDM program by new and prior mode ofuse; average trip length; emission factors (per trip and per mile) by pollutant.
Outputs – Changes in vehicle-trips, VMT, and emissions.
Level of Effort – The method is easy to apply. Some effort may be required in obtainingvalid estimates of program participation.
Advantages – The method provides a standard and easy-to-follow set of calculation stepsthat accounts for prior mode of travel and trip lengths in calculating overall emissionsreductions. Worksheets are provided to account for emissions from changes in transitservice as well as changes in personal vehicle travel.
Limitations – The method does not estimate travel behavior changes directly, and so it isnot a forecasting method per se. Instead, it relies on surveys or other estimates of programparticipation as inputs. The user must also supply appropriate emission factors.
Source/Availability – Schreffler, Eric N.; Theresa Costa, and Carl B. Moyer. “EvaluatingTravel and Air-Quality Cost-Effectiveness of Transportation Demand ManagementProjects.” Transportation Research Record 1520. For information, contact Eric Schreffler(858-538-9430, [email protected]).
Low High
AvailabilityEase of applicationTechnical robustnessRange of strategiesSelf-sufficiency

A Sampling of Emissions Analysis Techniques for Transportation Control Measures 4-12
Regional Air Quality Council (RAQC) Workbook
Overview – The Workbook of Transportationand Land Use Strategies for Reducing MobileSource Emissions was prepared by theRegional Air Quality Council in Denver, COin order to allow assessment of a wide rangeof local and regional strategies forimproving air quality.
Strategies Addressed – Improved transit;HOV lanes; carpooling and vanpoolingpromotion; employer-based TDM; bicycle and pedestrian programs; telecommute andwork hour strategies; pricing and subsidies; land use.
Methodology – Strategies are analyzed individually through a series of calculation steps.Trip and/or VMT impacts are based on elasticities or empirical evidence from the litera-ture. Changes in emissions are calculated based on changes in VMT. The workbook canbe used to analyze strategies applied at particular employment sites or for an entire area.
Data Requirements – Total employees, persons, or vehicles affected; informationdescribing the strategy analyzed; various other parameters (i.e., baseline vehicle trips peremployee, total regional VMT) depending upon the strategy. Default parameters are pro-vided for average trip lengths, emission factors, etc., although the user can replace withtheir own parameters.
Outputs – Changes in VMT and emissions.
Level of Effort – The workbook is easy to use, but it is in paper format and calculationsare not automated. Some effort may be required to gather baseline regional or local data.
Advantages – The workbook is a simple means of developing a rough estimate of theemissions impacts of a wide range of strategies. The elasticities and empirical data con-tained in the workbook represent the state of knowledge as of 1996. The workbook alsocontains a discussion of supporting strategies and policy design issues, as well as anassessment of the relative magnitude of impacts at a regional level.
Limitations – Elasticities and empirical factors derived from one situation may not neces-sarily be applicable to a specific local situation. Impacts calculated using elasticities areheavily influenced by the choice of baseline parameters (e.g., vehicle operating cost permile).
Source/Availability – The Workbook of Transportation and Land Use Strategies for ReducingMobile Source Emissions (April 1997) is available from the Regional Air Quality Council(303-629-5450, [email protected].)
Low High
AvailabilityEase of applicationTechnical robustnessRange of strategiesSelf-sufficiency

A Sampling of Emissions Analysis Techniques for Transportation Control Measures 4-13
MWCOG Sketch-Planning Methods
Overview – The Metropolitan WashingtonCouncil of Governments (MWCOG) devel-oped a set of sketch-planning calculations toestimate emissions benefits for TCM strate-gies that could not be assessed throughquantitative modeling. MWCOG used thesesketch-planning approaches in conjunctionwith the TDM Evaluation Model and theirregional mode choice model to estimate theimpacts of over 50 individual strategies.
Strategies Addressed – Park and ride; carpooling and vanpooling promotion; bicycle andpedestrian facilities; traveler information; telecommuting/work hours; pricing/subsidies;land use; idle control; other strategies.
Methodology – The sketch-planning calculations are applied to strategies proposed forregional-level implementation. Various assumptions about program effectiveness areemployed, based on either experience from other areas or judgment. Additional assump-tions account for other factors such as prior mode of travel and trip lengths. Impacts areestimated separately for work and non-work trips. Cold start, hot start, and running(VMT-based) emission factors are used.
Data Requirements – Inputs vary by project type, but include factors such as total numberof park-and-ride spaces, average trip lengths, utilization of various strategies, employ-ment affected by the strategy, and existing mode shares.
Outputs – Changes in vehicle-trips, VMT, emissions.
Level of Effort – The calculation steps are clearly documented. Some effort may berequired to develop assumptions appropriate for local use, and to set up calculationseither on paper or in a spreadsheet.
Advantages – Potentially helpful examples of calculations and assumptions are includedfor a number of strategy types. The calculations account for prior mode of travel as wellas both trip and VMT-based emissions.
Limitations – Estimation of travel impacts is frequently based on judgment. (This is dueto the lack of reliable data and analytical procedures for estimating the travel impacts ofthese strategies.) The particular assumptions and calculation approaches may not beappropriate in all situations.
Source/Availability – U.S. DOT. Transportation Control Measure Analysis: TransportationControl Measures Analyzed for the Washington Region’s 15 Percent Rate of Progress Plan.Metropolitan Planning Technical Report No. 5, FHWA Publication No. FHWA-PD-95-008,February 1995. Contact Michael Culp, FHWA Office of Metropolitan Planning andPrograms (202-366-9229, [email protected]).
Low High
AvailabilityEase of applicationTechnical robustnessRange of strategiesSelf-sufficiency

A Sampling of Emissions Analysis Techniques for Transportation Control Measures 4-14
NCTCOG Sketch-Planning Methods
Overview – The North Central TexasCouncil of Governments (NCTCOG) applieda set of sketch-planning procedures to assessthe emissions benefits of TCMs implementedin an air quality attainment plan for theDallas-Fort Worth metropolitan area.
Strategies Addressed – Improved transit;HOV lanes; park and ride; carpooling andvanpooling promotion; employer-basedTDM; bicycle and pedestrian facilities; traffic flow improvements; incident management;alternative fuel vehicles.
Methodology – The procedures are at a sketch-planning level with data sources, assump-tions, and basic equations described in a report. The procedures are applied to analyzespecific projects or sets of projects.
Data Requirements – Inputs vary by project type but typically include extent of project(i.e., miles of HOV or bike lane), average before and after travel speeds, traffic volumes,ridership levels or participation rates, trip lengths, and emission factors by speed. Empiri-cal data on impacts for similar projects (or simulations for traffic flow projects) are used todevelop or verify assumptions for most strategies.
Outputs – Changes in emissions.
Level of Effort – The calculation methodologies are generally straightforward and easy toapply. Some effort may be required to conduct data collection or to identify existingstudies from which to draw assumptions.
Advantages – The document illustrates some simplified techniques for developing proj-ect-level emissions estimates. Assumptions on travel behavior and traffic flow impactswere developed or validated based on real-world observations of similar implementedstrategies. The document describes the types of studies undertaken to develop the inputsto the sketch-planning procedures.
Limitations – The methods generally do not forecast travel demand or traffic flow impactsdirectly, but instead require the user to identify reasonable assumptions about theseimpacts. Trip-based emissions impacts are not considered.
Source/Availability – Transportation Control Measure: Effectiveness Study. Technical ReportSeries No. 44, North Central Texas Council of Governments, Arlington, TX (August 1996).Contact the Regional Information Center (817-640-3300, http://www.dfwinfo.com/publications.html).
Low High
AvailabilityEase of applicationTechnical robustnessRange of strategiesSelf-sufficiency
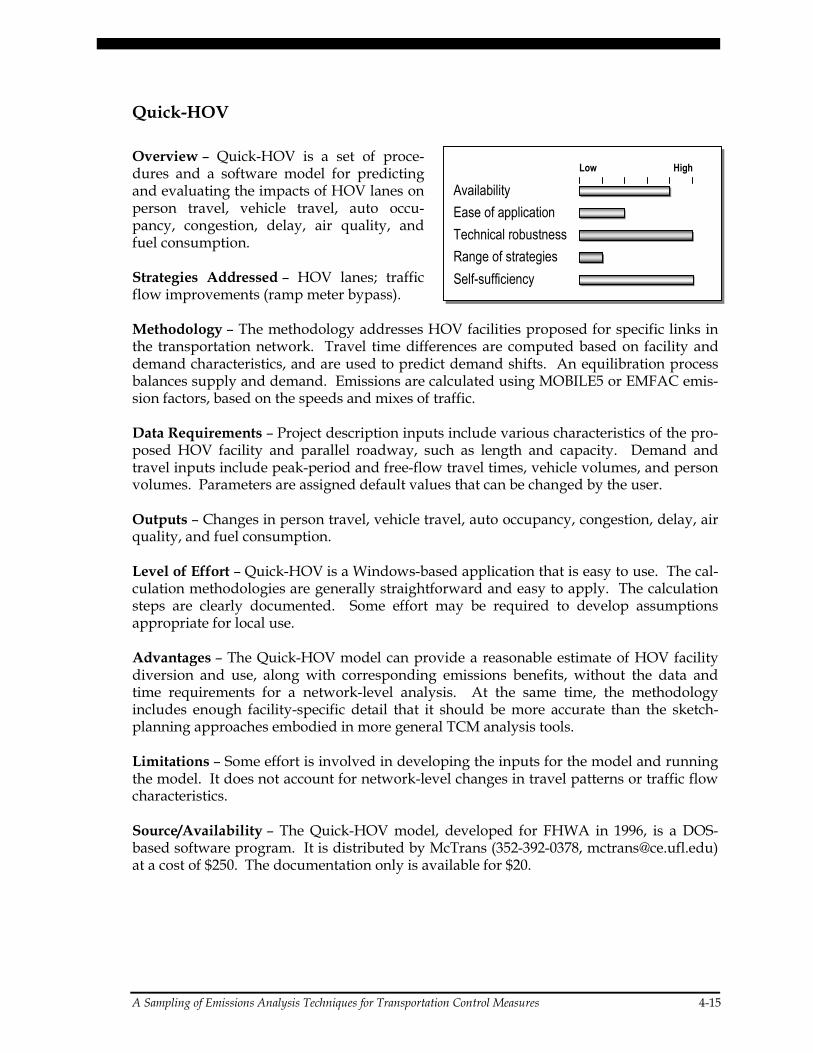
A Sampling of Emissions Analysis Techniques for Transportation Control Measures 4-15
Quick-HOV
Overview – Quick-HOV is a set of proce-dures and a software model for predictingand evaluating the impacts of HOV lanes onperson travel, vehicle travel, auto occu-pancy, congestion, delay, air quality, andfuel consumption.
Strategies Addressed – HOV lanes; trafficflow improvements (ramp meter bypass).
Methodology – The methodology addresses HOV facilities proposed for specific links inthe transportation network. Travel time differences are computed based on facility anddemand characteristics, and are used to predict demand shifts. An equilibration processbalances supply and demand. Emissions are calculated using MOBILE5 or EMFAC emis-sion factors, based on the speeds and mixes of traffic.
Data Requirements – Project description inputs include various characteristics of the pro-posed HOV facility and parallel roadway, such as length and capacity. Demand andtravel inputs include peak-period and free-flow travel times, vehicle volumes, and personvolumes. Parameters are assigned default values that can be changed by the user.
Outputs – Changes in person travel, vehicle travel, auto occupancy, congestion, delay, airquality, and fuel consumption.
Level of Effort – Quick-HOV is a Windows-based application that is easy to use. The cal-culation methodologies are generally straightforward and easy to apply. The calculationsteps are clearly documented. Some effort may be required to develop assumptionsappropriate for local use.
Advantages – The Quick-HOV model can provide a reasonable estimate of HOV facilitydiversion and use, along with corresponding emissions benefits, without the data andtime requirements for a network-level analysis. At the same time, the methodologyincludes enough facility-specific detail that it should be more accurate than the sketch-planning approaches embodied in more general TCM analysis tools.
Limitations – Some effort is involved in developing the inputs for the model and runningthe model. It does not account for network-level changes in travel patterns or traffic flowcharacteristics.
Source/Availability – The Quick-HOV model, developed for FHWA in 1996, is a DOS-based software program. It is distributed by McTrans (352-392-0378, [email protected])at a cost of $250. The documentation only is available for $20.
Low High
AvailabilityEase of applicationTechnical robustnessRange of strategiesSelf-sufficiency

A Sampling of Emissions Analysis Techniques for Transportation Control Measures 4-16
ITS Deployment Analysis System (IDAS)
Overview – The Intelligent TransportationSystem (ITS) Deployment Analysis System(IDAS) is a modeling tool that enables theuser to conduct systematic assessments andquantitative evaluations of the relative bene-fits and costs of more than 60 types of ITSinvestments, in combination or in isolation.IDAS has been tested in three metropolitanareas and is currently being applied in sevenadditional areas.Strategies Addressed – Improved transit; HOV lanes; traveler information; traffic flowimprovements; incident management.
Methodology – The model utilizes network and trip data from the regional transportationmodel. Strategies are applied either for links in the transportation network or at the trafficanalysis zone level. Strategies that affect the time or cost of travel affect mode choice,temporal choice, and induced/foregone demand through a “pivot-point” model, which isbased on coefficients from the regional travel model. Other strategy impacts are based onfindings from various empirical studies. Changes in trips by mode, time of day, and origin/destination subsequently affect vehicle speeds and volumes. Emissions are calculatedbased either on default or user-input MOBILE5 or EMFAC emission factors by speedrange.Data Requirements – Transportation network and trip tables by mode and/or purpose,which can be obtained from the regional travel model; deployment of ITS strategies bytype and location on the transportation network.
Outputs – Changes in vehicle-trips, VMT, emissions; travel time savings and improve-ments in travel time reliability; energy consumption, noise impacts, safety impacts, andmonetary values of these changes; and lists of ITS equipment and costs.Level of Effort – Familiarity with travel demand model structure and output is requiredin doing initial set-up for the model. Some effort is also needed to identify the various ITSimprovements to be analyzed. Data entry and alternatives analysis are conducted in auser-friendly Windows environment.Advantages – IDAS can analyze the benefits of a wide range of ITS strategies. It can alsoanalyze “generic” strategies affecting travel time or cost that are input for transportationlinks or analysis zones. Changes in emissions are based on network-wide VMT and speedimpacts, consistent with network data used in regional travel modeling. The model canaccount for time-of-day shifts, induced demand, and changes in travel time reliability.
Limitations – IDAS requires some time investment to learn and some user skills; in par-ticular, it is helpful to have familiarity with travel model data in setting up the model.Run time is non-trivial (anywhere from a few minutes to a few hours, depending on thenumber of zones and other factors.)Source/Availability – IDAS was developed for FHWA and is distributed throughMcTrans at the University of Florida (352-392-0378, http://mctrans.ce.ufl.edu/) andPCTrans at the University of Kansas (785-864-5655, http://kuhub.cc.ukans.edu/~pctrans/),at a cost of $600. Information is available at http://www.tfhrc.gov/its/its.htm orhttp://www.camsys.com/.
Low High
AvailabilityEase of applicationTechnical robustnessRange of strategiesSelf-sufficiency

A Sampling of Emissions Analysis Techniques for Transportation Control Measures 4-17
Simplified Method for Analysis of Regional Travel (SMART)
Overview – The SMART (Simplified Methodfor Analysis of Regional Travel) Model wasdeveloped in the Chicago area to support airquality conformity modeling and is com-patible with regional modeling datasets. Itcould be modified for similar application inother metropolitan areas.
Strategies Addressed – Improved transit;HOV lanes; roadway pricing; land use.
Methodology – SMART is applied for an area covered by the regional travel demandmodel upon which it is based. Strategies are applied to specific links in the roadway andtransit networks. SMART’s distinguishing features include the use of a “combinedmodel” for trip distribution, mode choice and assignment of auto trips; and the use of asketch planning zone system in conjunction with a detailed regional highway networkand zone system. SMART includes a stand-alone emissions module, which utilizes aspeed post-processor.
Data Requirements – Travel model data, including land use/socioeconomic and highway/transit network data, are required. Strategies are entered as changes to highway and tran-sit network characteristics (e.g., capacity, speed, cost).
Outputs – VMT and speeds by link; overall VMT and emissions changes.
Level of Effort – SMART requires significant customization.
Advantages – The use of the sketch zone system for trip distribution and mode choiceprovides efficiencies for quick turnaround with very little loss of accuracy, compared to aregional travel model. SMART is sensitive to regional shifts that result from redistributionor reassignment of trips in response to the alternative being tested.
Limitations – SMART would require significant customization for local use, and isdesigned to address only network-level transportation investments and policies.
Source/Availability – SMART was initially developed for IDOT by COMSIS Corporationin conjunction with the Chicago Area Transportation Study (CATS), and was enhanced in1998 by Cambridge Systematics, with Michael Baker Corporation and E.H. Pechan.
Contacts – Illinois DOT – Tim Milam (217-524-9067) or Susan Stitt (217-782-2863).Cambridge Systematics, Inc. – Don Vary (202-466-5542) or Dan Beagan (617-354-0167).
Low High
AvailabilityEase of applicationTechnical robustnessRange of strategiesSelf-sufficiency

A Sampling of Emissions Analysis Techniques for Transportation Control Measures 4-18
Traffic Simulation Models
Overview – Traffic simulation models areused to evaluate the impacts of changes intraffic volumes and transportation networkcharacteristics (capacity, signal timing, etc.)on traffic flow patterns (vehicle speeds,acceleration, and delay). A number of themodels are capable of calculating changes inemissions resulting from changes in trafficcharacteristics.
Strategies Addressed – HOV lanes; traffic flow improvements.
Methodology – Traffic simulation models can be divided into two general classes: macro-scopic and microscopic. Macroscopic models (TRANSYT-7F, TRAF, FREQ) are based ondeterministic relationships between roadway and intersection characteristics and trafficflow. Microscopic models (TSIS, INTEGRATION, Paramics, SIDRA, Synchro/SimTraffic)simulate the movement of individual vehicles through the network being modeled. Ineither type of model, emissions are estimated based on vehicle speed and accelerationcharacteristics.
Some simulation models are designed for analysis of individual intersections or specifictypes of facilities, while others are designed for network-level analysis. Models capable ofnetwork-level analysis include TRANSYT-7F, Synchro/SimTraffic, INTEGRATION, andParamics. The TRAF and TSIS sets of models include NETFLO and NETSIM (respec-tively) for network analysis, FREFLO and FRESIM for freeway analysis, and CORFLO andCORSIM, which are integrated packages of the network and freeway models. SIDRA isdesigned for intersection analysis. FREQ simulates corridor traffic operations includingone freeway and one parallel arterial.
Data Requirements – Requirements for traffic data include volumes by link and intersec-tion turning movement, link travel times, and percent heavy vehicles and buses.Requirements for network data include characteristics of each link (e.g., lanes, turninglanes, speed limits, lane widths) and intersection (e.g., signal phasing).
Outputs – Changes in average speeds, travel time, delay, and emissions.
Level of Effort – The individual models vary in their ease of use. A significant amount ofeffort generally is required to learn to use traffic simulation models, including setting upthe appropriate inputs and parameters. (Most regional and local transportation agencieswill have staff that are familiar with the use of one or more of these software packages.) Asignificant amount of effort may also be required to obtain traffic and network data toconduct the analysis and to calibrate the model to local conditions. Data requirements areproportional to the extent of the network being modeled.
Advantages – Traffic simulation models are the best means of estimating changes in emis-sions resulting from strategies that affect traffic flow, and can provide a relatively accurate
Low High
AvailabilityEase of applicationTechnical robustnessRange of strategiesSelf-sufficiency

A Sampling of Emissions Analysis Techniques for Transportation Control Measures 4-19
assessment of impacts. Microsimulation models can account for the effects of the varianceof driver behavior on emissions.
Limitations – The models generally require a non-trivial analysis effort as describedabove. Also, the quality of the emissions data and the vehicle trajectories(speed/acceleration profiles) produced by the models varies; for example, emissions fac-tors may not be available or are often based on old data and may not closely represent thecurrent vehicle fleet.
Source/Availability – TRANSYT-7F, the TRAF suite, the TSIS suite, and INTEGRATIONare available through McTrans (352-392-0378, http://www-mctrans.ce.ufl.edu) or PC-TRANS (785-864-5655, http://kuhub.cc.ukans.edu/~pctrans/). Information on TSIS canbe found at http://www.fhwa-tsis.com/. Paramics is available from SIAS Ltd., Edinburgh,Scotland (+0131-225-7900, http://www.sias.com/). SIDRA is available from Akcelik &Associates, Greythorn, Australia (+61-3-9857-9351, http://www.akcelik.com.au/sidra/sidra.htm). Synchro/SimTraffic is available from Trafficware, Albany CA (510-526-5891,http://www.trafficware.com/).

A Sampling of Emissions Analysis Techniques for Transportation Control Measures 4-20
AirCred
Overview – The AirCred model estimatesemissions benefits from the fleet use of alter-native-fuel vehicles. The model is designedto assist states in estimating emissions cred-its for non-attainment areas and to help fleetoperators meet the Department of Energy’sEnergy Policy Act fleet-conversion andalternative-fuel market penetration goals.
Strategies Addressed – Alternative-fuelvehicles.
Methodology – The model compares current year alternative fuel vehicle certificationvalues with conventional fuel vehicle emission factors from the MOBILE model. Thesame incremental benefit is assumed for future years. The model is based on current,area-specific MOBILE inputs for a variety of metropolitan regions throughout the country.Versions using both MOBILE5a and MOBILE5b outputs are available.
Data Requirements – AirCred requires data on the number of new alternative fuel vehi-cles delivered for last year and the current year by vehicle and fuel type, the average dailydistance driven, and the average number of days per week the vehicle is in use. Addi-tional information on vehicle usage patterns is required to compute cold start credits.Vehicle types include light-duty vehicles, light-duty trucks, transit buses, and schoolbuses. Fuel types include compressed natural gas (CNG), liquid propane gas (LPG), andelectric. Dual-fuel vehicles can also be included.
Outputs – Emission “credits” (reduction in total and/or cold start emissions) per day forNMHC, CO, and NOx.
Level of Effort – AirCred is easy to use.
Advantages – The model provides a quick way of estimating the emission benefits ofalternative-fuel passenger vehicles and buses. The emission rates in the model are basedon the best available current information.
Limitations – AirCred is not designed to calculate future year benefits, only current yearbenefits. Therefore, emission benefits for planned future year purchases may be differentif emission standards or deterioration rates for these vehicles are different.
Source/Availability – The AirCred model is available through the Department ofEnergy’s web site (http://www.fleets.doe.gov/). It was initially developed in 2000, andemission factors will be updated regularly.
Low High
AvailabilityEase of applicationTechnical robustnessRange of strategiesSelf-sufficiency

A Sampling of Emissions Analysis Techniques for Transportation Control Measures 4-21
Bus Replacement Spreadsheet
Overview – The bus replacement spread-sheet estimates the emission impacts of one-for-one replacements within an existing busfleet, or purchases of vehicles not dedicatedto specific service improvements. The meth-odology can assess the replacement of olderdiesel buses with new diesel or alternativefuel buses.
Strategies Addressed – Alternative fuelvehicles.
Methodology – The approach for estimating the emissions reductions of vehicle replace-ments is based on the average daily revenue miles per vehicle of in-service vehicles, theprocurement/replacement schedule and the difference in emissions between retired vehi-cles and the replacement vehicles. Emissions are estimated based on the year of manu-facture of old vehicles and the technology of new vehicles. The spreadsheet convertsfactors in terms of g/bhp-hr to g/mile.
Data Requirements – Data are required on the number of new buses procured by yearand the number of buses retired by model year. Data on annual vehicle revenue milesand the number of vehicle operating during maximum service are obtained from theNational Transit Database. The average speed of bus operation locally is also required, toadjust emission factors.
Outputs – Annual and cumulative emission reductions.
Level of Effort – This method is easy to apply.
Advantages – Data requirements for the spreadsheet are modest. The spreadsheet pro-vides a quick way of estimating the emission benefits of new bus purchases.
Limitations – Emission factors and conversion factors may need to be updated by the userto reflect current data on bus emission characteristics. The method does not account fordifferences in activity patterns (distance driven, driving cycles, etc.) among individualbuses in the fleet.
Source/Availability – The Bus Replacement Spreadsheet was developed by COMSIS forthe Pennsylvania DOT and updated in 1998 by Cambridge Systematics, with E.H. Pechanfor the Atlanta Regional Commission. The spreadsheet can be downloaded from theTravel Model Improvement Program web site, http://www.bts.gov/tmip/. Contact:Cambridge Systematics, Inc. – Chris Porter (617-354-0167).
Low High
AvailabilityEase of applicationTechnical robustnessRange of strategiesSelf-sufficiency

A Sampling of Emissions Analysis Techniques for Transportation Control Measures 4-22
Freight Air Quality Analysis Procedures
Overview – A methodology was developedfor the U.S. DOT and EPA to analyze the airquality impacts of actions to address freighttransportation problems. The methodologyprovides for a range of analysis procedures,from sketch planning to detailed analysis,depending upon available resource andaccuracy needs. The methodology is aimedat strategies within a metropolitan area thataffect movements of intercity freight (e.g.,intermodal terminals).
Strategies Addressed – Freight/intermodal.
Methodology – A series of analysis steps are outlined, including 1) assess overall freightcontributions to regional air quality; 2) develop a profile of the freight system; 3) identifyfreight strategy options; 4) identify and characterize potential impacts of strategies; and5) assess impacts. Options for impact assessment include 1) judgment; 2) sketch planningusing secondary data; 3) adaptation of existing models; and 4) local case studies, data col-lection, and model development. The steps are outlined in worksheet form with examplesprovided. Information to help characterize strategy impacts is also provided.
Data Requirements – Data requirements vary but may include, at a minimum, descriptivedata on the local freight system (e.g., ton-miles by mode or terminal) and the strategies tobe analyzed, as well as anticipated effects on freight movement. Some data, such as pro-jected truck and rail emission factors, are provided in the report.
Outputs – Changes in modal activity, VMT by mode, emissions.
Level of Effort – A significant level of effort would be required to develop baseline dataand strategy assumptions.
Advantages – The freight air quality analysis methodology provides a good frameworkfor analyzing freight projects. The framework is geared toward helping to understand therange of potential impacts of a transportation improvement affecting freight movement.The report also includes some useful data and sample calculations.
Limitations – The options for assessing impacts of specific strategies are not described indetail. The assessment of the impacts of strategies will generally require additional analy-sis and assumptions by the user.
Source/Availability – Cambridge Systematics, Inc., with Jack Faucett Associates, Inc. andSierra Research. Air Quality Issues in Intercity Freight: Final Report. Prepared for FederalRailroad Administration, FHWA, and EPA (March 1997). The report is available throughthe TMIP web site, http://www.bts.gov/tmip/.
Low High
AvailabilityEase of applicationTechnical robustnessRange of strategiesSelf-sufficiency

A Sampling of Emissions Analysis Techniques for Transportation Control Measures 5-1
5.0 Key Inputs and Outputs forEach Method
Strategy and Method Key Inputs Outputs
Improved Transit
TDM Evaluation Model Change in travel time and/or cost by transit Trips, VMT
TCM/Commuter ChoiceModel
Change in travel time and/or cost by transit Trips, VMT,Emissions
TCM Analyst/EPA TCMMethodology
Percent change in fares or service frequency, or surveydata on ridership (shuttle)
Trips, VMT,Emissions
CM/AQ EvaluationModel
Percent change in transit fare, wait time, travel time,and/or total revenue-miles; number of riders (shuttle)
Trips, VMT,Emissions
TCM Tools Percent change in fare/cost of using transit Trips, VMT,Emissions
Off-Net/PAQONE Strategies: bus shelters, bike access, service changes,new service, transit center. Data: variously include dailyboardings, adjacent pop., current local mode share,change in revenue miles, headways, route travel times,wait/access times
Trips, VMT,Emissions
ECO/Regulation XVSoftware
Change in travel time and/or cost by transit Trips, VMT
California StandardizedMethodology
New transit riders by prior mode of travel Trips, VMT,Emissions
RAQC Workbook Percent increase in service (peak-period departures) VMT,Emissions
NCTCOG Sketch-PlanMethods
Rail: Average daily ridership, previous mode of railtravelers
Emissions
Quick-HOV Traffic volumes and physical characteristics (length,lanes, etc.) of HOV/bus lane and parallel facility
Trips,Emissions
SMART Change in travel time, cost by link in transit network Trips, VMT,Emissions

A Sampling of Emissions Analysis Techniques for Transportation Control Measures 5-2
Strategy and Method Key Inputs Outputs
HOV Lanes
TDM Evaluation Model Changes in travel time by HOV lane Trips, VMT
TCM Analyst/EPA TCMMethodology
Number of HOV lane-miles Trips, VMT,Emissions
CM/AQ EvaluationModel
Increase in number of HOVs Trips, VMT,Emissions
TCM Tools Miles of HOV lanes added Trips, VMT,Emissions
NCTCOG Sketch-PlanMethods
Before/after traffic volumes and speeds (freeway andparallel arterial); length of facilities
Emissions
Quick-HOV Traffic volumes and physical characteristics (length,lanes, etc.) of HOV lane and parallel facility
Trips,Emissions
SMART Addition of HOV link(s) to network, and time/costcharacteristics
Trips, VMT,Emissions
Park and Ride
CM/AQ EvaluationModel
Number of spaces, utilization rate Trips, VMT,Emissions
TCM Tools Number of spaces, utilization rate Trips, VMT,Emissions
Off-Net/PAQONE Number of new spaces, utilization rate Trips, VMT,Emissions
MWCOG Sketch-PlanMethods
Total number of spaces; work trip length Trips, VMT,Emissions
NCTCOG Sketch-PlanMethods
Number of spaces, utilization rate, speeds on adjacentfreeway
Emissions
Carpooling and Vanpooling Promotion
TDM Evaluation Model “Level” of employer-based program in impact area Trips, VMT
TCM/Commuter ChoiceModel
“Level” of employer-based program in impact area Trips, VMT,Emissions
TCM Analyst/EPA TCMMethodology
Vanpooling: number of vanpools, average vehicleoccupancy
Trips, VMT,Emissions
CM/AQ EvaluationModel
Number of new ridesharers Trips, VMT,Emissions

A Sampling of Emissions Analysis Techniques for Transportation Control Measures 5-3
Strategy and Method Key Inputs Outputs
CUTR_AVR Whether guaranteed ride home or ridematchingprogram are in place
Trips
TCM Tools Percent increase in non-drive alone modes Trips, VMT,Emissions
ECO/Regulation XVSoftware
Provision of guaranteed ride home, company vehicle,transportation coordinator, rideshare matching,vanpools, preferential parking
Trips, VMT
California StandardizedMethodology
Number of commuters by new and prior mode of travel Trips, VMT,Emissions
MWCOG Sketch-PlanMethods
Survey data on rideshare service utilization/placement Trips, VMT,Emissions
NCTCOG Sketch-PlanMethods
Number of vanpools, minimum riders/vanpool Emissions
Employer-Based TDM
TDM Evaluation Model Assume other strategies to achieve trip reduction or AVRincrease of X percent
Trips, VMT
TCM/Commuter ChoiceModel
Assume other strategies to achieve trip reduction or AVRincrease of X percent
Trips, VMT,Emissions
CM/AQ EvaluationModel
Transit pass subsidy amount; number of peopleswitching to each mode
Trips, VMT,Emissions
ECO/Regulation XVSoftware
Eligibility for various incentives; marketing andadministrative expenditures
Trips, VMT
California StandardizedMethodology
Number of commuters by new and prior mode of travel Trips, VMT,Emissions
NCTCOG Sketch-PlanMethods
Number of companies with TDM programs, reportednumber of active participants
Emissions
Bicycle and Pedestrian Facilities
TCM/Commuter ChoiceModel
“Level” of bicycle/pedestrian support program Trips, VMT,Emissions
TCM Analyst/EPA TCMMethodology
Vehicle volumes on roads adjacent to proposed trails;percent switching mode
Trips, VMT,Emissions
CM/AQ EvaluationModel
Number of new walkers/bicyclists or percent of tripsthat would bicycle
Trips, VMT,Emissions

A Sampling of Emissions Analysis Techniques for Transportation Control Measures 5-4
Strategy and Method Key Inputs Outputs
TCM Tools Percent of trips that would bicycle Trips, VMT,Emissions
Off-Net/PAQONE Size of service area, population density, existing modeshare, length of existing and new bike network; budgetfor promo. programs; bike coordinator
Trips, VMT,Emissions
ECO/Regulation XVSoftware
Provision of bicycle racks or storage, provision ofshowers and lockers
Trips, VMT
California StandardizedMethodology
Number of commuters by new and prior mode of travel Trips, VMT,Emissions
RAQC Workbook Population served by bike facilities VMT,Emissions
MWCOG Sketch-PlanMethods
Utilization and trip lengths for various strategies Trips, VMT,Emissions
NCTCOG Sketch-PlanMethods
Size of service area, population density, bicycle modeshare, length of project
Emissions
Traveler Information
CM/AQ EvaluationModel
ATIS: percent increase in transit ridership; motorist info:trip reduction during incidents
Trips, VMT,Emissions
Off-Net/PAQONE Freeway section length, baseline speed and volume Trips, VMT,Emissions
IDAS Types and locations of deployed ITS strategies Trips, VMT,Emissions
Telecommuting/Work Hours
TDM Evaluation Model Eligibility and participation in flex-time, staggeredhours, telecommute, 4/40 or 9/80 work week
Trips, VMT
TCM/Commuter ChoiceModel
Eligibility and participation in flex-time, staggeredhours, telecommute, 4/40 or 9/80 work week
Trips, VMT,Emissions
TCM Analyst/EPA TCMMethodology
Percent of eligible people telecommuting (home orsatellite); avg. days/week
Trips, VMT,Emissions
CM/AQ EvaluationModel
Telecommuting, compressed hours: participation rateand days/week, shift from peak to off-peak
Trips, VMT,Emissions
CUTR_AVR Whether a compressed work week is in place Trips

A Sampling of Emissions Analysis Techniques for Transportation Control Measures 5-5
Strategy and Method Key Inputs Outputs
TCM Tools Telecommuting, compressed hours: participation rateand days/week, shift from peak to off-peak
Trips, VMT,Emissions
ECO/Regulation XVSoftware
Eligibility and participation in flex-time, staggeredhours, telecommute, 4/40 or 9/80 work week
Trips, VMT
California StandardizedMethodology
Number of commuters by new and prior mode of travel Trips, VMT,Emissions
RAQC Workbook Telecommuting, compressed hours: participation rateand days/week
VMT,Emissions
MWCOG Sketch-PlanMethods
HBW trip lengths and utilization of telecommute centersin outlying areas
Trips, VMT,Emissions
Pricing/Subsidies
TDM Evaluation Model Changes in travel cost by mode to impact area Trips, VMT
TCM/Commuter ChoiceModel
Changes in travel cost by mode to impact area Trips, VMT,Emissions
TCM Analyst/EPA TCMMethodology
Percent change in travel cost by mode Trips, VMT,Emissions
CM/AQ EvaluationModel
Increase in cost per gallon or cost per mile; percentchange in transit cost; parking charge
Trips, VMT,Emissions
CUTR_AVR Whether higher costs for driving alone or alternativemode use subsidies are in place
Trips, AVR
TCM Tools Increase in cost per gallon or cost per mile; percentchange in transit cost; parking charge
Trips, VMT,Emissions
ECO/Regulation XVSoftware
Changes in travel cost by mode to impact area; change inparking cost
Trips, VMT
California StandardizedMethodology
Number of commuters by new and prior mode of travel Trips, VMT,Emissions
RAQC Workbook Increase in cost per gallon, VMT, or trip; peak-periodtolls; parking charge; parking cash-out; pay-at-the-pumpinsurance
VMT,Emissions
MWCOG Sketch-PlanMethods
Free midday fares: percent increased ridership by modeshift, time shift, other
Trips, VMT,Emissions
SMART Change in cost of travel by link, zone Trips, VMT,Emissions

A Sampling of Emissions Analysis Techniques for Transportation Control Measures 5-6
Strategy and Method Key Inputs Outputs
Land Use
CM/AQ EvaluationModel
Percent increase in density, mixed use, pedestrianamenities in employment centers
Trips, VMT,Emissions
TCM Tools Percent increase in density, mixed use, pedestrianamenities in employment centers
Trips, VMT,Emissions
RAQC Workbook Site design: grid streets, density standards, etc.; regionalgrowth management; infill development
VMT,Emissions
MWCOG Sketch-PlanMethods
Allow convenience uses in residential areas (tripgeneration, mode share, trip lengths)
Trips, VMT,Emissions
SMART Change in location of development by zone Trips, VMT,Emissions
Parking Management
TCM Analyst/EPA TCMMethodology
Percent change in parking cost Trips, VMT,Emissions
CM/AQ EvaluationModel
Change in vehicle-trips to site and elsewhere, number ofshort-term and long-term spaces
Trips, VMT,Emissions
RAQC Workbook Current parking space utilization, cap on parking spaces,maximum parking ratios
VMT,Emissions
MWCOG Sketch-PlanMethods
Maximum parking ratios, employment, trips, modeshare by area
Trips, VMT,Emissions
Traffic Flow Improvements
TCM Analyst/EPA TCMMethodology
Percent change in traffic speed; affected VMT Emissions
CM/AQ EvaluationModel
Percent change in traffic speed; affected VMT Emissions
TCM Tools Percent change in traffic speed; reduction in trips Emissions
Off-Net/PAQONE Arterial improvements: baseline speeds, volumes, LOS;improvements made and added capacity
Emissions
MWCOG Sketch-PlanMethods
Flashing yellow: number of signals, traffic counts,savings/signal; ATMS: speed increase, emission rates byspeed
Emissions
NCTCOG Sketch-PlanMethods
Project-specific average speed improvements, trafficvolumes, distance affected
Emissions

A Sampling of Emissions Analysis Techniques for Transportation Control Measures 5-7
Strategy and Method Key Inputs Outputs
IDAS Types and locations of deployed ITS strategies Trips, VMT,Emissions
SMART Change in capacity, travel speeds of links in transporta-tion network
Trips, VMT,Emissions
Traffic SimulationModels
Roadway and intersection characteristics, traffic andturning volumes
Emissions
Incident Management
Off-Net/PAQONE Freeway section length, baseline speed and volume Emissions
NCTCOG Sketch-PlanMethods
Traffic volumes affected; change in speeds and incidentduration as a result of strategies
Emissions
IDAS Types and locations of deployed ITS strategies Emissions
Freight/Intermodal
CM/AQ EvaluationModel
Number of trucks shifted from peak to off-peak Emissions
TCM Tools Number of trucks shifted from peak to off-peak Emissions
Freight Air QualityAnalysis Procedures
Various methodologies and inputs for determiningfreight activity levels and emission factors
Emissions
Idle Control
CM/AQ EvaluationModel
Number of sites impacted, number of affected trips/vehicles, idling time/vehicle
Emissions
MWCOG Sketch-PlanMethods
Vehicles affected, idle time, idle emission factors (fromMOBILE)
Emissions
Alternative Fuel Vehicles
CM/AQ EvaluationModel
Number of affected trips, emission rates Emissions
NCTCOG Sketch-PlanMethods
Number of vehicles by agency and fuel type; relativeemission rates
Emissions
AirCred Number of alternative fuel vehicles purchased by vehicletype and fuel type, miles driven per year
Emissions
Bus ReplacementSpreadsheet
Number of buses procured and retired by model yearand fuel type
Emissions

A Sampling of Emissions Analysis Techniques for Transportation Control Measures 6-1
6.0 References
���� 6.1 General Resources
FHWA information and guidance related to air quality and the CMAQ program is avail-able through the Office of Natural Environment. Internet: http://www.fhwa.dot.gov/environment/aq.htm.
EPA’s Transportation Air Quality (TRAQ) Center contains data, models, and reports toassist in quantifying the emissions benefits of transportation control measures. TRAQ ismaintained by the EPA Office of Transportation and Air Quality. Internet: http://www.epa.gov/oms/transp.htm.
The Center for Urban Transportation Research at the University of South Florida main-tains a web site of “Products and Services Available to Assist the TDM and TeleworkProfessional.” Internet: http://www.cutr.eng.usf.edu/.
���� 6.2 Other Emissions Estimation Methodologies
California Air Resources Board. “Evaluation of Selected Projects Funded by MotorVehicle Registration Fees.” Sacramento, CA (1995).
Estimates the emissions benefits of specific projects including alternative fuelvehicles, electric vehicles, vehicle scrappage, traffic signal timing, shuttle services,employer trip reduction, telecommunications, bicycle use and infrastructure, publiceducation, and smoking vehicle abatement. Assumptions and calculation methodsare clearly documented.
Federal Highway Administration. “Off-Model Air Quality Analysis: A Compendium ofPractice.” FHWA Southern Resource Center (August 1999). Contact Andrew Edwards,(404) 562-3673.
Includes examples of emission reduction calculations from programs throughout thesoutheastern U.S. Examples cover a variety of strategies such as traffic flowimprovements, HOV, transit, vanpool, pedestrian/bicycle, incident management,and public education.
North Jersey Transportation Planning Authority. “TCM Quick Response Handbook:Tools for Local Planners.” Prepared by Sarah Siwek and Associates and Apogee Research,Inc.

A Sampling of Emissions Analysis Techniques for Transportation Control Measures 6-2
Contains examples of calculation approaches and worksheets for estimating theemissions impacts of TCM measures including activity center-based trip reduction,bicycling improvements, incident management and information advisory systems,land use measures, parking controls, parking pricing measures, traffic flowimprovements, transit pricing programs, and transit improvement programs.
U.S. Environmental Protection Agency, Office of Policy, Planning, and Evaluation.Guidance on the Use of Market Mechanisms to Reduce Transportation Emissions (March 1998).Prepared by Apogee Research, Inc., et al. Internet: http://www.epa.gov/oms/transp/traqmkti.htm.
Discusses modeling approaches to address parking fees, VMT fees, and other cost-based TCMs. Methods include the STEP model (a microsimulation approach totravel modeling), the logit mode choice model, and the Post Processor for Air Quality(PPAQ) developed by Garmen Associates for applying MOBILE emission factors totravel model output.
Federal Highway Administration, Turner-Fairbanks Highway Research Center. Guidebookon Methods to Estimate Non-Motorized Travel. Prepared by Cambridge Systematics, Inc.,and Bicycle Federation of America. Publication No. FHWA-RD-98-165 (July 1999).Internet: http://www.tfhrc.gov/.
Reviews available methods to forecast changes in bicycle and pedestrian travel as aresult of facility improvements or policies.
���� 6.3 Information on CMAQ/TCM Strategy Effectiveness
National Association of Regional Councils. Costs and Effectiveness of Transportation ControlMeasures (TCM): A Review and Analysis of the Literature. Prepared by Apogee Research,Inc. (1994).
Federal Highway Administration. Transportation and Global Climate Change: A Review andAnalysis of the Literature. Prepared by Hagler-Bailly, Inc. Publication No. DOT-T-97-03(1998).
Institute of Transportation Engineers. A Toolbox for Alleviating Traffic Congestion andEnhancing Mobility. Prepared by Michael D. Meyer for Federal Highway Administration(1997). Internet: http://www.ite.org.
Transit Cooperative Research Program. Traveler Response to Transportation System ChangesHandbook, 3rd Edition. Prepared by Richard Pratt. TCRP Project B-12, TCRP WebDocument 12 (2000). Internet: http://www4.nationalacademies.org/trb/crp.nsf.

A Sampling of Emissions Analysis Techniques for Transportation Control Measures 7-1
7.0 List of Acronyms
AVO Average Vehicle Occupancy
AVR Average Vehicle Ridership
CMAQ Congestion Mitigation and Air Quality Improvement Program
CO Carbon Monoxide
CUTR Center for Urban Transportation Research
DOT Department of Transportation
ECO Employee Commute Options
EPA Environmental Protection Agency
FHWA Federal Highway Administration
FTA Federal Transit Administration
HOV High Occupancy Vehicle
I/M Inspection and Maintenance
IDAS ITS Deployment and Analysis System
ITS Intelligent Transportation Systems
MPO Metropolitan Planning Organization
MWCOG Metropolitan Washington Council of Governments
NCTCOG North Central Texas Council of Governments
NMHC Non-Methane Hydrocarbons
NOx Oxides of Nitrogen
PM Particulate Matter
RAQC (Denver) Regional Air Quality Council
SMART Simplified Model for the Analysis of Regional Travel
TAZ Traffic Analysis Zone
TCM Transportation Control Measure
TDM Travel Demand Management
TEA-21 Transportation Equity Act for the 21st Century
TSM Transportation Systems Management
TTI Texas Transportation Institute
VMT Vehicle-Miles of Travel
VOC Volatile Organic Compounds