a s i colony social organization and population genetic...
TRANSCRIPT
APICULTURE AND SOCIAL INSECTS
Colony Social Organization and Population Genetic Structure of anIntroduced Population of Formosan Subterranean Termite from
New Orleans, Louisiana
CLAUDIA HUSSENEDER,1 MATTHEW T. MESSENGER,2 NAN-YAO SU,3 J. KENNETH GRACE,4
AND EDWARD L. VARGO5
J. Econ. Entomol. 98(5): 1421Ð1434 (2005)
ABSTRACT The Formosan subterranean termite, Coptotermes formosanus Shiraki, is an invasivespecies in many parts of the world, including the U.S. mainland. The reasons for its invasive successmay have to do with the ßexible social and spatial organization of colonies. We investigated thepopulation and breeding structure of 14C. formosanus colonies in Louis Armstrong Park, New Orleans,LA. This population has been the focus of extensive study for many years, providing the opportunityto relate aspects of colony breeding structure to previous Þndings on colony characteristics such asbody weight and number of workers, wood consumption, and intercolony aggression. Eight colonieswere headed by a single pair of outbred reproductives (simple families), whereas six colonies wereheaded by low numbers of multiple kings and/or queens that were likely the neotenic descendantsof the original colony (extended families). Within the foraging area of one large extended familycolony, we found genetic differentiation among different collection sites, suggesting the presence ofseparate reproductive centers. No signiÞcant difference between simple family colonies and extendedfamily colonies was found in worker body weight, soldier body weight, foraging area, population size,or wood consumption. However, level of inbreeding within colonies was negatively correlated withworker body weight and positively correlated with wood consumption. Also, genetic distance betweencolonies was positively correlated with aggression levels, suggesting a genetic basis to nestmatediscrimination cues in this termite population. No obvious trait associated with colony reproductivestructure was found that could account for the invasion success of this species.
KEY WORDS microsatellite genotyping, breeding system, Isoptera, Rhinotermitidae
THE FORMOSAN SUBTERRANEAN TERMITE,Coptotermes for-mosanus Shiraki, is an invasive species that has beenintroduced from its native range in southeast Chinaand southern Asia to many parts of the world, includ-ing the U.S mainland and Hawaii, where it is a highlydestructive pest of wooden structures and trees. Oneof the Þrst detections of C. formosanus on the U.S.mainland was in 1966 in New Orleans, LA, at whichtime buildings and trees were heavily infested, indi-cating it had been present for several years already(Spink 1967). Since that time, C. formosanus hasspread through a large part of the southern UnitedStates and as of 2001 was found in at least 10 states from
North Carolina and Tennessee south to Florida on theEast Coast, throughout the Gulf Coast into Texas, andin California (Woodson et al. 2001).
Although a number of termite species have becomeestablished in nonnative areas,C. formosanus is one ofonly a few termite species that can be considered trulyinvasive, i.e., widely established and locally dominantwith severe economic and/or ecological impact. Thereasons for the exceptional success ofC. formosanus asan invader are not clear, but one possibility is thatcertain features of its colony structure facilitate theinvasion of new areas, as is characteristic of severalinvasive ants (Holway et al. 2002, Tsutsui and Suarez2003). Two of the most notorious ant invaders, the redimported Þre ant, Solenopsis invicta Buren, and theArgentine ant, Linepithema humileMayr, have under-gone population genetic changes during or after theirintroductions, leading to shifts in social behavior andcolony structure that favor their invasiveness (Holwayet al. 2002, Tsutsui and Suarez 2003). SpeciÞcally, in atleast some parts of their introduced ranges both spe-cies exhibit greater unicoloniality (formation of largemultinest colonies) than in their native ranges. Uni-colonial societies are characterized by reduced in-
1 Corresponding author: Department of Entomology, LouisianaState University Agricultural Center, Baton Rouge, LA 70803 (e-mail:[email protected]).
2 Dow AgroSciences LLC, 6650 Fleur de Lis #9, New Orleans, LA70124.
3 Department of Entomology and Nematology, Fort LauderdaleResearch and Education Center, University of Florida, 3205 CollegeAve., Fort Lauderdale, FL 33314.
4 Department of Plant and Environmental Protection Sciences,University of Hawaii at Manoa, 3050 Maile Way, Honolulu, HI 96822.
5 Department of Entomology, Box 7613, North Carolina State Uni-versity, Raleigh, NC 27695.
0022-0493/05/1421Ð1434$04.00/0 � 2005 Entomological Society of America

traspeciÞc aggression, high levels of polygyny (thepresence of multiple reproductive queens within acolony), and colony reproduction by budding (initi-ation of a new colony by one or more queens andworkers who leave their natal colony), all of which canhelp in the success of introduced populations. Therehave been very few studies of colony social organiza-tion in introduced populations of C. formosanus andnone in native populations, so it is not yet possible tosay whether introduction events have affected colonystructure in this species and what role any suchchanges may have played in the invasive success of thisspecies.
Like other subterranean termites,C. formosanushasa complex life cycle involving changes in colonybreeding structure and spatial organization. Coloniesgenerally begin as simple families headed by two pri-mary (alate-derived) reproductives who pair duringmating ßights (King and Spink 1974, Su and Tamashiro1987, Thorne 1998, Thorne et al. 1999, Raina et al.2003). Eventually, the primary king and/or queen willbe supplemented or replaced by neotenics (non-alate-derived reproductives) from within the colony, lead-ing to inbred extended families. As colonies grow,they expand their foraging range with undergroundtunnels, some of which may contain satellite nests,reaching up to 50 m or more from the main nest (Kingand Spink 1969, Su and Tamashiro 1987). It is likelythat groups of foragers and/or satellite nests some-times formbuds inwhich theyarephysically separatedfrom the rest of the colony and subsequently generateneotenics from existing workers to become indepen-dent colonies. In addition, there is evidence fromC. formosanus and other species that subterraneantermite colonies can occasionally fuse or adopt unre-lated reproductives (Su and Scheffrahn 1988a, Jenkinset al. 1999, Bulmer et al. 2001, Clement et al. 2001,Matsuura and Nishida 2001, DeHeer and Vargo 2004).Thus, there is great potential for variation amongC. formosanus populations in colony breeding struc-ture, depending on age structure of the colonies, dy-namics of colonyÐcolony interactions, local ecologicalconditions, and population genetic structure. To date,genetic studies of introduced populations from onlytwo areas have been published. In Hawaii, Hussenederand Grace (2001) found that all 17 colonies studiedconsisted of genetically distinct family units, and inJapan Vargo et al. (2003a) found that 27 of 30 coloniescontained a single pair of reproductives, whereas theremaining three colonies contained multiple relatedreproductives.
As part of a larger project investigating the breedingstructure of various introduced and native populationsofC. formosanus,we examined here the genetic struc-ture of an introduced population in Louis ArmstrongPark, New Orleans. The park has a long history ofC. formosanus activity dating back to a documentedintroduction in 1973 of an infested stage that wasplaced inside the parkÕs Performing Arts Center (Scottand Scott 1996), which originated from Camp LeroyJohnson, one of several military bases credited withintroducing C. formosanus from Asia to New Orleans
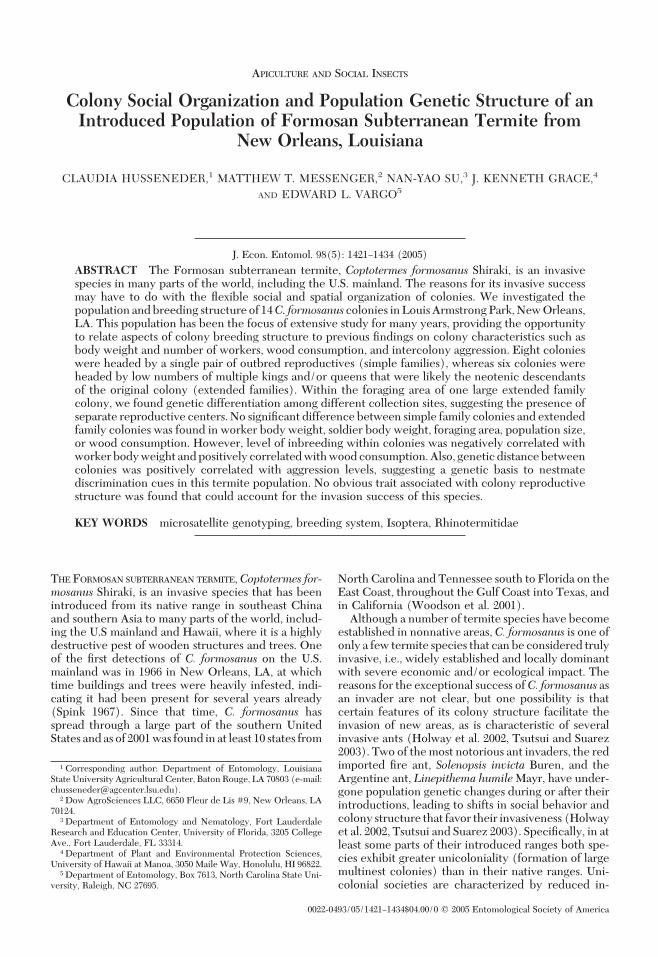
after World War II (La Fage 1987). This termite pop-ulation in Louis Armstrong Park has been the focus ofan intensive recent study of population and colonystructure and colonyÐcolony dynamics (Messengerand Su 2005a, b; Messenger et al. 2005). MarkÐreleaserecapture methods, i.e., releasing dyed termites todetermine colony identity, allowed delineation of 14foraging areas (Messenger and Su 2005a). Each ofthese foraging areas was shown to consist of geneti-cally distinct groups based on multilocus DNA Þnger-printing and was therefore considered to belong todifferent colonies (Husseneder et al. 2003a).
The goal of this study was to provide a comprehen-sive view of the population genetics and social orga-nization of the Louis Armstrong Park population ofC. formosanus in relation to speciÞc features of colo-nies and to behavioral interactions among colonies. Toachieve this objective, we used microsatellite geno-typing (Vargo and Henderson 2000) to describe thepopulation genetic structure and the social organiza-tion of the 14 colonies. In addition, we connected thesociogenetic system of each colony, i.e., the breedingstructure and the level of inbreeding within coloniesto a number of colony characteristics previously re-ported by Messenger and Su (2005a, b), such asworker body weight, soldier body weight, size of for-aging area, size of the foraging population, annualwood consumption rate, and levels of intercolony ag-gression. This study, which provides the most detailedanalysis to date of many key attributes of an intro-duced population of this pest, represents an importantstep toward understanding the exceptional success ofthis termite species as an invader.
Materials and Methods
Definitions. We use the following deÞnitionsthroughout this article. Termites were sampled fromcollection sites, i.e., distinct inground foraging stations,stakes, logs, or trees. In a previous study using markÐreleaseÐrecapture (Messenger and Su 2005a), collec-tion sites were connected to 14 foraging areas, i.e.,areas within which dyed termite workers were foundto intermix, indicating they shared the same set ofinterconnected foraging tunnels. To call groups oftermites sharing a foraging area a distinct colony, theyhave to form a functional unit of social interactiveindividuals and a distinct genetic unit (Thorne et al.1999). The latter we conÞrmed by showing that ter-mites from different collection sites within the sameforaging area genetically group together, yet separateclearly from termites from neighboring foraging areas(Husseneder et al. 2003a). Colonies may consist of oneor several interconnected nests, i.e., reproductive cen-ters that containa singlepairormultiple reproductivesand brood. This may lead to genetic structure amongspatially separated areas within colonies. Coloniesmay vary in their social structure; some colonies maybe headed by a single pair of reproductives (simplefamily colonies, orMendelian colonies), some coloniesmay be headed by multiple kings and queens (ex-tended family colonies, or non-Mendelian colonies;
1422 JOURNAL OF ECONOMIC ENTOMOLOGY Vol. 98, no. 5

Thorne et al. 1999, Vargo et al. 2003a). Termites in thepark were considered to belong to the same gene pooland therefore to the same population because dis-tances between collection sites in Louis ArmstrongPark lay well within the ßight ability (up to 892 m) ofalates (Messenger and Mullins 2005).Collections and DNA Extraction. Louis Armstrong
Park is located in New Orleans, a region heavily in-fested with Formosan subterranean termites. The12.75-ha park is densely populated with termite col-onies adjacent to each other. Foraging areas rangedfrom 83 to 1,634 m2 (Fig. 1a). At least 50 workers werecollected from one collection site at the center of theforaging area of each of the 14 colonies of Louis Arm-strong Park between 1999 and 2000 by using artiÞcialinground stations. From the largest colony (AP1),which occupied a foraging area �500 m2 larger thanany other colony, termites were collected from Þvecollection sites within the same foraging area to testfor intracolonial genetic structure (Fig. 1b). Speci-mens were stored in 95% ethyl alcohol until extractionof DNA. DNA was extracted from individual termitesusing the DNeasy tissue kit (QIAGEN, Valencia, CA).Microsatellite Genotyping. We scored 18Ð35 in-
dividuals of each colony at eight microsatellite loci(Table 1), which were described previously forC. formosanus by Vargo and Henderson (2000). Adetailed description of the polymerase chain reaction(PCR) conditions and genotype scoring procedurescan be found in Vargo and Henderson (2000). Becauseindividuals within colonies are related and thus ge-netically nonindependent, we used only one individ-ual per colony, i.e., when testing for linkage disequi-librium between loci and for the presence of a geneticbottleneck.General Statistics, Tests for Linkage Disequilib-rium, and Recent Bottleneck. General descriptivestatistics, such as numbers of alleles per locus, ob-served versus expected heterozygosity, and allele fre-quencies were calculated for each colony and locususing the program GDA (Lewis and Zaykin 2000;Tables 1 and 2). To test for linkage disequilibriumbetween pairs of loci, G-statistics based on log-likeli-hood ratios were calculated and summed over allsamples (FSTAT; Goudet 1995, 2001). To test for sig-
niÞcance of association between genotypes of all pairsof polymorphic loci, randomized data sets were cre-ated (2,400 permutations); genotypes at each pair ofloci were combined at random, and the log-likelihoodratio G-statistic was calculated for each randomizeddata set. The value of P was estimated from the pro-portion of permutations that were greater or thesame as the observed. None of the 28 pairs of locishowed signiÞcant linkage. Thus, all eight polymor-phic microsatellite loci were assumed to assort inde-pendently.
We determined whether the population had gonethrough a recent genetic bottleneck based on the factthat bottlenecks reduce allele numbers faster thanheterozygosity, so that observed heterozygosity isgreater than the heterozygosity expected from allelenumbers. Calculations of expected heterozygositydepend on the model of mutation (InÞnite Allelemodel, Stepwise Mutation model). Tests were per-formed with both mutation models as implemented inthe program BOTTLENECK (Piry et al. 1999).Population Structure, F-Statistics. Colonies were
tested for signiÞcant differentiation using log-likeli-hood G-statistics by using FSTAT (Goudet 2001).P values were obtained through permutations of themultilocus genotypes between each pair of coloniesand standard Bonferroni corrections were applied.Pairwise genetic distances (FCT; see below) betweencolonies were visualized using principal coordinateanalysis (NTSYSpc, 2.11, Applied Biostatistics Inc.,Setauket, NY). To assess isolation by distance FCT
values were correlated to geographical distance using
Table 2. Descriptive statistics of the 14 colonies of LouisArmstrong Park
Colony n A/locus Ho He r
AP1 21.38 2.13 0.44 0.34 0.49AP2 22.00 2.13 0.62 0.42 0.55AP3 23.00 1.75 0.26 0.24 0.72AP4 22.38 1.88 0.37 0.36 0.47AP5 22.50 2.50 0.69 0.56 0.15AP6 22.38 2.13 0.51 0.38 0.63AP7 20.63 2.13 0.56 0.46 0.37AP8 20.63 2.25 0.56 0.42 0.57AP9 20.75 2.13 0.70 0.47 0.46AP10 22.25 2.00 0.48 0.42 0.44AP11 20.38 2.00 0.52 0.37 0.72AP12 20.00 1.75 0.29 0.28 0.66AP14 20.50 2.00 0.48 0.39 0.52AP15 21.75 1.88 0.36 0.33 0.65
Mean simple family 21.77 2.07 0.50 0.40 0.53*SD 0.85 0.20 0.11 0.07 0.14Mean extended family 21.07 2.02 0.47 0.37 0.60*SD 1.04 0.22 0.17 0.10 0.15Mean all 21.47 2.05 0.49 0.39 0.55*SD all 0.97 0.20 0.14 0.08 0.18
Simple family colonies are shown with gray background, and ex-tended family colonies with black background. n, mean number ofindividuals across all loci;A/locus, the number of alleles per locus;Ho,observed heterozygosity; He, expected heterozygosity; r, relatednesscoefÞcients within colonies.
* Means for rwere calculated according to Queller and Goodnight(1989). SD values are calculated from the standard errors derivedfrom jackkniÞng over loci (1000 replications).
Table 1. Descriptive statistics of the eight microsatellite loci
Locus Allele size (kb)No.
alleles
Frequencyof the most
common alleleHo He
1 Cf 4:1A2-4 194, 191, 188, 185 4 0.46 0.57 0.612 Cf 4-4 248, 239, 230 3 0.54 0.21 0.543 Cf 10-4 173, 170 2 0.50 0.29 0.514 Cf 12-4 191, 182, 173, 146 4 0.68 0.57 0.525 Rf 6-1 172, 163 2 0.80 0.36 0.306 Cf 4-10 245, 242, 236 3 0.46 0.71 0.597 Cf 10-5 308, 296, 281 3 0.50 0.71 0.648 Cf 4-9A 302, 299, 287 3 0.50 0.71 0.61
Mean 3.00 0.56 0.52 0.54SD 0.76 0.12 0.20 0.11
Locus designations follow Vargo and Henderson (2000). Geno-types were scored for one randomly chosen individual per colony.
October 2005 HUSSENEDER ET AL.: FORMOSAN TERMITE GENETIC STRUCTURE 1423
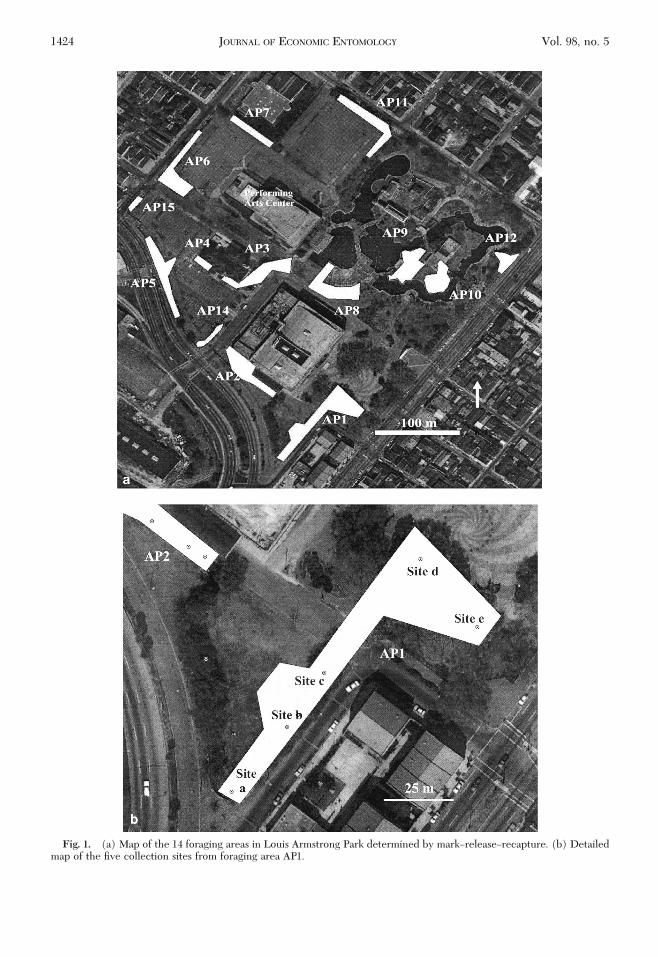
Fig. 1. (a) Map of the 14 foraging areas in Louis Armstrong Park determined by markÐreleaseÐrecapture. (b) Detailedmap of the Þve collection sites from foraging area AP1.
1424 JOURNAL OF ECONOMIC ENTOMOLOGY Vol. 98, no. 5

PearsonÕs correlation coefÞcient and the correlationwas subsequently tested for signiÞcance using a Man-tel test (1000 iterations, GENEPOP on the Web; Ray-mond and Rousset 1995).
To analyze the population genetic structure andinbreeding at the levels of the colony and population,hierarchical F-statistics were calculated using themethods of Weir and Cockerham (1984) as imple-mented in GDA (Lewis and Zaykin 2000). To assessthe signiÞcance of the F-statistics, 95% conÞdenceintervals (CI) were constructed by bootstrappingover loci. F values were considered signiÞcantly dif-ferent from zero if their conÞdence intervals did notspan zero. When two F values were compared, theywere considered signiÞcantly different when their95% CI did not overlap each other.
Traditionally, in nonsocial insects FIT signiÞes thecoefÞcient of inbreeding for individuals relative to thetotal population and can be divided into FST (thecoefÞcient of inbreeding of subpopulations relative tothe total population) and FIS (the coefÞcient of in-breeding of individuals within subpopulations). Be-cause of the strongly hierarchical genetic structure insocial insect populations (Ross 2001), it is reasonableto treat colonies as subpopulations (Thorne et al. 1999,Bulmer et al. 2001). Thus, FIT in social insects is anal-ogous to the standard inbreeding coefÞcient in non-social populations, FIS, and is a measure of the level ofinbreeding in individuals relative to the population.FCT is analogous to FST and represents the geneticdifferentiation among colonies.FIC is the coefÞcient ofinbreeding in individuals relative to their colony andreßects most clearly the colonyÕs breeding system(Thorne et al. 1999; Bulmer et al. 2001; Bulmer andTraniello 2002a; Vargo 2003a, b; Vargo et al. 2003a;DeHeer and Vargo 2004).Colony Social Organization andGenetic Structure.
We tested whether colonies were headed by a singlepair of reproductives (simple family colonies) or mul-tiple reproductives (extended family colonies) basedon the frequencies and classes of worker genotypes(Vargo 2003a, Vargo et al. 2003a). Colonies were con-sidered simple families if the classes of genotypes ofthe workers were consistent with those expected forthe offspring of a single pair of parents, and if thefrequencies of the observed genotypes did not differsigniÞcantly from the expected Mendelian ratios. De-viations from Mendelian ratios were determined be-tween observed and expected genotype frequencies ateach locus by a G-test for goodness-of-Þt. An overallG-value for each colony was obtained by summing allthe G-values across all eight loci. Colonies were con-sidered extended families when they had more geno-types than possible for the offspring of a monogamouspair or the observed frequencies of the genotypesdeviated signiÞcantly from those expected in simplefamilies (P � 0.05, G-test).
To further determine degrees of inbreeding withincolonies, we assessed average nest mate relatedness(r) for workers (RELATEDNESS 5.0.8, Queller andGoodnight 1989, 95% CI were obtained by jackkniÞngover loci) and calculated F-statistics by treating col-
onies as subpopulations as described above. The in-ferred reproductive structure together with estimatedvalues of relatedness and inbreeding were comparedwith the values predicted by simulations of a varietyof possible reproductive systems for subterranean ter-mites (Thorne et al. 1999, Bulmer et al. 2001).
From the worker genotypes present in each of thesimple family colonies, the genotypes of the parentswere reconstructed, and F-statistics for the reproduc-tives were estimated from the inferred genotypes.Pairwise relatedness between the parents was calcu-lated using SpaGeDi 1_1b (Hardy and Vekemans2002). To test whether parents were putative siblings,i.e., prior nest mates, we used likelihood calculationsin KINSHIP 1.3.1 (Goodnight and Queller 1999, avail-able at http://www.gsoftnet.us/GSoft.html). The nullhypothesis was that pairs were unrelated (r � 0),whereas the alternate hypothesis was that pairs werenest mates (r� 0.55 as determined by the average nestmate relatedness within all colonies; Table 2). Signif-icance at the level of P� 0.05 was determined by loglikelihood tests with 10,000 series of pairs created atrandom.
Results
General Statistics, Linkage Disequilibrium, andBottleneck. Each colony in the Louis Armstrong Parkpopulation was represented by termites from one cen-tral collection site per foraging area as we have pre-viously shown that different collection sites from thesame foraging area belong to one genetic unit, i.e., thesame colony (Husseneder et al. 2003a). To analyze thecolony organization, we genotyped 390 individualworker termites from the 14 colonies at eight micro-satellite loci. Each of the eight microsatellite loci waspolymorphic with two to four alleles observed acrossthe 14 colonies surveyed (Table 1).
Mean observed heterozygosity for all eight lociacross all 14 colonies was 0.52 (SD � 0.20) and cor-responded well with the expected heterozygosity 0.54(SD � 0.11; Table 1). We tested each locus for het-erozygote excess or deÞcit, i.e., deviations from Har-dy-Weinberg equilibrium. None of the eight locishowed signiÞcant heterozygote excess. Only Cf 4-4showed signiÞcant heterozygote deÞciency (P �0.006; P for a 5% signiÞcance level � 0.003 after Bon-ferroni correction). The most likely cause of hetero-zygote deÞciency at only one locus is the presence ofnull alleles. However, the genotypic distribution in thedata set with at least 18 individuals genotyped perlocus did not indicate the presence of null alleles. Infact, in eight coloniesCf 4-4 showed no deviation fromMendelian ratios and in six colonies the locus wasmonomorphic. No individual was found in which thislocus did not amplify consistently (null allele homozy-gote). Therefore, the slight heterozygote deÞcit ob-served was not due to the presence of null alleles.
There was signiÞcant evidence of a recent geneticbottleneck in the Louis Armstrong Park population forboth the inÞnite alleles model of mutation-drift equi-librium (P� 0.004) and the stepwise mutation model
October 2005 HUSSENEDER ET AL.: FORMOSAN TERMITE GENETIC STRUCTURE 1425

(P � 0.008, one-tailed Wilcoxon sign-rank test forheterozygote excess).Social Organization of Colonies. Permutation tests
of the distribution of genotypes between pairs of col-onies showed signiÞcant differentiation between eachpair of colonies at the 5% level. Each pair of colonieswas distinguished from each other by at least two andup to 13 private alleles, i.e., alleles only occurring inone of the colonies, but not the other (mean � 6.71,SD � 2.41, n � 91). Thus, the genetic differentiationfound in a previous study based on multilocus DNAÞngerprinting (Husseneder et al. 2003a) was con-Þrmed; the 14 colonies of Louis Armstrong Park weregenetically distinct. No signiÞcant correlation be-tween genetic distance (FCT) and geographic distancewas found (PearsonÕs r� 0.08, P� 0.20, Mantel test).
To assess whether colonies were headed by a singlepair (simple families) or by multiple reproductives(extended families), we analyzed genotypes of at least18 workers per colony. Eight colonies (57%) had ge-notypes and genotype frequencies consistent with thepresence of a single pair of reproductives and werethus considered to be simple families. Six colonies(43%) had genotypes or genotype frequencies incon-sistent with simple families, indicating the presence ofmultiple same-sex reproductives in an extended family(Table 2).
The F-statistics and relatedness values with their95% conÞdence intervals estimated from the workergenotypes across all loci and colonies are shown inTable 3, along with values derived from computersimulations by Thorne et al. (1999), Bulmer et al.(2001), and Vargo (2003a, b). Overall, FCT was large(0.31) and conÞrmed the genetic differentiation be-tween colonies. Workers within colonies were mod-erately inbred on the level of the local population (FIT� 0.13) and showed highly negative FIC-values (FIC ��0.28), consistent with low numbers of reproductives
within colonies. Nestmates were closely related toeach other (r � 0.55).F-statistics and relatedness analyses considering the
eight simple families and six extended family coloniesseparately yielded values not signiÞcantly differentfrom the overall population and each other. Simplefamily colonies showed genetic differentiation, andlow inbreeding within colonies with intracolonial re-latedness not signiÞcantly different from 0.5 as didextended family colonies (Table 3). No signiÞcantdifferences were found comparing simple family col-onies versus extended family colonies in genetic dif-ferentiation (FCT), nor in the degrees of inbreedingandrelatedness (FIC and r)withincolonies(two-sidedP values �0.20; permutation test, FSTAT).
The F values for simple family colonies were notsigniÞcantly different (based on the overlapping 95%CI) from those of the computer simulations for col-onies headed by a pair of outbred reproductives(Table 3, case A.1). The empirical values for extendedfamily colonies did not provide a clear match with anyof the simulated breeding systems, but the highly neg-ative FIC value is suggestive of a low number of re-productives, on the order of fewer than 10 (Table 3).Nevertheless, certain breeding systems could be ex-cluded, such as a high number of neotenics inbreedingover at least three generations (case B.3), pleometro-sis (case C), and mixing of unrelated workers at col-lection sites (case D).
Reproductives of simple family colonies were notsigniÞcantly inbred based on the genotypes inferredfrom their worker offspring (FIT � 0.02, 95% CI ��0.14Ð0.11). Overall, reproductive pairs were lessinbred than workers but the difference was not sig-niÞcant (FIT � 0.13, 95% CI � 0.03Ð0.25). Relatednessbetween the reproductives within pairs (r � 0.11,SD � 0.41, n � 8) was slightly higher than the pop-ulation background derived from pairwise compari-
Table 3. F-statistics and relatedness coefficients for C. formosanus workers of 14 colonies from Louis Armstrong Park, New Orleans,and expected values for different breeding systems derived from computer simulations
FIT FCT FIC r
All colonies (n � 14) (95% CI) 0.13 (0.03 to 0.25) 0.31 (0.25 to 0.40) �0.28 (�0.38 to �0.21) 0.55 (0.47 to 0.64)Simple family colonies (n � 8) (95% CI) 0.12 (�0.01 to 0.26) 0.30 (0.24 to 0.38) �0.27 (�0.36 to �0.16) 0.53 (0.46 to 0.62)Extended family colonies (n � 6) (95% CI) 0.16 (0.03 to 0.32) 0.34 (0.26 to 0.46) �0.28 (�0.33 to �0.23) 0.60 (0.49 to 0.70)Simulated breeding system
(A) Simple family colonies with(1) outbred reproductive pairs 0.00 0.25 �0.33 0.50(2) inbred pairs Nf � Nm � 1, X� 1 0.33 0.42 �0.14 0.62
(B) Extended family colonies with inbreedingamong multiple neotenics
(1) Nf � 2, Nm � 1, X� 1 0.26 0.35 �0.14 0.55(2) Nf � Nm � 10, X� 1 0.33 0.34 �0.01 0.51(3) Nf � Nm � 10, X� 3 0.37 0.38 �0.02 0.56(4) Nf � 200, Nm � 100, X� 3 0.33 0.34 �0.00 0.50
(C) PleometrosisNf � 1, Nm � 2 0.00 0.19 �0.23 0.38
(D) Inbreeding, then mixing of unrelatedworkers from two colonies (1:4)
Nf � Nm � 10, X� 3, p� 0.8 0.37 0.25 0.15 0.36
For the simulated breeding systems, X represents the number of generations of production of replacement reproductives within a colony;Nf and Nm represent the number of replacement females and males, respectively, produced per generation (Thorne et al. 1999, Bulmer et al.2001).
1426 JOURNAL OF ECONOMIC ENTOMOLOGY Vol. 98, no. 5
sons between reproductives from different colonies(r � �0.08, SD � 0.36, n � 112, two-tailed MannÐWhitneyU,P� 0.13); however, this difference was notsigniÞcant due to the small number of single pairs andthe large standard deviation of the relatedness values.The latter reßects the wide range of the relatednessvalues between pairs (range �0.75Ð0.62). Only incolony AP15 were the parents putative siblings, i.e.,they most likely originated from the same colony(10,000 simulations, P � 0.05).GeneticDifferentiationwithinColonies.We found
small but signiÞcant genetic differentiation among ter-mites from Þve different collection sites within theforaging area of the spatially expansive colony AP1.SigniÞcant differentiation in the genotypic distribu-tion occurred between six of the 10 pairings of col-lection sites (Fisher method, �2 � inÞnity, df � 14Ð16,P � 0.001). The detected genetic differentiationamong termites from different collection sites of AP1(FCT � 0.02, SD � 0.01, n � 10) was signiÞcantlysmaller than the differentiation among groups of ter-mites from different colonies (average FCT � 0.31,SD � 0.09, n � 91; Fig. 2, two-tailed MannÐWhitneyU, P � 0.001). This result is consistent with all thetermites within AP1 belonging to a single colony withslight differentiation among spatially separated por-tions of the foraging area.Correlation of Genetic, Colony Characteristics andBehavioral Data. Previously, Messenger and Su(2005a, b) reported colony characteristics and aggres-sion of termite colonies in Louis Armstrong Park. Col-ony characteristics were described for 12 colonies, andaggression was described for 11 of the colonies inves-tigated in the current study. We correlated their datawith our results concerning social organization andgenetic distance.
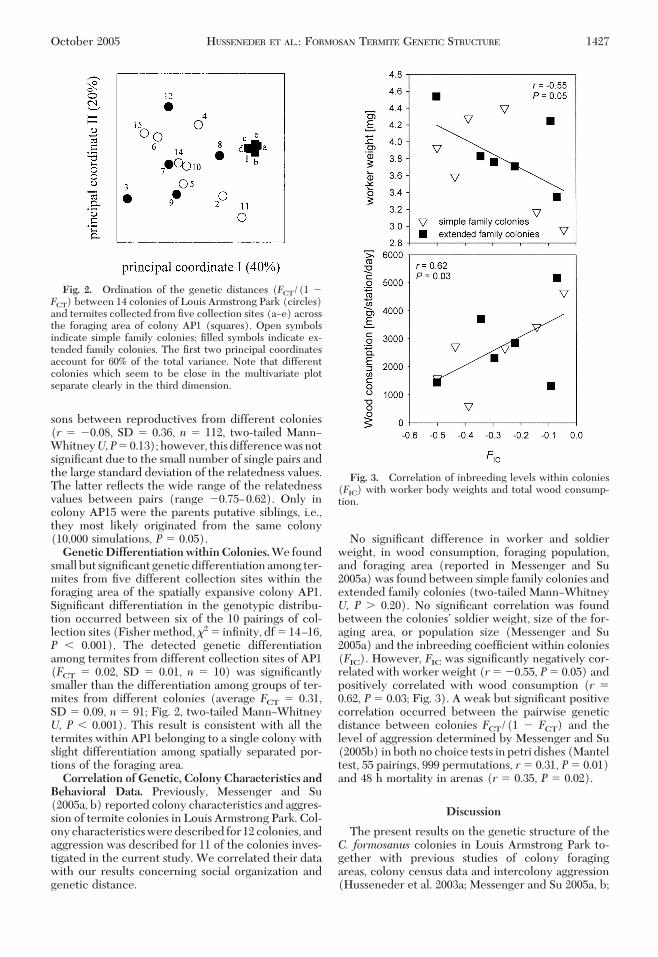
No signiÞcant difference in worker and soldierweight, in wood consumption, foraging population,and foraging area (reported in Messenger and Su2005a) was found between simple family colonies andextended family colonies (two-tailed MannÐWhitneyU, P � 0.20). No signiÞcant correlation was foundbetween the coloniesÕ soldier weight, size of the for-aging area, or population size (Messenger and Su2005a) and the inbreeding coefÞcient within colonies(FIC). However, FIC was signiÞcantly negatively cor-related with worker weight (r� �0.55, P� 0.05) andpositively correlated with wood consumption (r �0.62, P � 0.03; Fig. 3). A weak but signiÞcant positivecorrelation occurred between the pairwise geneticdistance between colonies FCT/(1 � FCT) and thelevel of aggression determined by Messenger and Su(2005b) in both no choice tests in petri dishes (Manteltest, 55 pairings, 999 permutations, r� 0.31, P� 0.01)and 48 h mortality in arenas (r � 0.35, P � 0.02).
Discussion
The present results on the genetic structure of theC. formosanus colonies in Louis Armstrong Park to-gether with previous studies of colony foragingareas, colony census data and intercolony aggression(Husseneder et al. 2003a; Messenger and Su 2005a, b;
Fig. 2. Ordination of the genetic distances (FCT/(1 �FCT) between 14 colonies of Louis Armstrong Park (circles)and termites collected from Þve collection sites (aÐe) acrossthe foraging area of colony AP1 (squares). Open symbolsindicate simple family colonies; Þlled symbols indicate ex-tended family colonies. The Þrst two principal coordinatesaccount for 60% of the total variance. Note that differentcolonies which seem to be close in the multivariate plotseparate clearly in the third dimension.
Fig. 3. Correlation of inbreeding levels within colonies(FIC) with worker body weights and total wood consump-tion.
October 2005 HUSSENEDER ET AL.: FORMOSAN TERMITE GENETIC STRUCTURE 1427

Messenger et al. 2005), provide the most comprehen-sive view to date of the population genetics, breedingsystem, ecology, and behavior of an introduced pop-ulation ofC. formosanus.Our genetic analyses showedthat termite colonies in Louis Armstrong Park wereapproximately equally divided between simple andextended families. One would expect colonies withmultiple reproductives to have greater populationsize and thus occupy larger territories and consumemore wood than simple family colonies with just onereproductive pair (Thorne et al. 1999, Grube and For-schler 2004). Our results did not support this predic-tion. Although the two colonies with the largest for-aging areas were extended families (AP1 with 1,634m2, and AP8 with 1,186 m2; Messenger and Su 2005a),we found no signiÞcant difference overall betweensimple families and extended families in the threevariables associated with colony size: size of theworker population, size of foraging area, or quantity ofwood consumed.
This lack of association between family type andcharacteristics linked to colony size may be due in partto the difÞculty of measuring the latter accurately,especially the size of the worker population and totalamount of wood consumed by colonies. For practicalreasons, colony population size can only be estimatedby the indirect method of markÐreleaseÐrecapturebecause excavation of colonies for direct colony cen-sus is not feasible given their large underground for-aging areas and the destructive and time-consumingnature of the procedure. MarkÐreleaseÐrecapture canlead to biased estimates of the actual number of work-ers in a colony if there is intracolony differentiation,because this violates one of the main assumptions ofthis method, that of equal distribution and free inter-change of individuals within the entire foraging area(Evans et al. 1999). In fact, we did Þnd signiÞcantgenetic differentiation among collection sites withinthe most expansive colony, AP1, indicating that, in atleast this one colony, the markÐreleaseÐrecapturetechnique probably did not provide an accurate esti-mate of colony size. Wood consumption was deter-mined from artiÞcial monitoring stations, which likelycomprised only a few of a much larger number of otherfood sources used by the study colonies. Thus woodconsumption, as measured by Messenger and Su(2005a), may depend as much or more on the amountof other food materials to which a colony has accessas the number of individuals in the colony. Of thesethree variables likely to be associated with colony size,the most accurately measured was probably foragingarea, but still we found no difference between simpleand extended families. Recently, DeHeer and Vargo(2004) also reported a lack of association betweencolony breeding structure and size of foraging areain Reticulitermes flavipes Kollar, suggesting thatthe presence of multiple neotenics in this species isnot associated with more expansive foraging areaseither. However, among extended family colonies ofR.flavipes,both DeHeer and Vargo (2004) and Bulmerand Traniello (2002a) found a positive associationbetween foraging area and level of inbreeding within
colonies (FIC), suggesting that within this colony type,larger colonies have more reproductives and possiblyspatially separate reproductive centers. No such cor-relation was found in the current study for C. formo-sanus, possibly because competition among neighbor-ing colonies might have limited expansion of foragingareas of extended families (Messenger and Su 2005b),or the extended family colonies in our study werecomparatively young as suggested by the fact thatthey were not signiÞcantly more inbred than simplefamilies (see below).
Our results may provide some insight into the fac-tors underlying the considerable variation amongC. formosanus colonies in the size of workers, a phe-nomenon noted by others (Su and Scheffrahn 1988a)but for which no explanation had been previouslyoffered. Although we found no signiÞcant differencebetween simple and extended families in size of work-ers, across both colony types combined there was asigniÞcant negative correlation between the level ofinbreeding within colonies (FIC) and worker bodysize, as measured by weight. The colony inbreedingcoefÞcient also was positively correlated with woodconsumption. Together, these results suggest thatcolonies that are more inbred have smaller workersand consume more food. A negative relationship be-tween worker size and wood consumption also wasreported by Su and La Fage (1984). One possibleexplanation for why more inbred colonies mighthave smaller workers is that inbreeding negativelyaffects development, resulting in slightly stuntedgrowth. It is of interest to note that such a negativeeffect of inbreeding on growth rates and adult bodysize has recently been reported in the subsocial spiderStegodyphus lineatus Latreille (Bilde et al. 2005), sug-gesting this may be a widespread consequence ofinbreeding, at least in arthropods. However, the as-sumption that smaller worker size is a sign of inbreed-ing depression and thus associated with a negativeeffect on the termite colony, is inconsistent with pre-vious Þndings suggesting that termite colonies withsmaller workers are actually more vigorous and there-fore more active foragers (Shimizu 1962, Grace et al.1995).More studieson themechanisms linkingworkersize, inbreeding, and breeding structure of termitecolonies are needed.
In a previous study, pairwise aggression tests be-tween 11 of the Louis Armstrong Park colonies re-vealed variable levels of agonism (Messenger and Su2005b). These aggression levels were weakly but sig-niÞcantly correlated with genetic distances amongcolonies determined in the current study, suggestingthere is some genetic component to colony labelsleading to colony mate recognition and discrimination(Beye et al. 1997). Genetically based discriminationcues have been suggested for other termite species(Adams 1991, Husseneder et al. 1998, Kaib et al. 2004),but two previous studies with C. formosanus failed todetect a genetic inßuence on levels of intercolonialaggression (Husseneder and Grace 2001, Florane et al.2004). The reasons for the discrepancy between thecurrent study and the previous work are not clear,
1428 JOURNAL OF ECONOMIC ENTOMOLOGY Vol. 98, no. 5

but there are several mutually compatible possibilities.First, there could simply be variation among popula-tions in the level of intraspeciÞc aggression (Su andHaverty 1991) and the extent to which genetic factorsinßuence behavior toward foreign conspeciÞcs suchthat genetically based odor cues are more important ininßuencing agonism in some populations. Second,there could be differences between studies in thetypes of genetic markers used to assess genetic rela-tionships among colonies. Using multilocus DNA Þn-gerprinting, Husseneder and Grace (2001) did notÞnd a signiÞcant correlation between intercolonialaggression and genetic similarities in a population of17 colonies from Oahu, HI. However, multilocus DNAÞngerprinting may not be as precise as the micro-satellite markers used in the current study for quan-tifying genetic distances (Husseneder et al. 2003b).Small sample size may account for the lack of a sig-niÞcant relationship between aggression levels andgenetic similarities as measured by microsatellitemarkers among only four colonies from Louisiana asrecently reported by Florane et al. (2004).
Another possible reason why we found a relation-ship between genetic similarity and agonistic behaviornot detected in previous studies may have to do withthe detailed nature of the current study. Our studyconcerned a small area with neighboring colonies,which probably encountered each other frequently inthe Þeld. The high frequency of these encountersmight have led to aggression mediated by genetic cuesbetween familiar neighboring colonies, which may notoccur in colonies so distant that they would nevermeet under natural conditions. Encounter-inducedhostility has been described in the ants Cataglyphisfortis Forel (Knaden and Wehner 2003) and Pristo-myrmex pungensMayr (Sanada-Morimura et al. 2003).This phenomenon, which is the opposite of the dear-neighbor concept, also has been reported in othersocial insects, including the nest building termite,Nasutitermes corniger Motschulsky (Dunn and Mes-sier 1999). However, no evidence for increased ag-gression among neighboring colonies was found in theeastern subterranean termite R. flavipes (Bulmer andTraniello 2002b), suggesting that this is not a universalphenomenon in termites. Further detailed studies ofthe genetic relationships among colonies and levels ofaggression are needed to determine whether the pos-itive relationship found in the current study is generalin this species. Of particular importance will be studiesof native populations which are genetically more di-verse than introduced populations (see below).
Genetic diversity in the Louis Armstrong Park pop-ulation, as measured by allele number per locus, waslow (2.9) compared with most other populations ofC. formosanus investigated so far, but it was similar toa neighboring population from City Park, New Or-leans (3.1, n � 17 colonies, unpublished data). Threeother introduced populations had more alleles perlocus on average, Oahu, HI (3.9, n � 12 colonies;unpublished data), Rutherford County, North Caro-lina (3.5, n � 8 colonies; unpublished data), andKyushu, Japan (6.0, n � 20 colonies; Vargo et al.
2003a), whereas two introduced populations hadslightly lower allele numbers: Fukue, Japan (2.7, n �10 colonies; Vargo et al. 2003a) and Charleston, SC 1.9,n � 25 colonies; unpublished data). As expected, anative population from China had the highest numberof alleles per locus (6.4, n� 13 colonies; unpublisheddata).
Reduced genetic diversity can be caused by geneticdrift and/or a recent genetic bottleneck, i.e., a sharpreduction in population size (Cornuet and Luikart1996, Piry et al. 1999). Such a drop in effective pop-ulation size often occurs when a species is introducedto a new area (founder effect). Not surprisingly, wedetected a recent genetic bottleneck in the LouisArmstrong Park population, which was reportedlyfounded only 30 yr ago from wood brought in from anearby military base (Scott and Scott 1996). Thus, theLouis Armstrong Park population was likely estab-lished by a very small population that had undergoneat least two recent bottlenecks, the Þrst during itsintroduction to New Orleans and the second upon itsintroduction to the park from a nearby population. Inaddition to its introduction history, a bottleneck alsomight reßect the continuous effort to control termitepopulations in New Orleans, leading to frequent re-ductions in population size. We also have found evi-dence of a recent bottleneck in two other introducedpopulations on the U.S. mainland (City Park, n � 17colonies; and Charleston, n� 25 colonies), but not ina third population (Rutherford County), which con-sisted of only eight colonies (unpublished data). Incontrast, in a previous study we did not detect a recentbottleneck in two introduced populations in Japan,where C. formosanus has been established for some300 yr (Vargo et al. 2003a). The lack of a trace of arecent bottleneck in these Japanese populations is notunexpected considering that the heterozygosity ex-cess caused by loss of rare alleles during a bottleneck,which forms the basis of the tests used, is expected topersist for only a couple of dozen generations (Cor-nuet and Luikart 1996).F-statistics conducted to describe the small scale
population structure of Louis Armstrong Park termitesrevealed moderate inbreeding on the population level(FIT � 0.13). Because of the hierarchical nature of theanalysis in our study and in other similar studies, FIT,when estimated for a single population, is equivalentto the standard inbreeding coefÞcient FIS applied tosolitary breeders. The degree of total inbreeding var-ies within and among subterranean termite speciesand depends on the relatedness among founders, thefrequency of colonies headed by neotenics, the num-ber of reproductives within neotenic-headed colonies,and the number of generations of inbreeding withincolonies. The level of inbreeding in the Louis Arm-strong Park population studied here is very similar tothat found in a nearby population from City Park(FIT � 0.08; unpublished data), despite the fact thatthe latter population had a higher frequency of simplefamily colonies (82 versus 57% in Louis ArmstrongPark). Similar levels of inbreeding also have beenfound in introduced populations in Charleston (FIT �
October 2005 HUSSENEDER ET AL.: FORMOSAN TERMITE GENETIC STRUCTURE 1429

0.14; unpublished data), in which 48% of 25 colonieswere simple families, and in Kyushu (FIT � 0.16; Vargoet al. 2003a), in which 85% of 20 colonies were simplefamilies. A population of eight colonies in RutherfordCounty of which six were simple families, was foundto have a higher level of inbreeding (FIT � 0.24; un-published data). The most inbred population found todate is that of Fukue, Japan, in which 10 colonies, allsimple families, had an inbreeding coefÞcient of FIT �0.46. The high level of inbreeding in this populationwas primarily due to the high degree of relatedness ofnestmate reproductives heading simple family colo-nies (r� 0.61). Similar variation in levels of inbreedinghas been reported for native populations ofR. flavipes,where values of FIT ranged from 0.62 in Tennessee(Reilly 1987), 0.34 and 0.27 in Massachusetts (Bulmeret al. 2001) where 0 and 38% of colonies were simplefamilies, to 0.05Ð0.12 in North Carolina (Vargo 2003a,b; DeHeer and Vargo 2004), where �75% of colonieswere simple families. Two populations of Reticuli-termes santonensis (Feytaud) in France, which mostlikely are R. flavipes that was introduced from theUnited States and became established there �100 yrago (Clement et al. 2001, Jenkins et al. 2001, Austin etal. 2002, Marini and Mantovani 2002, Luchetti et al.2004, Uva et al. 2004, Ye et al. 2004), were moderatelyto highly inbred (FIT � 0.17 and 0.39; Dronnet et al.2005); both of these populations consisted entirely ofextended family colonies (Dronnet et al. 2005).
Eight (57%) of the 14 colonies in Louis ArmstrongPark showed Mendelian distribution of genotypes andwere therefore simple family colonies headed by amonogamous pair. The proportion of simple familycolonies falls into the rather large range for otherintroduced C. formosanus populations that have beenstudied: Oahu, 30% of 20 colonies (Vargo et al. 2003b);Charleston, 48% of 25 colonies (unpublished data);Rutherford County, 67% of eight colonies (unpub-lished data); City Park, 82% of 17 colonies (unpub-lished data); Kyushu, 85% of 20 colonies; and Fukue,Japan, 100% of 10 colonies (Vargo et al. 2003a). Incontrast, a native population of 14 colonies in Guang-dong, China, consisted exclusively of extended fami-lies (C.H.,E.L.V., and J.K.G., unpublisheddata).Thus,apart from having at least some simple family colonies,there seems to be considerable variation among dif-ferent introduced populations in the reproductivestructure of colonies. It is not clear whether suchdifferences might be due to variation in age structureof colonies, ecological conditions, or genetic compo-sition.
The pairs of reproductives in simple family coloniesin the current study were outbred (FIT � 0.02), and onaverage no more related to each other than to indi-viduals in the population as a whole. Only one of theeight simple family colonies was headed by putativesiblings, i.e., former nest mates. Together with the factthat relatedness of tandem running dealated pairs dur-ing swarming in the French Quarter, New Orleans,was not signiÞcantly different from the populationbackground (C.H., unpublished data), these resultssuggest that mating is independent of the repro-
ductivesÕ relatedness and does not involve kin recog-nition. Similarly, simple family colonies in some othersubterranean termites are predominantly headed byunrelated primary reproductives, e.g., R. flavipes inMassachusetts (Bulmer et al. 2001) and North Caro-lina (Vargo 2003a, b; DeHeer and Vargo 2004), andSchedorhinotermes lamanianus Sjostedt in Kenya(Husseneder et al. 1999). The only exception to thesegeneral Þndings so far was the unusually high relat-edness between pairs of reproductives in simple fam-ily colonies in a Japanese population in Fukue (r �0.61; Vargo et al. 2003a). Additional genetic and eco-logical studies of introduced and native populations ofC. formosanus are needed to determine the extent towhich colonies are founded by unrelated reproduc-tives and what environmental and/or genetic factorspromote pairing of close relatives during colonyfounding.
The prevalence of simple family colonies headed byoutbred pairs in the Louis Armstrong Park populationstudied here indicates a relatively young population,because the production of neotenic replacement re-productives occurs later in the colony life cycle(Thorne 1998, Thorne et al. 1999). Thus, an areawith a high proportion of colonies headed by singlepairs may indicate that it was recently colonized byswarming termites, resulting in a population of uni-formly young colonies. Alternatively, it could meanthat simple family colonies of C. formosanus in thepopulation are fairly short-lived so that fewer than halfthe established colonies live long enough to produceneotenics, as has been proposed for populations ofR. flavipes in North Carolina (Vargo 2003a). Further-more, the fact that extended family colonies of LouisArmstrong Park were not signiÞcantly more inbredthan their simple family counterparts suggests thatthese colonies also were relatively young, headed byreproductives that were only a generation or two re-moved from the founders. In contrast to the presentÞndings on C. formosanus in Louis Armstrong Park,extended families in Kyushu (Vargo et al. 2003a), CityPark (unpublished data), Charleston (unpublisheddata), and Rutherford County (unpublished data)clearly showed higher degrees of inbreeding than sim-ple family colonies in the same population. This sug-gests that extended family colonies in these otherpopulations contain more neotenics and/or neotenicsinbreed for more generations than those in LouisArmstrong Park.
Nearly half the 14 colonies (47%) studied here wereheaded by multiple reproductives as inferred from theclasses and frequencies of genotypes among workernest mates. F values and the coefÞcient of relatednessindicated that the multiple reproductives did not arisefrom pleometrosis (multiple same-sex reproductivescooperating in colony founding), which would lead tolower FIT and relatedness values than those observed(Table 3, case C), nor from colony fusion, whichwould result in positive FIC values and relatednesslower than 0.5 (Thorne et al. 1999, Bulmer et al. 2001).Thus, colonies with multiple reproductives were trueextended families consisting of the neotenic descen-
1430 JOURNAL OF ECONOMIC ENTOMOLOGY Vol. 98, no. 5
dants of monogamous pairs of founders. This seems tobe generally true for this species as it has been foundin six other introduced populations (Vargo et al. 2003a,b; unpublished data). The closest match between theempirical F-statistics and relatedness values obtainedhere with those predicted for various types of ex-tended families is for colonies headed by the leastnumber of multiple neotenics possible, that is, twofemale and one male neotenic who are the directdescendants of the founding pair (Table 3, case B.1).Even so, the empirical values for levels of inbreedingin individuals relative to the total population (FIT) andfor individuals relative to their own colonies (FIC) aresomewhat lower than the predicted values but onlysigniÞcantly so in the latter case (based on non overlapof the 95% CI). The reason for such low F values inextended family colonies is not clear, but one possi-bility is that at least some colonies contain a mixtureof primary founders and their neotenic offspring re-sulting in colonies less inbred than those headed byneotenics only. The presence of both primary repro-ductives and neotenics in colonies may reßect thebeginning of a turnover from the Þrst generation offounders to the second generation of replacementreproductives. Another possibility is that such colo-nies have very few neotenics but have unequal repro-duction so that a single pair within each colony pro-duces most of the offspring. Distinguishing betweenthese possibilities will require further studies combin-ing more detailed genetic analyses with nest censuses.
Mature colonies of C. formosanus may contain mil-lions of individuals with foraging areas extending�3,500 m2 (Su and Scheffrahn 1988b). The occur-rence of extended family colonies with multiple re-productives coupled with the tendency of this speciesto produce satellite nests, could lead to genetic dif-ferentiation within colonies (Roisin and Pasteels 1986,Su and Tamashiro 1987, Husseneder et al. 1998). Sep-arate breeding units within a colony could have im-portant implications for the sociogenetics and man-agement of termites. We detected subtle geneticdifferentiation among collection sites within the for-aging area of the most expansive colony. The magni-tude of differentiation was substantially smaller thanthe differentiation between colonies and was due todifferences in allele and genotype frequencies ratherthan to differences in genotypes or alleles.
The occurrence of spatially separate reproductivecenters could potentially lead to colony reproductionby budding, should connections among reproductivecenters become severed. It is thought that multiple-site nesting termites, which includes many subterra-nean termite species such asC. formosanus (Shellman-Reeve 1997), efÞciently exploit spatially heterogeneousresources by increasing the number of colonies throughbudding (Clement 1981, Roisin and Pasteels 1986, Hus-seneder et al. 1998, Thorne 1998). However, detailedgenetic studies on a small scale capable of detectingbudding are few, and those that have been conducted,e.g., on R. flavipes (Bulmer and Traniello 2002a, Vargo2003a, DeHeer and Vargo 2004), have failed to Þnd ev-idence of frequent colony reproduction by budding.
Thatbuddingmayoccur inC. formosanus is suggestedbyresults from a Japanese population, in which Vargo et al.(2003a) found a positive FIC value in extended familycolonies, a Þnding consistent with nest budding withinterconnected daughter nests (Thorne et al. 1999).However, thefact thatall14colonies inthecurrentstudywere genetically distinct and had discreet foraging areasand the fact that there was no signiÞcant isolation bydistance suggest that colony reproduction by budding isnot common in the Louis Armstrong Park population.Perhaps budding, if it occurs at all in this species, islimited to the rare, large colonies with spatially separatereproductive centers, and is therefore difÞcult to detect.Longer term studies in which the foraging areas andgenetic structure of individual colonies are tracked overtime are needed to fully investigate the possibility ofcolony reproduction by budding in C. formosanus andother subterranean termites.
Like other subterranean termites, C. formosanuspossesses a great deal of plasticity in social organiza-tion, providing for the possibility of shifts in socialorganization after introductions to new areas thatcould favor invasiveness. Although colony reproduc-tive structure has yet to be fully characterized innative populations, the present results together withthose on other introduced populations suggest therehave not been widespread changes in colony breedingstructure common to introduced populations. Rather,introduced populations seem to consist of geneticallyand spatially distinct colonies comprised of close fam-ily groups founded by monogamous pairs of primaryreproductives, albeit with considerable variation inthe frequency of extended families and levels of in-breeding. In this respect, introduced populations ofC. formosanus differ from those of many invasive ants,which frequently exhibit unicoloniality and the atten-dant traits of polygyny, colony reproduction by bud-ding and reduced intraspeciÞc aggression (Holway etal. 2002, Tsutsui and Suarez 2003). More extensivestudies are needed to determine whether the ob-served variation in colony reproductive structureamong introduced populations of C. formosanus is re-lated to the severity of different invasive populations,and whether this variation is associated with the ageof populations, local ecological conditions, or geneticcomposition. In light of current results, the key tounderstanding the invasion success of C. formosanusmay have as much to do with other features of itsbiology that are characteristic of invasive species gen-erally, such as relatively broad diet (Lai et al. 1983),ability to use a variety of nesting sites, and tolerancefor disturbed habitats, than with particular features ofits colony social organization. Continued work on thegenetics, ecology and behavior of native and intro-duced populations of this destructive pest will helpshed light on why C. formosanus is such a successfulinvader.
Acknowledgments
We thank S. Garner and T. Juba for technical assistance.L. Foil, G. Henderson, and D. Prowell provided valuable
October 2005 HUSSENEDER ET AL.: FORMOSAN TERMITE GENETIC STRUCTURE 1431

comments on an earlier draft of the manuscript. Thiswork was supported by USDAÐARS SpeciÞc CooperativeAgreements 58-6435-8-107, 58-6615-9-018, and 58-6435-2-0023, and the Tropical/Subtropical Agriculture Research(#HAW00987-1011S and #HAW00990-1013S) programs.Approved for publication by the Director, LA AgriculturalExperiment Station, as Manuscript No. 05-26-0188.
References Cited
Adams,E.S. 1991. Nest-mate recognitionbasedonheritableodors in the termiteMicrocerotermes arboreus. Proc. Natl.Acad. Sci. U.S.A. 88: 2031Ð2034.
Austin, J. W., A. L. Szalanski, P. Uva, A.-G. Bagneres, andA. Kence. 2002. A comparative genetic analysis of thesubterranean termite genus Reticulitermes (Isoptera:Rhinotermitidae). Ann. Entomol. Soc. Am. 95: 753Ð760.
Beye, M., P. Neumann, and R.F.A. Moritz. 1997. Nestmaterecognition and the genetic gestalt in the mound-buildingant Formica polyctena. Insectes Soc. 44: 49Ð58.
Bilde, T., Y. Lubin, D. Smith, J. M. Schneider, andA. A. Maklakov. 2005. The transition to social inbredmating systems in spiders: role of inbreeding tolerance ina subsocial predecessor. Evolution 59: 160Ð174.
Bulmer, M. S., and J.F.A. Traniello. 2002a. Foraging rangeexpansion and colony genetic organization in the sub-terranean termite Reticulitermes flavipes (Isoptera:Rhinotermitidae). Environ. Entomol. 31: 293Ð298.
Bulmer, M. S., and J.F.A. Traniello. 2002b. Lack of aggres-sion and spatial association of colony members in Reticu-litermes flavipes. J. Insect Behav. 15: 121Ð126.
Bulmer,M. S., E. S. Adams, and J.F.A. Traniello. 2001. Vari-ation in colony structure in the subterranean termiteReticulitermes flavipes. Behav. Ecol. Sociobiol. 49: 236Ð243.
Clement, J.-L. 1981. Enzymatic polymorphism in the Euro-pean populations of various Reticulitermes species(Isoptera), pp. 49Ð62. In P. E. Howse and J.-L. Clement[eds.], Biosystematics of social insects. Academic, Lon-don, United Kingdom.
Clement, J.-L., A.-G. Bagneres, P. Uva, L. Wilfert, A. Quin-tana, J. Reinhard, and S. Dronnet. 2001. Biosystematicsof Reticulitermes termites in Europe: morphological,chemical and molecular data. Insectes Soc. 48: 202Ð215.
Cornuet, J. M., and G. Luikart. 1996. Description andpower analysis of two tests for detecting recent popula-tion bottlenecks from allele frequency data. Genetics144: 2001Ð2014.
DeHeer, C. J., and E. L. Vargo. 2004. Colony genetic orga-nization and colony fusion in the termite Reticulitermesflavipes as revealed by foraging patterns over time andspace. Mol. Ecol. 13: 431Ð441.
Dronnet, S., M. Chapuisat, E. L. Vargo, C. Louhou, andA.-G. Bagneres. 2005. Genetic analysis of the breedingsystem of an invasive subterranean termite,Reticulitermessantonensis, in both urban and natural habitats. Mol. Ecol.14: 1311Ð1320.
Dunn R., and S. Messier. 1999. Evidence for the oppositeof a dear enemy phenomenon in termites. J. InsectBehav. 12: 461Ð464.
Evans, T. E., M. Lenz, and P. V. Gleeson. 1999. Estimatingpopulation size and forager movement in a tropical sub-terranean termite (Isoptera: Rhinotermitidae). Environ.Entomol. 28: 823Ð830.
Florane, C. B., J. M. Bland, C. Husseneder, and A. K. Raina.2004. Diet-mediated inter-colonial aggression in theFormosan subterranean termite Coptotermes formosanus.J. Chem. Ecol. 30: 2559Ð2574.
Goodnight, K. F., and D. C. Queller. 1999. Computer soft-ware for performing likelihood tests of pedigree relation-ship using genetic markers. Mol. Ecol. 8: 1231Ð1234.
Goudet, J. 1995. FSTAT (version 1.2): a computer programto calculate F-statistics. J. Hered. 86: 485Ð486.
Goudet, J. 2001. FSTAT, a program to estimate and test genediversities and Þxation indices (version 2.9.3). http://www.unil.ch/izea/softwares/fstat.html.
Grace, J. K., R. T. Yamamoto, and M. Tamashiro. 1995. Re-lationship of individual worker mass and population de-cline in a Formosan subterranean termite colony(Isoptera: Rhinotermitidae). Environ. Entomol. 24: 1258Ð1262.
Grube, S., and B. T. Forschler. 2004. Census of monogyneand polygyne laboratory colonies illuminates dynamics ofpopulation growth in Reticulitermes flavipes (Isoptera:Rhinotermitidae). Ann. Entomol. Soc. Am. 97: 466Ð475.
Hardy, O. J., and X. Vekemans. 2002. SpaGeDi: a versatilecomputer program to analyse spatial genetic structure atthe individual or population levels. Mol. Ecol. Notes 2:618Ð620.
Holway, D. A., L. Lach, A. V. Suarez, N. D. Tsutsui, andT. J. Case. 2002. The causes and consequences of antinvasions. Annu. Rev. Ecol. Syst. 33: 181Ð233.
Husseneder, C., and J. K. Grace. 2001. Evaluation of DNAÞngerprinting, aggression tests and morphometry as toolsfor colony delineation of the Formosan subterraneantermite. J. Insect Behav. 14: 173Ð186.
Husseneder, C., E. L. Vargo, and J. K. Grace. 2003a. Molec-ular genetic methods: new approaches to termite biology,pp. 358Ð370. In B. Goodell, T. P. Schultz, and D. D.Nicholas [eds.], Wood deterioration and preservation:advances in our changing world. American Chemical So-ciety Symposium Series 845. American Chemical Society,Washington, DC.
Husseneder, C., R. Brandl, C. Epplen, J. T. Epplen, andM. Kaib. 1998. Variation between and within colonies inthe termite: morphology, genomic DNA, and behaviour.Mol. Ecol. 7: 983Ð990.
Husseneder, C., R. Brandl, C. Epplen, J. T. Epplen, andM. Kaib. 1999. Within-colony relatedness in a termitespecies: genetic roads to eusociality? Behaviour 136:1045Ð1063.
Husseneder, C., J. K. Grace, M. T. Messenger, E. L. Vargo,and N.-Y. Su. 2003b. Describing the spatial and socialorganization of Formosan subterranean termite colo-nies in Armstrong Park, New Orleans. Sociobiology 41:61Ð65.
Jenkins, T.M., C. J. Basten, S. Kresovich, and B. T. Forschler.1999. Mitochondrial gene sequence questions Reticuli-termes sp. social structure (Isoptera: Rhinotermitidae).Sociobiology 34: 161Ð172.
Jenkins, T. M., R. E. Dean, R. Verkerk, and B. T. Forschler.2001. Phylogenetic analyses of two mitochondrial genesand one nuclear intron region illuminate European sub-terranean termite (Isoptera: Rhinotermitidae) gene ßow,taxonomy, and introduction dynamics. Mol. Phylogenet.Evol. 20: 286Ð293.
Kaib, M., P. Jmhasly, L. Wilfert, W. Durka, S. Franke,W. Francke, R. H. Leuthold, and R. Brandl. 2004. Cu-ticular hydrocarbons and aggression in the termite Ma-crotermes subhyalinus. J. Chem. Ecol. 30: 365Ð385.
King, E. G., andW. T. Spink. 1969. Foraging galleries of theFormosan subterranean termite,Coptotermes formosanus,in Louisiana. Ann. Entomol. Soc. Am. 62: 536Ð542.
King, E. G., and W. T. Spink. 1974. Laboratory studies onthe biology of the Formosan subterranean termite with
1432 JOURNAL OF ECONOMIC ENTOMOLOGY Vol. 98, no. 5

primary emphasis on young colony development. Ann.Entomol. Soc. Am. 67: 953Ð958.
Knaden, M., and R. Wehner. 2003. Nest defense and con-speciÞc enemy recognition in the desert ant Cataglyphisfortis. J. Insect Behav. 16: 717Ð730.
LaFage, J. P. 1987. Practical considerations of the Formosansubterranean termite in Louisiana: A 30-year-old prob-lem, pp. 37Ð42. In M. Tamashiro and N.-Y. Su [eds.],Biology and Control of the Formosan SubterraneanTermite. College of Tropical Agriculture and HumanResources, University of Hawaii, Honolulu, HI.
Lai, P. Y., M. Tamashiro, J. R. Yates, N.-Y. Su, J. K. Fuji, andR. H. Ebesu. 1983. Living plants in Hawaii attacked byCoptotermes formosanus. Proc. Hawaii Entomol. Soc. 24:283Ð286.
Lewis, P. O., and D. Zaykin. 2000. Genetic data analysis:computer program for the analysis of allelic data, version1.0 (d12). http://alleyn.eeb.uconn.edu/gda/.
Luchetti, A., M. Trenta, B. Mantovani, and M. Marini. 2004.Taxonomy and phylogeny of north Mediterranean Re-ticulitermes termites (Isoptera, Rhinotermitidae): a newinsight. Insectes Soc. 51: 117Ð122.
Marini, M., and B. Mantovani. 2002. Molecular relation-ships among European samples of Reticulitermes(Isoptera, Rhinotermitidae). Mol. Phylogenet. Evol. 22:454Ð459.
Matsuura, K., and T. Nishida. 2001. Colony fusion in a ter-mite: what makes the society “open”? Insectes Soc. 48:378Ð383.
Messenger,M.T., andA. J.Mullins. 2005. New ßight distancerecorded for Coptotermes formosanus (Isoptera: Rhino-termitidae). Florida Entomol. 88: 99Ð100.
Messenger, M. T., and N.-Y. Su. 2005a. Colony characteris-tics and seasonal activity of the Formosan subterraneantermite (Isoptera: Rhinotermitidae) in Louis ArmstrongPark, New Orleans, Louisiana. J. Entomol. Sci. (in press).
Messenger, M. T., and N.-Y. Su. 2005b. Agonistic behaviorbetween colonies of the Formosan subterranean termitefrom Louis Armstrong Park, New Orleans, Louisiana.Sociobiology 45: 1Ð15.
Messenger, M. T., N.-Y. Su, C. Husseneder, and J. K. Grace.2005. Elimination and reinvasion studies with Copto-termes formosanus (Isoptera: Rhinotermitidae) in Loui-siana. J. Econ. Entomol. 98: 916Ð929.
Piry, S., G. Luikart, and J. M. Cornuet. 1999. BOTTLE-NECK: a computer program for detecting recent reduc-tions in the effective population size using allele fre-quency data. J. Hered. 90: 502Ð503.
Queller, D. C., and K. F. Goodnight. 1989. Estimating re-latedness using genetic markers. Evolution 43: 258Ð275.
Raina, A., Y. I. Park, and C. Florane. 2003. Behavior andreproductive biology of the primary reproductives of theFormosan subterranean termite (Isoptera: Rhinotermiti-dae). Sociobiology 41: 37Ð48.
Raymond, M., and F. Rousset. 1995. GENEPOP (version1.2): population genetics software for exact tests andecumenicism. J. Hered. 86: 248.
Reilly,L.M. 1987. Measurements of inbreeding and averagerelatedness in a termite population. Am. Nat. 130: 339Ð349.
Roisin, Y., and J. M. Pasteels. 1986. Replacement of repro-ductives in Nasutitermes princeps (Desneux) (Isoptera:Termitidae). Behav. Ecol. Sociobiol. 18: 437Ð442.
Ross, K. G. 2001. Molecular ecology of social behaviour:analyses of breeding systems and genetic structure. Mol.Ecol. 10: 265Ð284.
Sanada-Morimura, S., M. Minai, M. Yokoyama, T. Hirota,T. Satoh, and Y. Obara. 2003. Encounter-induced hos-
tility to neighbors in the ant Pristomyrmex pungens. Be-hav. Ecol 14: 713Ð718.
Scott, R. F., and H. G. Scott. 1996. The Formosan subterra-nean termite, Coptotermes formosanus. River Ridge, LA.
Shellman-Reeve, J. S. 1997. The spectrum of eusociality intermites, pp. 52Ð93. In J. C. Choe and B. J. Crespi [eds.],Social behavior in insects and arachnids. CambridgeUniversity Press, Cambridge, United Kingdom.
Spink, W. T. 1967. The Formosan subterranean termite inLouisiana. Louisiana State Univ. Circ 89: 1Ð12.
Shimizu, K. 1962. Analytical studies on the vitality of colo-nies of the Formosan subterranean termite, Coptotermesformosanus Shiraki. I. Analysis of the strength of vitality.Bull. Fac. Agric. Univ. Miyazaki 8: 106Ð110.
Su, N.-Y., and J. P. La Fage. 1984. Differences in survivaland feeding activity among colonies of the Formosansubterranean termite (Isoptera: Rhinotermitidae).J. Appl. Entomol. 97: 134Ð138.
Su, N.-Y., and M. Tamashiro. 1987. An overview of theFormosan subterranean termite (Isoptera: Rhinotermiti-dae) in the world, pp. 3Ð14. InM. Tamashiro and N.-Y. Su[eds.], Biology and control of the Formosan subterraneantermite. Research Extension Series 083. University ofHawaii, Honolulu, HI.
Su, N.-Y., and R. H. Scheffrahn. 1988a. Intra- and interspe-ciÞc competition of the Formosan and eastern subterra-nean termite: evidence from Þeld observations (Isoptera:Rhinotermitidae). Sociobiology 14: 157Ð164.
Su, N.-Y., and R. H. Scheffrahn. 1988b. Foraging populationand territory of the Formosan subterranean termite(Isoptera: Rhinotermitidae) in an urban environment.Sociobiology 14: 353Ð360.
Su,N.-Y., andM. I.Haverty. 1991. Agonisticbehavior amongcolonies of the Formosan subterranean termite, Copto-termes formosanus Shiraki (Isoptera: Rhinotermitidae),from Florida and Hawaii: lack of correlation with cutic-ular hydrocarbon composition. J. Insect Behav. 4: 115Ð128.
Thorne, B. L. 1998. Biology of subterranean termites of thegenusReticulitermes, pp. 1Ð30. InNPCA Research Reporton Subterranean Termites. National Pest Control Asso-ciation, Dunn Loring, VI.
Thorne, B. L., J.F.A. Traniello, E. S. Adams, and M. Bulmer.1999. Reproductive dynamics and colony structure ofsubterranean termites of the genus Reticulitermes(Isoptera Rhinotermitidae): a review of the evidencefrom behavioral, ecological and genetic studies. Ethol.Ecol. Evol. 11: 149Ð169.
Tsutsui, N. D., and A. V. Suarez. 2003. The colony structureand population biology of invasive ants. Conserv. Biol. 17:48Ð58.
Uva, P., J. L. Clement, J. W. Austin, J. Aubert, V. Zaffagnini,A. Quintana, and A.-G. Bagneres. 2004. Origin of a newReticulitermes termite (Isoptera, Rhinotermitidae) in-ferred from mitochondrial and nuclear DNA data. Mol.Phylogenet. Evol. 30: 344Ð353.
Vargo, E. L. 2003a. Hierarchical analysis of colony andpopulation genetic structure in the eastern subterraneantermite, Reticulitermes flavipes, using two classes ofmolecular markers. Evolution 57: 2805Ð2818.
Vargo, E. L. 2003b. Genetic structure of Reticulitermes fla-vipes and R. virginicus (Isoptera: Rhinotermitidae) col-onies in an urban habitat and tracking of colonies fol-lowing treatment with hexaßumuron bait. Environ.Entomol. 32: 1271Ð1282.
Vargo,E.L., andG.Henderson. 2000. IdentiÞcation of poly-morphic microsatellite loci in the Formosan subterranean
October 2005 HUSSENEDER ET AL.: FORMOSAN TERMITE GENETIC STRUCTURE 1433

termite Coptotermes formosanus Shiraki. Mol. Ecol. 9:1935Ð1938.
Vargo, E. L., C. Husseneder, and J. K. Grace. 2003a. Colonyand population genetic structure of the Formosan sub-terranean termite,Coptotermes formosanus, in Japan. Mol.Ecol. 12: 2599Ð2608.
Vargo, E. L., C. Husseneder, J. K. Grace, G. Henderson, andD. Ring. 2003b. Colony and population genetic struc-ture of Formosan subterranean termites from Hawaii andLouisiana. Sociobiology 41: 67Ð69.
Weir, B. S., and C. C. Cockerham. 1984. Estimating F-sta-tistics for the analysis of population structure. Evolution38: 1358Ð1370.
Woodson, W. D., B. A. Wiltz, and A. R. Lax. 2001. Currentdistribution of the Formosan subterranean termite(Isoptera: Rhinotermitidae) in the United States. Socio-biology 37: 661Ð671.
Ye,W.M., C. Y. Lee, R. H. Scheffrahn, J.M. Aleong, N.-Y. Su,G. W. Bennett, and M. E. Scharf. 2004. Phylogeneticrelationships of NearcticReticulitermes species (Isoptera:Rhinotermitidae) with particular reference to Reticuli-termes arenincola Goellner. Mol. Phylogenet. Evol. 30:815Ð822.
Received 29 March 2005; accepted 27 May 2005.
1434 JOURNAL OF ECONOMIC ENTOMOLOGY Vol. 98, no. 5