a role for subducted super-hydrated kaolinite in earth’s ... · pdf filearticles nature...
TRANSCRIPT

Articleshttps://doi.org/10.1038/s41561-017-0008-1
1Department of Earth System Sciences, Yonsei University, Seoul, Republic of Korea. 2Stanford Synchrotron Radiation Lightsource, SLAC National Accelerator Laboratory, Menlo Park, CA, USA. 3Center for High Pressure Science & Technology Advanced Research (HPSTAR), Shanghai, China. 4Department of Civil and Environmental Engineering, The George Washington University, Washington, DC, USA. 5Photon Sciences, Deutsches Elektronen-Synchrotron (DESY), Hamburg, Germany. 6High-Pressure Physics Group, Physics and Life Sciences, Lawrence Livermore National Laboratory, Livermore, CA, USA. 7NanoCenter & Department of Chemistry and Biochemistry, University of South Carolina, Columbia, SC, USA. 8Geophysical Laboratory, Carnegie Institution of Washington, Washington, DC, USA. Present address: 9Department of Earth System and Environmental Sciences, Chonnam National University, Gwangju, Republic of Korea. *e-mail: [email protected]
Current predictions of the global H2O flux into the deep mantle amount to about one ocean mass over the age of the Earth1. Present-day estimates for subduction efficiency reveal that
approximately 68% of the subducted water outgasses through arc volcanism1–5. Trapped in oceanic sediments or the oceanic crust in hydrous minerals6 that contain H2O molecules or OH− groups, such as serpentine7, lawsonite8,9, phlogopite10 and amphibole11, 68% of the subducted water is released at different depths along the subduction zone12: amphiboles at 75 km, phlogopite at 200 km and lawsonite at 300 km. A previous study demonstrated that clay sediments at the slab surface control the updip limit of a seismogenic zone in subduction thrust faults13. Interestingly, the temperature ranges of the phase transformation from smectite to illite/chlorite coincide with this updip seismogenic limit. At depths between 410 km and 660 km in the Earth’s mantle transition zone, the presence of water-containing minerals such as wadsleyite and ringwoodite induces further dehydration melting14–16. Dehydration embrittlement, where released aqueous fluids induce brittle shear failure at elevated pres-sures after creating a positive volume change, has recently been reconsidered as a viable mechanism for nucleating earthquakes independent of depth, provided that hydrous minerals breakdown under differential stress17,18.
Kaolinite (Al2Si2O5(OH)4) is the most abundant mineral of the kaolin group, comprising between 5% and 60% of oceanic sediments19,20. There are few high-pressure and high-temperature studies of clay minerals, although knowledge of their behaviour at moderate pressures and temperatures, especially under cold sub-duction zone conditions21, is extremely important to understand
and model water transport and recycling in the Earth. X-ray diffrac-tion (XRD) and infrared (IR) spectroscopy revealed that kaolinite partially loses its crystallinity between ambient pressure and 2 GPa, indicative of stacking faults perpendicular to the c axis during compression22. In a Raman study of dickite23 pressure-induced changes in the local environment of OH groups above 1.9 GPa were observed. The same study also detected a reversible phase transfor-mation to a high-pressure dickite phase above ~2.6 GPa, where both the stacking sequence and hydrogen bonding topology are altered. Recently, the existence of two high-pressure kaolinite polytypes was established24: kaolinite I (the ambient polytype) transforms to kaolinite II near 3.7 GPa, which is stable up to 7 GPa, above which it transforms to kaolinite III. These polytypic transformations change the stacking vector sequence of the aluminosilicate sheets (Supplementary Figs. 1–3).
Pressure-induced hydration (PIH) and the formation of super-hydrated phases has been identified in numerous porous materials such as the small-pore zeolites natrolite, scolecite and mesolite, which contain various mono- and divalent cations as extra-framework cations, as well as in synthetic clays such as sodium hectorite25–27. At elevated temperatures and pressures PIH occurs in laumontite28,29, an important hydrous mineral found in low-grade metamorphic conditions along subduction zones. Using in situ and ex situ high-pressure XRD and IR spectroscopy, we report the observation of PIH in kaolinite above 2.5(1) GPa and 200 °C and its sequential breakdown at higher pressures and temperatures. These are condi-tions that exist along the subduction zones where water transport and release occurs, possibly inducing volcanism and seismicity.
A role for subducted super-hydrated kaolinite in Earth’s deep water cycleHuijeong Hwang1, Donghoon Seoung1,2,9, Yongjae Lee1,3*, Zhenxian Liu4, Hanns-Peter Liermann5, Hyunchae Cynn6, Thomas Vogt7, Chi-Chang Kao2 and Ho-Kwang Mao3,8
Water is the most abundant volatile component in the Earth. It continuously enters the mantle through subduction zones, where it reduces the melting temperature of rocks to generate magmas. The dehydration process in subduction zones, which determines whether water is released from the slab or transported into the deeper mantle, is an essential component of the deep water cycle. Here we use in situ and time-resolved high-pressure/high-temperature synchrotron X-ray diffraction and infrared spectra to characterize the structural and chemical changes of the clay mineral kaolinite. At conditions correspond-ing to a depth of about 75 km in a cold subducting slab (2.7 GPa and 200 °C), and in the presence of water, we observe the pressure-induced insertion of water into kaolinite. This super-hydrated phase has a unit cell volume that is about 31% larger, a density that is about 8.4% lower than the original kaolinite and, with 29 wt% H2O, the highest water content of any known alu-minosilicate mineral in the Earth. As pressure and temperature approach 19 GPa and about 800 °C, we observe the sequential breakdown of super-hydrated kaolinite. The formation and subsequent breakdown of super-hydrated kaolinite in cold slabs subducted below 200 km leads to the release of water that may affect seismicity and help fuel arc volcanism at the surface.
© 2017 Macmillan Publishers Limited, part of Springer Nature. All rights reserved.
NATurE GEoSCiENCE | www.nature.com/naturegeoscience

Articles Nature GeoscieNce
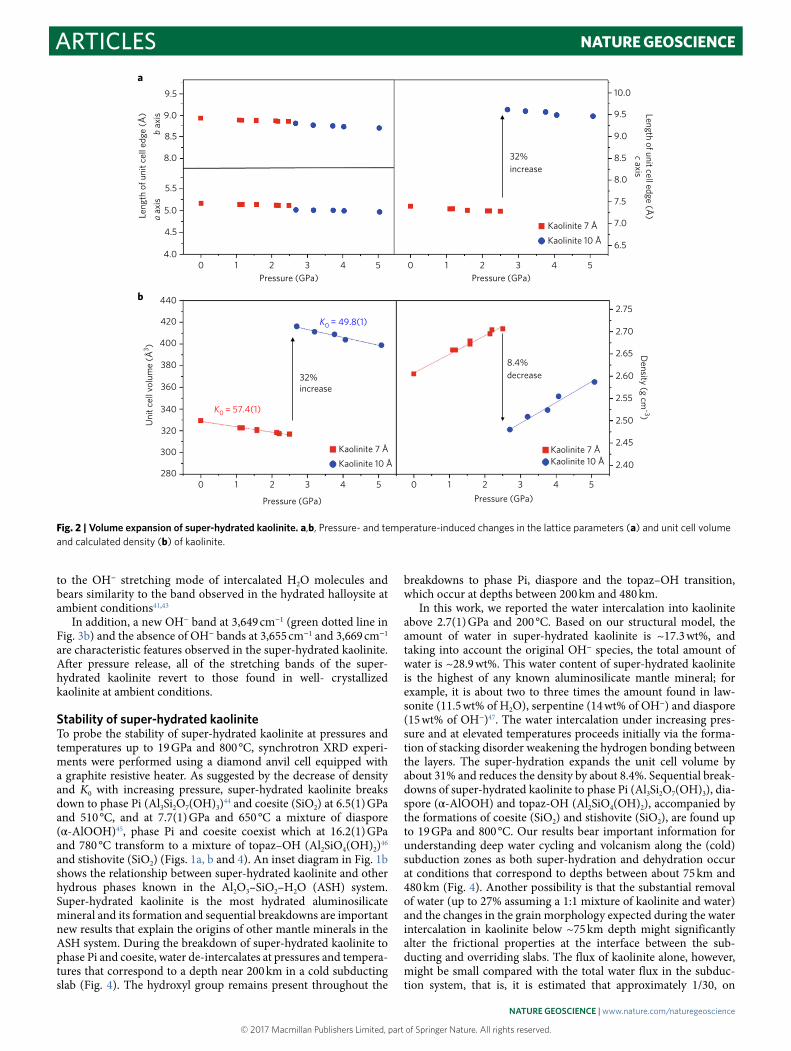
Kaolinite in water under high pressures and temperaturesA kaolinite sample (from Washington County, GA, KGa-1b from the Source Clays of the Clay Mineral Society) is heated at 200 °C for 1 hr at 2.7(1) GPa in the presence of water to mimic the conditions found along subduction zones (Fig. 1). Synchrotron XRD patterns reveal the appearance of a new (001) reflection with a d spacing of ~10 Å concomitantly to the intensity of the original (001) reflection with the d spacing near ~7 Å decreasing (Fig. 1a). This expansion of the basal (001) reflection is caused by water molecule interca-lation between the kaolinite layers. This new super-hydrated and expanded phase is stable over a temperature range between around 200 °C and 500 °C at pressures between 2.5(1) GPa and 5.0(1) GPa (Fig. 1b and Supplementary Fig. 4). After pressure release, the (001) reflection with a d spacing of ~10 Å disappears, indicating revers-ible water intercalation. Changes in the lattice parameters and unit cell volumes throughout this transition are depicted in Fig. 2 (see also Supplementary Table 3). The length of the c axis contracts gradually by 0.12(1) Å while the a and b axes contract by 0.05(2) Å up to pressures near 2.5(1) GPa (Fig. 2a). Such an anisotropic con-traction is also found in smectite26. Above 2.7(1) GPa and heating at 200 °C for 1 hour, the c axis length increases by about 32% while the a and b axis lengths decrease by 1.96% and 0.52%, respectively (Fig. 2a). This results in the expansion of the unit cell volume by approximately 31 % (Fig. 2b). This now super-hydrated kaolinite seems to be less stable under pressure, showing a smaller bulk modulus of K0 = 49.80(1) GPa compared with K0 = 57.38(1) GPa for kaolinite before super-hydration. The calculated density of the super-hydrated kaolinite is also found to be lower than the original phase at ambient conditions, that is, 2.48(6) g cm−3 versus 2.61(1) g cm−3 (Fig. 2b). The lower density and K0 of super-hydrated kaolinite compared with the original phase at ambient conditions indicates that it might transform or break down into dense phases at higher pressures and temperatures along the subduction zone.
Time-resolved study of kaolinite during super-hydrationWe monitored changes during pressure- and temperature-induced expansion and super-hydration in kaolinite using time-resolved synchrotron XRD in the presence of H2O as a pressure transmission medium. Time-dependent XRD patterns measured after ramping the temperature to 200 °C at 2.7(1) GPa are shown in Fig. 1c and reveal that the intensity of the original kaolinite (001) reflection with a d spacing near 7 Å decreases over time, whereas the inten-sity of the super-hydrated kaolinite (001) reflection at a d spacing of approximately 10 Å grows concomitantly. At the same time, we observe a decrease in the intensity of the ice VII (110) reflection as the temperature reaches its melting point of 165 °C at 2.7(1) GPa30. It is interesting to note that the time-dependent changes in the inten-sities of the kaolinite basal reflections are continuous, whereas the intensity of the ice VII (110) reflection decreases discontinuously and disappears.
To further elucidate the kinetics of water intercalation and the formation of the super-hydrated phase, we have modelled the reac-tion pathway using the classical Avrami equation α = − −kt1 exp( )n , where t is time, k is the rate constant and n is the Avrami exponent31. We followed the time-dependent isothermal decay of the basal (001) intensity of the original phase (It) while setting the zero-time inten-sity (I0) as a reference so that α = − ∕I I1 ( )t 0 . The reaction order, n, for the conversion of kaolinite to its super-hydrated phase is derived to be 0.55(3) with a k value of 9.0(3) × 10−3 (see Supplementary Fig. 5). In previous work an n value in the range of 0.4 to 0.8 was seen as an indication of a heterogeneous nucleation and growth mechanism32. This supports the notion that the formation of the super-hydrated phase involves the migration of water molecules into the interlayers and proceeds in a topotactic manner from the original kaoli-nite structure. The dehydroxylation of kaolinite also revealed a
diffusion-controlled process33 (n ~ 0.5) as did the swelling behaviour of the ‘10Å phase’ of talc (Mg3Si4O10(OH)2 nH2O) in the presence of water and acetone34 (n ~ 0.63). It is, however, important to note the structural and chemical differences between kaolinite and talc during super-hydration. In kaolinite, water intercalation proceeds by a weakening the hydrogen bonding between dioctahe-dral sheets under pressure and temperature, whereas in talc, water intercalation and the formation of the 10Å phase is preceded by a hydrophobic to hydrophilic conversion of van der Waals bonded tri-octahedral sheets35–37.
Structural model of super-hydrated kaoliniteThe structural model of the super-hydrated kaolinite has been derived using Rietveld refinements of synchrotron XRD powder data taken at 4.1(1) GPa after heating at 200 °C. The measured dif-fraction peaks are indexed in space group C1, the same as the original kaolinite. Using a published starting structural model38, difference-Fourier synthesis revealed maxima of electron densi-ties between the layers (Fig. 3a). Subsequent modelling and refine-ment of the electron densities by the oxygen atoms of the H2O molecules at three distinct interlayer sites results in a chemical composition of Al2Si2O5(OH)4·2.97(2)H2O (Supplementary Table 4). Details of the crystallographic models are summarized in Supplementary Tables 4 and 5. The structural model of the super-hydrated kaolinite sheds new light on the origin of the hydrated analogue of kaolinite, halloysite (Al2Si2O5(OH)4·2H2O). Our experimental data show that when halloysite is compressed in the presence of water, the intensity of its basal reflection at d ≈ 10 Å increases, indicating that additional water insertion forms a phase similar to the super-hydrated kaolinite with three H2O molecule per unit cell (Supplementary Fig. 2b). It is also interesting to note the contrasting morphologies of kaolinite and halloysite at ambient conditions. Although kaolinite is platy (Supplementary Fig. 1a), halloysite is known to be a natural nanotube mineral. In situ transmission X-ray microscopy studies are underway to elucidate the possible change in morphology from kaolinite to super-hydrated kaolinite.
ir spectroscopy on super-hydrated kaoliniteHydroxyl vibrations of kaolinite are indicators of the changes in the interlayer hydrogen bonding and water intercalation under pressure and at elevated temperatures. Infrared reflectivity spectra were measured following decompression from the super-hydrated kaolinite at 3.5(1) GPa after heating to 200 °C (Fig. 3b). Kaolinite at ambient conditions displays four characteristic OH− stretch-ing bands at 3,620 cm−1, 3,655 cm−1, 3,669 cm−1 and 3,695 cm−1, respectively. The single OH− band at 3,620 cm−1 (red dotted line in Fig. 3b) corresponds to the inner OH− while the other bands (blue dotted line in Fig. 3b) indicate the coupled vibrations of the inter-layer OH−39. For halloysite, on the other hand, the IR spectra are characterized by two broad bands near 3,695 cm−1 and 3,620 cm−1, while a weak band observed near 3,550 cm−1 is only found in the hydrated form at ambient conditions40,41.
In excellent agreement with the XRD results, the major changes in the OH− stretching bands occur between 1.9(1) GPa and 2.7(1) GPa after releasing pressure from 3.5(1) GPa (Fig. 3b). Further decompression to ambient conditions results in the shifts of all OH− stretching bands to lower wave numbers. Additionally, all of the stretching bands attributed to the vibrations of the hydroxyls in kaolinite broaden before the formation of the super-hydrated kaolinite, which we interpret as being due to an increase in stack-ing disorder between the kaolinite layers, consistent with the anisotropic broadening effects observed in this and previous XRD studies22,42. The IR reflectivity spectra of super-hydrated kaolinite above 2.7(1) GPa show a distinct OH− stretching band near 3,543 cm−1 (purple dotted line in Fig. 3b), which is assigned
© 2017 Macmillan Publishers Limited, part of Springer Nature. All rights reserved.
NATurE GEoSCiENCE | www.nature.com/naturegeoscience

ArticlesNature GeoscieNce
10 Å(001)
7 Å(001)
Ice VII(110)
Pressure and temperature set to2.7(1) GPa and 200 °C
c16.2 GPa, 780 °CTopaz–OH (Al2SiO4(OH)2) + Stishovite(SiO2)
7.7 GPa, 650 °CPhase Pi (Al3Si207(OH)3) + Diaspore (AlO(OH)) + Coesite(SiO2)
6.5 GPa, 510 °CPhase Pi (Al3Si2O7(OH)3) + Coesite(SiO2)
5.75 GPa, 460 °CSuper hydrated Kaolinite (Al2Si2O5(OH)4·3H2O)
1.00 GPa, RTKaolinite Al2Si2O5(OH)4
3 54 6 7 8 9 102θ (°)
Inte
nsity
(arb
. uni
ts)
Topaz–OHStishovite
DiasporeCoesitePhase Pi
CoesitePhase Pi
d
Pressure (GPa)
Tem
pera
ture
(°C
)
420 6 8
100
200
300
400
500
0
TongaKermadecNew ZealandNorth AntillesHot subduction
10 1412 16
600
700
800
56
1
7
Kaolinite
Super-hydrated kaoliniteSuper hydrated kaolinite(in situ HPT)
Phase Pi + Diaspore + Coesite
Phase Pi + Coesite
Topas-OH + Stishovite
43
2
Diaspore
H2O
Al2O3SiO2
Gibbsite (Al(OH)3)
Diaspore (AlOOH)
Corundum
Phase Egg (AlSiO3OH)
Kyanite (Al2SiO5)
QuartzCoesiteStishovite
Halloysite (Al2Si2O5(OH)4·2H2O)
Phase Pi (Al3Si2O7(OH)3)
Kaolinite(Al2Si2O5(OH)4)Topaz-OH
(Al2SiO4(OH)2)
7.7 GPa, 660 °C16.1 GPa, 790 °C
Super hydrated Kaolinite(Al2Si2O5(OH)4·3H2O)
1
1.10 GPa
1.58 GPa
2.20 GPa
2.50 GPa
3.20 GPa
4.07 GPa
5
7Release
6
2
3
4
10Å 7Å
(001) (002)
(001)
** *
ICE
(020)
(110)(020)
a b
10 Å 7 Å
4 6 8 10 1412
Inte
nsity
(arb
. uni
ts)
1
5
4 6 8 10 1412
(110)
Topaz-OH
d
c
ba
Topaz-O
H
Phase Egg
6.5 GPa, 510 °Cabcd
2.5 GPa, 200 °C
Intensity (arb. units) Incr
ease
Decrease3.0
3.5
4.0
4.5
5.0
5.5
6.0
14.5
15.0
2θ (°)
30 min0
Time
2θ (°)
Fig. 1 | Formation and breakdown of super-hydrated kaolinite. a, Synchrotron XRD powder patterns of kaolinite at ambient and high-pressures, as well as annealed at different temperatures, in the presence of water (top). XRD Debye–Scherrer cones of kaolinite at ambient conditions (bottom) and at 2.7(1) GPa after being heated at 200 °C for 1 hr (middle). Numbers on the right in Fig. 1a match those inside symbols in Fig. 1b. b, Results of high-pressure and heating experiments on kaolinite. Errors are smaller than the size of the symbols. The geotherms for subducting slabs are from ref. 21. The coloured lines are the P–T paths of the subducting slab surfaces for normal (North Antilles and New Zealand), cold (Kermadec and Tonga) and hot (Cascadia, Mexco, Nankai and South Chile) subducting slabs. The dotted lines in matching colours indicate the P–T paths of the corresponding Moho. The blue solid lines are phase boundaries of diaspore, topaz–OH and phase egg from refs 60,63. Inset, Ternary diagram for selected phases in the ASH system. The arrows indicate the super-hydration and breakdown sequence of kaolinite. c, A three-dimensional plot of the time-resolved synchrotron XRD powder patterns of kaolinite. The scan started when the temperature reached 200 °C at 2.7(1) GPa. d, Synchrotron XRD powder patterns that show the super-hydration and breakdown sequence from kaolinite.
© 2017 Macmillan Publishers Limited, part of Springer Nature. All rights reserved.
NATurE GEoSCiENCE | www.nature.com/naturegeoscience
Articles Nature GeoscieNce
to the OH− stretching mode of intercalated H2O molecules and bears similarity to the band observed in the hydrated halloysite at ambient conditions41,43
In addition, a new OH− band at 3,649 cm−1 (green dotted line in Fig. 3b) and the absence of OH− bands at 3,655 cm−1 and 3,669 cm−1 are characteristic features observed in the super-hydrated kaolinite. After pressure release, all of the stretching bands of the super-hydrated kaolinite revert to those found in well- crystallized kaolinite at ambient conditions.
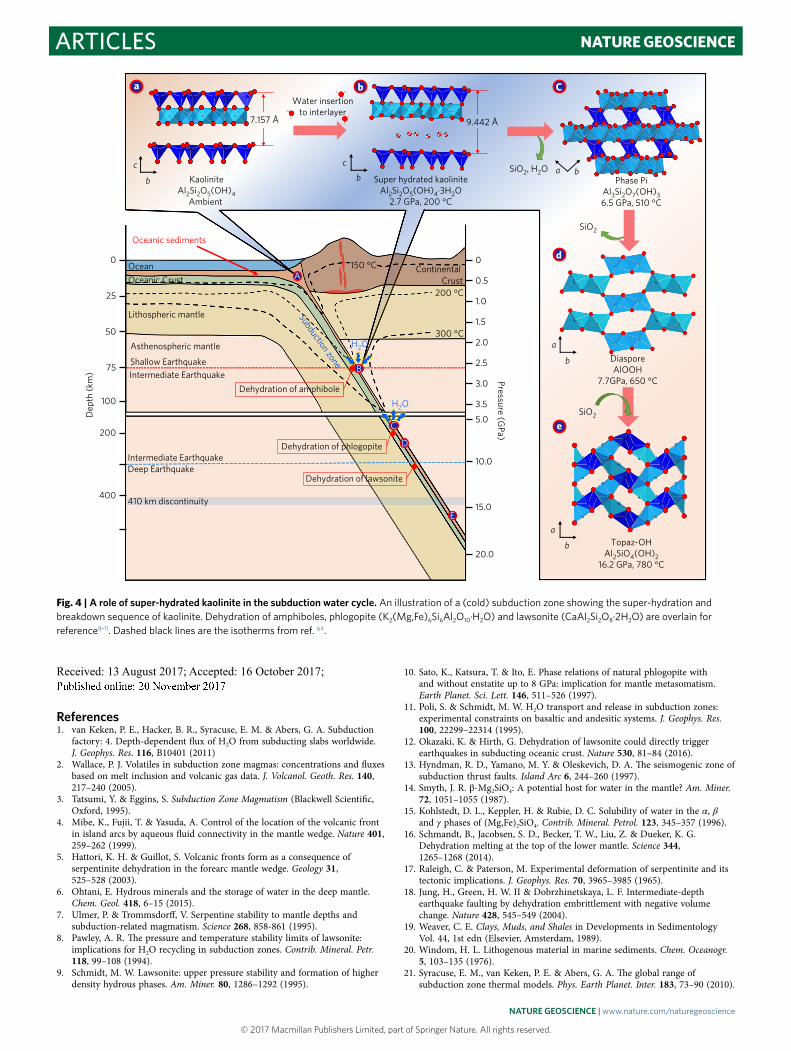
Stability of super-hydrated kaoliniteTo probe the stability of super-hydrated kaolinite at pressures and temperatures up to 19 GPa and 800 °C, synchrotron XRD experi-ments were performed using a diamond anvil cell equipped with a graphite resistive heater. As suggested by the decrease of density and K0 with increasing pressure, super-hydrated kaolinite breaks down to phase Pi (Al3Si2O7(OH)3)44 and coesite (SiO2) at 6.5(1) GPa and 510 °C, and at 7.7(1) GPa and 650 °C a mixture of diaspore (α -AlOOH)45, phase Pi and coesite coexist which at 16.2(1) GPa and 780 °C transform to a mixture of topaz–OH (Al2SiO4(OH)2)46 and stishovite (SiO2) (Figs. 1a, b and 4). An inset diagram in Fig. 1b shows the relationship between super-hydrated kaolinite and other hydrous phases known in the Al2O3–SiO2–H2O (ASH) system. Super-hydrated kaolinite is the most hydrated aluminosilicate mineral and its formation and sequential breakdowns are important new results that explain the origins of other mantle minerals in the ASH system. During the breakdown of super-hydrated kaolinite to phase Pi and coesite, water de-intercalates at pressures and tempera-tures that correspond to a depth near 200 km in a cold subducting slab (Fig. 4). The hydroxyl group remains present throughout the
breakdowns to phase Pi, diaspore and the topaz–OH transition, which occur at depths between 200 km and 480 km.
In this work, we reported the water intercalation into kaolinite above 2.7(1) GPa and 200 °C. Based on our structural model, the amount of water in super-hydrated kaolinite is ~17.3 wt%, and taking into account the original OH− species, the total amount of water is ~28.9 wt%. This water content of super-hydrated kaolinite is the highest of any known aluminosilicate mantle mineral; for example, it is about two to three times the amount found in law-sonite (11.5 wt% of H2O), serpentine (14 wt% of OH−) and diaspore (15 wt% of OH−)47. The water intercalation under increasing pres-sure and at elevated temperatures proceeds initially via the forma-tion of stacking disorder weakening the hydrogen bonding between the layers. The super-hydration expands the unit cell volume by about 31% and reduces the density by about 8.4%. Sequential break-downs of super-hydrated kaolinite to phase Pi (Al3Si2O7(OH)3), dia-spore (α -AlOOH) and topaz-OH (Al2SiO4(OH)2), accompanied by the formations of coesite (SiO2) and stishovite (SiO2), are found up to 19 GPa and 800 °C. Our results bear important information for understanding deep water cycling and volcanism along the (cold) subduction zones as both super-hydration and dehydration occur at conditions that correspond to depths between about 75 km and 480 km (Fig. 4). Another possibility is that the substantial removal of water (up to 27% assuming a 1:1 mixture of kaolinite and water) and the changes in the grain morphology expected during the water intercalation in kaolinite below ~75 km depth might significantly alter the frictional properties at the interface between the sub-ducting and overriding slabs. The flux of kaolinite alone, however, might be small compared with the total water flux in the subduc-tion system, that is, it is estimated that approximately 1/30, on
9.5
9.0
8.5
8.0
5.5
5.0
4.5
4.0
Leng
th o
f uni
t cel
l edg
e (Å
) Length of unit cell edge (Å)
32%increase
b ax
isa
axis
c axis
0 1 2 3 4 5Pressure (GPa)
0 1 2 3 4 5Pressure (GPa)
9.5
9.0
8.5
8.0
10.0
7.5
7.0
6.5
Kaolinite 7 ÅKaolinite 10 Å
Uni
t cel
l vol
ume
(Å3 )
Density (g cm
–3)
32%increase
K0 = 49.8(1)
K0 = 57.4(1)
2.75
2.70
2.65
2.60
2.55
2.50
2.45
2.40
0 1 2 3 4 5 0 1 2 3 4 5
Pressure (GPa) Pressure (GPa)
440
420
400
380
360
340
320
300
280
Kaolinite 7 ÅKaolinite 10 Å
Kaolinite 7 ÅKaolinite 10 Å
8.4%decrease
a
b
Fig. 2 | Volume expansion of super-hydrated kaolinite. a,b, Pressure- and temperature-induced changes in the lattice parameters (a) and unit cell volume and calculated density (b) of kaolinite.
© 2017 Macmillan Publishers Limited, part of Springer Nature. All rights reserved.
NATurE GEoSCiENCE | www.nature.com/naturegeoscience

ArticlesNature GeoscieNce
average, of the total water in the subduction system can be accom-modated into this single phase by super-hydration. We suggest that other (clay) minerals and/or multicomponent systems in the oceanic sediment and crust could undergo similar super-hydration during subduction. It is also possible that the subduction interface might not be homogeneous but is made up of patches of kaolinite, which will then serve as clear rupture points after super- hydration. Previous studies have proposed water release by dehydration of various hydrous minerals at depths below 100 km down to the
transition zone16,48–51 (Fig. 4). The dehydration and breakdown sequence of super-hydrated kaolinite provides new insights into the geochemical and seismic processes occurring along subduction zones and needs to be incorporated in future modelling studies.
MethodsMethods, including statements of data availability and any associ-ated accession codes and references, are available in the online ver-sion of this paper.
KaoliniteAmbient
Refle
ctan
ce
Wave number (cm–1)
Release0.23 GPa
0.73 GPa
1.28 GPa1.91 GPa
2.67 GPa3.18 GPa3.52 GPa after heating at 200 °C for 1 hr
3,620 3,655 3,669 3,695
Decompressing
3,543
Halloysite
Interlayerwater
Disorderedkaolinite3,649
T
O
T
Kaolinite 10 Å
Kaolinite 7 Å
Abs
orba
nce
Abs
orba
nce
10 Å
a0.35a
d(001)= 9.316 Å
5 10 15 20 25
Inte
nsity
(arb
. uni
ts)
2θ (°)
7 Å
Di�erence-fourier mapbefore refinement of the interlayer H2O
Refined H2O positionin super-hydrated kaolinite
ab OW3 OW3
OW2OW2OW1OW1
OW3 OW3
OW2OW2OW1 OW1
a
a
b
ab c
b
ac
Observed
Calculated
Di�erence
ow1 ow3 ow2ow2 ow1 ow3
Interlayer OH
3,550 3,600 3,650 3,700 3,750
Inner OH
T
O
T
H O AI Si
a
ab
b
Fig. 3 | Structural details of super-hydrated kaolinite. a, Rietveld fit of the structural model of kaolinite measured at 4.1(1) GPa after heating at 200 °C. The difference curve is shown below, and the positions of the Bragg reflections of the super-hydrated and original kaolinite are shown as black and red vertical bars, respectively. The difference-Fourier synthesis map (right) reveals residual electron densities that indicate the oxygen location of interlayer water molecules. b, In situ high-pressure IR reflectivity spectra of kaolinite during decompression from 3.5(1) GPa. For comparison, IR absorption spectra measured at ambient conditions of the original kaolinite and halloysite are shown for references above and below, respectively. The vertical dotted lines indicate the positions of the OH− stretching bands.
© 2017 Macmillan Publishers Limited, part of Springer Nature. All rights reserved.
NATurE GEoSCiENCE | www.nature.com/naturegeoscience
Articles Nature GeoscieNce
Received: 13 August 2017; Accepted: 16 October 2017; Published: xx xx xxxx
references 1. van Keken, P. E., Hacker, B. R., Syracuse, E. M. & Abers, G. A. Subduction
factory: 4. Depth-dependent flux of H2O from subducting slabs worldwide. J. Geophys. Res. 116, B10401 (2011)
2. Wallace, P. J. Volatiles in subduction zone magmas: concentrations and fluxes based on melt inclusion and volcanic gas data. J. Volcanol. Geoth. Res. 140, 217–240 (2005).
3. Tatsumi, Y. & Eggins, S. Subduction Zone Magmatism (Blackwell Scientific, Oxford, 1995).
4. Mibe, K., Fujii, T. & Yasuda, A. Control of the location of the volcanic front in island arcs by aqueous fluid connectivity in the mantle wedge. Nature 401, 259–262 (1999).
5. Hattori, K. H. & Guillot, S. Volcanic fronts form as a consequence of serpentinite dehydration in the forearc mantle wedge. Geology 31, 525–528 (2003).
6. Ohtani, E. Hydrous minerals and the storage of water in the deep mantle. Chem. Geol. 418, 6–15 (2015).
7. Ulmer, P. & Trommsdorff, V. Serpentine stability to mantle depths and subduction-related magmatism. Science 268, 858-861 (1995).
8. Pawley, A. R. The pressure and temperature stability limits of lawsonite: implications for H2O recycling in subduction zones. Contrib. Mineral. Petr. 118, 99–108 (1994).
9. Schmidt, M. W. Lawsonite: upper pressure stability and formation of higher density hydrous phases. Am. Miner. 80, 1286–1292 (1995).
10. Sato, K., Katsura, T. & Ito, E. Phase relations of natural phlogopite with and without enstatite up to 8 GPa: implication for mantle metasomatism. Earth Planet. Sci. Lett. 146, 511–526 (1997).
11. Poli, S. & Schmidt, M. W. H2O transport and release in subduction zones: experimental constraints on basaltic and andesitic systems. J. Geophys. Res. 100, 22299–22314 (1995).
12. Okazaki, K. & Hirth, G. Dehydration of lawsonite could directly trigger earthquakes in subducting oceanic crust. Nature 530, 81–84 (2016).
13. Hyndman, R. D., Yamano, M. Y. & Oleskevich, D. A. The seismogenic zone of subduction thrust faults. Island Arc 6, 244–260 (1997).
14. Smyth, J. R. β -Mg2SiO4: A potential host for water in the mantle? Am. Miner. 72, 1051–1055 (1987).
15. Kohlstedt, D. L., Keppler, H. & Rubie, D. C. Solubility of water in the α, β and γ phases of (Mg,Fe)2SiO4. Contrib. Mineral. Petrol. 123, 345–357 (1996).
16. Schmandt, B., Jacobsen, S. D., Becker, T. W., Liu, Z. & Dueker, K. G. Dehydration melting at the top of the lower mantle. Science 344, 1265–1268 (2014).
17. Raleigh, C. & Paterson, M. Experimental deformation of serpentinite and its tectonic implications. J. Geophys. Res. 70, 3965–3985 (1965).
18. Jung, H., Green, H. W. II & Dobrzhinetskaya, L. F. Intermediate-depth earthquake faulting by dehydration embrittlement with negative volume change. Nature 428, 545–549 (2004).
19. Weaver, C. E. Clays, Muds, and Shales in Developments in Sedimentology Vol. 44, 1st edn (Elsevier, Amsterdam, 1989).
20. Windom, H. L. Lithogenous material in marine sediments. Chem. Oceanogr. 5, 103–135 (1976).
21. Syracuse, E. M., van Keken, P. E. & Abers, G. A. The global range of subduction zone thermal models. Phys. Earth Planet. Inter. 183, 73–90 (2010).
Ocean
Oceanic sediments
Asthenospheric mantle
Dep
th (k
m)
0
25
50
75
100
Pressure (GPa)
0
0.5
1.5
2.5
3.5
1.0
2.0
3.0
Oceanic CrustContinental
Crust
150 °C
200 °C
300 °C
Lithospheric mantle
20.0
15.0
10.0
5.0200
400
Dehydration of amphibole
B
Dehydration of lawsonite
E
C
H2ODiasporeAlOOH
7.7GPa, 650 °C
a b
a
b
a
b
D
c
b
9.442 Å
c
b
7.157 Å
Water insertionto interlayer
SiO2, H2O
SiO2
SiO2
A
H2O
Shallow EarthquakeIntermediate Earthquake
Intermediate EarthquakeDeep Earthquake
410 km discontinuity
a b C
d
e
Dehydration of phlogopite
KaoliniteAl2Si2O5(OH)4
Ambient
Super hydrated kaoliniteAl2Si2O5(OH)4·3H2O
2.7 GPa, 200 °C
Phase PiAl3Si2O7(OH)36.5 GPa, 510 °C
Topaz-OHAl2SiO4(OH)2
16.2 GPa, 780 °C
Subduction zone
Fig. 4 | A role of super-hydrated kaolinite in the subduction water cycle. An illustration of a (cold) subduction zone showing the super-hydration and breakdown sequence of kaolinite. Dehydration of amphiboles, phlogopite (K2(Mg,Fe)6Si6Al2O10·H2O) and lawsonite (CaAl2Si2O8·2H2O) are overlain for reference8–11. Dashed black lines are the isotherms from ref. 64.
© 2017 Macmillan Publishers Limited, part of Springer Nature. All rights reserved.
NATurE GEoSCiENCE | www.nature.com/naturegeoscience

ArticlesNature GeoscieNce
22. Laiglesia, A. Pressure-induced disorder in kaolinite. Clay Miner. 28, 311–319 (1993).
23. Johnston, C. T. et al. Novel pressure-induced phase transformations in hydrous layered materials. Geophys. Res. Lett. 29, 17-1–17-4 (2002).
24. Welch, M. D. & Crichton, W. A. Pressure-induced transformations in kaolinite. Am. Mineral. 95, 651–654 (2010).
25. Seoung, D., Lee, Y., Kao, C. C., Vogt, T. & Lee, Y. Super-hydrated zeolites: pressure-induced hydration in natrolites. Chem.-Eur. J. 19, 10876–10883 (2013).
26. Seoung, D., Lee, Y., Kao, C. C., Vogt, T. & Lee, Y. Two-step pressure-induced superhydration in small pore natrolite with divalent extra-framework cations. Chem. Mat. 27, 3874–3880 (2015).
27. You, S. J. et al. Pressure-induced water insertion in synthetic clays. Angew. Chem. Int. Ed. 52, 3891–3895 (2013).
28. Lee, Y., Vogt, T. & Hriljac, J. Pressure-induced migration of zeolitic water in laumontite. Phys. Chem. Miner. 31, 421–428 (2004).
29. White, C. L., Ruiz‐Salvador, A. R. & Lewis, D. W. Pressure-induced hydration effects in the zeolite laumontite. Angew. Chem. Int. Ed. 43, 469–472 (2004).
30. Simon, F. & Glatzel, G. Bemerkungen zur Schmelzdruckkurve. Z. Anorg. Allg. Chem. 178, 309–316 (1929).
31. Avrami, M. Kinetics of phase change. I General theory. J. Chem. Phys. 7, 1103–1112 (1939).
32. Wang, D., Yi, L., Huang, B. & Liu, C. High-temperature dehydration of talc: a kinetics study using in situ X-ray powder diffraction. Phase Transit. 88, 560–566 (2015).
33. Hancock, J. & Sharp, J. Method of comparing solid-state kinetic data and its application to the decomposition of kaolinite, brucite, and BaCO3. J. Am. Ceram. Soc. 55, 74–77 (1972).
34. Fumagalli, P., Stixrude, L., Poli, S. & Snyder, D. The 10Å phase: a high-pressure expandable sheet silicate stable during subduction of hydrated lithosphere. Earth Planet. Sci. Lett. 186, 125–141 (2001).
35. Welch, M. D., Pawley, A. R., Ashbrook, S. E., Mason, H. E. & Phillips, B. L. Si vacancies in the 10-Å phase. Am. Mineral. 91, 1707–1710 (2006).
36. Phillips, B. L., Mason, H. E. & Guggenheim, S. Hydrogen bonded silanols in the 10 Å phase: Evidence from NMR spectroscopy. Am. Mineral. 92, 1474–1485 (2007).
37. Pawley, A. R., Welch, M. D., Lennie, A. R. & Jones, R. L. Volume behavior of the 10 Å phase at high pressures and temperatures, with implications for H2O content. Am. Mineral. 95, 1671–1678 (2010).
38. Bish, D. L. & Vondreele, R. B. Rietveld refinement of non-hydrogen atomic positions in kaolinite. Clay Clay Miner. 37, 289–296 (1989).
39. Welch, M. D., Montgomery, W., Balan, E. & Lerch, P. Insights into the high-pressure behavior of kaolinite from infrared spectroscopy and quantum-mechanical calculations. Phys. Chem. Miner. 39, 143–151 (2012).
40. Kodama, H. & Oinuma, K. Identification of kaolin minerals in the presence of chlorite by X-ray diffraction and infrared absorption spectra. Clay Clay Miner. 11, 236–249 (1963).
41. Wilson, M. J. Clay Mineralogy: Spectroscopic and Chemical Determinative Methods (Chapman & Hall, London, 1994).
42. Frost, R. L., Kloprogge, J. T., Thu, H. T. T. & Kristof, J. The effect of pressure on the intercalation of an ordered kaolinite. Am. Mineral. 83, 1182–1187 (1998).
43. Costanzo, P. M., Giese, R. F. & Lipsicas, M. Static and dynamic structure of water in hydrated kaolinites. 1. The static structure. Clay Clay Miner. 32, 419–428 (1984).
44. Daniels, P. & Wunder, B. Al3Si2O7(OH)3, phase Pi (formerly piezotite): Crystal structure of a synthetic high-pressure silicate rediscovered. Eur. J. Mineral. 8, 1283–1292 (1996).
45. Friedrich, A. et al. High-pressure properties of diaspore, AlO(OH). Phys. Chem. Mineral. 34, 145–157 (2007).
46. Kanzaki, M. Crystal structure of a new high-pressure polymorph of topaz-OH. Am. Mineral. 95, 1349–1352 (2010).
47. Ohtani, E. Water in the mantle. Elements 1, 25–30 (2005). 48. Karato, S. I., Paterson, M. S. & FitzGerald, J. D. Rheology of synthetic
olivine aggregates: influence of grain size and water. J. Geophys. Res. 91, 8151–8176 (1986).
49. Iwamori, H. Transportation of H2O and melting in subduction zones. Earth Planet. Sci. Lett. 160, 65–80 (1998).
50. Inoue, T., Yurimoto, H. & Kudoh, Y. Hydrous modified spinel, Mg1.75SiH0.5O4—
A new water reservoir in the mantle transition region. Geophys. Res. Lett. 22, 117–120 (1995).
51. Shieh, S. R., Mao, H.-k, Hemley, R. J. & Ming, L. C. Decomposition of phase D in the lower mantle and the fate of dense hydrous silicates in subducting slabs. Earth Planet. Sc. Lett. 159, 13–23 (1998).
AcknowledgementsThis work was supported by the Global Research Laboratory (NRF-2009-00408) and National Research Laboratory (NRF-2015R1A2A1A01007227) programs of the Korean Ministry of Science, ICT and Planning (MSIP). H.-K.M. was supported by NSF Grants EAR-1345112 and EAR-1447438. We also received surpport from NRF grants NRF-2016K1A4A3914691 and NRF-2016K1A3A7A09005244. Experiments using the synchrotrons were supported by the Collaborative Access Program of SSRL and general user programs of PAL, SSRF, ALS and APS. HPCAT operations are supported by DOE-NNSA under Award No. DE-NA0001974 and DOE-BES under Award No. DE-FG02-99ER45775, with partial instrumentation funding by NSF. The APS is supported by DOE-BES under Contract No. DE-AC02-06CH11357. The operation of the Infrared Lab of the NSLS-II at BNL was supported by COMPRES (EAR 1606856) and CDAC (DE-NA-0002006). NSLS-II is supported by DOE-BES under Contract No. DE-SC0012704. The ALS is support by DOE-BES under Contract No. DE-AC02-05CH11231. Part of this work was performed under the auspices of the US DOE by LLNL under Contract DE-AC52-07NA27344. Parts of this research were carried out at PETRA III at DESY, a member of the Helmholtz Association (HGF).
Author contributionsH. H. contributed to the experiments and data analysis with the help from D.S., Z.L., H.-P.L. and H.C. Y.L. designed the research, discussed the results with T.V., C.-C.K. and H.-K.M. and worked on the manuscript with all authors.
Competing interestsThe authors declare no competing financial interests.
Additional informationSupplementary information is available for this paper at https://doi.org/10.1038/s41561-017-0008-1.
Reprints and permissions information is available at www.nature.com/reprints.
Correspondence and requests for materials should be addressed to Y.L.
Publisher’s note: Springer Nature remains neutral with regard to jurisdictional claims in published maps and institutional affiliations.
© 2017 Macmillan Publishers Limited, part of Springer Nature. All rights reserved.
NATurE GEoSCiENCE | www.nature.com/naturegeoscience

Articles Nature GeoscieNce
The starting structural model used was the one proposed in a previous study38. After initial refinements, an inspection of difference-Fourier maps suggested three interlayer sites showing residual electron densities, which were subsequently modelled as oxygen atoms of water molecules, that is, OW1 at (0.102(4), 0.441(3), 0.697(3)), OW2 at (0.586(4), 0.330(3), 0.697(3)) and OW3 at (0.554(4), 0.645(3), 0.730(2)). The refined occupancies of the OW1 and OW2 sites converged to unity while that of the OW3 site was refined to be 0.970(2). Geometrical soft restraints were applied for the layer interatomic distances assuming ideal tetrahedral and octahedral geometries, that is Si–O = 1.610(1) Å and O–O = 2.630(5) Å for SiO4 and Al–O = 1.885(1) Å and O–O = 2.668(5) Å for AlO6. All of the atom displacements were modelled using one isotropic displacement parameters (Uiso) to reduce the number of parameters. The basal plane (00l) reflections (l being the Miller index) indicated the presence of preferred orientation and therefore corrections were applied as done in a previous study61 and the March–Dollase preferential orientation parameter was refined to a value of 1.1814(2). The final convergence of the refinement was achieved by simultaneously varying all of the background and profile parameters, preferred orientation parameters, scale factor, lattice constants, 2θ zero, and the atomic positional and displacement parameters. The parameters of the final refined models are listed in Supplementary Tables 4 and 5.
In situ high-pressure IR spectroscopy. High-pressure IR experiments were carried out at the Infrared Lab of NSLS-II at Brookhaven National Laboratory. To avoid absorption saturation from the water present, all IR spectra were collected in reflection mode using a Bruker Vertex 80v FTIR spectrometer and a Hyperion 2000 IR microscope equipped with a liquid nitrogen-cooled mid-band MCT detector. Some experiments were done at beamline 1.4.3 at the Advanced Light Source (ALS). A DAC containing a pair of type-II diamond anvils with 400 μ m culet size was used. The ruby fluorescence technique was utilized to estimate the pressures for all experiments at room temperature. Kaolinite was loaded into a 200 μ m wide and 80 μ m thick sample chamber drilled using electro-spark erosion in a pre-indented stainless steel gasket. Near the edge of the chamber, a few small ruby spheres (~20 μ m) were added as pressure gauges. The reflectance from the sample–diamond interface (Rsd(ω)) is calculated using:
= ∕R I I I I (1)sd sd d e 0
where Rsd is the reflectivity of the sample–diamond interface, Isd the intensity reflected from the sample–diamond interface, Id the intensity reflected from the air–diamond interface, Ie the intensity reflected from the empty cell and I0 the intensity reflected from the gold foil62. Although it is impossible to obtain accurate Rsd values due to the both sample and water being present, our goal was to monitor the changes in the O–H stretching vibrational modes. The changes of the frequencies of the O–H stretching vibrational modes are related to the structural changes that occur during the insertion of the water molecules between the layers in the kaolinite structure.
Data availability. The data that support the findings of this study are available from the corresponding author upon request.
references 52. Mao, H. K., Xu, J. & Bell, P. M. Calibration of the ruby pressure gauge to 800-kbar
under quasihydrostatic conditions. J. Geophys. Res. 91, 4673–4676 (1986). 53. Toby, B. H. EXPGUI, a graphical user interface for GSAS. J. Appl. Crystallogr.
34, 210–213 (2001). 54. Thompson, P., Cox, D. E. & Hastings, J. B. Rietveld refinement of Debye–Scherrer
synchrotron X-ray data from Al2O3. J. Appl. Crystallogr. 20, 79–83 (1987). 55. Birch, F. Finite elastic strain of cubic crystals. Phys. Rev. 71, 809–824 (1947). 56. Comboni, D. et al. Pargasite at high pressure and temperature. Phys. Chem.
Minerals https://doi.org/10.1007/s00269-017-0915-0 (2017). 57. Liermann, H.-P. et al. The Extreme Conditions Beamline P02.2 and the
Extreme Conditions Science Infrastructure at PETRA III. J. Synchrotron Radiat. 22, 908–924 (2015).
58. Wang, Y. et al. Thermal equation of state of copper studied by high P–T synchrotron X-ray diffraction. Appl. Phys. Lett. 94, 071904 (2009)
59. Larson, A. C. & Von Dreele, R. B. GSAS—General Structure Analysis System (Los Alamos National Laboratory, 1986).
60. Sano, A., Ohtani, E., Kubo, T. & Funakoshi, K. In situ X-ray observation of decomposition of hydrous aluminum silicate AlSiO3OH and aluminum oxide hydroxide delta-AlOOH at high pressure and temperature. J. Phys. Chem. Solids. 65, 1547–1554 (2004).
61. Dollase, W. Correction of intensities for preferred orientation in powder diffractometry: application of the March model. J. Appl. Crystallogr. 19, 267–272 (1986).
62. Seagle, C. T., Heinz, D. L., Liu, Z. & Hemley, R. J. Synchrotron infrared reflectivity measurements of iron at high pressures. Appl. Opt. 48, 545–552 (2009).
63. Wunder, B. et al. Synthesis, stability, and properties of Al2SiO4(OH)2: A fully hydrated analogue of topaz. Am. Mineral. 78, 285–297 (1993).
64. Tsujimori, T., Sisson, V. B., Liou, J. G., Harlow, G. E. & Sorensen, S. S. Petrologic characterization of Guatemalan lawsonite eclogite: Eclogitization of subducted oceanic crust in a cold subduction zone. Geol. Soc. Am. S. 403, 147–168 (2006).
MethodsSample preparation and high-pressure experiments. We used a well-crystallized kaolinite powder (KGa-1b) sample from Washington County, GA. Crystal morphology and chemical composition were investigated using a scanning electron microscope (JEOL-7800F) equipped with an energy-dispersive X-ray spectroscopy system (Oxford Instruments) operating at 15 kV accelerating voltage.
We performed in situ high-pressure experiments of kaolinite using a diamond anvil cell (DAC) equipped with 700 μ m diameter culets. We used two different pressure-transmitting media (PTM): water a pore-penetrating medium and silicone oil a non-pore-penetrating medium. Kaolinite powder was loaded into a 350 μ m-wide and 110 μ m-high sample chamber drilled by electro-spark erosion in a pre-indented stainless steel gasket. A few small ruby spheres (around 20 μ m in diameter) added into the sample chamber were used as pressure gauge. The pressure of the sample inside the DAC was measured by detecting the shift of the R1 emission line of ruby (precision:± 0.1 GPa)52.
In situ high-pressure synchrotron X-ray powder diffraction. High-resolution in situ high-pressure synchrotron XRD powder data of kaolinite were collected at beamline BL10-2 at the Stanford Synchrotron Radiation Lightsource (SSRL) at the SLAC National Accelerator Laboratory. At beamline BL10-2, the primary white beam from the wiggler source impinged on Si (111) focusing crystals to produce monochromatic X-rays with a wavelength of 0.6199(1) Å. The wavelength of the incident beam was determined using a LaB6 standard reference material (SRM 660c). A Pilatus 300K-w Si-diode CMOS detector was used to collect powder diffraction data at a 1,126 mm sample-to-detector distance and with 2-theta coverage up to 30°. Pressure was increased up to 7.0(1) GPa in intervals of about 0.2–0.5 GPa. The sample equilibrated for about 10 min in the DAC at each measured pressure. The pressure treatment sequences are summarized in Supplementary Tables 2 and 3 along with the resulting changes of the unit cell volume.
To mimic conditions in a subduction zone, occasional ex situ heating was done by placing the sample containing water in a DAC inside an oven for 1 h. The pressure and temperature sequences are listed in Supplementary Table 3 along with the resulting changes in the unit-cell volume. Pressure-dependent changes in the lattice parameters and unit cell volumes were derived by whole-pattern profile fitting using the Le Bail method implemented in the GSAS suite of programs53. The background curve was fitted with a Chebyshev polynomial using 32 coefficients. The pseudo-Voigt profile function proposed by a previous study54 was used to model the observed Bragg peaks. Bulk moduli from normalized volume (V/V0) were calculated using the second-order Birch–Murnaghan equation of state55.
Additional in situ high-pressure synchrotron XRD experiments for kaolinite under water medium were performed at beamline 9 A at Pohang Accelerator Laboratory (PAL) and beamline BL14B1 at Shanghai Synchrotron Radiation Facility (SSRF). At beamline 9 A at PAL, Rayonix SX165 CCD detector and monochromatic X-ray with a wavelength of 0.6215 Å were used while at beamline BL14B1 at SSRF, Rayonix mx225 CCD detector was used with monochromatic X-ray of 0.6888 Å wavelength. In situ high-pressure laboratory XRD was also performed at the department of Earth System Sciences at Yonsei university using a MicroMax-007HF (Rigku) system equipped with a microfocusing rotating anode Mo Kα radiation, multilayer optics (VariMax-Mo, Rigaku), and R axis IV++ imaging plate detector (Rigaku).
We have also performed in situ high–pressure and high-temperature synchrotron XRD on kaolinite under water medium at beamline 16BMD of HPCAT at the Advanced Photon Source (APS) at Argonne national laboratory and the Extreme Conditions Beamline P02.2 of PETRA III at Deutsches Elektronen-Synchrotron (DESY). At beamline 16BMD at APS, we used a cylinder-type DAC that consists of one ring-shaped ceramic heater surrounding the gasket. A platinum wire of thickness 0.3 mm and resistance 0.6 Ω was used as heating element. Monochromic X-ray beam with a wavelength of 0.4959 Å and a MAR345 detector were used for data XRD measurement. At beamline P02.2 of PETRA III, we used a DAC equipped with a graphite resistive heater to perform in situ high-pressure and high-temperature experiments. The pressure and temperature of the sample in the DAC increased up to 19 GPa and 800 °C. The description of this DAC can be found in the literature56,57. Synchrotron XRD was performed using a monochromic X-ray beam of 0.4838(1) Å wavelength and a PerkinElmer XRD 1621 flat-panel detector.
Time-resolved synchrotron X-ray powder diffraction. To probe the transformation pathway of kaolinite during the pressure and temperaturetreatment, time-resolved synchrotron XRD experiments were performed at beamline BL10-2 at SSRL using a Pilatus 300K-w detector. The pressure was fixed at 2.7(1) GPa, and the temperature was gradually raised to 200 °C. When the sample reached 200 °C, synchrotron XRD data were measured in 1 min intervals during 30 min at a fixed 2θ angle containing the 10 Å reflection. The pressure and temperature of the sample inside the DAC was determined by using the shift of the (002) reflection of an internal Cu standard and its equation of state58.
Rietveld structure refinement. Structural characterization of the super-hydrated kaolinite measured at 4.1(1) GPa after heating at 200 °C was performed using the Rietveld refinement program from the EXPGUI suite of programs53,59. The background curve and peak shape were modelled using the Le Bail method60.
© 2017 Macmillan Publishers Limited, part of Springer Nature. All rights reserved.
NATurE GEoSCiENCE | www.nature.com/naturegeoscience