a robust penalized cox prediction model for detection of
TRANSCRIPT
A Robust Penalized Cox Prediction Model for Detection of Mis-Spliced Transcripts with Prognostic Impacts in Adult de novo Acute Myeloid Leukemia
By
Sheida Hayati
A Dissertation Submitted in Partial Fulfillment of the Requirements for the Degree
of Doctor of Philosophy in Biomedical Informatics
Department of Health Informatics
School of Health Professions
Rutgers, the State University of New Jersey
July 2018

Copyright © Sheida Hayati 2018
All Rights Reserved
Final Dissertation Defense Approval Form
A Robust Penalized Cox Prediction Model for Detection of Mis-Spliced Transcripts with Prognostic Impacts in Adult de novo Acute Myeloid Leukemia
BY
Sheida Hayati
Dissertation Committee:
Antonina Mitrofanova, Ph.D.
Steven Buyske, Ph.D.
Christopher Hourigan, BM BCh, D.Phil.
Approved by the Dissertation Committee:
Date:
Date:
Date:

iv
ABSTRACT
A Robust Penalized Cox Prediction Model for Detection of Mis-Spliced Transcripts with Prognostic Impacts in Adult de novo Acute Myeloid Leukemia
By
Sheida Hayati
Background: Our understanding of Acute Myeloid Leukemia (AML) has transformed
over the recent years. We have yet to tackle an ongoing major challenge of high mortality
rate in elderly AML. AML outcome differs usually depending on patient age, predisposing
genomics variations (i.e., chromosomal abnormalities, mutations, gene expression profile,
epigenomic patterns, and possibly aberrant mRNA splicing), infectious complications,
severe bleeding, and complications after bone marrow/stem cell transplant. Thus far,
available AML risk assessment systems mainly rely on the well-established prognostic
indicators in a form of chromosomal aberrations, and a few driver mutations often in
patients with normal cytogenetics. Although these systems demonstrated acceptable
performance in separating favorable and adverse groups, they faced limitation in defining
patients with intermediate risk status. Pre-mRNA splicing regulation is a tissue dependent
process, plays an important role in hematopoiesis including proliferation and
differentiation. Several studies on a select number of genes reported expression of spliced
variants with clinical implications in AML. Yet, a systematic approach to investigate

v
clinical relevance of alternative spliced (AS) variants, and their capacity to predict disease
outcome in AML is lacking.
Objectives: (i) To identify genes with AS variant (signature event) with capacity of
predicting disease outcome in adult de novo AML (defined as AML in patients without
history of antecedent hematologic disorder or treatment with cytotoxic reagents),
outperforming a standard model built on the well-established AML prognostic risk factors;
(ii) to evaluate capacity of signature events to serve as prognostic indicators in adult AML;
and (iii) to distinguish common cis regulatory modules in genes with signature events.
Methods: We employed available bioinformatics, machine learning, and statistical
techniques to build two models: (i) a standard Cox proportional hazards (PH) model
(referred to as S-Cox) fit to the well-established AML prognostic risk factors, i.e., age,
cytogenetic and molecular risk status, and total peripheral blood white blood cell (WBC)
counts at diagnosis; and (ii) a Cox PH model with the grouped lasso penalty (referred to as
GL-Cox) built on age, cytogenetic and molecular risk status, WBC count, and Percent
Spliced In (PSI) value of alternative exons. Overall survival was considered as clinical
endpoint and death as event. We validated performance of these models by calculating area
under time-dependent Receiver Operating Characteristic curve (AUROCt).
Results: We developed our models on a training set (TS) of fifty-four adult de novo AML
cases participated in the Cancer Genome Atlas (TCGA) study. Two non-overlapping
validation sets (VSs) from TCGA cohort (n=25 and n=44) were used to evaluate model
performance. Patients included in the TS and the VS-1 were treated with similar initial
therapy. Patients in the VS-2 had a history of prior treatment with Hydrea (to reduce WBC
counts) and were treated with different types of therapy. The GL-Cox model identified 19
vi
signature events with improved prediction power compared to the S-Cox model. Time-
dependent ROC curve at 1-5 years survival for the GL-Cox model dominated the ROC
curve for the S-Cox model in two VSs. These signature events belonged to genes including
CLK4 (exon 5) a splicing regulator, MCPH1 (exons 5:6) a tumor suppressor gene, RFWD2
(exons 10:8) a gene that encodes a ubiquitin-protein ligase to target and degrade different
proteins including TP53 and JUN, and ABCB7 (exons 5:4) that involved in iron
homeostasis and heme transportation, among others. Furthermore, we found that of the 19
genes with signature event, 12 had at least one CTCF-binding module, a regulatory element
involved in alternative exon inclusion by pausing RNA polymerase II.
Conclusion: This study for the first time demonstrated capacity of mis-spliced transcripts
in predicting disease outcome in adult AML, and their potential to serve as prognostic
indicators. Presence of alternatively spliced CLK4 among the signature events suggested a
possible role for this trans-splicing factor in global regulation of AS in adult AML. In
addition, existence of CTCF-binding module in more than half of these signature events
and very close to NCDN and RFWD2 target exons indicated a possible role for this
regulatory element in mediating exon inclusion. Despite promising results of our study, we
faced several limitations including small sample size and access to limited clinical data
(e.g. time of transplant, and cause of death). We also did not evaluate our model on an
independent patient cohort. Therefore, further investigation is essential to draw a more
reliable conclusion.

vii
ACKNOWLEDGMENTS
It is my pleasure to gratefully acknowledge all the people who have supported and
encouraged me throughout this journey.
My special thanks go to my mentors, Professor Antonina Mitrofanova and
Professor Steven Buyske, who supported me to accomplish my PhD. Their generous
guidance, innovative ideas, tremendous patience, and most importantly belief in me,
empowered me to finish this study.
I would like to acknowledge the invaluable input of my NIH mentor, Dr.
Christopher Hourigan, who has been instrumental for completion of this research.
I wish to express my deepest gratitude to my unofficial mentor, Dr. Stephen Burley,
for his priceless advice and trust in my competence. His directions have helped foster my
personal and professional growth.
I also would like to thank Dr. Kristina Plazonic for reading my thesis thoroughly,
and for her great comments.
A huge thank to my family for their unconditional love and support. First and
foremost, I would like to thank my mom, a remarkable woman whose capacity of caring
for her children under incredibly difficult circumstances has inspired me throughout my
life. A sincere thank you to my husband Hussein, for his unequivocal support and great
patience at all time. I indeed owe a debt of gratitude to my lovely sister Sahra and my

viii
brother Mohammad, for their never-ending emotional support, and for taking care of mom
while I was working on my thesis.
I am grateful to Dean Gwendolyn Mahon, who has been my role model, and Chair
Barbara Gladson for their tremendous support throughout my graduate study.
I would like to thank the Vice Chair Shankar Srinivasan for his encouragement and
support.
Additional thanks go to people in Mitrofanova and Hourigan labs. I am so grateful
for working with all of you.
Finally, I would like to acknowledge the New Jersey Commission on Cancer
Research (NJCCR), for awarding me a Pre-Doctoral Fellowship, and supporting young
investigators to achieve their goals of advancing cancer research through innovative idea.

To My Beloved Parents
&
My Husband
&
All the Children with a Dream

Table of Contents
ABSTRACT ................................................................................................................................................. IV
ACKNOWLEDGMENTS ........................................................................................................................... VII
LIST OF TABLES ...................................................................................................................................... XII
LIST OF FIGURES .................................................................................................................................... XIII
LIST OF ABBREVIATIONS .................................................................................................................... XIV
CHAPTER I .................................................................................................................................................... 1 INTRODUCTION ........................................................................................................................................... 1
BACKGROUND: ............................................................................................................................................ 1 STATEMENT OF THE PROBLEM: ................................................................................................................... 2 RESEARCH HYPOTHESIS: ............................................................................................................................. 2 SIGNIFICANCE OF THE STUDY: ACCORDING TO T ......................................................................................... 2
CHAPTER II ................................................................................................................................................... 4
LITERATURE REVIEW ................................................................................................................................ 4
2.1 | AML A COMPLEX MALIGNANCY OF HEMATOPOIETIC PROGENITOR CELLS ......................................... 4 2.1.1 | Epidemiology of AML ................................................................................................................. 5 2.1.2 | Diagnosis .................................................................................................................................... 5 2.1.3 | AML Risk Factors ....................................................................................................................... 5 2.1.4 | Recurrent Translocations and Genetic Rearrangements in AML ............................................... 6 2.1.5 | Common Mutations in AML ........................................................................................................ 7 2.1.6 | AML Classification and Risk Stratification ................................................................................ 8 2.1.7 | AML Therapy ............................................................................................................................ 12
2.2 | ALTERNATIVE SPLICING .................................................................................................................... 16
CHAPTER III ................................................................................................................................................ 19
METHODOLOGY ........................................................................................................................................ 19
3.1| DATASET ............................................................................................................................................ 21 3.2 | STUDY DESIGN................................................................................................................................... 22 3.3 | BIOINFORMATICS PIPELINE ................................................................................................................ 24
3.3.1 | STAR ......................................................................................................................................... 24 3.3.2 | rMATS ....................................................................................................................................... 25
3.4 | THE COX PH MODEL ......................................................................................................................... 28 3.4.1 | Why the Use of a Cox PH Model .............................................................................................. 28 3.4.2 | Partial Likelihood Estimation of the Cox PH Model ................................................................ 29 3.4.3 | Hazard Ratio ............................................................................................................................. 30 3.4.4 | Development of a S-Cox Model ................................................................................................ 31
3.5 | DEVELOPMENT OF A GL-COX MODEL ............................................................................................... 32 3.6 | DETERMINING TUNING PARAMETER BY K-FOLD CROSS VALIDATION ............................................... 34
3.7 | BUILDING THE GL-COX MODEL ON AML DATA ............................................................................... 35 3.8 | KAPLAN-MEIER SURVIVAL ANALYSIS ............................................................................................... 36
3.8.1 | Linear Predictor Cut-off ........................................................................................................... 37 3.9 | PREDICTION ASSESSMENT .................................................................................................................. 38
3.9.1 | Receiver Operating Characteristic Curve ................................................................................ 38 3.9.2 | Time-dependent ROC Curve for Censored Survival Data ........................................................ 40
3.9.2.1 | Setting Cut-points for the Risk Score ................................................................................ 41 3.10 | LIMITATIONS .................................................................................................................................... 41
CHAPTER IV ............................................................................................................................................... 43
RESULTS ..................................................................................................................................................... 43
4.1 | PATIENTS CHARACTERISTICS ............................................................................................................. 43 4.1.1 | Training Set .............................................................................................................................. 44
4.2 | THE STANDARD COX PH MODEL ....................................................................................................... 45 4.5 | AS EVENTS FOR TCGA AML COHORT ............................................................................................. 48 4.6 | PENALIZED COX REGRESSION ANALYSIS AND ITS PERFORMANCE .................................................... 49 4.7 | PSI DISTRIBUTION IN THE TRAINING SET AND THE HEALTHY BONE MARROW.................................. 54 4.8 | CHARACTERISTICS OF SIGNATURE EVENTS ........................................................................................ 55 4.9 | CIS-REGULATORY MODULES ............................................................................................................. 61 4.10 | CORRELATION OF AGE AND % BLAST COUNT WITH LINEAR PREDICTOR ......................................... 62
CHAPTER V ................................................................................................................................................. 65
DISCUSSION ............................................................................................................................................... 65
CHAPTER VI ............................................................................................................................................... 69
SUMMARY AND CONCLUSION .............................................................................................................. 69
REFERENCES .............................................................................................................................................. 72

LIST OF TABLES
Table 1. Common mutations in AML and their associated altered biological function .................................. 8
Table 2. The FAB morphology based sub classification of AML ................................................................... 9
Table 3. The 2017 European LeukemiaNet classification system ................................................................. 10
Table 4. The 2016 WHO classification system of AML ............................................................................... 11
Table 5. The NCCN Guideline Version 3.2017 for AML classification guideline ....................................... 12
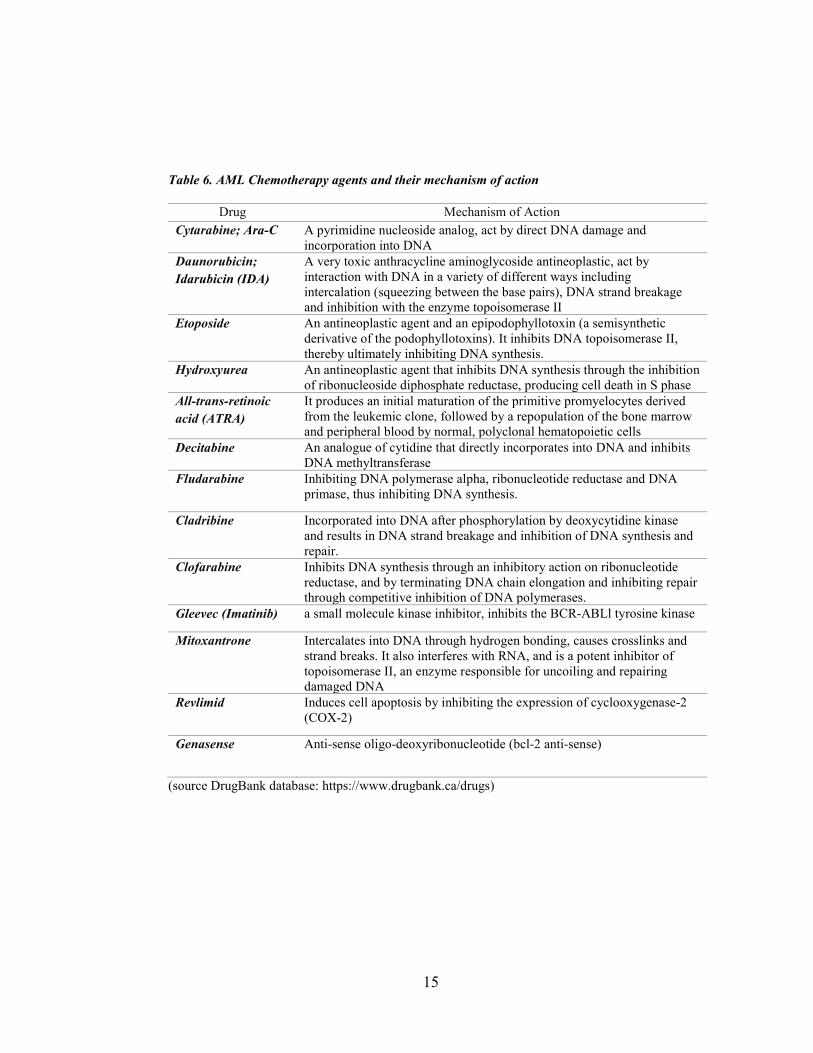
Table 6. AML Chemotherapy agents and their mechanism of action ........................................................... 15
Table 7. Frequency of different induction therapies in TCGA AML cohort ................................................. 23
Table 8. AUROC commonly accepted guideline .......................................................................................... 40
Table 9. Training set characteristics .............................................................................................................. 44
Table 10. Frequency of common mutations in the training set. .................................................................... 45
Table 11. Multivariate survival statistics in the training set .......................................................................... 46
Table 12. Comparison of AUROC for two fitted models .............................................................................. 49
Table 13. Coordinates of the signature events ............................................................................................... 59
Table 14. Coordinates guide .......................................................................................................................... 59
Table 15. Proposed mechanism of action for genes with AS event............................................................... 60
Table 16. Cis-regulatory modules in genes with signature AS events .......................................................... 63
LIST OF FIGURES
Figure 1. Normal Hematopoiesis ..................................................................................................................... 4
Figure 2. Pre-mRNA editing ......................................................................................................................... 16
Figure 3. Schematic illustration of the study ................................................................................................. 21
Figure 4. Study design ................................................................................................................................... 22
Figure 5. Schematic illustration of the STAR ............................................................................................... 25
Figure 6. The schematic depiction of the effective lengths of isoforms ........................................................ 27
Figure 7. Schematic illustration of the 10-fold cross-validation. .................................................................. 35
Figure 8. Frequency of recurrent mutations in TCGA AML cohort (n=173) ................................................ 44
Figure 9. AUC for ROC at 1-5 years ............................................................................................................. 47
Figure 10. PSI variance density plot and comparison of different AS cut-offs ............................................. 48
Figure 11. Development of a penalized Cox PH model ................................................................................ 51
Figure 12. Model validation .......................................................................................................................... 52
Figure 13. Treatment with ATRA or decitabine altered disease outcome ..................................................... 53
Figure 14. PSI distribution for the training set (n=54) and the healthy bone marrow (n=4) ......................... 55
Figure 15. Correlation of age and the PB % blast with LP ............................................................................ 64
Figure 16. Summary of Study ....................................................................................................................... 69

LIST OF ABBREVIATIONS
AML Acute Myeloid Leukemia ACS American Cancer Society's AS Alternative Splicing aSCT allogeneic Stem Cell Transplantation CBF AML Core Binding Factor Acute Myeloid Leukemia CN-AML Cytogenetically Normal Acute Myeloid Leukemia CR Complete Remission Cross-Validation CV del Deletion ELN European LeukemiaNet ENET Elastic Net GL Grouped Lasso i Isochromosome (unless stated otherwise) idic Isodicentric (having two repetitive elements and centrosomes) lasso Least Absolute Shrinkage and Selection Operator NCCN The National Comprehensive Cancer Network p Short arm of a chromosome q Long arm of a chromosome t Translocation TCGA The Cancer Genome Atlas MRD Measurable Residual Disease WHO World Health Organization WT Wild Type w/o Without 7+3 Cytarabine (7 days) + daunorubicin/ idarubicin (3 days) 7+3+3 Cytarabine (3 days) + daunorubicin/ idarubicin (3 days) +
etoposide (3 days)
1
CHAPTER I
INTRODUCTION
Background: Acute Myeloid Leukemia (AML), with the exception of acute
promyelocytic leukemia (APL), is a heterogenous aggressive neoplasm of myeloid
progenitor cells, and characterized as a blood malignancy with rapid proliferation and
accumulation of immature, or abnormally differentiated, and non-functional myeloid
lineage cells in the bone marrow (BM), and the peripheral blood (PB), and their infiltration
to other tissues1,2. AML harbors various cytogenetic and molecular abnormalities,
including chromosomal aberrations, mutations, epigenetic alteration, and impaired RNA
splicing.3-8
There are number of factors that determine the outlook of AML including age,
white blood cell (WBC) count, chromosomal abnormalities, and driver mutations (i.e.
NPM1, FLT3-ITD, TP53, and biallelic CEBPA) in cytogenetically normal (CN-AML)
patients. Taking into consideration that CN-AML represents roughly half of cases, and
sparsity of driver mutations in adult AML3, a significant number of patients do not harbor
any well-established prognostic marker to measure their risk score. Thus, there is a need
for identifying new group of prognostic indicators in adult AML.
Herein, we performed systems analysis of RNA-Seq data from adult AML patients
to discover group of alternative spliced events associated with disease outcome.
2
Statement of the Problem: Our understanding of AML has transformed over the past
decade. We have yet to tackle an ongoing major challenge of high mortality rate in elderly
AML. The high risk of relapse signifies our lack of capacity to forecast AML outcome, and
to apply more tailored disease management strategies. Thus far, available AML risk
assessment systems mainly rely on the well-established prognostic indicators in a form of
chromosomal aberrations, and a few driver mutations often in patients with normal
cytogenetics. Although these systems demonstrated acceptable performance in separating
favorable and adverse groups, they faced limitation in defining group of patients with no
cytogenetic aberrations, or driver mutations, and classified them as intermediate risk group.
Thus, there is a need for introducing new group of markers with ability to predict disease
outcome in adult AML.
Research Hypothesis: The majority of multi-exon pre-mRNA undergo alternative
splicing (AS). Erroneous splicing has been reported in genes associated with cancer
progression and metastasis.5,9-12 Recently, several groups have investigated AS for selected
genes in AML. 5,7,13-17 However, developing a robust disease outcome prediction model on
mis-spliced transcripts is still underway. We hypothesize that (i) AS variants have the
capacity of forecasting outcome in adult AML regardless of the known prognostic risk
factors. (ii) Signature events with AML outcome prediction capacity can serve as potential
prognostic indicators.; (iii) genes with erroneous splicing can harbor specific cis regulatory
module belong to regulatory elements with a role in splicing.
Significance of the Study: According to the American Cancer Society's (ACS)
(https://www.cancer.net/cancer-types/leukemia-acute-myeloid-aml/statistics), the 5-year
survival rate for adult AML is approximately 24%, with a rise in incidence, poor prognosis,
3
and failure to respond to therapy with age. AML is becoming a challenge as the US
population is growing and aging. Therefore, a great need exists for identifying novel AML
risk stratifying and prognostic indicators. Disrupted mRNA splicing is a hallmark of cancer
and has been reported in AML. However, systems analysis of mRNA splicing data from
adult AML patients to identify AS events with contribution to disease outcome and
predictive ability is lacking. This study offers a new method for risk assessment for adult
AML by identifying a group of mis-spliced isoforms with contribution to patient overall
survival (OS).

4
CHAPTER II
LITERATURE REVIEW
2.1 | AML a Complex Malignancy of Hematopoietic Progenitor Cells
AML is an aggressive complex
malignancy of myeloid blood cell lineage,
characterized by aberrant proliferation and
differentiation of myeloid blast, that result
in accumulation of undifferentiated,
immature, or mature non-functional
leukemic cells in the BM, and the PB, as
well as extramedullary tissues.2,18 In AML,
production of healthy and functional blood
cells from pluripotent hematopoietic stem
cells in the BM is suppressed. (Figure 1.)
Figure 1. Normal Hematopoiesis
Illustration depicts normal blood cell formation a so-called hematopoiesis. All mature functional blood components are derived from multipotential hematopoietic stem cells. AML is a blood malignancy of the myeloid line of blood cells.

5
Recent advances in technology have revolutionized our understanding of AML
heterogeneity, shed light on molecular landscape of disease. However, the primary focus
of the majority of AML related studies has been on mutations and to a lesser extent on gene
expression profile, methylation patterns, and miRNA regulation, leaving behind an
important mis-regulated process of alternative mRNA splicing.
2.1.1 | Epidemiology of AML
The ACS has estimated approximately 19,520 new cases of AML, and 10,670
deaths from AML, for 2018. The median age of patients with AML at diagnosis is about
65 years old.18 The incidence increases in elderly patients and is slightly higher in males.18
2.1.2 | Diagnosis
Normal bone marrow (BM) consists of 5% or less blasts. According to the 2016
WHO guideline,19 the diagnosis of AML is based on the presence of 20% or more myeloid
blasts in the marrow or the blood. In addition to a routine complete blood count (CBC),
microscopic exams, measuring prothrombin time (PT), partial thromboplastin time (PTT),
fibrinogen, and evaluating chemistry profile such as uric acid and lactate dehydrogenase
(LDH), a multidisciplinary diagnostic study on the BM including cytochemistry,
flowcytometry, immunohistochemistry, and molecular genetics analysis are essential to
precisely classify AML.20
2.1.3 | AML Risk Factors
For patients with de novo AML, incidence increases by age, most likely because of
accumulating molecular and cytogenetic abnormalities over times, and physiological
changes associated with aging that decrease treatment tolerance.21

6
There are several reported risk factors associated with secondary AML (referred to
as therapy-related AML, or AML arising from an antecedent hematologic disorders)
including exposure to alkylating agents (i.e., cyclophosphamides, procarbazine,
chlorambucil, melphalan, busulfan, and nitrogen mustard), high-dose radiation, history of
prior treatment with Topoisomerase II inhibitors (an important DNA repair enzyme) i.e.,
etoposide, teniposide, mitoxantrone, epirubicin, and doxorubicin,22 smoking and long term
exposure to benzene.23 AML can also be secondary to myelodysplastic syndrome (MDS),
myeloproliferative neoplasm (MPN), MDS/MPN, and aplastic anemia.
2.1.4 | Recurrent Translocations and Genetic Rearrangements in AML
The chromosomal aberrations or anomalies include numerical (aneuploidy) or
structural disorder. Aneuploidy occurs when cells missing one of the diploid chromosomes
(referred to as monosomy) or has gained two chromosomes of a pair (such as trisomy).
Structural abnormalities include (i) translocations (abbreviated as: t), in which a segment
of the chromosome is transferred to another chromosome; (ii) inversions (abbreviated as:
inv); when a portion of the chromosome is reversed; (iii) deletions (abbreviated as: del) ,
when a part of the chromosome is missing; (iv) duplication, in which a portion of
chromosome is duplicated; (v) isochromosome (abbreviated as: i), with loss of one arm of
the chromosome and duplication of the other arm; and (vi) isodicentric (abbreviated as:
idic), which an abnormal chromosome contains two repetitive elements and centrosomes.
Cytogenetic and chromosomal abnormalities have been detected in approximately
50% of AML patients. AML chromosomal abnormalities include: (i) unbalanced
abnormalities: del(7q), del(5q), i(17q)/t(17p), del(13), del(11q), del(12p)/t(12p),
idic(X)(q13); (ii) balanced abnormalities: t(11;16)(q23;p13.3), t(3;21)(q26.2;q22.1),

7
t(1;3)(p36.3;q21.1), t(2;11)(p21;q23), t(5;12)(q33;p12), t(5;7)(q33;p12), t(5;17)(q33;p13),
t(5;10)(q33,q21), and t(3;5)(q25;q34).24
According to the 2016 World Health Organization (WHO)19 and the 2017 National
Comprehensive Cancer Network (NCCN) 20guidelines, AML patients harboring 3 or more
cytogenetic abnormalities are considered as complex karyotype (AML-CK) with poor
prognosis and a frequency of 10-15%.3,24 Patients with two or more autosomal
monosomies or one autosomal monosomy with another structural abnormality are referred
to as a monosomal karyotype (AML-MK) with unfavorable risk status and frequency of
5-10%.3 BCR-ABL1 fusion (t(9;22)(q34q11.2)), translocation in 11q23- non t(9;11) or
t(11,v)(q23,v), GATA2-MECOM fusion (inv(3)(q21q26)/ t(3;3)), and DEK-NUP214
fusion (t(6;9)(p23;q34)) are also associated with poor AML prognosis.19,25 AMLs with
RUNX1-RUNX1T1 fusion (t(8;21)(q22;q22)), MYH11-CBFB fusion (inv(16)(p13q22)),
or PML-RARA fusion (t(15;17)(q24;q21)) are referred to as core binding factor AML
(CBF-AML) with favorable risk status.19 Finally, patients with MLLT3-KMT2A fusion
(t(9;11)(p22;q23)) are considered as intermediate prognosis group.
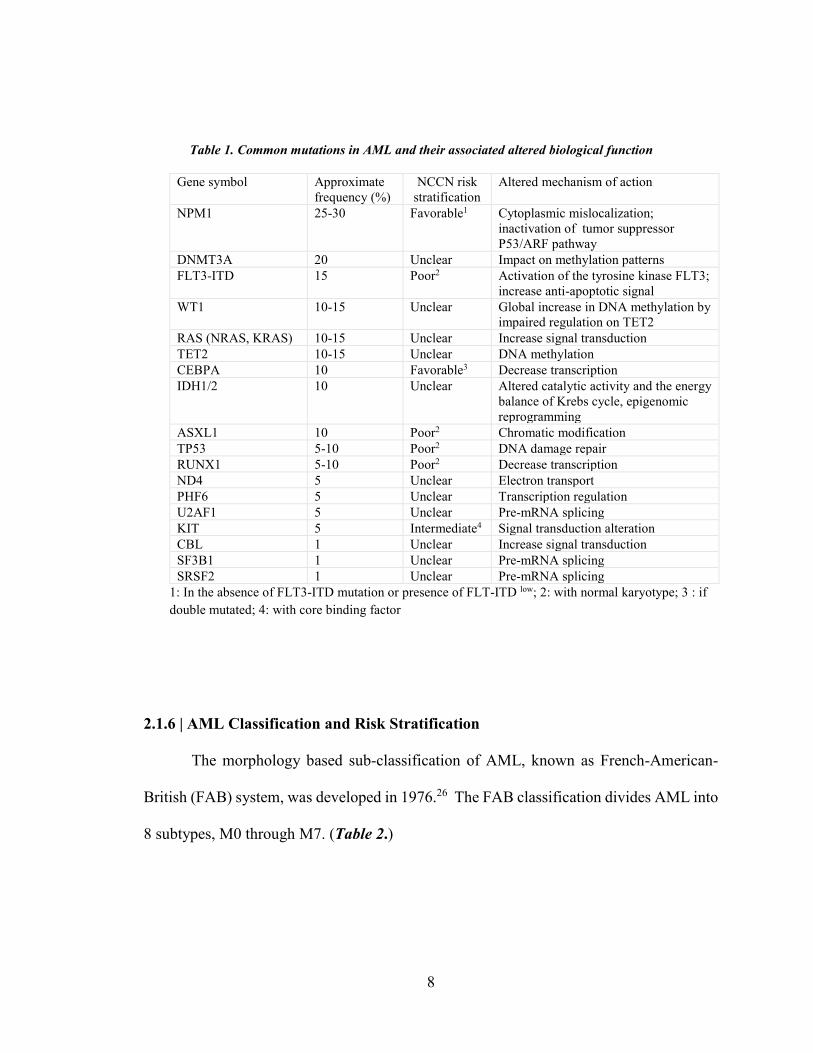
2.1.5 | Common Mutations in AML
In addition to recurrent cytogenetics and chromosomal abnormalities, several
somatic mutations have been associated with AML prognosis. These genes include NPM1,
the most common mutated gene, followed by DNMT3A, FLT3-ITD, WT1, RAS, TET2,
CEBPA, IDH1, IDH2, ASXL1, TP53, RUNX1, ND4, PHF6, U2AF1, KIT, KMT2A-PTD,
SRSF2, SF3B1, and CBL24. Table 1 represents approximate frequency of each mutation,
its proposed prognostic risk, and altered function.24
8
2.1.6 | AML Classification and Risk Stratification
The morphology based sub-classification of AML, known as French-American-
British (FAB) system, was developed in 1976.26 The FAB classification divides AML into
8 subtypes, M0 through M7. (Table 2.)
Table 1. Common mutations in AML and their associated altered biological function
Gene symbol Approximate frequency (%)
NCCN risk stratification
Altered mechanism of action
NPM1 25-30 Favorable1
Cytoplasmic mislocalization; inactivation of tumor suppressor P53/ARF pathway
DNMT3A 20 Unclear Impact on methylation patterns FLT3-ITD 15 Poor2
Activation of the tyrosine kinase FLT3; increase anti-apoptotic signal
WT1 10-15 Unclear Global increase in DNA methylation by impaired regulation on TET2
RAS (NRAS, KRAS) 10-15 Unclear Increase signal transduction TET2 10-15 Unclear DNA methylation CEBPA 10 Favorable3 Decrease transcription IDH1/2 10 Unclear Altered catalytic activity and the energy
balance of Krebs cycle, epigenomic reprogramming
ASXL1 10 Poor2 Chromatic modification TP53 5-10 Poor2 DNA damage repair RUNX1 5-10 Poor2 Decrease transcription ND4 5 Unclear Electron transport PHF6 5 Unclear Transcription regulation U2AF1 5 Unclear Pre-mRNA splicing KIT 5 Intermediate4 Signal transduction alteration CBL 1 Unclear Increase signal transduction SF3B1 1 Unclear Pre-mRNA splicing SRSF2 1 Unclear Pre-mRNA splicing
1: In the absence of FLT3-ITD mutation or presence of FLT-ITD low; 2: with normal karyotype; 3 : if double mutated; 4: with core binding factor

9
Gradual improvement in AML diagnosis and risk classification started in 1999,
when WHO offered a new cytogenetics based prognostic risk assessment system, and re-
set percent blast threshold at diagnosis from 30% offered by FAB group to 20% or more.
Several years later, in 2008, WHO released a revised guideline that incorporated recurrent
cytogenetic abnormalities and some molecular markers.27 In 2010, the European
LeukemiaNet (ELN) proposed an AML risk assessment system based on cytogenetic and
molecular abnormalities that divided AML to four sub-groups of (i) favorable in patients
with core-binding factors, or NPM1 mutation in absence of FLT3-ITD, or CEBPA
mutation, (ii) intermediate-I consisting of patients with FLT3-ITD mutation, (iii)
intermediate-II including patients with MLLT3-MLL fusion or other cytogenetic
abnormalities not classified as favorable or adverse outcome, and (iv) adverse28, which later
was updated to three groups of favorable, intermediate, and adverse, by merging two
Table 2. The FAB morphology based sub classification of AML
FAB subtype Name M0 Undifferentiated acute myeloblastic leukemia M1 Acute myeloblastic leukemia with minimal maturation M2 Acute myeloblastic leukemia with maturation M3 Acute promyelocytic leukemia (APL) M4 Acute myelomonocytic leukemia M5 Acute monocytic leukemia M6 Acute erythroid leukemia M7 Acute megakaryoblastic leukemia
M0-M5 include myeloid undifferentiated cells; M6 starts in erythroid progenitor lineage; M7 represents AML with megakaryoblastic cell lineage.

10
intermediate groups and addition of RUNX1, ASXL1, and TP53 mutations to the adverse
group. (Table 3.)29
Table 3. The 2017 European LeukemiaNet classification system
Risk category
Genetic abnormality
Favorable t(8;21)(q22;q22.1); RUNX1-RUNX1T1 inv(16)(p13.1q22) or t(16;16)(p13.1;q22); CBFB-MYH11 Mutated NPM1 w/o FLT3-ITD or with FLT3-ITDlow Biallelic mutated CEBPA Intermediate Mutated NPM1 and FLT3-ITDhigh WT NPM1 w/o FLT3-ITD or with FLT3-ITD low (w/o adverse-risk lesions) t(9;11)(p21.3;q23.3); MLLT3-KMT2A Cytogenetic abnormalities not classified as favorable or adverse Adverse t(6;9)(p23;q34.1); DEK-NUP214 t(v;11q23.3); KMT2A rearranged
t(9;22)(q34.1;q11.2); BCR-ABL1 inv(3)(q21.3q26.2) or t(3;3)(q21.3;q26.2); GATA2,MECOM(EVI1) −5 or del(5q); −7; −17/abn(17p) Complex karyotype, monosomal karyotype WT NPM1 and FLT3-ITDhigh Mutated RUNX1 Mutated ASXL1 Mutated TP53
Low: low allelic ratio (<0.5); high: high allelic ratio (≥0.5); semiquantitative assessment of FLT3-ITD allelic ratio: ratio of the area under the curve “FLT3-ITD” divided by area under the curve “FLT3-wild type”
11
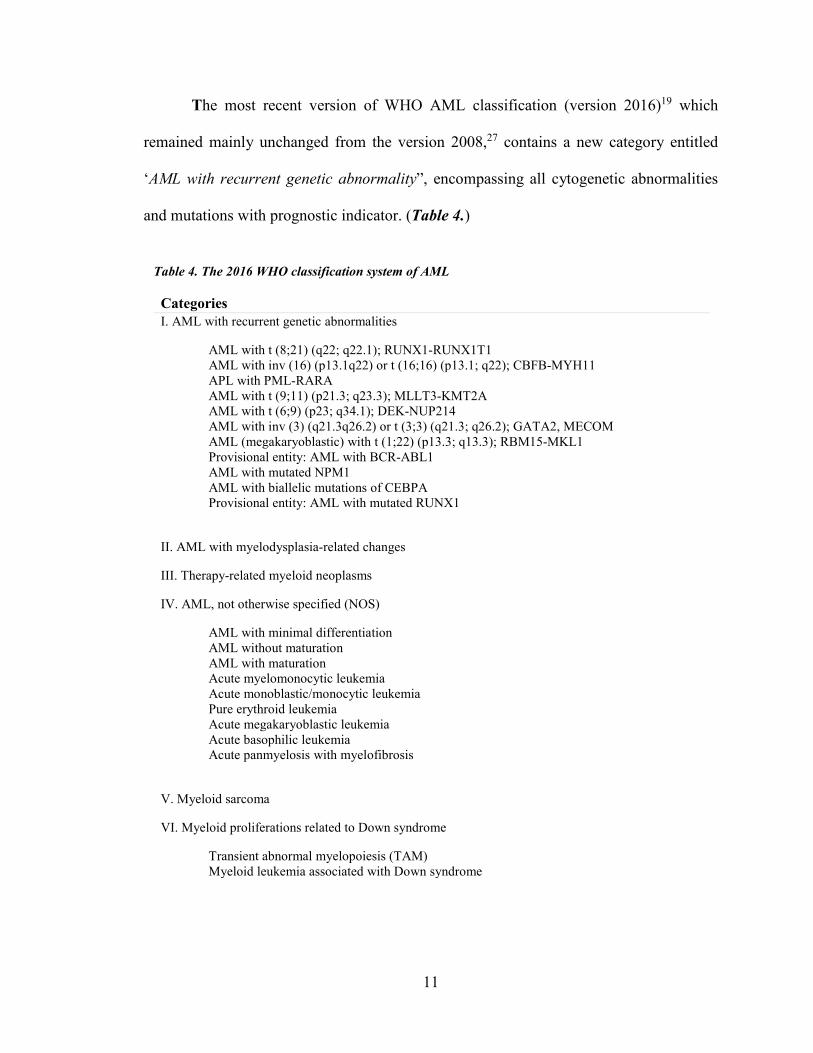
The most recent version of WHO AML classification (version 2016)19 which
remained mainly unchanged from the version 2008,27 contains a new category entitled
‘AML with recurrent genetic abnormality”, encompassing all cytogenetic abnormalities
and mutations with prognostic indicator. (Table 4.)
Table 4. The 2016 WHO classification system of AML
Categories I. AML with recurrent genetic abnormalities
AML with t (8;21) (q22; q22.1); RUNX1-RUNX1T1 AML with inv (16) (p13.1q22) or t (16;16) (p13.1; q22); CBFB-MYH11 APL with PML-RARA AML with t (9;11) (p21.3; q23.3); MLLT3-KMT2A AML with t (6;9) (p23; q34.1); DEK-NUP214 AML with inv (3) (q21.3q26.2) or t (3;3) (q21.3; q26.2); GATA2, MECOM AML (megakaryoblastic) with t (1;22) (p13.3; q13.3); RBM15-MKL1 Provisional entity: AML with BCR-ABL1 AML with mutated NPM1 AML with biallelic mutations of CEBPA Provisional entity: AML with mutated RUNX1
II. AML with myelodysplasia-related changes
III. Therapy-related myeloid neoplasms
IV. AML, not otherwise specified (NOS)
AML with minimal differentiation AML without maturation AML with maturation Acute myelomonocytic leukemia Acute monoblastic/monocytic leukemia Pure erythroid leukemia Acute megakaryoblastic leukemia Acute basophilic leukemia Acute panmyelosis with myelofibrosis
V. Myeloid sarcoma
VI. Myeloid proliferations related to Down syndrome
Transient abnormal myelopoiesis (TAM) Myeloid leukemia associated with Down syndrome
12
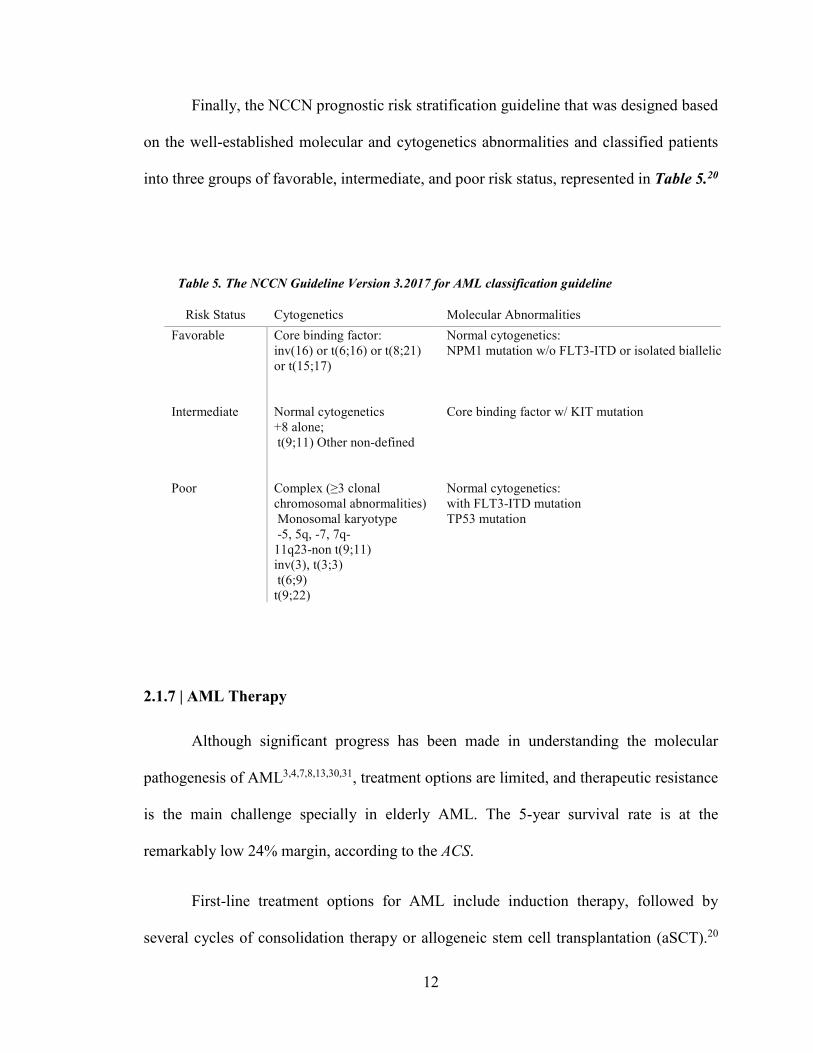
Finally, the NCCN prognostic risk stratification guideline that was designed based
on the well-established molecular and cytogenetics abnormalities and classified patients
into three groups of favorable, intermediate, and poor risk status, represented in Table 5.20
2.1.7 | AML Therapy
Although significant progress has been made in understanding the molecular
pathogenesis of AML3,4,7,8,13,30,31, treatment options are limited, and therapeutic resistance
is the main challenge specially in elderly AML. The 5-year survival rate is at the
remarkably low 24% margin, according to the ACS.
First-line treatment options for AML include induction therapy, followed by
several cycles of consolidation therapy or allogeneic stem cell transplantation (aSCT).20
Table 5. The NCCN Guideline Version 3.2017 for AML classification guideline
Risk Status Cytogenetics Molecular Abnormalities Favorable
Core binding factor: inv(16) or t(6;16) or t(8;21) or t(15;17)
Normal cytogenetics: NPM1 mutation w/o FLT3-ITD or isolated biallelic
Intermediate
Normal cytogenetics +8 alone; t(9;11) Other non-defined
Core binding factor w/ KIT mutation
Poor
Complex (≥3 clonal chromosomal abnormalities) Monosomal karyotype -5, 5q, -7, 7q- 11q23-non t(9;11) inv(3), t(3;3) t(6;9) t(9;22)
Normal cytogenetics: with FLT3-ITD mutation TP53 mutation
13
For the past three decades the standard induction protocol remained unchanged, employing
a continuous infusion of 100-200 mg/m2 cytarabine for 7 days, with an anthracycline, either
daunorubicin (60-90 mg/m2 on days 1-3) or idarubicin (IDA, 12 mg/m2 for 3 days), with
or without etoposide (75 mg/m2 for 3 days), hereinafter referred to as 7+3 or 7+3+3
regimens.20,25 Induction therapy often preceded by hydroxyurea (Hydrea) to reduce WBC
counts. (Table 6.) A successful treatment for Acute Promyelocytic Leukemia (APL), a
subclass of AML with PML-RARA fusion, can be achieved with all-trans retinoic acid
(ATRA, 25-45 mg/m2 until CR, max 90 days), in addition to IDA (12 mg/m2 days
2,4,6,8),32 or in combination with standard induction therapy.25 PML-RARA is known for
its role in repressing myeloid differentiation genes.33 ATRA detaches PML-RARA from
DNA, results in promyelocyte maturation to neutrophil.34
Complete remission (CR) in AML is defined as reduction of blast counts to less
than 5% in the bone marrow while maintaining normal blood cell counts.35,36 Although
evaluating the bone marrow and the peripheral blood with available techniques37,38
indicates that a substantial number of patients experience CR after induction therapy, a
small subset of patients achieve a long-term remission. Larger number of patients fail re-
induction therapy and relapse. Relapse following complete response is defined as
reappearance of myeloblast cells in the peripheral blood or finding more than 5% blasts in
the bone marrow. 25
For younger patients who achieve CR, matched sibling or alternative donor
hematopoietic stem cell transplantation often gives promising outcome.
14
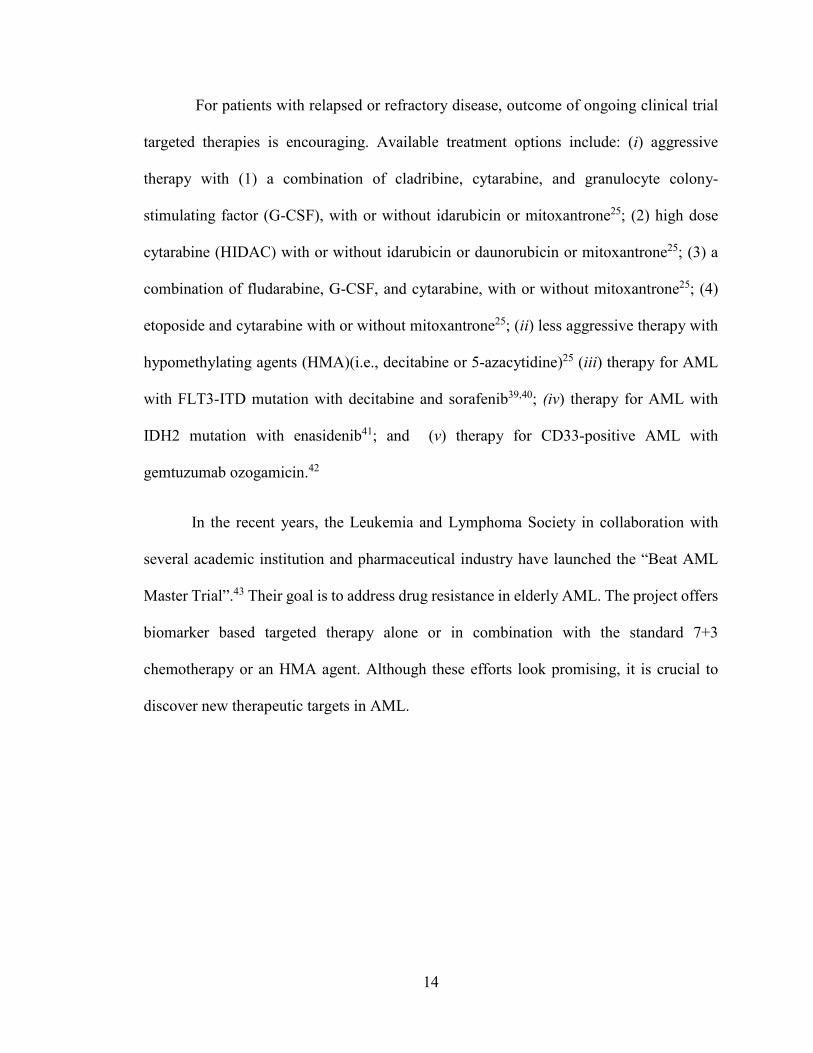
For patients with relapsed or refractory disease, outcome of ongoing clinical trial
targeted therapies is encouraging. Available treatment options include: (i) aggressive
therapy with (1) a combination of cladribine, cytarabine, and granulocyte colony-
stimulating factor (G-CSF), with or without idarubicin or mitoxantrone25; (2) high dose
cytarabine (HIDAC) with or without idarubicin or daunorubicin or mitoxantrone25; (3) a
combination of fludarabine, G-CSF, and cytarabine, with or without mitoxantrone25; (4)
etoposide and cytarabine with or without mitoxantrone25; (ii) less aggressive therapy with
hypomethylating agents (HMA)(i.e., decitabine or 5-azacytidine)25 (iii) therapy for AML
with FLT3-ITD mutation with decitabine and sorafenib39,40; (iv) therapy for AML with
IDH2 mutation with enasidenib41; and (v) therapy for CD33-positive AML with
gemtuzumab ozogamicin.42
In the recent years, the Leukemia and Lymphoma Society in collaboration with
several academic institution and pharmaceutical industry have launched the “Beat AML
Master Trial”.43 Their goal is to address drug resistance in elderly AML. The project offers
biomarker based targeted therapy alone or in combination with the standard 7+3
chemotherapy or an HMA agent. Although these efforts look promising, it is crucial to
discover new therapeutic targets in AML.
15
Table 6. AML Chemotherapy agents and their mechanism of action
Drug Mechanism of Action Cytarabine; Ara-C A pyrimidine nucleoside analog, act by direct DNA damage and
incorporation into DNA Daunorubicin; Idarubicin (IDA)
A very toxic anthracycline aminoglycoside antineoplastic, act by interaction with DNA in a variety of different ways including intercalation (squeezing between the base pairs), DNA strand breakage and inhibition with the enzyme topoisomerase II
Etoposide An antineoplastic agent and an epipodophyllotoxin (a semisynthetic derivative of the podophyllotoxins). It inhibits DNA topoisomerase II, thereby ultimately inhibiting DNA synthesis.
Hydroxyurea An antineoplastic agent that inhibits DNA synthesis through the inhibition of ribonucleoside diphosphate reductase, producing cell death in S phase
All-trans-retinoic acid (ATRA)
It produces an initial maturation of the primitive promyelocytes derived from the leukemic clone, followed by a repopulation of the bone marrow and peripheral blood by normal, polyclonal hematopoietic cells
Decitabine An analogue of cytidine that directly incorporates into DNA and inhibits DNA methyltransferase
Fludarabine Inhibiting DNA polymerase alpha, ribonucleotide reductase and DNA primase, thus inhibiting DNA synthesis.
Cladribine Incorporated into DNA after phosphorylation by deoxycytidine kinase and results in DNA strand breakage and inhibition of DNA synthesis and repair.
Clofarabine Inhibits DNA synthesis through an inhibitory action on ribonucleotide reductase, and by terminating DNA chain elongation and inhibiting repair through competitive inhibition of DNA polymerases.
Gleevec (Imatinib) a small molecule kinase inhibitor, inhibits the BCR-ABLl tyrosine kinase
Mitoxantrone Intercalates into DNA through hydrogen bonding, causes crosslinks and strand breaks. It also interferes with RNA, and is a potent inhibitor of topoisomerase II, an enzyme responsible for uncoiling and repairing damaged DNA
Revlimid Induces cell apoptosis by inhibiting the expression of cyclooxygenase-2 (COX-2)
Genasense Anti-sense oligo-deoxyribonucleotide (bcl-2 anti-sense)
(source DrugBank database: https://www.drugbank.ca/drugs)

16
2.2 | Alternative Splicing
Over the past decade scientists
have utilized high-throughput
sequencing to assess genetic aberrations
of cancer. The primary focus has been
discovery of common cancer driver
mutations that involve in tumorigenesis,
cancer aggressiveness, and treatment
response. However, a functional driver
gene does not need to be mutated;
ectopic expression can also promote
tumorigenesis.44 Utilizing a systems
analysis approach empowered
researchers to study beyond mutation
profile of AML.3,44-46 47,48This resulted in better understanding of AML epigenomics3,8,49,
and shed light on differential gene expression patterns of AML.46-48 A key step in regulating
tissue specific gene expression profile is post-transcriptional regulation via alternative
precursor messenger RNA (pre-mRNA) splicing.50
In 1961, Francois Jacob, along with Sydney Brenner and Matthew Meselson,
announced discovery of mRNA as an informational molecule.51 A nascent pre-mRNA, a
product of DNA transcription in the nucleus, consists of exons (i.e., coding regions) and
intron(s) (i.e., non-coding regions). Introns present in a gene but not in a mature mRNA.
Figure 2. Pre-mRNA editing
Eukaryotic pre- mature mRNA undergoes splicing process prior to leaving the nucleus. This process includes intron excision and exon splicing that creates different isoforms in multi-exons transcripts. Five types of alternative spliced mRNA depicted in this schematic.
17
The process of cutting intron(s) out and joining the exon-exon boundaries (a.k.a splice
junctions) to form a protein coding mature-sized mRNA is called RNA splicing.51
The majority of human multi-exon pre-mRNAs can be spliced in more than one
way, 50-52 a so-called alternative splicing (referred to as AS). AS is delineated as various
combinations of 5´ and 3´ exon splice sites to generate mRNA isoforms from a single
mRNA precursor that results in structural RNA as well as regulatory RNA (i.e., lncRNA)
variations, leading to proteome diversity.9,11,12 This leads to one or several splice variants
known as (i) skipped exon (SE), (ii) mutually exclusive exons (MXE), (iii) retained intron
(RI), (iv) alternative 5´ splice sites (A5SS), and, alternative 3´ splice sites (A3SS). (Figure
2.)
AS plays a crucial role during cell proliferation and differentiation. In cancer, the
normal splicing process is often disrupted and cancer cells make isoforms that contribute
to cancer hallmarks.5,9,11,12 Several studies have shown aberrant splicing in genes related to
apoptosis (BCL2L1, FAS, BIN1, CASP-2, and MCL1), angiogenesis (VEGFA), tumor
progression, invasion, and metastasis (CD44, ENAH, MSTR1, RAC1, and KLF6), cell
metabolism (PKM), and drug resistance (BCL2L11, and HER2) in various tumor types
including hematologic, breast, bladder, colorectal, gynecologic, head and neck, kidney,
liver, pancreatic, prostate, and skin.5,9-12
Pre-mRNA splicing has profound effect in normal hematopoiesis and blood cell
differentiation.53 In addition, a comparison between AS profile of AML patients and
normal donor bone marrow CD34+ cells suggested that disrupted splicing is a common
characteristic for AML.17 Aberrant expression of gene isoforms with a role in AML has

18
been reported in multiple studies. These include CD44, a cell-surface glycoprotein54 ;
CD33 or SIGLEC-3, a transmembrane receptor of myeloid lineage and a target for AML
therapy55-57; DIS3, a catalytic subunit of RNA processing exosome58; DNMT3A, a DNA
methyltransferase with pathogenesis role in a subset of AML patients59; hTERT,
telomerase reverse transcriptase60; and NOTCH2 and FLT361, among others. Moreover,
risk stratifying capacity of AS has been suggested by a study on RNA-Seq profiling of an
AML patient prior to chemotherapy and after CR.14
Splicing in multi-exon genes is highly regulated by cis-regulatory modules (CRM),
and trans splicing factors.51 Although several studies have shown recurrent splicing factor
mutations as possible drivers of hematological malignancies62-64, study by the Cancer
Genome Atlas (TCGA) group revealed that a small subset of adult AML cases harbor
splicing factors mutation, the majority in U2AF1 (4%)3, stressing on importance of
investigating other mechanisms by which activity of splicing factors is altered in AML.
In the recent years, several computational tools with different splice variant calling
and statistical approach have been developed to study differentially spliced transcripts
from RNA-Seq data.65-69 Yet, a system analysis approach to identify mis-spliced
transcripts as prognostic and/or pre-disposing cancer indicators, and to assess their capacity
to predict patients survival outcome is lacking.
In the present study, we introduced a computational systems biology approach,
developed using available bioinformatics, machine learning, and statistical algorithms to
elucidate capacity of alternative splice variants in discriminating survival outcome in adult
AML, and identify their contribution to AML prognosis.

19
CHAPTER III
METHODOLOGY
Considering shortcomings of AML risk stratification system, we aimed to introduce
a method to address several existing issues by global analysis of alternative mRNA splicing
from RNA-Seq data. Our goals include (aim 1) constructing a validated model on mRNA
splicing data with a capacity of predicting disease outcome in adult AML; (aim 2)
evaluating capacity of mis-spliced transcripts to serve as novel prognostic indicators; (aim
3) understanding the mechanism behind aberrant splicing in AML.
Overview: In our method we employed (i) Spliced Transcripts Alignment to Reference
(STAR)70 for aligning RNA-Seq reads to the human reference genome (hg19), and (ii)
replicate Multivariate Analysis of Transcript Splicing (rMATS)65 to calculate Percent
Spliced In, abbreviated as PSI (or ψ ϵ[0,1]), and the effective length of inclusion and
skipped isoforms for each splice variant.
We utilized a penalized Cox’s proportional hazards (PH) model to investigate
contribution of genes with AS events to patients `overall survival who assigned a specific
initial therapy (i.e., 7+3 or 7+3+3). Since the number of observations (i.e., n = AML
patients) was far less than the number of predictor variables (i.e., p = AS events and AML
risk factors), we penalized Cox with the grouped lasso (hereinafter referred to as GL-Cox)
to eliminate variables with no apparent contribution to disease outcome prediction.71,72
20
Our dataset consisted of 173 adult AML patients participated in TCGA study.3 To
avoid overfitting, we started by focusing on patients treated with a 7+3 or 7+3+3 regimen
after blood collection (core dataset; n = 79). We performed stratified random sampling by
considering age, WBC count, history of transplant, treatment, and overall survival time as
strata, and split the core dataset into two groups of training set (referred to as TS; n=54)
and validation set-1 (referred to as VS-1; n =25). Ratio of male to female in both groups
stayed the same (about 1.2, compare to 1.1 for the entire dataset). Patients with history of
prior treatment with Hydrea who were treated with different types of initial therapy were
considered as a validation set-2 (referred to as VS-2; n =44), and all patients with exclusion
of the TS as a validation set-3 (referred to as VS-3; n =119).
We fit the GL-Cox model on the TS and performed a 10-fold cross validation to
identify tuning parameter (λ) that minimized partial likelihood deviance. Then, the model
was re-fit using the selected tuning parameter to identify predictors with non-zero
coefficients. Moreover, we validated our model by computing Area under time-dependent
Receiver Operating Characteristic (ROC) Curve (AUROCt), constructed on different
values of sensitivity and specificity estimated from the predicted values (i.e., linear
predictor "LP ").
To further demonstrate clinical relevance of the signature AS events identified by
the GL-Cox, we set-up an LP cut-off (LPc), and performed Kaplan-Meier survival analysis
on two groups of patients distinguished by this cut-off. Finally, we compared the prediction
accuracy of the GL-Cox model to a standard Cox PH model (herein after referred to as S-
Cox) fit to the well-established AML risk factors. A schematic illustration of the study is
shown in Figure 3.
21
3.1| Dataset
Data that we analyzed for this study were from a study conducted by TCGA.3 We
obtained the peripheral blood RNA sequencing data from 173 clinically annotated cases of
adult de novo AML, from Genomic Data Commons (GDC) legacy portal
(https://portal.gdc.cancer.gov/legacy-archive). Clinical data and mutation profile of
patients were obtained from TCGA data portal (https://tcga-
data.nci.nih.gov/docs/publications/laml_2012 )
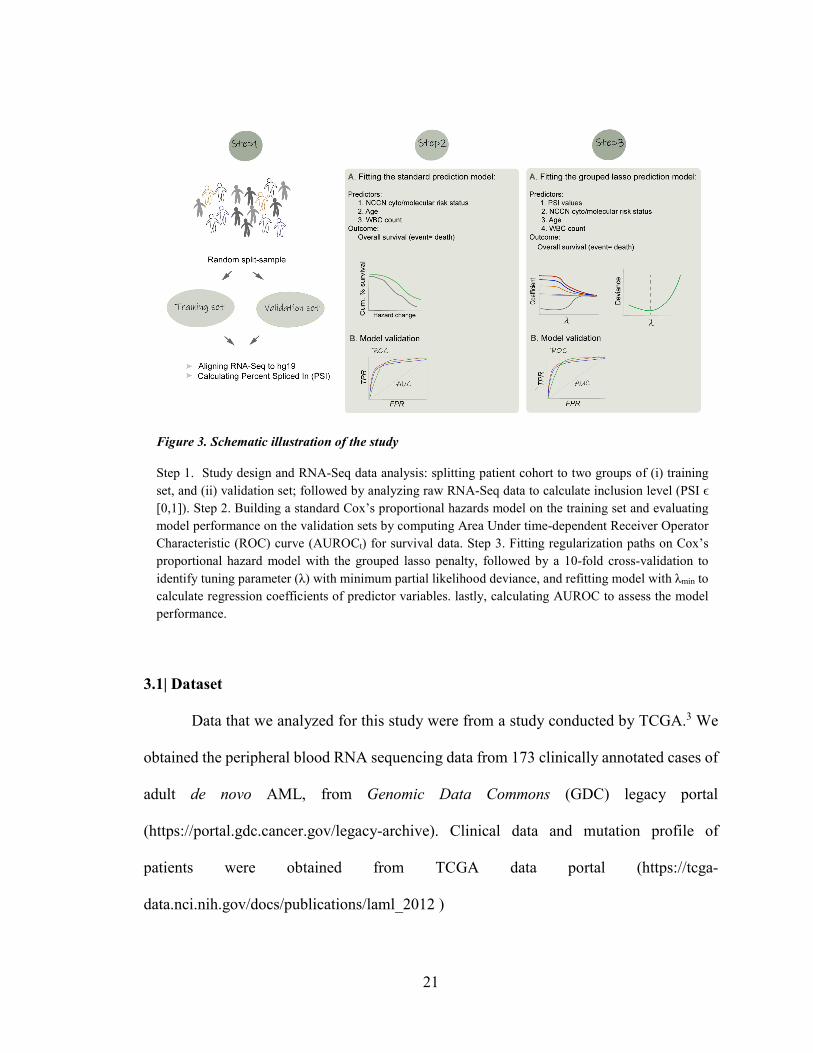
Figure 3. Schematic illustration of the study
Step 1. Study design and RNA-Seq data analysis: splitting patient cohort to two groups of (i) training set, and (ii) validation set; followed by analyzing raw RNA-Seq data to calculate inclusion level (PSI ϵ [0,1]). Step 2. Building a standard Cox’s proportional hazards model on the training set and evaluating model performance on the validation sets by computing Area Under time-dependent Receiver Operator Characteristic (ROC) curve (AUROCt) for survival data. Step 3. Fitting regularization paths on Cox’s proportional hazard model with the grouped lasso penalty, followed by a 10-fold cross-validation to identify tuning parameter (λ) with minimum partial likelihood deviance, and refitting model with λmin to calculate regression coefficients of predictor variables. lastly, calculating AUROC to assess the model performance.

22
3.2 | Study Design
We performed a stratified random sampling on a core dataset of 79 patients treated
with similar initial therapy, i.e., 7+3 or 7+3+3 regimen and split it to two groups: (1) TS
(n=54), and (2) VS-1 (n=25). (Figure 4.) Strata included (i) age, (ii) history of transplant,
(iii) WBC count, (iv) treatment, and (v) overall survival time. We considered patients with
prior history of Hydrea therapy and different types of induction therapy (Table 8.) as VS-
2 (n=44). A VS-3 included all patients excluding the TS (n=119) was used to evaluate
prognostic capacity of signature events. (Figure 4., and Table 7.)
Figure 4. Study design
TCGA adult de novo AML cohort treated with 7+3 or 7+3+3 regimens after sample collection have been stratified on AML risk factors and split randomly to two groups: training set (n =54) and validation set-1 (n=25). Validation set-2 included Hydrea pre-treated cohort (n=44) with different therapy regimens and validation set-3 all treated AML patients excluding the training set.

23
Table 7. Frequency of different induction therapies in TCGA AML cohort
Prior Hydrea therapy Induction therapy regimen No Yes 7+3 44 18 7+3+3 35 10 7+3, daunorubicin 2 1 7+3, IT 2 1 7+3+3, gleevec 0 1 7+3+3, then 5+2+2 0 1 7+3+3+PSC* 2 2 7+3+AMD 1 1 7+4+ATRA 2 0 7+3+ATRA 11 1 7+3+Genasense 2 1 7+3+study drug 2 1 Azacytidine 1 0 Clofarabine, Cytarabine and Mitoxantrone (CLAM)** 0 2 Cytarabine 1 0 Decitabine 13 0 Decitabine then 7+3 1 0 Hydrea + Idarubicin 0 1 Hydrea, ATRA 1 0 Hydrea 1 0 LBH/Decitabine 1 0 Ara C(low dose) 1 0 Revlimid 5 3 Revlimid then Decitbne,7+3,5+2 1 0 No treatment 5 -
Table represents frequency of each induction regimen for TCGA AML cohort with available RNA-Seq data. Patients with history of prior treatment with Hydrea were counted separately. * valspodar: inhibits p-glycoprotein, the multidrug resistance efflux pump, thereby restoring the retention of chemotherapy drugs ** cytarabine 750mg/m2/day for 5 days + clofarabine 30mg/m2/day for 5 days, Mitoxantrone 12mg/m2/day for 3 days Cases included in the training set and validation set-1 were highlighted in the table.

24
3.3 | Bioinformatics Pipeline
The accuracy of downstream analysis of RNA-Seq data largely depends on the
alignment step. The most commonly used spliced-aware aligners are based on direct
alignment of RNA-Seq reads to the reference genome.73
We utilized STAR, which is a highly accurate, fast, and among the most reliable
splice-aware aligner,73 to map short paired RNA-Seq reads to human reference genome.
Then, we employed rMATS65 to (i) assign AS type (Figure 2.) to reads that mapped to
alternative exon(s) and its associated boundaries, using transcripts `coordinates, (ii)
calculate the effective length of each isoform, and (iii) estimate PSI value for each AS
event. Finally, we defined a cut-off to capture AS events with more reliable PSI estimates
across all 173 samples. MATS algorithm has advantage of correcting mapped reads counts
to the length of target region (i.e., target exon or splice site) that results in more reliable
PSI estimation.
3.3.1 | STAR
Precise alignment of millions of short reads belong to nearly 20,000 human genes
with at least one isoform is an ongoing challenge. Multiple tools have provided smart
solutions to this problem, among them the popular STAR introduced an algorithm that
starts by seed finding or sequential search for Maximal Mappable Prefix (MMP) using
uncompressed suffix arrays (SAs), followed by stitching together all the aligned seeds
within a user-defined window70. (Figure 5.) The stitching is directed by a local alignment
scoring strategy with a pre/user-defined match, mismatch, indel, and splice junction gap
penalties that led to quantification assessment of the alignment quality and rank.70

25
We employed STAR 2.5.170 to align Illumina Genome Analyzer IIx paired end 50
bases RNA sequencing reads to the human reference genome (hg19) with slight
modification in the default setting to capture splice variants. 65 (i.e., chimSegmentMin= 2,
outFilterMismatchNmax= 3, alignEndsType= EndToEnd, alignIntronMax= 300,000,
alignSJDBoverhangMin=8).70
3.3.2 | rMATS
We utilized rMATS 3.2.565 to estimate inclusion isoform reads (abbreviated as I)
and skipped isoform reads (abbreviated as S) for each transcript. Briefly, I include the reads
that map to the upstream splice junction, the body of alternative exon, and the downstream
splice junction. (Figure 6.) S are the reads that align to the skipping splice junction that
directly connects the upstream exon to the downstream exon. (Figure 6.)
For four AS types (i.e., SE, RI, A3SS, and A5SS) S were corrected to RNA-Seq
read length (i.e., the effective length of skipping isoforms, referred to as ls) and I to RNA-
Figure 5. Schematic illustration of the STAR
Maximum Mappable Prefix (MMP) search for a read containing a splice junction (shown in purple color). STAR seeks for MMP1 that matches a substring of reference genome (shown in green color are exons separated by an intron/long gap in black color), starting from the first base of RNA-Seq read. MMP1 maps to donor splice site (exon at the left side). Then algorithm continues its search by remapping the unmapped portion of the read (i.e., MMP2) looking for acceptor splice site (in the second exon, at the right) in the same gene or another chimeric gene.

26
Seq read length plus alternative exon length (i.e., the effective lengths of inclusion isoforms
referred to as li).65 (Figure 6.) For MXE isoforms, with two alternative exons, both I and
S were corrected to RNA-Seq read length plus alternative exon length. (Figure 6.) The
correction step is calculated as follow:
𝐼𝐼𝑛𝑛 =𝐼𝐼𝑙𝑙𝑖𝑖
𝑆𝑆𝑛𝑛 = 𝑆𝑆 𝑙𝑙𝑠𝑠
where In represents the corrected inclusion counts and Sn shows the corrected skipped
counts. Inclusion level or PSI (PSI ϵ [0,1]) reflects a proportion estimated from read counts,
representing the percentage of transcripts with a specific exon or splice site, and is defined
as In over the sum of In and Sn. 65,69
𝑃𝑃𝑆𝑆𝐼𝐼 =𝐼𝐼𝑛𝑛
(𝐼𝐼𝑛𝑛 + 𝑆𝑆𝑛𝑛)
To capture more reliable PSI estimate across all samples, we filtered out events if
the minimum minor splice expression was less than 10% of the mean major splice
expression across all samples. We performed filtering step as follow:
𝑃𝑃𝑆𝑆𝐼𝐼 ������ ≥ 0.5 → 𝑒𝑒 = 1 (𝑖𝑖𝑖𝑖𝑖𝑖𝑙𝑙𝑖𝑖𝑖𝑖𝑖𝑖𝑖𝑖𝑖𝑖 𝑖𝑖𝑖𝑖𝑖𝑖𝑖𝑖𝑖𝑖𝑖𝑖𝑖𝑖)
𝑃𝑃𝑆𝑆𝐼𝐼 ������ < 0.5 → 𝑒𝑒 = 2 (𝑖𝑖𝑠𝑠𝑖𝑖𝑠𝑠𝑠𝑠𝑖𝑖𝑖𝑖𝑠𝑠 𝑖𝑖𝑖𝑖𝑖𝑖𝑖𝑖𝑖𝑖𝑖𝑖𝑖𝑖)
min(𝑆𝑆𝑛𝑛1 … 𝑆𝑆𝑛𝑛𝑛𝑛 ) ≥ 0.1 ∗ 𝐼𝐼𝑛𝑛� | 𝑒𝑒 = 1
min(𝐼𝐼𝑛𝑛1 … 𝐼𝐼𝑛𝑛𝑛𝑛 ) ≥ 0.1 ∗ 𝑆𝑆𝑛𝑛��� | 𝑒𝑒 = 2

27
where 𝑃𝑃𝑆𝑆𝐼𝐼 ������ represented mean PSI across all samples (1, ..., m), and major splice event (e)
was considered inclusion isoform, if 𝑃𝑃𝑆𝑆𝐼𝐼 ������ ≥ 0.5 and skipping isoform otherwise. 𝑆𝑆𝑛𝑛��� and
𝐼𝐼𝑛𝑛� represented mean corrected skipped counts and inclusion counts, respectively.
Figure 6. The schematic depiction of the effective lengths of isoforms
For four types of AS event (i.e., SE, RI, A3SS, and A5SS), the reads of inclusion isoform (I) was defined as the RNA-Seq reads that mapped to two splice junctions, and the body of alternative exon (ae1) (shown in purple color), and the reads of the skipped isoform (S) as those that aligned to the skipping junction (shown in orange color). For MXE, reads that mapped to either of two alternative exons (ae1: inclusion isoform or ae2: skipped isoform) and their associated junctions were counted as I and S. rMATS used read length (e.g., r = 50 bases) to estimate effective length of skipping isoforms and read length plus alternative exon length to calculate the effective lengths of inclusion isoforms (li and ls), for all AS types except MXE.
28
Statistical Analyses
All statistical analyses were conducted in R version 3.4.3 (2017-11-30).74 We
utilized coxph function in survival package to fit the S-Cox model, and grpsurv function in
grpreg package to build the GL-Cox model. We used tdrocc function (a wrapper to
survivalROC) in survcomp, a Bioconductor package, to construct time-dependent ROC
curve from censored survival data, and compute AUROC. Furthermore, we used survfit
function in survival package to create survival curve from survival estimate at each failure
time (i.e., Kaplan Meier), and ggsurvplot function in survminer to plot survival curves. All
other plots were graphed using ggplot2 package in R.
3.4 | The Cox PH Model
3.4.1 | Why the Use of a Cox PH Model
The Cox PH regression model is a class of survival models. Cox is a robust semi-
parametric model for investigating the relationship of predictor variables (i.e., covariates
and confounders), and survival time while dealing with censored time-to-event data. With
censored survival data the Cox model is preferred to a linear or logistic model, since the
two latter ignore censoring information.
Considering survival data of (y1, x1, δ1), . . ., (yn, xn, δn), for i ϵ (1 ,2, ..., n), where xi
represents a predictor, and yi specifies the observed time of failure (i.e., death or relapse)
if δi = 1, or right-censoring (when information about time to event is incomplete) if δi = 0;
let’s further consider t1 < t2 < ...< tk to be the increasing list of unique failure times, and
j(i) the index of failing at time ti. The Cox PH model closely approximates the hazard rate
(i.e. rate of event or failure) for an individual at a unique failure time ti..75 Hazard rate is
29
the strength of the effect of covariates on the risk of failure, given that the participant has
survived up to ti..
The Cox PH model formula consist of two parts, (i) the baseline hazard function
(represented as ℎ0(𝑡𝑡)) that involves failure time (t), and (ii) the exponential expression (e)
of the sum of 𝛽𝛽𝑖𝑖𝑥𝑥𝑖𝑖 that involves a vector of predictors X= (x1, x2, ..., xn) and their
corresponding parameters, without considering failure time (t). The exponential expression
(as oppose to linear) ensures a nonnegative estimate of hazard. Because both parts of Cox
formula are non-negative the estimated hazard rates are always non-negative. The Cox PH
formula at failure time t and with time-independent variables of X (i.e., not changing over
time) is represented as follow:
ℎ(𝑡𝑡|𝑋𝑋) = ℎ0(𝑡𝑡)𝑒𝑒∑ 𝛽𝛽𝑖𝑖𝑥𝑥𝑖𝑖𝑛𝑛𝑖𝑖=1
𝑥𝑥𝑖𝑖 = 𝑠𝑠𝑖𝑖𝑒𝑒𝑝𝑝𝑖𝑖𝑖𝑖𝑡𝑡𝑖𝑖𝑖𝑖 𝑖𝑖𝑖𝑖𝑖𝑖 𝑖𝑖𝑡𝑡ℎ 𝑖𝑖𝑖𝑖𝑝𝑝𝑖𝑖𝑖𝑖𝑖𝑖𝑝𝑝𝑖𝑖𝑖𝑖𝑙𝑙
ℎ0(𝑡𝑡) = 𝑏𝑏𝑖𝑖𝑖𝑖𝑒𝑒𝑙𝑙𝑖𝑖𝑖𝑖𝑒𝑒 ℎ𝑖𝑖𝑎𝑎𝑖𝑖𝑖𝑖𝑝𝑝 𝑖𝑖𝑖𝑖𝑖𝑖𝑖𝑖𝑡𝑡𝑖𝑖𝑖𝑖𝑖𝑖
0 ≪ ℎ(𝑡𝑡|𝐗𝐗) < ∞
3.4.2 | Partial Likelihood Estimation of the Cox PH Model
The covariate parameters ß= (ß1 , ß2 , ..., ßn) in the Cox PH formula can be estimated
by maximizing the nonparametric partial likelihood, while ignoring the baseline hazard
function ℎ0(𝑡𝑡). This is a so called partial likelihood, because it considers probabilities for
subjects who had the event, and not explicitly for those who were censored.76 The survival
information of censored subjects are only considered for subjects who were at risk prior to
failure time, and number of individuals at risk decreases as failure time increases.76 The
partial likelihood (L) is defined as a product of likelihood at each failure time and
represented as below:
30
𝐿𝐿 = 𝐿𝐿1 × 𝐿𝐿2 × 𝐿𝐿3 × … × 𝐿𝐿𝐷𝐷 = � 𝐿𝐿𝑗𝑗
𝐷𝐷
𝑗𝑗=1
Let’s consider 𝜑𝜑𝑖𝑖 = 𝑒𝑒∑ 𝛽𝛽𝑖𝑖𝑥𝑥𝑖𝑖𝑛𝑛𝑖𝑖=1 (section 3.4.1), then partial likelihood is represented
by the following equation:
𝐿𝐿(𝛽𝛽) = �ℎ0�𝑡𝑡𝑗𝑗�𝜑𝜑𝑖𝑖
∑ ℎ0 �𝑡𝑡𝑗𝑗�𝜑𝜑𝑘𝑘𝑘𝑘∈𝑅𝑅𝑗𝑗
𝐷𝐷
𝑗𝑗=1
where j denotes an index of failure at time t; D represents number of event, Ri denotes risk
set or all individual at risk of failure t. While nominator presents hazard rate for individual in
the risk set who experienced the failure, denominator calculates the sum of all risks in the risk sets.
Maximum likelihood estimates (i.e., the values of coefficients that maximize the
value of the likelihood), is calculated by taking the derivative of natural log of L (𝑙𝑙𝑖𝑖 𝑳𝑳)
with respect to each parameter in the model.
Considering i as number of parameters (𝑖𝑖 = 1, … , 𝑖𝑖), estimates of 𝛽𝛽𝑖𝑖′ solves a
derivative function presented as follow:76
𝜕𝜕 ln 𝐿𝐿𝜕𝜕𝛽𝛽𝑖𝑖
= 0
𝑠𝑠 → ∞ 𝑖𝑖𝑖𝑖 𝛽𝛽𝑖𝑖 ������⃗′ 𝛽𝛽
3.4.3 | Hazard Ratio
A hazard ratio (HR) is a ratio of hazard for one individual (or groups of subjects)
over the hazard for different individual, compared on a set of predictors. Proportional
hazards assumption premises that the relative difference between two survival curves
(constructed by the hazard functions) stays constant over time. Considering sets of
predictor variables (X and X*) for two subject groups, we can estimate the hazard rate for

31
each group as h(t | X) and h(t | X*) (section 3.4.1) and estimate a HR by calculating a ratio
of h(t | X*) over h(t | X). The HR formula can be further simplified and shown as below:
𝐻𝐻𝐻𝐻� = ℎ(𝑡𝑡|𝑋𝑋∗)ℎ(𝑡𝑡| 𝑋𝑋)
= 𝑒𝑒∑ 𝛽𝛽(𝑋𝑋𝑖𝑖∗−𝑋𝑋𝑖𝑖)𝑛𝑛
𝑖𝑖=1
3.4.4 | Development of a S-Cox Model
We used AML prognostic risk factors as predictor variable and overall survival
(scaled in months) as outcome variable. The overall survival was defined as time from
blood collection until death from any cause, and patients who survived were censored at
the last follow-up time.
AML risk factors include: (i) the cytogenetic abnormalities and driver mutations
included in the stratified risk status (i.e., favorable, intermediate, poor); (ii) the total
peripheral WBC count at diagnosis (WBC ≥ 16000/mm3 or WBC < 16000/mm3), with
higher counts associated with worse prognosis ; and (iii) age, as elderly patients with an
age greater than 60 years have greater chance of experiencing an adverse outcome.3
The training set was used to build the model. We utilized coxph function in survival
package77,78 to fit a S-Cox model to cytogenetic/molecular risk status (classified according
to the NCCN version 3.201720), and WBC, stratified on age. We used age as a stratifying
variable rather than a covariate, because using age as a covariate violated the proportional-
hazards assumption.
The goal was to estimate HR for the effect of covariates on disease outcome and
estimate parameters (ß) to predict disease outcome in the VSs.
32
We used predict function in the survival package to calculate the predicted score
(i.e., the linear predictor "LP ") from the model for each patient in the TS and the VSs.
Then, LP values were used to assess model prediction on two non-overlapping VSs.
(section 3.9)
3.5 | Development of a GL-Cox Model
The Cox PH model (section 3.4), performs well with many more observations than
variables (n >> p where n is the number of observations, and p is the number of predictor
variables) . However, it falls short when p > n, drives all coefficients to ±∞.
To address this problem several strategies have been proposed, including
regularization paths for the Cox PH model, i.e., Cox model with the ridge regression
penalty,79 or with a variable selection algorithm such as the lasso,80 the LARS,81,82 the
elastic net,83 84 or the grouped lasso72 penalty.
These penalties are applied to the Cox model during maximization step of partial
likelihood. For instance, with a penalty 𝑃𝑃(𝛽𝛽), at failure time t, maximizing log partial
likelihood considering that 𝑙𝑙(𝛽𝛽) = log 𝐿𝐿(𝛽𝛽) is equivalent to:
𝑖𝑖𝑖𝑖𝑠𝑠𝑖𝑖𝑖𝑖𝑥𝑥 𝑙𝑙 (𝛽𝛽), 𝑖𝑖𝑖𝑖𝑏𝑏𝑠𝑠𝑒𝑒𝑖𝑖𝑡𝑡 𝑡𝑡𝑖𝑖 𝑃𝑃(𝛽𝛽) ≤ 𝑡𝑡𝑖𝑖𝑖𝑖𝑖𝑖𝑖𝑖𝑠𝑠 𝑠𝑠𝑖𝑖𝑖𝑖𝑖𝑖𝑖𝑖𝑒𝑒𝑡𝑡𝑒𝑒𝑖𝑖
The ridge regression79 considers ∑ 𝛽𝛽𝑗𝑗2𝑝𝑝
𝑗𝑗 penalty (or 𝑙𝑙2 norm as ‖𝛽𝛽‖2 = �∑ 𝛽𝛽𝑗𝑗2𝑝𝑝
𝑗𝑗=1 )
and builds a model under the constraint that sum of the squared regression coefficients does
not exceed the ridge tuning parameter; while the lasso80 penalizes the Cox model by ∑ �𝛽𝛽𝑗𝑗�𝑝𝑝𝑖𝑖
(or 𝑙𝑙1 norm of ‖𝛽𝛽‖1 = ∑ |𝛽𝛽|𝑝𝑝𝑗𝑗 ) and fits a model under the regularization that the sum of
the absolute values of the coefficients does not exceed the lasso tuning parameter.

33
A tuning parameter (λ ≥ 0) of the models controls the relative impact of shrinkage
penalty. When λ = 0, the penalty has no effect, as λ∞ the impact of shrinkage penalty
grows and coefficient estimates will approach zero.85
Although both solutions regulate the coefficients and shrink them toward zero, the
lasso has advantage of variable selection, induces sparsity.71 However, the lasso selects
maximum n variables (n= number of observations) before it saturates.83
The elastic net regularization83 is another shrinkage model that addressed the
limitation of the lasso by linear combination of 𝑙𝑙1 and 𝑙𝑙2 norms in a form of
∑ 𝛼𝛼�𝛽𝛽𝑗𝑗� + (1 − 𝛼𝛼)𝛽𝛽𝑗𝑗 2𝑝𝑝
𝑗𝑗=1 , and shrinks regression coefficients to zero while induce sparsity
to the model. The parameter 𝛼𝛼 determines the combination of penalties and can get any
value between 0.05 and 1.
When dealing with variables with strong correlations (e.g., gene expression data),
the lasso fails to perform group selection, behaves indifferently to correlated variables and
selects only one variable from the group, and ignores others. The ridge also fails by
shrinking coefficients of correlated variables toward each other. The elastic net results in
more reliable model by encouraging sparsity while averaging highly correlated
predictors.83
Recently, several other shrinkage models (i.e., the adaptive lasso86, the grouped
lasso,72 and the fused lasso87) evolved from the lasso.
For large dataset (p>>n), when predictors belong to pre-defined groups, the
grouped lasso outperforms the lasso and elastic net. It encourages sparsity at group level
34
as well as individual level, and shrinks a locally or group approximated coordinate to zero,
depending on the penalty.72
Let’s consider p predictors belonging to L groups, with pl defined as the number of
predictors in lth group, Xl a matrix of predictors corresponding to the group l , and ßl as
coefficient vector. The grouped lasso penalty is defined as 72
𝜆𝜆 � �𝑠𝑠𝑙𝑙 ‖𝛽𝛽𝑙𝑙‖2
𝐿𝐿
𝑙𝑙=1
Where ‖𝛽𝛽𝑙𝑙‖2 is the Euclidean norm of a vector ßl and is shrunk to exact zero if
coefficients for all members of group are zero. Therefore, for some values of tuning
parameter λ the entire predictors belonging to a group are dropped.
3.6 | Determining Tuning Parameter by K-fold Cross Validation
Cross-validation (CV) is the simplest and most precise method for estimating
prediction error. K-fold CV starts by splitting data to K roughly equally-sized partitions,
followed by fitting a model on the training set that includes K-1 of the partitions, and
estimating prediction error of the fitted model when predicting the outcome of subjects in
the test set. In each iteration (i = 1, 2, 3, ..., K), kth part (k = 1, 2, 3, ..., K) is considered as
a test set (Figure 7.).
A 5 or 10-fold CV (depending on the number of observations) on a sequence of λ
values (i.e., a grid of λ values that ranges uniformly on log scale) is used to estimate partial
likelihood deviance of the Cox model penalized with a shrinkage model penalty including
the lasso, the elastic net, or the grouped lasso, among others.
35
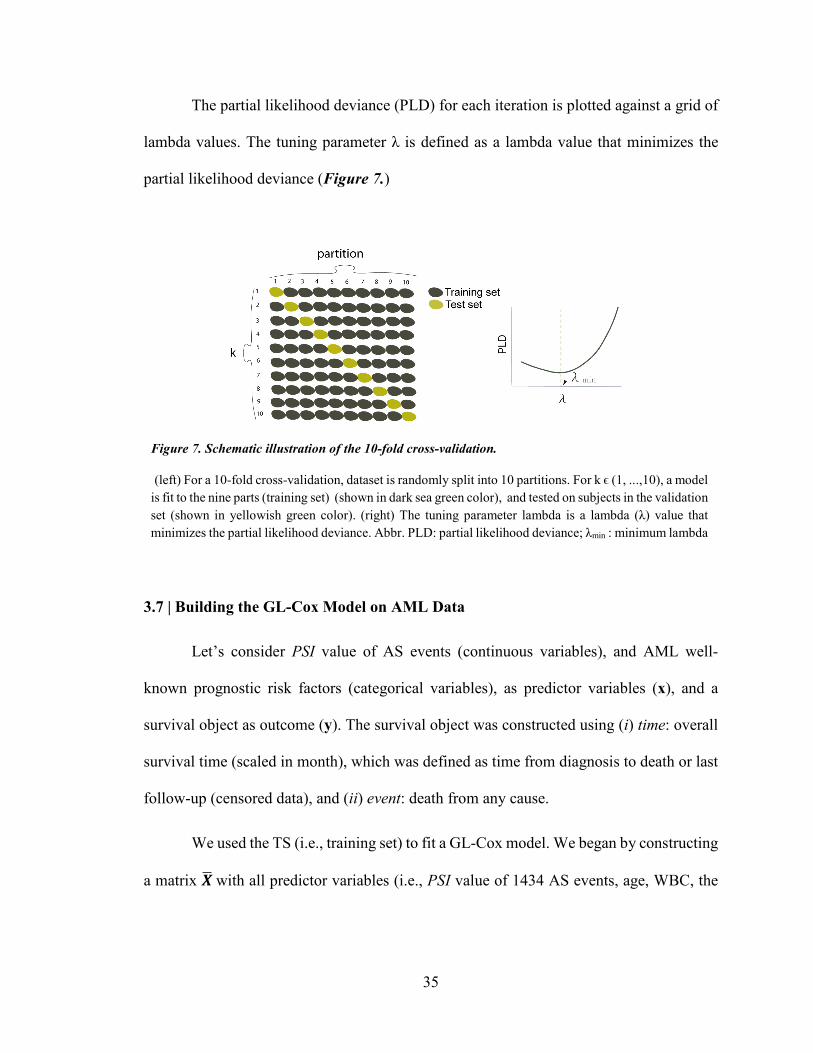
The partial likelihood deviance (PLD) for each iteration is plotted against a grid of
lambda values. The tuning parameter λ is defined as a lambda value that minimizes the
partial likelihood deviance (Figure 7.)
3.7 | Building the GL-Cox Model on AML Data
Let’s consider PSI value of AS events (continuous variables), and AML well-
known prognostic risk factors (categorical variables), as predictor variables (x), and a
survival object as outcome (y). The survival object was constructed using (i) time: overall
survival time (scaled in month), which was defined as time from diagnosis to death or last
follow-up (censored data), and (ii) event: death from any cause.
We used the TS (i.e., training set) to fit a GL-Cox model. We began by constructing
a matrix 𝑿𝑿� with all predictor variables (i.e., PSI value of 1434 AS events, age, WBC, the
Figure 7. Schematic illustration of the 10-fold cross-validation.
(left) For a 10-fold cross-validation, dataset is randomly split into 10 partitions. For k ϵ (1, ...,10), a model is fit to the nine parts (training set) (shown in dark sea green color), and tested on subjects in the validation set (shown in yellowish green color). (right) The tuning parameter lambda is a lambda (λ) value that minimizes the partial likelihood deviance. Abbr. PLD: partial likelihood deviance; λmin : minimum lambda

36
NCCN cyto-molecular risk status), and a Surv object 𝒀𝒀� with patients’ OS data and vital
status (deceased =1, alive=0).
We grouped PSI values on gene (i.e., gene symbol), and employed grpsurv function
with default setting (alpha =1; the tuning parameter of the group (gamma) = 3; number of
lambda =100; max iterations =10000) to fit a GL-Cox model to the matrix 𝑿𝑿�. 71,72,80,84 The
AML risk factors were penalized with the lasso.
Then, we performed 10-fold CV for the fitted model over a grid of 100 lambda
values, to identify the tuning parameter (λmin) that minimizes partial likelihood deviance.
The model was re-fit using the selected tuning parameter to identify predictor variables
with non-zero coefficient.
Moreover, we validated our model by calculating predictor score (LP) for patients
in two non-overlapping VSs (section 3.2) from the fitted model, followed by computing
time dependent AUROC (section 3.9.2).
3.8 | Kaplan-Meier Survival Analysis
In survival analysis, Kaplan-Meier (KM) is a non-parametric method to measure
the fraction of patients living for a certain amount of time past entry into the study.
Let’s denote by T a random variable for a subject survival time and t as any specific
value for T. Considering failure as 1 and censorship as 0, the survivor function (referred to
as 𝑆𝑆𝑡𝑡) at any given time interval t calculated as probability that the random variable T
exceeds the time t shown as 𝑆𝑆𝑡𝑡 = Pr (𝑇𝑇 > 𝑡𝑡) and for any failure time 𝑡𝑡𝑓𝑓 the general KM
formula that is a product limit function represented as below:76,88

37
�̂�𝑖�𝑡𝑡𝑓𝑓� = � 𝑃𝑃�𝑖𝑖𝑓𝑓
𝑖𝑖=1
[𝑇𝑇 > 𝑡𝑡𝑖𝑖 |𝑇𝑇 ≥ 𝑡𝑡𝑖𝑖]
This measures the probability of surviving past the previous failure time 𝑡𝑡𝑓𝑓−1
multiplied by probability of surviving after time 𝑡𝑡𝑓𝑓 given survival until 𝑡𝑡𝑓𝑓. There is a
relationship between survival function and hazard function (section 3.4.1). In fact, 𝑆𝑆𝑡𝑡
equals to the exponential of the negative integral of the hazard function.76
To construct the KM, the estimated survival probabilities are graphed in a plot with
survival probability for ordered failure time 𝑆𝑆𝑡𝑡 on Y axis and time (as a vector starting at 0
and incremating until study ends) on X axis. The plot consists of horizontal and vertical
lines and illustrates how survival decline with time, drawn as a step function that starts
with survival probability of 1 and drops to next survival probability as we move from one
ordered failure time to another.76
The popular log-rank test is used to assess statistical equivalency of KM curve for
two groups. The log-rank test is a Chi-square test that make use of observed versus
expected counts over all failure times for one of the two groups.
𝐿𝐿𝑖𝑖𝑠𝑠 − 𝑖𝑖𝑖𝑖𝑖𝑖𝑠𝑠 𝑖𝑖𝑡𝑡𝑖𝑖𝑡𝑡𝑖𝑖𝑖𝑖𝑡𝑡𝑖𝑖𝑖𝑖𝑖𝑖 =(𝑂𝑂1 − 𝐸𝐸1)
�𝑉𝑉𝑖𝑖𝑖𝑖(𝑂𝑂1 − 𝐸𝐸1)
3.8.1 | Linear Predictor Cut-off
Let’s denote linear predicted values from the fitted GL-Cox model as LP, and the
ordered natural log-transformed overall survival time (time scaled in month) corresponding
to each patient as ln(OS).

38
We used the TS to graph a scatter plot of "LP " values (on a X axis) against ln(OS)
(on a Y axis). Then, we fit locally weighted scatterplot smoothing (LOESS) regression
curve 89-91 to the plotted data, and set up an LP cut-off (LPc ) by calculating x coordinate
for regression line at 36 months survival (ln(36) =3.58). (Figure 9.)
The LPc was used to predict outcome from LP value for each patient in the TS and
VSs. Poor outcome was defined if LP was equal or greater than the LPc , and good outcome
if LP was less than the LPc.
We graphed Kaplan-Meier survival curves to compare how well two groups of
patients with predicted good and poor outcome were separated, and measured significance
of non-equivalency with a log-rank p-value.
3.9 | Prediction Assessment
3.9.1 | Receiver Operating Characteristic Curve
Receiver operating characteristic curve, abbreviated as ROC curve, is commonly
used for assessing prediction accuracy of a fitted model. ROC demonstrates a tradeoff
between sensitivity and specificity, where the sensitivity is the proportion of subjects with
an event (i.e., death) that are correctly predicted by the model, and the specificity is the
proportion of individuals without an event (i.e., alive) that are accurately identified by the
model.
For all cut-points values of "c", with linear predictors of LP (a higher value is more
predictive of event) and D as a binary disease status indicator, the ROC estimates the
sensitivity as the probability of LP greater than a cut-point given the patient died and the

39
specificity as the probability of LP equal or less than a cut-point given the patient
survived.92
𝑖𝑖𝑒𝑒𝑖𝑖𝑖𝑖𝑖𝑖𝑡𝑡𝑖𝑖𝑖𝑖𝑖𝑖𝑡𝑡𝑠𝑠 ∶ 𝑃𝑃𝑖𝑖(𝐿𝐿𝑃𝑃 > 𝑖𝑖 |𝐷𝐷 = 1)
𝑖𝑖𝑠𝑠𝑒𝑒𝑖𝑖𝑖𝑖𝑖𝑖𝑖𝑖𝑖𝑖𝑖𝑖𝑡𝑡𝑠𝑠: 𝑃𝑃𝑖𝑖(𝐿𝐿𝑃𝑃 ≤ 𝑖𝑖 |𝐷𝐷 = 0)
𝑖𝑖 𝜖𝜖 (−∞, +∞)]
𝐻𝐻𝑂𝑂𝑅𝑅 ∈ [0,1]
ROC demonstrates as a graph of sensitivity (also known as true positive rate
abbreviated as TPR) against 1-specificity (also known as false positive rate abbreviated as
FPR) for all possible cut-points. It starts at origin (0,0), goes vertically up across the y-axis
and then horizontally across to (1,1), with the perfect scenario of sensitivity and specificity
both equal to 1. A model with no prediction power would be equally likely to produce a
false positive or a true positive result.
The performance of a fitted model can be quantified by calculating the area under
the ROC curve (AUROC). AUROC can be computed as a sum of the areas of trapeziums.
While, a random guess will result to AUROC of 0.5, an ideal AUROC would be 1.
Commonly accepted criteria are shown in Table 8.

40
3.9.2 | Time-dependent ROC Curve for Censored Survival Data
The time-dependent ROC (ROC(T)) curve and corresponding AUROC evaluate
disease status change with time.92
Considering ti as failure time, xi as a covariate value, and Ci as the censoring time
for subject i. Zi =min (ti, Ci) denotes the follow-up time, and censoring indicator of δi =1
if ti ≤ Ci ; and δi =0 if ti ≥ Ci. The counting process at any time (t) considers Di(t) = 1 when
ti ≤ t (indicates that subject i has an event prior to time t), and Di(t) = 0 if ti > t. The
sensitivity and specificity of the ROC(T) are estimated as:
𝑖𝑖𝑒𝑒𝑖𝑖𝑖𝑖𝑖𝑖𝑡𝑡𝑖𝑖𝑖𝑖𝑠𝑠(𝑖𝑖, 𝑡𝑡) = 𝑃𝑃𝑖𝑖(𝐿𝐿𝑃𝑃 > 𝑖𝑖 |𝐷𝐷(𝑡𝑡) = 1)
𝑖𝑖𝑠𝑠𝑒𝑒𝑖𝑖𝑖𝑖𝑖𝑖𝑖𝑖𝑖𝑖𝑖𝑖𝑡𝑡𝑠𝑠(𝑖𝑖, 𝑡𝑡) = 𝑃𝑃𝑖𝑖(𝐿𝐿𝑃𝑃 ≤ 𝑖𝑖 |𝐷𝐷(𝑡𝑡) = 0)
A ROC(T) curve is defined for any time t as a plot of sensitivity against 1- specificity
with a set of cutoff points of c. The Nearest Neighbor Estimation (NNE)93 method for the
bivariate distribution function is used for estimating conditional probabilities.
Table 8. AUROC commonly accepted guideline
AUROC Model Performance 0.9-1 Excellent
0.8-0.9 Good 0.7-0.8 Fair 0.6-07 Poor
0.5 No prediction < 0.5 Negative prediction

41
3.9.2.1 | Setting Cut-points for the Risk Score
We employed survcomp package in Bioconductor to assign risk score (i.e., LP) cut-
points. Let’s consider F as an ordered vector of unique LP values. We calculated delta as
the minimum differences between all consecutive values of vector F, divided by 2:
𝑝𝑝𝑒𝑒𝑙𝑙𝑡𝑡𝑖𝑖 =min (𝑝𝑝𝑖𝑖𝑖𝑖𝑖𝑖(𝐹𝐹))
2
We subtracted delta from each unique LP value and added delta to the maximum LP value.
A vector of the resulting values was considered as cut-points.
𝑖𝑖𝑖𝑖𝑡𝑡 𝑠𝑠𝑖𝑖𝑖𝑖𝑖𝑖𝑡𝑡𝑖𝑖 = (𝐹𝐹 − 𝑝𝑝𝑒𝑒𝑙𝑙𝑡𝑡𝑖𝑖, max(𝐿𝐿𝑃𝑃) + 𝑝𝑝𝑒𝑒𝑙𝑙𝑡𝑡𝑖𝑖)
We utilized survcomp package, which is a wrapper for the survivalROC, to estimate
sensitivity and specificity for ROC at 5 time points (t = 1, 2, 3, 4, 5 years) via the Nearest
Neighbor Estimation (NNE) method.92 Then, we quantified AUROC for each curve
(AUROC(1-5 years)). While an AUC between 0.9-1 represents an excellent predictability,
AUC equal to 0.5 indicates a random classification model. (Table 8.)
3.10 | Limitations
We employed the popular statistical and machine learning techniques including
Cox PH model, regularization paths on Cox model, AUROC, and Kaplan-Meier to
investigate disease outcome prediction capacity of alternative spliced variants. While we
used the same dataset for comparison of two models (i.e., the S-Cox and the GL-Cox),
further evaluation of our introduced method on an independent group of patients to get an
unbiased result is essential.

42
We declare that we faced several limitations when we conducted this study
including: (i) small sample size; (ii) unclear cause of death; (iii) unknown time of
transplant; (iv) low depth of sequencing; and (v) RNA-Seq data that obtained from mixed
population of leukemic and normal hematopoiesis clones.
We also used time to death as clinical endpoint and did not consider relapse-free
survival time, mainly because there was no indication of change in treatment strategy that
resulted in prolonged survival of patients (i) without history of transplant, or (ii) with
history of a transplant but missing time of transplant.
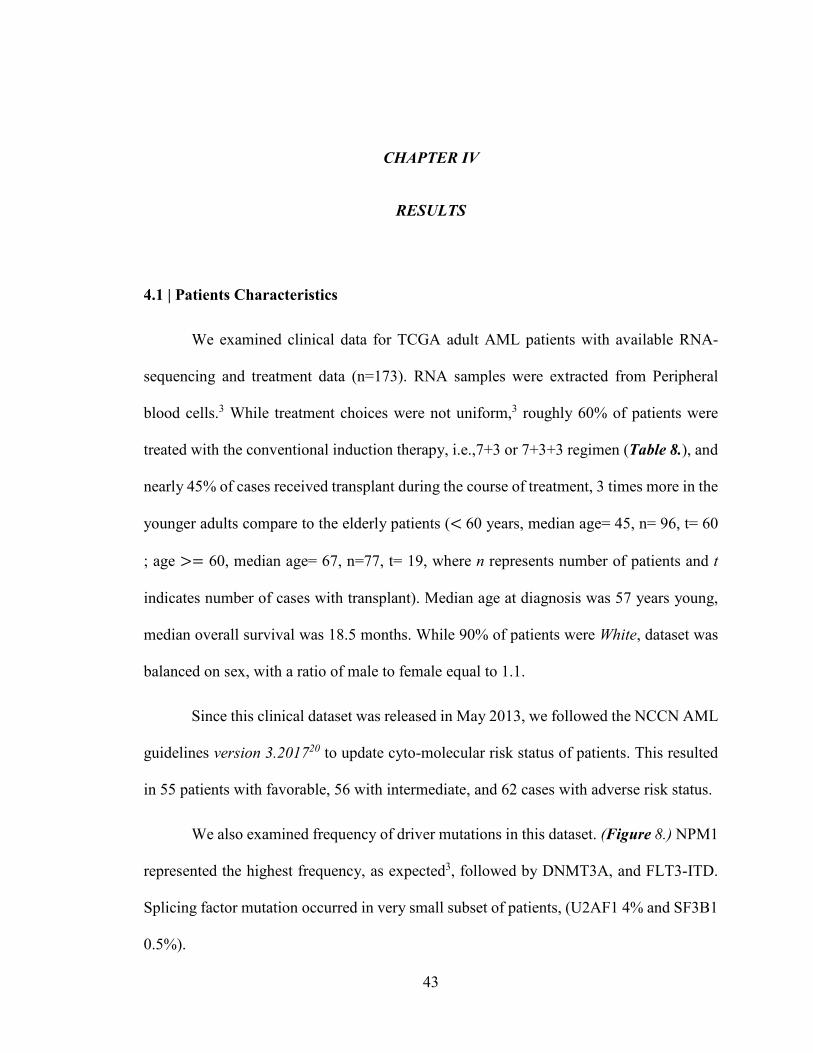
43
CHAPTER IV
RESULTS
4.1 | Patients Characteristics
We examined clinical data for TCGA adult AML patients with available RNA-
sequencing and treatment data (n=173). RNA samples were extracted from Peripheral
blood cells.3 While treatment choices were not uniform,3 roughly 60% of patients were
treated with the conventional induction therapy, i.e.,7+3 or 7+3+3 regimen (Table 8.), and
nearly 45% of cases received transplant during the course of treatment, 3 times more in the
younger adults compare to the elderly patients (< 60 years, median age= 45, n= 96, t= 60
; age >= 60, median age= 67, n=77, t= 19, where n represents number of patients and t
indicates number of cases with transplant). Median age at diagnosis was 57 years young,
median overall survival was 18.5 months. While 90% of patients were White, dataset was
balanced on sex, with a ratio of male to female equal to 1.1.
Since this clinical dataset was released in May 2013, we followed the NCCN AML
guidelines version 3.201720 to update cyto-molecular risk status of patients. This resulted
in 55 patients with favorable, 56 with intermediate, and 62 cases with adverse risk status.
We also examined frequency of driver mutations in this dataset. (Figure 8.) NPM1
represented the highest frequency, as expected3, followed by DNMT3A, and FLT3-ITD.
Splicing factor mutation occurred in very small subset of patients, (U2AF1 4% and SF3B1
0.5%).

44
4.1.1 | Training Set
Using stratified random sampling (section 3.4.4) we selected 54 patients as a
training set (TS). This set was balanced on age, transplant, WBC count, treatment choice,
and overall survival time. Median age of patients was 56.5, with median overall survival
of 18.5 months. (Table 9.)
Figure 8. Frequency of recurrent mutations in TCGA AML cohort (n=173)
Table 9. Training set characteristics
Status Transplant Age WBC Sex Induction Cyto-risk group
Death: 33 Yes: 28 > 60: 16 > 16,000/μl: 25 M: 30 7+3+3: 28 Favorable: 16
Censored: 21 No: 26 ≤ 60: 38 ≤ 16,000/μl: 29 F: 24 7+3: 26 Intermediate: 16
Poor: 22
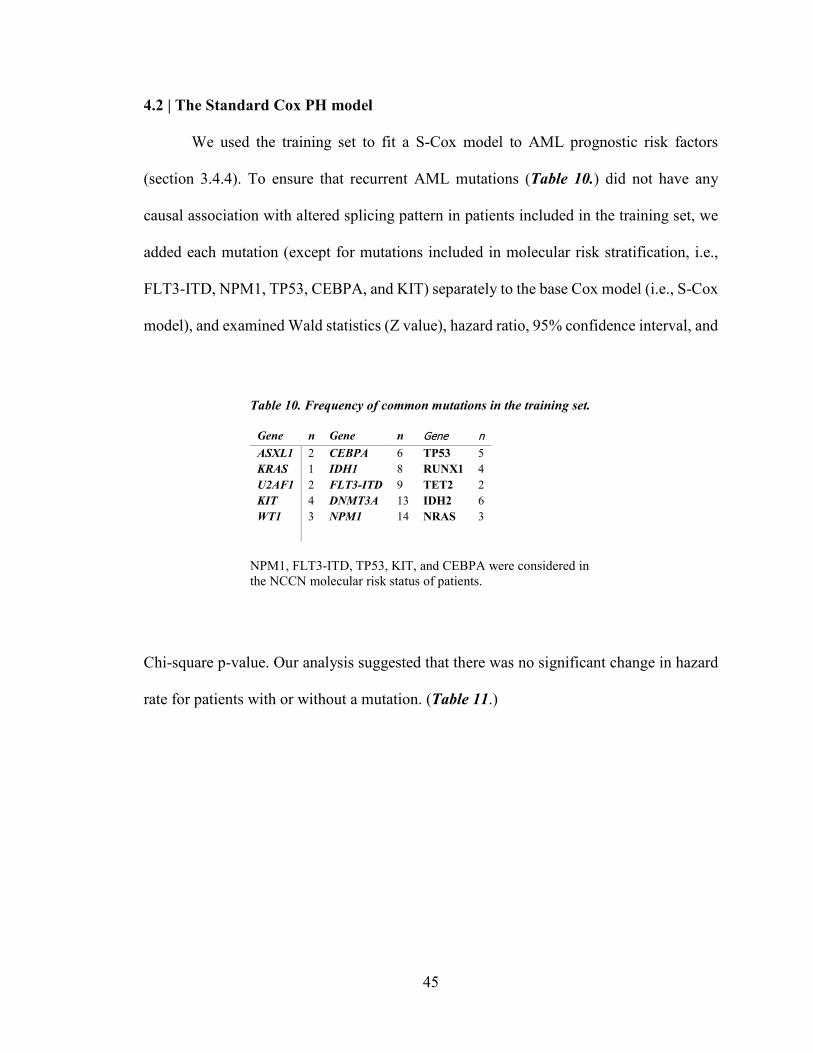
45
4.2 | The Standard Cox PH model
We used the training set to fit a S-Cox model to AML prognostic risk factors
(section 3.4.4). To ensure that recurrent AML mutations (Table 10.) did not have any
causal association with altered splicing pattern in patients included in the training set, we
added each mutation (except for mutations included in molecular risk stratification, i.e.,
FLT3-ITD, NPM1, TP53, CEBPA, and KIT) separately to the base Cox model (i.e., S-Cox
model), and examined Wald statistics (Z value), hazard ratio, 95% confidence interval, and
Chi-square p-value. Our analysis suggested that there was no significant change in hazard
rate for patients with or without a mutation. (Table 11.)
Table 10. Frequency of common mutations in the training set.
Gene n Gene n Gene n ASXL1 2 CEBPA 6 TP53 5 KRAS 1 IDH1 8 RUNX1 4 U2AF1 2 FLT3-ITD 9 TET2 2 KIT 4 DNMT3A 13 IDH2 6 WT1 3 NPM1 14 NRAS 3
NPM1, FLT3-ITD, TP53, KIT, and CEBPA were considered in the NCCN molecular risk status of patients.

46
To evaluate disease status over time, we calculated AUROCt at 1-5 years survival
based on predicted values from the fitted S-Cox model. (Figure 9.) Our results represented
a maximum AUROC value of 0.71 at 5 years for the TS, and 0.74 at 1, 3, 4, and 5 years
for the VS-1. Evaluating the S-Cox model on the VS-3 indicated that AML risk factors
reversely predicted disease outcome in this group of patients, with a minimum AUROC of
0.32 at 5 years. (Figure 9.)
Table 11. Multivariate survival statistics in the training set
Covariates ß SE z p-value HR CI
NCCN Poor 1.17 0.48 2.4 0.016 3.2 1.24 - 8.3 NCCN Intermediate 0.67 0.54 1.26 0.2 1.96 0.68 - 5.6 WBC > 16000 /μl - 0.06 0.36 -0.16 0.87 0.94 0.46-1.91 Sex (Male) - 0.017 0.37 -0.048 0.96 0.98 0.47 - 2.03 IDH1 0.189 0.51 0.37 0.7 1.2 0.44 – 3.28 IDH2 0.11 0.5 0.2 0.8 1.11 0.4 – 3.06 TET2 -0.2 1.08 -0.197 0.84 0.81 0.097 - 6.7 NRAS -0.2 0.75 -0.285 0.77 0.8 0.18 – 3.5 RUNX1 1.05 0.71 1.48 0.137 2.8 0.7 – 11.5 DNM3TA 0.67 0.4 1.67 0.095 1.96 0.89 - 4.3 WT1 -1.18 1.03 -1.15 0.25 0.31 0.04 - 2.3 U2AF1 -0.26 0.76 -0.347 0.729 0.77 0.17 – 3.4 ASXL1 0.56 0.85 0.655 0.51 1.75 0.33 – 9.3
The S-Cox model (stratified by age group) was fit to the known AML risk factors (rows highlighted in light grey color). Having poor cyto/molecular risk status increased hazard with significant p-value, as expected. To evaluate significance of common mutations in estimating hazard, mutated genes were separately added to the base S-Cox model. Risk of experiencing an event did not change between male and female patients in the TS. Abbr. Regression coefficient (ß); Standard error of Reg. Coef. (SE); Wald statistics (z); Chi-square p-value (p); Hazard Ratio (HR); 95% Confidence Interval of HR (CI).

47
Figure 9. AUC for ROC at 1-5 years
Four plots of ROC curves at 1-5 years survival for (top-left) the training set, (top-right) the validation set-1 , (bottom-left) the validation set-2, and (bottom-right) the validation set-3, illustrate prediction accuracy of the standard Cox model. A maximum AUROC of 0.71 at 5 years ROC (dotted line green colored curve), 0.74 for the validation set 1, 0.46 at 1 year for the validation set 2 at one-year ROC (purple colored curve), and 0.68 for the validation set-3 at one-year ROC were detected. A table of AUROC value associated to each ROC curve is presented for each plot. Abbr. TPP: true positive rate (sensitivity); FPR: False positive rate (1- specificity).
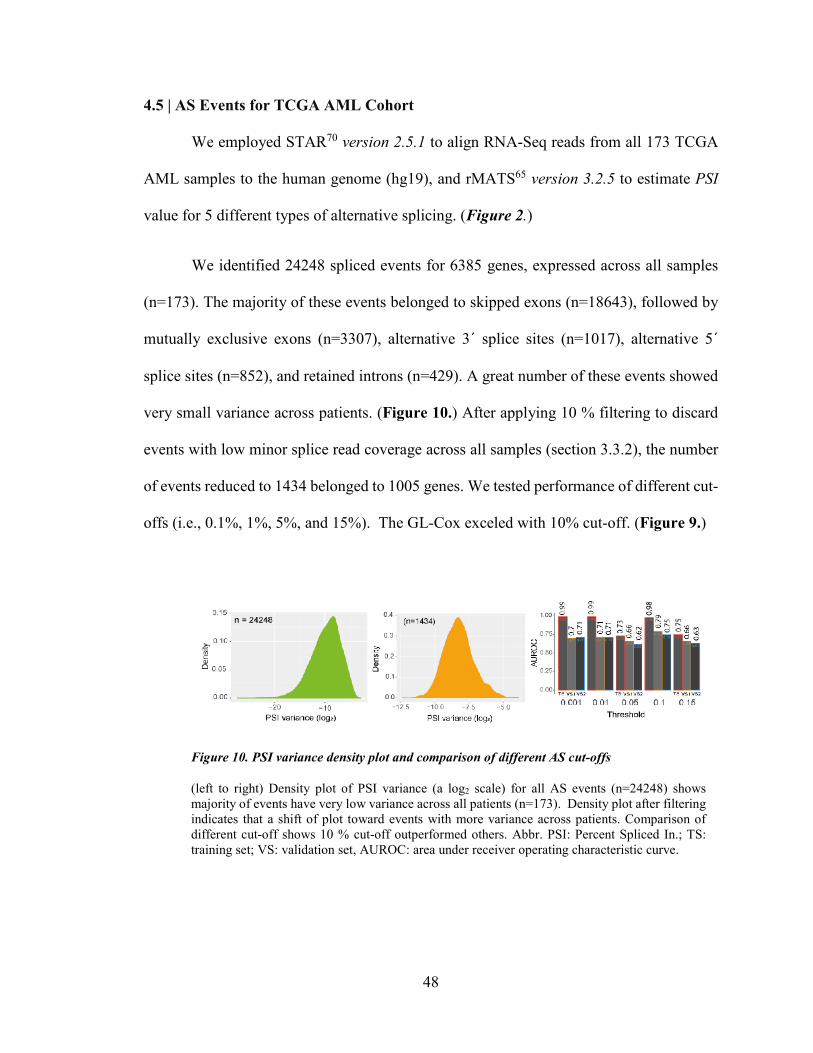
48
4.5 | AS Events for TCGA AML Cohort
We employed STAR70 version 2.5.1 to align RNA-Seq reads from all 173 TCGA
AML samples to the human genome (hg19), and rMATS65 version 3.2.5 to estimate PSI
value for 5 different types of alternative splicing. (Figure 2.)
We identified 24248 spliced events for 6385 genes, expressed across all samples
(n=173). The majority of these events belonged to skipped exons (n=18643), followed by
mutually exclusive exons (n=3307), alternative 3´ splice sites (n=1017), alternative 5´
splice sites (n=852), and retained introns (n=429). A great number of these events showed
very small variance across patients. (Figure 10.) After applying 10 % filtering to discard
events with low minor splice read coverage across all samples (section 3.3.2), the number
of events reduced to 1434 belonged to 1005 genes. We tested performance of different cut-
offs (i.e., 0.1%, 1%, 5%, and 15%). The GL-Cox exceled with 10% cut-off. (Figure 9.)
Figure 10. PSI variance density plot and comparison of different AS cut-offs
(left to right) Density plot of PSI variance (a log2 scale) for all AS events (n=24248) shows majority of events have very low variance across all patients (n=173). Density plot after filtering indicates that a shift of plot toward events with more variance across patients. Comparison of different cut-off shows 10 % cut-off outperformed others. Abbr. PSI: Percent Spliced In.; TS: training set; VS: validation set, AUROC: area under receiver operating characteristic curve.

49
4.6 | Penalized Cox Regression Analysis and Its Performance
To identify alternative spliced events in the training set that can predict disease
outcome upfront chemotherapy in the validation sets, we fit regularization paths on Cox
model penalized with the grouped lasso (GL).72 We grouped PSI values on their
corresponding gene and fit a model to PSI value of 1434 events and AML risk factors.
The GL-Cox model considered a penalty for AS events that became a larger value
as the number of events per gene increased. However, AML risk factors only penalized
with the lasso l1 norm. A 10-fold CV for the fitted model had led us to find a tuning
parameter (λ) that minimized partial likelihood deviance. (Figure 11.) Re-fitting the GL-
Cox model with λmin identified 19 AS events (referred to as signature events) with AUROC
at 1-5 years greater than 0.97 (Table 12.; Figure 11.) and shrunk coefficients of AML risk
factors, and other 1415 AS events exactly to zero. Validation of this model on two non-
overlapping VSs showed dominant performance of this approach over the standard Cox
model. Comparison of AUROC for two models is shown in Table 12.
Table 12. Comparison of AUROC for two fitted models
AUROC for the Cox model with the GL AUROC for the standard Cox model Year 1 2 3 4 5 1 2 3 4 5 TS 0.97 0.98 0.98 0.98 0.98 0.58 0.68 0.69 0.69 0.71 VS-1 0.74 0.73 0.79 0.79 0.79 0.74 0.66 0.74 0.74 0.74 VS-2 0.62 0.61 0.75 0.75 0.72 0.46 0.4 0.34 0.34 0.32 VS-3 0.56 0.57 0.63 0.64 0.62 0.68 0.67 0.66 0.65 0.63
AUROC at 1-5 year survival for the Cox model penalized with the grouped lasso (GL) (highlighted in dark sea green color) and the standard Cox model fit to well established AML risk factors (highlighted in light grey), represent outperformance of the GL Cox model. Abbr. TS: training set; VS-1 validation set-1; VS2: validation set-2; VS3: validation set-3

50
Further, we used the TS to calculate a predictor value cut-off (LPc) (section 3.8.1)
(Figure 11.) We employed LPc to classify AML patients into two groups of (i) good-
outcome if LP < LPc; and (ii) poor-outcome, if LP ≥ LPc.
The Kaplan-Meier survival curves for the length of time after diagnosis until death
from any cause were graphed for the good-outcome and poor-outcome groups, which
demonstrated a significant difference in survival times between two defined groups (VS-1
: log rank test p = 0.0086, hazard ratio= 2.47, likelihood ratio p =0.016; VS-2: log rank test
p = 0.013, hazard ratio= 1.78, likelihood ratio p =0.017) (Figure 12.).
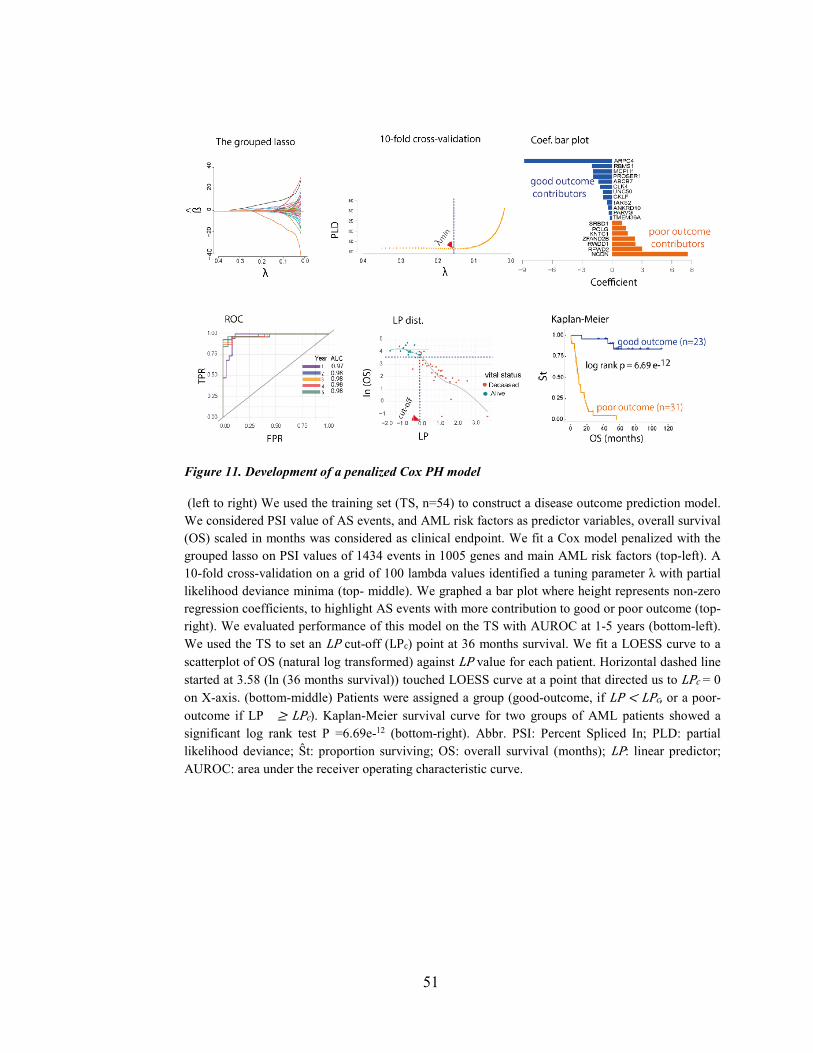
51
Figure 11. Development of a penalized Cox PH model
(left to right) We used the training set (TS, n=54) to construct a disease outcome prediction model. We considered PSI value of AS events, and AML risk factors as predictor variables, overall survival (OS) scaled in months was considered as clinical endpoint. We fit a Cox model penalized with the grouped lasso on PSI values of 1434 events in 1005 genes and main AML risk factors (top-left). A 10-fold cross-validation on a grid of 100 lambda values identified a tuning parameter λ with partial likelihood deviance minima (top- middle). We graphed a bar plot where height represents non-zero regression coefficients, to highlight AS events with more contribution to good or poor outcome (top-right). We evaluated performance of this model on the TS with AUROC at 1-5 years (bottom-left). We used the TS to set an LP cut-off (LPc) point at 36 months survival. We fit a LOESS curve to a scatterplot of OS (natural log transformed) against LP value for each patient. Horizontal dashed line started at 3.58 (ln (36 months survival)) touched LOESS curve at a point that directed us to LPc = 0 on X-axis. (bottom-middle) Patients were assigned a group (good-outcome, if LP < LPc, or a poor-outcome if LP ≥ LPc). Kaplan-Meier survival curve for two groups of AML patients showed a significant log rank test P =6.69e-12 (bottom-right). Abbr. PSI: Percent Spliced In; PLD: partial likelihood deviance; Ŝt: proportion surviving; OS: overall survival (months); LP: linear predictor; AUROC: area under the receiver operating characteristic curve.
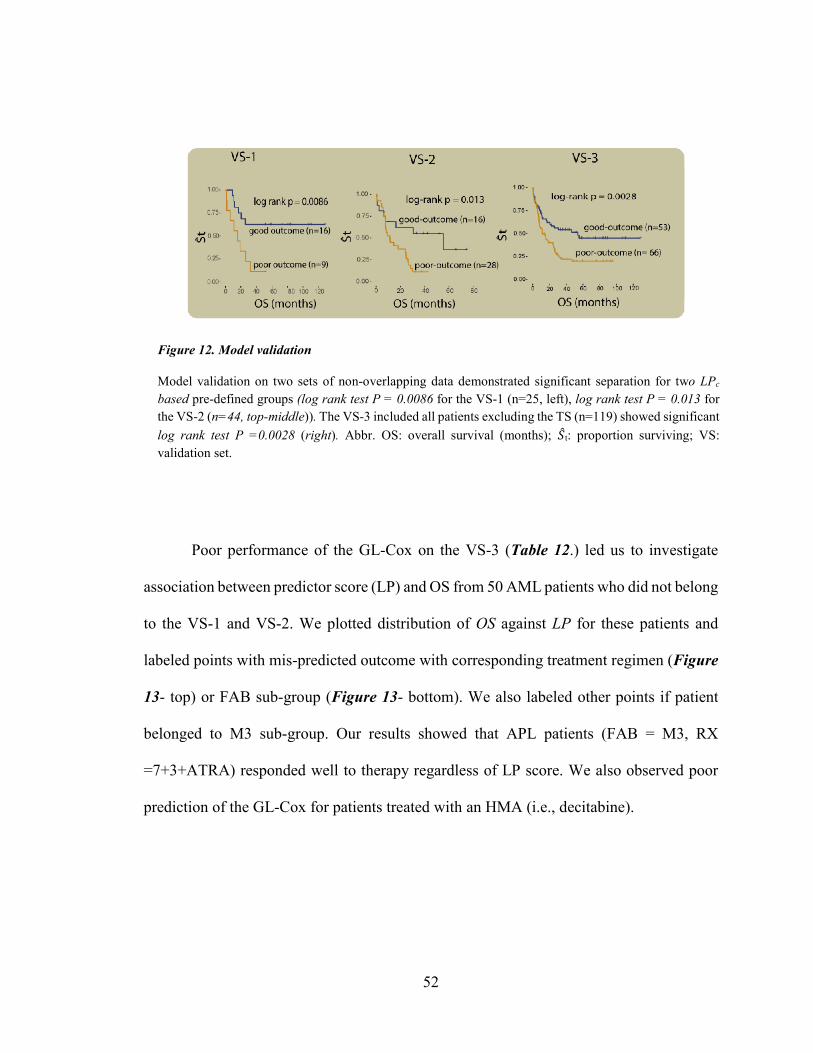
52
Poor performance of the GL-Cox on the VS-3 (Table 12.) led us to investigate
association between predictor score (LP) and OS from 50 AML patients who did not belong
to the VS-1 and VS-2. We plotted distribution of OS against LP for these patients and
labeled points with mis-predicted outcome with corresponding treatment regimen (Figure
13- top) or FAB sub-group (Figure 13- bottom). We also labeled other points if patient
belonged to M3 sub-group. Our results showed that APL patients (FAB = M3, RX
=7+3+ATRA) responded well to therapy regardless of LP score. We also observed poor
prediction of the GL-Cox for patients treated with an HMA (i.e., decitabine).
Figure 12. Model validation
Model validation on two sets of non-overlapping data demonstrated significant separation for two LPc
based pre-defined groups (log rank test P = 0.0086 for the VS-1 (n=25, left), log rank test P = 0.013 for the VS-2 (n=44, top-middle)). The VS-3 included all patients excluding the TS (n=119) showed significant log rank test P =0.0028 (right). Abbr. OS: overall survival (months); �̂�𝑆t: proportion surviving; VS: validation set.

53
Figure 13. Treatment with ATRA or decitabine altered disease outcome
We graphed a scatterplot of natural log transformed overall survival (ln(OS)) on Y-axis against the linear predictor score (LP) on X-axis, highlighted the LPc with a vertical dashed line, and ln (36 months survival) with a horizontal dashed line. Dots represented deceased patients, and triangle illustrated alive patients at the last follow-up time. Patients who had LP ≥ LPc and survived longer than 36 months, or had LP < LPc
and died or censored in less than 36 months were labeled with their corresponding initial therapy (top) or FAB sub-group (bottom, color guideline represented each 8 FAB sub-group). All M3 FAB sub-group were labeled on the plot (right, red colored dots and triangles). Abbr. M1-M7 FAB sub-groups; NC: not clear

54
4.7 | PSI Distribution in the Training Set and the Healthy Bone Marrow
We obtained RNA-Seq data for four healthy bone marrow (BM) from The National Center
for Biotechnology Information Gene Expression Omnibus (GEO) repository, with project
number of PRJNA232593 and GEO number of GSE53655. We analyzed these data using
our bioinformatics pipeline. (section 3.3) Our results indicated that these four healthy BM
expressed 16 out of 19 signatures events. (Figure 14. B.)
We graphed two PSI density plots for each AS event, (i) for 54 patients in the TS;
(ii) for four healthy BM. The AML PSI density plot covered an area containing both
skipping and inclusion isoforms. While we observed consistency in the healthy BM PSI
distribution for several AS events, sample size limitation introduced noise in others.
(Figure 14.)
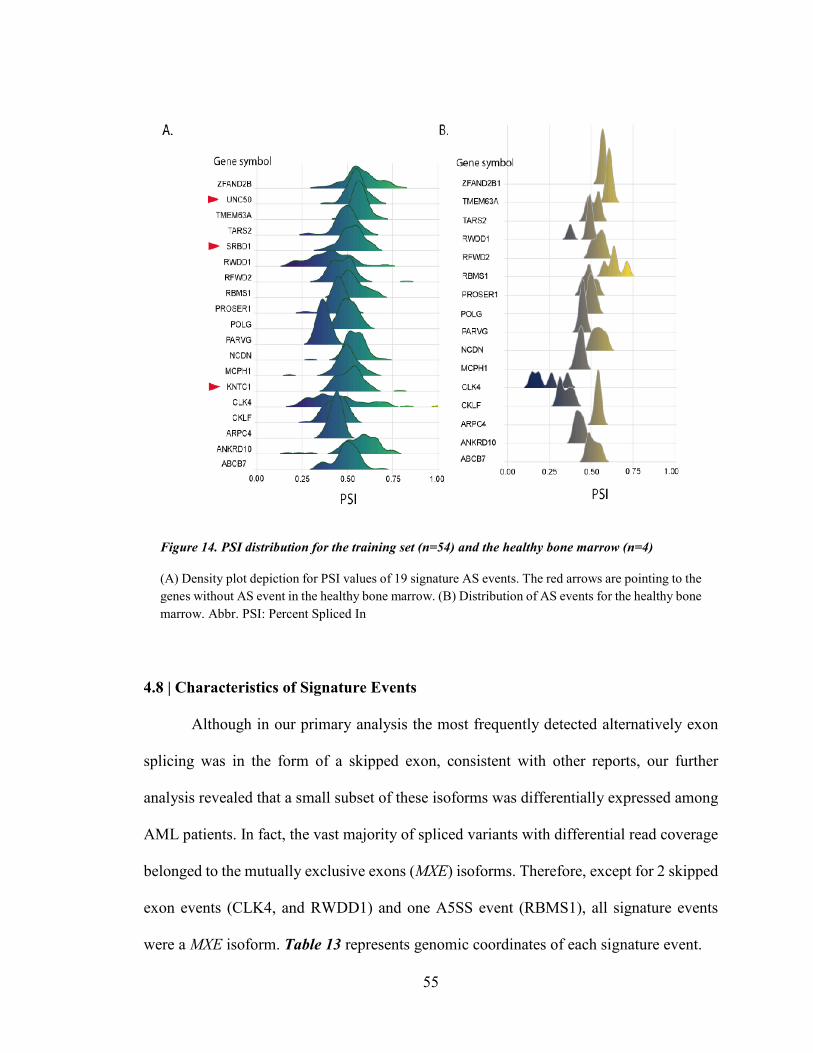
55
4.8 | Characteristics of Signature Events
Although in our primary analysis the most frequently detected alternatively exon
splicing was in the form of a skipped exon, consistent with other reports, our further
analysis revealed that a small subset of these isoforms was differentially expressed among
AML patients. In fact, the vast majority of spliced variants with differential read coverage
belonged to the mutually exclusive exons (MXE) isoforms. Therefore, except for 2 skipped
exon events (CLK4, and RWDD1) and one A5SS event (RBMS1), all signature events
were a MXE isoform. Table 13 represents genomic coordinates of each signature event.
Figure 14. PSI distribution for the training set (n=54) and the healthy bone marrow (n=4)
(A) Density plot depiction for PSI values of 19 signature AS events. The red arrows are pointing to the genes without AS event in the healthy bone marrow. (B) Distribution of AS events for the healthy bone marrow. Abbr. PSI: Percent Spliced In
56
Study of four healthy bone marrow RNA-Seq data showed that all except three
signature events have been expressed in the healthy BM. These events include KNTC1
(MXE; ae44:ae45) , SRBD1 (MXE; ae14:ae13), and UNC50 (MXE; ae3:ae4).
All 19 events belonged to protein coding genes and cover a wide range of cellular
functions. (Table 15.) One of the most important events occurred in CLK4 ae5. The
splicing regulatory CLK4 (CDC like kinase 4) is a member of the Clk class of enzymes
that targets both serine/threonine and tyrosine-containing substrates, and perform a
distinguished role in phosphorylating serine and arginine rich (SR) proteins of the
spliceosomal complex, such as SRSF1 and SRSF3. 94 95
Other genes with an alternative spliced event include (i) MCPH1 (Microcephalin
1), a tumor suppressor gene96 that contributes to DNA repair, post-transcriptional
modification and stability of P53 by blocking Mdm2 mediated ubiquitination of TP53; (ii)
RFWD2 (Ring Finger And WD Repeat Domain 2, also known as E3 ubiquitin-protein
ligase COP1) with an MXE event between e10, and e8, an E3 ubiquitin-protein ligase97 that
plays a direct role in destabilizing TP53 and JUN by ubiquitination and degradation of
these proteins, and an indirect role in AKT activation that results in cell survival.
Intriguingly, ubiquitinates CEBPA, a transcription factor involved in myeloid lineage
differentiation, upon binding to TRIB198 ; (iii) ABCB7 (ATP-binding cassette sub-family
B member 7, mitochondrial), involved in heme transportation from the mitochondria to
cytoplasm, and cellular iron homeostasis via maturation of cytoplasmic iron-sulfur (Fe/S)
cluster-containing proteins, iron accumulation in the mitochondria in Sideroblastic
anemia99,100; (iv) TMEM63A (Transmembrane Protein 63A), an osmolarity sensitive ion
channel,101 involved in innate immune response through regulating proliferation and

57
migration of peripheral blood mononuclear cells102 ; (v) POLG (DNA polymerase subunit
gamma-1), the catalytic subunit of mitochondrial DNA polymerase, a 3´-5´ exonuclease
involved in mitochondrial DNA replication and repair103; (vi) ZFAND2B (Zinc Finger
AN1-Type Containing 2B) encodes an zinc finger motif containing endoplasmic reticulum
(ER) protein that regulates translocation and ubiquitination mediated proteasomal
degradation of the nascent proteins, including IGF1 receptor (IGF1R), at the ER104; (vii)
KNTC1 (Kinetochore Associated 1) an essential component of the mitotic checkpoint105,
involved in proper chromosome segregation during cell division106,107; (viii) RBMS1
(RNA Binding Motif Single Stranded Interacting Protein 1), encodes a single-stranded
DNA and RNA binding protein, with several proposed roles including DNA replication108,
transcription, cell cycle progression, c-MYC mediated apoptosis through binding to
upstream region of c-MYC109,110, and miR-383 regulated steroidogenesis through c-
MYC111; (ix) CLKF (Chemokine Like Factor) plays an essential role in immune response
by chemotactic activity112,113; (x) TARS2 (Threonyl-tRNA Synthetase 2, Mitochondrial),
encodes an aminoacyl-tRNA synthase that catalyzes threonine loading reaction of tRNA
in the mitochondria114; (xi) NCDN (Neurochondrin), provides instruction for translation
of a guanine(G)-protein-coupled-receptor (GPCR)-adaptor protein Norbin, first recognized
in the nervous system for its role in neurite outgrowth115,116 and its hydroxyapatite
restorative function in the osteoclast-like bone marrow cells117, more recently for its
function in promoting translocation of proteins from cytosol to plasma membrane in
collaboration with P-Rex1118; (xii) UNC50 encodes Unc-50 inner nuclear membrane RNA
binding protein, an RNA binding protein localized in the nuclear inner membrane and
Golgi apparatus of different cell types, plays various roles including regulation of EGFR

58
in human hepatocellular carcinoma (HCC),119 neuron signal transduction at neuromuscular
junction,120 and transportation121; (xiii) PARVG, encodes Parvin gamma that mediates
leukocyte migration via binding to integrin-linked kinase (ILK)122; (xiv) ARPC4 (Actin-
related protein 2/3 complex subunit 4), acts as actin polymerization regulator123 and
contributes to cell migration in different cancers124,125; (xv) PROSER1 (Proline and serine-
rich protein 1), encode a proline-serine rich domain with possible protein-protein
interaction role; (xvi) ANKRD10 (Ankyrin Repeat Domain 10), involved in regulation of
canonical Wnt signal transduction pathway (http://amigo.geneontology.org) ; (xvii)
SRBD1 (S1 RNA Binding Domain 1), encodes an RNA binding protein with unclear
function ; and (xviii) RWDD1 (RWD domain-containing protein 1), involved in cell
aging126, cellular response to oxidative stress, and regulation of androgen receptor
activity127.
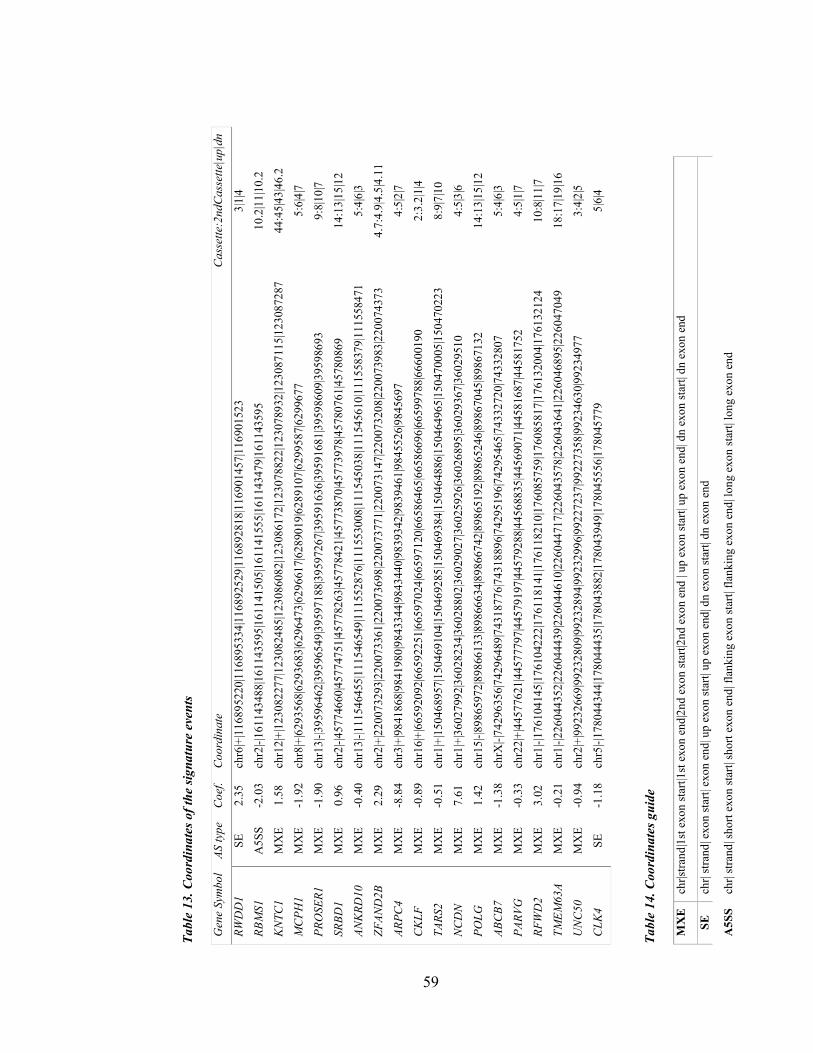
59
Tabl
e 13
. Coo
rdin
ates
of t
he si
gnat
ure
even
ts
Gen
e Sy
mbo
l AS
type
C
oef.
Coo
rdin
ate
Cas
sette
:2nd
Cass
ette
|up|
dn
RWD
D1
SE
2.35
ch
r6|+
|116
8952
20|1
1689
5334
|116
8925
29|1
1689
2818
|116
9014
57|1
1690
1523
3|
1|4
RBM
S1
A5S
S -2
.03
chr2
|-|16
1143
488|
1611
4359
5|16
1141
505|
1611
4155
5|16
1143
479|
1611
4359
5 10
.2|1
1|10
.2
KN
TC1
MX
E 1.
58
chr1
2|+|
1230
8227
7|12
3082
485|
1230
8608
2|12
3086
172|
1230
7882
2|12
3078
932|
1230
8711
5|12
3087
287
44:4
5|43
|46.
2
MC
PH1
MX
E -1
.92
chr8
|+|6
2935
68|6
2936
83|6
2964
73|6
2966
17|6
2890
19|6
2891
07|6
2995
87|6
2996
77
5:6|
4|7
PRO
SER1
M
XE
-1.9
0 ch
r13|
-|395
9646
2|39
5965
49|3
9597
188|
3959
7267
|395
9163
6|39
5916
81|3
9598
609|
3959
8693
9:
8|10
|7
SRBD
1 M
XE
0.96
ch
r2|-|
4577
4660
|457
7475
1|45
7782
63|4
5778
421|
4577
3870
|457
7397
8|45
7807
61|4
5780
869
14:1
3|15
|12
ANK
RD10
M
XE
-0.4
0 ch
r13|
-|111
5464
55|1
1154
6549
|111
5528
76|1
1155
3008
|111
5450
38|1
1154
5610
|111
5583
79|1
1155
8471
5:
4|6|
3
ZFAN
D2B
M
XE
2.29
ch
r2|+
|220
0732
93|2
2007
3361
|220
0736
98|2
2007
3771
|220
0731
47|2
2007
3208
|220
0739
83|2
2007
4373
4.
7:4.
9|4.
5|4.
11
ARPC
4 M
XE
-8.8
4 ch
r3|+
|984
1868
|984
1980
|984
3344
|984
3440
|983
9342
|983
9461
|984
5526
|984
5697
4:
5|2|
7
CK
LF
MX
E -0
.89
chr1
6|+|
6659
2092
|665
9225
1|66
5970
24|6
6597
120|
6658
6465
|665
8669
6|66
5997
88|6
6600
190
2:3.
2|1|
4
TARS
2 M
XE
-0.5
1 ch
r1|+
|150
4689
57|1
5046
9104
|150
4692
85|1
5046
9384
|150
4648
86|1
5046
4965
|150
4700
05|1
5047
0223
8:
9|7|
10
NC
DN
M
XE
7.61
ch
r1|+
|360
2799
2|36
0282
34|3
6028
802|
3602
9027
|360
2592
6|36
0268
95|3
6029
367|
3602
9510
4:
5|3|
6
POLG
M
XE
1.42
ch
r15|
-|898
6597
2|89
8661
33|8
9866
634|
8986
6742
|898
6519
2|89
8652
46|8
9867
045|
8986
7132
14
:13|
15|1
2
ABC
B7
MX
E -1
.38
chrX
|-|74
2963
56|7
4296
489|
7431
8776
|743
1889
6|74
2951
96|7
4295
465|
7433
2720
|743
3280
7 5:
4|6|
3
PARV
G
MX
E -0
.33
chr2
2|+|
4457
7621
|445
7779
7|44
5791
97|4
4579
288|
4456
8835
|445
6907
1|44
5816
87|4
4581
752
4:5|
1|7
RFW
D2
MX
E 3.
02
chr1
|-|17
6104
145|
1761
0422
2|17
6118
141|
1761
1821
0|17
6085
759|
1760
8581
7|17
6132
004|
1761
3212
4 10
:8|1
1|7
TMEM
63A
MX
E -0
.21
chr1
|-|22
6044
352|
2260
4443
9|22
6044
610|
2260
4471
7|22
6043
578|
2260
4364
1|22
6046
895|
2260
4704
9 18
:17|
19|1
6
UN
C50
M
XE
-0.9
4 ch
r2|+
|992
3266
9|99
2328
09|9
9232
894|
9923
2996
|992
2723
7|99
2273
58|9
9234
630|
9923
4977
3:
4|2|
5
CLK
4 SE
-1
.18
chr5
|-|17
8044
344|
1780
4443
5|17
8043
882|
1780
4394
9|17
8045
556|
1780
4577
9 5|
6|4
Tabl
e 14
. Coo
rdin
ates
gui
de
MX
E
chr|s
trand
|1st
exo
n st
art|1
st e
xon
end|
2nd
exon
star
t|2nd
exo
n en
d | u
p ex
on st
art|
up e
xon
end|
dn
exon
star
t| dn
exo
n en
d
SE
chr|
stra
nd| e
xon
star
t| ex
on e
nd| u
p ex
on st
art|
up e
xon
end|
dn
exon
star
t| dn
exo
n en
d
A5S
S ch
r| st
rand
| sho
rt ex
on st
art|
shor
t exo
n en
d| fl
anki
ng e
xon
star
t| fla
nkin
g ex
on e
nd| l
ong
exon
star
t| lo
ng e
xon
end

60
Tabl
e 15
. Pro
pose
d m
echa
nism
of a
ctio
n fo
r gen
es w
ith A
S ev
ent
Gen
e Sy
mbo
l Pr
otei
n fu
nctio
n C
LK4
Splic
ing
regu
lato
r by
phos
phor
ylat
ing
SRSF
1 an
d SR
SF3
RB
MS1
D
NA
repl
icat
ion,
gen
e tra
nscr
iptio
n, c
ell c
ycle
pro
gres
sion
and
apo
ptos
is.
KN
TC1
Chr
omos
ome
segr
egat
ion
durin
g ce
ll di
visi
on
PRO
SER
1 Pr
otei
n-pr
otei
n in
tera
ctio
n A
NK
RD
10
Play
s a ro
le in
regu
latio
n of
Wnt
sign
alin
g pa
thw
ay
ZFA
ND
2B
Reg
ulat
es tr
ansl
ocat
ion
and
ubiq
uitin
-med
iate
d pr
otea
som
al d
egra
datio
n of
nas
cent
pro
tein
s at t
he E
R
AR
PC4
Cel
l mig
ratio
n PO
LG
Mito
chon
dria
l DN
A re
plic
atio
n TA
RS2
A
mito
chon
dria
l am
inoa
cyl-t
RN
A sy
nthe
tase
, atta
chm
ent o
f thr
eoni
ne to
tRN
A(T
hr)
NC
DN
A
neg
ativ
e re
gula
tor o
f CaM
K2
phos
phor
ylat
ion;
pro
mot
es p
rote
in tr
ansl
ocat
ion
from
cyt
osol
to p
lasm
a m
embr
ane
AB
CB
7 Ir
on h
omeo
stas
is a
nd h
eme
trans
porta
tion
PAR
VG
M
edia
tes l
euko
cyte
mig
ratio
n vi
a IL
K
RFW
D2
E3 u
biqu
itin
ligas
e, d
irect
JUN
and
TP5
3 de
stab
ilize
r M
CPH
1 A
tum
or su
ppre
ssor
gen
e in
volv
ed in
DN
A re
pair
and
post
-tran
slat
iona
l mod
ifica
tion
of T
P53
RW
DD
1 R
egul
atio
n of
and
roge
n re
cept
or a
ctiv
ity a
nd c
ellu
lar r
espo
nse
to st
ress
C
KLF
A
che
moa
ttrac
tant
for n
eutro
phils
, mon
ocyt
es a
nd ly
mph
ocyt
es
TMEM
63A
A
n os
mos
ensi
tive
calc
ium
-per
mea
ble
catio
n ch
anne
l, in
volv
ed in
inna
te im
mun
e sy
stem
, neu
troph
il de
grad
atio
n U
NC
50
RN
A b
indi
ng p
rote
in
SRB
D1
RN
A b
indi
ng p
rote
in

61
4.9 | Cis-regulatory Modules
To investigate presence of cis-regulatory modules in 19 genes with AS event, we
obtained curated regulatory annotation data from The Open Regulatory Annotation
ORegAnno database (http://www.oreganno.org/) (version 3.0, 2016). This dataset
contained information about miRNA, and transcription factor binding sites, and other
regulatory elements.128,129 We focused on regulatory elements (i.e., miRNA, or trans-
regulatory factors) that had been expressed in the TCGA adult AML cohort. After filtering
out elements without expression, our dataset was limited to 122 miRNAs and 213 trans-
regulatory factors. Of the 19 genes with an AS event, USP50 did not contain binding
module for any expressed regulatory elements. We mapped regulatory module coordinates
to genes coordinates (i.e., genes with signature events), and found 18 regulatory elements
with at least one cis-regulatory module in at least one gene. (Table 16.)
Of the 19 cis-regulatory modules, 7 were located within close proximity of the
alternative exon(s). While the majority of these regulatory elements are transcription
activator or silencer, CCCTC-Binding Factor (CTCF) - a transcription repressor- serves as
a splicing regulator. In total,12 genes had CTCF binding sites. NCDN and RFWD2 had
CTCF binding site downstream alternative exon. Our analysis showed that 10 out of 19
genes contained at least one CEBPA binding module, ZFAND2B contained a CEBPA
binding module very close to the target exon. CEBPA (CCAAT/enhancer-binding protein
alpha) plays a role in myeloid cell differentiation, but there is no report indicating its
splicing regulatory capacity.
62
4.10 | Correlation of Age and % Blast Count with Linear Predictor
Since age is among AML prognostic risk factors, we included it in the GL-Cox and
S-Cox model. To demonstrate that there was no correlation between age and the signature
events, we performed a Spearman ’rank-order correlation between age (natural log
transformed) and linear predictor for all patients in this study (n=173). We found no
correlation between these pairs of variables (Spearman's rank correlation coefficient or
Spearman's rho = 0.11, p-value=0.13). (Figure 15., left)
The RNA-Seq that was used for this study was collected from peripheral blood cells
of AML patients. Considering that AML is a clonal disease and it originates from a single
errant leukemic committed stem cell or leukemic myeloblast, we would expect to have
normal hematopoietic cell among leukemic population in the PB. To address this issue, we
conducted Spearman ’rank-order correlation between PB % blast and linear predictor. This
resulted in Spearman's rank correlation coefficient of 0.086 with p-value=0.26, indicating
there was no correlation between these two variables. (Figure 15. right)
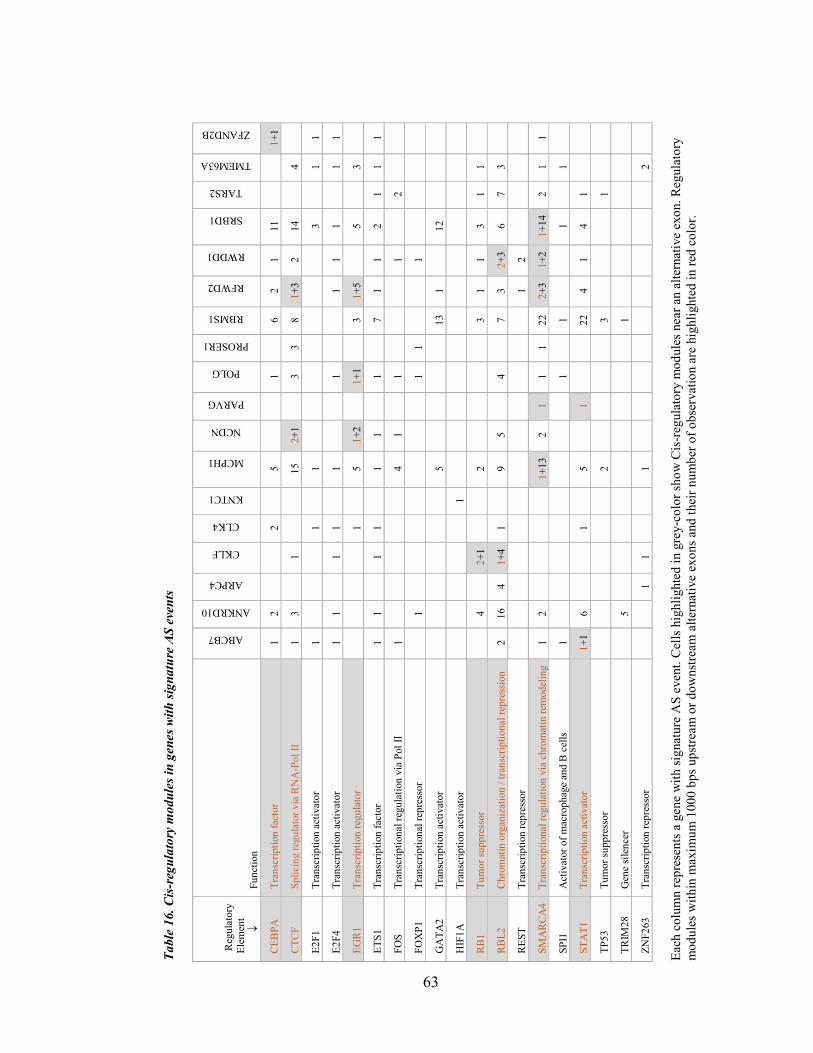
63
Tabl
e 16
. Cis
-reg
ulat
ory
mod
ules
in g
enes
with
sign
atur
e A
S ev
ents
Reg
ulat
ory
El
emen
t ↓
Func
tion
ABCB7
ANKRD10
ARPC4
CKLF
CLK4
KNTC1
MCPH1
NCDN
PARVG
POLG
PROSER1
RBMS1
RFWD2
RWDD1
SRBD1
TARS2
TMEM63A
ZFAND2B
CEB
PA
Tran
scrip
tion
fact
or
1 2
2
5
1
6
2 1
11
1+1
CTC
F Sp
licin
g re
gula
tor v
ia R
NA
-Pol
II
1 3
1
15
2+1
3
3 8
1+3
2 14
4
E2F1
Tr
ansc
riptio
n ac
tivat
or
1
1
1
3
1 1
E2F4
Tr
ansc
riptio
n ac
tivat
or
1 1
1
1
1
1
1 1
1
1 1
EGR
1 Tr
ansc
riptio
n re
gula
tor
1
5 1+
2
1+1
3
1+5
5
3
ETS1
Tr
ansc
riptio
n fa
ctor
1
1
1 1
1
1
1
7 1
1 2
1 1
1
FOS
Tran
scrip
tiona
l reg
ulat
ion
via
Pol I
I 1
4
1
1
1
2
FOX
P1
Tran
scrip
tiona
l rep
ress
or
1
1
1
1
GA
TA2
Tran
scrip
tion
activ
ator
5
13
1
12
HIF
1A
Tran
scrip
tion
activ
ator
1
RB1
Tu
mor
supp
ress
or
4
2+
1
2
3 1
1 3
1 1
RB
L2
Chr
omat
in o
rgan
izat
ion
/ tra
nscr
iptio
nal r
epre
ssio
n 2
16
4 1+
4 1
9
5
4
7 3
2+3
6 7
3
RES
T Tr
ansc
riptio
n re
pres
sor
1 2
SMA
RC
A4
Tran
scrip
tiona
l reg
ulat
ion
via
chro
mat
in re
mod
elin
g 1
2
1+
13
2 1
1 1
22
2+3
1+2
1+14
2
1 1
SPI1
A
ctiv
ator
of m
acro
phag
e an
d B
cel
ls 1
1
1
1
1
STA
T1
Tran
scrip
tion
activ
ator
1+
1 6
1
5
1
22
4
1 4
1
TP53
Tu
mor
supp
ress
or
2
3
1
TRIM
28
Gen
e si
lenc
er
5
1
ZNF2
63
Tran
scrip
tion
repr
esso
r
1
1
1
2
Each
col
umn
repr
esen
ts a
gen
e w
ith si
gnat
ure
AS
even
t. C
ells
hig
hlig
hted
in g
rey-
colo
r sho
w C
is-r
egul
ator
y m
odul
es n
ear a
n al
tern
ativ
e ex
on. R
egul
ator
y m
odul
es w
ithin
max
imum
100
0 bp
s ups
tream
or d
owns
tream
alte
rnat
ive
exon
s and
thei
r num
ber o
f obs
erva
tion
are
high
light
ed in
red
colo
r.

64
Figure 15. Correlation of age and the PB % blast with LP
Spearman ’rank-order correlation between age (natural log transformed), and linear predictors (LP) (left), and PB % blast and linear predictors (right) for 173 AML cases showed no correlation between pairs. Abbr. ln(Age): natural log of age, PB: peripheral blood; LP: linear predictor

65
CHAPTER V
DISCUSSION
Adult AML, with exception of APL, is a very lethal disease in elderly patients.
Despite our better understanding of AML, well-established prognostic factors fail to
predict disease outcome in a subset of patients without chromosomal abnormalities or
driver mutations. While the primary focus for prognostic marker discovery has been on
cytogenetic aberrations and mutations, other genetic alterations may contribute to AML
prognosis. Alternative pre-mRNA splicing plays a major role in hematopoiesis and several
studies indicated different AS patterns in normal cell compared to leukemic cell, with
clinical implication in a number of isoforms.54,55,59,61
This study was organized to infer the clinical relevance of alternative splicing in
adult AML, manifest overperformance of a penalized Cox prediction model (i.e., GL-Cox)
built on PSI value of AS events , and the existing well-established AML prognostic risk
factors, examine potential of signature AS events to serve as prognostic marker, and shed
new light on the potential causal-effect role of cis-regulatory modules and trans-splicing
factors on widely disrupted RNA splicing in adult AML.
We exploited available bioinformatics, machine learning, and statistics techniques,
to build a disease outcome prediction model based on AS data. To deal with the censored
survival data and a large number of predictor variables, we utilized an extension to Cox
regression that penalized predictors with the grouped lasso penalty.

66
Our designed disease outcome prediction model on a balanced sample of 54 AML
patients with similar initial therapy identified 19 signature mis-spliced transcripts, majority
in a form of mutually exclusive exons (MXE). Intriguingly, none of AML prognostic risk
factors contributed to survival outcome prediction.
Among the 19 signature events, ARPC4 (MXE ae4:ae5) exhibited the highest
contribution to a good-outcome prediction, and NCDN (MXE ae4:ae5) held the highest
coefficient among AS events with poor-outcome association. Interestingly, study of cis-
regulatory modules uncovered presence of two CTCF (CCCTC-binding factor) binding
sites downstream NCDN alternative-exons. A systematic CTCF binding site study
suggested its indirect role in promoting weak exon inclusion by pausing RNA polymerase
II.130 In addition to NCDN, RFWD2 also contained a CTCF module downstream the target
exons, indicating a potential role for CTCF in regulating AS in these two genes. There was
no report indicating any association between other 18 cis-regulatory modules and
alternative splicing. However, several of these binding sites belonged to elements that
regulate transcription. Our analysis showed that 10 out of 19 genes with signature event
contained at least one CCAAT/enhancer-binding protein alpha (CEBPA) binding module.
This module was located in close proximity to ZFAND2B alternative exon. CEBPA
belongs to a family of leucine zipper transcription factors and plays a role in myeloid cell
differentiation,131 but its impact on exon splicing is not clear.
A comprehensive literature review for gene with signature event led us to perform
a function-based gene classification. We assigned each gene with a spliced variant to one
of nine sub-groups: (i) splicing regulator: CLK494 (ii) immune response and inflammation:
CKLF112,113, TMEM63A101,102, and PARVG122; (iii) cell division, cell cycle progression,

67
and DNA replication: KNTC1106, and RBMS1108; (iv) ubiquitination mediated protein
degradation: RFWD297, ZFAND2B104, and MCPH196; (v) cell migration: ARPC4125; (vi)
mitochondrial DNA replication and translation: POLG103, and TARS2114; (vii) protein
translocation: NCDN118, and ABCB7100; (viii) RNA binding: UNC50 , and SRBD1; (ix)
others: PROSER1, ANKRD10, and RWDD1.
Impaired splicing of a key splicing regulator CLK4 with clinical implications
suggested a potential role for this isoform in global aberrant splicing in adult de novo AML.
Besides critical role of majority of genes with signature event, their variation or aberrant
expression have been reported in different cancers including hematologic malignancies.
For instance, (i) differentially expressed ABCB7 in Myelodysplastic Syndromes (MDS)
patients with mutated splicing factor SF3B1132; (ii) myeloid transformation via
deregulation of IGF-1 signaling pathway as a result of loss of ZFAND2B encoded
protein104,133 ; (iii) genomic variation of POLG in hepatocellular carcinoma,134 and breast
cancer in the African-American women135 ; and (iv) overexpression of ARPC4 in invasive
breast cancer,136 liver cancer,137 lung adenocarcinoma125,138, colorectal carcinoma, and
pancreatic cancer. 125,139,140 Moreover, downregulation of iron transporter gene ABCB7 has
been associated with sideroblastic anemia,99,100 a form of anemia that in some cases can
develop into hematological malignancy including AML.141
Model validation on two non-overlapping validation sets (i.e., VS-1, VS-2)
revealed better performance of AS-based GL-Cox over a standard model. A decrease in
AUROC from 0.98 in the TS (n=54) to 0.79 in the VS-1 (n=25) can be related to sample
size. In addition, using different underlying population (i.e., patients treated with various
types of therapy) resulted in relatively low AUROC in VS-2 compare to the TS.

68
Kaplan-Meier survival analysis on two VSs resulted in a significant log rank p-
value, and signified capacity of the signature events in separating two groups of patients
defined by the GL-Cox model.
We investigated the poor performance of the signature events in predicting disease
outcome in the VS-3. Looking into FAB subgroup and treatment choices of mis-classified
patients, we noticed that the majority of these patients either belonged to M3 sub-group
(APL) or treated with decitabine. APL is a well-characterized subtype of AML with PML-
RARA fusion and account for 10% of AML cases. APL usually responds well to a targeted
therapy with a combination of ATRA and the standard induction therapy. While PML-
RARA represses cell differentiation by suppressing CEBPA,142 ATRA binds to retinoic
acid receptor (RARA) and triggers differentiation activation which leads to promyelocyte
maturation. A study on NB4 cells showed that ATRA induced cyclin D1 degradation via a
member of E2 ubiquitin-conjugating enzyme family UBE2D3.143 Although RFWD2 (a
gene with a signature event associated to poor outcome) encodes an E3 ubiquitin ligase
that involves in CEBPA ubiquitination upon binding to TRIB, as well as P53
ubiquitination, its association to ATRA mediated proteolytic activity is not clear.
On the other hand, decitabine is a hypomethylating agent. It is very well known that
DNA methylation regulates alternative splicing at least by two mechanisms (i) modulating
elongation rate of Pol II by CTCF and methyl-CpG binding protein 2 (MeCP2); (ii) by
heterochromatin 1 (HP1) that recruits splicing factors onto alternative exons.144
Decitabine-mediated DNA hypomethylation most likely disrupted splicing patterns of
signature events. Consequently, the signature events failed to predict disease outcome.
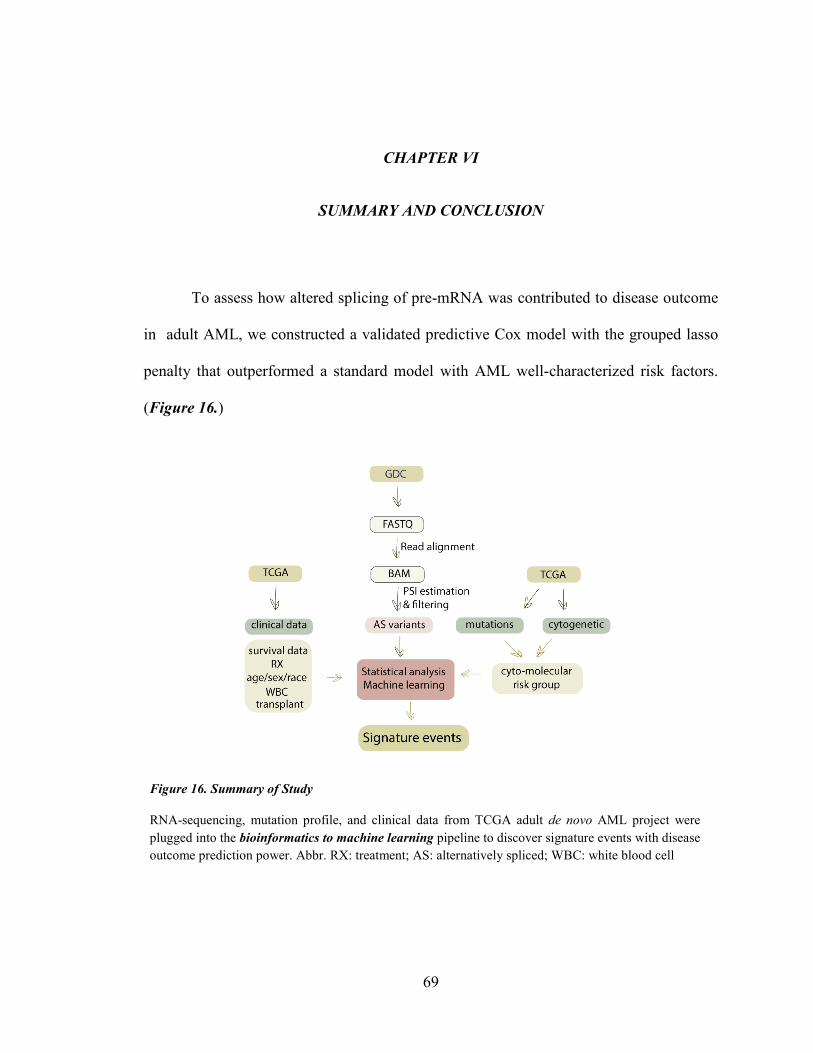
69
CHAPTER VI
SUMMARY AND CONCLUSION
To assess how altered splicing of pre-mRNA was contributed to disease outcome
in adult AML, we constructed a validated predictive Cox model with the grouped lasso
penalty that outperformed a standard model with AML well-characterized risk factors.
(Figure 16.)
Figure 16. Summary of Study
RNA-sequencing, mutation profile, and clinical data from TCGA adult de novo AML project were plugged into the bioinformatics to machine learning pipeline to discover signature events with disease outcome prediction power. Abbr. RX: treatment; AS: alternatively spliced; WBC: white blood cell

70
We identified signature events in genes with various central cellular functions
including splicing regulation, DNA synthesis, protein ubiquitination and degradation, iron
hemostasis, immune response, and mitochondrial DNA replication and translation.
Identifying two mitochondrial associated genes with signature event (PARVG that
involved in mitochondrial DNA replication, and TARS2 that encodes an enzyme
responsible for loading tRNA with a threonine) indicated a possible link between altered
mitochondrial metabolism and adult AML outcome. In addition, inactivation of TP53 by
RFWD2 ubiquitination suggested a potential role for RFWD2 signature event in TP53
degradation in adult AML patients with poor outcome, as oppose to MCPH1 (a tumor
suppressor gene with a signature event associated with good outcome) that stabilizes TP53
by inhibiting Mdm2 mediated ubiquitination of TP53. Finding signature event in genes
associated with immune response including CKLF, TMEM63A, and PARVG showed
possible splicing regulated disruption of immune system in adult AML.
Presence of CTCF module in genes with signature event, as well as detection of
mis-spliced CLK4 by the GL-Cox model suggested that mRNA mis-splicing in AML can
be regulated by both cis and trans regulatory mechanisms.
Although our results look encouraging, we need to acknowledge several
limitations. (i) we worked with RNA-seq data from samples with a mixed population of
leukemic and normal hematopoietic cells; (ii) our sample size was small; (iii) having very
limited information about time to relapse and time of transplant, we defined our model
outcome based on overall survival as clinical end-point and death as event; (v) we stratified
the training set on number of patient treated with transplant, but we did not have any
71
information about time of transplant, so our results can still be impacted by transplant. (v)
we observed no correlation between %blast and predictor score, but with limited sample
size we could not test our model on a pure leukemic clone. (vi) we did not use an
independent patient cohort to obtain an unbiased AUROC estimate. (vii) we did not assess
function of target exon(s) in genes with signature event.
In conclusion, despite all limitations, our introduced method based on available
bioinformatics, machine learning, and statistical techniques, demonstrated potential of
alternative splicing data in predicting risk of death in adult AML regardless of age, WBC
count, cytogenetic abnormalities and mutations. Identified signature events showed
capacity to serve as prognostic indicators. However, model validation on an independent
patient cohort for an unbiased conclusion is essential. Thus, until further investigation we
consider these events as predictor markers of adult AML outcome.
72
REFERENCES
1 Dohner, H., Weisdorf, D. J. & Bloomfield, C. D. Acute Myeloid Leukemia. N
Engl J Med 373, 1136-1152, doi:10.1056/NEJMra1406184 (2015).
2 Aster, J. C. & DeAngelo, D. J. in Pathophysiology of Blood Disorders, 2e (eds Jon C. Aster & H. Franklin Bunn) (McGraw-Hill Education, 2017).
3 Ley, T. J. et al. Genomic and Epigenomic Landscapes of Adult De Novo Acute Myeloid Leukemia. New England Journal of Medicine 368, 2059-2074, doi:10.1056/NEJMoa1301689 (2013).
4 Li, S. et al. Distinct evolution and dynamics of epigenetic and genetic heterogeneity in acute myeloid leukemia. Nature medicine 22, 792-799, doi:10.1038/nm.4125 (2016).
5 Sveen, A., Kilpinen, S., Ruusulehto, A., Lothe, R. A. & Skotheim, R. I. Aberrant RNA splicing in cancer; expression changes and driver mutations of splicing factor genes. Oncogene, doi:10.1038/onc.2015.318 (2015).
6 Papaemmanuil, E. et al. Genomic Classification and Prognosis in Acute Myeloid Leukemia. New England Journal of Medicine 374, 2209-2221, doi:10.1056/NEJMoa1516192 (2016).
7 Yoshimi, A. & Abdel-Wahab, O. Targeting mRNA Decapping in AML. Cancer Cell 33, 339-341, doi:https://doi.org/10.1016/j.ccell.2018.02.015 (2018).
8 Akalin, A. et al. Base-Pair Resolution DNA Methylation Sequencing Reveals Profoundly Divergent Epigenetic Landscapes in Acute Myeloid Leukemia. PLOS Genetics 8, e1002781, doi:10.1371/journal.pgen.1002781 (2012).
9 David, C. J. & Manley, J. L. Alternative pre-mRNA splicing regulation in cancer: pathways and programs unhinged. Genes & Development 24, 2343-2364, doi:10.1101/gad.1973010 (2010).

73
10 Urbanski, L. M., Leclair, N. & Anczukow, O. Alternative-splicing defects in cancer: Splicing regulators and their downstream targets, guiding the way to novel cancer therapeutics. Wiley Interdiscip Rev RNA, e1476, doi:10.1002/wrna.1476 (2018).
11 Zhang, J. & Manley, J. L. Misregulation of pre-mRNA alternative splicing in cancer. Cancer discovery 3, 10.1158/2159-8290.CD-1113-0253, doi:10.1158/2159-8290.CD-13-0253 (2013).
12 Biamonti, G., Catillo, M., Pignataro, D., Montecucco, A. & Ghigna, C. The alternative splicing side of cancer. Seminars in Cell & Developmental Biology 32, 30-36, doi:https://doi.org/10.1016/j.semcdb.2014.03.016 (2014).
13 Lee, S. C. et al. Modulation of splicing catalysis for therapeutic targeting of leukemia with mutations in genes encoding spliceosomal proteins. Nature medicine 22, 672-678, doi:10.1038/nm.4097 (2016).
14 Li, X. Y. et al. RNA-Seq profiling reveals aberrant RNA splicing in patient with adult acute myeloid leukemia during treatment. European review for medical and pharmacological sciences 18, 1426-1433 (2014).
15 Gao, P., Jin, Z., Cheng, Y. & Cao, X. RNA-Seq analysis identifies aberrant RNA splicing of TRIP12 in acute myeloid leukemia patients at remission. Tumour biology : the journal of the International Society for Oncodevelopmental Biology and Medicine 35, 9585-9590, doi:10.1007/s13277-014-2228-y (2014).
16 Liu, J. et al. Aberrant expression of splicing factors in newly diagnosed acute myeloid leukemia. Onkologie 35, 335-340, doi:10.1159/000338941 (2012).
17 Adamia, S. et al. A genome-wide aberrant RNA splicing in patients with acute myeloid leukemia identifies novel potential disease markers and therapeutic targets. Clin Cancer Res 20, 1135-1145, doi:10.1158/1078-0432.ccr-13-0956 (2014).
18 Randhawa JK, K. J., Ravandi-Kashani F. Adult Acute Myeloid Leukemia. In: Kantarjian HM, Wolff RA. eds. ,. The MD Anderson Manual of Medical Oncology. New York, NY: McGraw-Hill, (2018).
74
19 Arber, D. A. et al. The 2016 revision to the World Health Organization classification of myeloid neoplasms and acute leukemia. Blood 127, 2391-2405, doi:10.1182/blood-2016-03-643544 (2016).
20 O'Donnell, M. R. et al. Acute Myeloid Leukemia, Version 3.2017, NCCN Clinical Practice Guidelines in Oncology. Journal of the National Comprehensive Cancer Network 15, 926-957, doi:10.6004/jnccn.2017.0116 (2017).
21 Klepin, H. D. Elderly acute myeloid leukemia: assessing risk. Current hematologic malignancy reports 10, 118-125, doi:10.1007/s11899-015-0257-2 (2015).
22 Armstrong, S. A. et al. MLL translocations specify a distinct gene expression profile that distinguishes a unique leukemia. Nat Genet 30, 41-47, doi:10.1038/ng765 (2002).
23 West, R. R., Stafford, D. A., White, A. D., Bowen, D. T. & Padua, R. A. Cytogenetic abnormalities in the myelodysplastic syndromes and occupational or environmental exposure. Blood 95, 2093-2097 (2000).
24 Fortina P., L. E., Park J.Y., Kricka L. J., . Acute Myeloid Leukemia, Methods and Protocols. Springer Nature, doi:10.1007/978-1-4939-7142-8 (2017).
25 NCCN. NCCN Clinical Practice Guidelines in Oncology, Acute Myeloid Leukemia. Version I.2018,. NCCN (2018).
26 Bennett, J. M. et al. Proposals for the classification of the acute leukaemias. French-American-British (FAB) co-operative group. British journal of haematology 33, 451-458 (1976).
27 Vardiman, J. W. et al. The 2008 revision of the World Health Organization (WHO) classification of myeloid neoplasms and acute leukemia: rationale and important changes. Blood 114, 937-951, doi:10.1182/blood-2009-03-209262 (2009).
28 Döhner, H. et al. Diagnosis and management of acute myeloid leukemia in adults: recommendations from an international expert panel, on behalf of the European LeukemiaNet. Blood 115, 453-474, doi:10.1182/blood-2009-07-235358 (2010).

75
29 Döhner, H. et al. Diagnosis and management of AML in adults: 2017 ELN recommendations from an international expert panel. Blood 129, 424-447, doi:10.1182/blood-2016-08-733196 (2017).
30 Brooks, A. N. et al. A Pan-Cancer Analysis of Transcriptome Changes Associated with Somatic Mutations in U2AF1 Reveals Commonly Altered Splicing Events. PLoS One 9, e87361, doi:10.1371/journal.pone.0087361 (2014).
31 Lindsley, R. C. et al. Acute myeloid leukemia ontogeny is defined by distinct somatic mutations. Blood 125, 1367-1376, doi:10.1182/blood-2014-11-610543 (2015).
32 Avvisati, G. et al. AIDA 0493 protocol for newly diagnosed acute promyelocytic leukemia: very long-term results and role of maintenance. Blood 117, 4716-4725, doi:10.1182/blood-2010-08-302950 (2011).
33 de The, H. & Chen, Z. Acute promyelocytic leukaemia: novel insights into the mechanisms of cure. Nat Rev Cancer 10, 775-783, doi:10.1038/nrc2943 (2010).
34 Vitaliano-Prunier, A. et al. Clearance of PML/RARA-bound promoters suffice to initiate APL differentiation. Blood 124, 3772-3780, doi:10.1182/blood-2014-03-561852 (2014).
35 Cheson, B. D. et al. Revised recommendations of the International Working Group for Diagnosis, Standardization of Response Criteria, Treatment Outcomes, and Reporting Standards for Therapeutic Trials in Acute Myeloid Leukemia. Journal of clinical oncology : official journal of the American Society of Clinical Oncology 21, 4642-4649, doi:10.1200/jco.2003.04.036 (2003).
36 Shafer, D. & Grant, S. Update on rational targeted therapy in AML. Blood Reviews, doi:10.1016/j.blre.2016.02.001.
37 Schuurhuis, G. J. et al. Minimal/measurable residual disease in AML: consensus document from ELN MRD Working Party. Blood, doi:10.1182/blood-2017-09-801498 (2018).
38 Hourigan, C. S., Gale, R. P., Gormley, N. J., Ossenkoppele, G. J. & Walter, R. B. Measurable residual disease testing in acute myeloid leukaemia. Leukemia 31, 1482-1490, doi:10.1038/leu.2017.113 (2017).

76
39 Ravandi, F. et al. Phase 2 study of azacytidine plus sorafenib in patients with acute myeloid leukemia and FLT-3 internal tandem duplication mutation. Blood 121, 4655-4662, doi:10.1182/blood-2013-01-480228 (2013).
40 Muppidi, M. R. et al. Decitabine and sorafenib therapy in FLT3-ITD mutant acute myeloid leukemia- A case series. Clinical Lymphoma, Myeloma and Leukemia 15, S187, doi:10.1016/j.clml.2015.04.034 (2015).
41 Stein, E. M. et al. Enasidenib in mutant IDH2 relapsed or refractory acute myeloid leukemia. Blood, doi:10.1182/blood-2017-04-779405 (2017).
42 Taksin, A. L. et al. High efficacy and safety profile of fractionated doses of Mylotarg as induction therapy in patients with relapsed acute myeloblastic leukemia: a prospective study of the alfa group. Leukemia 21, 66, doi:10.1038/sj.leu.2404434 (2006).
43 Raetz E, K. T. Personalizing Therapy: The Beat AML Trial. The Hematologist. 14, 1-2 (2017).
44 Mazzarella, L., Riva, L., Luzi, L., Ronchini, C. & Pelicci, P. G. The genomic and epigenomic landscapes of AML. Seminars in hematology 51, 259-272, doi:10.1053/j.seminhematol.2014.08.007 (2014).
45 Maunakea, A. K., Chepelev, I., Cui, K. & Zhao, K. Intragenic DNA methylation modulates alternative splicing by recruiting MeCP2 to promote exon recognition. Cell Res 23, 1256-1269, doi:10.1038/cr.2013.110 (2013).
46 Miller, B. G. & Stamatoyannopoulos, J. A. Integrative Meta-Analysis of Differential Gene Expression in Acute Myeloid Leukemia. PLoS One 5, e9466, doi:10.1371/journal.pone.0009466 (2010).
47 Foroushani, A. et al. Large-scale gene network analysis reveals the significance of extracellular matrix pathway and homeobox genes in acute myeloid leukemia: an introduction to the Pigengene package and its applications. BMC medical genomics 10, 16, doi:10.1186/s12920-017-0253-6 (2017).
48 Lamba, J. K. et al. Identification of predictive markers of cytarabine response in AML by integrative analysis of gene-expression profiles with multiple phenotypes. Pharmacogenomics 12, 327-339, doi:10.2217/pgs.10.191 (2011).

77
49 McKeown, M. R. et al. Superenhancer Analysis Defines Novel Epigenomic Subtypes of Non-APL AML, Including an RARα Dependency Targetable by SY-1425, a Potent and Selective RARα Agonist. Cancer Discovery 7, 1136-1153, doi:10.1158/2159-8290.Cd-17-0399 (2017).
50 Wang, E. T. et al. Alternative Isoform Regulation in Human Tissue Transcriptomes. Nature 456, 470-476, doi:10.1038/nature07509 (2008).
51 Weaver R. F. Molecular Biology, Fifth Edition. MCGraw-Hill (2012).
52 Cooper, T. A., Wan, L. & Dreyfuss, G. RNA and Disease. Cell 136, 777-793, doi:10.1016/j.cell.2009.02.011.
53 Grech, G. et al. Expression of different functional isoforms in haematopoiesis. International journal of hematology 99, 4-11, doi:10.1007/s12185-013-1477-7 (2014).
54 Legras, S. et al. A Strong Expression of CD44-6v Correlates With Shorter Survival of Patients With Acute Myeloid Leukemia. Blood 91, 3401-3413 (1998).
55 Laszlo, G. S. et al. Expression and functional characterization of CD33 transcript variants in human acute myeloid leukemia. Oncotarget 7, 43281-43294, doi:10.18632/oncotarget.9674 (2016).
56 Hernandez-Caselles, T. et al. A study of CD33 (SIGLEC-3) antigen expression and function on activated human T and NK cells: two isoforms of CD33 are generated by alternative splicing. Journal of leukocyte biology 79, 46-58, doi:10.1189/jlb.0205096 (2006).
57 Perez-Oliva, A. B. et al. Epitope mapping, expression and post-translational modifications of two isoforms of CD33 (CD33M and CD33m) on lymphoid and myeloid human cells. Glycobiology 21, 757-770, doi:10.1093/glycob/cwq220 (2011).
58 Robinson, S. R. et al. DIS3 isoforms vary in their endoribonuclease activity and are differentially expressed within haematological cancers. Biochemical Journal, doi:10.1042/bcj20170962 (2018).
78
59 Lin, N. et al. Biologico-clinical significance of DNMT3A variants expression in acute myeloid leukemia. Biochem Biophys Res Commun 494, 270-277, doi:10.1016/j.bbrc.2017.10.041 (2017).
60 Calvello, C. et al. Alternative splicing of hTERT: a further mechanism for the control of active hTERT in acute myeloid leukemia. Leukemia & lymphoma 59, 702-709, doi:10.1080/10428194.2017.1346252 (2018).
61 Adamia, S. et al. NOTCH2 and FLT3 gene mis-splicings are common events in patients with acute myeloid leukemia (AML): new potential targets in AML. Blood 123, 2816-2825, doi:10.1182/blood-2013-02-481507 (2014).
62 Hahn, C. N., Venugopal, P., Scott, H. S. & Hiwase, D. K. Splice factor mutations and alternative splicing as drivers of hematopoietic malignancy. Immunological reviews 263, 257-278, doi:10.1111/imr.12241 (2015).
63 Wu, L. et al. Genetic landscape of recurrent ASXL1, U2AF1, SF3B1, SRSF2, and EZH2 mutations in 304 Chinese patients with myelodysplastic syndromes. Tumour biology : the journal of the International Society for Oncodevelopmental Biology and Medicine 37, 4633-4640, doi:10.1007/s13277-015-4305-2 (2016).
64 Yip, B. H. et al. The U2AF1S34F mutation induces lineage-specific splicing alterations in myelodysplastic syndromes. The Journal of clinical investigation 127, 2206-2221, doi:10.1172/jci91363 (2017).
65 Shen, S. et al. rMATS: robust and flexible detection of differential alternative splicing from replicate RNA-Seq data. Proc. Natl. Acad. Sci. U. S. A. 111, E5593-5601, doi:10.1073/pnas.1419161111 (2014).
66 Katz, Y., Wang, E. T., Airoldi, E. M. & Burge, C. B. Analysis and design of RNA sequencing experiments for identifying isoform regulation. Nature Methods 7, 1009, doi:10.1038/nmeth.1528 (2010).
67 Wu, J. et al. SpliceTrap: a method to quantify alternative splicing under single cellular conditions. Bioinformatics 27, 3010-3016, doi:10.1093/bioinformatics/btr508 (2011).
68 Alamancos, G. P., Pagès, A., Trincado, J. L., Bellora, N. & Eyras, E. Leveraging transcript quantification for fast computation of alternative splicing profiles. RNA 21, 1521-1531, doi:10.1261/rna.051557.115 (2015).

79
69 Park, E., Pan, Z., Zhang, Z., Lin, L. & Xing, Y. The Expanding Landscape of Alternative Splicing Variation in Human Populations. The American Journal of Human Genetics 102, 11-26, doi:https://doi.org/10.1016/j.ajhg.2017.11.002 (2018).
70 Dobin, A. et al. STAR: ultrafast universal RNA-seq aligner. Bioinformatics, doi:10.1093/bioinformatics/bts635 (2012).
71 Tibshirani, R. Regression shrinkage and selection via the lasso. J. Royal. Statist. Soc B. 58, 267–288 (1996).
72 Ming, Y. & Yi, L. Model selection and estimation in regression with grouped variables. Journal of the Royal Statistical Society: Series B (Statistical Methodology) 68, 49-67, doi:doi:10.1111/j.1467-9868.2005.00532.x (2006).
73 Baruzzo, G. et al. Simulation-based comprehensive benchmarking of RNA-seq aligners. Nature Methods 14, 135, doi:10.1038/nmeth.4106 (2016).
74 R Core Team. R: A Language and Environment for Statistical Computing. (2017).
75 Cox DR. Regression Models and Life Tables. Journal of the Royal Statistical Society B, 34, 187-220 (1972).
76 Kleinbaum D.G., K. M. Survival Analysis A Self-Learning Text, Third Edition,. Springer New York, (2012).
77 Andersen, P. K., Gill, R. D.,. Cox's Regression Model for Counting Processes: A Large Sample Study. The Annals of Statistics 10, 1100-1120, doi:10.2307/2240714 (1982).
78 Therneau, T., Grambsch, P.,. Modeling Survival Data: Extending the Cox Model. . Springer-Verlag (2000).
79 Hoerl, A. E., Kennard R.W.,. Ridge regression: Biased estimation for nonorthogonal problems. Technometrics 12, 55-67 (1970).

80
80 Tibshirani R. The Lasso Method for Variable Selection in the Cox Model. Statistics in Medicine, 16, 385-395 (1997).
81 Efron B., H. T., Johnstone I., Tibshirani R.,. Least angle regression. Ann. Statist. 32, 407-499 (2004).
82 Gui, J. & Li, H. Penalized Cox regression analysis in the high-dimensional and low-sample size settings, with applications to microarray gene expression data. Bioinformatics 21, 3001-3008, doi:10.1093/bioinformatics/bti422 (2005).
83 Zou H., H. T. Regularization and variable selection via the elastic net. Journal of the Royal Statistical Society. Series B: Statistical Methodology, 67, 301-320 (2005).
84 Simon N, F. J., Hastie T, Tibshirani R,. Regularization Paths for Cox's Proportional Hazards Model via Coordinate Descent. Journal of Statistical Software, 39, 1-13 (2011).
85 James G., W. D., Hastie T.,Tibshirani R.,. An Introduction to Statistical Learning. Springer (2013).
86 Zou H. The Adaptive Lasso and Its Oracle Properties. Journal of American Statistical Association, 101, 1418-1429 (2006).
87 Tibshirani R., S. M. Sparsity and smoothness via the fused lasso. J. royal. Statist. Soc B., 67, 91-108 (2005).
88 Goel, M. K., Khanna, P. & Kishore, J. Understanding survival analysis: Kaplan-Meier estimate. International Journal of Ayurveda Research 1, 274-278, doi:10.4103/0974-7788.76794 (2010).
89 Cleveland, W. S. LOWESS: A Program for Smoothing Scatterplots by Robust Locally Weighted Regression. The American Statistician 35, 54-54, doi:10.2307/2683591 (1981).
90 Cleveland, W. S. Robust Locally Weighted Regression and Smoothing Scatterplots. Journal of the American Statistical Association 74, 829-836, doi:10.1080/01621459.1979.10481038 (1979).

81
91 Cleveland, W. S. & Devlin, S. J. Locally Weighted Regression: An Approach to Regression Analysis by Local Fitting. Journal of the American Statistical Association 83, 596-610, doi:10.1080/01621459.1988.10478639 (1988).
92 Heagerty, P. J., Lumley, T.,Pepe, M. S.,. Time‐Dependent ROC Curves for Censored Survival Data and a Diagnostic Marker. Biometrics 56, 337-344, doi:doi:10.1111/j.0006-341X.2000.00337.x (2000).
93 Akritas M. . Nearest neighbor estimation of a bivariate distribution under random censoring. Annals of Statistics in Medicine, 22, 1299-1327 (1994).
94 Colwill, K. et al. The Clk/Sty protein kinase phosphorylates SR splicing factors and regulates their intranuclear distribution. The EMBO Journal 15, 265-275 (1996).
95 Hanes, J., von der Kammer, H., Klaudiny, J. & Scheit, K. H. Characterization by cDNA cloning of two new human protein kinases. Evidence by sequence comparison of a new family of mammalian protein kinases. Journal of molecular biology 244, 665-672, doi:10.1006/jmbi.1994.1763 (1994).
96 Venkatesh, T. et al. Primary microcephaly gene MCPH1 shows signatures of tumor suppressors and is regulated by miR-27a in oral squamous cell carcinoma. PLoS One 8, e54643, doi:10.1371/journal.pone.0054643 (2013).
97 Yi, C., Wang, H., Wei, N. & Deng, X. W. An initial biochemical and cell biological characterization of the mammalian homologue of a central plant developmental switch, COP1. BMC cell biology 3, 30 (2002).
98 Dedhia, P. H. et al. Differential ability of Tribbles family members to promote degradation of C/EBPα and induce acute myelogenous leukemia. Blood 116, 1321-1328, doi:10.1182/blood-2009-07-229450 (2010).
99 Boultwood, J. et al. The role of the iron transporter ABCB7 in refractory anemia with ring sideroblasts. PLoS One 3, e1970, doi:10.1371/journal.pone.0001970 (2008).
100 Nikpour, M. et al. The transporter ABCB7 is a mediator of the phenotype of acquired refractory anemia with ring sideroblasts. Leukemia 27, 889-896, doi:10.1038/leu.2012.298 (2013).

82
101 Zhao, X., Yan, X., Liu, Y., Zhang, P. & Ni, X. Co-expression of mouse TMEM63A, TMEM63B and TMEM63C confers hyperosmolarity activated ion currents in HEK293 cells. Cell biochemistry and function 34, 238-241, doi:10.1002/cbf.3185 (2016).
102 Yuan, C. et al. Transmembrane protein 63A is a partner protein of Haemonchus contortus galectin in the regulation of goat peripheral blood mononuclear cells. Parasites & vectors 8, 211, doi:10.1186/s13071-015-0816-3 (2015).
103 Copeland, W. C. & Longley, M. J. DNA polymerase gamma in mitochondrial DNA replication and repair. TheScientificWorldJournal 3, 34-44, doi:10.1100/tsw.2003.09 (2003).
104 Osorio, F. G. et al. Loss of the proteostasis factor AIRAPL causes myeloid transformation by deregulating IGF-1 signaling. Nature medicine 22, 91, doi:10.1038/nm.4013 (2015).
105 Chan, G. K., Jablonski, S. A., Starr, D. A., Goldberg, M. L. & Yen, T. J. Human Zw10 and ROD are mitotic checkpoint proteins that bind to kinetochores. Nature cell biology 2, 944-947, doi:10.1038/35046598 (2000).
106 Kops, G. J. et al. ZW10 links mitotic checkpoint signaling to the structural kinetochore. The Journal of cell biology 169, 49-60, doi:10.1083/jcb.200411118 (2005).
107 Scaerou, F. et al. The ZW10 and Rough Deal checkpoint proteins function together in a large, evolutionarily conserved complex targeted to the kinetochore. Journal of cell science 114, 3103-3114 (2001).
108 Niki, T., Galli, I., Ariga, H. & Iguchi-Ariga, S. M. MSSP, a protein binding to an origin of replication in the c-myc gene, interacts with a catalytic subunit of DNA polymerase alpha and stimulates its polymerase activity. FEBS letters 475, 209-212 (2000).
109 Takeshi, N. et al. MSSP promotes ras/myc cooperative cell transforming activity by binding to c‐Myc. Genes to Cells 5, 127-141, doi:doi:10.1046/j.1365-2443.2000.00311.x (2000).

83
110 Negishi, Y. et al. Identification and cDNA cloning of single-stranded DNA binding proteins that interact with the region upstream of the human c-myc gene. Oncogene 9, 1133-1143 (1994).
111 Yin M., L. M., Yao G.,Tian H.,Lian J.,Liu L., Liang M.,Wang Y.,Sun F.,. Transactivation of microRNA-383 by Steroidogenic Factor-1 Promotes Estradiol Release from Mouse Ovarian Granulosa Cells by Targeting RBMS1. Molecular Endocrinology 26 (2012).
112 Han, W. et al. Molecular cloning and characterization of chemokine-like factor 1 (CKLF1), a novel human cytokine with unique structure and potential chemotactic activity. The Biochemical journal 357, 127-135 (2001).
113 Wang, Y. et al. Chemokine-like factor 1 is a functional ligand for CC chemokine receptor 4 (CCR4). Life sciences 78, 614-621, doi:10.1016/j.lfs.2005.05.070 (2006).
114 Freist, W. & Gauss, D. H. Threonyl-tRNA synthetase. Biological chemistry Hoppe-Seyler 376, 213-224 (1995).
115 Shinozaki, K., Maruyama, K., Kume, H., Kuzume, H. & Obata, K. A novel brain gene, norbin, induced by treatment of tetraethylammonium in rat hippocampal slice and accompanied with neurite-outgrowth in neuro 2a cells. Biochem Biophys Res Commun 240, 766-771, doi:10.1006/bbrc.1997.7660 (1997).
116 Shinozaki, K., Kume, H., Kuzume, H., Obata, K. & Maruyama, K. Norbin, a neurite-outgrowth-related protein, is a cytosolic protein localized in the somatodendritic region of neurons and distributed prominently in dendritic outgrowth in Purkinje cells. Brain research. Molecular brain research 71, 364-368 (1999).
117 Ishiduka, Y. et al. Induction of hydroxyapatite resorptive activity in bone marrow cell populations resistant to bafilomycin A1 by a factor with restricted expression to bone and brain, neurochondrin. Biochimica et biophysica acta 1450, 92-98 (1999).
118 Pan, D. et al. Norbin Stimulates the Catalytic Activity and Plasma Membrane Localization of the Guanine-Nucleotide Exchange Factor P-Rex1. The Journal of biological chemistry 291, 6359-6375, doi:10.1074/jbc.M115.686592 (2016).
84
119 Fang, Z., Zhou, L., Jiang, S., Cao, L. & Yu, L. UNC50 prompts G1/S transition and proliferation in HCC by regulation of epidermal growth factor receptor trafficking. PLoS One 10, e0119338, doi:10.1371/journal.pone.0119338 (2015).
120 Eimer, S. et al. Regulation of nicotinic receptor trafficking by the transmembrane Golgi protein UNC-50. Embo j 26, 4313-4323, doi:10.1038/sj.emboj.7601858 (2007).
121 Selyunin, A. S., Iles, L. R., Bartholomeusz, G. & Mukhopadhyay, S. Genome-wide siRNA screen identifies UNC50 as a regulator of Shiga toxin 2 trafficking. The Journal of cell biology 216, 3249-3262, doi:10.1083/jcb.201704015 (2017).
122 Yoshimi, R. et al. The gamma-parvin-integrin-linked kinase complex is critically involved in leukocyte-substrate interaction. Journal of immunology (Baltimore, Md. : 1950) 176, 3611-3624 (2006).
123 Yamaguchi, H. & Condeelis, J. Regulation of the actin cytoskeleton in cancer cell migration and invasion. Biochimica et biophysica acta 1773, 642-652, doi:10.1016/j.bbamcr.2006.07.001 (2007).
124 Le Clainche, C. & Carlier, M. F. Regulation of actin assembly associated with protrusion and adhesion in cell migration. Physiological reviews 88, 489-513, doi:10.1152/physrev.00021.2007 (2008).
125 Molinie, N. & Gautreau, A. The Arp2/3 Regulatory System and Its Deregulation in Cancer. Physiological reviews 98, 215-238, doi:10.1152/physrev.00006.2017 (2018).
126 Kang, N. et al. Rwdd1, a thymus aging related molecule, is a new member of the intrinsically unstructured protein family. Cellular & molecular immunology 5, 333-339, doi:10.1038/cmi.2008.41 (2008).
127 Grotsch, H. et al. RWDD1 interacts with the ligand binding domain of the androgen receptor and acts as a coactivator of androgen-dependent transactivation. Molecular and cellular endocrinology 358, 53-62, doi:10.1016/j.mce.2012.02.020 (2012).
128 Griffith, O. L. et al. ORegAnno: an open-access community-driven resource for regulatory annotation. Nucleic acids research 36, D107-113, doi:10.1093/nar/gkm967 (2008).

85
129 Lesurf, R. et al. ORegAnno 3.0: a community-driven resource for curated regulatory annotation. Nucleic Acids Res 44, D126-132, doi:10.1093/nar/gkv1203 (2016).
130 Shukla, S. et al. CTCF-promoted RNA polymerase II pausing links DNA methylation to splicing. Nature 479, 74-79, doi:10.1038/nature10442 (2011).
131 Zhang, D.-E. et al. Absence of granulocyte colony-stimulating factor signaling and neutrophil development in CCAAT enhancer binding protein α-deficient mice. Proceedings of the National Academy of Sciences 94, 569-574, doi:10.1073/pnas.94.2.569 (1997).
132 Dolatshad, H. et al. Disruption of SF3B1 results in deregulated expression and splicing of key genes and pathways in myelodysplastic syndrome hematopoietic stem and progenitor cells. Leukemia 29, 1092-1103, doi:10.1038/leu.2014.331 (2015).
133 Santiago-Fernández, O., Osorio, F. G. & López-Otín, C. Proteostasis alterations in myeloproliferative neoplasms: Oncogenic relevance and therapeutic opportunities. Experimental Hematology 44, 574-577, doi:https://doi.org/10.1016/j.exphem.2016.04.004 (2016).
134 Long, X. et al. Polymorphisms in POLG were associated with the prognosis and mtDNA content in hepatocellular carcinoma patients. Bulletin du Cancer 104, 500-507, doi:https://doi.org/10.1016/j.bulcan.2017.02.005 (2017).
135 Azrak, S. et al. CAG Repeat Variants in the POLG1 Gene Encoding mtDNA Polymerase-Gamma and Risk of Breast Cancer in African-American Women. PLoS One 7, e29548, doi:10.1371/journal.pone.0029548 (2012).
136 Iwaya, K., Norio, K. & Mukai, K. Coexpression of Arp2 and WAVE2 predicts poor outcome in invasive breast carcinoma. Modern Pathology 20, 339, doi:10.1038/modpathol.3800741 (2007).
137 Keiichi, I. et al. Correlation between liver metastasis of the colocalization of actin‐related protein 2 and 3 complex and WAVE2 in colorectal carcinoma. Cancer Science 98, 992-999, doi:doi:10.1111/j.1349-7006.2007.00488.x (2007).
138 Semba, S. et al. Coexpression of Actin-Related Protein 2 and Wiskott-Aldrich Syndrome Family Verproline-Homologous Protein 2 in Adenocarcinoma of the

86
Lung. Clinical Cancer Research 12, 2449-2454, doi:10.1158/1078-0432.Ccr-05-2566 (2006).
139 Su, X., Wang, S., Huo, Y. & Yang, C. Short interfering RNA-mediated silencing of actin-related protein 2/3 complex subunit 4 inhibits the migration of SW620 human colorectal cancer cells. Oncology Letters 15, 2847-2854, doi:10.3892/ol.2017.7642 (2018).
140 Rauhala, H. E., Teppo, S., Niemela, S. & Kallioniemi, A. Silencing of the ARP2/3 complex disturbs pancreatic cancer cell migration. Anticancer research 33, 45-52 (2013).
141 Hast, R. & Reizenstein, P. Sideroblastic anemia and development of leukemia. Blut 42, 203-207, doi:10.1007/bf00996749 (1981).
142 Keeshan, K. et al. Co-operative leukemogenesis in acute myeloid leukemia and acute promyelocytic leukemia reveals C/EBPα as a common target of TRIB1 and PML/RARA. Haematologica 101, 1228-1236, doi:10.3324/haematol.2015.138503 (2016).
143 Hattori, H. et al. RNAi screen identifies UBE2D3 as a mediator of all-trans retinoic acid-induced cell growth arrest in human acute promyelocytic NB4 cells. Blood 110, 640-650, doi:10.1182/blood-2006-11-059048 (2007).
144 Lev Maor, G., Yearim, A. & Ast, G. The alternative role of DNA methylation in splicing regulation. Trends in Genetics 31, 274-280, doi:10.1016/j.tig.2015.03.002.