a robust neutrosophic fuzzy-based approach to integrate
TRANSCRIPT

Journal Pre-proofs
A Robust Neutrosophic Fuzzy-based Approach to Integrate Reliable FacilityLocation and Routing Decisions for Disaster Relief under Fairness and After-shocks Concerns
S. Mohammadi, S.A. Darestani, Behnam Vahdani Modelling, A. Alinezhad
PII: S0360-8352(20)30457-5DOI: https://doi.org/10.1016/j.cie.2020.106734Reference: CAIE 106734
To appear in: Computers & Industrial Engineering
Received Date: 27 January 2020Revised Date: 1 July 2020Accepted Date: 6 August 2020
Please cite this article as: Mohammadi, S., Darestani, S.A., Vahdani Modelling, B., Alinezhad, A., A RobustNeutrosophic Fuzzy-based Approach to Integrate Reliable Facility Location and Routing Decisions for DisasterRelief under Fairness and Aftershocks Concerns, Computers & Industrial Engineering (2020), doi: https://doi.org/10.1016/j.cie.2020.106734
This is a PDF file of an article that has undergone enhancements after acceptance, such as the addition of a coverpage and metadata, and formatting for readability, but it is not yet the definitive version of record. This versionwill undergo additional copyediting, typesetting and review before it is published in its final form, but we areproviding this version to give early visibility of the article. Please note that, during the production process, errorsmay be discovered which could affect the content, and all legal disclaimers that apply to the journal pertain.
© 2020 Published by Elsevier Ltd.

1
A Robust Neutrosophic Fuzzy-based Approach to Integrate Reliable Facility Location and Routing Decisions for Disaster Relief under Fairness and
Aftershocks Concerns
S. Mohammadia, S.A. Darestania,b , Behnam Vahdania,c,1, A. Alinezhada
aDepartment of Industrial Engineering, Faculty of Industrial and Mechanical Engineering, Qazvin Branch, Islamic Azad University, Qazvin, IranbDepartment of Management, Sunway university Business School, Sunway university, Malaysia
cIMT Atlantique, Lab-STICC, UBL, F-29238 Brest, France
1 Corresponding [email protected]

2
A Robust Neutrosophic Fuzzy-based Approach to Integrate Reliable Facility Location and Routing Decisions for Disaster
Relief under Fairness and Aftershocks Concerns Abstract
Relief distribution and victim evacuation are the crucial emergency relief operations after sudden-onset disasters to alleviate the repercussions of catastrophes in the concerned areas, although aftershocks and unfair distribution of relief items can affect these planning and beget plenty of undesirable reflections. In this paper, a new multi-objective reliable optimization model to organize a humanitarian relief chain is rendered to make a broad range of decisions, including reliable facility location-allocation, fair distribution of relief items, assignment of victims, and routing of trucks. For this purpose, the first objective function is to minimize the total logistics costs, the second one is to minimize the total time of relief operations, and the third one minimizes the variation between upper and lower bounds of transportation cost of distribution centers to regulate the workload of them. What is more, due to the fact that the uncertain essence of catastrophes, such as demand, the capacity of facilities, miscellaneous costs and transportation times, a novel uncertainty approach, including robust optimization and the neutrosophic set, is proposed to surmount these obstacles. Ultimately, a real case study is examined to illustrate the validity of the proposed model and solution method. The obtained results reveal that via increasing the capacity of the emergency centers by 30%, the total cost of the humanitarian relief network is reduced by 18%, and the operating time is reduced by 9%. What is more, if the probability of disruption in one of the distribution centers reaches zero, the logistics costs will be reduced to approximately 20%, and also the distance between the maximum and minimum distance traveled will be reduced by 30%, and the workload between distribution centers will be more balanced.
Keywords: Humanitarian logistics; Reliability; Facility Location; Equitable allocation; Vehicle routing; Uncertainty
1. Introduction Year after year, a broad range of miscellaneous catastrophes such as natural or human-made
calamities typically murders plenty of human beings, threatens manifold of the remnants, and beget titanic repercussions in terms of economic criteria. More importantly, the alteration of these calamities has manifested a considerable trend recently. In the literature, catastrophes were classified into slow and sudden onsets (Van Wassenhove, 2006) such that an earthquake, which falls out unexpectedly and unanticipatedly, is an instance of a sudden-onset catastrophe. Obviously, a broad range of repercussions would be brought about for disaster regions by a vigorous earthquake in the 100-km vicinity from the epicenter (Setiawan et al., 2019). In this study, the proposed framework is to deal with the challenges of this kind of catastrophe via providing a reliable tailor-made humanitarian logistics network (HLN).
In an attempt to mitigate the fatalities and enhance survivors’ endurance, comprehensive cooperation must be implemented right after any catastrophes. In this regard, the inauguration of provisional facilities such as distribution and emergency centers, the distribution of relief items among survivors, and the evacuation of injured people to create an HLN, are the crucial

3
considerations of vital measures. In retrospect, this cooperation could be encountered with varied obstacles (Balcik et al., 2010; Coppola, 2007; Nolte et al., 2012), such as the restriction of resources, aftershocks, varied types of injuries, unfair relief distribution (RD), accessibility of resources, increasing planning time, and uncertain and dynamic essence of catastrophes (e.g., Martinez et al., 2011; Jotshi et al., 2009).
One of the above-mentioned main obstacles is aftershocks and their concerns. Indeed, most vigorous earthquakes are followed by supplementary earthquakes, namely aftershocks. They are typically weaker and smaller than mainshock and could continue in the course of weeks, months, or years. Generally, the larger mainshock can beget larger and frequent aftershocks. In this way, almost all of the studies in the field of humanitarian logistics planning in pre-and post-disaster phases have assumed that the earthquake occurred and then necessitated planning is conducted and have not reflected the repercussions of aftershocks such as destruction of provisional facilities in their investigations. In this circumstance, the emergency relief chain possibly encounters substantial losses. Hence, in order to mitigate these repercussions, creating a reliable relief logistics network is one of the crucial measures. In this regard, with the intention of reflecting the facility disruption in a mathematical model, two major methods were proposed in the literature. The first method considers the failure probability as a constant parameter, and the second one endeavors to compute customer assignment probabilities through introducing a set of decision variables (Yu et al., 2017). Needless to say, the second one is complicated, but it is more accurate and reliable.
Another obstacle concerns the fairness manner of relief items distribution. Obviously, offering a fair and equitable scheme to distribute relief items among survivors, which have been stored in warehouses or distribution centers, is a vital measure and undeniable truth. For this purpose, there is a limited range of policies in the literature, including maximizing the minimum rate of demand satisfaction, minimizing the latest arrival time, minimizing the inequality in demand satisfaction, and considering a service level gap as a constraint. In the latest one, which is a new and efficient approach, the equity level could be adjusted by a maximal ratio to ascertain the best allocation of relief items with respect to the accessible supply. It should be noted that this gap could be considered for the disaster units with dissimilar facility providers, so it to be zero among disaster units that have similar service providers (Noham and Tzur, 2018).
Last but not least of the obstacles is the uncertain nature of calamities. In this regard, the reflection of uncertain conditions in the organizing and managing miscellaneous challenges is staggering, no more so than in the emergency relief supply chain. As a consequence, programming under uncertainty has been gaining prestige in the designing, planning and managing operations in this area (Liu et al., 2019; Tirkolaee et al., 2019, 2020a,b; Hematian et al., 2020). As a matter of fact, uncertain parameters can affect the performance of the humanitarian logistics planning to large scale, and disregarding this concern inevitably can beget ineffectual solutions. In the literature of humanitarian logistics, a broad range of parameters has been considered under an uncertain environment, including demand, the capacity of facilities, cost, transportation time and etc. In this regard, the supply factors could be encountered with uncertainty due to the unknown amount of resource availability and vibrational contributions from suppliers and responsible entities. In addition, the availability level of vehicles such as trucks, ambulances, and the accessibility of infrastructures can beget uncertainty in cost parameters. Also, the fluctuation of relief items or the number of injuries, and inaccurate estimations can beget uncertainty in demand parameters. In the

4
literature, so as to surmount these challenges, there are two substantial solution approaches, including robust optimization (RO) and stochastic programming (SP). On the one hand, now that there are historical and meteorological information concerning short-notice calamities such as flooding and hurricanes, and prediction method can render a suitable projection about these disasters, the SP solution approaches have been widely employed for them (Mete and Zabinsky, 2010). On the other hand, when decision-makers (DMs) encounter the shortage of information, the RO approaches have been utilized to optimize the performance of the system under worst-case situation (Balcik and İhsan, 2019). Subsequently, the RO approaches might be reasonable in response to tsunamis and earthquakes, which are known as no-notice catastrophes or quick-onset. What is more, in a similar circumstance, DMs may favor employing the other uncertainty approaches such as inexact programming or miscellaneous fuzzy programming approaches, in order to surmount these uncertainties. However, the attitude of DMs and the availability level of data can ascertain the type of uncertain approach.
Accordingly, this paper investigates a multi-echelon relief logistics network problem. With the intention of planning this problem, a new multi-objective reliable optimization model is proposed. The offered model involves a number of simultaneous decisions concerning facilities location, equitable allocation, assignment probability, routing of vehicles, RD, and victim evacuation (VE). Also, a novel uncertainty approach, which is included neutrosophic fuzzy programming and RO, is rendered. Ultimately, a real case study is examined to illustrate the validity of the proposed model and solution method. Concisely, the unprecedented features of this research compared to its counterparts are abridged as bellows:
Rendering a reliable synchronized framework to distribute relief items and evacuate victims in an HLN.
Developing a novel multi-objective model to integrate reliable locating and routing under fairness in distribution relief items.
Mitigating the repercussions of aftershocks by considering an efficient reliability approach.
Proposing an uncertain approach based on neutrosophic fuzzy programming and RO The remnant of this paper is structured as follows: Section2 investigates the literature in the
related research area. A framework of the proposed model is provided in Section 3. The details of the development and implementation of the hybrid uncertainty approach are explained in Sections 4 and 5, respectively. The multi-objective solution approach is addressed in Section 6. The case study and numerical results are provided in Section 7, and Section 8 renders sensitivity analysis and management insights. Lastly, the paper is concluded in Section 9.
2. Literature review Now that there are plenty of studies in the scope of emergency relief logistics (ERL), this section
concentrates on the location routing (LR) models, which are comprehensively related to the main goal of the current study. What is more, a comparative table of the examined studies is rendered at the end of this section, in order better to demonstrate the research gaps and contributions of this study. Meanwhile, there are a significant number of studies concerning LR models in the ERL, but the scrutiny of these studies manifests that merely a limited number of them have been reflected the

5
considerations of vehicle routing problem in their models, and the most of which have been reflected transmission considerations.
Yi and Ozdamar (2007) investigated a multi-period LR optimization model for synchronized RD and VE problems in an ERL network to minimize the waiting time of injuries and the unfulfilled demand of survivors. Also, the best locations of emergency centers were determined without introducing binary variables for this aim. Additionally, the pickup and delivery considerations were reflected in the phase of the vehicle routing problem (VRP) to determine the flow amount of various relief items. Another novelty of this research was to consider varied types of injuries in the planning. Also, a heuristic algorithm (HA) was introduced to solve the proposed model. The maximum number of disaster units considered in their study was 60, which required 140.3 seconds of computational time on a PC with 3.2 GHz CPU and 512 MB RAM to solve by CPLEX. A mobile healthcare management problem was considered to develop a multi-objective LR model by (Doerner et al., 2007), such that three criteria, including coverage, the effectiveness of workforce employment and average accessibility were examined to assess the tours of vehicles. Also, after completing the mission, the vehicles should have returned to the starting point, which was called closed VRP. More importantly, three meta-heuristic algorithms (MHAs) were proposed to solve the proposed model. As a matter of fact, the above-mentioned criteria to assess vehicle tours were the major contributions of this study. The maximum number of disaster units considered in their study was 500, which required 12 minutes of computational time on a Pentium III with 1400 MHz CPU to solve by MHA. Mete and Zabinsky (2010) presented an LR optimization model to minimize the total costs of the RD network, in which the parameters of the optimization model were considered under an uncertain state. In an attempt to overcome these uncertainties, they employed an SP approach. The main novelties of this research were to consider the dissimilar kinds of potential calamities and their magnitudes and to reflect on inventory management considerations. The maximum number of disaster units considered in their study was 10, which required 60 seconds of computational time on a PC with 1.8 GHz CPU to solve by CPLEX. A bi-level LR optimization model was proposed to design an HLN by (Oran et al., 2012). The location-allocation facilities' decisions were determined in the upper level, and the routing decisions of vehicles were ascertained in the lower-level by a VRP model. The objective function of the upper-level minimized the unfulfilled emergency demand, and the objective function of the lower-level maximized the priorities of emergency types. Moreover, the proposed framework, upper and lower objective functions, and the considerations of time windows constraints in the lower-level model were the contributions. Also, they proposed a tabu search based MHA to solve the presented models. The maximum number of disaster units considered in their study was 100, which required 5 minutes of computational time to solve by MHA. Afshar and Haghani (2012) addressed an LR model to plan a humanitarian supply chain, and the pickup and delivery considerations were reflected to determine the flow amount of various relief items. In this study, the total amount of weighted unsatisfied demand was minimized as the objective function. The main novelty of this research was the constraint of the minimum percentage of demand that should have been fulfilled. They opined that this model could offer a suitable opportunity to efficiently utilize resources and eliminate the delays. The maximum number of disaster units considered in their study was 500, which required 231035 seconds of computational time on a PC with 3 GHz CPU and 2 GB RAM to solve by CPLEX.

6
Wang et al., (2014) investigated a non-linear model with multiple objectives to plan a relief supply chain. The first objective minimized the maximum traveling time of vehicles, the second one minimized the costs of RD, and the third one maximized the minimum accessibility of routes. The main novelties of this research were to reflect split delivery considerations in the delivery process of relief items and to define the first and third objective functions. Also, two MHAs were applied to solve the addressed model. The maximum number of disaster units considered in their study was 120, which required 3989 seconds of computational time on a PC with 2.67 GHz CPU and 512 MB RAM to solve by MHA. In an attempt to maximize the recipient demand satisfaction and residual budget, a multi-level LR model under an uncertain state was proposed by (Rennemo et al., 2014). Also, they employed an SP approach, in order to overcome the uncertainties of demand, supplies, availability of vehicles and infrastructure. The location decisions of local distribution centers and the quantity of supply were determined at the first level. In what follows, the distribution decisions of last-mile routes and the resource arrangements were ascertained at the second and third levels, respectively. Moreover, presenting a synchronized configuration for discussed decisions, the types of objective functions, improvising adequate linkage between consecutive stages, and developing a set of efficiency constraints were the novelties of this study. The maximum number of disaster units considered in their study was 250, which required 3500 seconds of computational time on a PC with 3.40 GHz CPU and 16 GB RAM to solve by CPLEX. Abounacer et al., (2014) investigated a multi-objective LR optimization model to minimize traveling time, aid distribution facilities and unfulfilled demand. The main novelty of this study was related to the solution methodology, which was comprehended from the epsilon-constraint method. The maximum number of disaster units considered in their study was 45, which required 30038 seconds of computational time on a PC with 3.2 GHz CPU and 4 GB RAM to solve by CPLEX.
A non-linear LR optimization model to minimize the total evacuated time under considerations of traffic assignment was proposed by (Bayram et al., 2015). Computation of traffic flow on each arc and the restriction concerning maximum route length was the main novelties of this research. In the phase of location problem, the purpose was to determine the best locations of provisional shelters. What is more, they utilized order cone programming techniques to solve the proposed model. The maximum number of disaster units considered in their study was 416, which required 1907.59 seconds of computational time on a PC with 2.4 GHz CPU and 16 GB RAM to solve by CPLEX. In order to formulate an HLN by considering the uncertainties of demand, supply capacity, availability of roads and inventory level, two multi-period LR models were proposed by (Moreno et al., 2016). Moreover, they employed an SP approach to surmount the challenges of these uncertainties. The opportunity of reusing vehicles to cover additional routes, and ascertaining the fleet sizing of them were the main novelties of this research. Moreover, relax-and-fix and fix-and-optimize were offered as two HAs, in order to solve the proposed model. The maximum number of disaster units considered in their study was 10, which required 3600 seconds of computational time on a PC with 2.4 GHz CPU and 16 GB RAM to solve by CPLEX. Bozorgi-Amiri and Khorsi (2016) presented a multi-objective multi-period HLN model under an uncertain state, where the objective functions were to minimize the maximum unfulfilled demand, the vehicle traveling time and total costs. Also, they employed an SP approach in order to overcome the uncertainties of demand, cost and travel time. Considering the constraints of inventory balance among facilities was the main noticeable aspect of this study. Additionally, an ε-constraint method was utilized to solve the proposed model. The maximum

7
number of disaster units considered in their study was 6, and numerical studies were implemented by CPLEX on a PC with 2.3 GHz CPU and 4 GB RAM. A multi-period multi-objective HLN was proposed by (Tavana et al., 2018) to minimize the total relief time and costs. Even though they reflected the considerations of perishable commodities, there was not any unique constraint to manage the requirements of this type of commodities. The noticeable feature of this research was to propose a reference point based non-dominated sorting genetic algorithm-II to solve the proposed model. The maximum number of disaster units considered in their study was 60, which required 64.84 seconds of computational time on a PC with 3.6 GHz CPU and 16 GB RAM to solve by MHA.
Vahdani et al., (2018a) formulated a bi-level multi-objective multi-period HLN under an uncertain state, where the objective function of the upper-level was to minimize the total costs and objective functions of lower-level were to minimize the traveling costs, traveling time, and to maximize the reliability of routes with respect to the hard time windows constraints. As a matter of fact, the upper-level ascertained the facilities’ locations, the levels of capacity and inventory of them, and the lower-level model determined the routes of vehicles. The noticeable feature was related to the vehicle scheduling considerations. Also, they employed an RO approach, in order to overcome the uncertainties of travel time, capacities of facilities and route reliability. What is more, an extension of this model under a split delivery assumption was introduced. Also, they applied two MHAs to solve the proposed model. The maximum number of disaster units considered in their study was 200, which required 634.58 seconds of computational time on a PC with 3.6 GHz CPU and 8 GB RAM to solve by MHA. Veysmoradi al., (2018) formulated an HLN under an uncertain state in terms of the multi-objective optimization model, where the objective functions were to minimize the total costs, the vehicle traveling time, and to maximize the minimum route reliability. The noticeable features were comprehended two dissimilar transportation modes, including helicopter and vehicle for the VRP stage. Also, they utilized an RO approach in order to overcome the uncertainties of costs and aids. In this study, likewise to the studies, which were proposed by (Wang et al., 2014) and (Vahdani et al., 2018a), the assumption of split delivery was also reflected. The maximum number of disaster units considered in their study was 11, which required 14 minutes and 37 seconds of computational time on a PC with 3.6 GHz CPU and 8 GB RAM to solve by BARON. Vahdani et al., (2018b) formulated a multi-objective multi-period relief logistics network, where the objective functions were similar to previous research. The noticeable aspect of this study was related to the possibility of repairing the emergency roadway. Also, they employed two MHAs to solve the proposed model. The maximum number of disaster units considered in their study was 65, which required 655.781 seconds of computational time on a PC with 3.6 GHz CPU and 8 GB RAM to solve by MHA.
Moreno et al., (2018) formulated an HLN under an uncertain environment in terms of the multi-objective multi-period optimization model, where the objective functions were to minimize the human suffering and total costs. Also, they utilized a two-stage SP approach to surmount the uncertainties of demand, supply and availabilities of roads. The novelties of this research were to consider the possibility to reuse vehicles for multi-trip planning and to reflect social concerns considerations. Furthermore, a heuristic algorithm was offered to solve the presented model. The maximum number of disaster units considered in their study was 5, which required 571.3 seconds of computational time on a PC with 3.2 GHz CPU and 32 GB RAM to solve by CPLEX. Çankaya et al., (2018) formulated an HLN in terms of a bi-level optimization model, where the upper-level objective function was to minimize total costs, and the lower-level one was to maximize the minimum safety

8
stock level. The location decisions were to determine at the upper level, and the routing and scheduling decisions were ascertained at the lower level. The novelty of this research was to reflect the considerations of slack. More importantly, a multi-stage HA was sketched to solve the different phased of the proposed model, ranging from clustering to routing. The maximum number of disaster units considered in their study was 100, which required 215.14 seconds of computational time on a PC with 2.4 GHz CPU and 24 GB RAM to solve by CPLEX. With the intention of distributing reliefs and evacuating survivors, three mathematical models were formulated by (Setiawan et al. 2019). The objective functions of these models minimized the victim's suffering. The first model formulated in terms of bi-level programming, and the second one rendered an integrated model. Also, the third model offered a synchronized framework to share the necessitated vehicles between RD and VE. The noticeable constraints were related to the computation of vehicle resources and combinations of trips. What is more, a heuristic algorithm was also rendered to solve the proposed model. The maximum number of disaster units considered in their study was 47, and numerical studies were implemented by Xpress MP on a PC with 3 GHz CPU and 4 GB RAM. Another study concerning synchronizing RD and VE under an uncertain environment in terms of multi-objective multi-period mathematical mode was proposed by (Ghasemi et al., 2019), where the objective functions were to minimize total costs and the amount of the shortage of relief commodities. The noticeable features were to consider different types of injuries and different types of facilities, including destroyable and indefectible. Moreover, two MHAs were proposed to solve the model. The maximum number of disaster units considered in their study was 10, which required 139 seconds of computational time on a PC with 2.5 GHz CPU and 8 GB RAM to solve by MHA. As can be seen in the above-mentioned description, in these valuable studies have been endeavored to organize a number of necessitated items such as facilities and means of transport to managing the repercussions of disaster in an HLN. Although, a number of critical and practical concerns have not been considered due to the expansion of the subject, which this research has tried to take care of a limited number of them. The first one concerns aftershocks after the mainshock, which could have a significant negative influence on the determined decisions in the whole of these studies. The second one relates to synchronizing location and routing decisions under aftershocks’ concerns. Although there are a number of magnificent research studies in the literature of reliable facility location to driving down the negative impacts of disruptions, there is a lack of a framework to integrate location and routing decisions, especially where the customer assignment probabilities should be computed. The third one concerns the fair distribution of relief items, which could have significant impacts on survivors, both psychologically and helpfully. In this regard, organizing several decisions, including supply, equitable assignment, and distribution in the same as the quota, are momentous. Last but not least, in most of these studies, RO has been employed to surmount the challenges of uncertainties. Meanwhile, some estimations could be provided for a limited number of uncertain parameters under inconsistent, imprecise, and vague information. Hence, providing a hybrid approach to simultaneously consider the lack of information alongside inconsistent, imprecise, and vague information is indispensable. So as to demonstrate the research gap and our contributions, a comparative table of the investigated studies on location-routing models in relief logistics network design is offered in Table 1.

9
Table 1. A comparative literature review Objective Function Type of Research Condition Uncertain Approach Planning system Transportation Mode
Authors and Year Single Multiple Theoretical
Case StudyBased
Certain Uncertain Singular Mixed Victim Evacuation
Relief Distribution
Fairness in Distribution
Aftershock/Reliable Location Single Multiple
SolverMaximum number of
disaster units
Yi and Ozdamar
(2007) CPLEX 60
Doerner et al., (2007) MHA 500
Mete and Zabinsky
(2010) CPLEX 10
Oran et al., (2012) MHA 100
Afshar and Haghani (2012)
CPLEX 500
Wang et al., (2014) MHA 120
Rennemo et al., (2014) CPLEX 250
Abounacer et al., (2014) CPLEX 45
Bayram et al., (2015) CPLEX 416
Moreno et al., (2016) CPLEX 10
Bozorgi-Amiri and Khorsi
(2016) CPLEX 6
Tavana et al., (2018) MHA 60
Vahdani et al., (2018a) MHA 200
Veysmoradi al., (2018) BARON 11
Vahdani et al., (2018b) MHA 65
Moreno et al., (2018) CPLEX 5
Çankaya et al., (2018) CPLEX 100
Setiawan et al., (2019) Xpress MP 47
Ghasemi et al., (2019) MHA 10
Current research BARON 10

10
3. Problem definition and formulation In this paper, a multi-echelon HLN, including suppliers, distribution centers, disaster units,
emergency centers, and hospitals, is considered. Suppliers could provide the essentials needed and relief items for distribution centers by vehicles such as trucks, trailers, and aircraft. In the following, distribution centers allocate these relief items among disaster units. Also, with the intention of improving service recipients, enhancing the accuracy of plans, reducing planning time, and increasing utilization of resources, truck routing between distribution centers and disaster units is considered. It is worth noting that after completing the mission, these trucks should return to the starting point.
Moreover, in an attempt to provide a fairness distribution of relief items among survivors, which have been stored in distribution centers, a service level gap as a constraint is considered to ascertain the best allocation of relief items with regard to the available supply. This gap could be considered for the disaster units with dissimilar facility providers, and it to be zero among disaster units that have similar facility providers. Meanwhile, so as to mitigate the repercussions of aftershocks and design a reliable relief logistics network, the possibility of failure of distribution centers is considered, and an efficient approach, which was proposed by Aboolian et al., (2012), is utilized to overcome this challenge. With the intention of evacuating injured people, there are two alternatives, including transferring them from disaster units to hospitals and transferring them through emergency centers as transitional points to hospitals. In fact, in the real situation of a disaster, a number of injured people are taken to emergency centers, and after examining their physical condition, the decision of transferring them to the hospitals would be made. Needless to say, people with serious injuries are transported to hospitals directly. The decisions which are made in this problem are included setting up suppliers, opening provisional locations of distribution centers and emergency centers, determining assignment probability, routing of trucks between disaster units and distribution centers, and a number of allocations, including classical and equitable allocations concerning evacuating injured people and distributing relief items. What is more, Fig. 1 provides a road map for better illustrating the connections among the comprehensive, decision, and mathematical visions. Fig. 2 depicts a graphic demonstration of the investigated problem. The main assumptions, which are considered in this research, are as follows:
Distribution centers could be encountered with disruption due to the aftershocks. There is not any connection between distribution centers. The locations of suppliers, distribution centers, and emergency centers are undefined. A number of influential parameters such as demand, costs, transportation time, the
capacity of supply, the percentage of injured people who should be dispatched from the emergency center to hospital, and the capacity of facilities are uncertain.

11
Fig 1. A road map for illustrating the various levels of planning
3.1. Sets and indices : Indices for nodes (𝑘,𝑗,𝑖,𝑙,𝑟,𝑠,𝑛,ℎ,𝑣)
: Set of potential suppliers 𝐾: Set of potential distribution centers 𝐽: Set dummy distribution centers 𝐸
: Set of disaster units 𝐼: Assignment levels 𝑅: Set of potential emergency centers 𝑁: Set of hospitals 𝐻: Set of vehicles 𝑉: Set of all nodes 𝑀 {𝐼,𝐽,𝐸}

12
Suppliers Distribution Centers
Hospitals
Disaster Regions
Fig.2.The graphic demonstration of the investigated problem
3.2. Parameters : Demand of disaster unit 𝑑𝑖 𝑖
: Service level gap 𝜌 (𝜌 ≤ 1) : Capacity of supplier 𝒞𝒜𝒮𝑘 𝑘 : Capacity of emergency center 𝒞𝒜𝐸𝑛 𝑛 : Capacity of hospital 𝒞𝒜𝐻ℎ ℎ: Capacity of vehicle 𝒞𝒜𝒱𝑣 𝑣
: Maximum supply capacity of distribution center 𝑇𝑚𝑎𝑥𝑗 𝑗
: Constant setting up cost of supplier 𝑐𝑤𝑘 𝑘: Constant opening cost of distribution center 𝑓𝑗 𝑗
: Constant opening cost of emergency center 𝑐𝑓𝑛 𝑛: Transportation cost of relief items from supplier to distribution center 𝑐𝑢𝑘𝑗 𝑘 𝑗: Transportation cost per distance traveled by vehicle 𝑓𝑣𝑣 𝑣: Preparation cost of relief items based on the demand of disaster unit at distribution center 𝑐𝑞𝑖𝑗 𝑖
𝑗: Dispatching cost per injured person from disaster unit to emergency center 𝑐𝑡1𝑖𝑛 𝑖 𝑛: Dispatching cost per injured person from emergency center to hospital 𝑐𝑡2𝑛ℎ 𝑛 ℎ: Dispatching cost per injured person from disaster unit to hospital 𝑐𝑡3𝑖ℎ 𝑖 ℎ

13
: Number of injuries at disaster unit 𝑤𝑑𝑖 𝑖: Transportation time per injured person from disaster unit to emergency center 𝜏1𝑖𝑛 𝑖 𝑛: Transportation time per injured person from emergency center to hospital 𝜏2𝑛ℎ 𝑛 ℎ: Transportation time per injured person from disaster unit to hospital 𝜏3𝑖ℎ 𝑖 ℎ
: Probability of failure of distribution center 𝑞𝑗 𝑗: Distance between node and node 𝑑𝑖𝑠𝑗𝑖 𝑗 𝑖
: Speed of vehicle 𝛿𝑣 𝑣: Capacity of dispatching injured people 𝛾: The percentage of injured people who should be dispatched from the emergency center to 𝜇
hospital : A sufficient big number ℳ
3.3. Decision variables : 1 if supplier is selected for setting up; 0 otherwise 𝑤𝑘 𝑘
: 1 if the distribution center is opened at location ; 0 otherwise 𝑍𝑗 𝑗: 1 if the emergency center is opened at location ; 0 otherwise 𝜑𝑛 𝑛
: 1 if distribution center is assigned to supplier ; 0 otherwise 𝑘ℎ𝑘𝑗 𝑗 𝑘: 1 if distribution center is assigned to disaster unit at level 𝑦𝑗𝑖𝑟 𝑗 𝑖 𝑟
: 1 if node is on the route of the vehicle before node at assignment level ; 0 otherwise𝑣𝑟𝑗𝑖𝑣𝑟 𝑗 𝑣 𝑖 𝑟: 1 if distribution center is on the route of the vehicle at assignment level ; 0 otherwise𝑥𝑗𝑣𝑟 𝑗 𝑣 𝑟
: Number of relief items transported from supplier to distribution center 𝑢𝑘𝑗 𝑘 𝑗: Number of relief items transported from distribution center to disaster unit 𝑇𝑗𝑖 𝑗 𝑖: Number of relief items allocated to disaster unit 𝑔𝑑𝑖 𝑖: The probability that distribution center serves disaster unit at assignment level 𝑃𝑖𝑗𝑟 𝑗 𝑖 𝑟: Number of injuries dispatched from disaster unit to emergency center 𝑓𝑥𝑖𝑛 𝑖 𝑛
: Number of injuries dispatched from emergency center to hospital 𝑚𝑥𝑛ℎ 𝑛 ℎ: Number of injuries dispatched from disaster unit to hospital ℎ𝑥𝑖ℎ 𝑖 ℎ
Subtour elimination variable 𝑢𝑢𝑖𝑣𝑟:
3.4. Mathematical model
min 𝑧1
= ∑𝑘𝜖𝐾
𝑐𝑤𝑘 𝑤𝑘 + ∑𝑗𝜖𝐽
𝑓𝑗 𝑍𝑗 + ∑𝑛𝜖𝑁
𝑐𝑓𝑛 𝜑𝑛 + ∑𝑖𝜖𝐼
∑𝑛𝜖𝑁
𝑐𝑡1𝑖𝑛 𝑓𝑥𝑖𝑛 + ∑𝑛𝜖𝑁
∑ℎ𝜖𝐻
𝑐𝑡2𝑛ℎ 𝑚𝑥𝑛ℎ + ∑𝑖𝜖𝐼
∑ℎ𝜖𝐻
𝑐𝑡3𝑖ℎ ℎ𝑥𝑖ℎ
+ ∑𝑗𝜖𝐽 ∪ 𝐸
∑𝑘𝜖𝐾
𝑐𝑢𝑘𝑗 𝑢𝑘𝑗 + ∑𝑖𝜖𝐼
∑𝑗𝜖𝐽 ∪ 𝐸
𝐽 + 1
∑𝑟 = 1
𝑐𝑞𝑖𝑗 𝑃𝑖𝑗𝑟 𝑦𝑗𝑖𝑟 + ∑𝑗𝜖𝑀
∑𝑖𝜖𝑀
∑𝑣𝜖𝑉
𝐽 + 1
∑𝑟 = 1
𝑓𝑣𝑣 𝑑𝑖𝑠𝑗𝑖 𝑣𝑟𝑗𝑖𝑣𝑟
(1)
min 𝑧2 = ∑𝑖𝜖𝑀
∑𝑗𝜖𝑀
∑𝑣𝜖𝑉
𝐽 + 1
∑𝑟 = 1
𝑑𝑖𝑠𝑗𝑖 𝑣𝑟𝑗𝑖𝑣𝑟
𝛿𝑣+ ∑
𝑖𝜖𝐼∑𝑛𝜖𝑁
∑ℎ𝜖𝐻
(𝜏1𝑖𝑛 𝑓𝑥𝑖𝑛 + 𝜏2𝑛ℎ 𝑚𝑥𝑛ℎ + 𝜏3𝑖ℎ ℎ𝑥𝑖ℎ
𝛾 )

14
(2)
min 𝑧3 = arg 𝑚𝑎𝑥𝑗𝜖𝐽 ∪ 𝐸 {∑
𝑖𝜖𝑀∑𝑗𝜖𝑀
∑𝑣𝜖𝑉
𝐽 + 1
∑𝑟 = 1
𝑓𝑣𝑣 𝑑𝑖𝑠𝑗𝑖 𝑣𝑟𝑗𝑖𝑣𝑟} ― arg 𝑚𝑖𝑛𝑗𝜖𝐽 ∪ 𝐸 {∑
𝑖𝜖𝑀∑𝑗𝜖𝑀
∑𝑣𝜖𝑉
𝐽 + 1
∑𝑟 = 1
𝑓𝑣𝑣 𝑑𝑖𝑠𝑗𝑖 𝑣𝑟𝑗𝑖𝑣𝑟}(3)
The first objective function (1) minimizes the total humanitarian logistics costs, in which the first to third terms calculate the setting up and opening costs of suppliers, distribution centers and emergency centers, respectively. The fourth to sixth terms calculate the dispatching cost of injured people among facilities, including disaster units, emergency centers, and hospitals. The seventh term computes the transportation costs between suppliers and distribution centers. The eighth term calculates preparation costs of relief items, and the ninth term computes the transportation costs of vehicle routing among distribution centers and disaster units. The second objective function (2) minimizes the total time of relief operations, in which the first term computes the time of distributing relief, and the second term calculates the time of dispatching injured people. The third objective function (3) minimizes the variation between upper and lower bounds of transportation cost of distribution centers to regulate the workload of them.
S.t.:
∑𝑛𝜖𝑁
𝑓𝑥𝑖𝑛 + ∑ℎ𝜖𝐻
ℎ𝑥𝑖ℎ = 𝑤𝑑𝑖 ∀ 𝑖𝜖𝐼
(4)
∑ℎ𝜖𝐻
𝑚𝑥𝑛ℎ ≤ ℳ.𝜑𝑛 ∀ 𝑛𝜖𝑁
(5)
∑ℎ𝜖𝐻
𝑚𝑥𝑛ℎ ≤ 𝜇 .∑𝑖𝜖𝐼
𝑓𝑥𝑖𝑛 ∀ 𝑛𝜖𝑁
(6)
∑𝑖𝜖𝐼
𝑓𝑥𝑖𝑛 ≤ 𝒞𝒜𝐸𝑛 𝜑𝑛 ∀ 𝑛𝜖𝑁
(7)
∑𝑖𝜖𝐼
ℎ𝑥𝑖ℎ + ∑𝑛𝜖𝑁
𝑚𝑥𝑛ℎ ≤ 𝒞𝒜𝐻ℎ ∀ ℎ𝜖𝐻
(8)Constraint (4) ensures that the number of injured people transferred from each disaster unit to
emergency centers and hospitals is equal to the number of injuries in that disaster unit. Constraint (5) ensures that emergency centers have been opened by the time they could provide transmission service. Constraint (6) ensures that the flow of injured people between disaster units and hospitals through emergency centers. Constraints (7) to (8) signify the restriction capacities of emergency centers and hospitals. Also, constraint (7) ensures that emergency centers have been opened by the time they could provide related service.

15
∑𝑘𝜖𝐾
𝑢𝑘𝑗 = ∑𝑖𝜖𝐼
𝐽 + 1
∑𝑟 = 1
𝑇𝑗𝑖 𝑦𝑗𝑖𝑟 ∀ 𝑗𝜖𝐽 ∪ 𝐸
(9)
∑𝑗𝜖𝐽 ∪ 𝐸
𝑢𝑘𝑗 ≤ 𝒞𝒜𝒮𝑘 𝑤𝑘 ∀ 𝑘𝜖𝐾
(10)𝑘ℎ𝑘𝑗 ≤ 𝑤𝑘 ∀ 𝑗𝜖 𝐽 ∪ 𝐸 ,∀ 𝑘𝜖𝐾
(11)
∑𝑘𝜖𝐾
𝑘ℎ𝑘𝑗 = 1 ∀ 𝑗𝜖 𝐽 ∪ 𝐸
(12)Constraint (9) guarantees that the amount of relief items transferred from suppliers to each
distribution center is equal to the amount of supplied relief items to the whole of disaster units, which have been assigned to that distribution center. Constraint (10) signifies the restriction capacity of suppliers. Also, constraints (10) and (11) ensure that suppliers have been launched by the time they could provide related service and could assign to a distribution center. Constraint (12) guarantees that a distribution center could be assigned to only one supplier.
𝑇𝑗𝑖 ≤ 𝑇𝑚𝑎𝑥𝑗
𝐽 + 1
∑𝑟 = 1
𝑦𝑗𝑖𝑟 ∀ 𝑗𝜖 𝐽 ∪ 𝐸 , 𝑖𝜖𝐼
(13)
∑𝑖𝜖𝐼
𝑇𝑗𝑖 ≤ 𝑇𝑚𝑎𝑥𝑗 𝑍𝑗 ∀ 𝑗𝜖𝐽
(14)Constraints (13) to (14) signify the restriction capacities of distribution centers. Also, constraint
(13) ensures that a distribution center could send relief items to disaster units only if it serves those demand units. Constraint (14) guarantees that the distribution center has been opened by the time they could provide related service.
𝑔𝑑𝑖 = ∑𝑗𝜖𝐽 ∪ 𝐸
𝑇𝑗𝑖 ∀ 𝑖𝜖𝐼
(15)𝑔𝑑𝑖 ≤ 𝑑𝑖 ∀ 𝑖𝜖𝐼
(16)𝑔𝑑𝑖
𝑑𝑖 ≤
𝑔𝑑𝑙
𝑑𝑙 . 𝜌 ∀ 𝑖 , 𝑙𝜖 𝐼 , 𝑖 ≠ 𝑙
(17)𝑔𝑑𝑖
𝑑𝑖 ≤
𝑔𝑑𝑙
𝑑𝑙+ (2 ―
𝐽 + 1
∑𝑟 = 1
𝑦𝑗𝑖𝑟 ―𝐽 + 1
∑𝑟 = 1
𝑦𝑗𝑙𝑟) ∀ 𝑖 , 𝑙𝜖 𝐼 , 𝑖 ≠ 𝑙 , 𝑗𝜖𝐽 ∪ 𝐸
(18)

16
Constraint (15) specifies the number of relief items received by each disaster unit. Constraint (16) restricts the number of allocated relief items to disaster units. Constraint (17) defines the service gap, that is to say, the maximal ratio between the proportions of fulfilled demand at all disaster units. Constraint (18) states that all disaster units that are served by the identical distribution center will receive equal proportions of their demand. Constraints (17) and (18) denote an equitable allocation policy.
𝐽
∑𝑟 = 1
𝑦𝑗𝑖𝑟 ≤ 𝑍𝑗 ∀ 𝑗𝜖𝐽 , 𝑖𝜖𝐼
(19)𝐽 + 1
∑𝑟 = 1
∑𝑗𝜖𝐸
𝑦𝑗𝑖𝑟 = 1 ∀ 𝑖𝜖𝐼
(20)
∑𝑗𝜖𝐽 ∪ 𝐸
𝑦𝑗𝑖𝑟 + ∑𝑗𝜖𝐸
𝑟 ― 1
∑𝑠 = 1
𝑦𝑗𝑖𝑠 = 1 ∀ 𝑖𝜖𝐼 , 1 ≤ 𝑟 ≤ 𝐽 + 1
(21)𝐽 + 1
∑𝑟 = 1
𝑦𝑗𝑖𝑟 ≤ 1 ∀ 𝑖𝜖𝐼 , 𝑗𝜖𝐽 ∪ 𝐸
(22)𝑃𝑖𝑗1 = 1 ― 𝑞𝑗 ∀ 𝑖𝜖𝐼 , 𝑗𝜖𝐽 ∪ 𝐸
(23)
𝑃𝑖𝑗𝑟 = (1 ― 𝑞𝑗) ∑𝑙𝜖𝐽
𝑞𝑙
1 ― 𝑞𝑙 𝑃𝑖,𝑙,𝑟 ― 1 𝑦𝑖, 𝑙,𝑟 ― 1 ∀ 𝑖𝜖𝐼 , 𝑗𝜖𝐽 ∪ 𝐸 , 2 ≤ 𝑟 ≤ 𝐽 + 1
(24)Constraint (19) guarantees that disaster units are only allocated to the established distribution
centers, and constraint (20) signifies that each disaster unit to be allocated to the dummy distribution center at a specified level. Constraint (21) guarantees that for each disaster unit and each 𝑖 assignment level , either is allocated to a distribution center at assignment level or it is allocated 𝑟 𝑖 𝑟to the dummy distribution center at a specified level . Constraint (22) restricts the allocation of 𝑠 < 𝑟each disaster unit to each distribution center on more than one assignment level. Constraints (23) and (24) are transitional equations of probability.
𝑍𝑗 ≥ 𝑥𝑗𝑣𝑟 ∀ 𝑗𝜖𝐽 ∪ 𝐸 , 𝑣𝜖𝑉 , 1 ≤ 𝑟 ≤ 𝐽 + 1 (25)
𝑦𝑗𝑖𝑟 ≥ 𝑣𝑟𝑗𝑖𝑣𝑟 ∀ 𝑗𝜖𝐽 ∪ 𝐸 , ∀𝑖𝜖𝐼 , 𝑣𝜖𝑉 , 1 ≤ 𝑟 ≤ 𝐽 + 1 (26)
𝑥𝑗𝑣𝑟 ≥ 𝑣𝑟𝑗𝑖𝑣𝑟 ∀ 𝑗𝜖𝑀 , ∀𝑣𝜖𝑉 , ∀𝑖𝜖𝐼 , 1 ≤ 𝑟 ≤ 𝐽 + 1 (27)
Constraint (25) ensures that a distribution center has been opened by the time it could be on the route of a vehicle to provide the required service. Constraint (26) ensures that a distribution center has been assigned to a disaster unit by the time it could be on the route of a vehicle to provide the

17
required service. Constraint (27) ensures that a distribution center should have been on a route by the time it could provide related service.
∑𝑗𝜖𝐽 ∪ 𝐸
𝐽 + 1
∑𝑟 = 1
𝑥𝑗𝑣𝑟 ≤ 1 ∀ 𝑣𝜖𝑉
(28)
∑𝑗𝜖𝑀
∑𝑣𝜖𝑉
𝐽 + 1
∑𝑟 = 1
𝑣𝑟𝑗𝑖𝑣𝑟 = 1 ∀ 𝑖𝜖𝐼
(29)
∑𝑗𝜖𝐽 ∪ 𝐸
∑𝑖𝜖𝐼
𝐽 + 1
∑𝑟 = 1
𝑣𝑟𝑗𝑖𝑣𝑟 ≤ 1 ∀ 𝑣𝜖𝑉
(30)Constraint (28) ensures that each vehicle could be assigned to only one distribution center.
Constraint (29) ensures that each disaster unit is met only once. Constraint (30) ensures that each vehicle could be dispatched from only one distribution center.
∑𝑗𝜖𝑀
𝑣𝑟𝑖𝑗𝑣𝑟 + ∑𝑗𝜖𝑀
𝑣𝑟𝑙𝑗𝑣𝑟 ― 𝑦𝑙𝑖𝑟 ≤ 1 ∀ 𝑙𝜖 𝐽 ∪ 𝐸 , 𝑖𝜖𝐼 , 𝑣𝜖𝑉 , 1 ≤ 𝑟 ≤ 𝐽 + 1
(31)
∑𝑣𝜖𝑉
𝐽 + 1
∑𝑟 = 1
𝑣𝑟𝑗𝑖𝑣𝑟 ≤ 1 ∀ 𝑖, 𝑗 𝜖 𝐼 , 𝑖 ≠ 𝑗
(32)
∑𝑖𝜖𝑀
𝑣𝑟𝑗𝑖𝑣𝑟 ― ∑𝑖𝜖𝑀
𝑣𝑟𝑖𝑗𝑣𝑟 = 0 ∀ 𝑗𝜖𝑀 , 𝑣𝜖𝑉 , 1 ≤ 𝑟 ≤ 𝐽 + 1
(33) 𝑢𝑢𝑗𝑣𝑟 ― 𝑢𝑢𝑖𝑣𝑟 + |𝑀| ∗ 𝑣𝑟𝑗𝑖𝑣𝑟 ≤ |𝑀| ―1 ∀ 𝑖,𝑗 𝜖𝐼 , 𝑣𝜖𝑉 , 1 ≤ 𝑟 ≤ 𝐽 + 1
(34)
∑𝑗𝜖𝑀
∑𝑖𝜖𝐼
𝐽 + 1
∑𝑟 = 1
𝑑𝑖 𝑣𝑟𝑗𝑖𝑣𝑟 ≤ 𝒞𝒜𝒱𝑣 ∀ 𝑣𝜖𝑉
(35)𝐽 + 1
∑𝑟 = 1
𝑣𝑟𝑗𝑖𝑣𝑟 = 0 ∀ 𝑖 ,𝑗 𝜖 𝐽 ∪ 𝐸 , 𝑣𝜖𝑉
(36)𝜑𝑛 , 𝑤𝑘 ,𝑧𝑗 ,𝑘ℎ𝑘𝑗 ,𝑦𝑗𝑖𝑟 ,𝑣𝑟𝑗𝑖𝑣𝑟 ,𝑥𝑗𝑣𝑟 ∈ (0,1)
(37)𝑢𝑘𝑗 , 𝑇𝑗𝑖 ,𝑔𝑑𝑖 ,𝑝𝑖𝑗𝑟 , 𝑓𝑥𝑖𝑛,𝑚𝑥𝑛ℎ ,ℎ𝑥𝑖ℎ,𝑢𝑢𝑗𝑣𝑟 ≥ 0
(38)Constraint (31) ensures that a disaster unit could be assigned to a distribution center if both are
on the same route. Constraint (32) states that at most one vehicle could be selected for each route.

18
Also, connectivity constraints and sub tour elimination are guaranteed by constraints (33) to (34), respectively. Constraint (35) signifies the restriction capacities of vehicles, and constraint (36) guarantees that there is not any connection between distribution centers. Constraints (37) to (38) denote the types of decision variables.
4. Proposed uncertainty approach Among the various uncertainty approaches, RO can be conducted, once DMs encounter the
shortage of information, so this approach can be employed to optimize the system’s performance under a worst-case situation. What is more, in a similar circumstance, DMs may favor employing the other uncertainty approaches such as miscellaneous fuzzy programming approaches, in order to surmount these uncertainties. Indeed, so as to surmount the challenges of ambiguity and uncertainty, the fuzzy set theory was presented by Zadeh (1965). In the course of time, different extensions of fuzzy sets have been developed in the related literature, including type 2, multi-sets, hesitant, intuitionistic, neutrosophic, Pythagorean fuzzy sets (Otay et al., 2017). The goal of these propagations is to render a better interpretation of imprecise and vague information. Since the intuitionistic fuzzy set (IFS) includes membership, non-membership and hesitancy functions, it is popular to surmount the vagueness and impreciseness (Ye, 2010). However, it cannot simulate the process of human decision making. With the intention of overcoming the obstacles of IFS, and handling inconsistent, imprecise and vague information, neutrosophic set (NS) was proposed by (Broumi et al., 2016a). Hence, NS theory can simulate the process of human decision making with respect to the entire features of the decision-making process. Indeed, NS is an extension of fuzzy and IFS such that each element of the set has the truth, indeterminacy and falsity membership functions, so NS can adapt vague, inaccurate and incompatible information effectively and efficiently (Deli and Şubaş, 2017a,b).
In the literature of HLN, a broad range of parameters have been considered under an uncertain environment, including demand, the capacity of facilities, cost, transportation time and etc. In this regard, the supply factors could be encountered with uncertainty due to the unknown amount of resource availability and vibrational contributions from suppliers and responsible entities. In addition, the availability level of vehicles such as trucks, ambulances, and the accessibility of infrastructures can beget uncertainty in cost parameters. Also, the fluctuation of relief items or the number of injuries, and inaccurate estimations can beget uncertainty in demand parameters. Therefore, in an attempt to overcome the challenges of uncertain humanitarian logistics environment, a new approach by integrating NS and RO is provided in this section, in which the uncertainty of cost and time parameters are handled by NS, and the other ones such as demand and supply, including the capacity of facilities, the number of injuries are handled by RO approach. Fig 3 illustrates an overview of the proposed uncertainty approach.

19
Fig 3. An overview of the proposed uncertainty approach
4.1. Mathematical Programming with Neutrosophic Number
4.1.1. Preliminaries of Trapezoidal Neutrosophic Number
Definition 1. Let be a trapezoidal fuzzy number (TFN) on , which is the real 𝐾 = [𝑎1,𝑎2,𝑎3,𝑎4] 𝑅number set, such that , and its membership function is described as 𝑎1 ≤ 𝑎2 ≤ 𝑎3 ≤ 𝑎4 𝜇𝐾:𝑅→[0,1]follows (Broumi et al., 2016a):
𝜇𝐾(𝑥) = { 𝜇𝐾( 𝑥 ― 𝑎1
𝑎2 ― 𝑎1) 𝑎1 ≤ 𝑥 ≤ 𝑎2
𝜇𝐾 𝑎2 ≤ 𝑥 ≤ 𝑎3
𝜇𝐾( 𝑎4 ― 𝑥𝑎4 ― 𝑎3) 𝑎3 ≤ 𝑥 ≤ 𝑎4
0 otherwise.
(39)when , the TFN is converted to a triangular fuzzy number. 𝑎2 = 𝑎3
Definition 2. Consider that be a set of points or objects, with a common component in signified 𝑋 𝑋by . A single-valued neutrosophic set (SVNS) in is defined by three separate segments, including 𝑥 𝑉 𝑋truth , indeterminacy , and falsity membership functions, so that , (𝑇𝑉) ( 𝐼𝑉) ( 𝐹𝑉) 𝑇𝑉:𝑋→[0,1] 𝐼𝑉
, and . For notational ease, is regularly signified as:𝑋→[0,1] 𝐹𝑉:𝑋→[0,1] 𝑉 𝑉 = and satisfies .{ < 𝑥,(𝑇𝑉(𝑥), 𝐼𝑉(𝑥), 𝐹𝑉(𝑥)) > |𝑥 ∈ 𝑋} 0 ≤ 𝑇𝑉(𝑥) + 𝐼𝑉(𝑥) + 𝐹𝑉(𝑥) ≤ 3
A component in an SVNS, which is named single-valued neutrosophic number (SVNN), is represented by crisp numbers; it is comprehended to a discrete set and cannot truly describe fuzzy information. So as to surmount this obstacle, a continuous set was extended by (Ye, 2015) with

20
integrating the concepts of TFNs and SVNS to introduce the single-valued neutrosophic trapezoidal numbers (SVTNNs).
Definition 3. Let , , ; a SVTNN be a special NS on , 𝑇𝑎 𝐼𝑎 𝐹𝑎 ∈ [0,1] 𝑎 =< [𝑎1,𝑎2,𝑎3,𝑎4],(𝑇𝑎, 𝐼𝑎, 𝐹𝑎) > 𝑅whose truth , indeterminacy , and falsity membership functions are defined as follows (𝜇𝑎) (𝑣𝑎) ( 𝜆𝑎)(Broumi et al., 2016a):
𝜇𝑎(𝑥) = {(𝑥 ― 𝑎1)𝑇𝑎/(𝑎2 ― 𝑎1) 𝑎1 ≤ 𝑥 ≤ 𝑎2𝑇𝑎 𝑎2 ≤ 𝑥 ≤ 𝑎3(𝑎4 ― 𝑥)𝑇𝑎/(𝑎4 ― 𝑎3) 𝑎3 ≤ 𝑥 ≤ 𝑎4
0 otherwise.
(40)
𝑣𝑎(𝑥) = { (𝑎2 ― 𝑥 + 𝐼𝑎(𝑥 ― 𝑎1))/(𝑎2 ― 𝑎1) 𝑎1 ≤ 𝑥 ≤ 𝑎2𝐼𝑎 𝑎2 ≤ 𝑥 ≤ 𝑎3(𝑥 ― 𝑎3 + 𝐼𝑎(𝑎4 ― 𝑥))/(𝑎4 ― 𝑎3) 𝑎3 ≤ 𝑥 ≤ 𝑎4
0 otherwise.
(41)
𝜆𝑎 = { (𝑎2 ― 𝑥 + 𝐹𝑎(𝑥 ― 𝑎1))/(𝑎2 ― 𝑎1) 𝑎1 ≤ 𝑥 ≤ 𝑎2𝐼𝑎 𝑎2 ≤ 𝑥 ≤ 𝑎3(𝑥 ― 𝑎3 + 𝐹𝑎(𝑎4 ― 𝑥))/(𝑎4 ― 𝑎3) 𝑎3 ≤ 𝑥 ≤ 𝑎4
0 otherwise.
(42)Once , is termed a positive SVTNN, signified by . 𝑎1 > 0 𝑎 =< [𝑎1,𝑎2,𝑎3,𝑎4],(𝑇𝑎, 𝐼𝑎, 𝐹𝑎) > 𝑎 > 0
Likewise, once , is termed a negative SVTNN, signified . 𝑎4 ≤ 0 𝑎 =< [𝑎1,𝑎2,𝑎3,𝑎4],(𝑇𝑎, 𝐼𝑎, 𝐹𝑎) > 𝑎 < 0Once and , , , is termed a normalized SVTNN (Broumi et al., 0 ≤ 𝑎1 ≤ 𝑎2 ≤ 𝑎3 ≤ 𝑎4 ≤ 1 𝑇𝑎 𝐼𝑎 𝐹𝑎 ∈ [0,1] 𝑎2016a).
Once , the SVTNN is converted to a trapezoidal intuitionistic fuzzy number 𝐼𝑎 = 1 ― 𝑇𝑎 ― 𝐹𝑎
(TIFN). Once , converts to a single-valued triangular 𝑎2 = 𝑎3 𝑎 =< [𝑎1,𝑎2,𝑎3,𝑎4],(𝑇𝑎, 𝐼𝑎, 𝐹𝑎) >neutrosophic number (SVTrNN). Once , an SVTNN is converted to a generalized TFN, 𝐼𝑎 = 0,𝐹𝑎 = 0 𝑎
.=< [𝑎1,𝑎2,𝑎3,𝑎4],𝑇𝑎 >
Definition 4. Let be a ranking function of neutrosophic numbers (NNs), where is a 𝑅:𝑁(𝑅)→𝑅 𝑁(𝑅)set of NNs defined on set of real numbers, which converts each NN into the crisp value. Let 𝐴 =<
and are two SVTNNs, hence (Abdel-[𝑎1,𝑎2,𝑎3,𝑎4],(𝑇𝑎, 𝐼𝑎, 𝐹𝑎) > 𝐵 =< [𝑏1,𝑏2,𝑏3,𝑏4],(𝑇𝑏, 𝐼𝑏, 𝐹𝑏) >Basset, 2019):
If then ,𝑅(𝐴) > 𝑅(𝐵) 𝐴 > 𝐵 If then ,𝑅(𝐴) < 𝑅(𝐵) 𝐴 < 𝐵 If then .𝑅(𝐴) = 𝑅(𝐵) 𝐴 = 𝐵
4.1.2. Mathematical Programming with SVNNsConsider the following mathematical programming model, in which its parameters are SVNNs:

21
𝑀𝑎𝑥𝑛
∑𝑗 = 1
𝑐𝑗𝑥𝑗
S.t.: 𝑛
∑𝑗 = 1
𝑎𝑖𝑗𝑥𝑗 ≤ 𝑏𝑖 ∀𝑖 = 1,2,…,𝑚
𝑥𝑗 ≥ 0 ∀𝑗 = 1,2,…,𝑛(43)
where , and 𝑐𝑗 =< [𝑐𝑗1,𝑐𝑗2,𝑐𝑗3,𝑐𝑗4],(𝑇𝑐𝑗, 𝐼𝑐𝑗, 𝐹𝑐𝑗) > 𝑎𝑖𝑗 =< [𝑎𝑖𝑗1,𝑎𝑖𝑗2,𝑎𝑖𝑗3,𝑎𝑖𝑗4],(𝑇𝑎𝑖𝑗, 𝐼𝑎𝑖𝑗, 𝐹𝑎𝑖𝑗) > 𝑏𝑖 =< are SVNNs. By utilizing the ranking function , the equivalent crisp [𝑏𝑖1,𝑏𝑖2,𝑏𝑖3,𝑏𝑖4],(𝑇𝑏𝑖, 𝐼𝑏𝑖, 𝐹𝑏𝑖
) > 𝑅model of the model (43) is provided as follows (Abdel-Basset, 2019):
𝑀𝑎𝑥𝑛
∑𝑗 = 1
[(𝑐𝑗1 + 𝑐𝑗4 + 2(𝑐𝑗2 + 𝑐𝑗3)2 ) + (𝑇𝑐𝑗 ― 𝐼𝑐𝑗 ― 𝐹𝑐𝑗)]𝑥𝑗
S.t.: 𝑛
∑𝑗 = 1
[(𝑎𝑖𝑗1 + 𝑎𝑖𝑗4 + 2(𝑎𝑖𝑗2 + 𝑎𝑖𝑗3)2 ) + (𝑇𝑎𝑖𝑗 ― 𝐼𝑎𝑖𝑗 ― 𝐹𝑎𝑖𝑗)]𝑥𝑗 ≤ [(𝑏𝑖1 + 𝑏𝑖4 + 2(𝑏𝑖2 + 𝑏𝑖3)
2 )+ (𝑇𝑏𝑖 ― 𝐼𝑏𝑖 ― 𝐹𝑏𝑖
)] ∀𝑖 = 1,2,…,𝑚
𝑥𝑗 ≥ 0 ∀𝑗 = 1,2,…,𝑛(44)
In what follows, if a mathematical model is a minimization problem, the equivalent crisp model is provided as bellows (Abdel-Basset, 2019):
𝑀𝑖𝑛𝑛
∑𝑗 = 1
[(𝑐𝑗1 + 𝑐𝑗4 ― 3(𝑐𝑗2 + 𝑐𝑗3)2 ) + (𝑇𝑐𝑗 ― 𝐼𝑐𝑗 ― 𝐹𝑐𝑗)]𝑥𝑗
S.t.: 𝑛
∑𝑗 = 1
[(𝑎𝑖𝑗1 + 𝑎𝑖𝑗4 ― 3(𝑎𝑖𝑗2 + 𝑎𝑖𝑗3)2 ) + (𝑇𝑎𝑖𝑗 ― 𝐼𝑎𝑖𝑗 ― 𝐹𝑎𝑖𝑗)]𝑥𝑗 ≤ [(𝑏𝑖1 + 𝑏𝑖4 ― 3(𝑏𝑖2 + 𝑏𝑖3)
2 )+ (𝑇𝑏𝑖 ― 𝐼𝑏𝑖 ― 𝐹𝑏𝑖
)] ∀𝑖 = 1,2,…,𝑚
𝑥𝑗 ≥ 0 ∀𝑗 = 1,2,…,𝑛(45)
4.2. Robust Optimization (RO)In this section, with respect to the modern achievements in the field of RO, the definitions of the
set-induced RO approach for the box polyhedral uncertainty set are presented. In this kind of RO, the uncertain parameters are changed in a specified uncertainty set, and the model attempts for those feasible solutions that protect the investigated system for the whole possible realizations from uncertainty set (Ben-Tal and Nemirovski, A., 2000). The main features of this kind of RO approach are 1) The independence of the statistical distribution of uncertain parameters, 2) maximum robustness of feasibility, 3) highly conservative and risk-averse, 4) providing the maximum degree of confidence.

22
4.2.1. Robust Mixed Integer Linear Optimization (MILP) Regularly, consider the subsequent MILP problem
max ∑𝑚
𝑐𝑚𝑥𝑚 + ∑𝑘
𝑑𝑘𝑦𝑘
S.t.:
∑𝑚
𝑎𝑖𝑚𝑥𝑚 + ∑𝑘
𝑏𝑖𝑘𝑦𝑘 ≤ 𝑝𝑖 ∀𝑖
(46)In this model, the continuous and integer decision variables are presented by and , 𝑥 𝑦
respectively, and , , exhibit uncertain parameters. With respect to the th constraint of this 𝑎𝑖𝑚 𝑏𝑖𝑗 𝑝𝑖 𝑖model, these uncertain parameters can be defined as follows (Ben-Tal and Nemirovski, A., 2000; Bertsimas et al., 2012):
𝑎𝑖𝑚 = 𝑎𝑖𝑚 + 𝜉𝑖𝑚𝑎𝑖𝑚 ∀𝑚 ∈ 𝑀𝑖
(47)𝑏𝑖𝑘 = 𝑏𝑖𝑘 + 𝜉𝑖𝑘𝑏𝑖𝑘 ∀𝑘 ∈ 𝐾𝑖
(48)𝑝𝑖 = 𝑝𝑖 + 𝜉𝑖0𝑝𝑖
(49)where and exhibit the subsets that involve the continuous and integer decision variable indices 𝑀𝑖 𝐾𝑖
whose equivalent technological coefficients and right-hand sides (RHSs) are susceptible to uncertainty, respectively; the nominal value of them are represented by , and ; the positive 𝑎𝑖𝑚 𝑏𝑖𝑘 𝑝𝑖
constant perturbations are represented by , and ; and the random variables which are 𝑎𝑖𝑚 𝑏𝑖𝑘 𝑝𝑖
susceptible to uncertainty are represented by , and . With respect to the above-mentioned 𝜉𝑖𝑚 𝜉𝑖𝑘 𝜉𝑖0
description, Eq. (46) can be reformulated as follows (Ben-Tal and Nemirovski, A., 2000):
∑𝑚 ∉ 𝑀𝑖
𝑎𝑖𝑚𝑥𝑚 + ∑𝑘 ∉ 𝐾𝑖
𝑏𝑖𝑘𝑦𝑘 + ∑𝑚 ∈ 𝑀𝑖
𝑎𝑖𝑚𝑥𝑚 + ∑𝑘 ∈ 𝐾𝑖
𝑏𝑖𝑘𝑦𝑘 ≤ 𝑝𝑖
(50)
In what follows, by classifying the uncertain parts, Eq. (50) can be rewritten as follows:
∑𝑚
𝑎𝑖𝑚𝑥𝑚 + ∑𝑘
𝑏𝑖𝑘𝑦𝑘 + { ― 𝜉𝑖0𝑝𝑖 + ∑𝑚 ∈ 𝑀𝑖
𝜉𝑖𝑚𝑎𝑖𝑚𝑥𝑚 + ∑𝑘 ∈ 𝐾𝑖
𝜉𝑖𝑘𝑏𝑖𝑘𝑦𝑘} ≤ 𝑝𝑖
(51)With regard to a predetermined uncertainty set for ; the objective function attempts 𝑈 𝜉 = {𝜉𝑖0,𝜉𝑖𝑚,𝜉𝑖𝑘}solutions that stay feasible for each , in an attempt to protect against infeasibility, that is to say: 𝜉
∑𝑚
𝑎𝑖𝑚𝑥𝑚 + ∑𝑘
𝑏𝑖𝑘𝑦𝑘 + max𝜉 ∈ 𝑈 { ― 𝜉𝑖0𝑝𝑖 + ∑
𝑚 ∈ 𝑀𝑖
𝜉𝑖𝑚𝑎𝑖𝑚𝑥𝑚 + ∑𝑘 ∈ 𝐾𝑖
𝜉𝑖𝑘𝑏𝑖𝑘𝑦𝑘} ≤ 𝑝𝑖
(52)

23
Afterward, by substituting Eq. (52) for the original MILP problem, the set induced robust counterpart of Eq. (46) is as follows (Zhang et al., 2016):
max ∑𝑚
𝑐𝑚𝑥𝑚 + ∑𝑘
𝑑𝑘𝑦𝑘
S.t.:
∑𝑚
𝑎𝑖𝑚𝑥𝑚 + ∑𝑘
𝑏𝑖𝑘𝑦𝑘 + max𝜉 ∈ 𝑈 { ― 𝜉𝑖0𝑝𝑖 + ∑
𝑚 ∈ 𝑀𝑖
𝜉𝑖𝑚𝑎𝑖𝑚𝑥𝑚 + ∑𝑘 ∈ 𝐾𝑖
𝜉𝑖𝑘𝑏𝑖𝑘𝑦𝑘} ≤ 𝑝𝑖
(53)It is worth noting that the formulation (53) pertains to the type of uncertainty set . 𝑈
4.2.2. Uncertainty SetsIn this section, the definitions of box, polyhedral and box polyhedral uncertainty sets are
described. For simplicity's sake, we remove the index of constraint in the random vector . 𝑖 𝜉
Definition 5. The box uncertainty set can be defined utilizing the -norm of the vector of uncertain ∞data as follows (Ben-Tal and Nemirovski, A., 2000):
𝑈∞ = {𝜉|‖𝜉‖∞ ≤ Ψ} = {𝜉||𝜉𝑗| ≤ Ψ,∀𝑗 ∈ 𝐽𝑖}(54)
In Eq. (54), with the intention of regulating the size of uncertainty set, the adjustable parameter (Ψ)is considered. In the sequel, the configuration of box uncertainty set for the parameter is depicted 𝑎𝑗
in Fig 4. If the uncertain parameters can be recognized to be bounded in specified intervals 𝑎𝑖𝑗 ∈, next, it can be described by and this derives in the interval [𝑎𝑖𝑗 ― 𝑎𝑖𝑗,𝑎𝑖𝑗 + 𝑎𝑖𝑗] ∀𝑗 ∈ 𝐽𝑖 𝑎𝑖𝑗 = 𝑎𝑖𝑗 + 𝜉𝑗𝑎𝑖𝑗
uncertainty set, which is a particular state of box uncertainty set, when (i.e., Ψ = 1 𝑈∞ =).{𝜉||𝜉𝑗| ≤ 1,∀𝑗 ∈ 𝐽𝑖}
Fig. 4. Configuration of box uncertainty set.
Definition 6. The polyhedral uncertainty set can be defined utilizing the 1-norm of the vector of uncertain data as depicted in Fig. 5 (Ben-Tal and Nemirovski, A., 2000),
𝑈1 = {𝜉|‖𝜉‖1 ≤ Γ} = {𝜉|∑𝑗 ∈ 𝐽𝑖
|𝜉𝑗| ≤ Γ, ∀𝑗 ∈ 𝐽𝑖}(55)
24
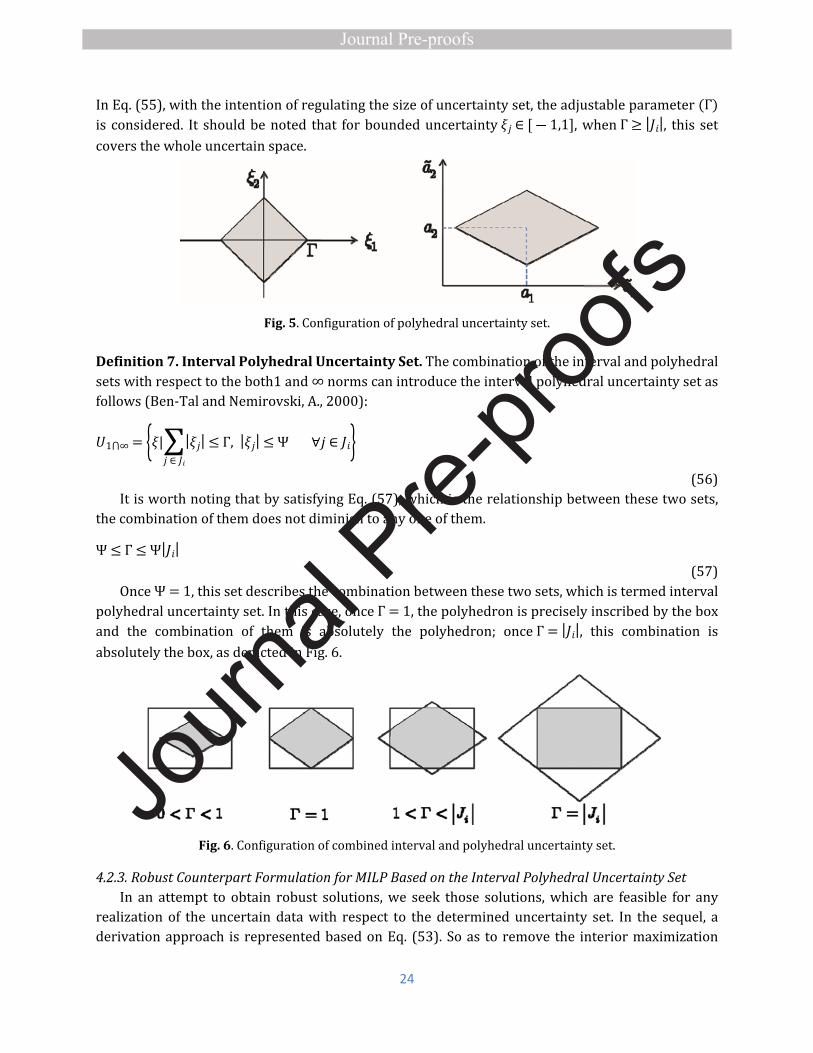
In Eq. (55), with the intention of regulating the size of uncertainty set, the adjustable parameter (Γ)is considered. It should be noted that for bounded uncertainty , when , this set 𝜉𝑗 ∈ [ ― 1,1] Γ ≥ |𝐽𝑖|covers the whole uncertain space.
Fig. 5. Configuration of polyhedral uncertainty set.
Definition 7. Interval Polyhedral Uncertainty Set. The combination of the interval and polyhedral sets with respect to the both1 and norms can introduce the interval polyhedral uncertainty set as ∞ follows (Ben-Tal and Nemirovski, A., 2000):
𝑈1⋂∞ = {𝜉|∑𝑗 ∈ 𝐽𝑖
|𝜉𝑗| ≤ Γ, |𝜉𝑗| ≤ Ψ ∀𝑗 ∈ 𝐽𝑖}(56)
It is worth noting that by satisfying Eq. (57), which is the relationship between these two sets, the combination of them does not diminish to any one of them.
Ψ ≤ Γ ≤ Ψ|𝐽𝑖|(57)
Once , this set describes the combination between these two sets, which is termed interval Ψ = 1polyhedral uncertainty set. In this case, once , the polyhedron is precisely inscribed by the box Γ = 1and the combination of them is absolutely the polyhedron; once , this combination is Γ = |𝐽𝑖|absolutely the box, as depicted in Fig. 6.
Fig. 6. Configuration of combined interval and polyhedral uncertainty set.
4.2.3. Robust Counterpart Formulation for MILP Based on the Interval Polyhedral Uncertainty Set In an attempt to obtain robust solutions, we seek those solutions, which are feasible for any
realization of the uncertain data with respect to the determined uncertainty set. In the sequel, a derivation approach is represented based on Eq. (53). So as to remove the interior maximization
25
function in the th constraint of Eq. (53), it is transformed into its conic dual, next the dual problem 𝑖is incorporated into the original constraint. What is more by defining an auxiliary variable , and 𝑥0
extra constraint , the initial th constraint of Eq. (53) can be rewritten as follows (Ben-Tal and 𝑥0 = ―1 𝑖Nemirovski, A., 2000; Zhang et al., 2016):
𝑝𝑖𝑥0 + ∑𝑚
𝑎𝑖𝑚𝑥𝑚 + ∑𝑘
𝑏𝑖𝑘𝑦𝑘 + max𝜉 ∈ 𝑈 {𝜉𝑖0𝑝𝑖𝑥0 + ∑
𝑚 ∈ 𝑀𝑖
𝜉𝑖𝑚𝑎𝑖𝑚𝑥𝑚 + ∑𝑘 ∈ 𝐾𝑖
𝜉𝑖𝑘𝑏𝑖𝑘𝑦𝑘} ≤ 0
(58)where , , , and 𝜉𝑖 = [𝜉𝑖0;{𝜉𝑖𝑚};{𝜉𝑖𝑘}] 𝐴𝑖 = [𝑝𝑖;{𝑎𝑖𝑚};{𝑏𝑖𝑘}] 𝐴𝑖 = [𝑝𝑖;{𝑎𝑖𝑚};{𝑏𝑖𝑘}] 𝑋 = [𝑥0;{𝑥𝑚};{𝑦𝑘}] 𝑗 ∈ 𝐽𝑖
, so Eq. (58) can be rewritten as follows:= {0} ∪ 𝑀𝑖 ∪ 𝐾𝑖
∑𝑗
𝐴𝑖𝑗𝑋𝑗 + max𝜉𝑖 ∈ 𝑈 {∑
𝑗 ∈ 𝐽𝑖
𝜉𝑖𝑗𝐴𝑖𝑗𝑋𝑗} ≤ 0
(59)With respect to the above-mentioned description and removing the maximization function of Eq.
(59), if the uncertainty set is considered as Eq. (56) with = 1, the equivalent robust counterpart 𝑈 ΨEq. (59) is as follows:
∑𝑚
𝑎𝑖𝑚𝑥𝑚 + ∑𝑘
𝑏𝑖𝑘𝑦𝑘 + [𝑧𝑖Γ𝑖 + ∑𝑚 ∈ 𝑀𝑖
𝑤𝑖𝑚 + ∑𝑘 ∈ 𝐾𝑖
𝑤𝑖𝑘 + 𝑤𝑖0] ≤ 𝑝𝑖
𝑧𝑖 + 𝑤𝑖𝑚 ≥ 𝑎𝑖𝑚|𝑥𝑚| ∀𝑚 ∈ 𝑀𝑖
𝑧𝑖 + 𝑤𝑖𝑘 ≥ 𝑏𝑖𝑘|𝑦𝑘| ∀𝑘 ∈ 𝐾𝑖
𝑧𝑖 + 𝑤𝑖0 ≥ 𝑝𝑖 (60)
It should be noted that when the decision variables are positive, the absolute operator can be straightly eliminated. If not, the Eq. (60) can be rewritten as follows:
∑𝑚
𝑎𝑖𝑚𝑥𝑚 + ∑𝑘
𝑏𝑖𝑘𝑦𝑘 + [𝑧𝑖Γ𝑖 + ∑𝑚 ∈ 𝑀𝑖
𝑤𝑖𝑚 + ∑𝑘 ∈ 𝐾𝑖
𝑤𝑖𝑘 + 𝑤𝑖0] ≤ 𝑝𝑖
𝑧𝑖 + 𝑤𝑖𝑚 ≥ 𝑎𝑖𝑚𝑢𝑚 ∀𝑚 ∈ 𝑀𝑖
𝑧𝑖 + 𝑤𝑖𝑘 ≥ 𝑏𝑖𝑘𝑣𝑘 ∀𝑘 ∈ 𝐾𝑖
𝑧𝑖 + 𝑤𝑖0 ≥ 𝑝𝑖 ― 𝑢𝑚 ≤ 𝑥𝑚 ≤ 𝑢𝑚 ∀𝑚 ∈ 𝑀𝑖― 𝑣𝑘 ≤ 𝑦𝑘 ≤ 𝑣𝑘 ∀𝑘 ∈ 𝐾𝑖
(61)5. Robust neutrosophic model
This section aims to develop the proposed deterministic HLN model to a robust neutrosophic counterpart model in which demand, costs, transportation time, the capacity of supply, the percentage of injured people who should be dispatched from the emergency center to hospital and capacity of facilities are uncertain. Based on the above-mentioned descriptions, the robust neutrosophic is conducted to the objective functions and uncertain constraints.
5.1. Objective functions

26
There are nine, three, and two uncertain coefficients in the first, second, and third objective functions, respectively, by utilizing model (45) it is transformed to the following neutrosophic counterpart objective functions:
min 𝑧1 = ∑𝑘𝜖𝐾
[(𝑐𝑤𝑘1 + 𝑐𝑤𝑘4 ― 3(𝑐𝑤𝑘2 + 𝑐𝑤𝑘3)2 ) + (𝑇𝑐𝑤𝑘 ― 𝐼𝑐𝑤𝑘 ― 𝐹𝑐𝑤𝑘)]𝑤𝑘 + ∑
𝑗𝜖𝐽[(𝑓𝑗1 + 𝑓𝑗4 ― 3(𝑓𝑗2 + 𝑓𝑗3)
2 ) + (𝑇𝑓𝑗 ― 𝐼𝑓𝑗 ― 𝐹𝑓𝑗)] 𝑍𝑗
+ ∑𝑛𝜖𝑁
[(𝑐𝑓𝑛1 + 𝑐𝑓𝑛4 ― 3(𝑐𝑓𝑛2 + 𝑐𝑓𝑛3)2 ) + (𝑇𝑐𝑓𝑛 ― 𝐼𝑐𝑓𝑛 ― 𝐹𝑐𝑓𝑛
)]𝜑𝑛
+ ∑𝑖𝜖𝐼
∑𝑛𝜖𝑁
[(𝑐𝑡1𝑖𝑛1 + 𝑐𝑡1𝑖𝑛4 ― 3(𝑐𝑡1𝑖𝑛2 + 𝑐𝑡1𝑖𝑛3)2 ) + (𝑇𝑐𝑡1𝑖𝑛 ― 𝐼𝑐𝑡1𝑖𝑛 ― 𝐹𝑐𝑡1𝑖𝑛
)]𝑓𝑥𝑖𝑛
+ ∑𝑛𝜖𝑁
∑ℎ𝜖𝐻
[(𝑐𝑡2𝑛ℎ1 + 𝑐𝑡2𝑛ℎ4 ― 3(𝑐𝑡2𝑛ℎ2 + 𝑐𝑡2𝑛ℎ3)2 ) + (𝑇𝑐𝑡2𝑛ℎ ― 𝐼𝑐𝑡2𝑛ℎ ― 𝐹𝑐𝑡2𝑛ℎ
)]𝑚𝑥𝑛ℎ
+ ∑𝑖𝜖𝐼
∑ℎ𝜖𝐻
[(𝑐𝑡3𝑖ℎ1 + 𝑐𝑡3𝑖ℎ4 ― 3(𝑐𝑡3𝑖ℎ2 + 𝑐𝑡3𝑖ℎ3)2 ) + (𝑇𝑐𝑡3𝑖ℎ ― 𝐼𝑐𝑡3𝑖ℎ ― 𝐹𝑐𝑡3𝑖ℎ
)]ℎ𝑥𝑖ℎ
+ ∑𝑗𝜖𝐽 ∪ 𝐸
∑𝑘𝜖𝐾
[(𝑐𝑢𝑘𝑗1 + 𝑐𝑢𝑘𝑗4 ― 3(𝑐𝑢𝑘𝑗2 + 𝑐𝑢𝑘𝑗3)2 ) + (𝑇𝑐𝑢𝑘𝑗 ― 𝐼𝑐𝑢𝑘𝑗 ― 𝐹𝑐𝑢𝑘𝑗)]𝑢𝑘𝑗
+ ∑𝑖𝜖𝐼
∑𝑗𝜖𝐽 ∪ 𝐸
𝐽 + 1
∑𝑟 = 1
[(𝑐𝑞𝑖𝑗1 + 𝑐𝑞𝑖𝑗4 ― 3(𝑐𝑞𝑖𝑗2 + 𝑐𝑞𝑖𝑗3)2 ) + (𝑇𝑐𝑞𝑖𝑗 ― 𝐼𝑐𝑞𝑖𝑗 ― 𝐹𝑐𝑞𝑖𝑗)]𝑃𝑖𝑗𝑟𝑦𝑗𝑖𝑟
+ ∑𝑗𝜖𝑀
∑𝑖𝜖𝑀
∑𝑣𝜖𝑉
𝐽 + 1
∑𝑟 = 1
[(𝑓𝑣𝑣1 + 𝑓𝑣𝑣4 ― 3(𝑓𝑣𝑣2 + 𝑓𝑣𝑣3)2 ) + (𝑇𝑓𝑣𝑣 ― 𝐼𝑓𝑣𝑣 ― 𝐹𝑓𝑣𝑣
)]𝑑𝑖𝑠𝑗𝑖 𝑣𝑟𝑗𝑖𝑣𝑟
(62)min 𝑧2
= ∑𝑖𝜖𝑀
∑𝑗𝜖𝑀
∑𝑣𝜖𝑉
𝐽 + 1
∑𝑟 = 1
𝑑𝑖𝑠𝑗𝑖 𝑣𝑟𝑗𝑖𝑣𝑟
𝛿𝑣+ ∑
𝑖𝜖𝐼∑𝑛𝜖𝑁
∑ℎ𝜖𝐻([(𝜏1𝑖𝑛1 + 𝜏1𝑖𝑛4 ― 3(𝜏1𝑖𝑛2 + 𝜏1𝑖𝑛3)
2 ) + (𝑇𝜏1𝑖𝑛 ― 𝐼𝜏1𝑖𝑛 ― 𝐹𝜏1𝑖𝑛)]𝑓𝑥𝑖𝑛
𝛾
+[(𝜏2𝑛ℎ1 + 𝜏2𝑛ℎ4 ― 3(𝜏2𝑛ℎ2 + 𝜏2𝑛ℎ3)
2 ) + (𝑇𝜏2𝑛ℎ ― 𝐼𝜏2𝑛ℎ ― 𝐹𝜏2𝑛ℎ)]𝑚𝑥𝑛ℎ
𝛾
+[(𝜏3𝑖ℎ1 + 𝜏3𝑖ℎ4 ― 3(𝜏3𝑖ℎ2 + 𝜏3𝑖ℎ3)
2 ) + (𝑇𝜏3𝑖ℎ ― 𝐼𝜏3𝑖ℎ ― 𝐹𝜏3𝑖ℎ)]ℎ𝑥𝑖ℎ
𝛾 ) (63)
min 𝑧3 = arg 𝑚𝑎𝑥𝑗𝜖𝐽 ∪ 𝐸 {∑
𝑖𝜖𝑀∑𝑗𝜖𝑀
∑𝑣𝜖𝑉
𝐽 + 1
∑𝑟 = 1
[(𝑓𝑣𝑣1 + 𝑓𝑣𝑣4 ― 3(𝑓𝑣𝑣2 + 𝑓𝑣𝑣3)2 ) + (𝑇𝑓𝑣𝑣 ― 𝐼𝑓𝑣𝑣 ― 𝐹𝑓𝑣𝑣
)] 𝑑𝑖𝑠𝑗𝑖 𝑣𝑟𝑗𝑖𝑣𝑟}― arg 𝑚𝑖𝑛
𝑗𝜖𝐽 ∪ 𝐸 {∑𝑖𝜖𝑀
∑𝑗𝜖𝑀
∑𝑣𝜖𝑉
𝐽 + 1
∑𝑟 = 1
[(𝑓𝑣𝑣1 + 𝑓𝑣𝑣4 ― 3(𝑓𝑣𝑣2 + 𝑓𝑣𝑣3)2 ) + (𝑇𝑓𝑣𝑣 ― 𝐼𝑓𝑣𝑣 ― 𝐹𝑓𝑣𝑣
)] 𝑑𝑖𝑠𝑖𝑙 𝑣𝑟𝑗𝑖𝑣𝑟}(64)
5.2. Constraints There are thirteen uncertain coefficients in the constraints, including technological coefficients
and RHSs, by utilizing model (60), they are transformed to the following robust counterpart constraints. Since the decision variables of the proposed model are positive, the absolute value operator can be directly removed.
∑𝑛𝜖𝑁
𝑓𝑥𝑖𝑛 + ∑ℎ𝜖𝐻
ℎ𝑥𝑖ℎ + [𝑧1𝑖 Γ𝑖 + 𝑤1
𝑖 ] ≤ 𝑤𝑑𝑖 ∀ 𝑖𝜖𝐼

27
𝑧1𝑖 + 𝑤1
𝑖 ≥ 𝑤𝑑𝑖 ∀ 𝑖𝜖𝐼
∑𝑛𝜖𝑁
𝑓𝑥𝑖𝑛 + ∑ℎ𝜖𝐻
ℎ𝑥𝑖ℎ ― [𝑧1𝑖 Γ𝑖 + 𝑤1
𝑖 ] ≥ 𝑤𝑑𝑖 ∀ 𝑖𝜖𝐼
𝑧1𝑖 + 𝑤1
𝑖 ≤ 𝑤𝑑𝑖 ∀ 𝑖𝜖𝐼(65)
∑ℎ𝜖𝐻
𝑚𝑥𝑛ℎ ― 𝜇.∑𝑖𝜖𝐼
𝑓𝑥𝑖𝑛 + [𝑧1𝑛Γ1
𝑛 + 𝑤𝜇] ≤ 0 ∀ 𝑛𝜖𝑁
𝑧1𝑛 + 𝑤𝜇 ≥ 𝜇 𝑓𝑥𝑖𝑛 ∀𝑖 ∈ 𝐼,𝑛 ∈ 𝑁
(66)
∑𝑖𝜖𝐼
𝑓𝑥𝑖𝑛 ― 𝒞𝒜𝐸𝑛 𝜑𝑛 + [𝑧2𝑛Γ2
𝑛 + 𝑤𝑛] ≤ 0 ∀ 𝑛𝜖𝑁
𝑧2𝑛 + 𝑤𝑛 ≥ 𝒞𝒜𝐸𝑛𝜑𝑛 ∀ 𝑛𝜖𝑁
(67)
∑𝑖𝜖𝐼
ℎ𝑥𝑖ℎ + ∑𝑛𝜖𝑁
𝑚𝑥𝑛ℎ + [𝑧ℎΓℎ + 𝑤ℎ] ≤ 𝒞𝒜𝐻ℎ ∀ℎ ∈ 𝐻
𝑧ℎ + 𝑤ℎ ≥ 𝒞𝒜𝐻ℎ ∀ℎ ∈ 𝐻(68)
∑𝑗𝜖𝐽 ∪ 𝐸
𝑢𝑘𝑗 ― 𝒞𝒜𝒮𝑘 𝑤𝑘 + [𝑧𝑘Γ𝑘 + 𝑤𝑘] ≤ 0 ∀ 𝑘𝜖𝐾
𝑧𝑘 + 𝑤𝑘 ≥ 𝒞𝒜𝒮𝑘𝑤𝑘 ∀ 𝑘𝜖𝐾 (69)
𝑇𝑗𝑖 ― 𝑇𝑚𝑎𝑥𝑗
𝐽 + 1
∑𝑟 = 1
𝑦𝑗𝑖𝑟 + [𝑧𝑗𝑖Γ𝑗𝑖 +𝐽 + 1
∑𝑟 = 1
𝑤𝑗𝑖𝑟] ≤ 0 ∀ 𝑗𝜖 𝐽 ∪ 𝐸 , 𝑖𝜖𝐼
𝑧𝑗𝑖 + 𝑤𝑗𝑖𝑟 ≥ 𝑇𝑚𝑎𝑥𝑗 𝑦𝑗𝑖𝑟 ∀ 𝑗𝜖 𝐽 ∪ 𝐸 , 𝑖𝜖𝐼, ∀𝑟
(70)
∑𝑖𝜖𝐼
𝑇𝑗𝑖 ― 𝑇𝑚𝑎𝑥𝑗 𝑍𝑗 + [𝑧𝑗Γ𝑗 + 𝑤𝑗] ≤ 0 ∀ 𝑗𝜖𝐽
𝑧𝑗 + 𝑤𝑗 ≥ 𝑇𝑚𝑎𝑥𝑗 𝑍𝑗 ∀ 𝑗𝜖𝐽
(71)𝑔𝑑𝑖 + [𝑧2
𝑖 Γ𝑖 + 𝑤2𝑖 ] ≤ 𝑑𝑖 ∀ 𝑖𝜖𝐼
𝑧2𝑖 + 𝑤2
𝑖 ≥ 𝑑𝑖 ∀ 𝑖𝜖𝐼(72)
𝑔𝑑𝑖
𝑑𝑖―
𝑔𝑑𝑙
𝑑𝑙 . 𝜌 + [𝑧1
𝑖𝑙Γ𝑖𝑙 + 𝑤3𝑖 + 𝑤1
𝑙 ] ≤ 0
𝑧1𝑖𝑙 + 𝑤3
𝑖 ≥𝑔𝑑𝑖
𝑑𝑖 ∀ 𝑖 , 𝑙𝜖 𝐼 , 𝑖 ≠ 𝑙
𝑧1𝑖𝑙 + 𝑤1
𝑙 ≥𝑔𝑑𝑙
𝑑𝑙 ∀ 𝑖 , 𝑙𝜖 𝐼 , 𝑖 ≠ 𝑙
(73)𝑔𝑑𝑖
𝑑𝑖―
𝑔𝑑𝑙
𝑑𝑙+ [𝑧2
𝑖𝑙Γ𝑖𝑙 + 𝑤4𝑖 + 𝑤2
𝑙 ] ≤ (2 ―𝐽 + 1
∑𝑟 = 1
𝑦𝑗𝑖𝑟 ―𝐽 + 1
∑𝑟 = 1
𝑦𝑗𝑙𝑟) ∀ 𝑖 , 𝑙𝜖 𝐼 , 𝑖 ≠ 𝑙 , 𝑗𝜖𝐽 ∪ 𝐸
𝑧2𝑖𝑙 + 𝑤4
𝑖 ≥𝑔𝑑𝑖
𝑑𝑖 ∀ 𝑖 , 𝑙𝜖 𝐼 , 𝑖 ≠ 𝑙
𝑧2𝑖𝑙 + 𝑤2
𝑙 ≥𝑔𝑑𝑙
𝑑𝑙 ∀ 𝑖 , 𝑙𝜖 𝐼 , 𝑖 ≠ 𝑙
(74)

28
∑𝑗𝜖𝑀
∑𝑖𝜖𝐼
𝐽 + 1
∑𝑟 = 1
𝑑𝑖 𝑣𝑟𝑗𝑖𝑣𝑟 + [𝑧𝑣Γ𝑣 + ∑𝑗𝜖𝑀
∑𝑖𝜖𝐼
𝐽 + 1
∑𝑟 = 1
𝑤𝑗𝑖𝑣𝑟] ≤ 𝒞𝒜𝒱𝑣 ∀ 𝑣𝜖𝑉
𝑧𝑣 + 𝑤𝑗𝑖𝑣𝑟 ≥ 𝑑𝑖𝑣𝑟𝑗𝑖𝑣𝑟 ∀ 𝑗𝜖𝐽, 𝑖 ∈ 𝐼,∀𝑟,∀ 𝑣𝜖𝑉 (75)
6. Multi-objective solution approach
In a multi-objective optimization problem, DMs are typically encountered with Pareto-optimal solutions instead of optimal solution(s), and the solution space should be explored to find them. As a matter of fact, if a solution cannot enhance any objective function without diminishing at least one other objective function, it is termed a Pareto optimal solution (Mavrotas, 2009). Subsequently, these solutions establish the Pareto front whence DMs can select final favored compromise solution. There is a broad range of approaches in the literature to solve a multi-objective optimization problem. One of the efficient approaches among them is AUGMECON2, which was proposed by (Mavrotas and Florios, 2013). Indeed, it is an improved version of the -constraint method, in which one of the 𝜀objective functions (typically the objective with utmost priority) is optimized while the other ones are considered in terms of constraints as follows:
max (𝑓1(𝑥) + 𝑒𝑝𝑠 × (𝑠2
𝑟2+ 10 ―1 ×
𝑠3
𝑟3+ … + 10 ―(𝑝 ― 2) ×
𝑠𝑝
𝑟𝑝))S.t.:
𝑓𝑘(𝑥) ― 𝑠𝑘 = 𝑒𝑘 𝑘 = 2,3,…,𝑝; 𝑥 ∈ 𝑆; 𝑠𝑘 ∈ 𝑅 +
(76)where , and are the solution space, decision vector and objective function, respectively. 𝑆 𝑥 𝑓𝑘(𝑥)
Also, the ranges of objective functions and the RHS values of these objectives are signified by 𝑟2,𝑟3,…,and ; respectively. Moreover, a sufficiently small number, which is typically between and𝑟𝑝 𝑒𝑘 10 ―3
, and a surplus variable are indicated by and , respectively. Ehrgott and Wiecek (2005) 10 ―6 𝑒𝑝𝑠 𝑠𝑘
articulated that the optimal solution of the model (76) can be efficient if each of objective (𝑝 ― 1)functions’ constraints is mandatory i.e., . In the primary -constraint (𝑠𝑘 = 0 for 𝑘 = 2,3,…,𝑝) 𝜀approach, the entire of objective functions are classified to specified equal intervals and the optimization model is solved utilizing the whole compounds of RHS values. Although an acceleration scheme was considered in AUGMECON2, so as to extrude those combinations that produce infeasible or weakly efficient solutions.
In what follows, Mousazadeh et al., (2018) proposed a modified AUGMECON2, in which a Tabu list that contains some combinations of RHS values is considered. Although, this list at the initialization stage is empty, it is gradually updated after solving the model using each combination of RHS values to improve the acceleration of AUGMECON2. As a result, the model is solved utilizing a specified compound, except that one exists on the Tabu list. The major superiority of this version that of other acceleration approaches is that this method is not concentrated merely on interior loop combinations, and surcharges some exterior loop ones to the Tabu list in each iteration. This modification outstandingly decreases the number of combinations required to be solved in order to achieve all the efficient Pareto optimal solutions. Because of the aforementioned reasons, this method is employed to solve the proposed optimization model.

29
7. Case study The Kermanshah province earthquake in the western region of Iran occurred in 2017, with a
magnitude of 7.3 on the Richter scale at the border region of Ezgeleh that killed about 1,000 people and left 10,000 injured and 70,000 homeless (Ahmadi and Bazargan-Hejazi, 2018; Hosseini et al., 2019). It was the deadliest earthquake in the world in 2017 that was felt in most of the western provinces of Iran and Iraq. It should be noted that this earthquake has had more than 1000 aftershocks so far, with 45 aftershocks ranging between 4 and 6.5 on the Richter scale, causing more severe damage in some areas (Ahmadi and Bazargan-Hejazi, 2018). In this case study, Kermanshah Red Crescent Center and the other ones in different provinces have been employed to assist disaster regions to provide them with basic supplies. In this regard, the air fleet has been used to expedite the transportation of shipment of relief items from other provinces, and these items have been stored in airport warehouses, and after that, they have been distributed to various disaster regions.
Hence, in this case study, Kermanshah Red Crescent Center and Kermanshah airport are considered as potential suppliers. Also, ten disaster regions between Sarpol-e Zahub and eslamabad-e gharb cities are considered to plan relief operations, due to the fact that they were available in the early hours of the crisis. In an attempt to coordinate and facilitate the distribution of relief items among disaster regions, distribution centers should be established as intermediaries to receive these items from suppliers and then send them to the disaster regions. Subsequently, Sarpol-e Zahub Red Crescent Center and Central Mosque, and eslamabad-e gharb Red Crescent Center are considered as potential distribution centers, such that these centers can distribute the relief items by trucks. Because of aftershocks, there is a possibility of failure of each distribution center, so Kerend-e gharb Red Crescent Center is considered as the emergency distribution center, which could provide required services to disaster units assigned to the disrupted distribution centers. As a matter of fact, the emergency centers would be established in near disaster regions to provide primary treatment for injured people. Additionally, there are two specialized hospitals, including Emam Reza and Bisotun to provide necessitated services for injured people. The main information on issues such as the capacities of facilities, the opening costs of potential facilities, demand of disaster units and failure probabilities of distribution centers are shown in Tables 2 to 5. Also, the proposed model was solved using GAMS software, version 23.6.2 by using the BARON optimization solver in a PC with core i3, 2.1 GHz CPU and 4 GB RAM for both deterministic and an uncertain condition. Moreover, the variation domain/perturbation level and budget parameter . In order to determine the (𝑎𝑖𝑗 = 15%) (𝛤𝑖 = 99%)values of two significant parameters in RO, including perturbation and budget, if there is much lack of information, the higher values should be considered for them. This is especially important in relation to the perturbation level since it considers the dispersion in estimating the uncertain parameters. In the case study, the earthquake happened and investigated in the past, and the information about the uncertain parameters has a relatively good estimate, so the perturbation level is considered lower. However, if the model is employed immediately after a crisis, this parameter should be considered at a high level due to the lack of information. Regarding the budget parameter, since the current problem belongs to disaster relief, it is better to consider this parameter at the highest possible level to prevent the repercussions due to the unsuitable estimation of uncertain parameters.

30
Fig 7. A demonstration of distributing and evacuating operations under deterministic state
Table 2. Parameters related to suppliers Potential suppliers Constant setting up cost of supplier ($)𝒄𝒘𝒌 Capacity of supplier 𝓒𝓐𝓢𝒌
Kermanshah Red Crescent Center 20000 =< [17500,19850,20100,21150],(1, 0.5, 0.2) > 10000
Kermanshah airport 22000 =< [19500,20150,22100,22300],(1, 0.5, 0.2) > 8000
Table 3. Parameters related to distribution centers
Distribution centers
Probability of failure of
distribution center 𝒒𝒋
Constant opening cost of distribution center 𝒇𝒋
Maximum supply capacity of
distribution center 𝑻𝒎𝒂𝒙
𝒋
Sarpol-e Zahub Red Crescent
Center0 8000 =< [6500,7100,8150,8250],(1, 0.5, 0.2) > 4000
Sarpol-e Zahub Central Mosque
0.8 5000 =< [4580,4800,5200,5400],(1, 0.5, 0.2) > 3500
eslamabad-e gharb Red Crescent
Center
0.9 7000 =< [6500,6800,7200,7500],(1, 0.5, 0.2) > 4000
Table 4. Parameters related to emergency centers

31
Emergency centers Constant opening cost of emergency center ($)𝒄𝒇𝒏
Capacity of emergency center
𝓒𝓐𝑬𝒏𝑬1 12000 =< [10400,11100,12250,12600],(1, 0.5, 0.2) > 50𝑬2 15000 =< [13500,14000,15300,15800],(1, 0.5, 0.2) > 55𝑬3 11000 =< [9800,10500,11600,12300],(1, 0.5, 0.2) > 45
Table 5. Parameters related to disaster units
Disaster units Demand of disaster unit 𝒅𝒊 Number of injuries 𝒘𝒅𝒊
Piran 910 15Ban Zardeh 860 14
Kerkere 845 11Sarable 1000 13
Tut Shami 870 14Hereer 800 13Naylak 916 10Vahdat 980 12
Kuzaran 832 11Gahvareh 900 10
Fig. 7 demonstrates the solution of problem-solving in the deterministic state. As can be seen in this figure, only Kermanshah Red Crescent Center is selected as a supplier. Also, among three potential distribution centers, Sarpol-e Zahub Red Crescent Center and eslamabad-e gharb Red Crescent Center are established. As it is noticeable, truck 2 is assigned to the eslamabad-e gharb Red Crescent Center such that this truck is responsible for distributing relief items to Gahvareh, Kuzaran and Vahdat disaster units. Moreover, the other disaster units are assigned to the Sarpol-e Zahub Red Crescent Center at the first level of assignment, but due to the aftershocks, it cannot serve them.
As a result, these disaster units are assigned to the Kerend-e gharb Red Crescent Center at the next assignment level as the emergency center, and relief items are distributed among disaster units by trucks 1 and 3. The route of each truck is shown in different colors. Furthermore, the first and second emergency centers are established, and the injured people of Sarable, Ban Zardeh, Tut Shami and Hereer disaster units are dispatched to emergency center 1 to receive primary treatment, and then dispatched to Emam Reza hospital, but the injured people of Piran and Kuzaran disaster units are directly dispatched to Emam Reza hospital. Likewise, the injured people of Kerkere, Naylak, and Vahdat are dispatched to emergency center 2 to receive primary treatment, and then dispatched to Bisotun hospital, but the injured people of Gahvareh is directly dispatched to Bisotun hospital. In this state, the values of the first to third objective functions are 2561792.3, 166.767 and 306, and the CPU time is 1001 seconds. Also, the number of constraints and variables are 18750 and 4569, respectively.
Fig. 8 demonstrates the solution of problem-solving in an uncertain state. Similar to the deterministic state, only Kermanshah Red Crescent Center is selected as a supplier. But, three potential distribution centers are established. As it is noticeable, at the first assignment level, Gahvareh, Kuzaran, Kerkere and Vahdat disaster units are assigned to the eslamabad-e gharb Red Crescent Center, and truck 3 is responsible for distributing relief items among these units. Similarly, Hereer, Tut Shami and Naylak disaster units are assigned to the Sarpol-e Zahub Red Crescent Center at the first level of assignment, and Sarable, Ban Zardeh and Piran disaster units are assigned to

32
Sarpol-e Zahub Central Mosque at the first level of assignment, but due to the aftershocks, they cannot serve these disaster units.
As a result, these disaster units are assigned to the Kerend-e gharb Red Crescent Center at the next assignment level as the emergency center, and relief items are distributed among disaster units by trucks 1 and 2. The route of each truck is shown in different colors. Moreover, the entire of potential emergency centers are established, and the injured people of Sarable, Piran, Hereer disaster units are dispatched to emergency center 1 to receive primary treatment, and then dispatched to Emam Reza hospital. Likewise, Naylak, Tut Shami and Gahvareh disaster units are dispatched to emergency center 2 to receive primary treatment and then dispatched to Bisotun hospital. Similarly, Kerkere and Vahdat disaster units are dispatched to emergency center 3 to receive primary treatment, and then dispatched to Emam Reza hospital, and the others are directly dispatched to related hospitals, which are shown in Fig 6. In this state, the values of the first to third objective functions are 2632185.87, 197.83 and 324, and the CPU time is 2540 seconds. The obtained results exhibit the validity of the proposed model and solution approach. Needless to say, all the goals of this research have been fulfilled. More importantly, the percentages of satisfied demands for each disaster unit under deterministic and uncertain states are provided in Table 6. Likewise, the number of injured people transported from disaster units to medical centers are presented in Table 7.
Table 6. Percentage of satisfied demands Satisfied demand (%)
Disaster unitsDeterministic state Uncertain state
Piran 0.81 0.61Ban zarde 0.65 0.68Kerkere 0.87 0.85Sarable 0.56 0.79Tut shami 0.79 0.48Hareer 0.90 0.85Naylak 0.95 0.93Vahdat 0.98 0.64Kuzaran 0.87 0.72Gahvareh 0.82 0.91Average 0.82 0.75

33
Fig 8. A demonstration of distributing and evacuating operations under uncertain state
Table 7. The number of injured people transferred to medical centers (Deterministic, Uncertain states)
Medical centersDisaster units/
Emergency centersEmergency
Center 1
Emergency
Center 2
Emergency
Center 3
Emam reza
Hospital
Bisotun
Hospital
Piran - ,15 _ _ 15 , - _
Ban zarde 14 , - _ _ - ,14 _
Kerkere _ 11, - - ,11 _ _
Sarable 13 , 13 _ _ _ _
Tut shami 14 , - - ,14 _ _ _
Hareer 13 , 13 _ _ _ _
Naylak _ 10 , 10 _ _ _
Vahdat _ 12 ,- - ,12 _ _
Kuzaran _ _ _ 11 , - - , 11
Gahvareh _ - ,6 _ - , 4 10 , -
Emergency Center 1 _ _ _ 54 , 41 _
Emergency Center 2 _ _ _ _ 33 , 30
Emergency Center 3 _ _ _ - , 23 _

34
8. Computational results and discussion 8.1. Sensitivity analysis
This section investigates the effectiveness of the recommended robust neutrosophic fuzzy model under uncertain state and compares the performance of it with that of the deterministic model. Firstly, the influences of uncertainty levels on objective functions are investigated via changing the conservatism level of the proposed model and the perturbation level of uncertain parameters. The perturbation domain is supposed to be 15%, 25%, and 35%, while the budget parameter, which represents reliability/conservatism level, is set to 70%, 85%, 99%. The obtained results which are presented in Table 8 manifest that the total cost of the robust neutrosophic model is higher than the deterministic one due to costs incurred for enhancing the stability of HLN. Once the reliability level or perturbation level increases, these trends become more perceptible. For case in a point, an extremely conservative version of the proposed robust neutrosophic model (i.e., perturbation level= 35% and reliability level=99%) under the optimistic attitude provides us solutions and decisions that lead to 42.3% ( higher total cost. 100 × ((568036.145 ― 2561792.3)/2561792.3))
Moreover, these changes are much less for the second and third objective functions such that these increases are 15.6% and 22.5%, which the details of them are provided in Tables 9 and 10. Also, a healthy balance between robustness and its cost can be made under lower levels of uncertainty with the intention of enhancing the reliability of the solutions alongside a more sensible cost. Furthermore, the trends of computational time are provided in Table 11. Since a broad range of constraints and variables are augmented to the proposed model with the intention of transforming the proposed uncertain model to an equivalent crisp model, naturally this approach increases the problem size and its computational time.
Table 8. Comparison of total costs of deterministic and robust neutrosophic models Total humanitarian logistics costs ($)
Robust neutrosophic Reliability level
Perturbation levelDeterministic
99% 85% 70%15% 2632185.8 2598267.5 2613144.125% 3156707.8 2804987.9 2655138.435%
2561792.33645430.4 3310932.6 3031450.8
Table 9. Comparison of total time of relief operations of deterministic and robust neutrosophic models Maximum overload
Robust neutrosophic Reliability level
Perturbation levelDeterministic
99% 85% 70%15% 197.83 180.45 177.0925% 205.13 197.14 187.3235%
166.767228.69 209.31 195.43
Table 10. Comparison of difference between maximum and minimum transportation cost of deterministic and robust neutrosophic models
Maximum overloadRobust neutrosophic
Reliability levelPerturbation level
Deterministic99% 85% 70%
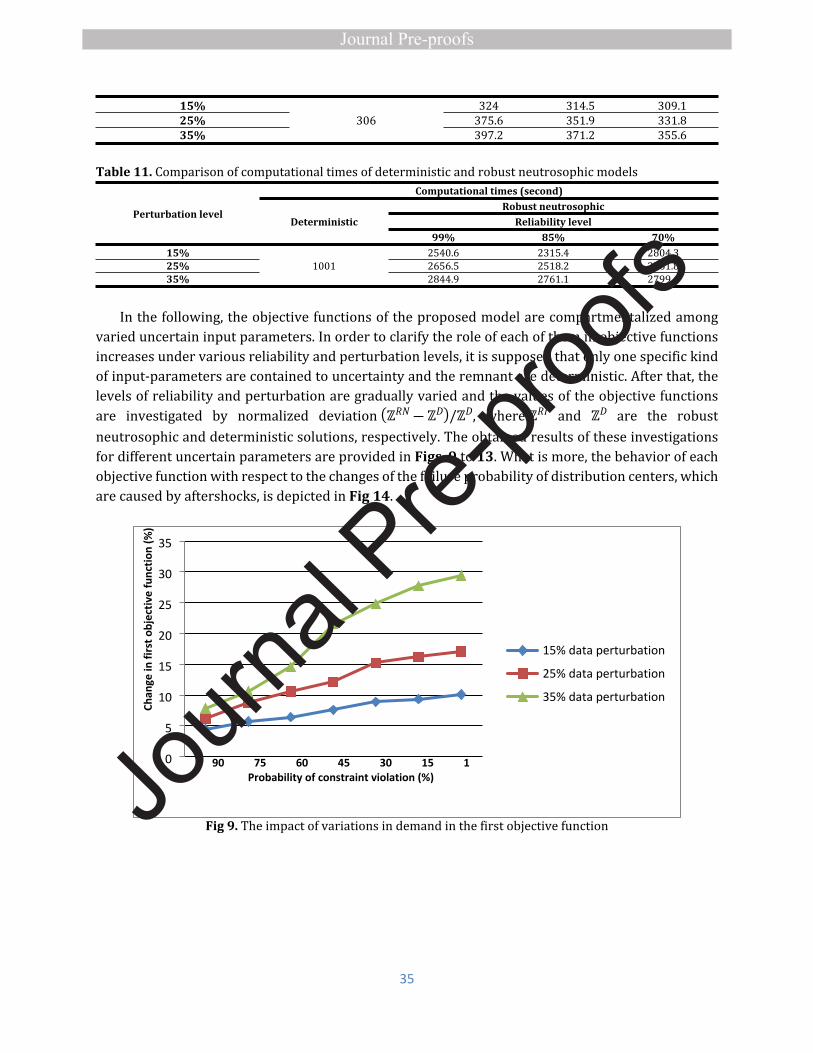
35
15% 324 314.5 309.125% 375.6 351.9 331.835%
306397.2 371.2 355.6
Table 11. Comparison of computational times of deterministic and robust neutrosophic models Computational times (second)
Robust neutrosophic Reliability level
Perturbation levelDeterministic
99% 85% 70%15% 2540.6 2315.4 2804.325% 2656.5 2518.2 2561.835%
10012844.9 2761.1 2799.6
In the following, the objective functions of the proposed model are compartmentalized among varied uncertain input parameters. In order to clarify the role of each of them in objective functions increases under various reliability and perturbation levels, it is supposed that only one specific kind of input-parameters are contained to uncertainty and the remnant are deterministic. After that, the levels of reliability and perturbation are gradually varied and the values of the objective functions are investigated by normalized deviation , where and are the robust (ℤ𝑅𝑁 ― ℤ𝐷)/ℤ𝐷 ℤ𝑅𝐼 ℤ𝐷
neutrosophic and deterministic solutions, respectively. The obtained results of these investigations for different uncertain parameters are provided in Figs. 9 to 13. What is more, the behavior of each objective function with respect to the changes of the failure probability of distribution centers, which are caused by aftershocks, is depicted in Fig 14.
0
5
10
15
20
25
30
35
15% data perturbation
25% data perturbation
35% data perturbation
90 75 60 45 30 15 1Probability of constraint violation (%)
Chan
ge in
firs
t obj
ectiv
e fu
nctio
n (%
)
Fig 9. The impact of variations in demand in the first objective function

36
0
2
4
6
8
10
12
14
15% data perturbation
25% data perturbation
35% data perturbation
90 75 60 45 30 15 1Probability of constraint violation (%)
Chan
ge in
tota
l hum
anita
rian
logi
stic
s cos
t
Fig 10. The impact of variations in demand in the second objective function
0
5
10
15
20
25
30
15% data perturbation
25% data perturbation
35% data perturbation
90 75 60 45 30 15 1Probability of constraint violation (%)
Chan
ge in
third
obj
ectiv
e fu
nctio
n(%
)
Fig 11. The impact of variations in demand in the third objective function

37
0
2
4
6
8
10
12
15% data perturbation
25% data perturbation
35% data perturbation
90 75 60 45 30 15 1Probability of constraint violation (%)
Chan
ge in
firs
t obj
ectiv
e fu
nctio
n (%
)
Fig 12. The impact of variations in the number of injuries in the first objective function
0
2
4
6
8
10
12
14
16
18
20
15% data perturbation
25% data perturbation
35% data perturbation
90 75 60 45 30 15 1Probability of constraint violation (%)
Chan
ge in
seco
nd o
bjec
tive
func
tion
(%)
Fig 13. The impact of variations in the number of injuries in the second objective function

38
0
2
4
6
8
10
12
14
16
18
First objective function
Second objective function
Third objective function
5 10 15 20 25 30 35Increase in failure probability (%)
Perc
enta
ge o
f cha
nges
Fig 14. The impact of variations in failure probability in objective functions
As can be seen, with the increase in the demand for relief items, most changes occur in the first objective function, while the increase in the number of injuries has the most changes in the second objective function. In addition, the percentage of changes in the total humanitarian logistics costs is higher than in the total time of relief operations, so it is suggested that more endeavors and measures should be made to better approximate demand because it is are more sensitive to changing perturbation level. Furthermore, it is clear that the reliability approach considered in this study has been able to provide a suitable solution to mitigate the effects of aftershocks. Although this method creates a reliable network, it also imposes additional costs on the system. Therefore, it is suggested that in the construction of distribution centers to provide the relief items needed for the disaster units, there should be no mere time considerations and that more durable distribution centers be built to avoid additional system costs.
8.2. Managerial insights With respect to the obtained results from investigated case study and explorative analysis, three
helpful managerial insights are provided as follows:Insight 1: Inequality in demand is a crucial issue in times of crisis. The high volume of demand
in critical points from distribution centers dramatically affects the quality of service, which is a vital challenge in the relief logistics and services. The high volume of demand increases the cost, which is due to the insufficient capacity of the service facilities. This will lead to the creation of more distribution centers to meet the demand, while this also requires cost and results in economic decline. Additionally, aid distribution centers may have sufficient capacity to meet all demand. Nevertheless, there is usually an unequal volume of demand and, therefore, unequal access to service, and this inequality often stems from statistical changes and geographical issues. Obviously, one of the desired goals in relief logistics is to meet the maximum volume of demand in the fastest possible time. Therefore, if there are no specific constraints on the management and planning of this issue, the

39
model will endeavor to meet the demand of the nearest critical areas to the distribution centers first, and only after fully fulfilling them will send the remaining units to the farthest points of demand. It is clear that the allocation of relief assistance in this way is not desirable and unequal, so it is necessary to add the limits of fair allocation to the model. One of the measures that reflect the quality
of allocation is the ratio of , which expresses the level of service at a point of demand. What is more, 𝑔𝑑𝑖
𝑑𝑖
the high volume of demand in some distribution centers compared to other ones makes the level of service to the demand points, which have been allocated to these centers, lower than planned. Consequently, the low values of service levels, in this case, may result in maximum service to other points of demand and thus affect the entire system. Hence, the ratio between the maximum and minimum service levels has been calculated, which is limited by the parameter. However, this ratio 𝜌may be less than in actual application, in which case the allocation of assistance is fairer. Therefore, 𝜌in the case study, the value of this parameter was initially considered to be 2, but after the necessary analysis, the value of this ratio was determined to be 1.75 in the deterministic case and 1.92 in the uncertain case.
Insight 2: The speed of transporting the injured from critical areas to the hospital plays a crucial role in ensuring the effectiveness and efficiency of emergency services. During a crisis, the number of casualties is usually higher than the capacity of the hospitals, and many of the injured only need first aid and outpatient treatment, or some of the victims have died. In these cases, they do not need to be transferred to the hospital. Therefore, to prevent overcrowding in the hospital and also to maintain the effectiveness of emergency services, emergency centers as the transfer points are designed to screen the injured. Therefore, the transfer of the injured from critical areas can be done directly to the hospital or indirectly through the transfer points. In other words, if the distance between the critical areas and the hospital is such that it does not worsen the condition of the injured, the transfer will be made directly to the hospital. Otherwise, the injured will first be sent to the nearest transfer point, and medical teams will take the initial treatment according to the type of injury to be sent to the hospital so that the transfer of the injured to the hospital is done quickly by using the equipped medical equipment and the rescue team. This provides the best chance of survival for those affected by the crisis and provides emergency services as soon as possible. What is more, due to screening in transmission points, it has been neglected over long distances and transportation. Therefore, the rate of displacement of the injured in the system is reduced, which not only increases the efficiency of the system but also reduces the total cost of the system. Moreover, congestion in the network also negatively affects the operation time. According to the analysis of the case study, it was found that by increasing the capacity of the transmission points by 30%, the total cost of the network is reduced by 18% and the operating time is reduced by 9%. Furthermore, by increasing the capacity of the transfer points, many problems that arise due to the influx of the injured to the hospital will be prevented, and the treatment and rescue process will be done correctly and with the desired efficiency.
Insight 3: Given the nature of natural disasters that can disrupt facilities, designing a reliable network is critical and dramatically reduces unmet demand. Considering emergency facilities is one of the ways to increase reliability, and if the primary distribution center is not able to provide services, it will send relief goods to the demand points. When a distribution center is completely disrupted, that center is not available, and the critical areas that were originally allocated to it must be redistributed to other distribution centers, and this redesign often results in higher costs. In the case

40
study, it was found that if the probability of disruption in one of the distribution centers reaches zero, the costs will be reduced to approximately 20%, and also the distance between the maximum and minimum distance traveled will be reduced by 30% and the workload between distribution centers will be more balanced. Therefore, locating distribution centers in places with a lower probability of disruption is highly recommended.
9. Conclusions In this paper, a novel reliable humanitarian logistics network was investigated to synchronize
relief distribution and victim evacuation, distribute relief items in a fair manner, and mitigate the repercussions of aftershocks. For this purpose, a framework for the planning of reliable location-allocation of facilities, fair distribution of relief items and vehicle routing was proposed. The proposed framework was a multi-objective optimization model, in which the first objective minimizes the total costs of planning, the second one minimizes the total time of relief operations, and the third one minimizes the difference between the maximum and minimum transportation cost of distribution centers and balances the workload of distribution centers. Moreover, due to the uncertain nature of the disaster, including demand, supply, time, capacities of facilities and costs, a hybrid robust optimization approach which involves robust optimization and the neutrosophic set was proposed to overcome this challenge. The main obtained results from the investigated case study and sensitivity analysis revealed that (1) increasing the capacity of the emergency centers by 30%, the total cost of the humanitarian relief network is reduced by 18% and the operating time is reduced by 9%; (2) if the probability of disruption in one of the distribution centers reaches zero, the logistics costs will be reduced to approximately 20%, and also the distance between the maximum and minimum distance traveled will be reduced by 30% and the workload between distribution centers will be more balanced, so locating distribution centers in places with a higher probability of confidence is highly recommended. A number of future directions could be considered including (1) reflecting the type of injuries, which is the main shortcoming of the current research; (2) proposing exact solution methods, heuristic and meta-heuristic algorithms to solve the proposed model in a large-scale; (3) conducting spatial filtering by utilizing GIS to recognize the most appropriate candidates’ locations to establish facilities.
ReferencesAboolian, R., Cui, T. and Shen, Z.J.M., 2012. An efficient approach for solving reliable facility
location models. INFORMS Journal on Computing, 25(4), pp.720-729.Abounacer, R., Rekik, M. and Renaud, J., 2014. An exact solution approach for multi-objective
location–transportation problem for disaster response. Computers & Operations Research, 41, pp.83-93.
Abdel-Basset, M., Gunasekaran, M., Mohamed, M. and Smarandache, F., 2019. A novel method for solving the fully neutrosophic linear programming problems. Neural Computing and Applications, 31(5), pp.1595-1605.
Afshar, A. and Haghani, A., 2012. Modeling integrated supply chain logistics in real-time large-scale disaster relief operations. Socio-Economic Planning Sciences, 46(4), pp.327-338.
Ahmadi, A. and Bazargan-Hejazi, S., 2018. 2017 Kermanshah earthquake; lessons learned. Journal of injury and violence research, 10(1), p.1.

41
Balcik, B., Beamon, B.M., Krejci, C.C., Muramatsu, K.M. and Ramirez, M., 2010. Coordination in humanitarian relief chains: Practices, challenges and opportunities. International Journal of Production Economics, 126(1), pp.22-34.
Balcik, B. and İhsan, Y., 2019. A Robust Optimization Approach for Humanitarian Needs Assessment Planning under Travel Time Uncertainty. European Journal of Operational Research.
Bayram, V., Tansel, B.Ç. and Yaman, H., 2015. Compromising system and user interests in shelter location and evacuation planning. Transportation research part B: methodological, 72, pp.146-163.
Bertsimas, D., Litvinov, E., Sun, X.A., Zhao, J. and Zheng, T., 2012. Adaptive robust optimization for the security constrained unit commitment problem. IEEE transactions on power systems, 28(1), pp.52-63.
Bertsimas, D. and Sim, M., 2004. The price of robustness. Operations research, 52(1), pp.35-53.Ben-Tal, A. and Nemirovski, A., 2000. Robust solutions of linear programming problems
contaminated with uncertain data. Mathematical programming, 88(3), pp.411-424.Bozorgi-Amiri, A. and Khorsi, M., 2016. A dynamic multi-objective location–routing model for
relief logistic planning under uncertainty on demand, travel time, and cost parameters. The International Journal of Advanced Manufacturing Technology, 85(5-8), pp.1633-1648.
Çankaya, E., Ekici, A. and Özener, O.Ö., 2018. Humanitarian relief supplies distribution: an application of inventory routing problem. Annals of Operations Research, pp.1-23.
Coppola, D.P., 2006. Introduction to international disaster management. Elsevier.Doerner, K., Focke, A. and Gutjahr, W.J., 2007. Multicriteria tour planning for mobile healthcare
facilities in a developing country. European Journal of Operational Research, 179(3), pp.1078-1096.Dubey, D. and Mehra, A., 2011, August. Linear programming with triangular intuitionistic fuzzy
number. In Proceedings of the 7th conference of the European Society for Fuzzy Logic and Technology (pp. 563-569). Atlantis Press.
Duque, J.C., Anselin, L. and Rey, S.J., 2012. The max-p-regions problem. Journal of Regional Science, 52(3), pp.397-419.
El Ghaoui, L., Oustry, F. and Lebret, H., 1998. Robust solutions to uncertain semidefinite programs. SIAM Journal on Optimization, 9(1), pp.33-52.
Ghasemi, P., Khalili-Damghani, K., Hafezolkotob, A. and Raissi, S., 2019. Uncertain multi-objective multi-commodity multi-period multi-vehicle location-allocation model for earthquake evacuation planning. Applied Mathematics and Computation, 350, pp.105-132.
Hematian, M., Seyyed Esfahani, M.M., Mahdavi, I., Mahdavi-Amiri, N. and Rezaeian, J., 2020. A multiobjective integrated multiproject scheduling and multiskilled workforce assignment model considering learning effect under uncertainty. Computational Intelligence, 36(1), pp.276-296.
Hosseini, K.A., Izadkhah, Y.O., Mansouri, B. and Ghayamghamian, M., 2019. Preparedness and Emergency Response Aspects of Sarpol-e Zahab (Kermanshah), Iran Earthquake of November 12, 2017. Journal of Seismology and Earthquake Engineering, 20(4), pp.57-68.
Hwang, C.L. and Masud, A.S.M., 2012. Multiple objective decision making—methods and applications: a state-of-the-art survey (Vol. 164). Springer Science & Business Media.
Jotshi, A., Gong, Q. and Batta, R., 2009. Dispatching and routing of emergency vehicles in disaster mitigation using data fusion. Socio-Economic Planning Sciences, 43(1), pp.1-24.

42
Ko, J., Nazarian, E., Nam, Y. and Guo, Y., 2015. Integrated redistricting, location-allocation and service sharing with intra-district service transfer to reduce demand overload and its disparity. Computers, Environment and Urban Systems, 54, pp.132-143.
Krassimir, T.A. and Parvathi, R., 1986. Intuitionistic fuzzy sets. Fuzzy Sets and Systems, 20(1), pp.87-96.
Li, D.F., 2010. A ratio ranking method of triangular intuitionistic fuzzy numbers and its application to MADM problems. Computers & Mathematics with Applications, 60(6), pp.1557-1570.
Liu, Y., Lei, H., Wu, Z. and Zhang, D., 2019. A robust model predictive control approach for post-disaster relief distribution. Computers & Industrial Engineering, 135, pp.1253-1270.
Martinez, A.J.P., Stapleton, O. and Van Wassenhove, L.N., 2011. Field vehicle fleet management in humanitarian operations: a case-based approach. Journal of operations management, 29(5), pp.404-421.
Mavrotas, G., 2009. Effective implementation of the ε-constraint method in multi-objective mathematical programming problems. Applied mathematics and computation, 213(2), pp.455-465.
Mavrotas, G. and Florios, K., 2013. An improved version of the augmented ε-constraint method (AUGMECON2) for finding the exact pareto set in multi-objective integer programming problems. Applied Mathematics and Computation, 219(18), pp.9652-9669.
Mete, H.O. and Zabinsky, Z.B., 2010. Stochastic optimization of medical supply location and distribution in disaster management. International Journal of Production Economics, 126(1), pp.76-84.
Mousazadeh, M., Torabi, S.A., Pishvaee, M.S. and Abolhassani, F., 2018. Accessible, stable, and equitable health service network redesign: A robust mixed possibilistic-flexible approach. Transportation Research Part E: Logistics and Transportation Review, 111, pp.113-129.
Moreno, A., Alem, D. and Ferreira, D., 2016. Heuristic approaches for the multiperiod location-transportation problem with reuse of vehicles in emergency logistics. Computers & Operations Research, 69, pp.79-96.
Moreno, A., Alem, D., Ferreira, D. and Clark, A., 2018. An effective two-stage stochastic multi-trip location-transportation model with social concerns in relief supply chains. European Journal of Operational Research, 269(3), pp.1050-1071.
Noham, R. and Tzur, M., 2018. Designing humanitarian supply chains by incorporating actual post-disaster decisions. European Journal of Operational Research, 265(3), pp.1064-1077.
Nolte, I.M., Martin, E.C. and Boenigk, S., 2012. Cross-sectoral coordination of disaster relief. Public Management Review, 14(6), pp.707-730.
Oran, A., Tan, K.C., Ooi, B.H., Sim, M. and Jaillet, P., 2012, September. Location and routing models for emergency response plans with priorities. In Future Security Research Conference (pp. 129-140). Springer, Berlin, Heidelberg.
Otay, İ., Oztaysi, B., Onar, S.C. and Kahraman, C., 2017. Multi-expert performance evaluation of healthcare institutions using an integrated intuitionistic fuzzy AHP&DEA methodology. Knowledge-Based Systems, 133, pp.90-106.
Rennemo, S.J., Rø, K.F., Hvattum, L.M. and Tirado, G., 2014. A three-stage stochastic facility routing model for disaster response planning. Transportation research part E: logistics and transportation review, 62, pp.116-135.

43
Saedinia, R., Vahdani, B., Etebari, F. and Nadjafi, B.A., 2019. Robust gasoline closed loop supply chain design with redistricting, service sharing and intra-district service transfer. Transportation Research Part E: Logistics and Transportation Review, 123, pp.121-141.
Setiawan, E., Liu, J. and French, A., 2019. Resource location for relief distribution and victim evacuation after a sudden-onset disaster. IISE Transactions, pp.1-17.
Singh, S.K. and Goh, M., 2018. Multi-objective mixed integer programming and an application in a pharmaceutical supply chain. International Journal of Production Research, pp.1-24.
Soyster, A.L., 1973. Convex programming with set-inclusive constraints and applications to inexact linear programming. Operations research, 21(5), pp.1154-1157.
Tavana, M., Abtahi, A.R., Di Caprio, D., Hashemi, R. and Yousefi-Zenouz, R., 2018. An integrated location-inventory-routing humanitarian supply chain network with pre-and post-disaster management considerations. Socio-Economic Planning Sciences, 64, pp.21-37.
Tirkolaee, E.B, Goli, A., Pahlevan, M. and Malekalipour Kordestanizadeh, R., 2019. A robust bi-objective multi-trip periodic capacitated arc routing problem for urban waste collection using a multi-objective invasive weed optimization. Waste Management & Research, 37(11), pp.1089-1101.
Tirkolaee, E.B., Mahdavi, I., Esfahani, M.M.S. and Weber, G.W., 2020a. A robust green location-allocation-inventory problem to design an urban waste management system under uncertainty. Waste Management, 102, pp.340-350.
Tirkolaee, E.B., Hadian, S., Weber, G.W. and Mahdavi, I., 2020b. A robust green traffic-based routing problem for perishable products distribution. Computational Intelligence, 36(1), pp.80-101.
Torabi, S.A. and Hassini, E., 2008. An interactive possibilistic programming approach for multiple objective supply chain master planning. Fuzzy sets and systems, 159(2), pp.193-214.
Vahdani, B., Veysmoradi, D., Noori, F. and Mansour, F., 2018a. Two-stage multi-objective location-routing-inventory model for humanitarian logistics network design under uncertainty. International journal of disaster risk reduction, 27, pp.290-306.
Vahdani, B., Veysmoradi, D., Shekari, N. and Mousavi, S.M., 2018b. Multi-objective, multi-period location-routing model to distribute relief after earthquake by considering emergency roadway repair. Neural Computing and Applications, 30(3), pp.835-854.
Van Wassenhove, L.N., 2006. Humanitarian aid logistics: supply chain management in high gear. Journal of the Operational research Society, 57(5), pp.475-489.
Veysmoradi, D., Vahdani, B., Sartangi, M.F. and Mousavi, S.M., 2018. Multi-objective open location-routing model for relief distribution networks with split delivery and multi-mode transportation under uncertainty. Scientia Iranica. Transaction E, Industrial Engineering, 25(6), pp.3635-3653.
Wang, H., Du, L. and Ma, S., 2014. Multi-objective open location-routing model with split delivery for optimized relief distribution in post-earthquake. Transportation Research Part E: Logistics and Transportation Review, 69, pp.160-179.
Wu, G.H., Chang, C.K. and Hsu, L.M., 2018. Comparisons of Interactive Fuzzy Programming Approaches for Closed-loop Supply Chain Network Design under Uncertainty. Computers & Industrial Engineering.
Yi, W. and Özdamar, L., 2007. A dynamic logistics coordination model for evacuation and support in disaster response activities. European Journal of Operational Research, 179(3), pp.1177-1193.
44
Ye, J., 2010. Multicriteria fuzzy decision-making method using entropy weights-based correlation coefficients of interval-valued intuitionistic fuzzy sets. Applied Mathematical Modelling, 34(12), pp.3864-3870.
Ye J (2015) Some weighted aggregation operators of trapezoidal neutrosophic numbers and their multiple attribute decision making method. http://fs.gallup.unm.edu/SomeWeightedAggregation Operators.pdf
Zadeh, L.A., 1965. Fuzzy sets. Information and control, 8(3), pp.338-353.Zhang, Y., Feng, Y. and Rong, G., 2016. New robust optimization approach induced by flexible
uncertainty set: Optimization under continuous uncertainty. Industrial & Engineering Chemistry Research, 56(1), pp.270-287.

45
Highlights
Rendering a reliable synchronized framework to distribute relief items and evacuate victims in a humanitarian logistics network.
Developing a novel multi-objective model to integrate reliable locating and routing under fairness in distribution relief items.
Mitigating the repercussions of aftershocks by considering an efficient reliability approach. Proposing an uncertain approach based on neutrosophic fuzzy programming and robust
optimization.

46
Author Contribution Statement
S. Mohammadi: Conceptualization, Methodology, Software, Writing- Original draft preparation, Data curation
S.A. Darestani: Visualization, Investigation,
Behnam Vahdani: Modelling, Validation, Supervision,
A. Alinezhad: Reviewing and Editing.