a roadmap toward a national employment policy for sudanafrica/@ro-addis_ababa/@sro... · a roadmap...
TRANSCRIPT

Project “SUDAN: Support to the developmentof a National Employment Framework”
A RoadmapToward A NationalEmployment PolicyFor Sudan


Project “SUDAN: Support to the development of a National Employment Framework”
A RoadmapToward A National Employment Policy
For Sudan
January 2014

Copyright © International Labour Organization 2014
First published 2014
Publications of the International Labour Office enjoy copyright under Protocol 2 of the Universal Copyright
Convention. Nevertheless, short excerpts from them may be reproduced without authorization, on condition
that the source is indicated. For rights of reproduction or translation, application should be made to ILO
Publications (rights and Permissions), International Labour Office, CH-1211 Geneva 22, Switzerland, or by
email: [email protected]. The International Labour Office welcomes such applications.
Libraries, institutions and other users registered with reproduction rights organizations may make copies in
accordance with the licences issued to them for this purpose. Visit www.ifrro.org to find the reproduction
rights organization in your country.
A Roadmap Toward A National Employment Policy For Sudan
ISBN: 978-92-2-128643-1 (print)
ISBN: 978-92-2-128644-8 (web pdf)
Arabic edition: ISBN: 978-92-2-628643-6 (print)
ISBN: 978-92-2-628644-3 (pdf)
ILO Cataloguing in Publication Data
The designations employed in ILO publications, which are in conformity with United Nations practice, and the
presentation of material therein do not imply the expression of any opinion whatsoever on the part of the
international Labour Office concerning the legal status of any country, area or territory or of its authorities, or
concerning the delimitation of its frontiers.
The responsibility for opinions expressed in signed articles, studies and other contributions rests solely with
their authors, and publication does not constitute an endorsement by the International Labour Office of the
opinions expressed in them.
Reference to names of firms and commercial products and processes does not imply their endorsement by
the International Labour Office, and any failure to mention a particular firm, commercial product or process
is not a sign of disapproval.
ILO publications and electronic products can be obtained through major booksellers or ILO local offices in
many countries, or direct from:
ILO Publications, International Labour Office, CH-1211 Geneva 22, Switzerland.
Catalogues or lists of new publications are available free of charge from the above address,
or by email: [email protected]
Visit our web site: www.ilo.org/publns
For ILO Publications, please contact:
ILO Cairo Office: 9, Dr. Taha Hussein St., Zamalek 11211 Cairo, EGYPT
Tel: (+202) 27350123
Visit our web site: www.ilo.org/cairo
Printed in Egypt

Table of Contents
Foreword ............................................................................................................................. 4
Executive Summary ........................................................................................................... 6
Introduction ....................................................................................................................... 8
Chapter 1 – Background And Description Of Sudan’sExisting Development Policy Framework ................................................................. 11
1.1 Overview of the socio-economic context ............................................................... 111.2 The development policy framework and employment promotion in Sudan ................. 18
Chapter 2 – Labour Market Dynamics ....................................................................... 232.1. Demographic trends .............................................................................................. 232.2. Trends in education ................................................................................................ 262.3. Labour market ........................................................................................................ 29
Chapter 3 – Sectoral Policies: The Role Of Micro, Small, And Medium-SizeEnterprises (MSMEs) And The Private Sector .......................................................... 41
3.1 Review of the current policy environment and challenges .................................. 413.2 Identification and evaluation of policy options to be included in the NEP ........... 51
Chapter 4 – Human Resources, Employability And Skills Development ............. 544.1 Review of the current education and training policies and challenges .................. 544.2 Identification and evaluation of policy options to be included in the NEP .............. 60
Chapter 5 – Labour Market Policies And Institutions ............................................. 635.1 Review of the current policy environment and challenges ................................ 635.2 Identification and evaluation of policy options to be included in the NEP ............ 68
Chapter 6 - Conclusions And Recommendations ...................................................... 70

4
Foreword
While growth is a necessary condition, there is no automatic translation of growth into decent jobs as many other countries with high and sustained growth rates have failed to translate it into job creation. In order to translate growth into jobs, many policies, procedures and economic reforms should be undertaken to ensure that investments lead to sustainable growth and decent jobs and hence, policy-makers in Sudan face a daunting task. In Sudan, the strong focus on macro-economic reforms, which is being advocated through the stability packages, needs to be balanced with concurrent investments in job creation and inclusive growth.
By all accounts, Sudan has witnessed an incredible economic growth over the last decade (1999-2010), posting an average annual growth rate of real gross domestic product (GDP) at 6 percent. Nonetheless, some of Sudan’s hopes for a fast and sustained development have withered away through decades of conflict and the loss of massive oil revenues in the aftermath of South Sudan’s secession in July 2011. This watershed event has brought the country face to face with the challenge of diversifying the economy and the need to apply short-term austerity measures to counteract the oil shock.
Over the years, the country has eaten away a large portion of its wealth, without being able to efficiently translate the oil boom into public investments in human and social capital, infrastructure, and widespread wealth and employment. The incidence of poverty remains high particularly in the rural areas, and inequality has been rising. Most Sudanese women and men work in vulnerable conditions. Age and gender trace major divides on the labour market. The youth labour market is characterized by low participation and employment rates, and high unemployment rates. According to the 2011 SLFS, the unemployment rate in urban areas is higher (22.8 percent) than in rural areas (15.3 percent).Women are disproportionally affected by employment challenges. It is estimated that about 30 percent of people who are employed in Sudan reside in households that, despite the income from holding a job, live below the poverty line. Merely having a job cannot be considered a vehicle out of poverty for many people. Thus, policy-makers must devote attention also to the quality of jobs that are being created in the economy.This Study shows that, despite policy statements towards economic diversification, the skills base of the country remains too limited to sustain agriculture-based economic innovation and transformation strategies unless additional capacities are injected (see Chapters 2 and 4). Even diversification into non-primary commodity sectors, such as manufacturing and services, with limited value addition and few forward and backward linkages to other sectors of the economy, may prove difficult to realize in the medium term, due to severe disparities between urban and rural areas and among States, and the net loss of resources and energies seeping through the large informal economy.
Thus, changing the patterns of growth and achieving structural changes in the economy and the labour market of Sudan is by no means a trivial exercise. A National Employment

5A Roadmap Toward A National Employment Policy For Sudan
Policy (NEP) can assist the Government of Sudan to give substance to their commitment to promote full and quality-centred employment through an appropriate choice of economic and social policies, as well as through the establishment of efficient institutions and the necessary legal framework. In recognition of the work already done by the Ministry of Human Resources Development and Labour (MHRDL) and the social partners, this Study is a contribution towards the development of Sudan’s NEP. Consistent with the national development plans and frameworks, the NEP can set out, in a comprehensive and holistic manner, the employment-related objectives for the medium term (7 to 10 years, for instance). This should ideally be supplemented by an Action Plan (covering for instance the first 3 years of implementation) to meet the objectives stated in the Policy, with clearly identified baselines and specific targets.
This paper raises and analyzes a broad set of policy areas that can be taken into account when developing the NEP. It offers 24 policy options, presented in the form of possible Outcomes for the NEP Action Plan.
This paper was funded by the ILO/UNDP project “Support to the development of a National Employment Framework in Sudan”, and based on seven thematic papers, which have provided background information for the employment diagnostic and situation analysis, this Study attempts a basic review of some of the policy areas that have an impact on the performance of Sudan’s labour market. The seven thematic papers have been subject to a review and validation process, involving the Government and the social partners, as well as other relevant stakeholders. The main lines of this document have also been the subject of a tripartite discussion at the country level, involving the Government, workers’ and the employers’ organizations, which was held in Khartoum on 19 December 2013. These consultations are part and parcel of the NEP process and should be conducted as broadly as possible to ensure stakeholders’ views and constituents’ demands be taken into consideration during the policy formulation process.
Finally, special acknowledgment to the support given by his Excellency Dr. Ibrahim Ghandour, “Assistant to the president of Sudan” and the intensive follow up provided by her Excellency Ms. Ishraka Sayed Mahmoud “Minister of Labor and Human Resources Development”, hoping that the collaborative work will continue to finalize the National Employment Policy in the nearest future. Also special thanks to the UNDP in Sudan for the fruitful cooperation within the framework of our joint program. And last but not least, it is essential to acknowledge the big effort done by Ms. Daniela Zampini as well as the different authors of the 7 thematic papers which were the base of this document.
Dr. Yousef QaryoutiDirectorDecent Work Team (DWT) for North Africa
6
Executive Summary
This Study outlines a general roadmap leading up to the formulation of the National Employment Policy (NEP) for Sudan. It covers elements of analysis of the labour market, particularly with regard to individuals facing multiple labour market disadvantages and at risk of social exclusion. On the basis of seven thematic papers1, which have provided background information for the employment diagnostic and situation analysis, the Study attempts a basic review of some of the policy areas that have an impact on the performance of Sudan’s labour market. The seven thematic papers have been subject to a review and validation process, involving the Government and the social partners, as well as other relevant stakeholders. These consultations are part and parcel of a good situation analysis and should be conducted as broadly as possible to ensure stakeholders’ views and constituents’ demands be taken into consideration during the policy formulation process. The preparation of the NEP warrants a broad-based national consensus among various stakeholders, particularly the social partners, since many policies can have trade-offs and may require adjustments, such as for instance to the regulatory framework. A mapping of the key employment challenges, in quantitative and qualitative terms, through benchmarking, can help to assess how far current policies, national and sectoral, can deliver on suitable employment ‘targets’ for Sudan. The recommendations that emerge through the analyses, reviews, and consultations, provide policy-makers with an initial basis from which to start the prioritization of issues and generate policy options.
This Study identifies some recommendations in the areas of skills development, partnership with the private sector, protection of vulnerable workers, social dialogue, and labour market programmes. It suggests some key policy options to be considered and further elaborated by national partners during the 12-18 months leading to the development of a comprehensive National Employment Policy in view of enhancing the potential employment content of growth in Sudan. Subsequently, each of the policy options that stakeholders select (down from a comprehensive set to a realistic set) will have to be translated into an “outcome” in the NEP Action Plan. A full-fledged NEP, and the accompanying Action Plan, would require additional detailed studies to ascertain employment outcomes of policies, particularly sectoral strategies, and consultations amongst various ministries and agencies, and other stakeholders, on potential policy and programme reforms.
To cover all the necessary elements of a national employment policy, this Study calls for further in-depth analysis of certain themes, including a clearer analysis of the dynamics between urban and rural areas, a better understanding of the extent of social protection, and a review of Sudan’s active labour market policies and institutional capacities to implement them.
1 The thematic papers cover the following areas: Sudan’s Small and Medium Enterprises; The Relevance of
International Labour Standards to the design of a National Employment Policy in Sudan; Skills Development
in Sudan; The Informal Sector; Social Dialogue; Social Protection; The Social Economy in Sudan.

7A Roadmap Toward A National Employment Policy For Sudan
The design and formulation of a NEP needs to be seen as an integrated approach, consistent with, and embedded in, the current national planning context. Needless to emphasize, employment generation is crucially influenced by the objectives pursued through macroeconomic policies as well as sectoral policies, as articulated in Sudan’s key development documents and long-term vision. At the same time, the quality of employment needs to be safeguarded through an appropriate regulatory framework, as well as social, labour market, and institutional policies.
The labour market data presented in Chapter 2 indicate that Sudan faces both quantitative and qualitative employment challenges. The institutional framework governing the labour market, and the way in which government policies are formulated and implemented, have an impact on the effectiveness of the measures taken to facilitate people’s transition to decent work. The data of the Sudanese labour market points to three main groups of policy priorities that can have an impact on employment generation in Sudan: i) macroeconomic and sectoral policies and their impact on job creation through support to small and micro-enterprises and the social economy; ii) education and training policies and their relevance to labour market requirements in view of boosting employability; and iii) labour market policies and institutions that bridge the gap between labour supply and demand and ensure workers’ protection.
For each of these policy areas, the study offers: i) a brief review of the policies currently in place in Sudan and the challenges they face; ii) an initial analysis of the policy space available (guiding scenario) for the identification and evaluation of policy options to be included in the NEP; iii) some elements for the definition of specific objectives, outcomes, and targets of Sudan’s NEP.
The main recommendations revolve around alternative options to the conventional policy wisdom that is being generally offered to Sudan’s policy makers. It is argued that Sudan’s National Employment Policy should present and promote a “Decent Work” perspective for economic growth and recovery. In this respect, the NEP should deal extensively with the multiple dimensions of employment promotion that come into play within a national policy, such as for instance the protection of fundamental rights and principles at work and other rights relating to conditions of work, encompassing wages, occupational safety and health, social security, working hours; the employment relationship, labour administration and protection, migrant workers, labour conditions in public contracts, and social dialogue mechanisms.

8
Introduction
This Study reviews and analyses a broad set of policy areas that policy planners, the social partners and other stakeholders can take into account when developing a National Employment Policy (NEP) for Sudan.
The NEP should take the form of an integrated set of policies and relevant programmes leading towards a state of full, productive, and freely chosen employment with full respect for labour rights. A national employment policy is expected to assist the Government of Sudan (GoS) to put employment at the centre stage of their economic and social policy making, and give substance to their commitment to promote the goal of full employment and quality of employment through an appropriate choice of economic and social policies, as well as through the establishment of efficient institutions and the necessary legal framework.
The justification for the development of a NEP, and for embedding an employment-friendly policy planning in the national development strategy of the country is all the more underscored by Sudan’s commitment to the MDGs, which incorporate the attainment of “full productive employment and decent work”, which, in turn, would facilitate a sustainable reduction of poverty (MDG 1). Moreover, a NEP and its related Action Plan are useful instruments to monitor and report on the country’s employment and labour market performance, as warranted by the commitment to ILO’s Convention 122, which Sudan has ratified.
The NEP is intended to be a forward-looking policy document, consistent with the national development plans and frameworks, that would set out, in a comprehensive and holistic manner, the employment-related objectives for the medium term (7 to 10 years, for instance). This should ideally be supplemented by an Action Plan (covering for example the first 3 years of implementation) to meet the objectives stated in the Policy, with clearly identified baselines and specific targets. In short, a NEP could provide2:
• an assessment of the key employment challenges, and identification of the priorities;• the structuring, within a coherent and coordinated framework, of the policy options
and concrete measures that could be taken (further to, or in place of, existing measures) to address the priority challenges;
• a link between the policy options and budgetary allocations and/or financing mechanisms;
• an institutional framework detailing roles and responsibilities for the implementation and monitoring of progress.
2 See also: Cambodia: toward a national employment strategy for sustained poverty reduction / a EU/ILO
Project on Improving Social Protection and Promoting Employment; Ministry of Labour and Vocational
Training; International Labour Office. - Geneva: ILO, 2012.

9A Roadmap Toward A National Employment Policy For Sudan
In the sections that follow, the Study provides a broad contour of the possible ingredients of a NEP for Sudan, vis-a-vis approaches to sizing up the employment challenge, and various policy options that could enhance the quality and quantity of employment. These policy options build on a first broad identification of hypotheses about the development context and employment situation, which are introduced at the beginning of each chapter.
The initial sections discuss issues related to generating labour demand in the economy. Employment performance would, however, depend on not only how much labour demand is generated but also on how far labour and skills are in supply, as well as on how far the supply-demand exchange is mediated without much ‘friction’. Most of these issues are usually addressed through well-articulated labour market policies, which range from a labour regulatory framework, skills development and employability, to specific public interventions to promote employment.
In 2012, the ILO published a comprehensive guidance document for the formulation of national employment policies3. As indicated above, the over-arching instrument for guiding such policies is the Employment Policy Convention, 1964 (No. 122). This is seen as a significant instrument from the viewpoint of governance, complemented by a further recommendation on the subject adopted in 1984. However, the ILO Guide also identifies a number of other main ILO instruments on employment policy, covering such diverse issues as: human resources development; the employment service; private employment agencies; job creation in small and medium enterprises; the promotion of cooperatives; vocational rehabilitation and employment; the employment relationship; older workers; and migration for employment. The ILO Guide also describes in detail the different phases for the development of a NEP and offers a series of methods and tools that the social partners and other NEP stakeholders at country level can adopt to manage the process and ensure broad-based consultation.
In recognition of the work already done by the Ministry of Human Resources Development and Labour and the social partners, this Study is a contribution to the first two steps of Sudan’s NEP process. The policy options that are presented at the end of each chapter, and which can translate into “Outcomes” in the NEP Action Plan, are by no means exhaustive and should be subject to further social dialogue among partners. Moreover, the employment diagnostics has highlighted the age and gender divides that characterize the Sudanese labour market and the pressing policy challenges with ensuring more equitable growth and employment outcomes at decentralized level. In this respect, some States may decide to assume and adapt the NEP “Outcomes” into their State-level Action Plans for youth employment, with a focus on young women4.
3 Guide for the Formulation of National Employment Policies, ILO, Geneva, 2012.
4 North Kordofan, South Kordofan and the Blue Nile States have already started the process of
implementing Action Plans for Youth Employment, which can be linked to the NEP Outcomes.

10
Source: ILO, Guide for the Formulation of National Employment Policies, p.40
1. Preparation
3. Formulation
4. Adoption5. Programming
6. Implementation
7. Evaluation 2. IssueIdentification

11A Roadmap Toward A National Employment Policy For Sudan
Chapter 1 – Background and description of Sudan’s existing development policy framework
1.1 Overview of the socio-economic5 context
Sudan’s economic growth over the last decade (1999-2010) was dominated by the accrual of large revenues, generated and sustained through oil production. Economic activity, measured by real gross domestic product (GDP), grew in the same period at an average annual rate of 6 percent, with peaks in 2006-07. Nonetheless, South Sudan’s secession in July 2011 brought the country face to face with the challenge of diversifying the economy and the need to apply short-term austerity measures to counteract the oil shock6. Even with the high oil profits that characterized the economy before the secession, over the years Sudan has pursued an unsustainable growth path. With an economy geared towards consumption and imports, rather than production and exports, the country has eaten away a large portion of its wealth, without being able to efficiently convert oil reserves into public investments in human and social capital, and infrastructure7 .
5 Since the secession of South Sudan in July 2011, it is difficult to identify comprehensive and consistent
economic data for Sudan. A specific challenge resides in the analysis on time series, as data for specific
years are often missing or cannot be disaggregated. In this chapter, we use data from the World Bank as
well as macroeconomic estimates provided in the 2012 budget document for 2011 and 2012.
6 It is estimated that, as a result of this permanent shock, Sudan lost almost 75 percent of its oil production,
nearly 55 percent of its fiscal revenues, and about two-thirds of its foreign exchange earnings.
7 Lee, Taehyun; Geiger, Michael; Alamir, Mosllem; Nishiuchi, Toru. 2013. Sudan economic brief: recent
economic developments - second semester 2012. Country economic brief; issue no. 2012-02 (December
2012). Washington DC: World Bank. The paper measures the country’s ability to convert oil revenues
into public investment through the Adjusted Net Savings Rate (ANS), which in Sudan was significantly
negative throughout the decade of the oil boom.
12
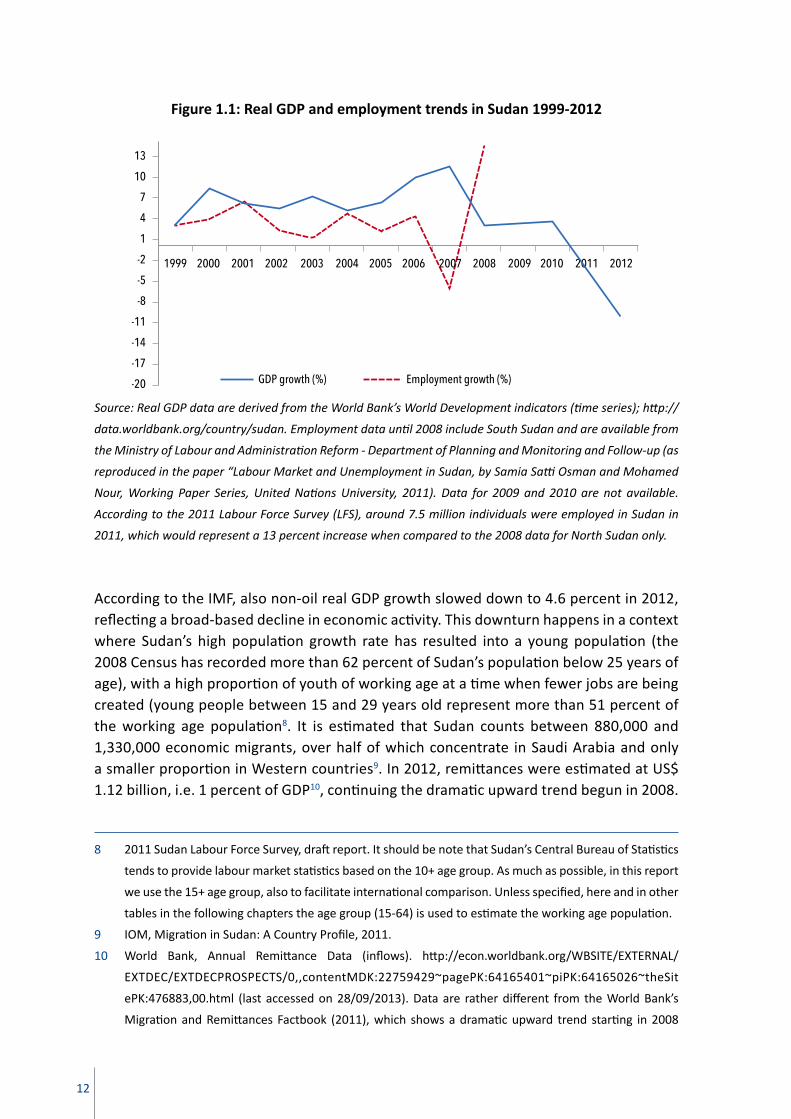
Figure 1.1: Real GDP and employment trends in Sudan 1999-2012
Source: Real GDP data are derived from the World Bank’s World Development indicators (time series); http://
data.worldbank.org/country/sudan. Employment data until 2008 include South Sudan and are available from
the Ministry of Labour and Administration Reform - Department of Planning and Monitoring and Follow-up (as
reproduced in the paper “Labour Market and Unemployment in Sudan, by Samia Satti Osman and Mohamed
Nour, Working Paper Series, United Nations University, 2011). Data for 2009 and 2010 are not available.
According to the 2011 Labour Force Survey (LFS), around 7.5 million individuals were employed in Sudan in
2011, which would represent a 13 percent increase when compared to the 2008 data for North Sudan only.
According to the IMF, also non-oil real GDP growth slowed down to 4.6 percent in 2012, reflecting a broad-based decline in economic activity. This downturn happens in a context where Sudan’s high population growth rate has resulted into a young population (the 2008 Census has recorded more than 62 percent of Sudan’s population below 25 years of age), with a high proportion of youth of working age at a time when fewer jobs are being created (young people between 15 and 29 years old represent more than 51 percent of the working age population8. It is estimated that Sudan counts between 880,000 and 1,330,000 economic migrants, over half of which concentrate in Saudi Arabia and only a smaller proportion in Western countries9. In 2012, remittances were estimated at US$ 1.12 billion, i.e. 1 percent of GDP10, continuing the dramatic upward trend begun in 2008.
8 2011 Sudan Labour Force Survey, draft report. It should be note that Sudan’s Central Bureau of Statistics
tends to provide labour market statistics based on the 10+ age group. As much as possible, in this report
we use the 15+ age group, also to facilitate international comparison. Unless specified, here and in other
tables in the following chapters the age group (15-64) is used to estimate the working age population.
9 IOM, Migration in Sudan: A Country Profile, 2011.
10 World Bank, Annual Remittance Data (inflows). http://econ.worldbank.org/WBSITE/EXTERNAL/
EXTDEC/EXTDECPROSPECTS/0,,contentMDK:22759429~pagePK:64165401~piPK:64165026~theSit
ePK:476883,00.html (last accessed on 28/09/2013). Data are rather different from the World Bank’s
Migration and Remittances Factbook (2011), which shows a dramatic upward trend starting in 2008
1999 2000 2001 2002 2003 2004 2005 2006 2007 2008 2009 2010 2011 2012
13
10
7
4
1
-2
-5
-8
-11
-14
-17
-20 Employment growth (%)GDP growth (%)

13A Roadmap Toward A National Employment Policy For Sudan
Top destination countries for Sudanese migrants are: Saudi Arabia, Uganda, the Republic of Yemen, Kenya, the United States, Chad, the United Arab Emirates, Australia, Jordan, and Canada. In previous years, the increased wealth generated by oil and FDI inflows had also encouraged migration from other countries to Sudan. However, according to UN data, the number of international migrants decreased from about 1.3 million in 1990 to 854,000 in 2000, and the further to 753,000 in 2010, accounting for 1.7 percent of the country‘s total population11. In 2012, the gold sector became Sudan’s most important export earner. Whereas it accounted for approximately 1 percent of export earnings in 2008, by 2012 its share increased to over 40 percent. Over the medium term, it is projected to contribute about one-third of total exports12. This moderate substitution of gold for oil exports has not yet heavily influenced Sudan’s trade balance, which recorded a deficit of 0.37 billion in 2011, and is expected to further deteriorate in 2013, thereby remaining in the negative throughout 201813. China received 73 percent of Sudan’s exports in 2010-11, while exports to Arab States and COMESA accounted for 14 percent and 6.4 percent, respectively. Imports are relatively more diversified and are dominated by food and manufactured products (43 percent and 20 percent, respectively)14. The current account deficit fell to 0.4 percent of GDP in 2011, but is expected to rise to 11.9 percent of GDP in 2013, reflecting a deterioration of the trade deficit due to the large drop in oil and gold exports and a slight increase in imports15. In 2012, the overall fiscal deficit peaked at 3.8 percent of GDP, mostly on account of a significant fall in oil revenues16. As a result of protracted economic sanctions as well as Sudan’s heavy debt, external borrowing options are severely limited and internal borrowing is likely to increase. The secession of the South has led to the depletion of foreign exchange reserves. In the aftermath of the secession, the Governor of the Bank of Sudan (BoS) has appealed to Arab countries to deposit funds into the Bank of Sudan and commercial banks. Sudan has also continued the negotiations with the South, hoping that transit fees charged for using its oil pipelines will help cushion the impact of secession. In this respect, the finalization of the implementation matrix for the Cooperation Agreement in March 2013 facilitated the resumption of oil production in South Sudan. The first oil shipment left Port Sudan in July 2013 and, as a result, Sudan is expected to begin receiving significant oil transit fees and payments linked to the Transitional Financial Arrangement (TFA).
(peaking at US$ 3.1 billion in 2010).
11 United Nations, Department of Economic and Social Affairs, Population Division (2009).Trends in
International Migrant Stock: The 2008 Revision, http://esa.un.org/migration/.
12 International Monetary Fund (IMF), Sudan: 2013 Article IV Consultation.
13 Ibidem. Macroeconomic projections for Sudan.
14 African Economic Outlook 2012: Sudan. African Development Bank, OECD, UNDP, UNECA.
www.africaneconomicoutlook.org
15 International Monetary Fund (IMF), Sudan: 2013 Article IV Consultation.
16 Ibidem.
14
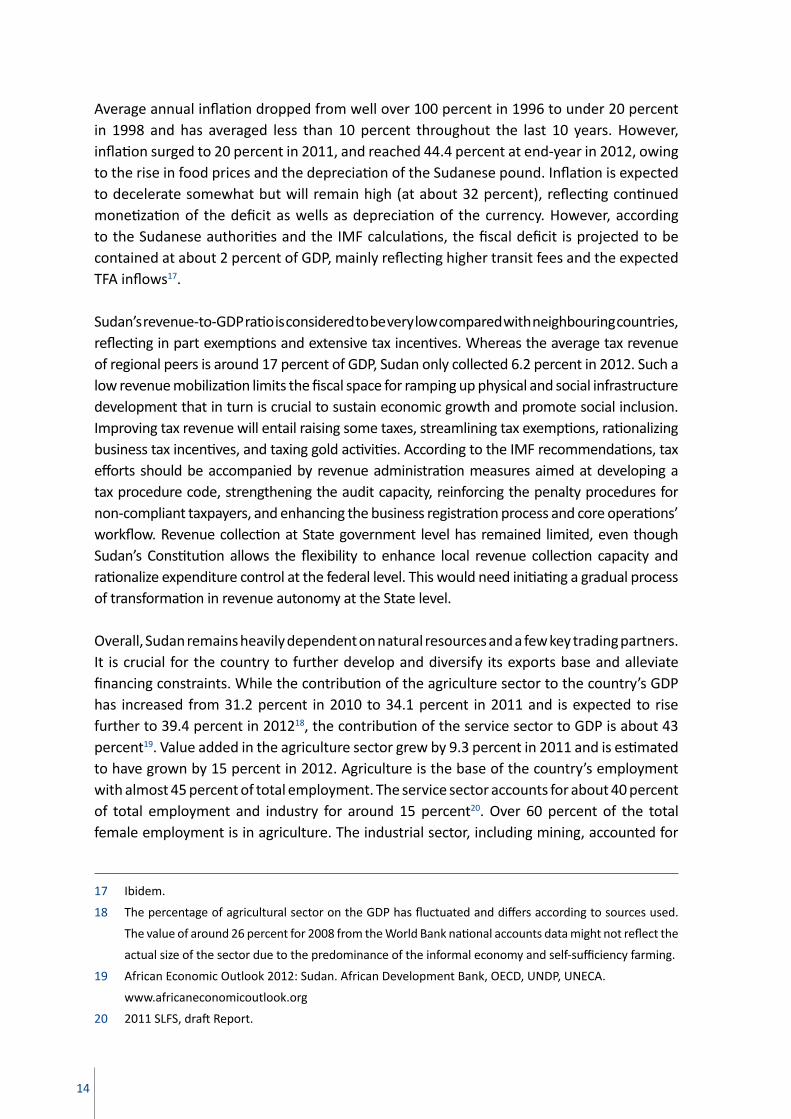
Average annual inflation dropped from well over 100 percent in 1996 to under 20 percent in 1998 and has averaged less than 10 percent throughout the last 10 years. However, inflation surged to 20 percent in 2011, and reached 44.4 percent at end-year in 2012, owing to the rise in food prices and the depreciation of the Sudanese pound. Inflation is expected to decelerate somewhat but will remain high (at about 32 percent), reflecting continued monetization of the deficit as wells as depreciation of the currency. However, according to the Sudanese authorities and the IMF calculations, the fiscal deficit is projected to be contained at about 2 percent of GDP, mainly reflecting higher transit fees and the expected TFA inflows17.
Sudan’s revenue-to-GDP ratio is considered to be very low compared with neighbouring countries, reflecting in part exemptions and extensive tax incentives. Whereas the average tax revenue of regional peers is around 17 percent of GDP, Sudan only collected 6.2 percent in 2012. Such a low revenue mobilization limits the fiscal space for ramping up physical and social infrastructure development that in turn is crucial to sustain economic growth and promote social inclusion. Improving tax revenue will entail raising some taxes, streamlining tax exemptions, rationalizing business tax incentives, and taxing gold activities. According to the IMF recommendations, tax efforts should be accompanied by revenue administration measures aimed at developing a tax procedure code, strengthening the audit capacity, reinforcing the penalty procedures for non-compliant taxpayers, and enhancing the business registration process and core operations’ workflow. Revenue collection at State government level has remained limited, even though Sudan’s Constitution allows the flexibility to enhance local revenue collection capacity and rationalize expenditure control at the federal level. This would need initiating a gradual process of transformation in revenue autonomy at the State level.
Overall, Sudan remains heavily dependent on natural resources and a few key trading partners. It is crucial for the country to further develop and diversify its exports base and alleviate financing constraints. While the contribution of the agriculture sector to the country’s GDP has increased from 31.2 percent in 2010 to 34.1 percent in 2011 and is expected to rise further to 39.4 percent in 201218, the contribution of the service sector to GDP is about 43 percent19. Value added in the agriculture sector grew by 9.3 percent in 2011 and is estimated to have grown by 15 percent in 2012. Agriculture is the base of the country’s employment with almost 45 percent of total employment. The service sector accounts for about 40 percent of total employment and industry for around 15 percent20. Over 60 percent of the total female employment is in agriculture. The industrial sector, including mining, accounted for
17 Ibidem.
18 The percentage of agricultural sector on the GDP has fluctuated and differs according to sources used.
The value of around 26 percent for 2008 from the World Bank national accounts data might not reflect the
actual size of the sector due to the predominance of the informal economy and self-sufficiency farming.
19 African Economic Outlook 2012: Sudan. African Development Bank, OECD, UNDP, UNECA.
www.africaneconomicoutlook.org
20 2011 SLFS, draft Report.

15A Roadmap Toward A National Employment Policy For Sudan
23 percent of GDP in 2011, and its share is expected to decrease to 15.9 percent in 2012 due to the decline in oil production and related processing activities. Manufacturing value added increased by 10.8 percent in 2011 thanks to expansion in sugar and cement processing. The government continues to provide tax and other incentives to attract domestic and foreign investment in manufacturing under an ongoing diversification strategy. It is expected that manufacturing exports will reach 10 percent of total exports by 201321.
Figure 1.2: Structure of GDP by sector (percentage of GDP at factor cost)
Source: Adaptation from the African Economic Outlook 2012: Sudan. African Development Bank, OECD, UNDP,
UNECA. www.africaneconomicoutlook.org
As indicated above, gold has emerged as a leading export commodity, contributing US$ 1.5 billion to export revenue in 2011 up from US$ 0.45 billion in 2010, and revenue from gold is expected to double by 2012. There are growing environmental concerns about the rudimentary informal gold extraction activities. It is estimated that more than 200,000 workers are engaged in these activities, living in camps lacking basic facilities. Currently there are two groups of gold miners in Sudan: the first consists of the five main gold mining companies and the second includes the thousands of small artisanal miners. Under the current taxation system, while artisanal miners are not taxed, gold mining companies are subject to a royalty (7 percent), a business profit tax (BPT; 30 percent), and pay a dividend proportional to for the equity share held by the government.
The construction sector continues to grow, driven by the expansion of infrastructure public utilities as part of government commitments under the East Sudan and Darfur (Doha) peace
21 African Economic Outlook 2012: Sudan. African Development Bank, OECD, UNDP, UNECA.
www.africaneconomicoutlook.org
100%
90%
80%
70%
60%
50%
40%
30%
20%
10%
0%
2006 2011
Services
Industry
Agriculture

16
agreements. In addition, the government’s commitment to continue reconstruction in other conflict-affected areas, especially in Blue Nile and South Kordofan states, is expected to sustain growth in the construction sector.
Figure 1.3: Distribution of employment by sector and by sex (percentage)
Source: Adaptation from the results of the 2011 Sudan Labour Force Survey (SLFS)
According to fieldwork conducted through ILO projects, in 2013 the estimated number of registered micro, small and medium enterprises (MSMEs) in Sudan was around 600,000. Based on calculations, they currently employ less than 1.5 million workers22, which is only about 20 percent of the total number of jobs existing in Sudan. This implies that a large number of Sudanese workers, and probably MSMEs, operate in the informal economy. The microenterprises represent 75 percent, small enterprises represent 23 percent and medium enterprises represent only 2 percent of the estimated figure. Based on Sudan’s working definitions, microenterprises employ an average of 2 workers, small enterprises employ up to 5 workers and medium enterprises employ up to 49 workers. In Sudan, very large-scale projects, which employ more than 100 workers, do not exceed more than 2 percent of the private sector while micro, small and medium-sized enterprises represent up to 98 percent of the sector.
22 Ahmed Abou El-Yazeid, Sudan’s Small and Medium Enterprises, Thematic Paper prepared for the ILO/
UNDP project “SUDAN: Support to the development of a National Employment Framework”, September
2013.
70
60
50
40
30
20
10
0
44.639.8
60.7
15.3 15.7
3.8
40.144.5
35.5
Agriculture Industry Services
Total Men Women

17A Roadmap Toward A National Employment Policy For Sudan
Figure 1.4: Distribution of Small and Micro Industrial Enterprisesaccording to economic activity (2013)
Source: Based on administrative data provided by the Sudanese Business and Employers’ Federation (SBEF)
The analysis of the available data on the growth rate of medium-size enterprises illustrates that the medium enterprise sector has progressed between 2000 and 2007 with an average estimated growth rate of 77 percent annually. This growth rate helped in the creation of many new enterprises that provided job opportunities for the labour market in Sudan. The average growth rate in the industrial sector was 75 percent, the service sector 80 percent and the agricultural sector 60 percent. However, after 2007 this notable growth was not sustained and has declined to an average growth rate of only 17 percent. The average growth rate of the industrial sector was 17 percent, the service sector 14 percent and agricultural sector 18 percent. In particular, the year 2011 had the lowest growth rate, at only 1.25 percent23.
Sudan ranked 143th out of 185 economies worldwide in the World Bank Doing Business Report 201324, while Rwanda ranked No. 52 and Egypt ranked No. 109. Sudan’s rank represents a further decrease by 3 ranks (140 in the 2012 report). Improvements were reached in the indicators starting a business and dealing with construction permit.
23 Ahmed Abou El-Yazeid, Sudan’s Small and Medium Enterprises, Thematic Paper prepared for the ILO/UNDP
project “SUDAN: Support to the development of a National Employment Framework”, September 2013.
24 Doing Business Sudan, World Bank, 2013.
Other metal works...
Greenhouses...
Folklore...
Cement...
Oils...
Plastic...
Ceramic...
Agricultural...
Pasteries &...
Décor...
Handcrafts...
Mouwlid...
Electronics...
Upholstery...
Automotive...
Car Denting...
Cooling...
Dairy Products...
Mining...
Leather...
Brick...
Electricity...
Foundry...
Plumbing...
Mechanics...
Sewing...
Lathing...
Metalworks...
Carpentry...
Cate
gory
Number of Enterprises
Distribution of Small and Micro Industrial Enterprises
0 50,000 100,000 150,000 200,000 250,000 300,000 350,000

18
Figure 1.5: Trend in international investments by number of enterprises (2000-2011)
Source: General Administration for research and projects -Ministry of Investment (2013)
According to the Sudan National Budget Household Survey (SNBHS) of 2009, about 46.6 percent of the Sudanese population lives below the poverty line25. This percentage goes as high as 62.7 percent in some poorer regions in the country. Data on poverty indicate that the categories of the population facing higher risk of poverty are the unemployed, less educated, members of large households, nomads, and people living in rural areas and engaged in own-account farming.
1.2 The development policy framework and employment promotion in Sudan
The main reference documents that define the development policy framework of Sudan are the second Five-Year National Development Plan (SFYP, 2012-2016); the Three-Year Salvation Economic Programme (2011-2013), and its follow-ups26; the Interim Poverty Reduction Strategy Paper (I-PRSP, 2012-2014); and the Twenty-Five Years National Strategy (2007-2031).
25 World Bank estimates based on Sudan’s 2009 National Budget Household Survey (NBHS).
26 The three-year Economic Programme for Stabilisation and Sustained Growth (EPSSG 2012-14).
76177
265
451
658
991
1339
15991768
1935
2500
2000
1500
1000
500
0
2160 2195
Num
ber o
f Ent
erpr
ises
Year
Industrial Services Agriculture Total
Y 2000 Y 2001 Y 2002 Y2003 Y 2004 Y 2005 Y 2006 Y 2007 Y 2008 Y 2009 Y 2010 Y 2011

19A Roadmap Toward A National Employment Policy For Sudan
The Government of Sudan has been unequivocal in its commitment to poverty reduction and the achievement of the Millennium Development Goals (MDGs). The MDGs were reflected in Sudan’s Interim Constitution as well as the Comprehensive Peace Agreement (CPA) as a prerequisite to achieve stability in Sudan. The National Strategy, which spans the 25-year period (2007-2031) has also made strong references and commitments to the MDGs. The new Five Year Development Plan (2012-2016) and its predecessor (2007-2011) have also made strong reference to the achievement of the MDGs in Sudan. The MDGs targets were set as a challenge in the Socio-cultural section of the Five Year Development Plan (Sudan MDGs Report, 2011).
At the broadest level, the 25-year strategic planning framework27 includes among its vision and goals related to employment, upgrading the labour force and reducing unemployment, building capabilities and skills to meet the needs of the labour market, giving due care to labour in the informal sector, approving equitable standards of labour, developing a labour market information base, and strengthening social dialogue between all those involved in the production process. The same goals are also articulated in Five Year Plans, and in poverty reduction plans and processes. The Interim PRSP (2012) has a chapter devoted specifically to economic growth and employment creation28. Particular attention is accorded to enabling the macro-economic environment for growth and private sector development; productivity and growth in agriculture; and economic infrastructure services for recovery and growth. These need to be seen together with extensive commitments to the development of human resources, the reduction of gender disparities through the empowerment of women, and social safety net programmes to protect the vulnerable poor. A key role for the government is identified as human development efforts that build a skilled labour force consistent with the demands of labour markets to foster innovation and productivity. The I-PRSP observes furthermore that, to create jobs and reduce unemployment, the Sudanese economy would have to be growing at 6.5 percent per annum.
The I-PRSP paves the way to a wide range of sector or cross-cutting policies, which can have either direct or indirect reference to job creation and employment. Some already exist and some will have to be formulated within a short timeframe. For example, the 2007 National Policy on Women’s Empowerment29 makes reference to the challenges of economic empowerment, whereby assets and credit are hard to obtain, rates of unemployment and poverty are on the increase, coupled with a drop in vocational and skills formation, and coverage through social safety nets also decreasing. Investment policies tend to be biased towards attracting (a few) big projects to the detriment of small-scale projects to which women are more likely to contribute and receive benefits. Objectives of the policy include the integration of the gender perspective into reforms and macro-economic policy
27 The Twenty Five Year National Strategy, 2007-2031, National Council for Strategic Planning.
28 Sudan: Interim Poverty Reduction Strategy Paper, 2012. This is listed as an interim paper, though information
was received during the mission that the draft as now been finalized without significant changes.
29 Women Empowerment National Policy, Ministry of Welfare and Social Security, March 2007.

20
based on the principles of fairness and equality; gender–sensitive budgeting; enhancing opportunities for women in non-traditional fields and promoting education capacities and skills, including the opportunity to obtain technology, knowledge and skill-training; and ensuring comprehensive coverage of social insurance.
Nonetheless, keeping focus on the socio-economic dimension becomes increasingly difficult at times of fiscal tightening, due to falling revenues. The 2011 Three-year emergency programme already envisaged several reforms to help revive the non-oil economy, particularly the agricultural sector. There was a commitment to more social protection, particularly to strengthen the existing mechanisms. The hope remains that the attention to social policies will translate into more resources for priority areas, starting with the 2014 budget30. Such a commitment has proven to be a successful formula also in other countries and contexts, as demonstrated by the ILO Global Job Pact31.
Policies and strategies naturally require the necessary institutional frameworks and capacities for implementation. Sudan has such examples. For instance, after the introduction of the Investment Encouragement Act, a Higher Council was formed under the chairmanship of the President to prepare and implement the Poverty Eradication Strategy and Program 32. In addition, a Higher Council for Employment Creation was formed in 2009, also under the guidance of the President of the Republic of Sudan. However, institutional capacities, coordination and sustainability are often challenging the continuation of these policy implementation mechanisms. For example, Sudan does not have yet a comprehensive migration management strategy. Many ministries and national institutions in Sudan are involved in various aspects of migration policy and management, but coordination appears to be limited.
The second Five-Year Strategic Plan (2012-16), which aims to diversify the economy away from oil to agriculture and other sectors, and the new Three-Year Emergency Austerity programme33, aided by the IMF, are expected to guide Sudan’s economic policy through 2012-17. While the oil decade, from 1999-2010, witnessed the strongest growth episode in the country’s history, there are now serious concerns about the negative impact of the post separation adjustments on real growth and social development. The immediate impact of the post-separation adjustment was fiscal: a supplementary budget had to be introduced in the second half of 2011 to accommodate the 35.6 percent loss in total revenue without jeopardising growth. In 2011, the BoS raised the reserve ratio by one percentage point up from 11 percent for 2010 and continued to use the nominal exchange rate as a nominal anchor to achieve price stability. The subsequent impacts of the post-separation adjustment have been perceived more intensely in the social sectors.
30 International Monetary Fund (IMF), Sudan: 2013 Article IV Consultation.
31 ILO’s 2009 Job Pact has been designed specifically to promote a “decent work” response to recovery
from the global economic and financial crisis.
32 Sudan Poverty Reduction Strategy Paper, June 2011.
33 The three-year Economic Programme for Stabilisation and Sustained Growth (EPSSG 2012-14).
21A Roadmap Toward A National Employment Policy For Sudan
The amended 2011 budget focused on cutting spending, increasing taxes and removing subsidies. Some safety nets for the public sector workers were introduced to mitigate the impact of fiscal consolidation, including an SDG100 across-the-board monthly bonus for civil servants, targeted income support for poor families and students, increased transfers to health insurance and additional resources for social development funds. However, similar measures are not being looked upon so favorably by the IMF34. The amended budget was based on the worst-case assumption concerning the outcome of the negotiations on the South oil transit fees, but it fell short of accommodating the full loss of oil revenue. Sudan’s economic performance has remained unfavorable, despite the introduction in June 2012 of yet another package of reforms35. The government has been asked again to move ahead with a three-year emergency economic programme introducing austerity measures aimed at cutting spending. This programme has partially removed subsidies on sugar and petroleum products, a step welcomed by the IMF but which resulted in prolonged large protests in the streets of Khartoum and in other parts of the country in October 2013. Sudan’s fiscal policy centres on restoring fiscal prudence at all levels of government by controlling expenditure in the medium term and using the non-oil deficit as a key fiscal indicator. It also focuses on strengthening accountability in the use of public funds, and on building capacity to improve the effectiveness of resource allocation including in the states where responsibility for front line service delivery lies. The reform process was expected to continue at full speed in 2013, through a second package of measures, which the authorities recently put together, but has yet to be fully implemented36. The policy recommendations emerging from the 2013 Article IV consultations require the GoS to take action on the following fronts: (i) fiscal adjustment grounded in a sound medium-term framework, including a gradual phase-out of fuel and wheat subsidies, and strengthening of social safety nets thus making way for higher quality spending; (ii) a tighter monetary stance to address high inflation and exchange rate pressures; (iii) unification of the exchange rates and markets together with further exchange rate flexibility; and (iv) further liberalization of the economy and improvement in the business environment in order to boost private sector-led growth.
There is growing concern that the fiscal adjustment, which focuses on spending cuts and tax increases, will seriously undermine pro-poor service delivery and the potential for long-term growth. Federal transfers to state governments, the main financing tool for service delivery under decentralisation, accounted for only 3.3 percent of GDP in 2011, down from the budgeted 4.1 percent share. The March 2013 agreement with South Sudan on oil and security matters is offering an opportunity to continue the adjustment process by implementing bold reforms to address the post-secession challenges. In long-term planning and strategic policy frameworks, employment needs to be placed more clearly among strategic goals, alongside (or together with) other strategic priorities such as poverty reduction and economic growth. Quite clearly, the GoS needs to explore alternative
34 International Monetary Fund (IMF), Sudan: 2013 Article IV Consultation.
35 For a description of the package, see IMF Country Report No. 12/298; September 7, 2012.
36 International Monetary Fund (IMF), Sudan: 2013 Article IV Consultation. Issued at the end of October 2013.

22
avenues for growth by attracting direct foreign investment and by providing support for agricultural diversification, including incentives to expand cash crop production into new areas and increase live-stock production in the areas of sheep and camels. The country also has a small agricultural processing base and the government has been active in developing industries, including assembly of small trucks and automobiles. On a positive side, the country has one of the most developed infrastructures and telecommunication systems in the region and, provided that political stability can be maintained, there are opportunities for expansion in the tourism sector, the processing and export of gold and the oil refinery sector. Policies need to be put in place immediately to enhance the employment impact of these emerging opportunities.

23A Roadmap Toward A National Employment Policy For Sudan
Chapter 2 – Labour Market Dynamics37
2.1. Demographic trends
The demographic profile of Sudan is characterised by a multifaceted tribal, ethnic and religious composition of the socio-cultural fabric, large internal and external migration, and continuous changes in the demographic structures, also driven by conflicts that spanned over two decades.
The Fifth Population and Housing Census (April 2008) estimated the total population of Sudan (North and South) at around 39.1 million, with women accounting for 48.7 percent of the population. At that time, it was also indicated that around 30.9 million Sudanese were residing in Northern Sudan and 8.2 million in Southern Sudan, thus providing a rough estimate of the population after the secession of South Sudan in 2011. Another important source of information on the characteristics of the population is the National Baseline Household Survey (NBHS, 2009). The 2011 Sudan Labour Force Survey (SLFS) estimated the total population of Sudan at around 30 million (48 percent women)38.
The age structure has changed significantly in the past decades. Sudan’s high population growth rate has resulted in a relatively young population and a high proportion of youth of working age at a time when fewer jobs are being created by the economy. According to the 2011 SLFS, the gender ratio for Sudan is 107 (108 in rural areas), which compares with 102 in 200239. Nonetheless, starting with the age-group 25-30 and up to the age-group 40-44 years old, women tend to outnumber men significantly, probably an indication of prevalence of male migration and a result of other dynamics. Around 60 percent of household members are in the working age population (age 15-64) in the urban areas, as opposed to 53 percent in rural areas.
The Sudanese population remains predominantly rural, with over 64 percent of the population still residing in rural areas. There is a higher incidence of urban population (81 percent), associated with internal migration flows, in Khartoum, which is also the most populous state, with over 5 million inhabitants (of which 35 percent are internal migrants, according to the 2008 Census).
37 Unless otherwise specified, reference is made to data and information that have been obtained through
the 2011 Sudan Labour Force Survey (abbreviated: 2011 SLFS).
38 The 2011 Sudan Labour Force Survey collected information relating to the demographic and social
characteristics of the Sudanese population residing in private households. The households residing in
institutions, the homeless, as well as Nomads were not covered in this survey. Therefore, data on the
population characteristics cannot be compared directly with the 2008 Population Census results.
39 UN Statistics Division, Department of Economic and Social Affairs. “World Population Prospects: The
2010 Revision”. Gender ratio = males per 100 females.

24
Figure 2.1: Age pyramid based on the 2011 SLFS
Source: Sudan Labour Force Survey (2011)
While there is no much difference in the old age dependency ratios between urban and rural areas, the child dependency ratio in rural areas is higher (82 percent vs. 60 percent in urban areas) and in both cases declining by around 5 percent compared to the 2009 NBHS. To assess the overall long-term impact on labour supply, these data need to be read in conjunction with the effects of out-migration, which is normally selective of young people in their reproductive years. According to the 2008 census, civil war, draught, desertification, lack of education and social services, and other push factors, such as lack of employment opportunities, have contributed to the migration to Khartoum state. The analysis shows that, after Khartoum, the Eastern and Central regions have been the most attractive destination areas for migrants, resulting in net losses of population due to internal migration in the states of North Kordofan, South Kordofan, and West Darfur.
Sudanese emigration includes both labour and other groups of migrants. Sudanese citizens and people with Sudanese origin currently living abroad can be estimated at between 1.2 and 1.7 million people. However these figures need to be taken with caution due to different coverage and systems, missing data and limited comparability. Beside the economic migrants (between 880,000 and 1,330,000), UNESCO also reports that around 3,000 Sudanese leave Sudan for tertiary education each year to the West as well as other countries such as Malaysia, Egypt, Uganda, Kenya, India and Pakistan. Anecdotal evidence
65 +
60 - 64
55 - 59
50 - 54
45 - 49
40 - 44
35 - 39
30 - 34
25 - 29
20 - 24
15 - 19
10 - 14
6 - 9
65 +
60 - 64
55 - 59
50 - 54
45 - 49
40 - 44
35 - 39
30 - 34
25 - 29
20 - 24
15 - 19
10 - 14
6 - 9
FemaleMale
4,000,000 2,000,000 0 2,000,000 4,000,000 5,000,000 3,000,000 1,000,000 1,000,000 3,000,000 5,000,000
25A Roadmap Toward A National Employment Policy For Sudan
seems to confirm that one of the preferential routes to emigration of highly skilled Sudanese is through the pursuit of undergraduate and postgraduate studies abroad40. Immigration flows from outside Sudan are mostly from neighbouring countries and represent a typical case of South-South migration. The stock of foreign-born population in 2010 was estimated at around 750,000 people. The informal nature of human mobility from neighbouring countries and the existence of an irregular migration phenomenon in the country mean that the total number of foreign nationals in Sudan could be much higher41.
Many indicators show the high incidence of poverty and difficult socioeconomic circumstances in Sudan.
According to recent IFAD reports, extreme poverty has declined from about 85 percent in the nineties to about 60 per cent in 2009, although with significant regional disparities. Poverty is mostly a rural phenomenon, often associated with rain-fed agriculture livelihood systems, which often determines massive requests of food assistance (IFAD data from 2007 and 2009). IFAD estimated that in 2007 more than half of people were living below the poverty line of US$ 1 a day and about almost the half in rural areas were surviving under abject poverty conditions, notably in the conflict-affected areas. According to the same organization, in the northern region the income per capita changed from US$ 340 in 2001 to around US$ 800 in 2006. On the other hand, in Southern Sudan, the average annual GDP per capita was estimated at US$ 100 in the same year, i.e. well below the average of sub-Saharan African countries (IFAD, 2007). According to the 2011 Sudan Labour Force Survey, about one-third of households live in small (one-floor) constructions made of mud bricks, 25 percent in “Gottiya” made only of sticks, and 20 percent in one-floor constructions made of concrete. In the same report, subsistence crop farming (36 percent) and paid employment/wages (36 percent) are recorded as the main source of livelihood for families, while 3 percent of households indicate remittances as the main source of their livelihood. Through the latest Labour Force Survey results, the Ministry of Human Resources Development and Labour has tried to calculate the number of working poor42. It is estimated that about 30 percent of people who are employed in Sudan reside in households that, despite the income from holding a job, live below the poverty line. This information carries important policy considerations, as it points to the fact that simply having a job cannot be considered a vehicle out of poverty for many people. Thus, policy-makers must devote attention to the quality of jobs that are being created in the economy.
40 International Organization for Migration (IOM), Migration in Sudan: A Country Profile, 2011. p. 19-20.
41 Ibidem.
42 The proportion of employed people living below the poverty line (working poverty rate) is one of the
Indicators selected for the Millennium Development Goals (MDGs). The working poor are defined as
employed persons living in a household whose members are estimated to be below the nationally defined
poverty line or the international poverty line of US$1.25 a day. Due to data constraints, particularly with
income data, some proxies were used in the formula used for the estimation. The poverty line used, with
reference to the year 2011, is SGD 152 per person per month.

26
2.2. Trends in education
According to the UNESCO Institute for Statistics, in 2011, the adult literacy rate in pre-secession Sudan was around 71.1 percent (80.1 and 62 percent for men and women, respectively). In the same year, the youth literacy rate (people aged 15 to 24 years old) was recorded at 86.7 percent, with a less noticeable gender gap (83.6 percent for women and 89.6 percent for men)43. The 2008 Fifth Population Census estimated the literacy rate for the (then Northern) Sudanese population aged 6 and over at 57.2 percent (63.3 and 51 percent for men and women, respectively), compared to 52.3 percent in 1993. Significant differences were reported at that time between urban and rural areas, while the overall literacy rate for the nomadic populations was significantly lower (at 15.6 percent). In the same year, the literacy level of young people (15-24) was 67 percent overall (71.4 and 62.8 percent for men and women, respectively), but significantly higher in urban (86.7 percent) than in rural areas (62.5 percent), where young women were even more disadvantaged (56.9 percent) than their male peers. Compared to 1993, slight improvements were registered for men and women, as well as in urban and rural areas. Although relatively more women than men were illiterate, the relative improvement from 1993 to 2008 was almost of the same order for both sexes in (Northern) Sudan44.
The Sudan Education Status Report (2011) indicates that student enrollments have expanded for all sub-sectors of education since 2000. The fastest growth in enrollments since 2000-01 has occurred in pre-school (10 percent per year), followed by higher education (7 percent per year), secondary education (6 percent per year) and basic education (5 percent per year). According to the I-PRSP (2012), with a gross enrollment rate of 77 percent, the number of those who have never attended school is still very high. Although rates of schooling and literacy have substantially increased, it was estimated that out of a population of over six million 10-17 year-olds in northern Sudan, one in six, or close to one million, never attended school in 2010. Of these out-of-school children, 62 percent are girls, and 84 percent are from rural areas. The longer distances to schools in rural areas may pose more of a constraint to school attendance for girls than for boys, in addition to early marriage for girls and the lower value assigned to girls education by parents in rural areas. According to the Millennium Development Goals progress report 201045, the gross enrolment rate in primary education in northern Sudan was 71.1 percent in 2009. However, only 70 percent of those who enrolled were able to reach the last year of basic education (8
43 http://www.uis.unesco.org/literacy/Pages/adult-youth-literacy-data-viz.aspx. Last accessed on 19
December 2013. The adult literacy rate is measured for the population over 15 years old.
44 http://www.uis.unesco.org/literacy/Pages/adult-youth-literacy-data-viz.aspx. Last accessed on 19
December 2013. The adult literacy rate is measured for the population over 15 years old.
45 National Population Council General Secretariat, Ministry of Welfare and Social Security, The Republic of
Sudan (NPC/GS) “Sudan Millennium Development Goals Progress Report 2010, Ministry of Welfare and
Social Security National Population Council General Secretariat.
http://www.sd.undp.org/doc/Sudan%20MDGs%20Report%202010.pdf

27A Roadmap Toward A National Employment Policy For Sudan
years). Thus, in basic education drop outs have remained high, estimated at 7 percent per grade. For those who remain in school, transition rates between the cycles are relatively high: about 74 percent of basic school completers continue in secondary education, and about 87 percent of secondary school completers continue in higher education. Retention at the secondary level, at 74 percent, is lower than in primary education when adjusted for length of the cycles. A retention rate of 74 percent corresponds to a dropout rate of 13 percent per year in the first two years of the cycle. The Census data (2008) highlights wide disparities in educational enrolment between men and women. For instance, the female enrolment rate in secondary education is 32.4 percent compared to 34.1 percent for males. The secondary school net attendance rate was 18.9 percent in 2006, according to the Sudan Household Health Survey 200646. The imbalance in terms of education and other social services contribute significantly to the increasing flow of rural-to-urban migration. Early school leavers tend to move to urban areas and feed the ranks of own-account workers and employees in informal enterprises.
The number of academic secondary schools has increased significantly since 2004-05, leading to smaller schools and lower student-teacher ratios. At this level, the average school size has dropped from 269 students per school in 2004-05 to 212 students per school in 2008-09. The student-teacher ratio also dropped from 19 to 17 over the same period. There has been an expansion in the number of technical secondary schools and teachers, but no growth in enrollments, according to available statistics (I-PRSP). From 1990s, tertiary education has rapidly expanded in Sudan with the number of universities going from 4 in 1990 to 30 public and 6 private universities, in addition to 48 specialized degree granting colleges (data from 2011). In 1990, student intake was 6,000 per annum; this has risen to an annual intake of 160,000 with a student population exceeding 500,000, equivalent to an enrolment rate of 10 percent of the relevant population. Over half of the students are girls. Expansion has not been accompanied by matching financial resources and the quality of tertiary education has been deteriorating.
46 Government of National Unity, Government of Southern Sudan, Sudan Household Health Survey (SHHS)
2006. http://www.childinfo.org/files/MICS3_Sudan_2006_FinalReport_En.pdf

28
Table 2.1: Working age population by educational attainment,sex and age-group, 2011 (percentage)
Illiterate Primary/Basic Secondary Tertiary Total
Total
Young (15-29) 9.3 24.1 12.4 5.3 51.1
Adults (30-64) 20.8 14.8 9.4 3.9 48.9
Total 30.1 38.9 21.8 9.2 100.0
Men
Young (15-29) 6.6 25.7 13.3 5.0 50.5
Adults (30-64) 15.8 17.2 11.8 4.7 49.5
Total 22.4 42.8 25.1 9.7 100.0
Women
Young (15-29) 12.1 22.6 11.5 5.5 51.7
Adults (30-64) 25.9 12.4 6.9 3.1 48.3
Total 38.0 35.0 18.4 8.7 100.0
Source: Adaptation from the results of the 2011 Sudan Labour Force Survey (SLFS)
As illustrated by the UNDP’s Human Development Index (HDI), human capital formation in Sudan is generally low by regional and international standard. Since the early 1980s, the country has been faring not only below the regional average for other Arab States, but also below the level categorized as “low human development”. Moreover, the Labour Force Survey reports that in 2011, one third of the people of working age (15 years old and above) are illiterate, while 37.4 percent have attained only primary/basic education. This implies that the share of those considered highly-skilled (having attained secondary and tertiary education qualifications) among the working age population is still limited (at less than 30 percent).
Figure 2.2: Human Development Index: Trends 1980 - 2012
Source: UNDP, Human Development Reports
1.0
0.9
0.8
0.7
0.6
0.5
0.4
0.3
0.2
0.1 1980 1985 1990 1995 2000 2005 2010
Arab States Low human development World Sudan

29A Roadmap Toward A National Employment Policy For Sudan
2.3. Labour market
Labour Force and Migration surveys were conducted in 1990 and 1996. However, plans to have an annual Labour Force Survey (LFS) did not materialize until 2011. The data collection for the latest LFS begun in December 2011 and was completed around mid-January 2012. The 2011 Sudan LFS (SLFS) represents the main source of labor market statistics for Sudan. For the prior years, some labour market data can be derived from the Population and Housing Census (PHC, April 2008), the National Baseline Household Survey (NBHS, 2009), and administrative data.
Age and gender trace major divides on the labour market. The youth labour market is characterised by low participation and employment rates and high unemployment rates. Women are disproportionally affected by employment challenges. While young women in the years of transition (15-24 years of age) are the most disadvantaged in absolute terms, the labour market performance of female prime-age workers (measured in terms of participation, employment and unemployment) poorly compares to that of their male peers.
Table 2.2: Key labour market indicators by age-group and sex, 2011 (percentage)
Age groups Participation rate Unemployment rate
(ILO definition)
Employment rate
All
15 + 50.5 18.5 41.1
15 to 24 30.9 33.8 20.4
25 to 64+ 61.0 14.5 52.0
Men
15 + 70.8 11.4 61.4
15 to 24 40.5 22.2 28.9
25 to 64+ 86.7 9.6 78.4
Women
15 + 28.9 37.0 19.6
15 to 24 20.6 57.9 11.4
25 to 64+ 33.2 28.0 23.9
Source: Adaptation from the 2011 SLFS
2.3.1. Labour force participation
The labour force participation rate is one of the indicators that underscore the striking difference between men’s and women’s performance in the labour market. While the overall labour force participation rate of men is 66.8 percent in urban areas and 73.3 in rural areas, for women it goes down to 26.1 and 30.7 percent, respectively. Table 2.3 below shows the labour force participation rates (for the population over 15 years old) in the different States.

30
Table 2.3: Labour Force Participation Rate (15 +)by State, rural/urban area and sex, 2011 (percentage)
State Urban Rural
Total M W Total M W
Sudan 46.8 66.8 26.1 52.8 73.3 30.7
Northern 46.4 77.5 19.0 40.1 70.3 12.1
River Nile 48.4 74.6 22.1 45.2 77.1 11.5
Red Sea 43.9 70.0 17.0 42.7 73.3 6.7
Kassala 44.0 75.0 18.1 45.7 75.9 2.7
Al-Gadarif 47.6 68.3 25.1 53.6 78.8 26.3
Khartoum 46.3 64.3 27.0 45.6 74.9 12.7
Al-Gezira 45.0 64.2 25.8 46.1 71.4 20.3
White Nile 40.7 66.6 14.3 44.1 74.0 10.9
Sinnar 47.1 70.9 21.9 44.0 70.0 13.9
Blue Nile 51.3 75.7 27.9 54.6 81.6 24.3
N.Kordufan 51.8 76.5 26.1 65.4 79.4 51.6
S.Kordufan 54.2 73.5 36.8 59.7 75.8 42.2
N.Darfur 49.7 62.6 36.4 52.3 60.4 43.7
W.Darfur 52.8 59.6 45.5 69.8 69.1 70.5
S.Darfur 47.4 62.6 31.2 66.2 72.5 59.3
Source: 2011 Sudan Labour Force Survey (SLFS), draft Report, p.31
The cases of Kassala and Red Sea State warrant further investigation, as both urban and rural female residents show dramatically low labour force participation in a context where for men participation is above the national average. At the national level, male labour force participation seems to rise starting with the 25-29 age-group and tends to remain pretty high throughout, with a sharp decline after 65 years old. In 2011, young people in the labour force represented 30.9 percent of the population aged 15 to 24 years old, compared to a national average of 50.5. The participation of young women in the labour force is as low as 20.6 percent of the population. The average low participation rate of young people is therefore mostly due to school attendance (around 66.5 percent of the youth population out of the labour force is in education and training) and the low participation of young women.
31A Roadmap Toward A National Employment Policy For Sudan
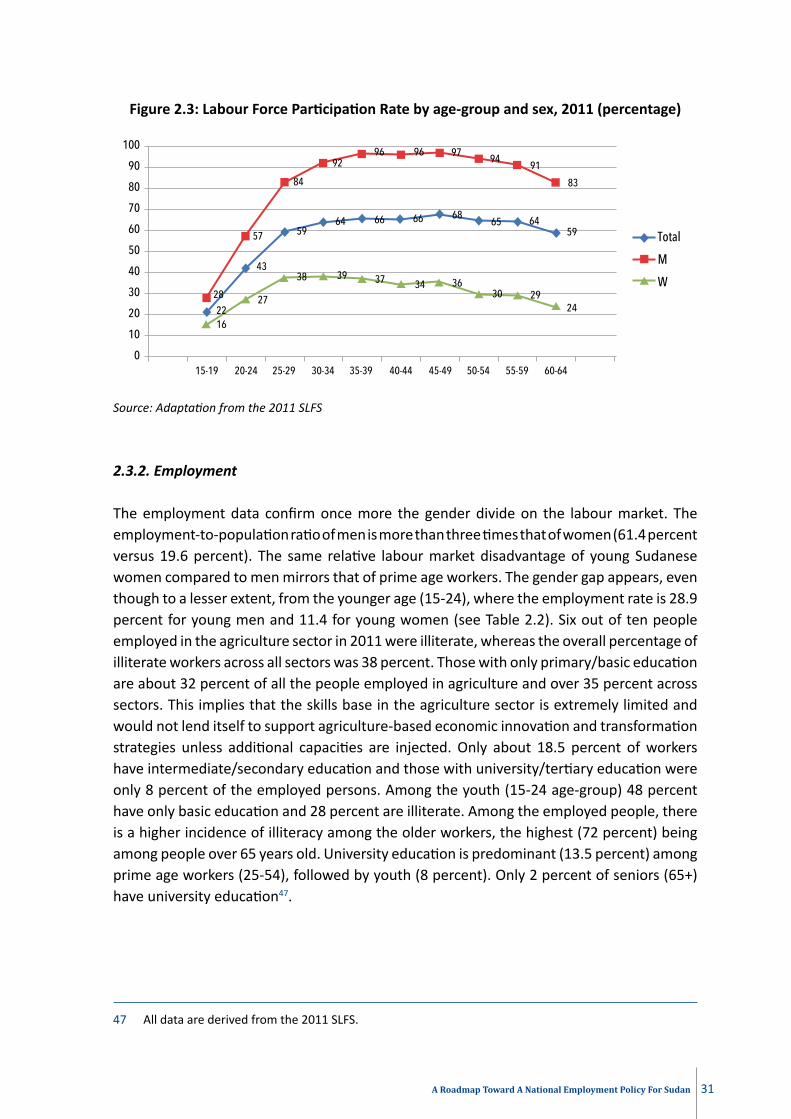
Figure 2.3: Labour Force Participation Rate by age-group and sex, 2011 (percentage)
Source: Adaptation from the 2011 SLFS
2.3.2. Employment
The employment data confirm once more the gender divide on the labour market. The employment-to-population ratio of men is more than three times that of women (61.4 percent versus 19.6 percent). The same relative labour market disadvantage of young Sudanese women compared to men mirrors that of prime age workers. The gender gap appears, even though to a lesser extent, from the younger age (15-24), where the employment rate is 28.9 percent for young men and 11.4 for young women (see Table 2.2). Six out of ten people employed in the agriculture sector in 2011 were illiterate, whereas the overall percentage of illiterate workers across all sectors was 38 percent. Those with only primary/basic education are about 32 percent of all the people employed in agriculture and over 35 percent across sectors. This implies that the skills base in the agriculture sector is extremely limited and would not lend itself to support agriculture-based economic innovation and transformation strategies unless additional capacities are injected. Only about 18.5 percent of workers have intermediate/secondary education and those with university/tertiary education were only 8 percent of the employed persons. Among the youth (15-24 age-group) 48 percent have only basic education and 28 percent are illiterate. Among the employed people, there is a higher incidence of illiteracy among the older workers, the highest (72 percent) being among people over 65 years old. University education is predominant (13.5 percent) among prime age workers (25-54), followed by youth (8 percent). Only 2 percent of seniors (65+) have university education47.
47 All data are derived from the 2011 SLFS.
Total
M
W
83
9194
979696
84
57
28
43
5964 66 66 68
65 6459
2216
27
38 39 37 34 3630 29
24
92
100
90
80
70
60
50
40
30
20
10
0 15-19 20-24 25-29 30-34 35-39 40-44 45-49 50-54 55-59 60-64

32
Table 2.4: People employed by economic sectorand educational attainment (percentage)
Agriculture Industry Service Total
Illiterate 26.8 3.4 7.6 37.8
Primary/ Basic 14.5 7.3 13.6 35.4
Secondary (general) 3.0 3.7 11.8 18.5
Tertiary/ University 0.4 0.9 7.0 8.3
Total 44.6 15.3 40.1 100.00
Source: Adaptation from the 2011 SLFS
Table 2.5: People employed by status and educational attainment (percentage)
Employees Self-employed Contributing family
members
Total
Illiterate 9.2 21.5 7.8 38.5
Primary/ Basic 14.9 16.3 4.0 35.2
Secondary 11.4 6.2 0.6 18.2
Tertiary/ University 6.8 1.2 0.1 8.1
Total 42.3 45.2 12.5 100.0
Source: Adaptation from the 2011 SLFS
Figure 2.4: People employed by status, 2011 (percentage)
Source: Adaptation from the 2011 SLFS
12.5
42.3
5.7
39.5
Employee
Employer
Own Account Workers
Unpaid Family Workers

33A Roadmap Toward A National Employment Policy For Sudan
While the percentage of wage-employees in 2011 is comparable to 2009 (NBHS), a 5 percentage point increase is registered for own-account workers, leading to assume that an increase in vulnerable employment has occurred. Workers in vulnerable employment48 amount to 52 percent of total employment and represent around 42 percent of all workers with low educational attainment. Women are much more at risk of being in vulnerable employment compared to their male peers (66.2 percent and 47.7 percent, respectively), even though men represent the largest share of the almost 4 million workers in vulnerable employment (around 70 percent). About 86 percent of female employment in rural areas and over 75 percent of employment in the agriculture sector are to be considered as a form of vulnerable employment. As it could be expected, the agriculture sector also presents the highest incidence of unpaid family work (estimated at 26.3 percent in 2011).
Figure 2.5: Vulnerable employment by sex, 2011 (percentage)
Source: Adaptation from the 2011 SLFS
48 Vulnerable employment is the share of self-employed (without employees) and contributing family
members in total employment.
5247.7
66.2
31.2 32.5 30.6
62.156
85.790
80
70
60
50
40
30
20
10
0
Sudan Urban Rural
Total Men Women

34
Table 2.6: Distribution of employment (15 years old and above)by major occupational group and sex, 2011 (percentage)
Major occupation Sudan Urban RuralTotal M W Total M W Total M W
Managers 0.6 0.7 0.3 1.3 1.4 0.8 0.3 0.4 0.1Professionals 6.8 4.8 13.2 12.8 8.6 29.5 3.7 2.7 6.4Technicians & associate professionals
3.1 3.1 3.0 5.5 5.1 6.7 1.8 1.9 1.5
Clerical support 2.3 1.9 3.6 5.3 3.9 10.8 0.7 0.8 0.6Services & sales 18.6 20.6 11.9 26.5 27.2 24.0 14.5 17.0 6.9
Skilled agricultural, forestry & fisheries
37.1 31.9 54.4 7.0 6.3 9.6 52.6 45.9 72.9
workers Craft & related
12.3 15.4 1.9 19.2 23.4 2.1 8.7 11.0 1.8
Plant and machine operators
6.5 8.2 0.5 10.5 12.8 1.3 4.4 5.7 0.2
Elementary occupation
11.2 11.2 11.0 9.0 7.6 14.5 12.3 13.3 9.5
Not stated 1.5 2.2 0.2 2.9 3.7 0.7 1.0 1.3 0.1
Source: 2011 SLFS, draft Report, p. 39.
In 2011, part-time employment49 represented 31 percent of total employment, with no significant gender difference in urban areas, but with a higher incidence among men in rural areas (35 percent of men and 30 percent of women).
49 In the case of Sudan, given the structure of the LFS questionnaire and in the absence of any country-
specific considerations, “working less than 40 hours a week” was used s a cut-off point to identify part-
time workers (i.e., those working up to and including 39 hours are considered part-timers). This does
not allow much comparability. While there is no agreed standard to identify part-time work, a cut off at
around 30 hours is widely used in the OECD and elsewhere.

35A Roadmap Toward A National Employment Policy For Sudan
2.3.3. Informal employment
Engagement in the informal economy is often associated with low earnings, poverty, and vulnerability. The current questionnaire of Sudan’s Labour Force Survey does not allow to draw estimates on informal employment50 in Sudan. However, there are some criteria that can be used to estimate informal sector employment51. Overall, the total number of people engaged in the informal sector represents about 25 percent of total employment. This is of course an underestimate (or only a portion) of informal employment in Sudan. Moreover, it should be considered that about 65 percent of prime age workers (those aged between 25 and 54 years old) are engaged in the informal sector. One out of five people in informal sector employment is a youth aged 15-24 years.
Informality is also a practice closely linked to certain sectors and occupations, such as agriculture and low-skilled services (see Table 2.4). However, a distinction should be made between agriculture, where own-account employment on family land is often the norm, and other sectors of the economy, where it becomes a signal of slow growth in urban formal employment.
50 To the layperson, the terms “informal sector”, “informal economy”, “employment in the informal
sector” and “informal employment” might all seem to be interchangeable. They are not. The nuances
associated with each term are extremely important from a technical and policy point of view. Within
the term “informal employment”, it is the quality (or lack thereof) of the job that is being taken into
consideration. Statistically, it represents the total number of informal jobs, whether carried out in
formal sector enterprises, informal sector enterprises, or households; including employees holding
informal jobs; employers and own-account workers employed in their own informal sector enterprises;
members of informal producers’ cooperatives; contributing family workers in formal or informal sector
enterprises; and own-account workers engaged in the production of goods for own end use by their
household (based on 17th International Conference of Labour Statisticians).
51 Employment in the informal sector includes all jobs in informal sector enterprises, or all persons who
were employed in at least one informal sector enterprise, irrespective of their status in employment and
whether it was their main or a secondary job. In this case, the characteristics of the enterprise (place
of work) determine the informal nature of the job. In the case of Sudan, the criteria used in the SLFS
Report to estimate the informal sector employment was: those aged 10 years and above, who reported
‘no specific place of work’ in response to question 209, and number of workers (less than 5) in response
to question 212. In our analysis above, we refer to people aged 15 years and above.

36
Table 2.7: Distribution of employment (15 years old and above)in the informal sector by main economic activity and age-group, 2011 (percentage)
Main economic Activity
Age groups
15 - 24 25 - 54 55 – 64 65 +
Agriculture, forestry and fishing 26.26 60.84 7.63 5.27Mining and quarrying 34.90 59.67 5.42 0.00Manufacturing 16.85 65.72 9.55 7.89Construction 23.94 65.91 6.38 3.77Wholesale and retail trade; repair of vehicles
12.37 70.40 10.05 7.18
Transportation and storage 16.41 73.83 7.12 2.64Other activities 17.47 61.28 15.83 5.42All 20.01 66.96 8.20 4.83
Source: Adaptation from the 2011 SLFS
2.3.4. Wages and other conditions of work
The 2011 SLFS recorded a 47 percent gender pay gap. The gender income difference was more or less constant across urban and rural areas, even though the average monthly wage of women in rural areas was slightly below the (then) monthly minimum wage (250 SDG52).When asked about the availability of occupational safety elements at the workplace53, only 15 percent of Sudanese workers answered positively, while others indicated that there were none (70 percent) or that workers were not aware of their existence (6 percent).
2.3.5. Unemployment
According to the NBHS, in 2009, the unemployment rate of people aged 15 years old and above in the 15 Northern States was 13 percent (9 percent for men and 23 percent for women). The unemployment rate was estimated at 10 percent in urban areas and 13 percent in rural settings. These rates calculated in the NBHS 2009 were lower than those reported in the 2008 Population Census. In 2009, women had a higher unemployment rate than men across all age groups, ranging from 32 percent for young women 15-24 years old to 14 percent for women 45-54 years old. Young men and women aged 15-24 years old
52 As of January 2013, the minimum wage was raised to 425 SDG.
53 The question was asked to those who were employed at the time of conducting the LFS and those who
had previously worked.
37A Roadmap Toward A National Employment Policy For Sudan
had the highest unemployment rate, at 20 percent. The overall unemployment rate for the population 15 years and above was lowest in the Blue Nile State (4 percent) and highest in Northern Kordufan State (22 percent).
According to the 2011 SLFS, the overall unemployment rate (strict definition) was 18.5 percent for people aged 15 years and above (11.4 percent for men and 37 percent for women). Women’s unemployment is significantly higher, up to three times as high compared with men. The unemployment rate in urban areas is higher (22.8 percent) than in rural areas (15.3 percent). This may be due to the fact that more people are engaged in agricultural activities in rural areas. Normally higher levels of education are inversely correlated with unemployment. However, in Sudan unemployment is recorded at levels that appear relatively higher for the highly-skilled individuals54. Thus, from a policy perspective, it would be as important to understand the skills composition (educational attainment) of the inactive population, including those who are discouraged. The unemployment rate for those with ‘university/tertiary’ level of education was 23.3 percent in 2011. The rate of unemployment for those with ‘Intermediate/secondary education’ (22.3 percent) was comparable with the unemployment of those illiterate (21.4 percent), but lower than the unemployment rate of those with ‘basic education’ (32.7 percent). The educational profile of the unemployed indicates one out of four has university/tertiary education. Twenty-six percent of the unemployed persons in Sudan reside in Khartoum and 44 percent of them have university/tertiary education. The incidence of unemployment among young people (15-24 years of age) is reported twice as high as for the rest of the population, with young women two and a half times more likely to be unemployed than their peers. In 2011, there were 1.66 million unemployed persons in Sudan and half of them had been unemployed already for 12 months. Eight out of ten reported as main reason for being unemployed that there were no jobs; 5 percent indicated inappropriate wages or inconvenient work. Long-term unemployment rates (12 months or more) for young people (15-24 years old) and prime-age workers (25-54 years old) were similar (55 percent and 50 percent, respectively). While 15 percent of the unemployed were seeking employment in the public sector, only one out of ten would think of approaching the labour office or the perspective employers. About 50 percent of them were seeking job through relatives.
54 This finding is not surprising. The “Statistical update on Arab States and Territories and North African
countries” published by the ILO Department of Statistics in May 2011, indicates that unemployment
is relatively higher for those with medium and advanced levels of education (or high skilled). This
corresponds to the fact that the share of high-skilled unemployment in total unemployment is higher,
on average, than the share of high-skilled economically active population (EAP) in total EAP.

38
Table 2.8: Educational profile of the unemployedby rural/urban area and sex, 2011 (percentage)
Illiterate Primary/Basic Secondary Tertiary TotalTotal
Urban 2.6 11.9 13.6 16.5 44.6Rural 18.8 21.1 8.7 6.8 55.4Total 21.4 33.0 22.3 23.3 100.0
MenUrban 2.2 13.1 12.3 13.4 41.0Rural 16.8 26.2 9.2 6.8 59.0Total 19.0 39.3 21.5 20.2 100.0
WomenUrban 3.1 10.5 15.0 19.9 48.4Rural 21.0 15.5 8.2 6.8 51.6Total 24.1 26.0 23.2 26.7 100.0
Source: Adaptation from the 2011 SLFS
Table 2.9: Youth unemployment indicators, 2011 (percentage)
% Sudan Urban RuralTotal M W Total M W Total M W
Youth unemployment rate 33.8 28.6 44.8 49.4 38.5 74.1 27.0 24.0 32.9
Adult unemployment rate 14.5 9.6 28.0 17.2 10.2 36.4 12.8 9.2 22.9
Ratio of youth-to-adult unemployment rate
2.3 3.0 1.6 2.9 3.8 2.0 2.1 2.6 1.4
Youth share of total unemployment
38.4 42.2 34.2 38.3 43.4 33.5 38.5 41.4 34.8
Youth not in employment, education or training (NEET)
28.3 20.3 36.8 29.9 20.8 39.3 27.3 19.9 35.1
Source: 2011 SLFS, draft Report

39A Roadmap Toward A National Employment Policy For Sudan
Figure 2.6: Youth and adult unemployment rate by urban/rural area and sex
Source: SLFS draft Report, page 53.
2.3.6. Inactivity
In 2011, over 8.8 million people of working age in Sudan resulted to be inactive (i.e. almost 50 percent of the working age population), with women representing about 70 percent of this group. In absolute terms, the majority of inactive people concentrates in the age group 15-24 years old (more than 51 percent of the total number) and in the rural areas of the country (over 5 million people overall). The main reasons for inactivity are full-time schooling or, in the case of women, being full-time engaged in home-making. As a result, out of ten women of working age in Sudan, seven would be economically inactive, while only two would be employed. In the case of men, the incidence of inactivity among the working age population appears to be lower (three out of ten are inactive, while six out of ten would be employed); slightly different is the situation in rural areas, where five men out of ten are inactive and only four result to be employed (see Table 2.10).
0 10 20 30 40 50 60 70 80
F
M
MF
F
M
MF
F
M
MF
Suda
n Ur
ban
Rura
l23
33
249
1327
3674
49
58
1039
17
28
1022
1534
Adult (25 & above)
Yoth (15-24)

40
Table 2.10: Economic Activity status of the Working Age population (15 years old and above) by urban/rural area and sex, 2011 (percentage)
Employed Unemployed(ILO definition)
Inactive
AllSudan 41.1 9.4 49.5Rural 44.3 8.5 47.2Urban 36.1 10.7 53.2
MenSudan 61.4 9.4 29.2Rural 64.3 9.0 26.7Urban 36.1 10.7 53.2
WomenSudan 19.6 9.3 71.1Rural 22.9 7.9 69.3Urban 14.6 11.5 73.6
Source: Adaptation from the 2011 SLFS
Table 2.11: Inactive youth (15-24) by educational attainment (percentage)
Educational Attainment In school Discouraged Other inactive Total Illiterate 0 1.9 8.9 10.8Primary/Basic 34.5 3.8 12.7 51.0Secondary (general) 25.0 1.1 4.2 30.3Tertiary/ University 7.0 0.4 0.5 7.9Total 66.5 7.2 26.3 100.00
Source: Adaptation from the 2011 SLFS

41A Roadmap Toward A National Employment Policy For Sudan
Chapter 3 – Sectoral Policies: The role of Micro, Small, and Medium-size Enterprises (MSMEs) and the private sector
3.1 Review of the current policy environment and challenges
With regard to growth and employment generation, the Interim Poverty Reduction Strategy Paper (I-PRSP, 2012) emphasizes the importance of mobilizing domestic and foreign investment in non-oil sectors to promote diversification and productivity growth. The I-PRSP identifies two policy areas of focus for the forthcoming years: “(i) targeted support for the agricultural sector, including livestock, forestry and fisheries, to promote growth and productivity change; and (ii) broad support for private sector development, with policies, institutions, incentives and infrastructural services to promote investments, innovation, productivity growth and employment creation in all sectors of the economy”55.
Sudan’s Ministry of Investment (MoI) operates a service window (one-stop-shop) to assist investors to overcome administrative hurdles (business registration, licensing, land issues, immigration, property registration, and taxation issues) and to facilitate access to the incentives under the Investment Encouragement Act (IEA). Amended in 2003, the IEA promotes investments in the agriculture, industry and service sectors. Foreign and domestic investors have access to the same type and level of incentives. These incentives include low profits tax (15 percent for the service sector and 10 percent for industry and agriculture); exemptions from customs duties for machinery and equipment including commercial vehicles; reduced duties on intermediate inputs and spare parts; and access to land below commercial prices. In addition, the Act provides for unlimited transfers of profits and salaries by foreign employees; and guarantees against nationalization and confiscation, in line with the protocols of bilateral and multilateral agreements that Sudan is party to (such as under the Multilateral Investment Guarantee Association, COMESA, and the Arab League). After the signing of the Comprehensive Peace Agreement (CPA) in 2005, Sudan has attracted substantial amounts of foreign direct investment (FDI), mostly from Asia and the Gulf. Investments have been directed predominantly to the oil sector and to economic activities benefiting the central region of the country. According to the MoI, for the period 2000-2010, overall recorded investment in the services sector was predominant, accounting for 57.8 percent, with industry at 38.6 percent, and agriculture only at 3.8 percent. The sources of investment were local investors (57 percent), joint ventures of local and foreign investors (18.4 percent) and foreign direct investment (24.6 percent). Eighty percent of the investment in the service sector was by local investors and joint ventures. Investment generally picked after the CPA but appeared to have lost momentum after 2009, perhaps due to the political uncertainties.
After two decades of neglect, the I-PRSP makes an effort to bring agriculture, including livestock, forestry and fishery back on Sudan’s growth agenda. There is a general consensus
55 Interim Poverty Reduction Strategy Paper (I-PRSP), p. 50.

42
that Sudan natural resources can boost its potential to be a large producer and exporter of agriculture products, with substantive impact on poverty reduction in the rural areas and growth in exports56. However, as indicated above, the agriculture sector still lacks the level of investment, both private and public, and the scale to fully exploit its potential. A large share of those working in rural settings still practices rain-fed traditional agriculture. Moreover, with the declining revenues from the oil sector and the limited savings realised, it remains doubtful that there will be sufficient national financial resources in the future, and hence, allocations to promote solid infrastructure development for the growth of small and medium-sized enterprises in Sudan.
Sudan still does not have a law in support to small and medium enterprises (SME Law), nor a specialized national entity dealing with the specific needs and challenges of SMEs57.
The overlap of the roles and responsibilities of the government entities and the absence of effective coordination between them limits the capacity of ministries to set policies, strategies and plans for the development of the SME sector. Furthermore, the sector is facing competition from abroad, especially with regard to imported products from China, due to the low quality and competitiveness of Sudanese SME products. The fluctuation in the prices of raw materials, especially imported inputs, is one of the most significant challenges facing small and medium enterprises in Sudan. Sudanese SME owners often fail to identify market opportunities and other needs of the domestic and international markets due to the limited available information on the marketplace. The unavailability of information and studies on the SME sector, growth rates, competitiveness, economic clusters, value chains and market opportunities is largely due to the lack of necessary infrastructure and systems for data collection and analysis. Although there are some business development services and programmes that provide training for entrepreneurs, their capacity and outreach is confined. It is also difficult for them to get access to modern technology and to continue their creative production due to absence of supportive policies for technology transfer. Some of the Sudanese universities have established incubators for small enterprises, but they are mainly managed as practical training labs for students. For example, the leather incubator
56 Livestock is a leading agricultural export product of Sudan. There are some 69 million sheep and goats
in Sudan, concentrated in the two poorest regions, Kordofan and Darfur, and exported to neighboring
middle-eastern countries. There is considerable scope for growth in livestock to meet both domestic
and export demands.
57 Working definitions were developed by the General Federation of Sudanese Employers and the Central
Bank of Sudan are as follows:
• Microenterprise: A sole proprietor or a small business in any sector, employing less than 3 workers.
• Small Enterprise: A sole proprietor or a small business in any sector employing less than 7 workers.
• Small Industrial Enterprise: Any enterprise in the production sector and employing between 1 to 9
workers. It is worth noting that the total number of enterprises under this category is nearly half a million.
• Medium Industrial Enterprise: Any enterprise in the production sector that employs between 10 to
49 workers.

43A Roadmap Toward A National Employment Policy For Sudan
at Sudan University supported a very limited number of its graduates (not exceeding 15 projects) since its inception in 2007 in cooperation with the Ministry of Industry. Other universities introduced entrepreneurship courses to their curriculum for commerce students. When initiatives exist, such as the Graduates Employment Fund and the Youth Employment Foundation, they do not often provide integrated and comprehensive services to their graduates, by extending the training into mentorship and other programmes of support. As a result, business start-ups often lack managerial experience and knowledge concerning the business environment, such as banking procedures and requirements. Moreover, they are unable to provide the required guarantees and collaterals for their loan applications, as micro-guarantee products are not yet developed for the Sudanese market. Nonetheless, Sudan’s micro-finance sector is often regarded as small, but rapidly growing (see paragraph 3.1.1).
Table 3.1: Regional comparison in trends relatedto the availability of credit to the private sector
Source: Sudan: 2013 Article IV Consultation.
Figure 3.1: Existing institutions that provideBusiness Development Services to MSMEs and start-up businesses
Name of Institution Area of SupportNational Fund for graduates’ employment (MHRDL)
Microfinance for graduatesEntrepreneurship trainingMarket needs surveys
National Credit Bank Microfinance National Workers Bank MicrofinanceFamily Bank MicrofinanceSudanese Rural Development Corporation Microfinance for rural poor
Non-financial services
Text Table 7. Credit To Private Sector, 2001 - 12(In Percent Og GDP)
2001 2002 2003 2004 2005 2006 2007 2008 2009 2010 2011 2012
Chad 4.34 4.21 4.20 3.13 2.88 2.61 2.96 3.79 5.14 5.29 5.60 6.67
Congo, Dem, Rep, O’ 0.77 0.69 0.86 1.57 1.90 2.89 3.71 7.14 7.25 6.58 6.34 7.02
Egypt 54.93 54.66 53.90 54.04 51.17 49.29 45.52 42.80 36.09 33.07 31.16 29.74
Ethiopia 17.91 18.12 17.63 16.66 19.01 20.61 18.67 17.85 -- -- -- --
Kenya 25.08 25.77 24.94 27.30 26.28 26.27 27.04 29.90 30.27 33.84 37.66 36.21
Sudan 3.89 4.61 6.21 7.92 11.11 13.27 12.72 11.15 12.62 11.87 10.89 12.07
Uganda 6.90 7.38 7.53 7.89 8.09 9.35 9.48 12.47 12.29 14.77 15.73 15.43
Source: National authorities; and IMF staff calculations.

44
National Sudanese Youth Union MicrofinanceTraining and retraining
Khartoum Locality Registration and licensingTendering for public utilities
Cooperative Associations, Ministry of TradeEstablishment of cooperativesTraining for cooperatives at the National Centrefor Cooperative Training.
SMEs Unit, Ministry of IndustryOrganization of industrial fairs and exhibitionsStudies related to industrial clusters and SMEs incubators
Social Development Foundation Micro-finance
Federation of Industrial ChambersLobbying and advocacySubcontracting among SMEsTechnology transfer
The Sudanese Employers Federation
Lobbying and advocacyTraining for small businessesPromotion and exhibitionsSmall enterprises involvement in public tendersPromoting innovation at the level of small businesses
Sudanese Women General Union
MicrofinanceTraining for women to start their home-businessAwareness about genderPromotion traditional artisan industries
Sudanese Workers Trade Union Federation (SWTUF)
Retraining
The National Training Council ToT programs Licensing of private management training institutions.
Supreme Council of the Technical and Technological Education
Supervision of technical and technological education institutions
Management Development Centre Management trainingCommercial Registration Department Registering the enterprises that want to obtain
a trade name and logo.Leather Incubator – Sudan Universityfor Science & Technology
Incubation and technical training for graduates leather manufacturing small businesses.
Private Sector Training Institutions(Vocational – Entrepreneurial)
Provision of entrepreneurial and technical training coursesTailored training programs
Source: Khaled Abdel Azim, The informal sector in Sudan: Current Situation and Prospects for Improvements,
Thematic Paper prepared for the ILO/UNDP project “SUDAN: Support to the development of a National
Employment Framework”, September 2013.

45A Roadmap Toward A National Employment Policy For Sudan
The lack of a suitable conducive environment to facilitate micro and small enterprises represents one of the main factors propelling the expansion of a large informal sector in Sudan. Data still fail to capture the phenomenon appropriately. The ILO conducted an in-depth analysis in the area of Khartoum, following the huge migration influx from rural areas, and has drawn some generalizations. The study identified two types of informal enterprises that are present in the Sudanese economy, namely subsistence enterprises and unofficial small enterprises. Subsistence enterprises are those that provide the (generally) own-account worker with minimal resources, barely sufficient for survival. They include street vending, Henna artwork, home based credit retail of commodities, outdoor automotive maintenance services and car wash, as well as tea and traditional food-making. Subsistence enterprises are generally home-based unincorporated small-scale activities. Unofficial small enterprises can take the form of small carpentry workshops, bakeries, home-based ice-cream making, cereal grinding and packing, leather products manufacturing, pottery making, and garments manufacturing. They require some skill and could have employment generation potential. According to some scholars, these enterprises “require less than average capital investment and only about half the investment of large-scale industries to create one job”58 and thus, provide a basic financial security platform to the majority of the poor.
This chapter only reviews some issues concerning policy support to facilitate the transition of “unofficial” small enterprises to formality. “Subsistence enterprises” are dealt with in Chapter 5 of this report, where issues related to vulnerable workers at risk of labour market exclusion are discussed.
58 Dr. Badr-El-Din A. Ibrahim “ The Role of Home Based Enterprises (HBE’s) in Alleviating Sudanese Urban
Poverty and the Effectiveness of Policies and Programmes to Promote HBE’s”, 2002. The paper makes no
reference to the quality of job creation in these enterprises.

46
Figure 3.2: Informal Sector Enterprises in Sudan
Subsistence enterprises (Majority) Unofficial enterprises (Minority)
Degree ofInformality
• 100 percent informal• Highly stagnant towards formalization
• High proportion of sales undeclared• Workers not registered• A combination of formal & informal
elements.
Type ofActivity
• Single street vendors• Home-based unincorporated small-
scale activities & crafts.• Outdoor automotive maintenance
services.• Home based credit retail of
commodities.• Traditional food-making and
beverages.
• Small carpentry workshops• Bakeries• Cereals grinding and packing.• Home based Garments manufacturing.• Pottery making.
Technology • Highly labour-intensive• Use of rudimentary equipment
• Relatively labour-intensive• Use of modern equipment
Owner profile
• Poor• Low education• Low level of skills• Not business-oriented
• Poor and not poor• Well-educated• High level of skills• Business-oriented
Markets
• Low barriers to entry• Highly competitive• Sell to local market• Sell to low-income final• consumers
• Face low barriers to market entry• Highly competitive• Have some product differentiation• Have some linkages with formal
enterprises
Finance Needs
• Working capital• Working capital• Investment capital• Supplier credit• Investment in Equipment
Other Needs
• Personal insurance• Social protection
• Personal needs• Business needs• Insurance
• Least dynamic• Completely informal• Stagnant to formalization
• Relatively dynamic and less stagnant to formalization

47A Roadmap Toward A National Employment Policy For Sudan
Source: Khaled Abdel Azim, The informal sector in Sudan: Current Situation and Prospects for Improvements,
Thematic Paper prepared for the ILO/UNDP project “SUDAN: Support to the development of a National
Employment Framework”, September 2013.
The registration of small enterprises that employ less than 10 workers is managed by localities and registration fees are not high. However, there are other obstacles that hinder informal enterprises from formalization. The most commonly reported obstacles are the procedures to start a business, the multiple payments a business has to incur, including taxation and fines imposed by localities. Starting a business in Sudan requires 13 procedures and takes 36 days, which is a long period of time when compared to 6 procedures and 7 days in the case of Egypt and 5 procedures and 19 days in the case of South Africa (comparison is made on the basis of the World Bank’s Doing Business Report – latest data available for these countries). Furthermore, these procedures are not enforced by one entity but different governmental authorities, which makes the process rather cumbersome.
Figure 3.3: Representation of the process of starting a business in Sudan
Source: The SMEs Unit, The Federal Ministry of Industry, Sudan.
Labor OfficeWorkers-Building (4)
Inspection Visit from MHRDL Inspectors (13)
Locality LicenseTo Activate
Business(10)
Installation Of Equipment(7)
EndorsementOf Health Affairs
& EngineeringAffairs Authorities
(3)
TentativeApproval
FromLocality
(2)
SpecifyingThe PlaceOf Activity
(1)
Co-operative
Partnership
Commercial
Type Of Activity Licensing OfficeIn Locality
State LicensingAuthorities MHRDL
MHRDL 2nd
Inspection (8)
Copy Of The Locality License (11)
Regular Inspection From MHRDL (12)
MHRDL FinalApproval (9)
MHRDL 1st
Inspection Multi Specialties Team (6)
Tentative Approval Of MHRDL (5)

48
3.1.1 Assessment of the micro-finance sector
Over the years, the Government of Sudan has adopted a series of policies to facilitate access to microfinance for micro and small enterprises. The Bank of Sudan (BoS) has taken the lead in the promotion of microfinance as a vehicle for poverty alleviation, job creation and economic development with the establishment of a microfinance unit at BoS in 2007 and the Sudanese Microfinance Development Facility (SMDF) in 2008. The SMDF, jointly owned by the BoS and the Ministry of Finance and National Economy, has been endowed with US$20 million of capital by donors. Parallel to this, BoS has developed a microfinance strategy that aimed at creating a framework of legislation and policies to support and strengthen the role of microfinance institutions (MFIs) and to establish a supportive infrastructure for the development of the microfinance sector. As a result, 13 MFIs have been registered as microfinance providers, in addition to 11 banks with specialized microfinance units. The microfinance unit at BoS is mandated to organize, supervise and provide capacity development to microfinance institutions and banks to qualify them for the management of microfinance programmes. It has adopted policies to motivate commercial banks to allocate 12 percent of their loan portfolios for small and microenterprises59. At present, the banks’ allocations have not exceeded 5 percent on average. The BoS has included microfinance in its 2013 General Policy Framework to provide various microfinance products to youth groups, women and the poor through existing commercial banks and financial institutions. Through a partnership with the Islamic Development Bank in Jeddah, the Ministry of Finance and the BoS have tried to expand the provision of microfinance to small farmers, women, youth, graduates and others. Several institutions operate similar schemes, such as the Family Bank60, under the Ministry of Social Solidarity, the Savings Bank61 and the
59 Central Bank of Sudan (CBOS)- Strategy paper - 2013.
60 Founded in 2008 with resources from the Bank of Sudan, the National Insurance Fund, pensions and the
support of some businesswomen, the main purpose of the Family Bank is poverty alleviation. The Bank
has 27 branches located in a number of states. It provides loans to around 106,000 beneficiaries. Loan
sizes range between 1,000 and 20,000 Sudanese pounds with repayment periods from one to three
years. The repayment rate is about 90 percent.
61 The Savings Bank mobilizes savings and provides financial services, including microfinance. The
total MSEs loan portfolio in 2012 was about 403 million Sudanese pounds provided to about 93,019
beneficiaries. The MSEs portfolio represents about 59 percent of the total bank loan portfolio, which
is around 682 million Sudanese pounds. The volume of commercial financing accounts for 24 percent
and the social portfolio accounts for 17 percent. The majority of beneficiaries are microenterprises,
representing around 83 percent of the total loan portfolio, followed by income generating activities
(IGAs) at around 14 percent, and small enterprises at around 3 percent. The agricultural sector represents
58 percent of the total number of funded enterprises followed by the service sector with 17 percent,
while the transport sector accounts for 80 percent of the allocated portfolio for small enterprises. From
the perspective of the beneficiaries, men represent 64 percent and women represent 36 percent.
The highest percentage of female participation is in the micro-loan portfolio, which nearly reaches 50
percent of the total number of beneficiaries.

49A Roadmap Toward A National Employment Policy For Sudan
Social Development Foundation62, the Youth Foundation for Microfinance, the Workers’ National Bank63, the Hope programme, and others. The IMF estimates that the number of micro-finance borrowers went from 49,000 at end-2007 to 494,000 by 2012. The growth has occurred in both bank portfolios (49,000 to 300,000) and at the dedicated institutions (zero to 194,000). The micro-finance unit at BoS estimates that the proportion of the adult population receiving MF funding from banks and MF institutions has gone from 0.7 percent to 8.2 percent over the same period.
3.1.2 Policies and challenges concerning the social economy in Sudan
Several of the institutions involved in microfinance belong to the emerging social economy64 in Sudan. The Workers’ National Bank, the Social Development Foundation, and Zakat Chamber are examples of social enterprises in the Sudanese economy. To a large extent, there is no specific and clear government policy on the social economy. Among the social economy entities, cooperatives are the only ones having some legal basis, through the
62 Established under the Khartoum State Ministry of Social Development, the Social Development
Foundation (SDF) works in partnership with community-based organizations (CBOs) and cooperatives.
Major activities include skills training programs and financing. In 2009, SDF established the Alamal
Project as a specialized microfinance branch, whose funds come from the government, banks and
other microfinance institutions. The Foundation has 8 branches with 240 staff members. The amount of
microfinance provided in 2012 was 36 million SDG. Repayment rate was 95 percent. Major beneficiaries
of the SDF are low-income women. NGOs, CBOs and cooperatives are represented in the board of
directors alongside government representatives.
63 Established in 1986, the Workers’ National Bank finances individuals and groups interested in setting
up microenterprises with a maximum of 20,000 Sudanese pounds and flexible repayment periods
that depend on the nature of the business. The number of beneficiaries is currently at 30,000 and the
repayment rate is 98 percent. The transport sector represents the highest proportion of funding followed
by livestock. Trade unions are represented by four (out of nine) members on the Board of Directors,
which influences the Bank’s decisions and priority activities. Agriculture constitutes the priority funding
sector of the Bank followed by industry, transport and commerce. According to the Central Bank Policy
the Bank reserves 12% of its portfolio for microfinance activities, which are used by community-based
organisations, including cooperatives. It is a member of the Country Foundation (known as Awkaff) that
supports development. It participates in the Security Fund with its share exceeding 2 million US$ and in
the Graduates’ Fund (with 2 million US$), which is used to finance small enterprise creations by young
people. The Bank provides long-term housing loans (up to 10 years), whose priority customers are low-
income people.
64 The term “social economy” is not used in Sudan. However, some organisations and entities like
cooperatives, associations, foundations and Islamic charity (zakat chamber) are considered to be in
this social enterprise/organisation category. Although they are placed in different groupings such as
associations, unions and foundations, etc., most of them are in one way or another part of the state
apparatus.

50
Cooperative Law of 1999, which has been under consideration for revision. The National Cooperative Federation estimates that there are at present 3,332 primary cooperatives in Sudan with 4 to 8 million members. The number of agricultural cooperatives is assumed to be around 2000 with about 1 million members. Due to the lack of statistical data, these figures are rough estimates. It is claimed that, in recent years, the financial and technical support provided by the GoS to cooperative development has sharply reduced without any preparation for a “transition” and, thus, cooperatives found themselves in an unfamiliar economic environment. Cooperatives are organized at grassroots, state and national levels. The National Cooperative Federation is the apex body representing the movement. Capacity building seems to be among the priority technical assistance areas to help cooperatives learn how to manage their businesses. A National Cooperative Training Centre was established and is operational since 1976. Cooperatives are not recognised by the government as independent, member-owned economic enterprises. Although some privileges and tax exemptions have been discontinued, due to the initial government sponsorship, cooperatives are still perceived by many as part of the public sector. In addition to this “identity” problem, major challenges for the cooperative movement include the lack of a clear and consistent cooperative development policy of the government, an inefficient legal framework, the lack of training services for cooperative members and weak financial support for cooperative undertakings. The current legal framework for cooperatives is very weak and not conducive to the development of a member-owned and controlled cooperative movement to grow as part of the social economy. According to the Law, cooperatives and services are structured as follows65:
- National Council for Care and Development of the Cooperative Movement: Relevant government ministries and the cooperative movement are represented on the board of the Council and its main functions are to lay down cooperative policies and development plans, coordinate interaction between the government and the cooperative movement, build and manage international connections, organize training and supervise cooperatives, etc.
- National Cooperative Federation: The apex body of the cooperative movement to carry out the main functions that are not too much different from the above; but in addition: helping cooperatives to prepare their economic plans, maintain the unity of cooperatives, try to find necessary funding in coordination with the Islamic Cooperative Development Bank (it is no longer a co-op bank), etc.
- State-level cooperative unions: Established in each of the 17 states as secondary structures.
- Primary cooperatives: Established at village or workplace levels.
According to international recommendations and good practices, the Cooperative Law of 199966 carries certain weaknesses. These include: i. “State patron-ship” of the co-op
65 The Cooperative Act, Sudan 1999.
66 For a full comparison of the current draft law with the provisions of ILO Recommendation No. 193,
please refer to: Huseyin Polat, The Social Economy in Sudan: with particular emphasis on cooperatives,

51A Roadmap Toward A National Employment Policy For Sudan
movement (Art. 6); ii. National Council for Care and Development of the Cooperative Movement is headed by a Minister with a wide-range functions that may interfere with cooperative operations (Art. 7-14); iii. Appointment of one-quarter of the board members by the Registrar (Art.18/3), which can also “suspend the board (Art. 30); iv. Appointment of one-quarter of the board members of the National Co-op Federation by the Minister (Art.22/3); v. Among the functions of the National Federation is to “strive to implement state plans” (Art. 23/a).
The Government has set up a Consultation Committee to draft a new cooperative law. The National Federation has brought several suggestions to the Committee in view of integrating international good practices in the new law, address some of the concerned raised above, and begin a transition phase.
Beyond cooperatives, there are other social economy entities in Sudan, such as the Zakat Chamber67, Sudan Rural Development and Finance Co. Ltd. (SRDC)68, and the Sudanese Women’s Union69.
3.2 Identification and evaluation of policy options to be included in the NEP
Sudan clearly needs higher capital investments in the emerging non-oil sectors to encourage economic and employment growth. Among others, one opportunity to advance such investments is provided by the extent of the infrastructural development projects included in the Agricultural Revitalization Programme (ARP), which seeks to transform agriculture
Thematic Paper prepared for the ILO/UNDP project “SUDAN: Support to the development of a National
Employment Framework”, September 2013.
67 It is a governmental organisation established under the Ministry of Social Welfare to implement one
of the Islamic Financial Principles, which entails taking a certain percentage of money per year from
the rich and from companies to give to the poor. Zakat is compulsory in Sudan. Every year companies
that have more than 17,000 SDG of profit (after tax) are expected to pay 0.25 percent as zakat. Every
community has a zakat committee to check and report about the zakat payments. The Higher Institute
of Zakat was established for the purpose of conducting training about zakat.
68 This is a specialized company established by the BoS with different partners for the specific purpose
of providing financial services for rural development. In 2011, it turned into a registered microfinance
company. Two channels are used to provide poor farmers with microfinance: i) Direct transfer through
its 6 branches, and ii) Through CBOs and cooperatives. The target set in the 2013 business plan is to
reach 21,000 beneficiaries to distribute 60 million SDG.
69 The Sudanese Women’s Union is registered as a Federal NGO. One of its main goals is the empowerment
of women. It has 20,000 branches all over the country, including villages, and is reaching out to 5 million
women; most of them are living in rural areas. One of Women’s Union activities is providing microcredit
and microfinance. The Union also organizes short training courses to capacitate women beneficiaries in
setting up and managing SMEs.

52
from a sector dominated by subsistence production to a modern sector responsive to market signals. Other major revitalization programmes are envisioned in other sectors of the economy as part of the current policy framework (I-PRSP, 25 year National Strategy, etc.). The NEP should consider the introduction of criteria for infrastructural project selection that prioritise employment generation. This could be done both for investments and public/private partnerships in water and irrigation, road rehabilitation, rural electrification, etc.
The enabling environment and policy frameworks for private sector development need to be put in place, particularly to address the emerging needs of MSMEs and the challenges related to the transition to formality of the informal enterprises. Careful attention needs to be given to the role of integrated policy frameworks in securing the transition from an informal to a formal economy, for example observing that the challenge for policy-makers is to find the right balance of incentives for formality and disincentives for informality. Successful strategies for transition to formality are associated with conducive macroeconomic, social, legal and political frameworks. They are embedded within national development strategies, and require strong social dialogue. Tailoring taxation, financing and social security systems to the specific challenges faced by informal economy actors – can make formalization a more attractive option and have a more sustained impact.
Thus, the following policy options (presented here already in the form of possible NEP Outcomes and Outputs) could be taken into consideration by the NEP for the short- to medium-term to complement on-going investment and private sector development measures and improve their employment impact:
Objective 1 – Enhance the employment intensity of growth
(Outcome 1.1): Employment is prioritized in the infrastructure development initiatives under consideration both at federal and state level.
(Outcome 1.2): Enterprise promotion policies that enhance investment in human capital and increase employment are advanced both at central and local levels.
This would include: (Output 1.2.1): A National SME strategy with a clear vision, strategy, goals and timeframe to be developed in consultation with the private sector (through its umbrella employers’ and business organizations) is prepared; (Output 1.2.2): The feasibility of an institution, under the umbrella of the Council of Ministers, but with an extended decentralized network at the local level, dealing with the specific needs and challenges of SMEs (including streamlining of the registration and licensing processes, preparation and dissemination of relevant market studies, one-stop shop models for SMEs at State level, etc.) is assessed; (Output 1.2.3): Access to entrepreneurship education as part of lifelong

53A Roadmap Toward A National Employment Policy For Sudan
learning and undertake necessary measures to guarantee equal opportunities for females in obtaining entrepreneurial training and entrepreneurial education is expanded;(Output 1.2.4): The creation of industrial zones and the establishment of incubators for all sizes of enterprises are facilitated; (Output 1.2.5): Social economy organizations and enterprises are reformed through a National Cooperative Development Policy and an umbrella law on the social economy entities to make them more independent and transparent, improving their structures and diversifying their membership composition;(Output 1.2.6): Innovations in the financial services for MSMEs, such as micro-credit guarantees, are introduced.
Objective 2 - Reduce informality
(Outcome 2.1): Promotional measures to move workers and firms to the formal economy are developed.
This could include:(Output 2.1.1): Entry costs are reduced by having a one stop-shop for registration, decreasing registration procedures, increasing the effectiveness and efficiency of offices involved in the registration process and sensitizing government officials to modify their attitude towards informal enterprises, also known as “Kasha”;(Output 2.1.2) Training of workers and entrepreneurs70 in the informal economy, as well as informal apprenticeships are improved and recognized in the training systems through links with the formal TVET71 mechanisms;(Output 2.1.3) Specific pilot measures for informal enterprises that have a higher value added and a higher employment capacity (like furniture manufacturing, leather industries and artisan industries) are launched.
(Outcome 2.2): Some services, such as social insurance schemes and business development services, are tailored to the needs of enterprises undertaking transition to formality.
(Outcome 2.3): Awareness is raised among vulnerable groups about their rights at work (see Chapter 5).
70 For instance the model adopted by some international companies in the industrial zone in North
Khartoum. See: Khaled Abdel Azim, The informal sector in Sudan: Current Situation and Prospects for
Improvements, Thematic Paper prepared for the ILO/UNDP project “SUDAN: Support to the development
of a National Employment Framework”, September 2013.
71 Technical and Vocational Education and Training. See further elaboration in Chapter 4.

54
Chapter 4 – Human Resources, Employability and Skills Development
4.1 Review of the current education and training policies and challenges
One of the key findings of the labour market analysis in Chapter 2 revolves around the relationship between people’s education/skills level and their labour market outcomes. It was highlighted how six out of ten people employed in the agriculture sector in 2011 were illiterate, whereas the overall percentage of illiterate workers across all sectors was 38 percent. Those with only primary/basic education were about 32 percent of all the people employed in agriculture and over 35 percent across sectors72. This implies that the skills base in the agriculture sector is extremely limited and would not yet lend itself to support agriculture-based economic innovation and transformation strategies unless additional capacities are injected.
Education in Sudan faces both quantitative (a lower stock of highly educated people compared to the majority of neighbouring countries) and qualitative challenges. Despite the improvement in enrollment rates over the past years, educational attainment levels at secondary and tertiary levels remain low, inequality in enrollment is relatively high (marked by deep urban/rural and gender divides) and the quality of education is inadequate to equip students with the required skills to meet labour market demands. Measures of educational quality are scant in Sudan, but available data gives rise to concern. Looking at the data from Sudan’s Labour Force Survey, formal education still appears to be the most important predictor of quality of employment. There are no disaggregated statistics that can help assess the impact of technical and vocational education and training (TVET) on the prospects of finding a job, which can partially explain the low and declining take up of vocational training or technical education certificates (estimated at less than 2 percent of the workforce by the Ministry of Human Resources Development and Labour in 2013). This finding provides support to the recognition of the limited contribution of formal technical and vocational training to skills development.
The Sudan Education Status Report (2011) provides detailed diagnostics of the education sector and the knowledge base to identify the priority actions to meet the commitment to free and compulsory basic education for all, as enshrined in the Interim National Constitution.
Student dropout is a serious concern. A high rate of dropout could indicate that students are not learning enough, i.e. that the quality of schooling is simply too low to justify students’ time and the direct cost in terms of parental contributions. More research is needed to understand the causes and risk factors for dropout in Sudan so that appropriate measures to improve retention can be put in place.
72 2011 SLFS.

55A Roadmap Toward A National Employment Policy For Sudan
The low levels of public expenditures in education have resulted in physical deterioration of schools and facilities and limited geographical spread. Since 2000 the share of education in total public spending has increased by about 4 percentage points to 12 percent, and as a share of GDP it has more than doubled to 2.7 percent. However, Sudan still spends less than countries with similar incomes and a similar proportion of school-age population. Recurrent spending accounts for 91 per cent of total spend, while development spending represents only 9 per cent73. With inflation increasing, this raises alarms over assuring teacher salaries. With the decentralization efforts, since the 2005 CPA, education spending has increased at the state level and, in 2009, 83 percent of public education spending took place at state level. Teacher training has fallen behind; the result has been the deterioration in the quality of teachers, with an estimated 50 percent of primary school teachers unqualified. While pre-schools and basic schools have student-teacher ratios of around 33, there is a very wide variation among states. The Darfur states have high student teacher ratios, with West Darfur at 65.7, nearly double the national average. Overcrowded classrooms and untrained teachers make for poor education. Household out-of-pocket payments cover a large share of school running costs, in particular for basic education, implying that basic education is not always free in practice. Moreover, education accounts for a larger share of consumption for poor rural households than non-poor rural households with implications for equity in access to education. Education opportunities for vulnerable groups, nomads and IDPs remain a significant challenge.
The I-PRSP identifies the preparation of an Education Sector Strategic Plan (ESSP) and 17 state-level strategic plans as a priority to develop concrete actions and targets. The appraisal of the GoS Interim Basic Education Strategy (IBES) was undertaken in May 2012. The appraisal report supported the GoS’s application to the Global Partnership for Education (GPE) for financial assistance over a three-year period. The strategy provides the framework within which the MoE and the education partners in Sudan will strive to achieve the overall strategic goal of achieving “significant and measurable progress towards … access for all to basic education of good quality, and expansion of quality secondary, vocational and non-formal education supported by a strengthened education system”. Under this overarching goal, three pillars have emerged as particularly critical for the basic education subsector during the IBES period, namely (1) Access (2) Quality and (3) System Strengthening.
The strategy recommends six areas of system strengthening during the IBES period: (1) development of a national strategy for Early Childhood Education (ECD), (2) technical assistance to develop the capacity of the National Centre for Curriculum and Education Research (NCCER) which is the national body responsible for curriculum development, (3) development of a learning assessment system, (4) strengthening of school management through capacity development of school councils , (5) development of a teacher management system and, (6) system management, with a particular focus on the Education Management and Information System (EMIS) as well as capacity development of the MoGE
73 Sudan Education Status Report, 2011.

56
to plan, manage, monitor and report on performance against set targets. However, there are a number of challenges which are already addressed in part in the current strategy, but will need further research and analysis both for the federal and state implementation plans and ahead of the full 5-year Education Sector Strategic Plan. These include: falling revenues within the already resource-constrained environment; social disparity, with a particular focus on gender and children with special needs; budgeting, particularly from the federal to the state level; provision for marginalised and nomadic communities; training, deployment and in-service management of teachers; inequitable and varied access within and between states; low completion rates; and low levels of learning achievement.
A significant trade-off that policy makers are facing is the choice whether to focus on pre-primary and basic education over secondary, higher and technical and vocational education. The detailed rationale for this decision is provided in the IBES and a strong case made in favour of pre-school and basic education, but the real impact on the other subsectors of education including the specific financial trade-offs will need to be detailed in the full Education Sector Strategic Plan (ESSP).
On 18th November 2013, the Government of Sudan, in consultation with the social partners, officially adopted a new Technical and Vocational Education and Training (TVET)74 policy (2013-2017), which consolidates numerous laws, decrees, and practices covering separate aspects of TVET. The focus is on skills to support both economic diversification and international competitiveness. Sudan is gradually becoming more integrated, both regionally and globally. It has bilateral agreements with neighbouring countries, such as Southern Sudan and Egypt; it is a member of COMESA; and it also aspires to join the WTO. All this has implications on export, import, balance of payment and, most importantly, labour mobility. It is equally important that those working in remote areas or the informal economy are also provided with the appropriate skills to work for micro-enterprises, as well as themselves. These issues are at the heart of the country’s TVET plan. More specifically, the TVET plan provides a framework for facilitating these structural shifts, ensuring that the TVET system responds to changing skill requirements in the economy and a more sustainable mechanism for supporting skills development within the informal economy. Several institutions currently operate within the TVET context, such as technical secondary schools and colleges, artisans institutes, vocational training centres (VTCs), private and non-profit TVET providers, etc75. Technical education in Sudan still targets primarily young people who
74 The policy defines TVET as being concerned with the acquisition of knowledge and skills for the world
of work. Technical education and vocational training are brought together and the term ‘training’ is
used frequently to refer to both ‘vocational training’ and ‘technical education’. The value of training is
measured by the quality of competencies it produces irrespective of the type of institution in which it
occurs. This policy also recognizes the acquisition of skill outside formal training systems.
75 For a detailed mapping of the Technical Education and Vocational Training (TVET) System in Sudan, please
refer to Ibrahim Khalid Ibrahim, Abdel Moneim Hussein Mahmoud, Marcus Powel, Hiyam Abdelrahim,
Skills development in Sudan: The Formal and Informal Reality, Thematic Paper prepared for the ILO/

57A Roadmap Toward A National Employment Policy For Sudan
have successfully completed basic formal education76. In 2013, there were only 98 technical secondary schools and 21 technical colleges at tertiary level in Sudan, vis-a-vis 3128 general/academic secondary schools. The share of technical schools has been decreasing over the past 20 years, pointing to an overemphasis of academic schooling to the detriment of TVET. Among the students who complete the three years, only about 50 percent pass the final test and thus graduate. Those students who decide not to repeat the final year try to enter the labour market without a qualification. A network of 12 VTCs (9 of which in Khartoum) provides the majority of public-sector vocational training opportunities77. They operate under the Supreme Council for Vocational Training and Apprenticeship. VTCs provide the
UNDP project “SUDAN: Support to the development of a National Employment Framework”, September
2013.
76 The most relevant institutions are the technical schools that report to the State Ministries of Education
(3 years programmes following 8 years of primary education), and the technical colleges (for graduates
of technical or academic secondary schools) which are supervised by the National Council for Technical
and Technological Education (NCTTE). The Federal Ministry of Education is responsible for curricula,
teachers, training, final examination and certification, while the State Ministry of Education is responsible
for administrative and financial matters. There are four types of technical secondary schools: industrial
(with several specialties including electronics, electricity, carpentry, automobiles, plumbing etc.),
agricultural (animal husbandry, horticulture and plant science), commercial (accounting), and services/
home economics/ tourism.
Artisan institutes also fall under the authority of State Ministries of Education, and therefore are
considered technical education, although programmes generally last 2 years only. They have originally
been designed to cater to local resource availability (leather, wood, palm trees etc.), but have expanded
their activity into other trades over the years.
77 Five VTC belong to the Federal Ministry of Labour, four VTCs to the State of Khartoum, and another three
VTCs to the States of Kassla, Kordofan North, and White Nile. However, under federalism some states
have converted existing VTCs into technical colleges (in Gazera, Red Sea and South Darfur).

58
following services: apprenticeship programmes78; short course79; skill upgrading courses80; trade testing activities81. The Supreme Council for Vocational Training and Apprenticeship (SCVTA) is mandated by the Vocational Training and Apprenticeship Act (2001) to undertake trade testing. Qualifications in Sudan are awarded on the basis of the educational attainment (see Figure 4.1 below).
Figure 4.1: Qualification system in Sudan
Qualification Educational AttainmentEngineers University Graduates with Bachelor degree Technicians Graduates from technical colleges, with
Diploma degreeSkilled workers VTC (Apprenticeship Diploma)
Technical school (Certificate)Source: SCVTA
78 This is a pre-employment program in 13 trades directed to youth who have successfully completed basic
education (eight years of schooling). It lasts for three years; the first two years are spent in the centre in
practical skills training and classroom instruction. The third year is spent in the industry (in-plant training)
to consolidate the acquired skills, with usually one day per week at the centre. The prescribed in-plant
period presents the potential workers to the employers for possible employment opportunities. In this
respect, there is a good coordination between vocational training centres and the Craftsmen Union.
As a result, a good number of trainees undertake their in-plant training for one year at the artisans’
workshops. Apprentices graduate after passing a unified national exam. Demand for this training largely
exceeds available places.
79 These are also pre-employment courses directed to school dropouts and out of school youth, usually
of 3 months. Short courses are designed to lead the trainees to self-employment, by adopting the ILO
developed approach known as “Modules of Employable Skills (MES)”, or more recently introduced short
courses in collaboration with JICA.
80 These are courses of 3-5 months or shorter depending on the volume of the training gap that need to
be bridged. They are directed to already employed public and private sector workers. The objectives
of the courses are to allow these workers to cope with the advancement of technologies, raise their
productivity, improve their product and/or service quality, rationalize their use of raw materials, and
reduce occupational hazards.
81 The trade testing activity is carried out by almost all VTCs run by the Ministry of Human Resources
Development and Labour. The objective is to certify the skills of workers acquired through traditional or
informal means of vocational training in an attempt to regulate the labour market. Trade tests can be
taken by all workers, no matter if they attended a training course at the centre or if they acquired skills
informally in workshops, such as by means of informal apprenticeship. Data on trade tests taken is not
available at central level.

59A Roadmap Toward A National Employment Policy For Sudan
The main challenges to the TVET system have been identified in i) the ongoing austerity programme, which will hardly allow to increase or even maintain current level of funding; and in ii) the preference for higher education despite the fact that employment outcomes are equally unclear for all groups of young graduates due to lack of feed-back mechanisms vis-à-vis labour market requirements. With regard to funding, the dependence of all public VTCs on already insufficient public finances (even for recurrent costs) compromises the quality of the training delivery, which contributes to a vicious circle of inadequate or unrecognized qualifications for the labour market. In addition to those, challenges, it should be noted that the decentralization process does not seem to have worked well for technical education nor vocational training, as indicated by the unbalanced distribution of assets and facilities. Moreover, TVET providers have yet failed to conclude sustained and effective partnerships with the employers’ organizations, in view of strengthening the link with the labour market and facilitate transition to work for their graduates.
Box 4.1: Target groups for TVET identified by the TVET Policy
First Group: Pre employment training• Young men and women who have completed the first or second cycle of formal
education and are preparing for their first employmentSecond Group: In-service training & re-training
• Men and women working in the informal or formal sectors (public & private) who want to update, upgrade or change their professions,
• Men and women who lost employment due to radical changes in technology or closing down of economic establishments
Third Group: Social Dimension• Men and women with disabilities • People who are disadvantaged in the labour market due to their geographical
location (e.g., rural or nomadic people),• Those who have been displaced and are unemployed (e.g., people from conflict
affected areas and demobilised soldiers),• Older workers who are at a disadvantage due to long unemployment periods• School dropouts
The current public TVET system has been mainly designed to cater for those who come through the formal education system. As such, there are significant access barriers to those in the informal economy. This raises the question of whether there is another option for those who wish to acquire skills and who are not able to access the TVET system. One option for acquiring skills is through the informal apprenticeship system and this refers to the system by which a young apprentice acquires the skills for a trade or craft in a micro or small enterprise by learning and working side by side with an experienced practitioner.
60
The informal apprenticeship system needs to be improved in terms of quality of skills, as well as decency of working and training conditions. Informal apprenticeship is cost effective if it is integrated into the production process. Yet, it has to be upgraded to get the maximum gains possible in terms of skills enhancement and achieving more of its potential. Formalizing the informal apprenticeship system is not the goal, nor is it a requirement for improvement. However forging and or enhancing links with the formal TVET system may offer one means of making improvements. Supporting the development of skills within the informal economy can result in a number of direct and indirect benefits for different groups. Commonly acknowledged benefits for the individual include raising income and security, as well as access to further learning and even the possibility of formal sector employment. For the company, it can also result in improved profitability, the utilization of technology and possibly higher turnover, as well as profits. Similarly, other benefits derive from improvements to social capital in local communities. For formal recognition of informal skills, relevant vocational training authorities should make it easier for the informal apprenticeship graduates to participate in formal trade testing and certification system. The scope of recognition could be expanded by introducing credentials by business associations. The policy should ultimately aim to promote inclusion of informal apprenticeship in the national training system and to institutionalize recognition of skills acquired in informal apprenticeship.
With regard to tertiary education, the National Council of Higher Education in the Ministry of Higher Education and Research, which is responsible for setting policies and regulating the system of tertiary education, has set up a commission for quality assurance. The Council has promoted the establishment of internal quality monitoring and evaluation units in some universities and a pilot program to apply the standards it developed before these standards are generalized. Another challenge to the tertiary education is to have a definitive policy towards progression from technical education that recognizes the importance for technical knowledge and skills for growth and diversification and makes technical education an attractive option for students. Furthermore, public universities are poorly funded by the federal and state governments and the universities are increasingly relying on cost-sharing with students for additional resources. While the cost-sharing schemes take family income into account, there is a risk that the costs could be excluding poor people from tertiary education.
4.2 Identification and evaluation of policy options to be included in the NEP
The 25-year National Strategy (2007-2031), the newly-adopted TVET policy (2013-2017), and the pressing reforms envisioned in the I-PRSP’s Education Sector Strategic Plan (ESSP) provide a framework for improving the quantity and quality of education outcomes as well as strengthening the delivery and responsiveness of the TVET system. The performance indicators of the educational system (as stated in the I-PRSP) and in the TVET strategy envisage, among others, i) bridging the gap between States in enrolment and thereby raising the average enrolment and increasing the completion rate in primary school from 57 percent

61A Roadmap Toward A National Employment Policy For Sudan
in 2009 to 70 percent in 2011, with further improvements in subsequent years; ii) bridging the enrolment gap between boys and girls that persist in some states so as to eliminate gender disparities in access to education at the basic level and achieve gender equality; iii) improving the literacy rate of those between ages 15-24 through programmes targeting school dropouts especially those between 9 and 14 years of age; iv) increase the delivery of TVET to represent about 60 percent of the education provided in Sudan. Human capital development should therefore also be at the core of the National Employment Policy. One of the common pitfalls to avoid in the NEP is to focus its strategic actions mainly on preventive policy options – e.g. reform of all levels of the education system, which will mostly benefit the next generation of young Sudanese – while paying little attention to curative policy options – e.g. addressing the current skills deficits affecting many young people and adults that attempt to enter and remain on the labour market with low educational attainment. In addition, the high percentage of young people with general secondary education attainment who are unemployed points to the fact that higher levels of education are not per se sufficient for gaining a foothold in the labour market. Not taking remedial action, pending the unfolding of the reform of the education system, would only aggravate the situation. The causes and effects of the current shortcomings of the education and training system call for a more balanced mix of preventive and curative policy options touching upon the drivers of vocational education reform and the establishment of a system for adult training. To redress labour market disadvantages and social exclusion that are strongly correlated to a poor skills base, it is of the utmost urgency to strengthen skills upgrading and retraining for adults, and recognise existing skills provision, in particular informal apprenticeships. This would allow both enterprises and training institutions to train people for occupations leading to sustainable jobs.
The following policy options are deemed affordable and feasible in the short- to medium-term to increase the relevance of education and training and facilitate the labour market integration of young people and adults with low educational attainment:
Objective 3 - Reform the TVET system, as already set forth in the Policy.
The short-term agenda for TVET must focus on consolidation (through political decision and administrative rigour which will protect the assets of Vocational Training Centres (VTCs), technical schools and colleges by avoiding the take-over by higher education institutions or other government agencies), more equal distribution of TVET service delivery across states, and improved coordination through the creation of a tripartite TVET coordination committee under the Minister of Human Resources Development and Labour and with the participation of the Supreme Council for Vocational Training and Apprenticeship (SCVTA) and the National Council for Technical and Technological Education (NCTTE). Systemic reforms should be left to a later stage, when the country education system is better prepared and major reforms are affordable. Furthermore, it is better for the time being to focus on a small number of well-equipped and functioning VTCs and colleges rather than a multitude of mediocre institutions.

62
This reform could be implemented through:
(Outcome 3.1): Education outcomes (including for TVET) are aligned with labour market needs.
This could include:(Output 3.1.1): Public private partnerships established for the development of occupational standards;(Output 3.1.2): The trade testing system is reviewed and updated in partnership with business associations;(Output 3.1.3): Entrepreneurship education is mainstreamed at all level of the education system;(Output 3.1.4): Enterprise attachments are included in technical and vocational education and training programmes; (Output 3.1.5): Private TVET provision is promoted and properly regulated.
(Outcome 3.2): TVET coverage is enlarged to cater to most economic sectors in the country.
(Outcome 3.3): TVET financing strategies are reviewed.
Objective 4 - Increase the availability of continuing training for the existing workforce (in service), job-seekers, school drop-outs, and early school-leavers.
(Outcome 4.1): Management capacities of public and private training providers are increased to make their training offer more flexible.
(Outcome 4.2): Technical capacity of public and private training providers and their instructors is increased to identify skills needs in the labour market and provide targeted skills upgrading and retraining courses.
Objective 5 - Strengthen the link between schools and work.
(Outcome 5.1): Timely career information, education and guidance is provided to young people.
(Outcome 5.2): Entrepreneurship education is included in the school curriculum.
(Outcome 5.3): Work experience opportunities, including job-shadowing and internships, are offered as part of secondary and tertiary education to ease the transition from school to work.

63A Roadmap Toward A National Employment Policy For Sudan
Chapter 5 – Labour Market Policies and Institutions
5.1 Review of the current policy environment and challenges
National Employment Policies are often centred on the promotion of an active policy on employment through the establishment of an efficient system of employment services, the development of employment promotion programmes, the reduction of informal employment, support to employment protection, the improvement of conditions of work, and the support to social dialogue.
A review conducted in 201182 found that the public employment services in Sudan faced critical challenges in their ability to support the promotion of an active policy on employment. Inefficiencies were the result of both structural and functional shortcomings. The review indicated that the lack of understanding of the relevance of a Public Employment Service (PES)83 was the main factor determining its poor functioning, lack of finances, and inability to carry out an essential mediation role on the labour market. In particular, the following main barriers were identified: i) Weak linkages and communications between the Federal and the State level, combined with unclear stipulations of respective functions, roles and responsibilities; ii) Provision of a limited range of employment services, mostly restricted to registration of jobseekers; iii) Overlap and confusion between the functions of labour inspectors and employment office officials; iv) Lack of basic tools (registers, forms, letters, procedures, protocols, etc.), trained human resources, and infrastructure (email, computers, rooms, etc.) to provide basic services84, including profiling, career counselling and guidance, referral, labor market information, etc.; and v) Inability to create strategic partnerships with vocational training centres, NGOs, and other partners currently active in the provision of some level of services, including private employment agencies.
82 International Labour Office, Reorganising public Employment Services in North Sudan, review
conducted in the context of the MGDF-funded UN Joint Programme on “Creating opportunities for
Youth Employment in Sudan”, 2011.
83 The 1997 Labour Code of Sudan still provides the legal basis for public employment services.
84 Some of these basic services are not available in Sudan. For instance, jobseekers are not counseled
at registration. Nor do employment offices carry out any matching. Jobseekers are encouraged to
view vacancy announcements posted on the notice boards at the labour offices and then contact the
employers directly. No services exist for those potentially interested in self-employment as a career
path.
64
Box 5.1: A note on private employment agencies in Sudan
Through interviews with private employment agencies (PEAs), the has ILO estimated the existence of about 300 operators in Sudan, of which only 10 percent are registered and licensed as companies, while the majority comprises individuals who carry out some mediation for international markets. Private employment agencies deal almost entirely with placements overseas; only a few have tried to work on the domestic labour market, mostly by supporting small foreign companies in bringing in their workers. The deposit paid for the PEA license is not particularly high (15,000 SDG) and the process is not cumbersome. Only Sudanese companies can apply for the license at the Ministry of Human Resources Development and Labour. Private employment agencies are thereby allowed to provide overseas employment services, but generally do not apply for a second license to provide pre-departure services, such as training and guidance, to perspective labour migrants. Also, they are not allowed to build rosters for foreign employment unless a vacancy is published for a certain country. Once the vacancy is published, they can seek permission from the Ministry of Human Resources Development and Labour to actively look for and collect profiles of potential candidates for the job.
Sudan counts between 880,000 and 1,338,000 economic migrants, over half of which are concentrated in Saudi Arabia, with the rest in other Arab countries and only a small proportion in Western countries. Sudanese in Saudi Arabia tend to be mostly male single workers (54%). According to the Sudan Migration Country Profile (IOM, 2011), Sudanese in Arab countries work prevalently in low-skilled occupations (around 75-80%), white collar jobs (around 12-15%) and high-skilled occupations (5-10%) including medical specialists, engineers, university professors, teachers, lawyers, legal advisers, entrepreneurs and managers suggesting the existence of brain drain in some professional categories such as health professionals.
Source: Interviews with Private Employment Agencies, November 2013.
5.1.1 Active labour market policies
As a result of the weakness of the public employment service, the availability of active labour market programmes in Sudan is limited to sporadic initiatives organized either by the public sector or by NGOs and CSOs with the support of donor funding.
As noted in the Government’s most recent 2013 report under Convention No. 122, a key instrument for the implementation of the Convention has been the national Graduate Fund for Employment. Under the supervision of the Ministry of Human Resources Development and Labour, the Graduate Fund is currently responsible for policy development, planning, supervision, monitoring and evaluation of graduate employment programmes, seeking,

65A Roadmap Toward A National Employment Policy For Sudan
inter alia, to foster a culture of self-employment and support micro-enterprises. Established in 1999, the government has introduced several amendments to its mandate. In April 2012, the Fund created a specialized funding portfolio with a capital of one hundred million pounds to finance graduate enterprises. The Bank of Sudan contributed 36 million pounds in addition to the contribution of 64 million that came from 9 different other banks (Savings Bank, Industrial Development Bank, Farms Bank, Real Estate, Family Bank, Workers’ Bank, National Development Cooperative, Livestock, National Omdurman and Khartoum). Between 2005 and the end of 2012, the Fund has provided training to 28,468 graduates and financed 3,736 small enterprises85. Despite the unique structure of the Fund and its achievements, there are gaps in the service provision, such as the lack of career counselling services prior to the training stage and the lack of business support services at the end of the training and prior to the start of the businesses. These services are largely in demand and widely missing in Sudan. For instance, Private Employment Agencies estimate that a large share of Sudanese economic migrants to Saudi Arabia and other countries tend to return after 7-10 years. Often they try to set up a business upon their return, but returnees do not necessarily have the business experience and the local knowledge to thrive as self-starter entrepreneurs. Thus, it is advocated that specific self-employment programmes for returnees would be needed to enable a successful reintegration on the local labour market. Moreover, lack of information on laws and fiscal regimes, which are not harmonized among the 17 States, create a lot of bias and additional transaction costs for aspiring entrepreneurs86.
According to the 2012 African Economic Outlook, existing youth employment promotion programmes in Sudan are not coordinated under a coherent national growth and employment strategy that focuses on youth and no measures have been taken to address disparities in employment along the urban/rural and gender divides.
5.1.2 Passive labour market policies and social protection
Formal social protection institutions are few in Sudan and an unemployment insurance scheme is not yet approved.
The Zakat Fund, based on Islamic Sharia principles, the Social Security Fund, and the National Pension Fund have been created to meet the needs of poor and vulnerable groups, but these institutions appear to be underfunded compared to the rising demands on them. Informal individual and family ties continue to provide a last resort for many people. Given that social protection is under the purview of several institutions (Ministry of Welfare and
85 Ahmed Abou El-Yazeid, Sudan’s Small and Medium Enterprises, Thematic Paper prepared for the ILO/
UNDP project “SUDAN: Support to the development of a National Employment Framework”, September
2013.
86 There seems to be a lack of coherence with regard to the 1997 Labour Code, the 2003 Insurance Act, and
the 1999 Investment Act (including its subsequent amendments).

66
Social Security, Ministry of Health, Ministry of Human Resources Development and Labour, Ministry of Finance, etc.), there appears to be also a certain level of fragmentation and lack of coordination among partners. The Government has adopted the objective of universal coverage of social benefits by 2031, thereby launching a series of reforms and pilot initiatives which led to the creation, in 2011, of the Social Support Programme (SSP). The SSP, financed by the Ministry of Finance through the State Budget and the Zakat Chamber, has five components, covering i) conditional cash transfers (CCT) for families living in extreme poverty; ii) microfinance; iii) health insurance for the one million families in the poorest bottom quintile; iv) housing; and v) subsidies for students to attend secondary and tertiary education in public institutions. The Ministry of Human Resources Development and Labour is working on the formulation of labour policies so as to ensure minimum standards and the protection of rights of workers both in the formal and informal contexts. Though the institutional environment is still under reform, the current status of the social security benefits in Sudan is summarized in Table 5.1 below.
Table 5.1: Summary of main social security benefits in Sudan (2013)Benefits Reference
Maternity leave 8 weeks (after 6 months of service) Art. 46, Labour Code 1997 Sick Leave Full pay for the first three months of
absenceArt. 47, Labour Code 1997
Old-age pension Age 60 with at least 20 years of contributionsThe minimum pension is 40% of the insured’s average monthly earnings in the last three years before retirement
Social Insurance Act, 1990, with 2004 Amendment
Disability 50% of the insured’s average monthly earnings in the last three years before disability began or 0,02% of the same earnings for each 12-month period of contributions (whichever is greater)
Social Insurance Act, 1990, with 2004 Amendment
Source: Celine Bacrot, Social Protection in Sudan, Thematic Paper prepared for the ILO/UNDP project “SUDAN:
Support to the development of a National Employment Framework”, September 2013.
67A Roadmap Toward A National Employment Policy For Sudan
The social protection regime is based on a contributory system. While 100 percent of government employees are covered by health87, social insurance88, and pension plans89, there are still large shares of the population that are not enrolled or fail to pay their contributions90. The combination of these two challenges creates cash-flow problems for the institutions, but is also a signal of the limited awareness about the respective obligations among workers and employers.
Given the share of workers in vulnerable employment and the estimates related to workers in the informal sector (see Chapter 2), there are several vulnerable groups that deserve further attention. The informal economy has grown rapidly, particularly in the state of Khartoum, following a huge migration influx from rural areas as a result of unequal development. It provides an important income generation platform for petty hawkers, venders, shoeshine boys and similar occupations, yet it remains an unmeasured element of the Sudanese economy. A better estimate of the total employment in the informal economy in Sudan should maybe include all persons working as contributing family members, all wage-employees for whom social security contribution went unpaid, and all the self-employed (in the private, non agricultural sector) with less than five employees. The 2011 SLFS enquired about the availability of social security and health insurance at the work place91. About 80 percent of workers have indicated that their social contributions went unpaid in 2011, while 74 percent indicated that no health insurance plan was available though the workplace/employer.
According to the Fifth Population and Housing Census, in 2008 the net migration rate per 1000 was 347.1 people. These local migrants are by default low-skilled workers and their limited skills are related to rural activities, such as agriculture and pastoralism (e.g. cattle rearing, crop production, food making, trade and similar work that are commonly found in rural communities). When moving to urban areas, they tend to establish “subsistence enterprises”, home-based informal operations that can be carried out by one individual without further support. These include street vending, food and beverages (Kesra and
87 Health insurance contributions are about 10 percent of the salary (4 percent paid by the employees and
6 percent by the employer).
88 Even though the National Social Insurance Fund (NSIF) is compulsory also for employees in the private
sector, currently it covers less than 1 percent of the active population. The mandatory contribution
is equal to 25 percent of the salary (8 percent is paid by the employee and 17 percent is paid by the
employer).
89 The National Pension Fund (NPF) is available only to public sector workers. There are currently 182,000
people receiving pension from the Fund.
90 According to the data provided by the Ministry of Welfare and Social Security and the Strategic Plan
(2012-2016) of the National Health Fund (NHIF), about 34 percent of the population is enrolled in one
of the existing health insurance schemes, through the NHIF, the Khartoum State Health Insurance Fund
(KSHIF), and (though in a small percentage) through private companies.
91 These data need be read with care, as the question was asked to those who were employed at the time
of conducting the LFS or had been working previously.

68
traditional food and tea making), transportation (Raksha transportation), car wash, retail and credit sales (Delala). Other examples of these enterprises that require more skills are tailoring, motorbike maintenance, automotive body repairing and electrical maintenance, hair cutting, “Henna” preparation and “Henna” art work, ornaments, traditional perfumery, incense making, and mattress upholstery. Migrant women are commonly seen selling food in the market and represent the larger share of these “active poor”. The situation may be different in rural communities in which most of the informal activities are home-based. The challenge is not just about acquiring adequate skills to adapt to the predominantly urban setting, but also about accessing social security schemes for those who work in an unprotected labour market, especially for migrants who lost the informal social security system provided by their families in rural areas.
5.2 Identification and evaluation of policy options to be included in the NEP
The policy options that are necessary to complement the existing mix of labour market measures to promote labour market inclusion are:
Objective 6 - Strengthen the governance system of the labour market.
(Outcome 6.1): The capacity of the Department responsible for the National Employment Policy at the Ministry of Human Resources Development and Labour to manage the employment policy cycle is enhanced.
(Outcome 6.2): A labour market observatory92 is established.
(Outcome 6.3): An overall strategic plan for the public employment service (PES) is prepared to clarify vision, mission, objectives and target of the service and its units; establishing a tripartite advisory board to guide and pilot the operations of the PES and the implementation of the strategic plan. The strategic plan should also help in the identification and itemization of all costs related to the employment services units93.
(Outcome 6.4): At least a first tier of services (job-search assistance and placement services)
92 There is a general recognition that enhancing the status of the Central Bureau of Statistics (CBS) with
the authority and resources to compile and disseminate official labour market statistics, in collaboration
with the Ministry of Human Resources Development and Labour, is a key step to improve Sudan’s Labour
Market Information System (LMIS). Further improvements to the LMIS should be addressed within the
context of the ongoing work in developing a five-year National Strategy for the Development of Statistics
(2012-16).
93 For instance costs involved in the registration of jobseekers; costs for mobile registration campaigns;
costs for the administration of career guidance sessions; costs of materials and for canvassing among
employers and training providers; etc.

69A Roadmap Toward A National Employment Policy For Sudan
is mainstreamed within all public employment offices, by building capacities and providing basic infrastructure.Objective 7 - Improve the design and targeting of Active Labour Market Programmes (ALMPs).
(Outcome 7.1): A basic regulatory framework is approved within MHRDL to govern and better coordinate employment promotion programmes being offered in Sudan.
(Outcome 7.2): Integrated programmes are designed and offered to specific vulnerable groups (such as returnees), including components targeting both labour demand and supply.
(Outcome 7.3): Funds available to implement employment promotion programmes are increased.(Output 7.3.1): A mix of fiscal and nonfinancial incentives (such as tax breaks, but also relations with local industries, farms, and enterprises) is created to support work-based learning.
(Outcome 7.4): An appropriate monitoring and evaluation system is established to measure the impact of programmes on beneficiaries.
Objective 8 - Promote labour market inclusion of disadvantaged groups through targeted labour market measures.
(Outcome 8.1): Modalities for recognition of skills acquired in non-formal settings or abroad are identified in collaboration with business associations.
(Outcome 8.2): Awareness on rights at work, including in relation to employment protection legislation and social protection schemes is promoted. A particular focus should be on young people and new labour market entrants.
(Outcome 8.3): As part of the stabilization package94, suitable modalities for the realization of social safety nets targeting vulnerable groups95 are introduced (for instance through public works).
94 It is understood that stabilization packages should not envisage lowering international labour standards,
particularly in the area of fundamental rights and principles at work, and in the areas of governance
covered by the ILO priority conventions.
95 This is also a recommendation included in the Report on the 2013 Article IV Consultation for Sudan.

70
Chapter 6 - Conclusions and Recommendations
Some of Sudan’s “hopes” for a fast and sustained development may have withered away through decades of conflict and the loss of massive oil revenues in the aftermath of South Sudan’s secession. Nonetheless, the past challenges in translating the oil boom into widespread wealth and employment generation and the declining GDP growth rates that the country is currently facing should not completely absorb the full attention of policy makers.
In reality, while growth is a truly necessary condition, there is no automatic immediate mechanical translation of growth into jobs. Many other countries with high and sustained growth rates have failed to translate it into job creation.
Thus, this Study argues that it is essential for Sudan to place employment policy and targets at the centre of the work of policy makers and not consider it as a residual outcome of growth. The strong and steady implementation of macro-economic reforms which is being advocated through the stability packages in 2012 and 2013 is certainly crucial to enhance medium-term growth prospects, but should be balanced with concurrent investments in job creation and inclusive growth. In this respect, the ILO’s Committee of Experts on the Application of Conventions and Recommendations (CEACR)96 warns against the risk of social regression. In its 2011 General Survey on Social Security instruments, the CEACR had an opportunity to take stock of developments towards recovery from the global economic and financial crisis. It concluded that: “It appears that in some cases the imperative need to achieve fiscal consolidation has not been balanced with sufficient concern for the social and human costs of such rapid austerity measures. Not only social cohesion will be put at risk, but in such conditions, the economic recovery may be accompanied by a prolonged “human recession”. One should also remember that governing only by financially oriented criteria may lead to an undermining of social justice and equity. Public opinion is much less ready to accept drastic austerity measures if it sees that the efforts requested are not equally distributed and shared by everyone.”97
From a macro-economic point of view, Sudan’s energies are currently geared towards the achievement of the HIPC98 decision point (possibly by September 2014), to avoid the activation of the debt apportionment clause under the “zero option” agreed between Sudan and South Sudan, and thus a surge in the political and economic tensions between the
96 The CEACR is the supervisory body which carries out a legal examination of the extent to which national
laws and practices conform to International Labour Standards (ILS) and reports thereon to the ILO’s
Conference.
97 International Labour Conference, 100th Session. Committee of Experts on the Application of Conventions
and Recommendations (CEACR). Social security and the rule of law: General Survey concerning social
security instruments in light of the 2008 Declaration on Social Justice for a Fair Globalization in Report III
(Part 1B), Geneva, 2011. Paragraph 599.
98 Heavily Indebted Poor Countries Initiative.

71A Roadmap Toward A National Employment Policy For Sudan
two countries. Indeed, the risks identified with regard to the implementation of a national employment policy include domestic political instability and volatile security conditions, notably tensions at the border with South Sudan.
The I-PRSP identifies medium-term sources of growth, employment creation and poverty reduction in the agriculture and livestock sector, as well as manufacturing and services. It also estimates that to create jobs and reduce unemployment and poverty, the Sudanese economy will have to be growing at 6.5 percent per annum. Yet, despite policy statements towards economic diversification, the skills base of the country is still too limited to sustain agriculture-based economic innovation and transformation strategies unless additional capacities are injected (see Chapters 2 and 4). Even diversification into non-primary commodity sectors, such as manufacturing and services, with limited value addition and few forward and backward linkages to other sectors of the economy, may prove difficult to realize in the medium term, due to severe regional disparities and the net loss of resources and energies seeping through the large informal economy. As many other African economies, Sudan’s growth appears to be still underpinned by heavy dependence on commodity production and export, gold being now a case in point. This structural weakness has already prevented many countries in the past from transforming growth into commensurate jobs and faster social development. It is indeed well documented99 that many African countries focusing on export of commodities without transformation may increase their wealth in the short term, but also cause harm to the poorest groups. As countries often re-import products with higher value added, the inflationary process triggered would hit in primis the working poor (particularly as wages remain largely untouched), while also affecting the development of the local production base.
Pro-employment growth, with a focus on boosting value-addition processes, could result inferior in the short-term. However, one key question that policy makers and planners need to answer at this point in time is whether their priority is for Sudan to be rich as a nation, or rather to have the largest share of the Sudanese population partake in the nation’s wealth. This decision is of course a matter of social justice. The programmes and initiatives suggested in this Study as an initial array of policy options to be included in Sudan’s NEP are aimed at bringing together some key priorities for action in view of engendering sustainable and inclusive growth in a country faced with considerable economic challenges and daring policy choices. Subsequently, the NEP should become embedded in the development framework of Sudan.
In recent times, as ever more attention is paid to the importance of job creation as a key aspect of both economic recovery and growth, as well as of poverty alleviation policies and programmes, there has been equally strong acceptance of the role of labour standards and social dialogue as an intrinsic part of overall job creation strategies. An important
99 Economic Commission for Africa (ECA), Economic Report on Africa 2013. Making the most of Africa’s
commodities: Industrializing for Growth, Jobs, and Economic Transformation, Addis Ababa, 2013.

72
instrument at the global level has been the Global Jobs Pact, adopted at the International Labour Conference in 2009. This instrument, designed to promote a “decent work” response to the global economic and financial crisis, provides an overall guidance on the key elements and ingredients that should be included in a successful economic recovery strategy. Thus, while the Global Employment Agenda (GEA) provides the core elements of an employment policy strategy, as outlined in the relevant chapters of this Study, there is also a normative framework of reference. In 2010, the ILO published a General Survey by the Committee of Experts100 on its employment standards101. In its concluding comments, the Committee discusses the importance of these instruments for national policies and strategies on employment. It observes that there are three fundamental steps to achieving full, productive and freely chosen employment. The first is to make a political commitment to achieve full employment. The second is for member States to build or strive to build institutions necessary to ensure the realization of full employment for those persons willing and available to work, such as employment services, and procedures to implement active labour market measures and keep those measures under review. The third fundamental step is for member States to make the best possible effort, in relation to their level of development and economic capacity, to achieve and maintain full employment by supporting the training and retaining of workers; promoting the development of the social economy; and promoting the development of small and medium enterprises, as they play a pivotal role in poverty reduction through job creation. The Committee also summarises some of the main challenges facing developing economies, where the rate of employment generation generally remains low. The employment instruments point to three useful policy options for reducing employment challenges, which have received insufficient emphasis in most countries. The first concerns measures to increase the labour intensity of economic growth. The second is to devote increased attention to rural areas, where the majority of the labour force is still located. The third is to provide access to funding to encourage an entrepreneurial spirit for young persons and women. Governments are therefore encouraged to develop job creation policies in this direction102.
100 Within the ILO the main technical body for supervising the application of its standard-setting
instruments by ILO member States is the Committee of Experts on the Application of Conventions and
Recommendations (CEACR). Originally set up in 1926, the CEACR is today composed of no more than 20
eminent jurists appointed by the Governing Body for three-year terms. Its role is to provide an impartial
and technical evaluation of the state of application of International Labour Standards.
101 This General Survey covered in particular: the Employment Policy Convention, 1964 (No. 122); the
Human Resources Development Convention, 1975 (No. 142); the Employment Service Convention,
1948 (No. 88); the Private Employment Agencies Convention, 1997 (No. 181); the Job Creation in
Small and Medium Enterprises Recommendation, 1998 (No. 189); and the Promotion of Cooperatives
Recommendation, 2002 (No. 193).
102 These issues are very well elaborated in Roger Plant, Designing a National Employment Policy in Sudan:
The relevance of International Labour Standards, Thematic Paper prepared for the ILO/UNDP project
“SUDAN: Support to the development of a National Employment Framework”, September 2013.

73A Roadmap Toward A National Employment Policy For Sudan
These fundamental orientations should also shape Sudan’s National Employment Policy. This first Study has provided some insights on the employment challenges of the economy and on its labour market dynamics.
Given the complexity of the challenges, Sudan needs to identify meaningful policy targets. Simply pursuing a “reduction in unemployment” by a certain percentage may not be an effective policy target for the country, given the gender and age divides, the incidence of vulnerable employment, the limited availability of social protection and safety nets, and the fact that the bulk of employment is being generated in the informal economy.
As highlighted throughout the Study, employment generation is rather complex exercise and it is influenced by the entire range of economic and social policies. The NEP needs to be structured as an integrated approach: macroeconomic policies, sectoral and social policies, skills development programmes, labour and social protection policies, as well as institutional and regulatory frameworks must be further reviewed by those stakeholders involved in the NEP process in view of formulating and selecting relevant and realistic policy options towards an articulated employment policy, and an Action Plan.


