a review of volunteered geographic information quality
TRANSCRIPT
A review of volunteered geographic information qualityassessment methodsHansi Senaratnea, Amin Mobasherib, Ahmed Loai Alic,d, Cristina Capinerie
and Mordechai (Muki) Haklayf
aData Analysis and Visualization Group, University of Konstanz, Konstanz, Germany; bGIScience ResearchGroup, Heidelberg University, Heidelberg, Germany; cBremen Spatial Cognition Center, University ofBremen, Bremen, Germany; dInformation System Department, Assiut University, Assiut, Egypt; eFaculty ofPolitical Sciences, University of Sienna, Sienna, Italy; fDepartment of Geomatic Engineering, UniversityCollege London, London, UK
ABSTRACTWith the ubiquity of advanced web technologies and location-sensing hand held devices, citizens regardless of their knowledgeor expertise, are able to produce spatial information. This phenom-enon is known as volunteered geographic information (VGI).During the past decade VGI has been used as a data sourcesupporting a wide range of services, such as environmental mon-itoring, events reporting, human movement analysis, disastermanagement, etc. However, these volunteer-contributed dataalso come with varying quality. Reasons for this are: data is pro-duced by heterogeneous contributors, using various technologiesand tools, having different level of details and precision, servingheterogeneous purposes, and a lack of gatekeepers. Crowd-sour-cing, social, and geographic approaches have been proposed andlater followed to develop appropriate methods to assess thequality measures and indicators of VGI. In this article, we reviewvarious quality measures and indicators for selected types of VGIand existing quality assessment methods. As an outcome, thearticle presents a classification of VGI with current methods uti-lized to assess the quality of selected types of VGI. Through thesefindings, we introduce data mining as an additional approach forquality handling in VGI.
1. Introduction
Volunteered geographic information (VGI) is where citizens, often untrained, and regard-less of their expertise and background create geographic information on dedicated webplatforms (Goodchild 2007), e.g., OpenStreetMap (OSM),1 Wikimapia,2 Google MyMaps,3
Map Insight4 and Flickr.5 In a typology of VGI, the works of Antoniou et al. (2010) andCraglia et al. (2012) classified VGI based on the type of explicit/implicit geography beingcaptured and the type of explicit/implicit volunteering. In explicit-VGI, contributors aremainly focused on mapping activities. Thus, the contributor explicitly annotates the datawith geographic contents (e.g., geometries in OSM, Wikimapia, or Google). Data that is
Konstanzer Online-Publikations-System (KOPS) URL: http://nbn-resolving.de/urn:nbn:de:bsz:352-0-341149
Erschienen in: International Journal of Geographical Information Science ; 31 (2017), 1. - S. 139-167 https://dx.doi.org/10.1080/13658816.2016.1189556
implicitly associated with a geographic location could be any kind of media: text, image,or video referring to or associated with a specific geographic location. For example,geotagged microblogs (e.g., Tweets), geotagged images from Flicker, or Wikipediaarticles that refer to geographic locations. Craglia et al. (2012) further elaborated thatfor each type of implicit/explicit geography and volunteering, there are potentiallydifferent approaches for assessing the quality.
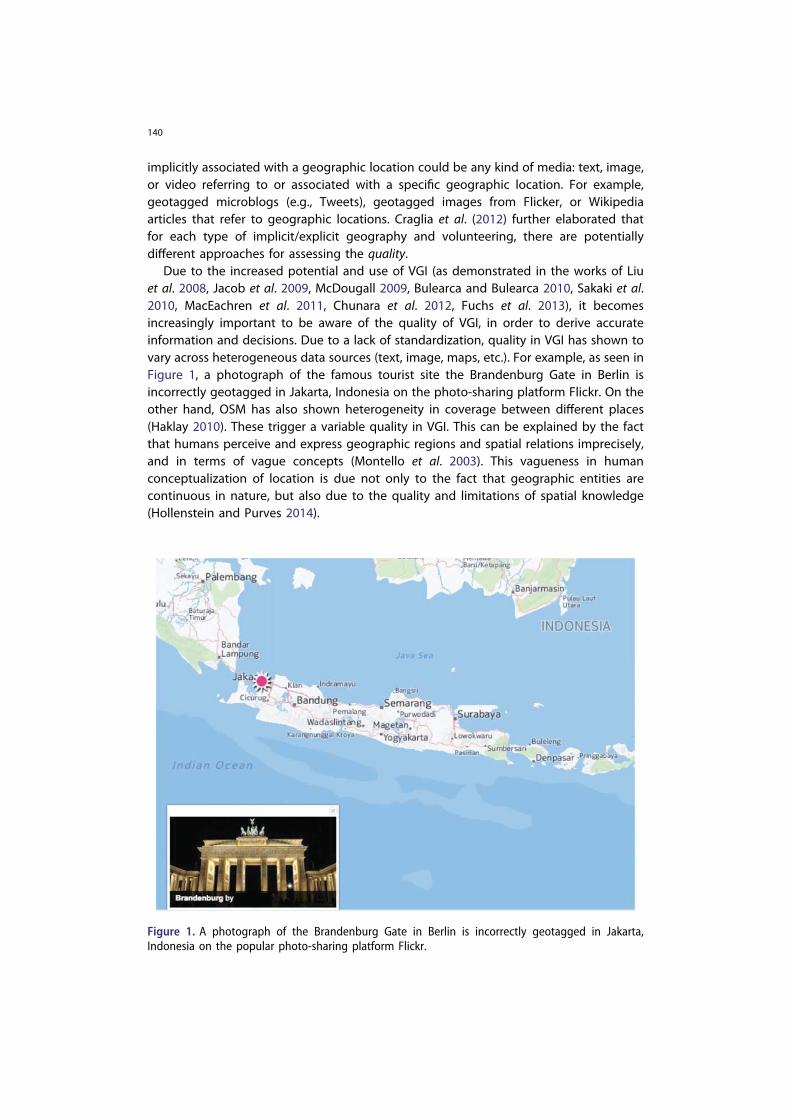
Due to the increased potential and use of VGI (as demonstrated in the works of Liuet al. 2008, Jacob et al. 2009, McDougall 2009, Bulearca and Bulearca 2010, Sakaki et al.2010, MacEachren et al. 2011, Chunara et al. 2012, Fuchs et al. 2013), it becomesincreasingly important to be aware of the quality of VGI, in order to derive accurateinformation and decisions. Due to a lack of standardization, quality in VGI has shown tovary across heterogeneous data sources (text, image, maps, etc.). For example, as seen inFigure 1, a photograph of the famous tourist site the Brandenburg Gate in Berlin isincorrectly geotagged in Jakarta, Indonesia on the photo-sharing platform Flickr. On theother hand, OSM has also shown heterogeneity in coverage between different places(Haklay 2010). These trigger a variable quality in VGI. This can be explained by the factthat humans perceive and express geographic regions and spatial relations imprecisely,and in terms of vague concepts (Montello et al. 2003). This vagueness in humanconceptualization of location is due not only to the fact that geographic entities arecontinuous in nature, but also due to the quality and limitations of spatial knowledge(Hollenstein and Purves 2014).
Figure 1. A photograph of the Brandenburg Gate in Berlin is incorrectly geotagged in Jakarta,Indonesia on the popular photo-sharing platform Flickr.
140
Providing reliable services or extraction of useful information require data with afitness-for-use quality standard. Incorrect (as seen in Figure 1) or malicious geographicannotations could be minimized in place of appropriate quality indicators and measuresfor these various VGI contributions.
Goodchild and Li (2012) have discussed three approaches for assuring the quality ofVGI: crowd-sourcing (the involvement of a group to validate and correct errors that havebeen made by an individual contributor), social approaches (trusted individuals whohave made themselves a good reputation with their contributions to VGI can, forexample, act as gatekeepers to maintain and control the quality of other VGI contribu-tions), and geographic approaches (use of laws and knowledge from geography, such asTobler’s first law to assess the quality). Many works have developed methods to assessthe quality of VGI based on these approaches.
In this article, we present an extensive review of the existing methods in the state-of-the-art to assess the quality of map-, image-, and text-based VGI. As an outcome of thereview, we identify data mining as one more stand-alone approach to assess VGI qualityby utilizing computational processes for discovering patterns and learning purely fromdata, irrespective of the laws and knowledge from geography, and independent fromsocial or crowd-sourced approaches. Extending the spectrum of approaches will sproutmore quality assessment methods in the future, especially for VGI types that have notbeen extensively researched so far. To the best of our knowledge, surveys on existingmethods have not been done so far. This review provides an overview of methods thathave been built based on theories and discussions in the literature. Furthermore, thissurvey gives the reader a glimpse to the practical applicability of all identifiedapproaches. The remainder of this article unfolds as follows. In Section 2, we describethe different quality measures and indicators for VGI. In Section 3, we describe the maintypes of VGI that we consider for our survey, and in Section 4, we describe themethodology that was followed for the selection of literature for this survey. Section 5summarizes the findings of the survey, and Section 6 discusses the limitations and futureresearch perspectives. Finally, we conclude our findings in Section 7.
2. Measures and indicators for VGI quality
Quality of VGI can be described by quality measures and quality indicators (Antoniou andSkopeliti 2015). Quality measures, mainly adhering to the ISO principles and guidelinesrefer to those elements that can be used to ascertain the discrepancy between thecontributed spatial data and the ground truth (e.g., completeness of data) mainly bycomparing to authoritative data. When authoritative data is no longer usable forcomparisons, and the established measures become no longer adequate to assess thequality of VGI, researchers have explored more intrinsic ways to assess VGI quality bylooking into other proxies for quality measures. These are called quality indicators, thatrely on various participation biases, contributor expertise or the lack of it, background,etc., that influence the quality of VGI, but cannot be directly measured (Antoniou andSkopeliti 2015). In the following, these quality measures and indicators are described indetail. The review of quality assessment methods in Section 5 is based on these variousquality measures and indicators.
141
2.1. Quality measures for VGI
International Organization for Standardization (ISO6) defined geographic informationquality as totality of characteristics of a product that bear on its ability to satisfy statedand implied needs. ISO/TC 2117 (Technical Committee) developed a set of internationalstandards that define the measures of geographic information quality (standard 19138,as part of the metadata standard 19115). These quantitative quality measures are:completeness, consistency, positional accuracy, temporal accuracy, and thematicaccuracy.
Completeness describes the relationship between the represented objects and theirconceptualizations. This can be measured as the absence of data (errors of omission) andpresence of excess data (errors of commission). Consistency is the coherence in the datastructures of the digitized spatial data. The errors resulting from the lack of it areindicated by (i) conceptual consistency, (ii) domain consistency, (iii) format consistency,and (iv) topological consistency. Accuracy refers to the degree of closeness between ameasurement of a quantity and the accepted true value of that quantity, and it is in theform of positional accuracy, temporal accuracy and thematic accuracy. Positional accu-racy is indicated by (i) absolute or external accuracy, (ii) relative or internal accuracy, (iii)gridded data position accuracy. Thematic accuracy is indicated by (i) classificationcorrectness, (ii) non-quantitative attribute correctness, (iii) quantitative attribute accu-racy. In both cases, the discrepancies can be numerically estimated. Temporal accuracy isindicated by (i) accuracy of a time measurement: correctness of the temporal referencesof an item, (ii) temporal consistency: correctness of ordered events or sequences, (iii)temporal validity: validity of data with regard to time.
2.2. Quality indicators for VGI
As part of the ISO standards, geographic information quality can be further assessedthrough qualitative quality indicators, such as the purpose, usage, and lineage. Theseindicators are mainly used to express the quality overview for the data. Purposedescribes the intended usage of the dataset. Usage describes the application(s) inwhich the dataset has been utilized. Lineage describes the history of a dataset fromcollection, acquisition to compilation and derivation to its form at the time of use (Hoyle2001, Guinée 2002, Van Oort and Bregt 2005). In addition, where ISO standardizedmeasures and indicators are not applicable, we have found in the literature moreabstract quality indicators to imply the quality of VGI. These are: trustworthiness, cred-ibility, text content quality, vagueness, local knowledge, experience, recognition, reputa-tion. Trustworthiness is a receiver judgment based on subjective characteristics, such asreliability or trust (good ratings on the creations, and the higher frequency of usage ofthese creations indicate this trustworthiness) (Flanagin and Metzger 2008). In assessingthe credibility of VGI, the source of information plays a crucial role, as it is whatcredibility is primarily based upon. However, this is not straightforward. Due to thenon-authoritative nature of VGI, the source maybe unavailable, concealed, or missing(this is avoided by gatekeepers in authoritative data). Credibility was defined by Hovlandet al. (1953) as the believability of a source or message, which comprises primarily twodimensions, the trustworthiness (as explained earlier), and expertise. Expertise contains
142

objective characteristics such as accuracy, authority, competence, or source credentials(Flanagin and Metzger 2008). Therefore, in assessing the credibility of data as a qualityindicator one needs to consider factors that attribute to the trustworthiness and exper-tise. Metadata about the origin of VGI can provide a foundation for the source creden-tials of VGI (Frew 2007). Text content quality (mostly applicable for text-based VGI)describes the quality of text data by the use of text features, such as the text length,structure, style, readability, revision history, topical similarity, the use of technical termi-nology, etc. Vagueness is the ambiguity with which the data is captured (e.g., vaguenesscaused by low resolutions) (De Longueville et al. 2010). Local knowledge is the con-tributors’ familiarity to the geographic surroundings that she/he is implicitly or explicitlymapping. Experience is the involvement of a contributor with the VGI platform that she/he contributes to. This can be expressed by the time that the contributor has beenregistered with the VGI portal, number of global positioning system (GPS) tracks con-tributed (e.g., in OSM) or the number of features added and edited, or the amount ofparticipation in online forums to discuss the data (Van Exel et al. 2010). Recognition isthe acknowledgement given to a contributor based on tokens achieved (e.g., in gamifiedVGI platforms), and the reviewing of their contributions among their peers (Van Exelet al. 2010). Maué (2007) described reputation as a tool to ensure the validity of VGI.Reputation is assessed by, for example, the history of past interactions that are happen-ing between collaborators. Resnick et al. (2000) described contributors’ abilities anddispositions as features where this reputation can be based upon. Maué (2007) furtherargue that similar to the eBay rating system,8 the created geographic features on variousVGI platforms can be rated, tagged, discussed, and annotated, which affects the datacontributor’s reputation value.
3. Map, image, and text-based VGI: definitions and quality issues
The effective utilization of VGI is strongly associated with data quality, and this variesdepending primarily on the type of VGI, the way data is collected on the different VGIplatforms, and the context of usage. The following sections describe the selected formsof VGI: (1) map, (2) image, and (3) text, their uses, and how data quality issues arise.These three types of VGI are chosen based on the methods that are used to capture thedata (maps: as GPS points and traces, image: as photos, text: as plain text), and becausethey are the most popular forms of VGI currently used. This section further lays theground work to understand the subsequent section on various quality measures andindicators, and quality assessment methods used for these three types of VGI.
3.1. Map-based VGI
Map-based VGI concerns all VGI sources that include geometries as points, lines, andpolygons, the basic elements to design a map. Among others, OSM, Wikimapia, GoogleMap Maker, and Map Insight are examples of map-based VGI projects. However, OSM isthe most prominent project due to the following reasons: (i) it aims to develop a freemap of the world accessible and obtainable for everyone; (ii) it has millions of registeredcontributors; (iii) it has active mapper communities in many locations; and (iv) it providesfree and flexible contribution mechanisms for data (useful for map provision, routing,
143

planning, geo-visualization, point of interests (POI) search, etc.). Thus, during the rest ofthe article we will discuss OSM as an example for map-based VGI. As in most VGIprojects, the spatial dimension of OSM data is annotated in the form of nodes, lines,or polygons with latitude/longitude referencing, and attributes are annotated by tags inthe form of key-value pairs. Each tag describes a specific geographic entity fromdifferent perspectives. There are no restrictions to the usage of these tags: endlesscombinations are possible, and the contributors are free to choose the tags theydeem appropriate. Nevertheless, OSM provides a set of recommendations of acceptedkey-value pairs, and if the contributors want their contributions to become a part of themap, they need to follow the agreed-upon standards. This open classification schemecan lead to misclassification and reduction in data quality. Map-based VGI is commonlyused for purposes, such as navigation and POI search. For these purposes, the positionalaccuracy and the topological consistency of the entities are as important as theirabstract locations. The other dimension is the attribute accuracy, where the annotationsassociated with an entity should reflect its characteristics without conflicts (e.g., for roadtags, one-way = true and two-way = true). In OSM, the loose contribution mechanismsresult in problematic classifications that influence the attribute accuracy. In addition toaccuracy, providing reliable services is affected by data completeness; features, attribute,and model completeness. Whether a map includes all the required features, whether afeature is annotated with a complete set of attributes, and if the model is able to answerall possible queries, all these points are related to the completeness quality measure.Especially due to the lack of ground-truth data for comparison, assessing VGI complete-ness still raises some challenges.
3.2. Image-based VGI
Image-based VGI is mostly produced implicitly within portals such as Flickr,Panoramio, Instagram, etc., where contributors take pictures of a particular geo-graphic object or surrounding with cameras, smart phones, or any hand held device,and attach a geospatial reference to it. These objects/surroundings can be spatiallyreferenced either by giving geographic coordinates and/or user-assigned geospatialdescriptions of these photographs in the form of textual labels. These photo-sharingwebsites have several uses, such as environmental monitoring (Fuchs et al. 2013),pedestrian navigation (Robinson et al. 2012), event and human trajectory analysis(Andrienko et al. 2009), for creating geographical gazetteers (Popescu et al. 2008), oreven to complement institutional data sources in your locality (Milholland and Pultar2013).
Tagging an image is a means of adding metadata to the content in the form ofspecific keywords to describe the content (Golder and Huberman 2006), or in the form ofgeographic coordinates (geotagging) to identify the location linked to the image con-tent (Valli and Hannay 2010). There exist several approaches to geotag an image: recordthe geographic location with the use of an external GPS device, with an in-built GPS (inmany of the modern digital cameras, smart phones), or manually positioning the photoon a map interface.
Not only the GPS precision and accuracy errors resulting from various devices, butalso other factors influence the quality of image-based VGI. For example, instead of
144

stating the position from where the photo was taken (photographer position) somecontributors tend to geotag the photo with the position of the photo content, whichcould be several kilometers away from where the photo originated causing positionalaccuracy issues (as also discussed in Keßler et al. 2009). This is a problem when we wantto utilize these photos, for example, in human trajectory analysis. Furthermore, due tothe lack of sufficient spatial knowledge contributors sometimes incorrectly geotag theirphotographs (Figure 1), also in lower geographic resolutions (in case of Flickr, somecontributors do not zoom enough to the street level, instead they zoom up to country orcity level to geotag their photos). Or some contributors geotag and textually labelrandom irrelevant photos for actual events, causing the users to doubt the trustworthi-ness of the content. Such contents are not fit for use for tasks, such as disaster manage-ment, environmental monitoring, or pedestrian navigation. Citizen Science Projects, suchas GeoTag-X9 have in place machine learning and crowd-sourcing methods to discoverunauthentic material and clean them.
3.3. Text-based VGI
Text-based VGI (typically microblogs) is mostly produced implicitly on portals, such asTwitter, Reddit or various Blogs, where people contribute geographic information in theform of text by using smart phones, PCs, or any hand held devices. Twitter, for example,is used as an information foraging source (MacEachren et al. 2011), in journalism todisseminate data to the public in near real-time basis (O’Connor 2009, Castillo et al.2011), detect disease spreading (Chunara et al. 2012), event detection (Bosch et al. 2013),and for gaining insights on social interaction behavior (Huberman et al. 2008) ortrajectories of people (Andrienko et al. 2013, Senaratne et al. 2014).
In text-based VGI, the spatial reference can be either in the text, where the con-tributor refers to a place-name (e.g., ‘Lady Gaga is performing in New York today’), or thespatial reference can be the geotag where the tweet is originating from. While somepeople contribute meaningful information most others use these mediums to expresspersonal opinions, moods, or for malicious aims, such as bullying or trolling to harassother users. Gupta and Kumaraguru (2012) conducted a study to investigate how muchinformation is credible and therefore useful, and how much information is spam, onTwitter. They found that 14% of Tweets collected for event analysis were spam, while30% of the Tweets contained situational awareness information, out of which only 17%of the total tweets contained credible situational awareness information. Such spammakes it difficult to derive useful information that could be of interest for the above-nameduse-cases. Therefore, quality analysis of these data is important to filter out the usefulinformation, and disregard the rest. Other than the inherent GPS errors in devices, a biggerrole for quality issues is played by the contributor herself/himself based on the informationshe/he provides. In addition, due to the lack of spatial knowledge of some contributors thelocation is incorrectly specified, and at times at a low resolution (in the Twitter interface onPCs the contributor can specify the location not only at the city level but also at a morecoarse state level). Sometimes, if the contributor is writing about an event that takes place afew hundred kilometers away from her position, she would geotag her content with thelocation of the event rather than her position, or the other way around.
145
A summary of quality assessment methods for these VGI types is presented in Section 5.
4. The literature review methodology
This review provides an overview of the state-of-the-art methods to assess the quality ofselected types of VGI. To achieve this goal, we breakdown our review in to threecategories. First, we show how the topic of quality assessment within map, image, andtext VGI has evolved over the years since the birth of VGI in 2007 until the time ofwriting this article (mid of 2015). Second, the reviewed papers are classified according tothe type of quality measure or indicator that is assessed within each of the papers. Third,all the quality measures and indicators that are addressed within each of the reviewedpapers are classified with the different methods utilized to assess them.
We used the following strategy to select the literature for our review. We used GoogleScholar to search for papers that include the following terms in their title or abstract:data quality assessment, methods and techniques, uncertainty, volunteered geographicinformation, map, microblog, photo. This query resulted in 425 research papers. Wesorted the search results according to the Google Scholar relevance ranking.10 Thisrelevance ranking follows a combined ranking algorithm that contains a weighting forthe full text of each article, author of article, publisher, and how often the article hasbeen cited in other scholarly articles. We refined our collection of papers by filtering outthe papers according to the following criteria: (1) papers were published from 2007, (2)papers should describe quality assessment methods, or techniques, or tools, (3) a latestpaper was selected when multiple versions of similar methods were available from thesame research group. Citizen Science research studies are not considered in this review.As such, we selected 56 papers in total.
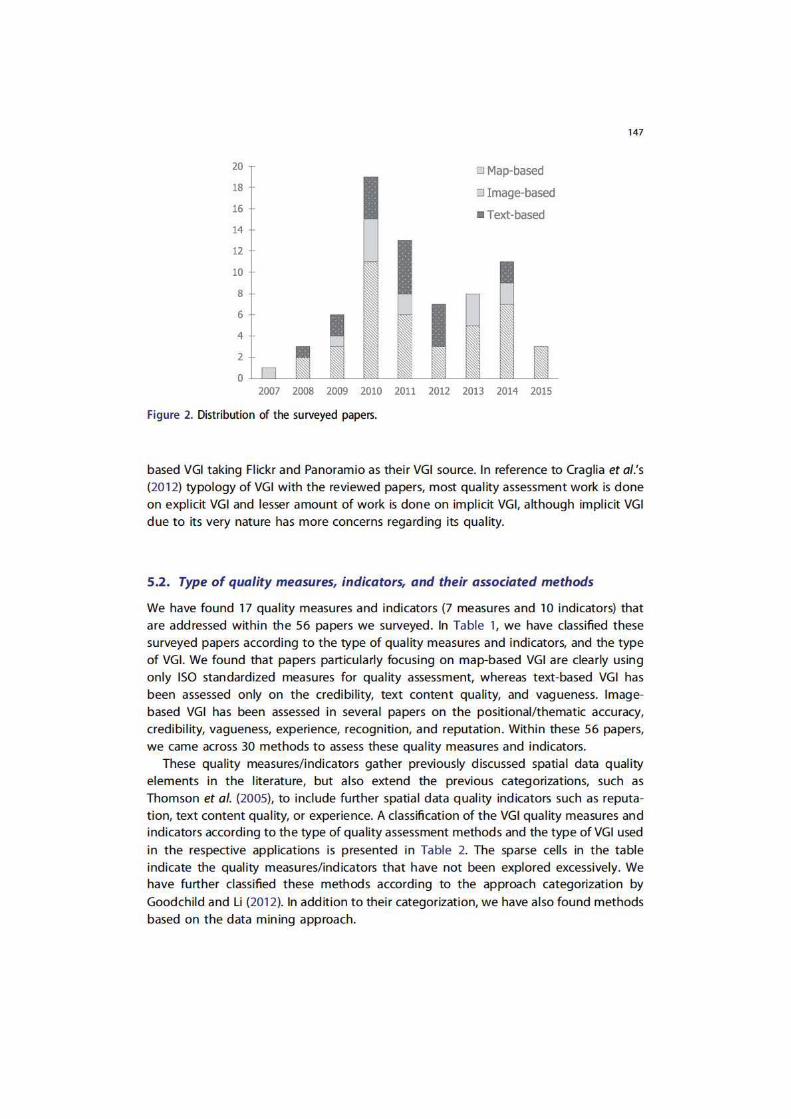
Figure 2 shows the distribution of the reviewed papers for VGI quality assessmentmethods. Evidently, the publication of papers on this topic gained momentum in 2010,for the most part papers discuss methods for map-based VGI.
5. Existing methods for assessing the quality of VGI
We have reviewed state-of-the-art methods to assess various quality measures andindicators of VGI. Within this review, a method is considered to be a systematicprocedure that is followed to assess the quality measures and quality indicators. Forexample, comparing with satellite imagery is a method to assess the positional accuracyof maps. The found methods have been mostly conceptually implemented for a parti-cular use-case. These methods have been reviewed mainly based on the type of VGI, thequality measures and indicators supported, and the approaches followed to develop themethod.
5.1. Distribution of selected literature
Out of the 56 papers that we reviewed, 40 papers discuss methods for assessing thequality of map-based VGI, in most cases taking OSM data as the VGI source. Eighteenpapers introduce methods for text-based VGI taking mainly Twitter, Wikipedia, andYahoo! answers as the VGI source. Thirteen papers introduce methods for image-
146
147
20 o Map-based 18 o Image-based 16 • Text-based 14
12
10
8
6
4
2
0 2007 2008 2009 2010 2011 2012 2013 2014 2015
Figure 2. Distribution of the surveyed papers.
based VGI taking Flickr and Panoramio as their VGI source. In reference to Craglia et al.'s (2012) typology of VGI with the reviewed papers, most quality assessment work is done on explicit VGI and lesser amount of work is done on implicit VGI, although implicit VGI due to its very nature has more concerns regarding its quality.
5.2. Type of quality measures, indicators, and their associated methods
We have found 17 quality measures and indicators (7 measures and 10 indicators) that are addressed within the 56 papers we surveyed. In Table 1, we have classified these surveyed papers according to the type of quality measures and indicators, and the type of VGI. We found that papers particularly focusing on map-based VGI are clearly using only ISO standardized measures for quality assessment, whereas text-based VGI has been assessed only on the credibility, text content quality, and vagueness. Imagebased VGI has been assessed in several papers on the positional/thematic accuracy, credibility, vagueness, experience, recognition, and reputation. Within these 56 papers, we came across 30 methods to assess these quality measures and indicators.
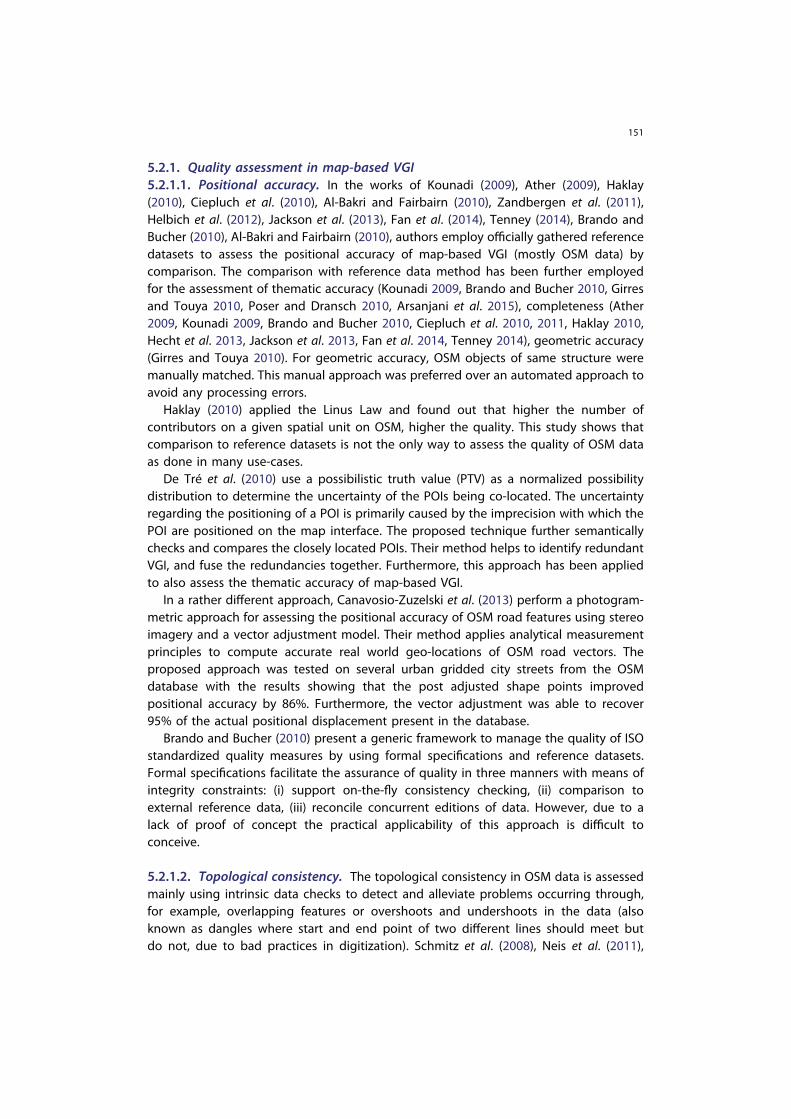
These quality measures/indicators gather previously discussed spatial data quality elements in the literature, but also extend the previous categorizations, such as Thomson eta/. (2005), to include further spatial data quality indicators such as reputation, text content quality, or experience. A classification of the VGI quality measures and indicators according to the type of quality assessment methods and the type of VGI used in the respective applications is presented in Table 2. The sparse cells in the table indicate the quality measures/indicators that have not been explored excessively. We have further classified these methods according to the approach categorization by Goodchild and Li (2012). In addition to their categorization, we have also found methods based on the data mining approach.
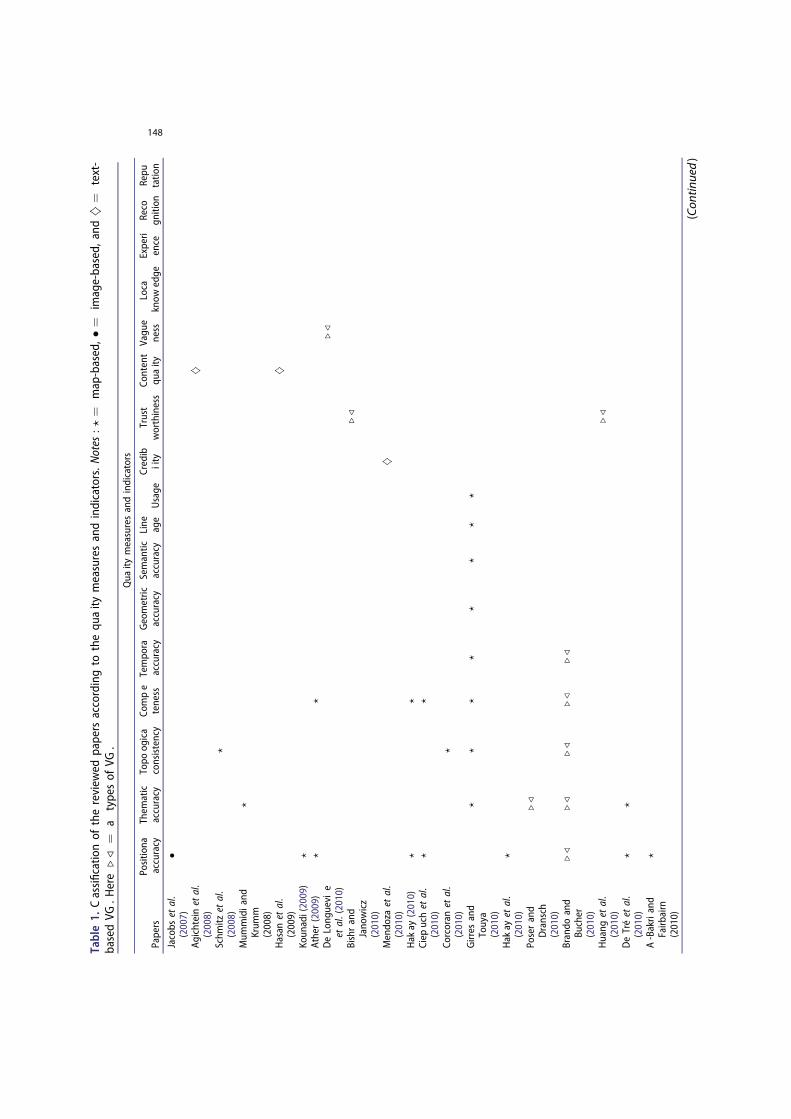
Table1.
Cassificatio
nof
thereview
edpapers
accordingto
thequ
aity
measuresandindicators.N
otes
:?¼
map-based,�
¼image-based,
and}
¼text-
basedVG
.Here
./
¼a
typesof
VG.
Qua
itymeasuresandindicators
Papers
Positio
naaccuracy
Them
atic
accuracy
Topo
ogica
consistency
Compe
teness
Tempo
raaccuracy
Geometric
accuracy
Semantic
accuracy
Line age
Usage
Credib
iity
Trust
worthiness
Content
quaity
Vagu
eness
Loca
know
edge
Experi
ence
Reco
gnition
Repu
tatio
n
Jacobs
etal.
(2007)
�
Agichteinet
al.
(2008)
}
Schm
itzet
al.
(2008)
?
Mum
midiand
Krum
m(2008)
?
Hasan
etal.
(2009)
}
Koun
adi(2009)
?Ather(2009)
??
DeLong
uevi
eet
al.(2010)
./
Bishrand
Jano
wicz
(2010)
./
Mendo
zaet
al.
(2010)
}
Hak
ay(2010)
??
Ciep
uchet
al.
(2010)
??
Corcoran
etal.
(2010)
?
Girres
and
Touya
(2010)
??
??
??
??
Hak
ayet
al.
(2010)
?
Poserand
Dransch
(2010)
./
Brando
and
Bucher
(2010)
./
./
./
./
./
Huang
etal.
(2010)
./
DeTréet
al.
(2010)
??
A-Bakriand
Fairb
airn
(2010)
?
(Con
tinued)
148
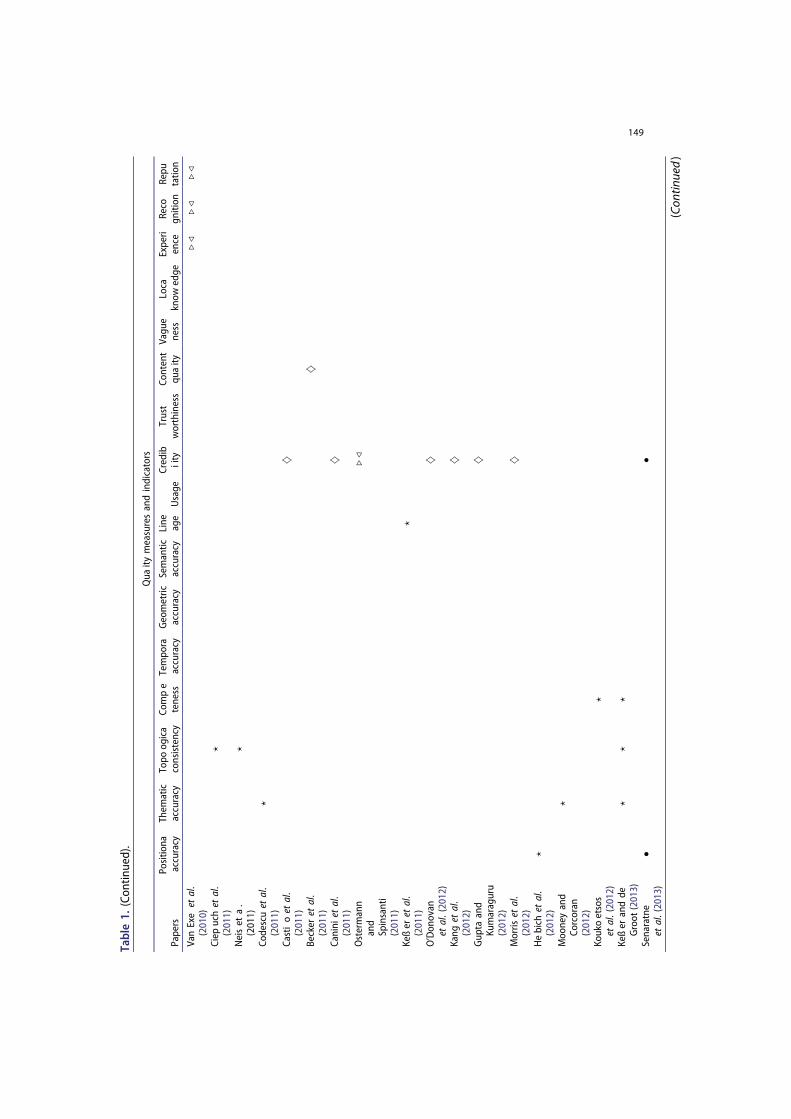
Table1.
(Con
tinued).
Qua
itymeasuresandindicators
Papers
Positio
naaccuracy
Them
atic
accuracy
Topo
ogica
consistency
Compe
teness
Tempo
raaccuracy
Geometric
accuracy
Semantic
accuracy
Line age
Usage
Credib
iity
Trust
worthiness
Content
quaity
Vagu
eness
Loca
know
edge
Experi
ence
Reco
gnition
Repu
tatio
n
VanExe
etal.
(2010)
./
./
./
Ciep
uchet
al.
(2011)
?
Neiset
a.
(2011)
?
Codescuet
al.
(2011)
?
Castioet
al.
(2011)
}
Becker
etal.
(2011)
}
Canini
etal.
(2011)
}
Ostermann
and
Spinsanti
(2011)
./
Keßer
etal.
(2011)
?
O’Don
ovan
etal.(2012)
}
Kang
etal.
(2012)
}
Gup
taand
Kumaraguru
(2012)
}
Morris
etal.
(2012)
}
Hebich
etal.
(2012)
?
Mooneyand
Corcoran
(2012)
?
Koukoetsos
etal.(2012)
?
Keßer
andde
Groot
(2013)
??
?
Senaratne
etal.(2013)
��
(Con
tinued)
149
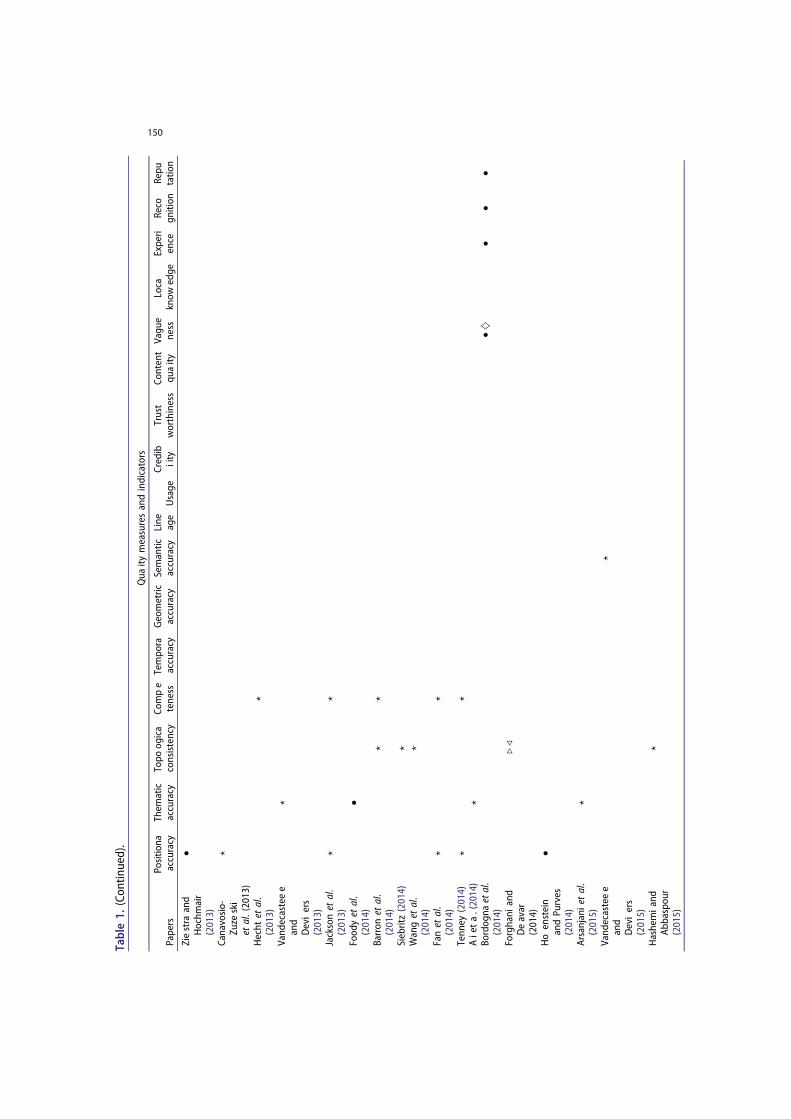
Table1.
(Con
tinued).
Qua
itymeasuresandindicators
Papers
Positio
naaccuracy
Them
atic
accuracy
Topo
ogica
consistency
Compe
teness
Tempo
raaccuracy
Geometric
accuracy
Semantic
accuracy
Line age
Usage
Credib
iity
Trust
worthiness
Content
quaity
Vagu
eness
Loca
know
edge
Experi
ence
Reco
gnition
Repu
tatio
n
Ziestra
and
Hochm
air
(2013)
�
Canavosio-
Zuze
ski
etal.(2013)
?
Hecht
etal.
(2013)
?
Vand
ecasteee
and
Deviers
(2013)
?
Jacksonet
al.
(2013)
??
Food
yet
al.
(2014)
�
Barron
etal.
(2014)
??
Siebritz(2014)
?Wanget
al.
(2014)
?
Fanet
al.
(2014)
??
Tenn
ey(2014)
??
Aieta.(2014)
?Bo
rdog
naetal.
(2014)
�}�
��
Forghani
and
Deavar
(2014)
./
Hoenstein
andPurves
(2014)
�
Arsanjanietal.
(2015)
?
Vand
ecasteee
and
Deviers
(2015)
?
Hashemiand
Abbaspou
r(2015)
?
150
5.2.1. Quality assessment in map-based VGI5.2.1.1. Positional accuracy. In the works of Kounadi (2009), Ather (2009), Haklay(2010), Ciepluch et al. (2010), Al-Bakri and Fairbairn (2010), Zandbergen et al. (2011),Helbich et al. (2012), Jackson et al. (2013), Fan et al. (2014), Tenney (2014), Brando andBucher (2010), Al-Bakri and Fairbairn (2010), authors employ officially gathered referencedatasets to assess the positional accuracy of map-based VGI (mostly OSM data) bycomparison. The comparison with reference data method has been further employedfor the assessment of thematic accuracy (Kounadi 2009, Brando and Bucher 2010, Girresand Touya 2010, Poser and Dransch 2010, Arsanjani et al. 2015), completeness (Ather2009, Kounadi 2009, Brando and Bucher 2010, Ciepluch et al. 2010, 2011, Haklay 2010,Hecht et al. 2013, Jackson et al. 2013, Fan et al. 2014, Tenney 2014), geometric accuracy(Girres and Touya 2010). For geometric accuracy, OSM objects of same structure weremanually matched. This manual approach was preferred over an automated approach toavoid any processing errors.
Haklay (2010) applied the Linus Law and found out that higher the number ofcontributors on a given spatial unit on OSM, higher the quality. This study shows thatcomparison to reference datasets is not the only way to assess the quality of OSM dataas done in many use-cases.
De Tré et al. (2010) use a possibilistic truth value (PTV) as a normalized possibilitydistribution to determine the uncertainty of the POIs being co-located. The uncertaintyregarding the positioning of a POI is primarily caused by the imprecision with which thePOI are positioned on the map interface. The proposed technique further semanticallychecks and compares the closely located POIs. Their method helps to identify redundantVGI, and fuse the redundancies together. Furthermore, this approach has been appliedto also assess the thematic accuracy of map-based VGI.
In a rather different approach, Canavosio-Zuzelski et al. (2013) perform a photogram-metric approach for assessing the positional accuracy of OSM road features using stereoimagery and a vector adjustment model. Their method applies analytical measurementprinciples to compute accurate real world geo-locations of OSM road vectors. Theproposed approach was tested on several urban gridded city streets from the OSMdatabase with the results showing that the post adjusted shape points improvedpositional accuracy by 86%. Furthermore, the vector adjustment was able to recover95% of the actual positional displacement present in the database.
Brando and Bucher (2010) present a generic framework to manage the quality of ISOstandardized quality measures by using formal specifications and reference datasets.Formal specifications facilitate the assurance of quality in three manners with means ofintegrity constraints: (i) support on-the-fly consistency checking, (ii) comparison toexternal reference data, (iii) reconcile concurrent editions of data. However, due to alack of proof of concept the practical applicability of this approach is difficult toconceive.
5.2.1.2. Topological consistency. The topological consistency in OSM data is assessedmainly using intrinsic data checks to detect and alleviate problems occurring through,for example, overlapping features or overshoots and undershoots in the data (alsoknown as dangles where start and end point of two different lines should meet butdo not, due to bad practices in digitization). Schmitz et al. (2008), Neis et al. (2011),
151
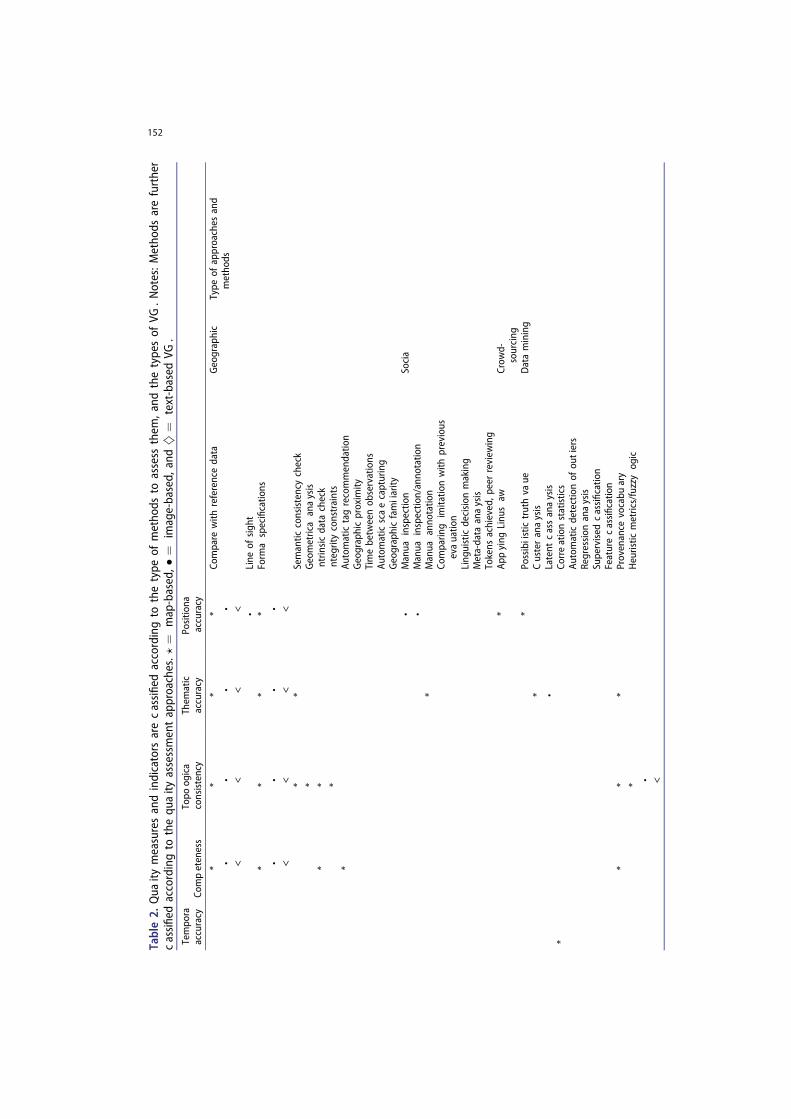
Table2.
Qua
itymeasuresandindicators
arecassified
accordingto
thetype
ofmetho
dsto
assess
them
,and
thetypesof
VG.Notes:M
etho
dsarefurther
cassified
accordingto
thequ
aity
assessmentapproaches.?
¼map-based,�
¼image-based,
and}
¼text-based
VG.
Tempo
raaccuracy
Competeness
Topo
ogica
consistency
Them
atic
accuracy
Positio
naaccuracy
*• <
*• <
* • <
*• <
Compare
with
referencedata
Geographic
Type
ofapproaches
and
metho
ds
•Line
ofsigh
t*• <
*• <
* • <
*• <
Form
aspecificatio
ns
**
Semantic
consistencycheck
*Geometricaanaysis
**
ntrin
sicdata
check
*ntegrityconstraints
*Au
tomatictagrecommendatio
nGeographicproximity
Timebetweenob
servations
Automaticscaecapturing
Geographicfamiiarity
•Manua
inspectio
nSocia
•Manua
inspectio
n/anno
tatio
n*
Manua
anno
tatio
nCo
mparin
gimitatio
nwith
previous
evauatio
nLing
uisticdecision
making
Meta-data
anaysis
Tokens
achieved,p
eerreview
ing
*Ap
pying
Linu
saw
Crow
d-sourcing
*Possibiistictruthva
ueDatamining
*Custeranaysis
•Latent
cassanaysis
*Co
rreationstatistics
Automaticdetectionof
outiers
Regression
anaysis
Supervised
cassificatio
nFeaturecassificatio
n*
**
Provenance
vocabu
ary
*• <
Heuristic
metrics/fuzzyog
ic
152

Geometric
accuracy
*
Semantic
accuracy
**
Lineage
**
Usage
*Credibiity
*• <
•<
<
Trust
*• <
*• <
*• <
Contentqu
aity
•<
<<
Vagu
eness
*• <
*• <
Loca
know
edge
*• <
Experience
•<
*• <
Recogn
ition
•<
*• <
Repu
tatio
n•<
153
Barron et al. (2014), Siebritz (2014) have demonstrated that for each of these measures aseparate topology integrity rule can be designed and applied. Further, based on thedefinition of planar and non-planar topological properties, Corcoran et al. (2010) and DaSilva and Wu (2007) have used geometrical analysis methods to assess the topologicalconsistency of the OSM data. In another work, the concept of spatial similarity in multi-representations have been employed in order to perform both extrinsic and intrinsicquality analysis (Hashemi and Abbaspour 2015). The authors discuss that their methodcould be efficiently applied to VGI data for the purpose of vandalism detection. Otherstudies have also focused on evaluating the topological consistency of OSM data with afocus on road network infrastructures (Will 2014). In Wang et al. (2014) and Girres andTouya (2010), the authors have used the Dimensional Extended Nine-Intersection Modelin order to compute the qualitative spatial relation between road objects in OSM. Thismethod and model allows them to check for topological inconsistencies and be able tolocate the junctions of roads in order to, for example, generate expected road signs.
5.2.1.3. Thematic accuracy and semantic accuracy. Mooney and Corcoran (2012)point out that most errors in OSM are caused by manual annotation by contributorswho sometimes misspell the feature values. Addressing this issue, Codescu et al. (2011),Vandecasteele and Devillers (2013), Ali et al. (2014) have developed semantic similaritymatching methods, which automatically assess the contributor annotation of features inOSM according to the semantic meaning of such features. Girres and Touya (2010) foundthat semantic errors were mainly due to the mis-specification of roads. For example,roads that were classified as ‘secondary’ in the reference dataset were classified as‘residential’, or ‘tertiary’ by contributors in OSM data. The reasons for these inaccuraciesas seen by authors are the lack of a standardized classification, looseness for contributorsto enter tags and values that are not present in the OSM specification, lack of namingregulations w.r.t., for example, capitalization or prefixes. The authors emphasize theneed for standardized specifications to improve semantic and attribute accuracy ofOSM data.
Furthermore, in regard to semantic accuracy of map-based VGI, Vandecasteele andDevillers (2015) introduced a tag recommender system for OSM data, which aims toimprove the semantic quality of tags. OSMantic is a plugin for the Java OpenStreetMapeditor, which automatically suggests relevant tags to contributors during the editingprocess. Mummidi and Krumm (2008) use clustering methods on Microsoft’s Live SearchMaps11 to group user contributed pushpins of POIs that are annotated with text.Frequent text phrases that appear in one cluster but infrequently in other clustershelp to increase the confidence that the particular text phrase describes a POI.
5.2.1.4. Completeness. Koukoletsos et al. (2012) propose to use a feature-based auto-mated matching method for linear data using reference datasets. Barron et al. (2014) andGirres and Touya (2010) use intrinsic data checks to record the statistics of the numberof objects, attributes, and values, thereby keeping track of all omissions and commis-sions to the database.
5.2.1.5. Temporal accuracy. Very few works exist to assess the temporal accuracy. Wereviewed the work of Girres and Touya (2010) where the authors use statistics to observe
154
the correlations of the number of contributors to the mean capture date, and to themean version of the capture object in order to assess how many objects are updated.Their results show a linear increase of the mean date, and the mean version of capturedobject in relation to the number of contributors in the chosen geographic area.Concluding results show higher the number of contributors, more recent the objectswere, and the more up-to-date the objects were.
5.2.1.6. Lineage, usage, purpose. In the work of Keßler et al. (2011), following a data-oriented approach with a focus on the origins of specific data items, their provenancevocabulary explicitly shows the lineage of data features of any online data. They basetheir provenance approach on Hartig (2009) on ‘provenance information in the web ofdata’. Their approach allows them to classify OSM features according to recurring editingand co-editing patterns. To keep track of the data lineage, Girres and Touya (2010) urgethe need for moderators who have control over screening the contributions (as inWikipedia) for necessary source information. They further analyze the usage of data bycomparing the limitations that were observed in previous evaluations of map-based VGI.
As a generic approach to assess ISO standardized quality indicators, Keßler and deGroot (2013) propose trust as a proxy to measure the topological consistency, thematicaccuracy, and completeness in these map data based on data provenance, a method,which relies on trust indicators as opposed to ground truth data.
5.2.2. Quality assessment in image-based VGI5.2.2.1. Positional accuracy and credibility. Jacobs et al. (2007) explored the varyingpositional accuracy of photos by matching photos with ancillary satellite imagery. Theylocalize cameras based on satellite imagery that correlates with the camera images taken ata known time. Their approach helps where it is important to know the accurate location ofthe photographer instead of the target object. Zielstra and Hochmair (2013) on the otherhand compared the geotagged positions of photos to the manually corrected cameraposition based on the image content. Their results indicate better positional accuracy forPanoramio photos compared to Flickr photos. Hollenstein and Purves (2014) assessed thepositional accuracy of such photos by manually inspecting these photos for their corre-spondence between the tagged geographic label and geotagged position. Senaratne et al.(2013) assessed the positional accuracy of Flickr photos by computing a line of sightbetween the camera position and the target position based on in-between surface eleva-tion data. They further manually inspected the geographic label against the geographiclocation. The results are used as a reference of quality for contributor and photo features ofFlickr, and thereby used to derive credibility indicators.
5.2.2.2. Thematic accuracy. Foody et al. (2014) use Geowiki as the data source, whereit contains a series of satellite imagery. Volunteered contributors were given the task tolabel the land use categories in these satellite imagery from a predefined set of labels.The accuracy of the labeling was assessed through conducting a latent class analysis(LCA). LCA allows the analyst to derive an accuracy measurement of the classificationwhen there are no reference datasets available to compare with. The authors furtheremphasize that this method can be applied to image-based VGI. Further, their approach
155
characterizes the volunteers based on the accuracy of their labels of land use classes.This helps to ultimately determine the volunteer quality.
On a related work, Zhang and Kosecka (2006) used feature-based geometric matchingusing the image recognition software scale-invariant feature transform (Lindeberg 2012)to localize sample photos in urban environments. Although their work was not based onVGI, this is a potential approach to solve quality-related issues within image-based VGI.
5.2.3. Quality assessment in text-based VGIQuality of text-based VGI has been mainly assessed through the credibility of such databased on contributor, text, and content features, and through the text content quality.
5.2.3.1. Credibility. Relating to a social approach of quality analysis, Mendoza et al.(2010) found out that rumors on Twitter tend to be more questioned by the Twittercommunity during an emergency situation. They further indicate that the Twitter com-munity acts as a collaborative filter of information.
Castillo et al. (2011) employed users on mechanical turk12 to classify pre-classified‘news-worthy events’ and ’informal discussions’ on Twitter according to several classesof credibility [(i) almost certainly true, (ii) likely to be false, . . .]. This is then used in asupervised classification to evaluate which Tweets belong to these different classes ofcredibility. This helped the authors to derive credibility indicators. The user features suchas average status count or the number of followers among others were found to be thetop ranked user-based credibility features.
The work of Gupta and Kumaraguru (2012) is similar to Castillo et al. (2011), andfollows a supervised feature classification PageRank-like method to propagate thecredibility on a network of Twitter events. They use event graph-based optimization toenhance the trust analysis at each iteration that updates the credibility scores. A credibleentity (node) links with a higher weight to more credible entities than to non-credibleones. Their approach is similar to that of Castillo et al. (2011), but the authors proposed anew technique to re-rank the Tweets based on a Pseudo Relevance Feedback.
Canini et al. (2011) divided credibility into implicit and explicit credibility. Implicitcredibility is the perceived credibility of Twitter contributors, and is assessed by Twitterusers by evaluating an external data source together with the Tweeters content topi-cality and its relevance to the context, and social status (follower/status counts). Explicitcredibility is evaluated by ranking Tweeters (Twitter contributors) on a scale from 1 to 5based on their trustworthiness. End result is a ranking recommendation system onwhom to follow on Twitter regarding a particular topic.
O’Donovan et al. (2012) provided an analysis of the distribution of credibility featuresin four different contexts in the Twitter network: diversity of topics, credibility, chainlength, and dyadic pairs. The results of their analysis indicate that the usefulness ofcredibility features depends on the context in question. Thus, the presence of a cred-ibility feature alone is not good enough to evaluate the credibility of the context, butrather a particular combination of different credibility features that are ‘suitable’ for thecontext in question.
Morris et al. (2012) designed a pilot study with participants (with no technical back-ground) to extract a list of features that are useful to make their credibility judgments.Finally, to run the survey, the authors sent the survey to a sample of Twitter users in
156
which they were asked to assess how each feature impacts their credibility judgment ona five-point scale. Their findings indicate that features, such as verified author expertise,re-tweets from someone you trust, or author is someone you follow have highercredibility impact. These features differ somewhat to the features extracted throughthe supervised classification of Castillo et al. (2011). These features were further rankedaccording to the amount of attention received by Twitter users.
Kang et al. (2012) defined three different credibility prediction models and studiedhow each model performs in terms of credibility classification of Twitter messages. Theseare: (1) social model, (2) content-based model, and (3) hybrid model (based on differentcombinations of the two previous models). The social model relies on a weightedcombination of credibility indicators from the underlying social network (e.g., re-tweets,no. of followers). The content-based model identifies patterns and tweet properties thatlead to positive reactions, such as re-tweeting or positive user ratings, by using aprobabilistic language-based approach. Most of these content-based features aretaken from Castillo et al. (2011). The main results from the paper indicate that the socialmodel outperformed all other models in terms of predication accuracy, and that includ-ing more features in the predication task does not mean a better predication accuracy.
5.2.3.2. Text content quality. Agichtein et al. (2008) describe a generic method for alltext-based social media data. They use three inputs for a feature classifier to determinethe content quality: (1) textual features (e.g., word n-grams up to length five thatappears in the text more than three times, semantic features such as punctuations,typos, readability measures, average number of syllables per word, entropy of wordlengths, grammaticality), (2) user relationships (between users and items, user intuition,such as good answers are given by good answerers, and vote for other good answerers),(3) usage statistics (number of clicks on an item, dwell time on content).
Becker et al. (2011) use a two tier approach for the quality analysis of text-basedTwitter data in an event analysis context. To identify the events, they first cluster tweetsusing an online clustering framework. Subsequently, they use three centrality-basedapproaches to identify messages in the clusters that have high textual quality, strongrelevance, and are useful. These approaches are: (1) centroid similarity approach thatcalculates the cosine similarity of the ‘tf–idf’ statistic of words, (2) degree centralitymethod which represents each cluster message as a node in a graph, and two nodes areconnected with an edge when their cosine similarity exceeds a predetermined thresh-old, (3) LexRank approach distributes the centrality value of nodes to its neighbors, andtop messages in a cluster are chosen according to their LexRank value.
Hasan Dalip et al. (2009) on the other hand use text length, structure, style readability,revision history, and social network as indicators of text content quality in Wikipediaarticles. They further use regression analysis to combine various such weighed qualityvalues into a single quality value, that represents an overall aggregated quality metricfor text content quality.
Bordogna et al. (2014) measure the validity of text data by measuring the number ofwords, proportion of correctly spelled words, language intelligibility, diffusion of words,and the presence of technical terms as indicators of text content quality. They furtherexplored quality indicators such as experience, recognition, and reputation to determinethe quality of VGI.
157
5.2.4. Generic approachesAs a generic method for all VGI, Forghani and Delavar (2014) propose a new qualitymetric for the assessment of topological consistency by employing heuristic metricssuch as minimum bounding geometry area and directional distribution (standarddeviational ellipse). Van Exel et al. (2010) propose to use contributor-related qualityindicators, such as local knowledge (e.g., spatial familiarity), experience (e.g., amountof contributions), and recognition (e.g., tokens achieved). A conceptual workflow forautomatically assessing the quality of VGI in crisis management scenarios was pro-posed by Ostermann and Spinsanti (2011). VGI is cross-referenced with other VGItypes and institutional ancillary data that are spatially and temporally close. However,in a realistic implementation this combination of different VGI data types for crossreferencing is a challenging task due to their heterogeneity. Bishr and Janowicz(2010) propose to use trust together with reputation as a proxy measure for VGIquality, and established the spatial and temporal dimensions of trust. They assert thatshorter geographic proximity of VGI observations provide more accurate informationas opposed to higher geographic proximity VGI observations (implying that localsknow better, the proximate spectator sees more). On a temporal perspective of trust,they further claim that trust in some VGI develop and decay over time, and that theobservation time of an event has an effect on the trust we endow in one’s observa-tion. Furthermore, to assess the trust of VGI, Huang et al. (2010) developed a methodto detect outliers in the contributed data. De Longueville et al. (2010) proposed twomethods to assess the vagueness in VGI. (1) contributor encodes the vagueness oftheir contributed spatial data in a 0–5 scale (e.g., 5 = it is exactly there, 0 = I do notknow where it is. (2) The second type is system created vagueness that is assessedthrough automatically capturing the scale at which VGI is produced. VGI produced inlower scales is classified as more vague.
Table 2 shows a summary matrix of all quality measures and indicators observed inthe literature review, with various methods that can be applied to assess these qualitymeasures/indicators. Following this matrix, we can learn which methods can be appliedto solve various quality issues within map, text and image-based VGI. However, thisshould be followed with caution, as we present here only what we discovered throughthe literature review, and the presented methods could be applied beyond our discov-ery, and therefore need to be further explored.
6. Discussion and future research perspectives in VGI quality
VGI is available with tremendous amounts through various platforms, and it is crucial tohave methods to ensure the quality of these VGI. The vast amount of data and theheterogeneous characteristics of utilization make the traditional comparison with refer-ence datasets no longer viable in every application scenario (also due to the lack ofaccess to reference data). Based on such characteristics, Goodchild and Li (2012) proposethree approaches to ensure the quality of VGI: (1) crowd-sourced, (2) social, and (3)geographic. As seen in Table 2, 20 of the methods we have discovered in the literaturefall in to geographic, social, or crowd-sourced approaches. Furthermore, 10 of themethods we discovered fall into an additional approach: (4) data mining, that helps toassess VGI quality by discovering patterns and learning purely from the data. Data
158
mining can be used as a stand-alone approach, completely independent of the laws andknowledge of geography, and independent from social or crowd-sourced approaches toassess the quality of VGI. For example, the PTV method is used to assess the positionaluncertainty of POIs based only on the possibility distribution. Similarly, outlier detection,cluster analysis, regression analysis, or correlation statistics methods can be used toassess the data quality by purely discovering and learning data patterns, irrespective ofthe laws and knowledge from geography. The supervised learning, and feature classifi-cation methods that are used to assess the quality of text-based VGI use text, message,and user features to train the classifier. These two machine learning methods we foundin the literature once again work irrespective of the laws and knowledge from geogra-phy. Therefore, we believe these methods deserve to be represented under an addi-tional approach to assess VGI quality.
We have classified the found methods according to these four approaches based onthe description of the methods in the literature. By this discovery, we aim to extendGoodchild and Li’s (2012) classification in this survey.
While most methods have been utilized to assess the positional accuracy, thematicaccuracy, and topological consistency, fewer methods tackle the rest of the qualitymeasures and indicators we review, such as the completeness, temporal accuracy, orvagueness. Future work should focus also on other potential approaches to handlequality measures and indicators. Different VGI platforms should clearly communicateto the contributors and the consumers, as to what kind of data that one couldcontribute. The more precise this is, the more comprehensive it is to the contributoron what is expected in terms of data. As also stated by Antoniou et al. (2010), explicit VGIgives a loosely coupled specification(s) of what volunteers can contribute. If thesespecifications are more rigid the future of VGI can expect higher quality information,although it may be a compromise with lesser contributions. This may further varydepending on the task at hand.
Lower population density positively correlates with fewer number of contributions,thus affecting data completeness or positional accuracy (Girres and Touya 2010, Haklay2010, Neis et al. 2013, Mullen et al. 2014). However, more research needs to be doneregarding this issue. Hence, a step further in this direction is to derive the socio-economic impacts on OSM data quality. As presented in Section 5.2., there have beena number of studies and empirical research performed on the subject of OSM quality.Nevertheless, a solid framework for assessing OSM data is far from being established,let alone a framework of quality measurement for specific application domains. Thelimitation is that existing measures and indicators (described by ISO) are not inclusiveenough to evaluate OSM data. This is mainly because the nature of OSM (and VGI ingeneral) is fundamentally different to what geospatial experts have dealt with so far.Therefore, we argue that there are still research gaps when defining quality measures/indicators and proposing methods to calculate these measures/indicators. In addition,only few studies have been conducted to explore and analyze the differences in qualityrequirements for different application domains. Therefore, as a recommendation forfuture research in this topic, we suggest to develop a systematic framework thatprovides methods and measures to evaluate the fitness for purpose of each VGI type.This would need to not only focus on the analysis of data itself, but also explore thesocial factors which are the driving forces behind public contributions, and thus
159
considerably affect the quality. For example, one could define a mathematical modelbased on OSM intrinsic data indicators (e.g., number of contributors, number of edits,etc.) to estimate the quality (e.g., completeness) of data without having reference data athand. This would enrich and complete the new paradigm of intrinsic quality evaluation,which by far has received less attention from the research community, compared to thecommon extrinsic quality evaluation, i.e., comparison with reference data.
The utilization of text and image-based VGI still mostly depends on the geotaggedcontent. However, the sparse geotagged content of these two VGI types in most casesrepresent only a minority of the data. Therefore, generalization based on VGI is stilllimited and need further demographic studies.
Gamification has become a popular way to involve people to contribute spatial data(Geograph, Foursquare,13 Ingress 14 are some examples). Such gamification approaches haveincreased participation as well as spatial coverage (Antoniou et al. 2010, Antoniou andSchlieder 2014). Due to the clear incentives of this data collection approach (going highup in rankings, collecting badges, etc.) this popular method can be used to control theprocess of collecting more accurate data by incorporating data quality concepts (Yanenkoand Schlieder 2014). One way to do that would be to give a ranking to the contributor basedon the quality of their collected data. Revealing such rankings of their peers would furtherencourage the contributors to pay more attention to the quality of their data (peer pressure).
As encouragement mechanisms are required to motivate people to contribute, weshould also research methods to make contributors aware of the importance of quality,and secondly to involve the contributors and consumers to maintain the quality of theVGI contents. This can be achieved, for example, by collaboratively doing quality checkson the data. Such collaborative efforts are presently actively done in OSM, but ratherinadvertently done on Flickr or Twitter. As evident from the review, image and text-based VGI have been given far less attention to its quality as compared to map-basedVGI. We see this as mainly due to the complexity of the image and text data types.Comments and discussions associated with image and text contents might be one wayto ensure the contribution while systematic analysis of these resources is not a trivialprocess. Our understanding is that quality assurance methods for text and image-basedVGI are still on the phase of experimentation, and therefore need more attention inorder to standardize these methods in to practice. This is crucial because more and moretext and image-based VGI are being utilized in various applications. Furthermore, theworks of Sacha et al. (2016), where they introduce a framework that integrates trust andother various quality indicators in a knowledge generation process within the visualanalytics paradigm can be adapted in future research to assess and visually analyzequality of VGI. Their framework allows the user to comprehend the associated quality ateach step of knowledge generation, and also express their confidence in the findingsand insights gained by externalizing their thoughts. This facilitates the user to compre-hend the provided quality of data as well as the perceived quality.
As further evident from this review, there is no holy grail that could solve all types ofquality issues in VGI. We should be aware of the heterogeneity of these data, and beinformed of the existing state-of-the-art to resolve many of the quality issues of VGI, andtheir limitations. Addressing these limitations and thereby improving the existing meth-ods already paves for new contributions on this topic that should be recognized as validscientific contributions in the VGI community.
160

7. Conclusions
In this review of VGI quality, we have taken a critical look at the quality issues within map,image, and text VGI types. The heterogeneity of these VGI types gives rise to varying qualityissues that need to be dealt with varying quality measures and indicators, and varyingmethods. As a result of this review, we have summarized the literature in to a list of 30methods that can be used to assess one or more of the 17 quality measures and indicatorsthat we have come across in the literature for map, image, and text-based VGI, respectively.This review further shows the following: (1) a majority of reviewed papers focus onassessing map-based VGI. (2) Though implicit VGI (e.g., text-based Twitter or image-based Flickr) has higher quality concerns in comparison to explicit VGI (e.g., map-basedOSM), such explicit VGI has received significantly higher attention to resolve quality issues,compared to implicit VGI. The review shows the increasing utilization of implicit VGI forgeospatial research. Therefore, more efforts should be in place to resolve quality issueswithin these implicit VGI. (3) Mostly ISO standardized quality measures have been used toassess the quality of map-based VGI (OSM). Text-based VGI have been assessed on thecredibility, vagueness, and the content quality. Image-based VGI have been assessed onthe positional/thematic accuracy, credibility, vagueness, experience, recognition, and repu-tation. A logical explanation for this is that ISO standardized measures are most oftenassessed through comparative analysis with ground truth data. For the explicit VGI (e.g.,OSM), we can easily realize, which ground truth data to look for. However, for implicit VGI, itis not straightforward to realize which ground truth data to look for, therefore comparativeanalysis is not always possible (e.g., topological consistency, or thematic accuracy cannotbe directly assessed, as we need to derive the topology or the thematic attributes from theVGI in an additional data processing step). These implicit VGI are further enriched withcontributor sentiments and contextual information. Therefore, ISO standardized measuresalone are not enough to assess the quality of implicit VGI. This explains the use ofindicators, such as reputation, trust, credibility, vagueness, experience, recognition, orlocal knowledge as quality indicators. A lack of standardization of these more abstractquality indicators is a reason why fewer works exist for image and text-based VGI. Inaddition, the implicit nature of the geography that is contributed in most of these VGI isyet another reason for the insufficiency of quality assessment methods for text and image-based VGI. (4) We have classified the quality assessment methods according to the crowd-sourced, geographic, and social approaches as introduced by Goodchild and Li (2012). Wehave further discovered data mining as an additional approach in the literature thatextends Goodchild and Li’s (2012) classification.
Notes
1. http://www.openstreetmap.org2. http://www.wikimapia.org3. https://www.google.com/maps/mm4. http://www.mapsharetool.com/external-iframe/external.jsp5. http://www.flickr.com6. http://www.iso.org/iso/home/standards.htm7. http://www.isotc211.org/8. http://ebay.about.com/od/gettingstarted/a/gs feed.htm
161

9. http://geotagx.org/10. https://scholar.google.com/scholar/about.html11. http://maps.live.com12. https://www.mturk.com13. https://foursquare.com/14. https://www.ingress.com/
Acknowledgments
This has been partly funded by the SPP programme: [Grant agreement number 1335 (ViAMoD)]; theEuropean Unions’s Seventh Framework Programme: [Grant agreement number 612096 (CAP4Access)];and the German Academic Exchange Service (DAAD). We thank particularly Tobias Schreck, AlexanderZipf, Mohamed Bakillah, and Hongchao Fan for their valuable discussions on the topic.
Disclosure statement
No potential conflict of interest was reported by the authors.
Funding
This work was supported in part by the SPP programme [grant agreement number 1335(ViAMoD)]; the European Unions’s Seventh Framework Programme [grant agreement number612096 (CAP4Access)]; and the German Academic Exchange Service (DAAD).
References
Agichtein, E., et al., 2008. Finding high-quality content in social media. In: Proceedings of the 2008international conference on web search and data mining, 11–12 February Palo Alto, CA. NewYork: ACM, 183–194.
Al-Bakri, M. and Fairbairn, D., 2010. Assessing the accuracy of crowdsourced data and its integra-tion with official spatial datasets. In: N.J. Tate and P.F. Fisher, eds. Proceedings of the ninthinternational symposium on spatial accuracy assessment in natural resources and environmentalsciences, 20–23 July, Leicester. 317–320.
Ali, A.L., et al., 2014. Ambiguity and plausibility: managing classification quality in volunteeredgeographic information. In: Proceedings of the 22nd international conference on geographicinformation systems.
Andrienko, G., et al., 2009. Analysis of community-contributed space-and time-referenced data(example of Flickr and panoramio photos). In: IEEE symposium on visual analytics science andtechnology, 2009. VAST 2009, 12–13 October Atlantic City, NJ. Piscataway, NJ: IEEE, 213–214.
Andrienko, G., et al., 2013. Thematic patterns in georeferenced tweets through space-time visualanalytics. Computing in Science and Engineering, 15 (3), 72–82. doi:10.1109/MCSE.2013.70
Antoniou, V., Morley, J., and Haklay, M., 2010. Web 2.0 geotagged photos: assessing the spatialdimension of the phenomenon. Geomatica, 64 (1), 99–110.
Antoniou, V. and Schlieder, C., 2014. Participation patterns, VGI and gamification. In: J. Huerta, S.Schade, C. Granell, eds. AGILE 2014. Cham: Springer International Publishing, 3–6.
Antoniou, V. and Skopeliti, A., 2015. Measures and indicators of VGI quality: an overview. ISPRSAnnals of Photogrammetry, Remote Sensing and Spatial Information Sciences, 1, 345–351.doi:10.5194/isprsannals-II-3-W5-345-2015
Arsanjani, J.J., et al., 2015. Quality assessment of the contributed land use information fromOpenStreetMap versus authoritative datasets. In: J. Arsanjani, et al., eds. OpenStreetMap inGIScience. Cham: Springer, 37–58.
162
Ather, A., 2009. A quality analysis of openstreetmap data. ME Thesis, University College London,London, UK.
Barron, C., Neis, P., and Zipf, A., 2014. A comprehensive framework for intrinsic OpenStreetMapquality analysis. Transactions in GIS, 18 (6), 877–895.
Becker, H., Naaman, M., and Gravano, L., 2011. Selecting quality twitter content for events. In:ICWSM, 17–21 July Barcelona. Menlo Park, CA: AAAI, 11.
Bishr, M. and Janowicz, K., 2010. Can we trust information? – The case of volunteered geographicinformation. In: A. Devaraju, et al., eds. Towards digital earth search discover and share geospatialdata workshop at future internet symposium [online], 20 September Berlin. Vol. 640. Availablefrom: CEUR-WS.org.
Bordogna, G., et al., 2014. A linguistic decision making approach to assess the quality of volunteergeographic information for citizen science. Information Sciences, 258, 312–327. doi:10.1016/j.ins.2013.07.013
Bosch, H., et al., 2013. Scatterblogs2: real-time monitoring of microblog messages through user-guided filtering. IEEE Transactions on Visualization and Computer Graphics, 19 (12), 2022–2031.doi:10.1109/TVCG.2013.186
Brando, C. and Bucher, B., 2010. Quality in user generated spatial content: a matter of specifica-tions. In: Proceedings of the 13th AGILE international conference on geographic informationscience, 11–14 May Guimarães. Cham: Springer International Publishing, 1–8.
Bulearca, M. and Bulearca, S., 2010. Twitter: a viable marketing tool for SMEs. Global Business andManagement Research: an International Journal, 2 (4), 296–309.
Canavosio-Zuzelski, R., Agouris, P., and Doucette, P., 2013. A photogrammetric approach forassessing positional accuracy of OpenStreetMap© roads. ISPRS International Journal of Geo-Information, 2 (2), 276–301. doi:10.3390/ijgi2020276
Canini, K.R., Suh, B., and Pirolli, P.L., 2011. Finding credible information sources in social networksbased on content and social structure. In: IEEE Third International Conference on Privacy, Security,Risk and Trust (PASSAT) and 2011 IEEE third inernational conference on social computing(SocialCom), 2011, 9–11 October Boston, MA. Piscataway, NJ: IEEE, 1–8.
Castillo, C., Mendoza, M., and Poblete, B., 2011. Information credibility on twitter. In: Proceedings ofthe 20th international conference on World Wide Web, 28 March–1 April Hyderabad, AndhraPradesh. New York: ACM, 675–684.
Chunara, R., Andrews, J.R., and Brownstein, J.S., 2012. Social and news media enable estimation ofepidemiological patterns early in the 2010 Haitian cholera outbreak. The American Journal ofTropical Medicine and Hygiene, 86 (1), 39–45. doi:10.4269/ajtmh.2012.11-0597
Ciepluch, B., et al., 2010. Comparison of the accuracy of OpenStreetMap for Ireland with GoogleMaps and Bing Maps. In: N.J. Tate and P.F. Fisher, eds. Proceedings of the ninth internationalsymposium on spatial accuracy assessment in natural resuorces and enviromental sciences 20–23July Leicester, 337.
Ciepluch, B., et al., 2011. Assessing the quality of open spatial data for mobile location-basedservices research and applications. In: Polish Society for Photogrammetry and Remote Sensing,editor. Archives of photogrammetry, cartography and remote sensing, Vol. 22. 105-116, ISSN 2083-2214.
Codescu, M., et al., 2011. Osmonto-an ontology of openstreetmap tags. In: Conference proceedingsof the the state of the map Europe (SOTM-EU), 15–17 July Vienna.
Corcoran, P., Mooney, P., and Winstanley, A., 2010. Topological consistent generalization ofOpenStreetMap [online]. Available from: http://bit.ly/1U2OeyV
Craglia, M., Ostermann, F., and Spinsanti, L., 2012. Digital Earth from vision to practice: makingsense of citizen-generated content. International Journal of Digital Earth, 5 (5), 398–416.doi:10.1080/17538947.2012.712273
Da Silva, A.C. and Wu, S.T., 2007. Consistent handling of linear features in polyline simplification. In:C.A. Davis Jr. and A.M.V. Monteiro, eds. Advances in geoinformatics. Cham: Springer, 1–17.
De Longueville, B., Ostländer, N., and Keskitalo, C., 2010. Addressing vagueness in VolunteeredGeographic Information (VGI)–A case study. International Journal of Spatial Data InfrastructuresResearch, 5, 1725–0463.
163
De Tré, G., et al., 2010. Consistently handling geographical user data. In: E. Hüllermeier, R. Kruse,and F. Hoffmann, eds. Information processing and management of uncertainty in knowledge-based systems, applications, 28 June–2 July Dortmund. Berlin: Springer, 85–94.
Fan, H., et al., 2014. Quality assessment for building footprints data on OpenStreetMap.International Journal of Geographical Information Science, 28 (4), 700–719. doi:10.1080/13658816.2013.867495
Flanagin, A.J. and Metzger, M.J., 2008. The credibility of volunteered geographic information.GeoJournal, 72 (3–4), 137–148. doi:10.1007/s10708-008-9188-y
Foody, G., et al., 2014. Accurate attribute mapping from volunteered geographic information:issues of volunteer quantity and quality. The Cartographic Journal, 52 (4). doi:10.1179/1743277413Y.0000000070.
Forghani, M. and Delavar, M.R., 2014. A quality study of the OpenStreetMap dataset for Tehran.ISPRS International Journal of Geo-Information, 3 (2), 750–763. doi:10.3390/ijgi3020750
Frew, J., 2007. Provenance and volunteered geographic information [online]. Available from: http://www.ncgia.ucsb.edu/projects/vgi/docs/position/Frew paper.pdf [Accessed 10 March 2008].
Fuchs, G., et al., 2013. Tracing the German centennial flood in the stream of tweets: first lessonslearned. In: D. Pfoser and A. Voisard, eds. Proceedings of the second ACM SIGSPATIAL internationalworkshop on crowdsourced and volunteered geographic information, 5–8 November Orlando, FL.New York: ACM, 31–38.
Girres, J.-F. and Touya, G., 2010. Quality assessment of the French OpenStreetMap dataset.Transactions in GIS, 14 (4), 435–459. doi:10.1111/tgis.2010.14.issue-4
Golder, S.A. and Huberman, B.A., 2006. Usage patterns of collaborative tagging systems. Journal ofInformation Science, 32 (2), 198–208. doi:10.1177/0165551506062337
Goodchild, M.F., 2007. Citizens as sensors: the world of volunteered geography. GeoJournal, 69 (4),211–221. doi:10.1007/s10708-007-9111-y
Goodchild, M.F. and Li, L., 2012. Assuring the quality of volunteered geographic information.Spatial Statistics, 1, 110–120. doi:10.1016/j.spasta.2012.03.002
Guinée, J.B., 2002. Handbook on life cycle assessment operational guide to the ISO standards. TheInternational Journal of Life Cycle Assessment, 7 (5), 311–313. doi:10.1007/BF02978897
Gupta, A. and Kumaraguru, P., 2012. Credibility ranking of tweets during high impact events. In:Proceedings of the 1st workshop on privacy and security in online social media, 17 April Lyon. NewYork: ACM, 2.
Haklay, M., 2010. How good is volunteered geographic information? A comparative study ofOpenStreetMap and Ordnance survey datasets. Environment and Planning. B, Planning &Design, 37 (4), 682. doi:10.1068/b35097
Haklay, M., et al., 2010. How many volunteers does it take to map an area well? The validity ofLinus’ law to volunteered geographic information. The Cartographic Journal, 47 (4), 315–322.
Hartig, O., 2009. Provenance information in the web of data. In: C. Bizer, et al., eds. LDOW [online],20 April Madrid, 538. Available from: CEUR-WS.org
Hasan Dalip, D., et al., 2009. Automatic quality assessment of content created collaboratively byweb communities: a case study of wikipedia. In: Proceedings of the 9th ACM/IEEE-CS jointconference on digital libraries, 14–19 June Austin, TX. New York: ACM, 295–304.
Hashemi, P. and Abbaspour, R.A., 2015. Assessment of logical consistency in OpenStreetMap basedon the spatial similarity concept. In: J. Arsanjani, et al., eds. OpenStreetMap in GIScience. Cham:Springer International Publishing, 19–36.
Hecht, R., Kunze, C., and Hahmann, S., 2013. Measuring completeness of building footprints inOpenStreetMap over space and time. ISPRS International Journal of Geo-Information, 2 (4), 1066–1091. doi:10.3390/ijgi2041066
Helbich, M., et al., 2012. Comparative spatial analysis of positional accuracy of OpenStreetMap andproprietary geodata. In: T. Jekel, et al., eds. Proceedings of GI Forum 2012, 3–6 July Berlin. Berlin:Wichmann & ÖAW-Verlag, 24–33.
Hollenstein, L. and Purves, R., 2014. Exploring place through user-generated content: using Flickrtags to describe city cores. Journal of Spatial Information Science, 1, 21–48.
164

Hovland, C.I., Janis, I.L., and Kelley, H.H., 1953. Communication and persuasion; psychological studiesof opinion change. New Haven: Yale University Press.
Hoyle, D., 2001. ISO 9000: quality systems handbook. Oxford: Butterworth and Heinemann.Huang, K.L., Kanhere, S.S., and Hu, W., 2010. Are you contributing trustworthy data?: the case for a
reputation system in participatory sensing. In: Proceedings of the 13th ACM international con-ference on modeling, analysis, and simulation of wireless and mobile systems, 17–21 OctoberBodrum. New York: ACM, 14–22.
Huberman, B.A., Romero, D.M., and Wu, F., 2008. Social networks that matter: twitter under themicroscope. arXiv preprint arXiv:0812.1045. Chicago, IL: University of Illinois.
Jackson, S.P., et al., 2013. Assessing completeness and spatial error of features in volunteeredgeographic information. ISPRS International Journal of Geo-Information, 2 (2), 507–530.doi:10.3390/ijgi2020507
Jacob, R., et al., 2009. Campus guidance system for international conferences based on open-streetmap. In: J.M. Ware and G.E. Taylor, eds. Web and wireless geographical information systems.Berlin: Springer, 187–198.
Jacobs, N., et al., 2007. Geolocating static cameras. In: IEEE 11th international conference onComputer vision, 2007. ICCV 2007, 14–20 October Rio de Janeiro. Piscataway, NJ: IEEE, 1–6.
Kang, B., O’Donovan, J., and Höllerer, T., 2012. Modeling topic specific credibility on twitter. In:Proceedings of the 2012 ACM international conference on intelligent user interfaces, 14–17February Lisbon. New York: ACM, 179–188.
Keßler, C., et al., 2009. Bottom-up gazetteers: learning from the implicit semantics of geotags. In:K. Janowicz, M. Raubal, and S. Levashkin, eds. GeoSpatial semantics. Berlin: Springer, 83–102.
Keßler, C. and de Groot, R.T.A., 2013. Trust as a proxy measure for the quality of volunteeredgeographic information in the case of OpenStreetMap. In: D. Vandenbroucke, B. Bucher, and J.Crompvoets, eds. Geographic information science at the heart of Europe. Cham: Springer, 21–37.
Keßler, C., Trame, J., and Kauppinen, T., 2011. Tracking editing processes in volunteered geographicinformation: the case of OpenStreetMap. In: M. Duckham, A. Galton, and M. Worboys, eds.Identifying objects, processes and events in spatio-temporally distributed data (IOPE), workshop atconference on spatial information theory 12–16 September Belfast, ME. Vol. 12.
Koukoletsos, T., Haklay, M., and Ellul, C., 2012. Assessing data completeness of VGI through anautomated matching procedure for linear data. Transactions in GIS, 16 (4), 477–498. doi:10.1111/j.1467-9671.2012.01304.x
Kounadi, O., 2009. Assessing the quality of OpenStreetMap data. Thesis (MSc). University College ofLondon.
Lindeberg, T., 2012. Scale invariant feature transform. Scholarpedia, 7 (5), 10491. doi:10.4249/scholarpedia.10491
Liu, S.B., et al., 2008. F. Fiedrich and B. Van de Walle, eds. In search of the bigger picture: theemergent role of on-line photo sharing in times of disaster. In: Proceedings of the InformationSystems for Crisis Response and Management conference (ISCRAM), 4–7 May Washington, DC.
MacEachren, A.M., et al., 2011. Senseplace2: geotwitter analytics support for situational awareness.In: IEEE conference on Visual Analytics Science and Technology (VAST), 2011, 23–28 OctoberProvidence, RI. Piscataway, NJ: IEEE, 181–190.
Maué, P., 2007. Reputation as tool to ensure validity of VGI. In: VGI specialist meeting, 13–14December Santa Barbara, CA.
McDougall, K., 2009. The potential of citizen volunteered spatial information for building SDI. In:GSDI 11 world conference: spatial data infrastructure convergence: building SDI bridges to addressglobal challenges. 15–19 June Rotterdam. GSDI Association Press.
Mendoza, M., Poblete, B., and Castillo, C., 2010. Twitter under crisis: can we trust what we RT? In:Proceedings of the first workshop on social media analytics, 25–28 July Washington, DC. NewYork: ACM, 71–79.
Milholland, N. and Pultar, E., 2013. The San Francisco public art map application: using VGI andsocial media to complement institutional data sources. In: Proceedings of the 1st ACM SIGSPATIALinternational workshop on MapInteraction, 5–8 November Orlando, FL. New York: ACM, 48–53.
165
Montello, D.R., et al., 2003. Where’s downtown? Behavioral methods for determining referents ofvague spatial queries. Spatial Cognition & Computation, 3 (2–3), 185–204. doi:10.1080/13875868.2003.9683761
Mooney, P. and Corcoran, P., 2012. The annotation process in OpenStreetMap. Transactions in GIS,16 (4), 561–579. doi:10.1111/j.1467-9671.2012.01306.x
Morris, M.R., et al., 2012. Tweeting is believing? Understanding microblog credibility perceptions.In: Proceedings of the ACM 2012 conference on computer supported cooperative work, 11–15February Seattle, WA. New York: ACM, 441–450.
Mullen, W.F., et al., 2014. Assessing the impact of demographic characteristics on spatial error involunteered geographic information features. GeoJournal, 80 (4), 587–605.
Mummidi, L.N. and Krumm, J., 2008. Discovering points of interest from users’ map annotations.GeoJournal, 72 (3–4), 215–227. doi:10.1007/s10708-008-9181-5
Neis, P., Zielstra, D., and Zipf, A., 2011. The street network evolution of crowdsourced maps:OpenStreetMap in Germany 2007–2011. Future Internet, 4 (4), 1–21. doi:10.3390/fi4010001
Neis, P., Zielstra, D., and Zipf, A., 2013. Comparison of volunteered geographic information datacontributions and community development for selected world regions. Future Internet, 5 (2),282–300. doi:10.3390/fi5020282
O’Connor, R., 2009. GLOBAL: Facebook and Twitter ’reshaping journalism as we know it’ [online].Available from: http://bit.ly/1InIn6V [Accessed 22 December 2015].
O’Donovan, J., et al., 2012. Credibility in context: an analysis of feature distributions in twitter. In:Privacy, Security, Risk and Trust (PASSAT), 2012 international conference on and 2012 internationalconfernece on social computing (SocialCom), 3–5 September Amsterdam. Piscataway, NJ: IEEE,293–301.
Ostermann, F.O. and Spinsanti, L., 2011. A conceptual workflow for automatically assessing thequality of volunteered geographic information for crisis management. In: S. Geertman, W.Reinhardt, and F. Toppen, eds. Proceedings of AGILE, 18–21 April Utrecht. Berlin: Springer.
Popescu, A., Grefenstette, G., and Moëllic, P.A., 2008. Gazetiki: automatic creation of a geographicalgazetteer. In: Proceedings of the 8th ACM/IEEE-CS joint conference on digital libraries, 16–20 JunePittsburgh, PA. New York: ACM, 85–93.
Poser, K. and Dransch, D., 2010. Volunteered geographic information for disaster managementwith application to rapid flood damage estimation. Geomatica, 64 (1), 89–98.
Resnick, P., et al., 2000. Reputation systems. Communications of the ACM, 43 (12), 45–48.doi:10.1145/355112.355122
Robinson, S., et al., 2012. Navigation your way: from spontaneous independent exploration todynamic social journeys. Personal and Ubiquitous Computing, 16 (8), 973–985. doi:10.1007/s00779-011-0457-2
Sacha, D., et al., 2016. The role of uncertainty, awareness, and trust in visual analytics. IEEETransactions on Visualization and Computer Graphics, 22 (1), 240–249. doi:10.1109/TVCG.2015.2467591
Sakaki, T., Okazaki, M., and Matsuo, Y., 2010. Earthquake shakes Twitter users: real-time eventdetection by social sensors. In: Proceedings of the 19th international conference on World WideWeb, 26–30 April Raleigh, NC. New York: ACM, 851–860.
Schmitz, S., Neis, P., and Zipf, A., 2008. New applications based on collaborative geodata—the caseof routing. In: Proceedings of XXVIII INCA international congress on collaborative mapping andspace technology, 4–6 November Gandhinagar.
Senaratne, H., et al., 2014. Moving on Twitter: using episodic hotspot and drift analysis to detectand characterise spatial trajectories. In: 7th ACM SIGSPATIAL International Workshop on Location-Based Social Networks (LBSN 2014), 4–7 November Dallas, TX. New York: ACM.
Senaratne, H., Bröring, A., and Schreck, T., 2013. Using reverse viewshed analysis to assess thelocation correctness of visually generated VGI. Transactions in GIS, 17 (3), 369–386. doi:10.1111/tgis.12039
Siebritz, L.A., 2014. Assessing the accuracy of openstreetmap data in South Africa for the purpose ofintegrating it with authoritative data. Master’s thesis. University of Cape Town.
166

Tenney, M., 2014. Quality evaluations on Canadian OpenStreetMap data. In: Spatial knowledge andinformation. Montreal, QC: McGill University.
Thomson, J., et al., 2005. A typology for visualizing uncertainty. In: Electronic imaging 2005, 16–20January San Jose, CA. International Society for Optics and Photonics, 146–157.
Valli, C. and Hannay, P., 2010. Geotagging where cyberspace comes to your place. In: Proceedingsof the international conference on security and management (SAM 10), 12–15 July Las Vegas, NV.Athens, GA. CSREA press, 627–632.
Van Exel, M., Dias, E., and Fruijtier, S., 2010. The impact of crowdsourcing on spatial data qualityindicators. In: S.I. Fabrikant, et al., eds. Proceedings of GiScience, 14–17 September Zurich. Berlin:Springer.
Van Oort, P. and Bregt, A., 2005. Do users ignore spatial data quality? A decision-theoreticperspective. Risk Analysis, 25 (6), 1599–1610. doi:10.1111/risk.2005.25.issue-6
Vandecasteele, A. and Devillers, R., 2013. Improving volunteered geographic data quality usingsemantic similarity measurements. ISPRS-International Archives of the Photogrammetry, RemoteSensing and Spatial Information Sciences, 1 (1), 143–148. doi:10.5194/isprsarchives-XL-2-W1-143-2013
Vandecasteele, A. and Devillers, R., 2015. Improving volunteered geographic information qualityusing a tag recommender system: the case of OpenStreetMap. In: J.J. Arsanjani, et al., eds.OpenStreetMap in GIScience. Cham: Springer, 59–80.
Wang, D., et al., 2014. Using semantic technology for consistency checking of road signs. In: Z.Huang, et al., eds. Web Information Systems Engineering–WISE 2013 workshops, 13–15 OctoberNanjing. Berlin: Springer, 11–22.
Will, J., 2014. Development of an automated matching algorithm to assess the quality of theOpenStreetMap road network: a case study in Göteborg, Sweden. Student thesis series INES.Lund: Lund University Publications.
Yanenko, O. and Schlieder, C., 2014. Game principles for enhancing the quality of user-generateddata collections. In: Proc. AGILE, workshop geogames geoplay, 3–16 June Castellon, 1–5.
Zandbergen, P.A., Ignizio, D.A., and Lenzer, K.E., 2011. Positional accuracy of TIGER 2000 and 2009road networks. Transactions in GIS, 15 (4), 495–519. doi:10.1111/tgis.2011.15.issue-4
Zhang, W. and Kosecka, J., 2006. Image based localization in urban environments. In: Thirdinternational symposium on 3D data processing, visualization, and transmission, 14–16 JuneChapel Hill, NC. Piscataway, NJ: IEEE, 33–40.
Zielstra, D. and Hochmair, H.H., 2013. Positional accuracy analysis of Flickr and Panoramio imagesfor selected world regions. Journal of Spatial Science, 58 (2), 251–273. doi:10.1080/14498596.2013.801331
167