a review of the multiwell experiment, williams fork …€¦ · chapter 15 a review of the...
TRANSCRIPT

Chapter 15
A Review of the Multiwell Experiment, Williams Fork and Iles Formations, Garfield County, Colorado
By Philip H. Nelson
Chapter 15 ofPetroleum Systems and Geologic Assessment of Oil and Gas in theUinta-Piceance Province, Utah and ColoradoBy USGS Uinta-Piceance Assessment Team
U.S. Geological Survey Digital Data Series DDS–69–B
U.S. Department of the Interior U.S. Geological Survey
Click here to return to Volume Title Page
U.S. Department of the Interior Gale A. Norton, Secretary
U.S. Geological Survey Charles G. Groat, Director
Version 1.0 2003
For sale by U.S. Geological Survey, Information ServicesBox 25286, Denver Federal CenterDenver, CO 80225
Any use of trade, product, or firm names in this publication is for descriptive purposes only and does not imply endorsement by the U.S. Government
Published in the Central Region, Denver, Colorado Manuscript approved for publication July 24, 2002
ISBN=0-607-99359-6

Contents
Abstract .......................................................................................................................................................... 1
Introduction ................................................................................................................................................... 1
Acknowledgments ........................................................................................................................................ 5
Geologic Setting............................................................................................................................................ 5
Sandstone Identification .................................................................................................................... 5
Coal Identification................................................................................................................................ 5
Geochemical Data, Thermal History, and Source Beds......................................................................... 6
Reservoir Properties .................................................................................................................................... 6
Authigenic Quartz ................................................................................................................................ 6
Authigenic Carbonate ......................................................................................................................... 6
Authigenic Clay Minerals ................................................................................................................... 6
Porosity.................................................................................................................................................. 9
Permeability of Dried Samples .......................................................................................................... 9
Slot-Like Pores as Controls on Permeability ................................................................................... 9
Water Saturation.................................................................................................................................. 9
Permeability to Gas in Partially Saturated Samples .................................................................... 17
Well Test Results......................................................................................................................................... 17
Results of Individual Tests................................................................................................................ 17
Summary ............................................................................................................................................. 20
Natural Fractures........................................................................................................................................ 20
Corcoran Sandstone Member ......................................................................................................... 20
Cozzette Sandstone Member........................................................................................................... 20
Paludal Interval .................................................................................................................................. 20
Coastal Interval .................................................................................................................................. 20
Fluvial Interval .................................................................................................................................... 20
Fracture Orientation and Density .................................................................................................... 20
Fractures, Depositional Environment, and Gas Production........................................................ 21
Stress Orientation ....................................................................................................................................... 21
Pore Pressure.............................................................................................................................................. 21
Conclusions ................................................................................................................................................. 23
References Cited ........................................................................................................................................ 23
Plates
1. Well logs and core data for fluvial interval of Williams Fork Formation for wells MWX-1, MWX-2, and MWX-3, Garfield County, Colorado............................................................................... 4
2. Well logs and core data for Iles Formation for well MWX-1, Garfield County, Colorado .................................................................................................................................................. 10
III

3. Well logs and core data for paludal interval of Williams Fork Formation for well MWX-1, Garfield County, Colorado ..................................................................................................................... 11
4. Well logs and core data for coastal interval of Williams Fork Formation for well MWX-1,Garfield County, Colorado..................................................................................................................... 12
5. Well logs and core data for fluvial interval of Williams Fork Formation for well MWX-1,Garfield County, Colorado..................................................................................................................... 13
Figures
1. Location map for Multiwell Experiment site........................................................................................ 2
2. Diagram showing well configuration at Multiwell Experiment site ................................................ 3
3. Ternary diagrams showing mineralogical compositions of framework grains in sandstones ............................................................................................................................................... 7
4. Graphs showing permeability and porosity measurements in sandstones................................. 14
5. Photomicrograph of a solution pore................................................................................................... 15
6. Photomicrograph of a slot pore........................................................................................................... 16
7. Graph showing permeability as function of water saturation, four samples .............................. 18
8. Graph showing pore pressure and fracture gradient measurements.......................................... 22
Tables
1. Properties of four sandstones within the Iles Formation.................................................................. 8
2. Properties of six sandstone zones within the paludal interval ........................................................ 8
3. Properties of six sandstone zones within the coastal interval ........................................................ 8
4. Properties of six sandstone zones within the fluvial interval ........................................................... 8
5. Summary of well tests in sandstone zones 3 and 4, paludal interval............................................ 18
6. Flow rates from the yellow sandstone test interval, coastal interval ........................................... 19
IV
A Review of the Multiwell Experiment, Williams Fork and Iles Formations, Garfield County, Colorado
By Philip H. Nelson
Abstract
The Cretaceous Iles and Williams Fork Formations of the Mesaverde Group contain important reservoir and source rocks for basin-centered gas in the Piceance Basin of northwestern Colorado. The sandstones in these formations have very low permeability, so low that successful production of gas requires the presence of fractures. To increase gas production, the natural fracture system of these “tight gas sandstones” must be augmented by inducing artificial fractures, while minimizing the amount of formation damage due to introduced fluids.
The Multiwell Experiment was undertaken to provide geologic characterization, obtain physical property data, and perform stimulation experiments in the Iles and Williams Fork Formations. Three vertical wells and one follow-up slant well were drilled, logged, partially cored, tested for gas production, stimulated in various manners, and tested again. Drawing from published reports and papers, this report reviews well log, core, and test data from the Multiwell Experiment while emphasizing geologic controls on gas production at the site.
Gas production is controlled by a single set of regional fractures trending west-northwest. The fractures are vertical, terminating at lithologic boundaries within and at the upper and lower boundaries of sandstone beds. Fractures formed preferentially in sandstones where in-place stress and fracture gradients are lower than in shales and mudstones. The frac-tures cannot be identified adequately with vertical wells; horizontal wells are required. The origin of the regional frac-ture set is attributed to a state of stress that is due to overpres-suring caused by gas. Because present-day maximum horizon-tal stress is aligned with the regional fractures, artificial frac-tures induced by pressuring the wellbore form parallel to the regional fractures rather than linking them, with consequent limitations upon enhancement of gas production.
Introduction
This review of the Multiwell Experiment is motivated by an assessment of the natural gas potential of the Piceance Basin by the U.S. Geological Survey. The Multiwell
Experiment stands as the most comprehensive and best docu-mented source of data concerning geologic controls on gas productivity in the Williams Fork and Iles Formations of the Mesaverde Group. From the standpoint of assessment work, the most significant findings of this experiment deal with the nature of permeability and porosity in the (unfractured) sand-stones, the characteristics of natural fractures and their impor-tance in gas production, and the nature of overpressure. These three topics are emphasized in this review. The results of production engineering work to stimulate the tight gas forma-tions are also reviewed briefly here.
The Multiwell Experiment (MWX) was sponsored by the U.S. Department of Energy to increase natural gas production from low-permeability reservoirs. Project leadership was car-ried out by Sandia National Laboratories and CER Corpora-tion. Drilling commenced in 1981, the field program was completed in 1988, and reporting was completed in 1990. The site is located in sec. 34, T. 6 S., R. 94 W. in the Rulison gas field in Garfield County, Colo. (fig. 1).
Three vertical wells, MWX-1, MWX-2, and MWX-3, were spaced several hundred feet apart so that pressure com-munication among wells could be observed. The display of downhole data in this review is restricted to well MWX-1, which was drilled to total depth in 1981. Most, but not all, of the production and stimulation work was performed in MWX-1, with MWX-2 and MWX-3 used as observation wells for interference tests. An additional slant hole, named SHCT-1 for slant hole completion test, was completed in 1990. The configuration of the four wells is represented in figure 2.
The Multiwell Experiment involved strata of the Mesaverde Group, which comprises the Iles and the Williams Fork Formations (pl. 1). Test work and reporting focused upon four depositional environments. In ascending order, these are (pl. 1) the marine interval (equivalent to the Iles Forma-tion), the paludal interval (sometimes referred to as the Cameo coal interval), the coastal interval, and the fluvial interval. These latter three intervals lie within the Williams Fork Forma-tion; the uppermost interval of the formation, described as the paralic interval, is not discussed.
The data and results for the four geologic intervals just mentioned were published in a series of four reports from Sandia National Laboratories during the years 1986 through 1990. Each of these reports discussed geology, well log
1

2 Petroleum Systems and Geologic Assessment of Oil and Gas in the Uinta-Piceance Province
96W 94W 92W 90W1S
5S
6S
8S
40°
108°
White River uplift
Colora
do R
iver
I-70GrandValley Parachute
Rulison
MWX siteSection 34
Grand H
ogback
Rifle Gap
96W 94W 92W90W
Figure 1. Location of Multiwell Experiment (MWX) site. Red dots indicate wells with gas production; black dots are dry wells. Three clusters of wells show locations of Grand Valley, Parachute, and Rulison gas fields in the Colorado River valley. Grand Hogback forms east edge of Piceance Basin. Sedimentary rocks of the Mesaverde Group penetrated at the MWX site are exposed at Rifle Gap.

A Review of the Multiwell Experiment, Williams Fork and Iles Formations, Garfield County, Colorado 3
Horizontal Displacement (feet)
05001,0001,5002,0002,5003,000
Ver
tical
Dep
th (
feet
)
0
2,000
4,000
6,000
8,000
10,000
Mesaverde Group (Top)
Paludal
Cozzette
Core
MWX-3 MWX-2
MWX-1
SHCT-1
SOUTHNORTH
Figure 2. Well configuration at Multiwell Experiment site, based upon Lorenz and Hill (1994). Horizontal well SHCT-1 passes between vertical wells MWX-1, MWX-2, and MWX-3. Plan view appears above vertical section.

4 Petroleum Systems and Geologic Assessment of Oil and Gas in the Uinta-Piceance Province
Click on image below to bring up high-resolution image of plate 1.
Plate 1. Well logs and core data for fluvial interval of Williams Fork Formation for wells MWX-1, MWX-2, and MWX-3, Garfield County, Colorado.

A Review of the Multiwell Experiment, Williams Fork and Iles Formations, Garfield County, Colorado 5
analysis, core analysis, stress studies, stimulation, and well tests. A summary paper by Northrop and Frohne (1990) listed more than 100 references bearing on the Multiwell Experi-ment, of which only selected papers are cited for purposes of the present review.
Wells MWX-1 and MWX-2 were drilled with oil-based mud, whereas well MWX-3 was drilled with water-based mud. The oil-based mud produced a smooth wellbore and high-quality well logs and also allowed a more accurate measure-ment of water saturation in core samples; however, its use did preclude some types of well logs, such as self-potential logs and resistivity-type imaging logs. Drilling and coring were done with mud weights designed to produce a wellbore fluid pressure nearly equal to that of formation pore pressure. How-ever, from subsequent analysis of pore pressures, it appeared that mud pressures were a few hundred pounds per square inch (psi) less than pore pressures (Sattler, 1989).
Core was obtained continuously to a depth of 6,710 ft in well MWX-1, with another section of core obtained in the Cozzette Sandstone Member. (Cored intervals are shown by red bars on pls. 1–5.) Casing was perforated at selected intervals within sandstones for testing. (Sandstones are shown by horizontal yellow shading, perforated intervals by vertical bars on pls. 1–5.)
Acknowledgments
John Lorenz and Norm Warpinski of Sandia National Laboratories furnished data, reports, and background infor-mation regarding the Multiwell Experiment program. Joyce Kibler produced most of the figures for this review. Review comments by John Lorenz, Norm Warpinski, and Mark Kirschbaum led to improvements in the manuscript.
Geologic Setting
The Iles and Williams Fork Formations of the Mesaverde Group are Late Cretaceous (Campanian) in age (Johnson, 1989).
The marine interval is equivalent to the Iles Formation (pl. 2). Blanket sandstones, formed in shallow marine to shoreline environments, represent regressive cycles. Tongues of Mancos Shale represent intervening transgressive cycles (Johnson, 1989; Lorenz and others, 1989). The Corcoran and Cozzette Sandstone Members of the Iles Formation were selected for testing. (See perforated intevals on pl. 2.)
The paludal interval (pl. 3) contains rocks laid down on a lower delta plain in lenticular distributary channels and adja-cent coal swamps (Johnson, 1989; Lorenz, 1988). Sandstone zones that received study are labeled 1 through 6 on plate 3.
The coastal interval (pl. 4) represents deposition on the upper portion of a deltaic plain, is characterized by lenticular
channel sands, and lacks the coal beds of the underlying palu-dal interval (Lorenz, 1989). Sandstone zones that were studied are labeled by color on plate 4.
The fluvial interval (pl. 5) represents deposition on a low-relief alluvial plain. Sandstones were formed mainly in fluvial meander belts, but also locally as extensive flood-plain deposits, and as more restricted levee and splay deposits (Lorenz, 1990). The meander-belt sandstones form the reser-voirs of interest in the fluvial interval. Sandstone intervals that received study are labeled A through F on plate 5.
Sandstone Identification
Sandstone intervals are highlighted with a yellow pattern on plates 1 through 5. The criteria for highlighting are based on the well logs and differ among the depositional intervals. In the Iles Formation (pl. 2), sandstones are highlighted where the gamma-ray log drops below 60 American Petroleum Institute (API) units. In the paludal interval (pl. 3), dielectric (Tpl) log values between 8.5 and 9.6 nanoseconds/meter (ns/m) were found to be a good indicator of sandstone. In the coastal and fluvial intervals (pls. 4 and 5), sandstones are highlighted where the gamma-ray log decreases below 75 API units. Boundaries of the highlighting were adjusted to achieve nominal agreement with sandstone intervals shown by Lorenz (1987, 1988, 1989, 1990), but the highlighting also includes some thin sandstone beds not depicted by Lorenz.
The Cozzette and Corcoran Sandstone Members are split into upper and lower intervals by intervening shales; coals are also present within the Corcoran Sandstone Member.
Sandstones are thicker and more numerous within the lower portion of the paludal interval than in the upper. Within the upper paludal (6,592–7,000 ft) interval, cumulative sand-stone thickness is approximately 100 ft; within the lower (7,000–7,455 ft) interval, cumulative thickness is approxi-mately 179 ft.
Coal Identification
The physical properties of coals in the paludal interval are such that almost all the well logs deflect in passing through a coal bed (see gray stripes on pl. 3). The 9-ft-thick coal bed at 7,044 ft has the following log responses: gamma ray, 27 API; electromagnetic wave slowness, 7.4 ns/m; resistivity from deep induction log, 200 ohm-m; apparent neutron poros-ity, 59 percent; apparent density, 1.37 g/cm3; compressional wave slowness, 132 microseconds per foot; shear wave slow-ness, 103 microseconds per foot. Actual deflections will vary because the deflections are only partial in the thinner coal beds and because properties vary from one coal bed to another. Coal beds were picked if the electromagnetic wave slowness fell below 8.5 ns/m; this criterion was selected because the electromagnetic propagation tool has the best vertical resolu-tion of the well log suite. Bed boundaries were then refined

6 Petroleum Systems and Geologic Assessment of Oil and Gas in the Uinta-Piceance Province
based upon visual inspection of all well logs. Beds thinner than about 1 ft are not represented because the deflections are too small.
In well MWX-1, both coalbed frequency and thickness are higher in the lower half of the paludal interval than in the upper half. Cumulative coal thickness is 74 ft in the interval 7,000–7,455 ft and 21 ft in the interval 6,592–7,000 ft. Within the lower interval, the four thickest coal beds have thicknesses of approximately 5, 7, 8, and 10 ft.
Geochemical Data, Thermal History, and Source Beds
Vitrinite reflectance (Ro) data from Nuccio and Johnson (1989) (pl. 1) show an increase in Ro from 0.82 percent at the top of the fluvial interval (4,398 ft) to 2.11 percent near the middle part of the marine interval (7,950 ft). From burial his-tory curves and thermal modeling, Nuccio and Johnson (1989) concluded that strata in the middle part of the marine interval (Iles Formation) reached a maximum depth of burial of 12,600 ft about 35 million years ago (Ma). Source rocks (specifically coal) in this part of the interval may have generated some oil at an Ro of 0.60 percent between 51 and 49 Ma, and likely began to generate thermogenic gas at an Ro of 0.73 percent about 49–46 Ma. These source rocks passed through the threshold at which oil breaks down to methane (Ro=1.35 percent) between 45 and 37 Ma. In fact, all coal beds below 6,500 ft reached an Ro of 1.35 percent prior to 15 Ma. The strata remained at the maximum depth of burial until regional uplift at 10 Ma.
Data tabulated by Barker (1989) revealed that total organic carbon (TOC) values from samples above 6,000 ft depth are generally less than 1 percent (pl. 1). Below 6,000 ft, TOC exceeds 1 percent at a number of depths. TOC values within the coal beds of the paludal interval frequently exceed 10 percent, with a maximum of 68 percent in a sample at 7,108 ft. In summary, the vitrinite reflectance and TOC data demonstrate the existence of abundant carbon-rich source beds that have reached a level of thermal maturity high enough to generate gas.
Eleven gas samples from wells MWX-1 and MWX-2 were analyzed as part of a study of gas geochemistry in the Piceance Basin (Johnson and Rice, 1990). From their interpre-tation of carbon-13 isotopes, vitrinite reflectance, and methane content, Johnson and Rice (1990) distinguished three types of gases charging reservoirs within the Mesaverde Group. The source of gas in sandstones of the Iles Formation was inter-preted to be the underlying Mancos Shale. Gas in sandstones of the Williams Fork Formation was interpreted as being gen-erated from associated carbonaceous shales. Methane-rich gas in coal beds of the Cameo (paludal) zone of the Willams Fork Formation is produced by devolatilization of humic coal, and has not migrated. Johnson and Rice (1990) contended that gas
from the coal beds is not the major source of gas in Williams Fork sandstone reservoirs.
Reservoir Properties
Composition of sandstones from the four depositional intervals is summarized in figure 3. Sandstones in the Iles For-mation are predominantly subarkoses and sublitharenites and are fairly uniformly fine grained (Pitman and others, 1989). Sandstones from the paludal interval are predominantly feld-spathic litharenites. Sedimentary lithic fragments—mudstone, siltstone, shale, and coal clasts—are common. Sandstones from the coastal interval are predominantly feldspathic lith-arenites. The sandstones are described as fine grained and moderately sorted, consisting predominantly of quartz, lithic fragments, and minor amounts of sodium feldspar. Sandstones from the fluvial interval are predominantly feldspathic lithar-enites and lithic arkoses. Plagioclase feldspar is common to all samples. Lorenz (1990) noted that sandstones of the fluvial interval contain significantly more unstable grains (rock frag-ments and feldspar) than sandstones of the coastal, paludal, or marine intervals.
Authigenic Quartz
Minor secondary quartz was reported in all depositional intervals by Pitman and others (1989). Soeder and Randolph (1987) claimed that secondary quartz is the key control on permeability. (See section, “Slot-like Pores as Controls on Permeability.”)
Authigenic Carbonate
Pitman and others (1989) reported variable amounts of calcite and dolomite in all depositional intervals, replacing framework grains and occurring as pore-fill and as replace-ment cement. In the paludal interval, ankerite and nonferroan dolomite are present. Estimates of total carbonate from well log analysis vary among sandstones and among depositional intervals, ranging from 2 to 15 percent of total rock volume (tables 1–4).
Authigenic Clay Minerals
From petrographic observation, illite and illite/smectite are reported as the most common clay mineral in all four depo-sitional intervals, commonly filling intergranular pores and coating framework grains (Pitman and others, 1989). Iron-rich chlorite and kaolinite are also reported in the fluvial interval. Analysis of well logs suggests clay content ranging from 5 to

A Review of the Multiwell Experiment, Williams Fork and Iles Formations, Garfield County, Colorado 7
0 20 40 60 80 1000
20
40
60
80
1000
20
40
60
80
100
D Fluvial Interval
Rock Fragments
0 20 40 60 80 100
Quartz
0
20
40
60
80
100
Feldspar
0
20
40
60
80
100
A Iles Formation
0 20 40 60 80 1000
20
40
60
80
1000
20
40
60
80
100
C Coastal Interval
0 20 40 60 80 1000
20
40
60
80
1000
20
40
60
80
100 Arkose
FeldspathicLitharenite
LithareniteLithic arkose
SublithareniteSubarkose
Quartzarenite
B Paludal Interval
Figure 3. Mineralogic compositions of framework grains in sandstones from four depositional intervals, from Pitman and others (1989). A, Iles Formation; B, paludal interval; C, coastal interval; D, fluvial interval.

Table 2. Properties of six sandstone zones within the paludal interval.[Well MWX-1, based upon well log analysis, from Kukal (1988)]
Zone 1 2 3 4 5 6Top depth, ft 7315.5 7240.0 7119.5 7071.0 6997.5 6880.5Bottom depth, ft 7340.0 7284.0 7147.5 7100.0 7014.0 6892.5Zone thickness, ft 24.5 44.0 28.0 29.0 16.5 12.0Sand thickness, ft 21.5 44.0 28.0 29.0 16.5 12.0Porosity, percent 7.2 8.7 8.6 10.1 8.1 8.7Water saturation, percent 70.7 64.1 57.1 53.9 79.6 53.7Volume clay, percent 9.2 10.7 15.1 8.1 12.5 10.5Volume carbonate, percent 6.0 2.3 5.7 11.9 6.5 8.4Permeability-thickness, mD-ft
0.2 1.1 0.7 1.0 0.2 0.5
Table 3. Properties of six sandstone zones within the coastal interval.[Well MWX-1, based upon well log analysis, from Kukal (1989)]
Zone Red B Red A Yel. B Yel. A Blue OrangeTop depth, ft 6524.0 6498.5 6442.5 6425.0 6242.5 6061.0Bottom depth, ft 6550.5 6521.5 6461.5 6440.0 6253.0 6081.0Zone thickness, ft 26.5 23.0 19.0 15.0 10.5 20.0Sand thickness, ft 16.0 23.0 19.0 13.0 10.5 11.5Porosity, percent 6.9 6.7 7.4 6.7 7.6 8.8Water saturation, percent 62.6 54.8 62.8 63.6 65.1 52.6Volume clay, percent 9.1 14.4 9.1 10.1 9.0 7.0Volume carbonate, percent 14.2 13.8 4.9 8.3 12.0 10.4Permeability-thickness, mD-ft
0.073 0.108 0.100 0.056 0.084 0.240
Table 4. Properties of six sandstone zones within the fluvial interval.[Well MWX-1, based upon well log analysis and core measurements, from Kukal (1990); meq/g, milliequivalents/gram]
Zone A2 B C2 D1 E1 FTop depth, ft 5957.0 5827.0 5714.5 5624.5 5544.0 5478.5Bottom depth, ft 5971.0 5843.0 5737.5 5635.5 5565.0 5491.5Zone thickness, ft 14.0 16.0 23.0 11.0 21.0 13.0Sand thickness, ft 14.0 16.0 23.0 11.0 21.0 13.0Porosity, percent 4.8 7.1 7.8 6.4 6.0 6.0Water saturation, percent 47.9 53.8 63.0 60.2 64.0 64.9Volume clay, percent 10.3 5.5 7.8 8.3 5.6 9.2Volume caronate, percent 12.2 18.8 7.1 14.8 10.0 8.0Cation exchange capacity, meq/100 g
2.07 3.02 2.00 1.72
Permeability-thickness, mD-ft
0.044 0.156 0.170 0.053 0.072 0.039
Table 1. Properties of four sandstones within the Iles Formation.[Well MWX-1, based upon well log analysis, from Kukal (1987)]
Interval Upper Cozzette Lower Upper Corcoran
LowerCozzette Corcoran
Top depth, ft 7831.0 7939.5 8111.5 8195.0Bottom depth, ft 7894.5 7995.0 8140.0 8232.0Sand thickness, ft 62.5 52.0 29.0 35.5Porosity, percent 7.0 7.5 6.7 5.9Water saturation, percent 58.8 64.7 57.5 44.9Volume clay, percent 9.3 11.0 9.4 18.3Permeability-thickness, millidarcy-ft (mD-ft)
0.42 0.29 0.20 0.30
8 Petroleum Systems and Geologic Assessment of Oil and Gas in the Uinta-Piceance Province

A Review of the Multiwell Experiment, Williams Fork and Iles Formations, Garfield County, Colorado 9
21 percent of total rock volume, with considerable variation among sandstone units (tables 1–4). Measurements of cation exchange capacity (CEC) provide a third measure of clay content (table 4; pls. 2, 4, 5). Cation exchange capacity data range from 2 to 3 milliequivalents per 100 grams (meq/100 g) within sandstone beds in the coastal and fluvial intervals, values which are compatible with significant concentrations of illite. However, six samples from the interval 7,878–7,892 ft in the upper part of the Cozzette Sandstone Member have CEC values of only 0.1–0.2 meq/100 g, indicative of negligible amounts of clay.
Porosity
Porosity measurements from core, using the helium method (Sattler, 1989), are shown as open squares in the porosity column of plates 2–5. Porosity was found to be insensitive to applied stress. Grain density data from core are shown in the neutron, density column of plates 2–5.
Because the smooth hole provides good log quality and because grain density data are available, porosity has been computed directly from the density log and is presented as the curve labeled “PorDen” in the porosity column. Note that computed porosity within the sandstone intervals overesti-mates the porosity from core measurements in some cases. Average porosity values for specific sandstone intervals based upon a more extensive analysis of well logs are given in tables 1–4.
Permeability of Dried Samples
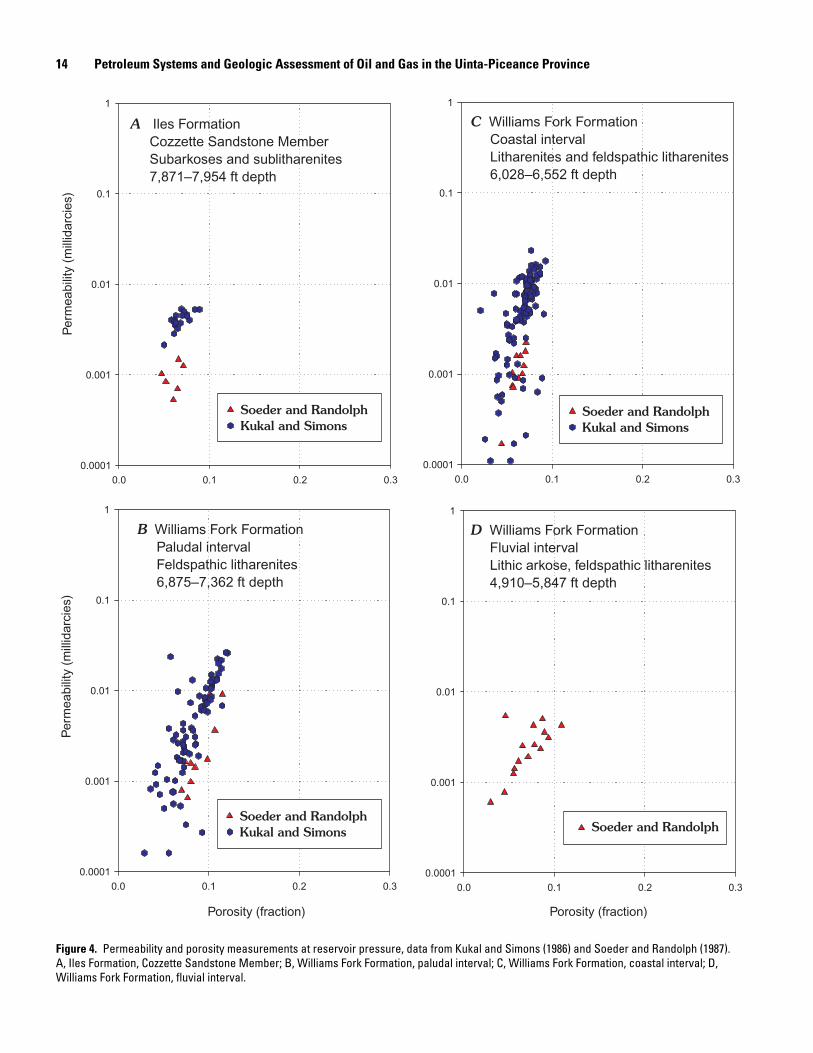
Permeability of dried samples to air or nitrogen was determined by two groups of analysts using independent mea-surement systems. Measurements made by Core Laboratories and reported by Kukal and Simons (1986) are shown in figure 4 as triangles. Measurements made at the Institute of Gas Technology and reported by Soeder and Randolph (1987) are shown in figure 4 as dots. Soeder and Randolph (1987) selected plugs from the cleanest gas-bearing sandstone inter-vals, as determined by well logs. The horizontal plug samples were dried at 45 percent relative humidity at a temperature of 140°F in a relative-humidity oven to baseline water saturation. The drying procedure used by Core Laboratories is not known. Both groups made the measurements on stressed samples and applied a correction for gas slippage (Klinkenberg correction), which is important in low-permeability samples.
Slot-Like Pores as Controls on Permeability
Using petrographic and scanning electron microscopes, Soeder and Randolph (1987, p. 133) recognized the existence of a dual porosity system, with one pore type (solution pores, fig. 5) making up the bulk of the pore volume and the other
(slot pores, fig. 6) controlling the permeability: “Virtually all the samples contain a pore geometry consisting of secondary pores that are separated from one another by several layers of quartz grains covered by extensive syntaxial quartz over-growths that produce planar grain contacts. This pore mor-phology is the result of diagenesis after deposition in which the primary porosity was filled in by quartz precipitating from solution. * * * The rock pore volume is divided unequally between the relatively large secondary solution pores and the narrow remnant openings at the planar grain contacts (i.e., slots). As a result, porosity is a function primarily of solution pore volume, although permeability of the rock is controlled by flow through the narrow slots.”
Porosity and permeability values are closely similar in all four depositional environments that are represented in figure 4. From these similarites, and from the following observations by Soeder and Randolph (1987, p. 134), one can conclude that the types of authigenic minerals present appear to play a subsidiary role in flow properties: “The quantity and distribu-tion of solution pores are similar for all four depositional environments, as they are from a common source and therefore have similar fractions of the less stable grains, such as feldspar and volcanic rock fragments. The type and quantity of second-ary minerals present in these solution pores, however, varies with depositional environment. * * * In many cases, the slot pores are partially filled or lined with authigenic minerals.” The solution and slot pores discussed by Soeder and Randolph (1987) are illustrated in figures 5 and 6.
Soeder and Randolph (1987, p. 135) indicated that the ultimate cause of the restricted range of permeability values remains elusive: “One of the most striking results of our core analysis is the narrow range of permeability values centered around one microdarcy. * * * Based just on average grain-size distribution throughout the formation, one would expect per-meabilities to vary by at least several orders of magnitude from the finer marine sands to the coarser fluvial deposits. The reason for the narrow permeability range [is that] all core samples have characteristic slot widths in the range of 0.04 to 0.18 micrometers. * * * One is tempted to hypothesize that some natural phenomenon dictates a preferred slot width of about 0.1 micrometer.”
Water Saturation
Water saturation data displayed on plates 2–5 were obtained from measurements on core samples using the Dean-Stark method (Sattler, 1989). The water saturations are plotted in complementary fashion to the gas saturations. If no fluids were lost during surfacing and if extractions and measure-ments were perfect, then the gas and water saturations would coincide. Average water saturation values calculated from well logs in specific sandstone intervals are given in tables 1–4. Of the 22 sandstone intervals listed, 18 have average values of water saturation between 50 and 65 percent.

10 Petroleum Systems and Geologic Assessment of Oil and Gas in the Uinta-Piceance Province
Click on image below to bring up high-resolution image of plate 2.
Plate 2. Well logs and core data for Iles Formation for well MWX-1, Garfield County, Colorado.

A Review of the Multiwell Experiment, Williams Fork and Iles Formations, Garfield County, Colorado 11
Click on image below to bring up high-resolution image of plate 3.
Plate 3. Well logs and core data for paludal interval of Williams Fork Formation for well MWX-1, Garfield County, Colorado.

12 Petroleum Systems and Geologic Assessment of Oil and Gas in the Uinta-Piceance Province
Click on image below to bring up high-resolution image of plate 4.
Plate 4. Well logs and core data for coastal interval of Williams Fork Formation for well MWX-1, Garfield County, Colorado.

A Review of the Multiwell Experiment, Williams Fork and Iles Formations, Garfield County, Colorado 13
Click on image below to bring up high-resolution image of plate 5.
Plate 5. Well logs and core data for fluvial interval of Williams Fork Formation for well MWX-1, Garfield County, Colorado.
14 Petroleum Systems and Geologic Assessment of Oil and Gas in the Uinta-Piceance Province
A Iles Formation Cozzette Sandstone Member Subarkoses and sublitharenites 7,871–7,954 ft depth
0.0 0.1 0.2 0.3
Per
mea
bilit
y (m
illid
arci
es)
0.0001
0.001
0.01
0.1
1
Soeder and RandolphKukal and Simons
Soeder and RandolphKukal and Simons
D Williams Fork Formation Fluvial interval Lithic arkose, feldspathic litharenites 4,910–5,847 ft depth
Porosity (fraction)Porosity (fraction)
0.0 0.1 0.2 0.30.0001
0.001
0.01
0.1
1
Soeder and Randolph
C Williams Fork Formation Coastal interval Litharenites and feldspathic litharenites 6,028–6,552 ft depth
0.0 0.1 0.2 0.3
Per
mea
bilit
y (m
illid
arci
es)
0.0001
0.001
0.01
0.1
1
Soeder and RandolphKukal and Simons
B Williams Fork Formation Paludal interval Feldspathic litharenites 6,875–7,362 ft depth
0.0 0.1 0.2 0.30.0001
0.001
0.01
0.1
1
Soeder and RandolphKukal and Simons
Figure 4. Permeability and porosity measurements at reservoir pressure, data from Kukal and Simons (1986) and Soeder and Randolph (1987). A, Iles Formation, Cozzette Sandstone Member; B, Williams Fork Formation, paludal interval; C, Williams Fork Formation, coastal interval; D, Williams Fork Formation, fluvial interval.

A Review of the Multiwell Experiment, Williams Fork and Iles Formations, Garfield County, Colorado 15
17
Figure 5. Photomicrograph from scanning electron microscope of a solution pore. Sample from well MWX-3 at 5,830 ft. Courtesy of D.J. Soeder.

16 Petroleum Systems and Geologic Assessment of Oil and Gas in the Uinta-Piceance Province
18
Figure 6. Photomicrograph from scanning electron microscope of a slot pore. Sample from well MWX-3 at 5,830 ft. Courtesy of D.J. Soeder.
A Review of the Multiwell Experiment, Williams Fork and Iles Formations, Garfield County, Colorado 17
Permeability to Gas in Partially Saturated Samples
Permeability to gas is extremely sensitive to water satura-tion. Eight samples reported by Randolph (1983) show that k45 / k0≈0.01, where k45 is the permeability to gas at 45 percent water saturation and k0 is the permeability to gas at 0 percent water saturation. Figure 7 shows similar results that were reported by Sattler (1990). The decline in permeability to gas occurring between 25 and 45 percent water saturation is much greater than the decline between 0 and 25 percent. In other words, the permeability to gas is approximately two orders of magnitude lower at in-place levels of water saturation than the measurements on dried, stressed samples. Because of the high sensitivity to water saturation exhibited by the curves in figure 7 and because only a few samples were measured, estimating the true in-place values of permeability to gas is difficult. Lorenz and others (1989) gave a range of 0.5–1.0 microdarcies for the in-place permeability to gas in the Coz-zette Sandstone Member and a range of 1.0–2.0 microdarcies (µD) for the paludal interval. Branagan and Warpinski (1989) cited a value of 0.05 µD for the coastal interval.
The laboratory measurements show that gas production is highly sensitive to in-place levels of water saturation. More-over, permeability to gas in low-aperture fractures can be expected to be highly sensitive to water content. This relation seems to have been demonstrated by the stimulation experi-ments in which gas productivity enhancements were found to be sensitive to the amounts of fluid emplaced during stimula-tion. (See “Well Test Results,” zones 3 and 4 of paludal interval.) However, core tests by Sattler (1989) showed that this is not necessarily the case, and Sattler argued that the high capillary pressure of the rock matrix will maintain fracture apertures at low saturation. (It is possible that capillary pres-sure (suction) was responsible for the improvement in gas production after the 18-month shut-in in zones 3 and 4.)
Well Test Results
Results of Individual Tests
A main objective of the Multiwell Experiment was to study and improve methods of artificially stimulating tight gas reservoirs. The following summaries of well tests emphasize the strong influence of natural fractures upon gas production while minimizing the details of stimulation research. The reader is referred to a summary paper by Northrop and Frohne (1990) and to chapters in project reports by Branagan (1987) and Branagan and Warpinski (1988, 1989, 1990) for more extensive discussions of the stimulation experiments.
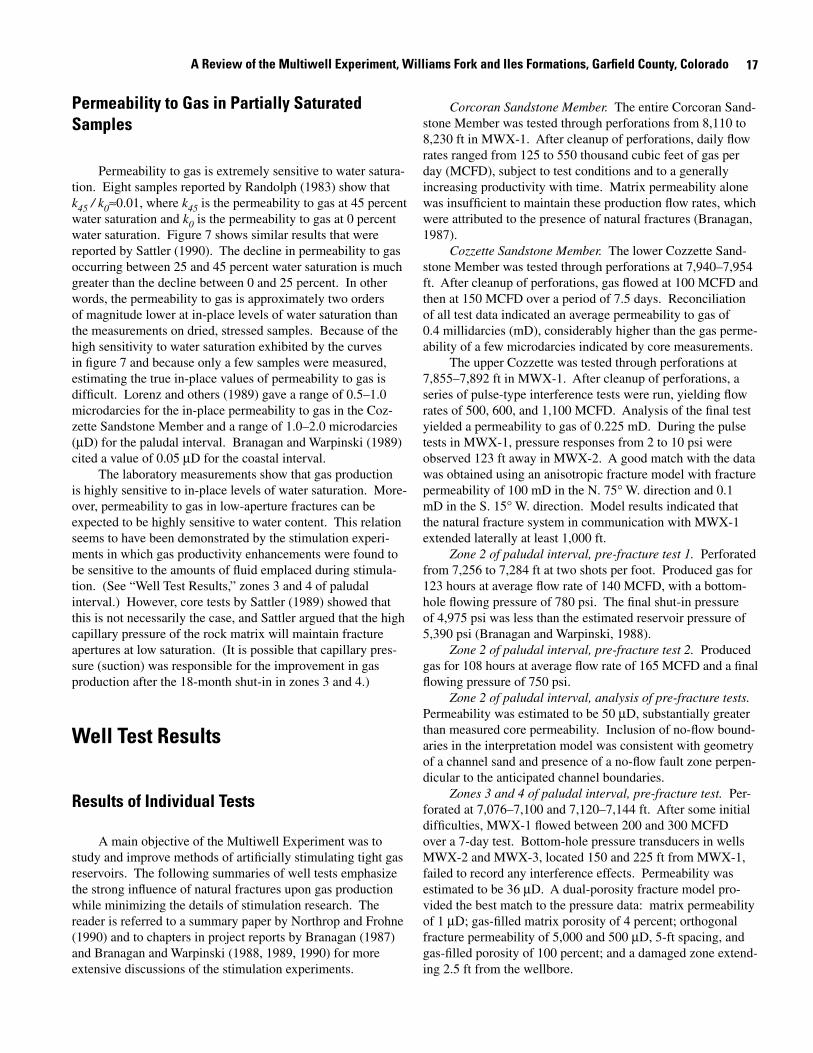
Corcoran Sandstone Member. The entire Corcoran Sand-stone Member was tested through perforations from 8,110 to 8,230 ft in MWX-1. After cleanup of perforations, daily flow rates ranged from 125 to 550 thousand cubic feet of gas per day (MCFD), subject to test conditions and to a generally increasing productivity with time. Matrix permeability alone was insufficient to maintain these production flow rates, which were attributed to the presence of natural fractures (Branagan, 1987).
Cozzette Sandstone Member. The lower Cozzette Sand-stone Member was tested through perforations at 7,940–7,954 ft. After cleanup of perforations, gas flowed at 100 MCFD and then at 150 MCFD over a period of 7.5 days. Reconciliation of all test data indicated an average permeability to gas of 0.4 millidarcies (mD), considerably higher than the gas perme-ability of a few microdarcies indicated by core measurements.
The upper Cozzette was tested through perforations at 7,855–7,892 ft in MWX-1. After cleanup of perforations, a series of pulse-type interference tests were run, yielding flow rates of 500, 600, and 1,100 MCFD. Analysis of the final test yielded a permeability to gas of 0.225 mD. During the pulse tests in MWX-1, pressure responses from 2 to 10 psi were observed 123 ft away in MWX-2. A good match with the data was obtained using an anisotropic fracture model with fracture permeability of 100 mD in the N. 75° W. direction and 0.1 mD in the S. 15° W. direction. Model results indicated that the natural fracture system in communication with MWX-1 extended laterally at least 1,000 ft.
Zone 2 of paludal interval, pre-fracture test 1. Perforated from 7,256 to 7,284 ft at two shots per foot. Produced gas for 123 hours at average flow rate of 140 MCFD, with a bottom-hole flowing pressure of 780 psi. The final shut-in pressure of 4,975 psi was less than the estimated reservoir pressure of 5,390 psi (Branagan and Warpinski, 1988).
Zone 2 of paludal interval, pre-fracture test 2. Produced gas for 108 hours at average flow rate of 165 MCFD and a final flowing pressure of 750 psi.
Zone 2 of paludal interval, analysis of pre-fracture tests. Permeability was estimated to be 50 µD, substantially greater than measured core permeability. Inclusion of no-flow bound-aries in the interpretation model was consistent with geometry of a channel sand and presence of a no-flow fault zone perpen-dicular to the anticipated channel boundaries.
Zones 3 and 4 of paludal interval, pre-fracture test. Per-forated at 7,076–7,100 and 7,120–7,144 ft. After some initial difficulties, MWX-1 flowed between 200 and 300 MCFD over a 7-day test. Bottom-hole pressure transducers in wells MWX-2 and MWX-3, located 150 and 225 ft from MWX-1, failed to record any interference effects. Permeability was estimated to be 36 µD. A dual-porosity fracture model pro-vided the best match to the pressure data: matrix permeability of 1 µD; gas-filled matrix porosity of 4 percent; orthogonal fracture permeability of 5,000 and 500 µD, 5-ft spacing, and gas-filled porosity of 100 percent; and a damaged zone extend-ing 2.5 ft from the wellbore.

Test Month, Year Duration Result (MCFD)Pre-frac October 1983 7 days 200 –300Post-frac July 1984 15 days 150Reentry March–April 1986 30 days 325
18 Petroleum Systems and Geologic Assessment of Oil and Gas in the Uinta-Piceance Province
Figure 7. Permeability to gas as a function of water saturation in four samples from well MWX-2. Measurements by Core Laboratories, reported by Sattler (1990).
MWX-2
Water Saturation (percent)
0 20 40 60 80 100
Klin
kenb
erg
Per
mea
bilit
y (m
icro
darc
ies)
0.01
0.1
1
10
Fluvial (5,734.3 ft)Fluvial (5,842.0 ft)Paludal (7,130.0 ft)Paludal (7,265.5 ft)
Table 5. Summary of well tests in sandstone zones 3 and 4, paludal interval.[Well MWX-1, from Branagan and Warpinski (1988)]

Table 6. Flow rates from the yellow sandstone test zone, coastal interval, 6,428–6,460 ft.
Test date Maximum flow rate(MCFD)
Pre-fracture November 1984 55–60Post-nitrogen fracture (unpropped)
June 1985 90
Post-nitrogen foam fracture (propped)
August 1985 100
Reentry June 1986 75–85
A Review of the Multiwell Experiment, Williams Fork and Iles Formations, Garfield County, Colorado 19
Zones 3 and 4 of paludal interval, minifracs and hydrau-lic fracture. Fractures were initiated through the perforated zones at 7,076–7,100 and 7,120–7,144 ft. The first minifrac used 15,000 gallons of 2 percent KCl and the second used 30,000 gallons of 2 percent KCl. No proppant was used. Analysis indicated that the resulting fracture extended 440 ft radially from the wellbore after the second test. A hydraulic fracture was then initiated using 81,000 gallons of liquid including 65,000 gallons of gel, and 193,000 lb of sand proppant.
Zones 3 and 4 of paludal interval, post-fracture testing and analysis. Slow cleanup and recovery of injected fluids indicated formation damage. After remedial treatment, gas production was 150 MCFD, substantially less than the pre-fracture production of 200–300 MCFD. Bottom-hole pres-sures during drawdown ranged from 1,200 to 2,000 psi. After 18 months of shut-in, the well was reentered and produced gas at 325 MCFD for 30 days. It was concluded that fracture treat-ment liquids damaged the natural fracture system, although the damage abated over the 18-month shut-in period. (See summary in table 5.) It was also concluded that the hydraulic fracture formed parallel to the high-permeability natural frac-ture set while intersecting the low-permeability set, thereby minimizing the potential for increased gas production (Brana-gan and Warpinski, 1988).
Red sandstone of coastal interval, pre-fracture test. Production tests through perforations at 6,500–6,524 and 6,535–6,552 ft produced gas at a rate near 45 MCFD during later portions of testing. Buildup pressure reached a maximum of 4,100 psi in MWX-1. Bottom-hole pressures in MWX-2 and MWX-3 showed no response to drawdown and buildup in MWX-1. Simulation suggests an average permeability of 11 µD and a fracture permeability anisotropy ratio of 100:1 (65 darcies:0.65 darcies), using a fracture spacing of 10 ft and an orientation of N. 74° W. for the primary fractures (Branagan and Warpinski, 1989).
Yellow sandstone of coastal interval, pre-fracture test. Initial production rate through perforations from 6,428 to 6,460 ft was about 100 MCFD declining to 50 MCFD at the end of testing. Final buildup pressure in MWX-1 was slightly above 3,800 psi. No correlative pressure disturbances were observed in MWX-2 or MWX-3 wells during testing of MWX-1. Simulation suggests an average permeability of 13 µD and a fracture permeability anisotropy ratio of 80:1.
Yellow sandstone of coastal interval, fracture test. The interval was fractured using nitrogen gas with no sand, fol-lowed by nitrogen foam with sand proppant. A post-fracture production test showed gas production at 90 MCFD at the end of the test period. The nitrogen foam injection did not increase production very much (see table 6) and other data suggested the possibility of some damage due to the foam injection. Commingled production from the red and yellow sandstone intervals during reentry a year later (table 6) did not show any appreciable change in production.
Production and interference test in zone B of fluvial inter-val. Production tests through perforations at 5,822–5,845 ft produced gas at a rate from 20 to 50 MCFD (Branagan and Warpinski, 1990). Bottom-hole pressures in MWX-2 and MWX-3 showed no response to drawdown and buildup in MWX-1. Argon injected into MWX-2 (as a tracer) failed to reach MWX-1 despite the pressure drawdown around MWX-1. Simulation of tests in MWX-1 and MWX-3 suggest that the reservoir is naturally fractured with 100:1 fracture perme-ability anisotropy and a matrix permeability of 0.4 µD.
Post-fracture production test in zone C2 of fluvial inter-val. Experimental tests in zone C2 were designed to fracture the formation while modifying the local stress regime. After a series of minifrac stimulations, sandstone zone C2 was tested through perforations in MWX-1 at 5,720–5,738 ft. The zone produced gas at roughly 60 MCFD during a 70-hour test. The zone was judged to be naturally fractured and to have better production than zone B (Branagan and Warpinski, 1990).
Production and interference test in zone E1 of fluvial interval. A series of experimental nitrogen pulse methods were used to break down the perforations at 5,544–5,565 ft. MWX-1 produced gas at roughly 65 MCFD during a series of production and interference tests. Optimum simulation of these tests, including the pressure pulses observed in MWX-2 and MWX-3, required a multi-layer, anisotropically fractured reservoir model (Branagan and Warpinski, 1990).
Post-fracture production test in zone E1 of fluvial interval. Zone E1 was fractured using nitrogen foam and sand proppant. The stimulation was successful, increasing gas production from 65 MCFD to 220 MCFD. Bottom-hole shut-in pressure was 3,200 psi. The results were simulated by adding a hydrau-lic fracture to the previously developed (and slightly modified) multi-layer, anisotropic fracture model, using a matrix perme-ability of 0.1 µD (Branagan and Warpinski, 1990).

20 Petroleum Systems and Geologic Assessment of Oil and Gas in the Uinta-Piceance Province
Summary
The well tests, without stimulation, produced gas at rates ranging from 25 to 1,100 MCFD, with most production in the 50–100 MCFD range. Matrix permeabilities in the microdarcy and sub-microdarcy range, as determined in the laboratory, were too low to produce gas at the observed rates. The lack of pressure response in wells MWX-2 and MWX-3 to pressure drawdown in MWX-1 showed that permeability must be highly anisotropic. Modeling of pressure response required permeability ratios of 100:1 (compatible with a single domi-nant fracture set) with matrix permeabilities of 1–10 µD (com-patible with laboratory measurements). All sandstones tested showed the influence of natural fractures upon gas production.
Natural Fractures
Fractures observed in core and inferred from well logs are indicated on plates 2–5. The use of oil-based mud in MWX-1 precluded the running of borehole imaging tools, which were run only in MWX-3. In MWX-1, the observation of fractures was restricted to the variable-amplitude display of sonic waveform data. (As an historical reminder, this work was done before good resistivity-based wellbore-image logs were available.)
Corcoran Sandstone Member
Two gas shows were recorded in the lower part of the Corcoran Sandstone Member, at 8,193–8,211 ft, and at 8,217–8,237 ft. A single fracture was identified from well logs in each of the two zones (Kukal, 1987). No fractures were found in the upper part of the Corcoran Sandstone Member (8,112–8,140 ft). Presence of a calcareous sandstone accounts for the resistivity peak and porosity decline registered on the sonic and density logs at 8,124 ft.
Cozzette Sandstone Member
Within the lower part of the Cozzette Sandstone Member, a fracture observed in core at 7,939 ft was also identified on the cement bond log. A major gas show on the mud log occurred at 7,946–7,957 ft; fractures were noted in core at 7,945 and 7,946 ft, with fractures also identified on the cement bond log at the same depth. Because of the gas show and fractures, this zone was interpreted as one of the better potential reservoirs within the Cozzette and Corcoran Sandstone Members. Within the upper part of the Cozzette Sandstone Member, a gas show was reported at 7,854–7,864 ft, whereas fractures were identified from the cement bond log at 7,862 ft and possibly at 7,869 ft (Kukal, 1987). No fractures were present in the core.
Paludal Interval
Kukal (1988) listed four intervals where sonic waveform logs run in cased hole indicated the presence of fractures (see FracLogs, pl. 3). Kukal also stated that zones 3 and 4 in well MWX-3 are naturally fractured (more tools for fracture identification were run in MWX-3 where water-based mud was used for drilling, than could be run in MWX-1 where oil-based mud was used).
Coastal Interval
Using a combination of well logs and core, Kukal (1989) identified four fracture zones within the coastal interval (see FracLogs, pl. 4). No single method was considered com-pletely diagnostic; the combination of methods included core, sonic waveforms, repeat runs of density logs, and resistivity logs. Individual fractures observed in core, listed by Lorenz (1989), are indicated by the lines labeled FracCore on plate 4. It is noteworthy that only a few fractures were observed in the red and yellow sandstones, which were the zones that were tested and stimulated.
Fluvial Interval
Extension fractures observed in core, listed by Lorenz (1990), are indicated in the column labeled FracCore on plate 5. A number of fracture diagnostic logging tools were run in MWX-3 (in water-base mud); from these data Kukal (1990, p. 414) concluded that “every zone in the low fluvial interval may be naturally fractured in MWX-3. Zones E1 and A1 are the only zones in which the presence of fractures is questionable.” In well MWX-1, only the sonic waveform log was available for fracture interpretation; fractures detected with this method in the lower fluvial interval are denoted on plate 5 in the column labeled FracLogs.
Fracture Orientation and Density
The population of vertical fractures is very poorly repre-sented in a vertical well because of the low probability of intercepting a vertical plane with a vertical hole. To obtain more reliable data on fractures, well SHCT-1 was drilled at 60° from the vertical through the paludal interval and at 85° from vertical in the Cozzette Sandstone Member, retrieving 266 and 115 ft of core from these two intervals (Lorenz and Hill, 1994). Within these two cored intervals, 65 natural fractures were recorded, 23 in the paludal interval and 37 in the Coz-zette Sandstone Member. The mean strike of fractures in the paludal interval was N. 84° W. and in the Cozzette Sandstone Member, N. 81° W. Strikes varied by ±15°. Dips were within 5° of vertical.

A Review of the Multiwell Experiment, Williams Fork and Iles Formations, Garfield County, Colorado 21
Orientation of well SHCT-1 was nearly north-south, lead-ing to modest correction factors in ascertaining the true spac-ing of fractures oriented west-northwest. Average fracture spacing was found to be about 3.0 ft, with maximum spacings of 7.6 ft in the paludal interval and 17.8 ft in the Cozzette Sandstone Member. Fracture spacing distributions are highly skewed to close spacings; most of the fracture spacings are less than 2 ft. The spacing between fracture swarms was found to be from 5 to 6 ft.
The futility of finding and characterizing vertical frac-tures with a vertical well is emphasized by Lorenz and Hill (1994, p. 69): “In Paludal zones 3 and 4 and the Cozzette reservoirs—reservoirs where the deviated SHCT-1 core shows extensive fracturing—only one fracture was encountered in the 162 ft of vertical core taken from the sections in the three MWX wells that overlap the SHCT-1 cored intervals. * * * The vertical core did not even definitively answer the question of whether the reservoirs were fractured, let alone provide information on fracture spacing.”
Adding to the difficulties in fracture characterization was the poor agreement among methodologies. Only a 10–20 percent overlap was noted between the indications of fractures in the various available logs (resistivity-based image logs were not available) or between the logs and fractures noted in core (J.C. Lorenz, oral commun., 2000).
On the other hand, the vertical core did provide data on the height of vertical fractures. Fractures were most common in the high-modulus sandstones, but many terminated within the sandstone beds rather than at boundaries with low-modulus shale beds. Many of these terminations occurred at lithologi-cal discontinuities internal to the sandstone bed. In other words, fracture height was often less than bed thickness.
Fractures, Depositional Environment, and Gas Production
Although one dominant (regional) set of west-northwest-trending fractures exists in all four depositional settings, some differences in fracture style and gas production occur (Lorenz and Finley, 1989). The blanket sandstones of the Iles For-mation are homogeneous with little lithologic change within beds, and most fractures extend from top to bottom of the beds. A second fracture set, striking north-northwest, was observed in outcrop and core. Pressure interference was observed in MWX-2 (see “Well Test Results, Cozzette Sand-stone Member”) during drawdown in MWX-1, and gas pro-duction was greater in the blanket marine sandstones than in the paludal, coastal, or fluvial intervals. Taken together, these observations indicate that the natural fracture system is best developed, both vertically and in orientation, in the marine blanket sandstones. Subtle differences in fracture char-acteristics and gas production in the paludal, coastal, and flu-vial intervals were also related to depositional characteristics (Lorenz and Finley, 1989).
Stress Orientation
Anelastic strain recovery on recovered core provided the most consistent determinations of the orientation of maximum horizontal stress. In the Iles Formation, the determinations yielded the following: Corcoran Sandstone Member, N. 83° W.; Cozzette Sandstone Member, N. 63° W.; Rollins Sand-stone Member, N. 61° W. (Warpinski, 1987). From four anelastic strain recovery measurements, the orientation of maximum horizontal stress ranges from N. 52° W. to N. 80° W. in the paludal interval (Warpinski, 1988). In the coastal interval, the orientation of maximum horizontal stress ranges from N. 58° W. to N. 88° W. with an average of about N. 73° W. (Warpinski, 1989). Warpinski (1990) reported that the maximum horizontal stress orientation is about N. 84° E. in the fluvial interval, with a range among individual measurements of N. 55° E. to N. 103° E.
These anelastic strain recovery data show that the west-of-northwest orientation of maximum horizontal stress is the same as that of natural fractures. Because induced hydraulic fractures take on the orientation of the maximum horizontal stress, the hydraulic fracture orientation should be closely aligned with the natural fracture orientation. The parallel orientation of induced hydraulic fractures and existing natural fractures explains the limited improvement in gas production following the stimulation experiments. (See “Well Test Results.”)
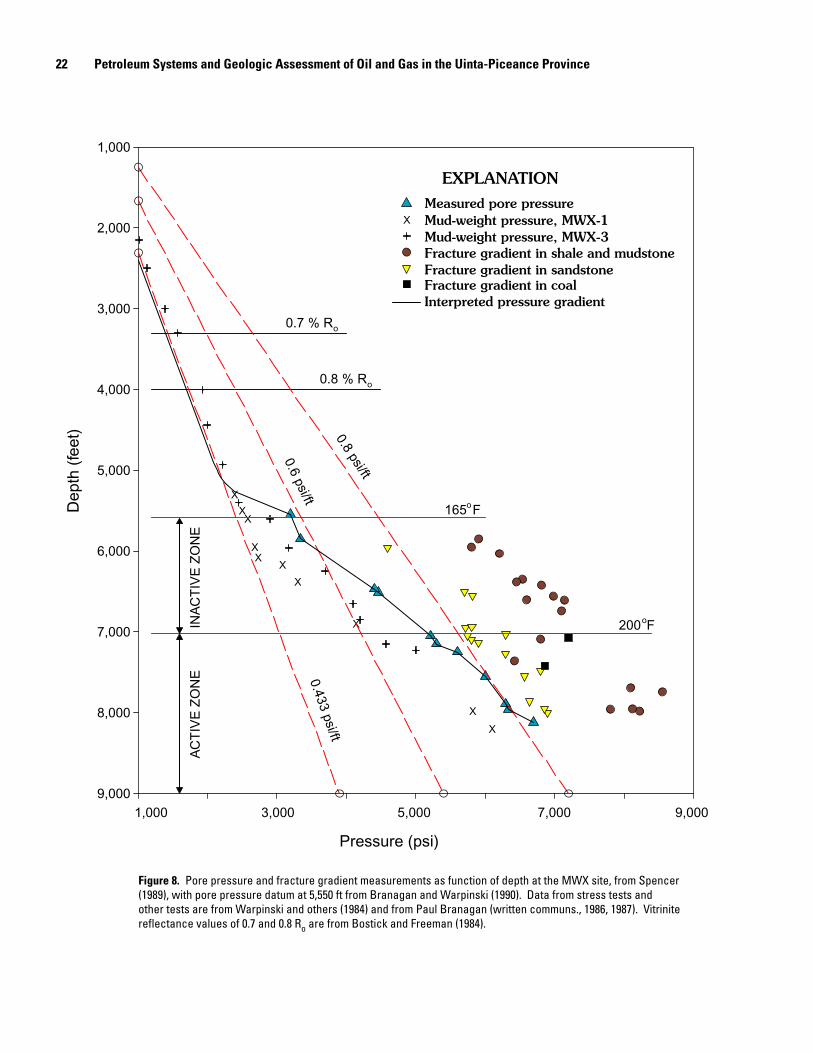
Pore Pressure
Pore pressure, mud weight, and fracture pressure from the MWX wells are shown in figure 8. The black line labeled “interpreted pressure gradient,” which joins the measured pore pressure points, departs from the normal hydrostatic gradient of 0.433 psi/ft at 5,200 ft. The uppermost blue triangle at 5,550 ft represents the E sandstone of the fluvial zone with a pore pressure of 3,200 psi, equivalent to an apparent pressure gradient of 0.58 psi/ft. Pore pressure increases with depth to progressively higher gradients. The two data points at 6,500 ft represent the red and yellow sandstones of the coastal interval, with apparent pressure gradients of 0.68 psi/ft. Three data points between 7,000 and 7,300 ft represent sandstones of the paludal interval, with apparent pressure gradients of 0.74 psi/ft. Pore pressure reaches a gradient of 0.8 psi/ft at 7,400 ft—the four lowermost blue triangles represent pore pressures in the Rollins, Cozzette, and Corcoran Sandstone Members of the Iles Formation.
Mud weights also increase with depth (fig. 8 and pls. 2–5), but the equivalent pressure of the mud column is less than pore pressure. In other words, the wells were drilled “underbalanced.”
The top of an “active” zone of present-day overpressuring coincides with the 200°F isotherm at 7,025 ft, approximately
22 Petroleum Systems and Geologic Assessment of Oil and Gas in the Uinta-Piceance Province
EXPLANATION
Pressure (psi)
1,000 3,000 5,000 7,000 9,000
Dep
th (
feet
)
1,000
2,000
3,000
4,000
5,000
6,000
7,000
8,000
9,000
X
X
X
X
XX
X
XX
X
X
Measured pore pressureMud-weight pressure, MWX-1Mud-weight pressure, MWX-3Fracture gradient in shale and mudstoneFracture gradient in sandstoneFracture gradient in coal
0.7 % Ro
0.8 % Ro
165 oF
200 oF
0.8 psi/ft
0.6 psi/ft0.433 psi/ft
INA
CT
IVE
ZO
NE
AC
TIV
E Z
ON
E
Interpreted pressure gradient
Figure 8. Pore pressure and fracture gradient measurements as function of depth at the MWX site, from Spencer (1989), with pore pressure datum at 5,550 ft from Branagan and Warpinski (1990). Data from stress tests and other tests are from Warpinski and others (1984) and from Paul Branagan (written communs., 1986, 1987). Vitrinite reflectance values of 0.7 and 0.8 Ro are from Bostick and Freeman (1984).
A Review of the Multiwell Experiment, Williams Fork and Iles Formations, Garfield County, Colorado 23
in the middle of the paludal interval. The presence of a 1,400-ft-thick “inactive” zone overlying the “active” zone is attributed to erosion followed by subsequent cooling and downward migration of the 200°F isotherm (Spencer, 1989). The B and E1 sandstone units within the lower portion of the fluvial interval now lie near the top of the “inactive” gas generation zone. Although overpressured, the entire coastal interval (from 6,000 to 6,600 ft) now lies above the top of the “active” gas generation zone at 7,025 ft.
The measured fracture gradients in sandstone (yellow triangles) are greater than 0.8 psi/ft, with the exception of the uppermost sandstone, which is slightly less than 0.8 psi/ft. The fracture gradient in shale and mudstone at any given depth is consistently greater than the fracture gradient in sandstone.
Conclusions
Vitrinite reflectance and total organic carbon data dem-onstrate the existence of abundant carbon-rich source beds (predominantly coals) that have reached a level of thermal maturity high enough that only gas will be present.
Formation temperature reaches 200°F at 7,000 ft, and in-place pore pressure approaches the fracture gradient in sand-stones. The zone from approximately 5,500 to 7,000 ft is interpreted as overpressured but not actively generating gas, whereas the zone from 7,000 ft to total depth is overpressured and is generating gas today.
Well tests showed that gas production rates were greatest in the marine sandstone beds of the Corcoran and Cozzette Sandstone Members of the Iles Formation, which produced at rates of 125–1,100 MCFD prior to stimulation. Sandstones in the paludal interval tested at 140–300 MCFD, sandstones in the coastal interval tested at 45–60 MCFD, and sandstones in the fluvial interval tested at 20–65 MCFD.
All sandstones that were tested show the influence of natural fractures upon gas production. Gas flows through the natural fractures to a wellbore, and hence flow is highly anisotropic, with little flow occurring transverse to the natural fracture orientation. Modeling of pressure response required permeability ratios of 100:1 (compatible with a single domi-nant fracture set), with matrix permeabilities of 1–10 micro-darcies (compatible with laboratory measurements).
Natural fractures are oriented west-northwest, are verti-cal, and terminate within and at the boundaries of sandstone beds. Few fractures were found with orientations other than west-northwest, that is, only one fracture set exists.
The present-day maximum horizontal stress is aligned with the primary set of natural fractures. As a consequence, hydraulic fractures initiated from the wellbore have the same general orientation as existing natural fractures, thereby less-ening the chance of linking with natural fractures.
References Cited
Barker, C.E., 1989, Rock-Eval analysis of sediments and ultimate analy-sis of coal, Mesaverde Group, Multiwell Experiment Site, Piceance Basin, Colorado, Chap. N in Law, B.E. and Spencer, C.W., eds., Geol-ogy of tight gas reservoirs in the Pinedale Anticline area, Wyoming, and at the Multiwell Experiment site, Colorado: U.S. Geological Survey Bulletin 1886, 11 p.
Branagan, P.T., 1987, Well testing, analysis and reservoir evaluation, Chap. 7 in Multiwell Experiment final report—I, The marine interval of the Mesaverde Formation: Sandia National Laboratories Report SAND87-0327, UC-92a, 290 p.
Branagan, P.T., and Warpinski, N.R., 1988, Well testing, analysis, and stimulation, Chaps. 7 and 8 in Multiwell Experiment final report—II, The paludal interval of the Mesaverde Formation: Sandia National Laboratories Report SAND88-1008, UC-92, 501 p.
———1989, Stimulation experiment, Chap. 7 in Multiwell Experiment final report—III, The coastal interval of the Mesaverde Formation: Sandia National Laboratories Report SAND88-3284, UC-92, 486 p.
———1990, Fluvial B, C, and E sandstone stimulation, Chaps. 7, 8, and 9 in Multiwell Experiment final report—IV, The fluvial interval of the Mesaverde Formation: Sandia National Laboratories Report SAND89-2612/B, UC-132, 448 p.
Bostick, N.H., and Freeman, V.L., 1984, Tests of vitrinite reflectance and paleotemperature models at the Multiwell Experiment site, Piceance Creek basin, Colorado, in Spencer, C.W., and Keighin, C.W., eds., Geologic studies in support of the U.S. Department of Energy Multiwell Experiment, Garfield County, Colorado: U.S. Geological Survey Open-File Report 84–757, p. 110–120.
Johnson, R.C., 1989, Geologic history and hydrocarbon potential of Late Cretaceous-age, low-permeability reservoirs, Piceance Basin, western Colorado: U.S. Geological Survey Bulletin 1787–E, 51 p.
Johnson, R.C., and Rice, D.D., 1990, Occurrence and geochemistry of natural gases, Piceance Basin, northwest Colorado: American Association of Petroleum Geologists Bulletin, v. 74, no. 6, p. 805–829.
Kukal, G.C., 1987, Log analysis, Chap. 4 in Multiwell Experiment final report—I, The marine interval of the Mesaverde Formation: Sandia National Laboratories Report SAND87-0327, UC-92a, 290 p.
———1988, Log analysis, Chap. 4 in Multiwell Experiment final report—II, The paludal interval of the Mesaverde Formation: Sandia National Laboratories Report SAND88-1008, UC-92, 501 p.
———1989, Log analysis, Chap. 4 in Multiwell Experiment final report—III, The coastal interval of the Mesaverde Formation: Sandia National Laboratories Report SAND88-3284, UC-92, 486 p.
———1990, Log analysis, Chap. 4 in Multiwell Experiment final report—IV, The fluvial interval of the Mesaverde Formation: Sandia National Laboratories Report SAND89-2612/A, UC-132, 448 p.
Kukal, G.C., and Simons, K.E., 1986, Log analysis techniques for quanti-fying the permeability of submillidarcy sandstone reservoirs: Soci-ety of Petroleum Engineers Formation Evaluation, v. 1, no. 4, p. 609–622.
Lorenz, J.C., 1987, Geology, Chap. 3 in Multiwell Experiment final report—I, The marine interval of the Mesaverde Formation: Sandia National Laboratories Report SAND87-0327, UC-92a, 290 p.
———1988, Geology, Chap. 3 in Multiwell Experiment final report—II, The paludal interval of the Mesaverde Formation: Sandia National Laboratories Report SAND88-1008, UC-92, 501 p.

24 Petroleum Systems and Geologic Assessment of Oil and Gas in the Uinta-Piceance Province
———1989, Geology, Chap. 3 in Multiwell Experiment final report—III, The coastal interval of the Mesaverde Formation: Sandia National Laboratories Report SAND88-3284, UC-92, 486 p.
———1990, Geology, Chap. 3 in Multiwell Experiment final report—IV, The fluvial interval of the Mesaverde Formation: Sandia National Laboratories Report SAND89-2612/A, UC-132, 448 p.
Lorenz, J.C., and Finley, S.J., 1989, Differences in fracture characteris-tics and related production—Mesaverde Formation, northwestern Colorado: Society of Petroleum Engineers Formation Evaluation (March), p. 11–16.
Lorenz, J.C., and Hill, R.E., 1994, Subsurface fracture spacing—Com-parison of inferences from slant/horizontal and vertical cores: Society of Petroleum Engineers Formation Evaluation (March), p. 66–72.
Lorenz, J.C., Sattler, A.R., and Stein, C.L., 1989, The effects of deposi-tional environment on petrophysical properties of Mesaverde res-ervoirs, northwestern Colorado: Society of Petroleum Engineers paper 19583, Transactions 64th Annual Technical Conference, p. 119–132.
Northrop, D.A., and Frohne, K-H., 1990, The Multiwell Experiment—A field laboratory in tight gas sandstone reservoirs: Journal of Petro-leum Technology (June), p. 772–779.
Nuccio, V.F., and Johnson, R.C., 1989, Thermal history of selected coal beds in the Upper Cretaceous Mesaverde Group and Tertiary Wasatch Formation, Multiwell Experiment Site, Colorado, relation to hydrocarbon generation, Chap. L in Law, B.E., and Spencer, C.W., eds., Geology of tight gas reservoirs in the Pinedale Anticline area, Wyoming, and at the Multiwell Experiment site, Colorado: U.S. Geological Survey Bulletin 1886, 8 p.
Pitman, J.K., Spencer, C.W., and Pollastro, R.M., 1989, Petrography, mineralogy, and reservoir characteristics of the Upper Cretaceous Mesaverde Group in the East-Central Piceance Basin, Colorado: U.S. Geological Survey Bulletin 1787–G, 31 p.
Randolph, P.L., 1983, Porosity and permeability of Mesaverde sand-stone core from the U.S. DOE Multiwell Experiment, Garfield
County, Colorado: Society of Petroleum Engineers Paper SPE 11765, SPE/DOE Symposium on Low Permeability, 12 p.
Sattler, A.R., 1989, Core analysis in a low permeability sandstone res-ervoir—Results from the Multiwell Experiment: Sandia National Laboratories Report SAND89-0710, UC-92a, 58 p.
———1990, Core analysis, Chap. 5 in Multiwell Experiment final report—IV, The fluvial interval of the Mesaverde Formation: Sandia National Laboratories Report SAND89-2612/A, UC-132, 448 p.
Soeder, D.J., and Randolph, P.L., 1987, Porosity, permeability, and pore structure of the tight Mesaverde Sandstone, Piceance Basin, Colo-rado: Society of Petroleum Engineers Formation Evaluation, p. 129–136.
Spencer, C.W., 1989, Comparison of overpressuring at the Pinedale anticline area, Wyoming, and the Multiwell Experiment site, Colo-rado, Chap. C in Law, B.E., and Spencer, C.W., eds., Geology of tight gas reservoirs in the Pinedale Anticline area, Wyoming, and at the Multiwell Experiment site, Colorado: U.S. Geological Survey Bulletin 1886, 16 p.
Warpinski, N.R., 1987, In-situ stress, Chap. 6 in Multiwell Experiment final report—I, The marine interval of the Mesaverde Formation: Sandia National Laboratories Report SAND87-0327, UC-92a, 290 p.
———1988, In-situ stress, Chap. 6 in Multiwell Experiment final report—II, The paludal interval of the Mesaverde Formation: Sandia National Laboratories Report SAND88-1008, UC-92, 501 p.
———1989, In-situ stress, Chap. 6 in Multiwell Experiment final report—III, The coastal interval of the Mesaverde Formation: Sandia National Laboratories Report SAND88-3284, UC-92, 486 p.
———1990, In-situ stress, Chap. 6 in Multiwell Experiment final report—IV, The fluvial interval of the Mesaverde Formation: Sandia National Laboratories Report SAND89-2612/A, UC-132, 448 p.
Warpinski, N.R., Branagan, P., and Wilmer, R., 1984, In-situ stress measurements at DOE’s Multiwell Experiment, in Frohne, K-H., ed., Western gas sands sub-program review, technical proceedings: U.S. Department of Energy, DOE/METC 84-3, p. 181–189.
Click here tV
o returolume T
n to itle Page