a review of the literature on marking reliability -...
TRANSCRIPT
A REVIEW OF THE LITERATURE ON MARKING RELIABILITY
Michelle Meadows and Lucy Billington
May 2005
This report was commissioned by the National Assessment Agency

CONTENTS
INTRODUCTION 4
DEFINITIONS AND FORMS OF RELIABILITY 4
A Brief Introduction to Classical Test Theory, Generalisability Theory and Item Response Theory 4
Definitions of reliability 7
Sources of unreliability 7 The test 7 The candidates 8 Scoring factors 8
Estimating reliability 9
Grades / levels 10
Making tests more reliable 11
Using tests to predict future performance 12
Using tests to select individuals 13
The relationship between reliability and validity 13
Types of interrater reliability 14 Consensus estimates of reliability 14 Consistency estimates of reliability 14 Measurement estimates of reliability 15
The limitations of the correlation as a measure of reliability 16
THE UBIQUITOUS RELIABILITY OF MARKING STUDY 17
CHANGES IN THE CONSISTENCY AND SEVERITY OF MARKING OVER TIME 20
SOURCES OF BIAS IN MARKING 23
Contrast effects 23
The text of the script 25
The candidate 27 Gender bias 27 Ethnic bias 30
The examiner 30 Examiner background 30 Examiner traits 34 Transient examiner traits 34
2
THE EFFECT OF QUESTION FORMAT, SUBJECT AND CHOICE OF ESSAY TOPIC ON MARKING RELIABILITY 35
Question format 35
Candidates’ choice of essay topic 38 Studies of the process by which examiners rate essays 38 Improving the reliability of essay marking 41
THE EFFECT OF THE MARK SCHEME/RATING SYSTEM ON MARKING RELIABILITY 42
PROCEDURAL INFLUENCES ON MARKING RELIABILITY 47
Consensus versus hierarchical approaches to achieving marking reliability 47
Training and feedback 50
Community of practice 53
Exemplar material 55
Double and multiple marking 56
REMEDIAL MEASURES TO DETECT/CORRECT UNRELIABLE MARKING 60
Adjustments to marks 60
Methods for detecting unreliable examiners used by UK awarding bodies 64 Enquiries on results 64 Centre grade comparison list 64 Office review 64 Borderline reviews 65 Checking for clerical errors 66
The reliability of e-marking 67
CONCLUSIONS 68
The need to routinely report reliability statistics alongside grades 68
Alternatives to marking 70 Thurstone paired comparison of scripts 70 Computer marking 70
REFERENCES 72
APPENDIX 1 A BRIEF INTRODUCTION TO THE CORRELATION COEFFICIENT 88
3

INTRODUCTION Hartog and Rhodes’ seminal book on marking reliability began “No element in the structure of our national education occupies at the present moment more public attention than our system of examinations” (vii, 1936). The focus of public attention has not diminished over the intervening 70 years. Moreover, there is an assumption on the part of the public that the marks awarded to candidates in high stakes examinations such as GCSE and GCE are (with only the occasional exception) highly reliable and a true reflection of the candidates’ abilities. Yet there is a long history of research findings to the contrary. As early as 1912 Starch and Elliott reported a study of the reliability of the marks assigned by teachers to English examination scripts. There was wide variation in the marks given to the same script. They replicated their findings in the marking of Mathematics (1913a) and History (1913b). They expected to find more consistency in the marking in Mathematics than English, but found that the marks varied even more widely. They suggested that this was because some teachers took into account the poor appearance of the script, which others ignored. The teachers also came from schools with varying levels of achievement, which they believed could have affected their grading. Marking reliability is the focus of this literature review, which will cover the levels of marking reliability achieved in different forms of assessment and research into methods of improving marking reliability. It concentrates upon the marking of externally assessed examination scripts, rather than on the assessment of coursework, performance or of competence (although research in these areas is drawn on where appropriate). Before discussing specific studies of marking reliability, it is worth considering what is meant by the term ‘reliability’ in relation to assessment in general, and more specifically in relation to marking. DEFINITIONS AND FORMS OF RELIABILITY Psychometrics is a field of psychology that deals with the measurement of individual differences, in terms of traits, abilities, skills, and other characteristics. The three main theories used by psychometricians and researchers studying marking reliability are classical test theory, generalisability theory and item response theory (IRT). These theories have influenced the definition and measurement of assessment reliability and so are referred to throughout this review. A Brief Introduction to Classical Test Theory, Generalisability Theory and Item Response Theory Classical test theory is the most common measurement theory used and dates back to work done by Charles Spearman (1904a, 1904b, 1927) at the turn of the last century. It is usually represented by the following formula: X = T + E where
X is the observed score (the actual measurement obtained) T is the true score (what the measurement would be if there were no error) E is the error score (the influence of error on the measurement, also known as ‘measurement error’)
Wiliam (1993) sees classical test theory as an attempt to capture the idea of a ‘signal-to-noise-ratio’ for assessments (Shannon and Weaver, 1949). It is based on the assumption that an
4
individual's scores contain error (noise) which can be decreased but never totally eliminated. The theory assumes that the error is random and normally distributed. Classical test theorists have shown that typically longer tests are more reliable than shorter tests and a larger sample of the population is more reliable than a smaller one. This rationale is based on the increased variance, or spread of scores, that allows the mean error score to approach zero. They also believe that results are useable and applicable to others (generalisable) only if the sample that was originally tested is representative of the target population currently under consideration. Classical test theorists assume that test scores are sample dependent (or sample variant). This means that scores are not the same across different samples. The same mathematics test could be given to year 7 children in different schools over the country. Their scores would be different because they came from different samples. The standard error of measurement (SEM), however, applies to all scores in the target population. SEM is an index of random measurement error and is used to calculate the range of scores in which the individual's ‘true score’ lies with a defined probability. SEM is discussed in more detail later. Classical test theory is theoretically and statistically not as complex as generalisability theory or IRT. Probably the most important weakness of its application is that scores are sample variant. Scores can vary from one sample to the next. This means that it is very important that the original sample (the ‘norm group’) is representative of the target population. Scores obtained using this model are also test dependent - the candidate’s score depends on the test taken. Generalisability theory is another popular method for computing a measurement estimate of marking reliability (Shavelson & Webb, 1991). It provides a comprehensive conceptual framework and methodology for analyzing more than one measurement facet simultaneously in investigations of assessment reliability (Cronbach, Gleser, Nanda and Rajaratnam, 1972; Brennan, 1992, 2000, 2001). Multiple sources of measurement error in the test data can be disentangled. Whereas in classical test theory all sources of error are lumped together in a single undifferentiated error term. For this reason classical test theory has been called the ‘one source of error at a time’ approach (Swanson, Noreini and Grosso, 1987). Generalisability theory allows investigation of the impact of various changes in measurement design (different numbers of tasks or markers for example). According to Wilmut, Wood and Murphy (1996) the theory provides the statistical method for answering the following question: given a candidate’s performance on a particular test at a particular time, assessed by a particular assessor, how dependable is the inference about how that candidate would have performed across all occasions in different settings, and with different observers. Generalisability theory can inform adjustments made to examiners’ marks in light of reliability information. Linacre (1994) has noted the usefulness of generalisability studies in determining “the error variance associated with each judge’s ratings, so that correction can be made to ratings awarded by a judge when he is the only one to rate an examinee.” (p. 29).
Wilmut et al recommend generalisability analysis as the preferred methodology for investigating examination reliability. Linacre, however, argues that for generalisability theory to be applied
“examinees must be regarded as randomly sampled from some population of examinees which means that there is no way to correct an individual examinee’s score for judge behavior, in a way which
5

would be helpful to an examining board. This approach, however, was developed for use in contexts in which only estimates of population parameters are of interest to researchers” (p. 29).
Further, the most powerful generalisability study designs are fully crossed: with the same raters marking all tests for all examinees (Lee, Kantor and Mollaun, 2002). This design is rarely feasible for large-scale testing situations. A partially nested design, with raters nested within examinees, would however be possible.
IRT is another common theory of test construction and performance. It relates characteristics of items (item difficulty) and characteristics of individuals (ability) to the probability of a correct item response. Item Response Theory comes in three forms reflecting the number of parameters considered in each case. In the simplest form of IRT only the difficulty of an item is considered (difficulty is the level of ability required for a candidate to be more likely to correctly answer the question than answer it wrongly). In more complex modelling both difficulty and discrimination are considered (discrimination is how well the question is at separating out candidates of similar abilities). It is also possible to model the effects of chance as well as difficulty and discrimination (chance is the random factor which enhances a candidates probability of success through guessing).
A great advantage of IRT is that it assumes that the scores obtained are sample invariant. What is measured is an individual's level on a trait. This gives increased freedom to equate test scores, because the score is a measurement of the amount of the trait this person possesses. It is not a measurement of how they scored in relation to the norm group (classical test theory). Further, proponents of IRT argue that it is so robust that even if some of its statistical assumptions are violated, data using this framework will still stand up to manipulation. However, IRT has some disadvantages. It requires complex statistical calculations that necessitate the use of a computer. It also requires a very large data bank of items. Finally, IRT modelling assumes that the trait being measured is one-dimensional, necessitating testing by domain.
Rasch modelling is example of IRT which has been used extensively in the study of marking reliability. Recent advances in the field of measurement have led to an extension of the standard Rasch measurement model (Rasch, 1960, 1980; Wright & Stone, 1979). This new, extended model, known as the many-facets Rasch model, allows judge severity to be derived using the same scale (the logit scale) as person ability and item difficulty. Rather than assuming that a score of 3 from Judge A is equally difficult for a participant to achieve as a score of 3 from Judge B, the equivalence of the ratings between judges can be empirically determined. Thus, a score of 3 from Judge A may really be closer to a score of 5 from Judge B. Using a many-facets analysis, each question paper item or behaviour that was rated can be directly compared. In addition, the difficulty of each item, as well as the severity of all judges who rated the items, can also be directly compared. Person abilities can be evaluated whilst controlling for differences in item difficulty and judge severity. Finally, in addition to providing information that allows for the evaluation of the severity of each judge in relation to all other judges, the facets approach also allows one to evaluate the extent to which each of the individual judges is using the scoring rubric in a manner that is internally consistent. The mathematical representation of the many-facets Rasch model and the associated FACETS software are fully described in Linacre (1994). Studies of marking reliability often use a classical test theory, generalisability theory or IRT approach to understanding assessment reliability, so the review will touch upon these theories
6

several times. Theoretical approach also influences the way in which researchers define reliability. Definitions of reliability Rudner and Schafer (2001) argue that the best way to view reliability is the extent to which test measurements are the result of properties of those individuals being measured. For example, reliability has been defined as “the degree to which test scores for a group of test takers are consistent over repeated applications of a measurement procedure and hence are inferred to be dependable and repeatable for an individual test taker” (Berkowitz, Wolkowitz, Fitch and Kopriva, 2000). This definition will be satisfied if the test scores are indicative of characteristics of the test takers, if not they will vary unsystematically and not be repeatable or dependable. Reliability can also be viewed as an indicator of the absence of error when the test is administered. For example, Ebel and Frisbie (1991) defined reliability as how consistent or error free measurements are. When random error is minimal, one can expect scores to be accurate, reproducible and generalisable to other testing occasions and other similar test instruments. A theoretical definition of reliability is the proportion of score variance caused by systematic variation in the population of test takers. This definition is population specific and sees reliability as a joint characteristic of a test and an examinee group, not just a characteristic of a test. As Crocker and Algina (1986) argue “Reliability is a property of the scores on a test for a particular group of examinees” (p.144). Group heterogeneity with regard to the trait being measured is an important factor that affects score reliability estimates. In general, other things being equal, measurement reliability is higher for a group that is heterogeneous with regard to the trait being measured than that of a more homogeneous group. So, an IQ test would be more reliable for a random sample of adults than for a sample of rocket scientists. Classical test theory assumes that only true score variance, not measurement error variance, varies with group heterogeneity. Fan and Yin (2003) argue that when performance levels of the groups are comparable; this assumption appears to be tenable, because the theoretically predicted measurement reliability estimates are largely consistent with the empirically observed measurement reliability estimates. They showed, however, that group performance level affects measurement reliability. For the data examined, after adjusting for the difference in group variability, measurement scores of the lower performing group had more measurement error, and consequently their scores had lower measurement reliability. The larger the performance difference, the more noticeable the difference in measurement reliability between the high and low performing groups. Sources of unreliability Unreliability in marking is only one factor influencing the overall reliability of the assessment. Wiliam (2000) sets out the three major sources of assessment error: factors in the test itself, factors in the candidates taking the test and scoring factors (such as who is marking the test). The test A source of unreliability (usually the largest according to Wiliam) concerns the particular choice of items included in the test. Most tests contain a selection of items to test particular skills. It is usual to generalise from each item to all items like that item. For example, if a candidate can solve several problems like seven times eight, then one may generalise his or her ability to
7
multiply single digit numbers. It is also usual to generalise from the collection of items to a broader domain. If a candidate does well on a test of addition, subtraction, multiplication and division of fractions, then one may generalise and conclude that the candidate is able to perform fraction operations. The selection of particular items to represent the skills and domains may introduce error. The set of items included will benefit some candidates and not others. Since one is generalising to ability across all the items that could have been on the test, the particular cross-section of test content that is included in the specific items on the test introduce sampling error and limit the dependability of the test. As the skills and domains being measured increase in complexity, the more error is introduced by the sampling of items. Wiliam lists other origins of test error including the effectiveness of the distracters in multiple choice tests, partially correct distracters, multiple correct answers, and difficulty of the items relative to the candidate’s ability. The candidates Candidates’ behaviour may be inconsistent and also introduce error into the testing process. Changes in candidates’ concentration, attitudes, health, fatigue, and so on may affect the quality of their responses and thus their test-taking consistency. For example, candidates may make careless errors, misinterpret or forget test instructions, accidentally omit test sections or misread test items. Scoring factors Numerous factors influence the reliability of scoring (or marking) and the aim of this paper is to review the research into marking reliability. Harper (1967) warns against confusing examiner reliability and examination reliability. As Wiliam (2000) shows, the reliability of the total testing situation is affected by a combination of test (or content) reliability, the candidates and examiner reliability. Measures of reliability It is impossible to calculate a reliability coefficient that conforms to the theoretical definition of reliability because it would require knowing the degree to which a population of candidates vary in their true achievement. Instead there are several statistics commonly used to estimate the stability of a set of test scores for a group of candidates: test-retest reliability, split-half reliability, measures of internal consistency, and alternate form reliability. Since these statistics are based upon the correlation coefficient, a brief explanation of the computation of a correlation coefficient is included in Appendix 1. Test-retest reliability A test-retest reliability coefficient is obtained by administering the same test twice and correlating the scores. As Wiliam (2000) points out, if a candidate attempts a test several times, even if no learning takes place in between, he or she will not get the same score each time. The candidate’s concentration may vary, the marker may be more or less generous, or the handwriting or the way in which the answer is expressed might be a little bit clearer so the marker can understand the answer better. In theory, a test-retest reliability coefficient is a useful measure of score consistency because it allows the direct measurement of consistency from administration to administration. This coefficient is not recommended in practice, however, because of its problems and limitations. It requires two administrations of the same test with the same group of candidates which is expensive and not a good use of time. If the time interval is short, candidates may be overly
8
consistent because they remember some of the questions and their responses. If the interval is long, then the results are confounded with learning and maturation, that is, changes in the candidates themselves. Split-half reliability This is a coefficient obtained by dividing a test into halves, correlating the score on each half, and then correcting for length (longer tests tend to be more reliable). The split can be based on odd versus evenly numbered items, randomly selecting items, or manually balancing content and difficultly. This approach has the advantage that it only requires a single test administration. Its weakness is that the resultant coefficient will vary as a function of how the test was split (this is a particular problem when the items are designed to be differentially difficult). Further, it is inappropriate on tests where speed is a factor (that is, where candidates’ scores are influenced by how many items they reached in the allotted time). Internal consistency This focuses on the degree to which the individual items are correlated with each other and is a measure of item homogeneity. It is assumed that items are measuring the same trait if scores on the items are highly correlated. Several statistics fall within this category. The best known are Cronbach’s alpha, the Kuder Richardson Formula 20 (KR-20) and Richardson Formula 21 (KR-21). Most testing programs that report data from one administration of a test do so using Cronbach’s alpha which is functionally equivalent to KR-20. The advantages of these statistics are that they only require one test administration and they do not depend on a particular split of items. The disadvantage is that they are most applicable when the test measures a single skill area. Where the test aims to measure knowledge, skills and so on across a wide specification, as is the case in GCSE and GCE examinations for example, one would not expect the test to have high internal consistency. Alternate-form reliability Most standardised tests provide equivalent forms that can be used interchangeably. These alternate forms are typically matched in terms of content and difficulty. The correlation of scores of pairs of alternate forms for the same candidates provides another measure of consistency or reliability (this is an extension of split-half reliability). Even with the best test and item specifications, each test would contain slightly different content and maturation and learning may confound the results. However, the use of different items in the two forms allows examination of the extent to which item sets contribute to random errors in estimates of test reliability. Unfortunately, as Satterly (1994) points out, although the method of estimating reliability preferred by statisticians is to correlate at least two equivalent assessments, the one-off nature of almost all UK examinations precludes this. Estimating reliability According to classical test theory, as Wiliam (2000) explains, the starting point for estimating the reliability of a test is to hypothesise that each candidate has a ‘true score’ on a particular test. A candidate’s true score is the average score that the candidate would get over repeated takings of the same or a very similar test. A candidate’s actual score on any particular occasion is made up of his or her true score plus a certain amount of error (as suggested by classical test theory). On a given day, a candidate might get a higher or a lower score than his or her true score. To get a measure of reliability one must compare the sizes of the errors with the sizes of the actual scores. When the errors are small in comparison with the actual scores, the test is relatively reliable, and when the errors are large in comparison with the actual scores, the test is relatively unreliable. It is impossible to use the average values for this comparison, because, by definition,
9

the average value of the errors is zero. Instead, a measure of the spread of the values, the standard deviation (SD), is used. The key formula is
Standard deviation of errors = r−1 x standard deviation of observed scores
r is the reliability coefficient of the test. A coefficient of 1 means that the standard deviation of the errors is zero and there is no error, so the test is perfectly reliable. A coefficient of 0 means that the standard deviation of the errors is the same as that of the observed scores - the scores obtained by the individuals are all error, so there is no information about the individuals at all. When a test has a reliability of zero the result of the test is completely random. How high reliability should be depends upon the consequences of the test. If the consequences are high, such as they are in public examinations, Wiliam (2000) argues that the internal consistency reliability needs to be high - 0.90 or above, preferably above 0.95. Naturally, when the stakes are high, misclassifications due to measurement error must be kept to a minimum. The SD of the errors is known as the standard error of measurement (SEM). As Satterly (1994) notes the purpose of a reliability study is to calculate an estimate for the SEM which enables the score user to quantify the uncertainty associated with it and to estimate the limits around obtained scores within which true scores lie. The results of even the best tests can be very inaccurate for individual candidates, and therefore high-stakes decisions should not be based on the results of individual tests. In the UK, public examinations have multiple components. An A level, for example, is made up of a minimum of six components each of which is assessed by a separate examination or piece of coursework. Because the effects of unreliability operate randomly, the averages across groups of candidates, however, are quite accurate. For every candidate whose actual score is lower than their true score, there is likely to be one whose actual score is higher than their true score, so the average observed score across a group of candidates will be the same as the average true score. Grades / levels Making sense of reliability for public examinations and national curriculum tests is further complicated by the use of grades or levels rather than marks. Wiliam (2000) demonstrates that there is good reason for the use of levels/grades. It is tempting to regard a candidate who gets 75 per cent in a test as being better than a candidate who gets 74 per cent, even though the second candidate actually might actually have a higher true score. In order to avoid unwarranted precision, therefore, just grades/levels are reported. The danger, however, is that in avoiding unwarranted precision, we end up falling victim to unwarranted accuracy - while we can see that a mark of 75 per cent is only a little better than 74 per cent, it is tempting to conclude that grade B is somehow qualitatively much better than grade C. Firstly, the difference in performance between someone who scored grade B and someone who scored grade C might be only a single mark, and secondly, because of the unreliability of the test, the person scoring grade C might actually have a higher true score. In reporting the reliability of assessments that use grades or levels it is useful to include the expected percentage of misclassifications. There are now sophisticated techniques to compute misclassification information, for example by using IRT (Rudner, 2001).
10

Wiliam (1993) demonstrated that it is particularly important to consider the percentage of misclassifications in criterion referenced assessments. He argues that the classical test theory definition of reliability puts a premium on increasing the true-score variance. This is because the reliability of a test can be improved either by reducing the error variance or by increasing the true-score variance. A reliable norm referenced test may therefore simply be one with such a large true score variance that the error variance is masked. But with criterion-referenced tests, the true-score variance can often be quite small, and the distribution of errors unusual. Wiliam gives the example of a criterion referenced test with a scale from 0 to 100 and with candidates who achieve at least 70 per cent being accorded ‘mastery’ status. If there is a U-shaped distribution of errors, so that almost all of the error is associated with scores over 90 per cent or less than 10 per cent, there might be a very large error variance and consequently a low value of reliability. However, it does not really matter if someone who should have got 8 per cent actually got 17 per cent, or if someone who should have got 90 per cent actually got 80 per cent because this variation makes no difference to their classification. Wiliam argues that classical reliability indices give misleading results in criterion referenced systems because of the inflexible approach to the treatment of error. He believes therefore that in criterion referenced tests reliability should be defined as the proportion of the population getting the ‘correct’ level. Wiliam (2000) demonstrates the relationship between the reliability of the test and the percentage of misclassifications in national curriculum tests. Even assuming a reliability coefficient as high as 0.95, 24 per cent of students would be misclassified at Key Stage 3 (KS3). As the reliability of a test increases the proportion of misclassifications declines, but the improvement is very slow. Further the greater the precision (the more levels into which students are classified), the lower the accuracy. Making tests more reliable Wiliam (2000) argues that, although tests can be made more reliable by improving the items included, and by making the marking more consistent, the effect of such changes is small. The most effective ways of increasing the reliability of a test are to make the scope of the test narrower, or make the test longer (Ebel, 1972). A number of authors (for example, Diederich, 1964; Wiliam, 2000) recommend the following formula for calculating how long a test needs to be to achieve a particular level of reliability.
No. of times test needs to be lengthened =
(The reliability you want) x (1 – the reliability you got) (The reliability you got) x (1 – the reliability you want)
So, if we have a test with a reliability of 0.75, and we want to make it into a test with a reliability of 0.85 we would need a test 1.9 times as long. There have been empirical demonstrations of the effect of increasing the length of the assessment, either by lengthening a question paper or increasing the number of assessments necessary to gain a qualification. Bull (1956) had candidates attempt 4, 8, 16, and 32 questions. As the number of questions rose from 4 to 8 to 16 there were appreciable increases in the correlation between the different marks from a single marker and between the marks of different markers. However, the increase in reliability was due not only to the increased number of questions but also to changes in the nature of the questions as they were shortened to fit the constant duration of the examination. The shorter the time allowed for the candidate to answer
11

the question the more specific must be the question and so the candidates and markers are more likely to follow the expected response. Hill (1978) studied the effect of examination length on inter-marker reliability in BSc Engineering. He simulated the effect of shortening the length of an examination by considering alternative combinations of questions from scripts from genuine full-length examinations which had been multiple marked. As expected reducing the length of the examination increased the effects of marking error. The greater the number of components in the assessment the more likely it is for the random error in the marks for different components to cancel one another, thereby diminishing their total effect. Branthwaite, Trueman and Berrisford (1981) comment that many of the methods of improving reliability, increasing the length of the examination or reducing the number of grades along the scale for example, are based on mathematical devices for artificially reducing the variance rather than psychological techniques for making marking more systematic and objective. They argue that while these ways of reducing unreliability have immediate practical usefulness, it is important to enquire into the basic underlying problem in terms of the causes and reasons why different assessors give different marks. Increasing the amount or length of examinations in the UK is unlikely to be popular. There is already concern that students are over-tested (see Morris, 2004, for example). Wiliam (2000), however, suggests using teacher assessment so that one would in effect, be “using assessments conducted over tens, if not hundreds of hours for each student, producing a degree of reliability that has never been achieved in any system of timed written examinations” (p.3). Houston (1983) discusses the debate about the extent to which teachers’ assessment should contribute to examinations. Using tests to predict future performance As well as certifying achievement, one of the most common uses of tests is to predict future performance. The usefulness of a test for this purpose depends entirely on the correlation between the scores on the test (the predictor) and the scores on whatever one is trying to predict (the criterion). For example, one might, like most universities in the UK, want to use the results of A level tests taken at the age of 18 to predict scores on university examinations taken at 21. The university scores obtained by candidates at age 21 would be compared with the scores the same candidates obtained on the A level tests three years earlier, when they were 18. One would expect to find that those who got high grades in the A level tests got good degree classifications, and those with low grades got lower classifications. However, there will also be some candidates getting high scores on the A level tests that do not go on to do well at university and vice-versa. How good the prediction is (the predictive validity of the test) is usually expressed as a correlation coefficient (validity coefficient). Generally, in educational testing, a correlation of 0.7 between predictor and criterion is regarded as good. Wiliam (2000) points out that it is a mistake to view the validity coefficient as the correlation between true scores on the predictor and true scores on the criterion. Only the observed scores are known and these are affected by the unreliability of the tests. Care is needed in interpreting validity coefficients, because such coefficients are often reported after correction for unreliability in the criterion measure (sometimes known as correction for attenuation). A statistical adjustment is applied to the correlation between the observed scores. Only unreliability on the criterion is corrected for because the observed predictor scores are what is used (the true scores being unknown). The correction allows validity coefficients computed in different
12

circumstances to be compared (in met-analysis, for example). Wiliam shows that validity coefficients that are corrected for unreliability appear to be much better than can be actually achieved in practice. He gives the following example: if the correlation between the true scores on a predictor and a criterion (that is the validity ‘corrected for unreliability’) is 0.7, but each of these is measured with tests of reliability 0.9, the correlation between the actual values on the predictor and the criterion will be less than 0.6. Using tests to select individuals As well as being used to predict future performance, tests are frequently used to select individuals. Wiliam (2000) uses the following example to demonstrate how predictive validity and reliability affect the accuracy of the setting: A test is used to group 100 pupils into 4 sets for mathematics; 35 in the top set, 30 in set 2, 20 in set 3 and 15 in set 4. Assuming that the selection test has a predictive validity of 0.7 and reliability of 0.9, then of the 35 candidates placed in the top set, only 23 should actually be there, the other 12 should be in sets 2 or 3. Moreover, 12 candidates who should be in set 1 will actually be placed in set 2 or even set 3. Only 12 of the 30 candidates in set 2 will be correctly placed there, 9 should have been in set 1 and 9 should have been in sets 3 and 4. In other words, because of the limitations in the reliability and predictive validity of the test, then only half the candidates are placed where they ‘should’ be. Wiliam points out that these are not weaknesses in the quality of the tests but fundamental limitations of what tests can do. If anything, the assumptions made here are rather conservative, reliabilities of 0.9 and predictive validities of 0.7 are at the limit of what can be achieved with current methods. The relationship between reliability and validity Predictive validity is only one of a number of inter-related forms of validity. However, they all address the same issue: “whether what is being measured is what the researchers intended” (Clark-Carter, 1997, p.28). According to classical test theory, the maximum validity for a test is the square root of the reliability (Magnusson, 1967). It is sometimes said that validity is more important than reliability, since there is no point in measuring something reliably unless one knows what one is measuring. On the other hand, reliability is a pre-requisite for validity. No assessment can have any validity at all if the mark a candidate gets varies radically from occasion to occasion, or depends on who does the marking. Cronbach (1951) comments
“Even those investigators who regard reliability as a pale shadow of the more vital matter of validity cannot avoid considering the reliability of their measures. No validity coefficient and no factor analysis can be interpreted without some appropriate estimate of the magnitude of the error of measurement.” (p.179)
Reliability and validity are often in tension. Attempts to increase reliability, for example by making the marking scheme stricter, often have a negative effect on validity, for example because candidates with good answers not foreseen in the mark scheme cannot be given high marks. Another way of increasing test reliability would be to test a smaller part of the curriculum. However, this would be a less valid test of candidates’ knowledge and skills in the subject area and would also provide an incentive for schools to improve their test results by teaching only those parts of the curriculum actually tested. For a given amount of testing time, one can get
13

only a little information across a broad range of topics and this means that the scores for individuals are relatively unreliable. Types of interrater reliability Variation in the marks assigned to an examination script by an individual marker is known as intramarker or intrarater reliability. Variation in the marks assigned to an examination script by different markers is known as intermarker or interrater reliability. Stemler (2004) notes that most research papers describe interrater reliability as though it is a single, universal concept. He argues this practice is imprecise and potentially misleading. The specific type of interrater reliability being discussed should be indicated. He categorises the most common statistical methods for reporting interrater reliability into one of three classes: consensus estimates; consistency estimates; and measurement estimates. Consensus estimates of reliability Consensus estimates of interrater reliability assume that observers should be able to come to exact agreement about how to apply the various levels of a scoring rubric. They are most useful when different levels of the rating scale represent qualitatively different ideas, but can also be useful when levels of the rating scale are assumed to represent a linear continuum of the construct, but are ordinal in nature. Consensus estimates of interrater reliability are often reported as a per cent agreement figure. According to Stemler this has the advantage of being easy to calculate and explain. However if the construct has a low incidence of occurrence in the population, it is possible to get artificially inflated percent-agreement figures simply because most of the values fall under one category of the rating scale (Hayes and Hatch, 1999). Sometimes the definition of agreement is broadened to include the adjacent scoring categories on the rating scale. This can lead to inflated estimates of interrater reliability if there are only a limited number of categories to choose from (a four point scale, for example). This also leads to the per cent agreement at the extreme ends of the rating scale to almost always be lower than in the middle. Another consensus estimate of interrater reliability is Cohen’s kappa statistic (Cohen, 1960, 1968) which estimates the degree of consensus between two judges after correcting for the amount of agreement that could be expected by chance alone. A value of zero indicates that the judges did not agree with each other any more than would be predicted by chance. Negative values of kappa occur if judges agree less often than chance would predict. Unfortunately, the kappa coefficient can be difficult to interpret and values of kappa may differ depending upon the proportion of respondents falling into each category of a rating scale (Uebersax, 1987). Consistency estimates of reliability According to Stemler, consistency estimates of interrater reliability assume that it is not necessary for judges to share a common meaning of the rating scale, so long as each judge is consistent in their classifications. Consistency approaches are most useful when the data are continuous but can be applied to categorical data if the rating scale categories are thought to represent an underlying one-dimensional continuum. Consistency estimates may be high whilst the averages of the different judges may be very different. The most popular statistic for calculating the degree of consistency between judges is the Pearson correlation coefficient. This assumes that the data underlying the rating scale are
14
normally distributed. The Spearman rank coefficient provides an approximation of the Pearson correlation coefficient, but may be used in circumstances where the data are not normally distributed. Cronbach’s alpha coefficient has been discussed earlier as a measure of how well a group of items correlate together. It is also useful for understanding the extent to which the ratings from a group of judges hold together to measure a common dimension. A low Cronbach’s alpha estimate among the judges implies that the majority of the variance in the total composite score is really due to error variance, and not true score variance (Crocker & Algina, 1986). Cronbach’s alpha gives a single consistency estimate of interrater reliability across multiple judges but each judge must give a rating on every case. A disadvantage of these consistency estimates is that they are highly sensitive to the distribution of the observed data. If most of the ratings fall into one or two categories, the correlation coefficient will be deflated. Measurement estimates of reliability Measurement estimates of reliability use all of the information available from all judges (including discrepant ratings) to create a summary score for each respondent. As Linacre (2002) has noted “It is the accumulation of information, not the ratings themselves, that is decisive” (p. 858). It is not necessary for judges to come to a consensus on how to apply a scoring rubric provided that it is possible to estimate and account for differences in judge severity in the creation of each respondent’s final score. Measurement estimates are best used when different levels of the rating scale are intended to represent different levels of an underlying one-dimensional construct. They are also useful when multiple judges are involved in administering ratings and it is impossible for all judges to rate all items (which is normally the case in the marking of examination scripts). Two popular methods for computing measurement estimates of interrater reliability were discussed earlier, that is generalisability theory (Cronbach, Nageswari and Gleser, 1963) and the many-facets Rasch model (Linacre, 1994). Another common measurement estimate of interrater reliability uses the factor analytic technique of principal components analysis (Harman, 1967). Judges’ scores are subjected to a principal components analysis to determine the amount of shared variance in the ratings that could be accounted for by the first principal component. The percentage of variance that is explainable by the first principal component gives some indication of the extent to which the multiple judges are reaching agreement. If the shared variance is high (greater than 60 per cent, for example) this suggests that the judges are rating a common construct. Once interrater reliability has been established in this way, each participant may then receive a single summary score corresponding to his or her loading on the first principal component underlying the set of ratings. This summary score for each participant is therefore based only on the relevance of the strongest dimension underlying the data. The disadvantage of this approach is that it assumes that ratings are assigned without error by the judges. There are several advantages to estimating interrater reliability using the measurement approach. First, measurement estimates can take into account errors at the level of each judge or for groups of judges so the summary scores more accurately represent the underlying construct of interest than do the simple raw score ratings from the judges. Second, measurement estimates effectively handle ratings from multiple judges by simultaneously computing estimates across all of the items that were rated, as opposed to calculating estimates separately for each item and each pair of judges. Third, measurement estimates do not require
15

all judges to rate all items to arrive at an estimate of interrater reliability. Judges may rate a particular subset of items and as long as there is sufficient connectedness (Linacre, 1994; Linacre, Englehard, Tatem and Myford, 1994) across the judges and ratings, it will be possible to directly compare judges. The major disadvantage of measurement estimates is that they require the use of specialized software. A second disadvantage is that certain methods for computing measurement estimates (FACETS, for example) can handle only ordinal level data. Stemler underlines the importance of indicating the specific type of interrater reliability being discussed by demonstrating that it is possible for two judges to have an extremely high consensus estimate of interrater reliability (96 per cent agreement, for example) and at the same time have a very low consistency estimate of interrater reliability (Pearson’s r = 0.39). This is a product of the assumption of the Pearson correlation coefficient that the data are normally distributed. The limitations of the correlation as a measure of reliability The correlation coefficient has been chosen by many researchers as the most suitable way of describing internal consistency estimates of reliability, but as Skurnik and Nuttall (1968) point out, it has many shortcomings. A correlation coefficient can fail to reveal where the characteristics of the underlying distributions of the two variables being correlated are different. Coffman (1971) argues that using the correlation over-inflates reliability because it ignores the means and standard deviations of the scores. As Lunz, Stahl and Wright (1994) demonstrate, even a perfect correlation may ignore systematic differences between raters. This approach also has the disadvantage that the correlations observed will depend on the spread of performance in the sample of scripts under consideration. Skurnik and Nuttall also argue that a correlation coefficient does not convey very much information to the majority of examiners and people who make use of examination results. Researchers such as Skurnik and Nuttall (1968), Cronbach and Gleser (1964), and McVey (1976) have searched for an alternative to the correlation coefficient. Classical test theory offers an alternative and complementary measure of precision to the reliability coefficient - the standard error of measurement (SEM). As discussed, classical test theory regards a mark or score as the sum of a true score and a measurement score. The SEM is the standard deviation of the error component. Although it is less familiar than the reliability coefficient, it has two advantages: it does not depend on the spread of performances studied and is more directly related to the likely error on an individual candidate’s mark. The true mark will be within one standard error of the observed mark 68 per cent of the time and within two standard errors 95 per cent of the time. Skurnik and Nuttall propose the use of the SEM as a measure of reliability. More recently, Cronbach has argued that the SEM is the most important single piece of information to report regarding a measurement instrument (Cronbach and Shavelson, 2004). He argued that this report on the uncertainty associated with each score, is easily understood not only by professional test interpreters but also by educators and other persons unschooled in statistical theory, and also to laypersons to whom scores are reported. It has also been argued that reliability must be defined in terms of how many candidates were graded incorrectly. For instance, William (1993) argues that classification consistency is the only sensible definition of the dependability of national curriculum assessment.
16

When the reliability of marking, rather than the reliability of the assessment as a whole, is being reported, Murphy (1982) argues that the simplest way of describing the amount of variation in candidates’ marks due to different examiners doing the marking, is the average mark change. This measure reports the mean of the variations in the marks awarded to the candidates in an examination. Where the average mark change is expressed out of a fixed amount (say 100) for examinations that have produced similarly spread distributions of marks, then it provides a useful comparative measure of marking reliability. Presumably, Murphy intends that the mean mark variation should be calculated using absolute mark differences; otherwise, the positive and negative mark differences would cancel out and produce a misleadingly low mean mark change. THE UBIQUITOUS RELIABILITY OF MARKING STUDY The reliability of marking has been studied at all levels of education across various subjects and assessment methods. The following section presents only a selection of studies to demonstrate the breadth of research in this area and the typical levels of reliability found. The earliest reported reliability studies focused on the marking of secondary school teachers. Starch and Elliot (1912) conducted a study in which identical copies of a single English test paper were given to 142 English teachers, with instructions to score it on the basis of 100 per cent for a perfect paper. Each teacher looked at only one paper, so no relative basis for judgement was available. The scores assigned to this one paper ranged from 98 to 50 per cent. The difficulties associated with the reliable assessment of English composition have generated many research studies (discussed in detail later). However, Starch and Elliot also reported similarly low levels of reliability in the marking of test papers in geometry (1913a) and in history (1913b). In the 1950s there were a number of studies of the marking reliability of the 11+ selection examination. Finlayson (1951) studied the marking reliability of essays proposed for inclusion in the examination. He found the mark-re-mark correlation for a team of four markers to be 0.94. But he argued that essay reliability is better measured by a test re-test correlation between essays. Re-test reliability was measured by having the children complete two essays, one week apart, which were then assessed by the same markers. The mean test re-test reliability for one marker was 0.69, and for a team of six was 0.86. When the idiosyncrasies of markers as well as the day-to-day fluctuations of candidates were taken into account, as occurs when different markers mark the re-test, the overall reliability of the essay for a team of three examiners was estimated to be 0.79. It is likely, however, that Finlayson’s results exaggerated the unreliability of marking because his examiners were unpaid volunteers, not likely to be as consistent as the experienced examiners paid to mark actual examination scripts (Wiseman, 1956). The extremely variable reliability of marking demonstrated by early studies such as this, triggered vigorous debate but it wasn’t until much later that systematic research studying the causes (and remedies) of unreliability occurred. This research will be detailed in later sections of the report. Marking reliability studies are an important aspect of quality control of an assessment process that affects candidates’ life chances and has implications for teachers and schools. Awarding bodies carry out evaluations of marking reliability of their high stakes examinations. For example, Murphy (1978, 1982) conducted in-depth analyses of the reliability of marking in 20 O and A level examinations sat between 1976 and 1979. Of eight subjects initially studied
17

(Murphy, 1978), the first written paper of the 1976 English A level was the least reliably marked with a correlation coefficient comparing prime with re-mark of 0.73; the second and third written papers fared slightly better with coefficients of 0.85 and 0.76 respectively. In a subsequent paper, Murphy (1982) considered the reliability of marking in English O level between 1976 and 1979; the respective coefficients of correlation for Paper 1 and Paper 2 were 0.75 and 0.91 in 1976, while in 1979 they were 0.76 and 0.93. Murphy stresses that these figures relate to the consistency of marking of individual components. The overall reliability of an examination depends upon the marks aggregated from a number of papers. Thus, although the highest coefficient of correlation for the three components of 1976 English A level was 0.85, the coefficient comparing original subject marks with re-mark subject marks was 0.91. As discussed, increasing the number of components will tend to increase the reliability of marking of an examination. Murphy (1982) also included details of an analysis of the 1977 examinations in O level Mathematics and A level Pure Mathematics. For both of these subjects the correlation coefficients comparing prime with re-mark were very high. Two of the three O level papers had a coefficient of 1.00 (although one of these was a computer marked objective test) and the other had a coefficient of 0.99. One of the three A level papers had a prime to re-mark correlation coefficient of 1.00, another had a coefficient of 0.99 and the third had a coefficient of 0.98. Clearly the standards of reliability were very high for mathematics; in fact it was the most reliably marked of all subjects. It was noticeable that the least reliably marked examinations tended to be those that placed the most dependence on essay-type questions and the most reliably marked tended to be those made up of highly structured, analytically marked questions. The effect of question type and mark scheme on reliability is discussed in detail later. There have also been many studies documenting the reliability of marking across a variety of subjects at Higher Education level. As early as 1936 Hartog and Rhodes found that the agreement between pairs of markers assessing history honours scripts ranged from -0.41 to 0.85 with an average of just 0.44. Assessment reliability was of such concern to the National Union of Students that a report on examinations was commissioned (NUS,1969). The report describes a study where 50 candidates sat a three-hour single-essay paper after which their answers were marked out of 100 by five markers. The average difference in marks for individual scripts was 19. Thus marks could be expected to vary, on average, by nearly 20 per cent dependent on who marked the script. By the 1970s it was clear that marking reliability is dependant on the subject area being assessed. James (1974) investigated the marking of scripts in physics and McVey (1975) the marking of scripts in electronic engineering. They found that in examinations of these kinds, the correlation coefficients between markers were high (usually 0.9 or above). Byrne (1979) described a study undertaken to establish the reliability of tutor-marked assignments at the Open University. Inter-marker reliability was best for assignments in mathematics, nearly as good for those in the physical sciences and physical science based technology and poorest for those in the arts, social sciences and educational studies faculties. Irrespective of the subject area, however, essay questions presented the greatest reliability problem.
18
Concerns with the reliability of marking in Higher Education are not restricted to the UK. Engvik, Kvale and Havik (1970) investigated the marking reliability for the examination system at the Psychological Institute, Oslo. The essay and oral performances of candidates were evaluated by an examination committee of three. Significant differences in the mean score awarded were found both within and between committees. When the same essays were rated within a committee, a wide variation of reliability coefficients was found, from -0.16 to 0.90. Studies of the reliability of marking at Higher Education are ongoing. Laming (1990) examined the marks awarded (blind) by pairs of markers for answers in an unidentified university examination over two years. The correlations between the two marks ranged form 0.47 to 0.72 for one year and from 0.13 to 0.37 for the second. Laming applied classical test theory to estimate the precision of the examination and concluded that for the second year this was insufficient to support the degree classes received by candidates. Dracup (1997) drew a different conclusion from his analysis of psychology degree marking. Combining the different components of assessment for each unit, the correlations between marks awarded by first and second markers ranged from 0.47 to 0.93 for compulsory units. The marks were much more variable for optional units with smaller numbers of candidates. Indeed some of the sets of the marks were not significantly correlated. However, when the marks across all units were averaged, the correlation between the averages of the first and second marks was 0.93 suggesting that the degree classes received by candidates were adequately reliable. The overall performance of the vast majority of students could be expected to be within two per cent of their true scores. Research into assessment reliability has not been restricted to written examinations. There have been studies of the reliability of competence-based assessments, the findings of which are relevant to our understanding of marking reliability in general. For example, Wolf and Silver (1986) studied the reliability of workplace assessment. They examined judgements of business and engineering candidates’ work by a sample of assessors which combined workplace supervisors and specialist trainers. Trainers administered a structured work simulation task to candidates who were ‘ready for assessment’. They then had to judge whether or not the students were competent in the relevant skills. The results demonstrated enormously variable judgements regarding the level of performance at which a candidate should be judged competent even though the assessment criteria were apparently highly prescriptive. Similarly, Clark and Wolf (1991) studied how reliably examiners assessed candidates for ‘Blue Badge Guide’ awards. The inter examiner reliabilities for these competence-based assessments were very variable. While some markers showed very high levels of agreement, for others the correlations dropped as low as 0.16. There have also been relevant studies of the reliability of marking of coursework. Taylor (1992) considered the reliability of marking of GCSE English, History, Mathematics and GCE Psychology coursework. In each subject, previously moderated work was re-marked by two further moderators (thus four marks were available for each candidate: the centre mark, the original moderator’s mark and the marks awarded by the two ‘project’ moderators). In mathematics, despite the fact that coursework is not as highly structured as the traditional written papers, the correlation coefficient between two moderators re-marking coursework folders ranged between 0.91 and 0.97 for different pairs of moderators. The coefficients were similarly high for English, ranging between 0.87 and 0.97. Despite these high coefficients, it was
19

found that if candidates involved in the study were re-graded on the basis of their re-mark scores approximately 20% would have received a different grade but in only one case would the change have been by more than one grade. Alton (1991) was also concerned with comparisons between teacher marks and moderator marks following training courses for teachers on GCSE coursework assessment. In GCSE Art and Design (which had a marking tolerance of 31 and maximum mark 15) 81 per cent of teacher marks were within 2 marks of the moderator mark; in English (which had a marking tolerance of 6 and maximum mark 120) 50 per cent of teacher marks were within 6 marks of the moderator mark; and in Computer Studies (which had a marking tolerance of 4 and maximum mark 60) only 42 per cent of teacher marks were within 4 marks of the moderator mark. Although there have been many studies of marking reliability it is often difficult to draw conclusions about the factors that influence reliability. This is because the studies often vary in so many important respects (the training of the markers, the type of assessment, the mark scheme, the subject/topic assessed and so on). Systematic research manipulating these variables and measuring the resultant effect on reliability is much rarer than descriptive studies reporting the reliability of operational marking. Nonetheless those studies that have been found are drawn together in this report. An important aspect of marker reliability is whether examiners vary in the consistency and severity/leniency of their marking over time. If they do, a candidate’s mark would vary according to when their script was marked. Research into changes in the consistency and severity/ leniency of marking over time are summarised in the next section. CHANGES IN THE CONSISTENCY AND SEVERITY OF MARKING OVER TIME White (1984, cited by Vaughan, 1991) reported on a study conducted at California State University in which two essays were tucked into a huge sample of essays and read a year apart by the same readers using a 6-point scale. The reading a year later produced scores that were identical to the first in only 20 per cent of the cases. The scores differed by one point or less in 58 per cent of cases and 2 points or less in 83 per cent of the cases. As White points out, a 1-point difference is generally considered unproblematic, but on a 6-point scale the difference between a 3 and a 4 is the difference between a pass and a fail. Obviously, then, changes in examiner severity/leniency over-time have implications for maintaining standards, and must be monitored. Research has been conducted into variations in examiner severity/leniency during the marking of a particular allocation of scripts, a marking period, and over more extended periods of time. In the short-term, there are a number of reasons why variations may occur in the way an examiner marks. Morrissy (2000) outlines three possible scenarios concerning changes in examiner accuracy. First, an examiner may be more accurate at the beginning of marking examinations because they have just been trained at the standardisation meeting on the marking scheme. Second, under time constraints, the pressure towards the end of the examination period may detract from the accuracy of marking. Finally, examiners may improve at marking with practice.
1 Awarding bodies take into account the inherent inaccuracy of marking by assigning a marking tolerance limit to each question paper. If the difference in marks awarded to a script by assistant and senior examiners is within the tolerance limit, the marking is deemed accurate.
20

The way in which an examiner responds to feedback may also help explain variations in their marking over time. Pinot de Moira, Massey, Baird and Morrissy (2001), for example, investigated marker reliability in A level English scripts during the Summer 2000 marking period. Although, for the majority of examiners feedback from the senior examiner failed to influence future accuracy, for a small number who began with extremely lenient or severe marking there appeared to be an ultimate decrease in marking accuracy over time. Pinot de Moira et al suggested that these examiners may fail to respond to feedback or that they may over-compensate for inadequacies highlighted in initial checks. Pinot de Moira (1999) reported that re-marking checks on examiner accuracy performed late in the marking period (and unbeknownst to the examiner) sometimes contradicted the conclusions that had been drawn from earlier re-marking checks. In other words, an examiner who was considered lenient early in the marking period was sometimes considered severe later on (or vice versa). This could be caused by over-compensation for severity/leniency highlighted in the early checks. Farrell and Gilbert (1960) argued that the variance of the marks an examiner awards will increase relative to the number of scripts he or she has already marked because of either growth in confidence or examiner fatigue. They tested the hypothesis that the more scripts an examiner marks the more likely he or she will be to award extreme marks. The undergraduate scripts were marked in alphabetical order, so it was predicted that extreme marks would occur most frequently in the later part of the alphabet. Unfortunately, Farrell and Gilbert only had access to the classification awarded to the scripts rather than the mark. They categorised the classifications as being either central (upper second, lower second and third class) or extreme (first class or below third class). Each candidate being classified according to whether his or her grade was extreme or central, and whether the initial of his or her surname came before L or after K in the alphabet. A small but highly significant effect of the sort predicted was found. Morrissy (2000) also investigated whether the standards of examiners’ marking tends to fall near the end of the marking period using re-marking data from GCSE English and Geography, and GCE English and Theatre Studies. The study concluded that there was no evidence of an important effect upon marking reliability arising from the point when a script is marked in an examiners’ allocation or the size of the allocation itself. There was no evidence of changes in the leniency or severity of marking over time. Similarly, Pinot de Moira, Massey, Baird and Morrissy (2001) found there were only minor changes in the relative leniency or severity of examiners over the period of marking summer 2000 GCE English scripts. The relative stability of examiners’ tendency to mark leniently or severely has been documented elsewhere. Lunz and Stahl (1990a) used an extended Rasch model to determine whether there were inter-judge differences in reliability between examining sessions. They found that even though judges differed in their severity, most judges were fairly consistent in their level of severity regardless of candidate attributes. In a later study, Lunz and O’Neil (1997) considered the effect of judge leniency and consistency across a ten-year period. They discovered that the judges were predominately consistent in their personal level of leniency across examination sessions and that the examiners maintained their level of leniency, regardless of retraining before each relevant session. In spite of claims that examiners remain internally consistent in their degree of severity/leniency over-time (Morrissey, 2000; Pinot de Moira et al, 2001; Lunz and Stahl, 1990a; Lunz and O’Neil,
21

1997) there is a substantial body of research which suggests otherwise. Coffman and Kurfman (1968) found that raters of history papers were more severe on the second day of marking than the first. Myford (1991) found that three groups of judges of secondary school students’ dramatic performances with varying levels of expertise (buffs, experts and novices) all showed significant changes in severity over a period of one month. The amount of change for buffs was nearly twice that for experts, while the amount of change for novices was nearly twice that again. Over a twenty month period, Lumley and McNamara (1995) investigated three sets of ratings for a test of spoken English. They found significant changes in rater severity and interactions between rater severity and rating set. In an investigation of ratings from three administrations of an oral certificate examination in the health profession, Webb, Raymond and Houston (1990) reported a moderate positive correlation in relative severity between years for two groups of raters, but noted that for approximately 20 per cent of the raters there was a high degree of change between years. It is common practice that candidates’ marks are adjusted to account for any inconsistencies in examiner severity (this practice is discussed in detail later in the report), but this is undermined if examiner severity varies across the marking period. Research conducted by Congdon and McQueen (2000) casts doubt on the most prevalent method used for making such adjustments – adjustments based upon a single calibration of examiner severity. The stability of the severity of 16 examiners of writing was investigated. Each piece of work was rated by two trained examiners over a period of seven days. Scripts marked on the first day were re-marked at the end of the marking period. There were significant differences between examiners within each day and in all days combined. Daily estimates of the relative severity of individual examiners were found to be different from single on-average estimates for the whole rating period. For ten examiners severity estimates on the last day were significantly different from estimates on the first day. Lunz and Stahl (1990a), in their investigation of inter-judge differences in reliability between examining sessions, suggested an alternative method for overcoming variations in rater severity. Data from three different examinations (an English Literature essay examination, a clinical examination and a Health profession oral examination) had shown that raters demonstrated significant instability in severity in two of the three, over grading periods ranging from one to four days. They argued that short-term effects such as fatigue and attitude may have accounted for the observed changes, and that this normal human behaviour cannot easily be eliminated. They showed that Rasch techniques could be used to account for these changes and remove their effects from candidate measures so that no candidate is unfairly penalized. In a later study, Lunz, Stahl and Wright (1996) used Rasch analysis to calibrate rater severity to control some of the subjectivity inherent in judgement. This calibration assumed that judge severity is consistent across candidates of varying ability. Judges attended a three-hour training session designed to review the rating criteria. The examination was in histotechnology. Candidates had to prepare tissue slides which were judged on a four point scale. There were significant differences in judge severity even when the ability of the candidates was controlled. Lunz et al concluded from this “Judges cannot be trained, cajoled or coerced into judging with exactly the same severity” (p.111). The pattern used by judges for awarding rating points was generally comparable regardless of candidate ability. Lunz et al pointed out the usefulness of adjusting candidate ability measures so that they become ‘judge-free’. They generalise beyond particular judge/candidate interactions so that the objectivity and fairness of the examination is
22

improved. They suggested that it may be possible to equate examinations that require judges by anchoring on the severities of predictable judges. Research evidence as to the degree to which the leniency/severity of examiners’ marking varies over time is contradictory. If there is significant variation in marking leniency/severity it renders simple adjustments to examiners’ marks inappropriate. Fortunately, statistical methods exist that can help to detect and eliminate the effect of changes in severity/leniency from the final marks candidates’ receive. The next section of the report discusses sources of bias in marking and attempts to remove such bias. SOURCES OF BIAS IN MARKING When an examiner marks a candidate’s script a number of biases can come into play. These biases can be seen as stemming from several sources, the standard of the script relative to others in the marking allocation (contrast effects), the text of the script itself, the candidate, or the examiner. There are a number of problems associated with gauging the extent of bias in marking. A major difficulty is that there is usually no objectively correct mark (or true score) against which the one awarded can be compared; nor is there any easy way of assessing markers’ prejudices and seeing how these relate to marks given (Newstead and Dennis, 1990). Nonetheless marking biases have been a fertile ground for research. It is only possible to say whether bias will affect reliability if its context is known. For example, if only one person marks all scripts, applying an equal bias to all scores the reliability is unaffected, but if he or she is one of a number of markers who apply different biases, the reliability is lowered. Contrast effects The mark awarded to a script has been shown to be influenced by the standard of the immediately preceding scripts. Such contrast effects have been described in a number of marking exercises. Hales and Tokar (1975) report that student teachers marked two essays of average quality significantly lower when they followed a block of five good essays than five poor essays. Hughes, Keeling and Tuck (1980a and b) found that good and poor essays were less susceptible to contrast effects than were average quality essays. They also found that contrast effects tend to disappear after a number of essays have been marked. Hughes et al believed that by this time marking standards had become established and consequently markers were less susceptible to contrast effects. Daly and Dickson-Markman (1982) argued that both the Hales and Tokar (1975) and Hughes et al (1980a and b) investigations were limited by the absence of adequate control groups for comparison – that is a rating of the criterion essay by itself, unaffected by other papers and a rating of the criterion essay following a block of papers of variable quality. Their study included these conditions and replicated the finding that ratings of the criterion essay differed as a function of the quality of the previously read papers. Spear (1996, 1997) also found that good work tended to be assessed more favourably when it followed work of a lower standard than when it preceded such work. Poor quality work was assessed more severely when it followed work of higher quality. Spear sought to improve the design of previous studies of contrast effects by having practising teachers mark genuine work (scientific reports). She argued that the marking of this kind of material should be more objective than that of essays, potentially making contrast effects less likely. Nonetheless she found
23

evidence of contrast effects arising when just two samples of work of contrasting quality preceded a criterion report. Two samples of work preceding a report of a contrasting quality produced greater biasing effects than a single sample. Spear concluded that the commonly adopted practice of reading through several pieces of work before commencing to mark is probably insufficient to prevent contrast effects biasing the marks awarded to the first few pieces of work. Vaughan (1991) provided qualitative evidence of contrast effects. She had raters read through and holistically grade essays whilst verbally commenting into a tape recorder. Analysis of the transcribed tapes revealed a tendency for the essays to become one long discourse in the rater’s mind. Raters made comparative statements such as “This essay is better/worse than the previous one or than other” as they read. Hughes et al (1980b) use the term ‘context’ rather than ‘contrast’ effect. They investigated the influence of marking method and context essay position on essay marking. It had been predicted that analytic marking procedures would be superior to holistic marking procedures in terms of reducing context effects. Whilst analytic marking requires examiners to adhere to strict guidelines regarding weightings to be awarded for particular essay features such as writing style, originality of ideas, grammar and so on, in holistic scoring the marker need only make a single global judgement. In terms of context essay position, it was felt that having markers read and grade several essays varying in quality before exposure to the context block of essays would reduce context effects. Hughes et al found that both marking strategies were equally susceptible to context effects. Similarly, placing the block of context essays late in the series of essays to be marked did not diminish context effects in comparison with placing the block of context essays early in the series. In a later study, Hughes et al (1983) sought to eliminate context effects by explicitly warning markers about their influence and also requesting that markers categorise essays qualitatively before re-reading them and awarding final grades. The results of these procedures were compared with those obtained by markers who were merely warned of the existence of context effects and with those obtained by markers who were given no information about the influence of context. Results showed that all three groups were influenced by context and to about the same extent. In a final attempt to control context effects, Hughes and Keeling (1984) provided markers with model essays. Context effects persisted despite the use of model essays during marking. Although the possibility remains that the provision of models may lessen the influence of context on the marking of essays in subject areas where factual accuracy rather than written communication is being assessed, Hughes and Keeling (1984) concluded that where written expression is the primary focus of assessment “we may be forced to accept context effects as an unavoidable concomitant of essay scoring” (p. 281). Contrast or context effects have clear implications for the way in which awarding bodies organise the marking of examination papers. Within AQA, for example, examiners are instructed to mark one centre at a time and, as far as possible, to mark in numerical sequence of centre and candidate numbers. While these instructions attempt to remove any element of choice from the marking sequence, neither centre number nor candidate number is allocated randomly. Centre number is assigned regionally and candidate number is assigned by the centre. Since there is evidence to suggest that contrast effects are greatest at the beginning of the marking exercise, reading a good range of scripts in advance might minimise the problems experienced. The marking standardisation meeting required by the code of practice (QCA,
24

ACCAC, CCEA, 2005) may facilitate such familiarisation, although Pinot de Moira (forthcoming) suggests that this isn’t the case. The text of the script Evidence suggests that the marks teachers’ award to pupils’ work is at times influenced by the neatness of the handwriting (James, 1927; Shepherd, 1929; Hartog and Rhodes, 1936; Briggs, 1970 and 1980; Bull and Stevens, 1979). Whereas good handwriting enables the teacher to discern easily what the pupil is trying to communicate, poor handwriting makes the task of reading rather more difficult (Bull and Stevens, 1979). James (1927) found that teachers gave higher grades to an essay written in good handwriting. Sheppard (1929) discovered a similar tendency for essays written in good handwriting to be assigned higher grades. Forty years on, Chase (1968) again observed quality of penmanship to have a significant influence upon the marks awarded to essays, as did Briggs (1970). In 1980, on the basis of evidence from an experiment where practising teachers of English marked copies of 16+ external examination scripts which had been rewritten in five different handwriting styles, Briggs went so far as to suggest that handwriting may make the difference between some 16-year-olds passing or failing the 16+. In 1976, Markham conducted an experiment to investigate the influence of handwriting quality on teacher evaluation of written work. Each of 45 teachers and 36 student teachers rated descriptive paragraphs varying in quality of content and quality of handwriting style. Multiple Classification Analysis2 indicated that neither the teacher characteristics of experience, level taught, degrees held and age, nor the student teacher characteristic of level taught had a significant influence on the score given to a paper. Yet analysis of variance indicated that the variation in scores explained by handwriting was significant. Papers with better handwriting consistently received higher scores than did those with poor handwriting regardless of content. The effect of poor handwriting on examiners’ assessments of written performance is paralleled by an effect of recording quality examiners’ assessments of speaking performance. McNamara and Lumley (1993) studied examiners’ ratings of candidates’ performance of a speaking test. Tapes perceived by examiners as being imperfectly audible were rated more harshly than perfectly audible tapes. It appears that handwriting bias is not uniform, but interacts with other variables, such as gender and attractiveness of the student as evidenced photographically. In a study conducted by Bull and Stevens (1979), an essay which was identical in content was assessed by 72 raters (mostly school teachers, but some students). Some of the assessors received the essay in typed form, for some it was written in good handwriting and for some the handwriting was poor. A photograph of the supposed author of the essay was attached to the essay. This photograph was of a male or a female who was either highly physically attractive or rather unattractive. It was found that when the authors were female the ratings given to the essays were affected by the factors of penmanship and attractiveness. No such effects were found if the authors were male. In an attempt to interpret their findings, Bull and Stevens comment that
“It is possible that society expects females to have better handwriting than males and so when a female has poor handwriting the resulting
2 MCA is a computer program which allows examination of relationships between several predictor variables and a dependent variable
25

impression created is poor. Similarly perhaps women are judged more on attractiveness than are men.” (p. 58)
As one would anticipate, then, good handwriting appears to benefit pupils in terms of the marks they receive for their written work, and handwriting bias is further influenced by gender and attractiveness. There is substantial evidence that other variables intrinsic to the written work of pupils, such as essay length (Hall and Daglish, 1982) and spelling and grammar (Chase, 1983) influence the marks that teachers assign. Stewart and Grobe (1979, cited by Vaughan, 1991) concluded from their study of teacher-markers that the raters were primarily influenced by “the length of the composition and their freedom from simple mechanical errors” (p.214). Hall and Daglish (1982) also found a significant interaction between grade awarded and length of an essay from an end-of-year examination in a first year undergraduate Education course. Chase (1983) compared scores on two essays, each correct in spelling and grammar, but one constructed to be at a difficult reading level, the other at a less difficult level, but with a common text base, to see how different levels of conventional readability influence essay test scores. Although the readers were all graduate students who had experience with reading material that ranged in difficulty, the essay written at a difficult reading level was scored lower than the essay written at an easier reading level. Chase concluded that variables that complicate the reading of an essay, spelling errors, grammar errors, poor handwriting and so on, reduce the marks assigned to the work. Massey (1983) explored whether these text effects are confined to teachers’ marking or whether they also affect the marking of experienced examiners (from the University of Oxford Delegacy of Local Examinations). He studied the effects of handwriting, complexity and accuracy of prose, the length and bulk of answers, and the number of quotations used on marks awarded by A level English Literature examiners. Untidiness, prose complexity and prose accuracy were unrelated to the marks given. The number of quotations employed, length and to a lesser extent, bulk were positively correlated with marks awarded. The results suggested that examiners were successful in avoiding the danger of crediting candidates for presentation rather than content, contrary to some previous research. Massey pointed out, however, that it is possible that teams of examiners in different subjects, at different levels, or from different boards, are more highly selected, better trained or more experienced than others. Hence, these findings may not be generalisable. In another awarding body-based study, Baird (1998) also found no evidence of bias related to handwriting style in AQA examiners’ marking of A level Chemistry and English Literature scripts. On balance the evidence suggests that experienced examiners are not susceptible to the biasing effects of handwriting style and presentation. The well-defined marking schemes and good community of practice brought about by well-managed standardisation meetings, found in today’s public examinations might reduce the effects of presentational style. Nonetheless, one obvious countermeasure to allay concerns over the effects of handwriting style and presentation on the marks awarded is to have candidates type their work where possible. There is evidence, however, that assessors judge typed scripts more harshly than handwritten scripts (Arnold, Legas, Pacheco, Russell and Umbdenstock, 1990; Bridgeman and Cooper, 1998; McGuire, 1996 cited in Craig, 2001; Peterson and Lou, 1991 cited in Craig, 2001; Russell, 2002; Sweedler-Brown, 1991, 1992; The Scottish Examination Board, 1992).
26

Craig (2001) investigated the issue of handwriting quality and word-processing as biasing factors in English as a Second Language testing. Four expert raters rated 40 essays, 20 original and 20 transcribed in either messy or neat handwriting or on a word processor. Word processed essays were scored lower than their handwritten counterparts. There was no effect of handwriting legibility. The candidate Research has shown that examiners can be influenced in their judgements by characteristics of the candidate, as well as order of marking and script presentation (see Wade 1978). Such characteristics include gender, race, social class, physical attractiveness, and attractiveness of Christian name. Since this is a review of the marking reliability of external assessment, those characteristics that may be pertinent to this marking environment will be emphasised here. Gender bias The largest body of literature concerning bias as a function of candidate characteristics relates to gender bias in marking. Examiners can readily identify the gender of candidates from their names, and hence bias can be easily activated. One of the first studies to stimulate research into gender bias in assessment was conducted by Deaux and Taynor (1973). They asked psychology undergraduates to evaluate the interview performance of applicants for a study abroad programme. Two competent applicants (one male and one female) and two less competent applicants (one of each sex) were judged. The competent male was judged as more competent than his female counterpart, but the less competent male was judged as a worse candidate than the less competent female. In contrast, Jacobson and Effertz (1974) observed a strictly pro-female bias - female leaders were rated as more competent than males, even though their performance was the same. Goddard-Spear (1984) had science teachers assess a piece of work on the subject of distillation. Half of the scripts were originally written by boys and half by girls but they were randomly allocated a gender in the study. Scripts were rated higher if they were perceived to have been written by boys. On the other hand, in a series of studies in higher education Newstead and Dennis (1990) found that second examiners didn’t mark men’s projects more severely than women’s. Where there were disagreements between examiners, men were more likely to have their marks raised than were women, but this difference didn’t reach significance. In these studies the teachers used relatively subjective rating scales rather than detailed marking schemes such as those used by GCSE and A level examiners, making generalisation of the studies findings to the latter scenario difficult. The Scottish Examination Board (1992) investigated marker practices in non-science subjects: English and History. As part of a controlled experimental design, examiners were sent scripts that varied in terms of the achieving record of the centre, the handwriting on the script, candidates’ gender and ethnicity. The only significant effect found in the English scripts was that typewritten scripts scored a lower mean mark than the handwritten ones (thought to be caused by candidates not using the spell check facility). For the History scripts those attributed to females were awarded more marks than those attributed to males. Perhaps girls were evaluated more highly because History is often assessed by essays and girls are thought to be better at extended writing (Punter and Burchell, 1996). It seems that gender bias is subject specific. Indeed in a study of Polish undergraduates, Ciechanowicz (1983) found that personal narrations were rated more highly when they were perceived as female rather than male. However, material described as ‘crude political
27
propaganda’ was given lower ratings when it was perceived as female authored than when it was male authored. One might expect interactions between perceived gender of the writer and subject matter for subjects which are viewed as masculine or feminine. Greatorex and Bell’s (2002a and b) research represents an extension of typical sex bias studies. They investigated not only whether male and female examiners respond differently to the scripts of candidates of different sexes, but also the relationship between the self-perception of masculinity and femininity (gender) of examiners and their marking of male and female examinees. Candidates’ marks and examiners were used from three GCSE subjects; English, History and Design and Technology. All examiners completed the Bem Sex Role Inventory - a self-reported measure that indicates the extent to which respondents are sex-typed. There were only two significant findings, both in relation to English. Firstly, one item on the paper was biased by 0.5 of a mark in the favour of girls. Secondly, the status of the examiner was a significant factor, the more senior the examiner the more generous the marking. Greatorex and Bell concluded that question papers should continue to be scrutinised for male/female friendly questions, and that differences in the severity and leniency of marking are attributable to factors other than the examiner’s sex and gender and/or the candidates’ sex. The greatest source of variance in this study was the candidates’ achievement, which is as it should be. There is evidence to suggest that mere knowledge of a candidate’s name, regardless of the candidate’s sex can lead to bias. McDavid and Harari (1973) and Harris (1975) both found that name stereotypes can influence the marking of essays. Erwin and Calev (1984) examined the influence of both evaluator and pupil name stereotypes on the marking of children’s essays. Evaluators marked six essays each supposedly written by a different pupil. They found that attractively named evaluators gave the children’s essays higher marks than did the unattractively named evaluators. Unattractively named pupils received lower marks than unnamed pupils who in turn received lower marks than attractively named pupils. There did not appear to be any interaction effect between the evaluator’s self-applied name stereotype and the name stereotype applied to the pupils. Erwin and Calev commented that it is reassuring to know that the accentuation/depression of marks on written work can be overcome by ensuring the anonymity of the candidate. Somewhat less easy to control, however is the bias on the evaluator’s essay marking which is due to his or her own name stereotype. It is unlikely that the unusual examiner recruitment practices suggested by these findings will be instigated until these findings have been replicated. As suggested by Erwin and Calev, one simple way in which gender bias and the effect of name stereotypes in marking could be reduced is by not providing the candidate’s name on the script - that is ‘blind marking’. Blind marking has been advocated by many (Fitz-Gibbon, 1996, for example). There is evidence, however, that a person’s gender can be distinguished from their handwriting (McCullough, 1987). Baird (1998) found examiners could identify the gender of candidates from their handwriting style with an accuracy rate of 75 per cent. This has lead to reservations about the effectiveness of blind marking for completely eliminating gender bias (Archer and McCarthy, 1988). Belsey (1988) looked at the degrees awarded in the Arts faculty at University College, Cardiff, before and after blind marking was introduced across the Faculty. In the English Department, before blind marking was introduced 27 per cent of women got ‘good’ degrees (firsts and upper seconds) compared to 45 per cent of the men. After blind marking was introduced, the figure for women jumped to 47 per cent, while that for men stayed almost the same at 42 per cent. For the three years following the introduction of blind marking, women obtained 50 per cent good
28

degrees, men 61 per cent; a male superiority, but less marked than that which obtained prior to blind marking. Belsey, however, argues that the apparent affects of blind-marking may not be as impressive as they first appear. The relative improvement of women may have been due to general improvement in performance coupled with lower variability in performance amongst females - the introduction of blind-marking simply being coincidental. Bradley (1984) studied the usefulness of blind-marking in eliminating bias in the marking of undergraduate projects. The projects were marked by a project supervisor who knew the students and then by a second examiner who was less familiar with the students, but who did know their names and therefore their gender. In four university departments that used this procedure, the second examiner marked the men’s projects more extremely than the women’s. However, in a polytechnic department where the second examiner was unaware of the student’s gender no sex bias occurred. Bradley concluded that greater knowledge of the student will reduce sex bias. Baird (1988) questioned this conclusion, commenting that summary data giving overall marks for projects for males and females would have been useful since males may have gained better marks from the first examiners too. Bradley also concluded that blind marking eliminated gender bias in second examiners. Baird (1988) conducted two experiments on blind marking in A level Chemistry and English literature. In each study presentation (and not the content) of thirty scripts was varied. Scripts were presented blind or non-blind, with a male or female name, and ‘male’ or ‘female’ handwriting. Baird found no consistent evidence of gender bias in the marking of scripts. Marks were not affected by the gender of the name on the scripts nor by the gender style of the handwriting on the script. Therefore, the blind marking procedure had no effect on the marks. A later study conducted by Newstead and Dennis (1990) revealed similar findings. A comparison was made of marks in institutions using blind and non-blind marking, and no effect of the marking procedure was identified. The standard deviations for females’ marks were higher whether blind marking was used or not. Baird (1988) has argued that the tightly defined marking schemes used at A level leave little room for sex bias, whereas those used by Goddard-Spear (1984) or in universities (Bradley, 1984) may lack sufficient specificity. Lenney, Mitchell and Browning (1983) demonstrated the effect of clear evaluation criteria on sex bias in judgements of performance. Male and female undergraduates evaluated a performance that was attributed to either a man or woman (a written intellectual test of creativity, concept grouping and reasoning, and an artistic craft). Participants followed either clear, explicit evaluation criteria or vague, ambiguous criteria. Female participants judged the females’ performance less favourably than the males only when criteria were vague. Male participants showed little evidence of sex bias regardless of the criteria they followed. Clear marking criteria leave less room for marking biases to operate because it is more difficult to justify any differences ascribed to the groups being evaluated. The value of blind-marking for eliminating bias and subsequently improving marker reliability seems questionable. Whilst in some studies the simple method of blind-marking seems to have overcome sex bias, in others it seems to have had no effect at all. Recently, a feasibility study of anonymised marking in GCSE English, conducted by Baird and Bridle (2000) concluded that concealing candidates’ names from examiners is far from a panacea for marking bias, as handwriting style, the content and the style of the language used reveal personal characteristics of the candidates. Perhaps a more effective solution for gender bias in marking would be to provide examiners with detailed evaluation criteria.
29
Ethnic bias Babad (1980) revealed the possibility of ethic bias in marking. A primary school child’s handwritten work sheet was attributed to a gifted or non-gifted child with either a high (European) or a low (Moroccan) ethnic status. Grades given to the worksheet varied as a function of the ability label and to a smaller extent as a function of the interaction between ethnic and ability labels. The participants in the research were not, however, teachers or experienced examiners. Fajardo (1985) examined the relationship between author race and essay quality on the rating of essays by teachers and student teachers. The raters were provided with a booklet containing four pre-selected and pre-rated essays: one poor, two moderate, and one excellent. Each essay was accompanied by a bogus admission form, an essay rating scale, and a class assignment form. The raters tended to use “reverse discrimination” in rating black authors higher than authors whose race was not indicated. Interestingly, reverse discrimination was found to be greatest for the moderate essays. Fajardo argues that the practice of reverse discrimination is potentially harmful for minority students, as it is essentially providing them with false information and may be indicative of less appropriate education than other students. Whether experienced examiners using tightly defined marking schemes (such as those employed by awarding bodies) are susceptible to such ethnic bias has yet to be explored. The examiner One way in which the examiner may represent another source of bias is that his or her personal ideological stance may influence the scores that candidates receive. Husbands (1976) questioned the assumption that there is a single ideal (or true) mark for a candidate that would be awarded by the ‘perfect examiner’. He suggests that some amount of bias is inevitable because of fundamental and perhaps legitimate disagreements between some examiners about what constitutes the ideal in their subject - what he calls ‘ideological bias’. He found bias in the marking of 15 undergraduate essays by some, but not all, 11 examiners from a social science department. Husbands also found some evidence of an interaction between the ideological stance of the examiner and that presented in the examination answer. Husbands studied marking in Higher Education. It is likely that the tightly prescribed mark schemes and standardisation of examiners removes the effect of ideological bias in GCSE and A level marking, for example. Examiner background A number of studies have attempted to identify factors which might allow awarding bodies to predict those examiners who are likely to mark most reliably and those who are likely to require additional training or monitoring. The quality assurance measures in place for examiner recruitment currently assume that good practice requires experienced examiners. The code of practice (QCA, ACCAC, CCEA, 2005) demands that examiners must have relevant experience in the subject but does not explicitly discuss the nature of this experience. The recruitment practices of awarding bodies suggest that three years’ teaching in a relevant subject area is desirable. With the proliferation of examining and the introduction of computer-based assessment, the search for a definition of ‘relevant experience’ has taken on new importance. Examiners are in short supply and e-marking technology has provided the facility for individual items within an examination to be marked separately, by individuals with different backgrounds. Investigations of the relationship between individual differences and marker reliability are crucial in determining examiner recruitment practices.
30
There are a number of studies which suggest that compared to experienced markers; inexperienced markers tend to mark more severely and employ different rating strategies (Ruth and Murphy, 1988; Huot, 1998; Cumming, 1990; Shohmy, Gordon and Kraemer, 1992; Weigle, 1994, 1999). Ruth and Murphy (1988) reported a study that revealed a tendency for more severe marks for essays from trainee teachers compared to those from experienced markers, though the differences were not significant. They suggested that the markers’ background determined distinctly different frames of reference for judging the essays. Similarly Weigle (1999) reported that inexperienced examiners were more severe than experienced examiners. She found that prior to training, inexperienced markers could be significantly more severe than experienced markers depending on the essay title, but after training the differences in severity disappeared. She suggested that her results “underscore the complexity of the relationship between rater background, the scoring rubric, the prompt, and rater training in writing assessment.” (p.171) Myford and Mislevy (1994) studied the Advanced Placement examination in Studio Art. They attempted to identify background variables, including years of teaching experience, which might predict marker severity but found that the variables studied had a negligible impact on predictions of marker severity. Further, Meyer (2000a, 2000b) found that length of examiner experience and a senior examiner’s rating of the examiner’s performance (from A - consistently excellent, to E - unsatisfactory not to be re-employed) rarely proved useful as predictors of whether an examiner’s marks would require adjustment. There is some evidence of an association between marker experience and severity, but the evidence of an association between marker experience and marking consistency is more inconclusive. Michael, Cooper, Shaffer and Wallis (1980) compared marks of two English essays given by university professors of English (defined as expert markers) and professors of other disciplines (defined as lay markers). The reliability indices were slightly higher for marks provided by either individual experts or pairs of experts than for those provided by lay readers or pairs of lay readers, but the differences were small enough for the authors to conclude that the reliability of the two groups was nearly comparable. Differences in reliability were greater between essay questions than between the types of marker suggesting that reliability was more a function of the type of question or of variations in the average ability level of the examinee samples than of the expertise of the markers. This pattern of findings was repeated for measures of concurrent validity3 of the essay evaluations. Expert markers’ evaluations had slightly higher validity than those of lay markers, but the variation in validity associated with the different essay questions were far greater. Shohamy, Gordon, and Kramer (1992) studied marker reliability in the assessment of English as a foreign language (EFL) among markers (raters) who were either professional, experienced EFL teachers or lay people (native English speakers). Half were trained in one of the three marking procedures used (holistic, analytic and primary trait scoring). Relatively high interrater reliability was achieved by the four groups of markers (trained/professionals, untrained/professionals, trained/lay and untrained/lay), irrespective of their training, but the overall reliability coefficients were higher for trained raters than they were for the untrained ones.
3 As assessed by three criterion measures: Diagnostic Test of Written English; Test of Standard Written English; and grade point average across all college or university courses.
31
In this study training appeared to have significant effect on marking, but no such effect was found for markers’ background. This was consistent across all three of the marking procedures used. The findings of this study suggested that raters are able to rate reliably, regardless of background and training. However, reliability improved substantially when raters received intensive procedural training. As Shohamy et al note,
“the practical implication of this finding is that decision makers, in selecting raters, should be less concerned about their background, since that variable seems not to increase reliability. More emphasis, however, should be put into intensive training sessions to prepare raters for their task.” (p. 31)
In another study of English assessment, Lumley, Lynch and McNamara (1994) had doctors and trained Occupational English test raters rate the overall communicative effectiveness of 20 candidates taking the Occupational English test. There was no difference between the two groups of raters in terms of leniency, if anything the doctors were slightly more lenient. In general all but one of the doctors interpreted the scale consistently with the experienced raters. Brown (1995) investigated rater background factors in assessment on the Japanese Language test for Tour Guides, an oral test measuring Japanese Language skills of Australian tour guides. Assessors were either from the tourist industry (this was preferred) or they were experienced teachers of Japanese as a foreign language. Overall the occupational background had no effect on rating consistency or severity. There was, however, greater variability in levels of severity among the non-teacher group. There were also differences between the groups at the level of particular criteria: teachers were harsher in ratings of grammar, expression, vocabulary and fluency, whereas industry raters gave harsher ratings of pronunciation. There was also some variation in severity across task type and in the way raters interpreted the ratings scales, for example teachers were less prepared to award very high or low scores. Nonetheless, the differences were not such as to suggest that the two groups differed in their suitability as raters. Ecclestone (2001) carried out a case study of nine university lecturers who double-marked 45 dissertations between them over two years. Discrepancies between grades were moderated at a one-day moderation meeting, and the external examiner saw a sample of dissertations. Rough distinctions between the lecturers were made according to length of experience in assessing the programme and of other degree and Masters’ level work. The lecturers were classified as novice, competent or expert markers. Following moderation the novices had fewer changes to their marks than the competents and experts, with the competents having more than the other two groups. However, experts had more changes which resulted in the degree grade being altered by a whole degree class while competents had more changes to their marks but within the same degree classification. The National Foundation for Educational Research (NFER) conducted an online marking pilot for Year 7 Progress Tests in mathematics and English. They considered, among other issues, the effect of using unskilled and semi-skilled examiners to mark specifically chosen items (Whetton and Newton, 2002). The data suggested that with some intervention by supervisors, this strategy could be technically effective. A similar, though less extensive, pilot study was undertaken by AQA in the marking of GCE Chemistry (Fowles, 2002). The focus of the study was the reliability of e-marking in comparison with conventional making. The results suggested that, with carefully chosen items, clerical marking could provide a reliable alternative to the use
32

of experienced examiners. Pinot de Moira (2003a) studied the relationship between examiner background and marking reliability across seven GCE subjects. She defined reliability as the difference between senior examiner and assistant examiner mark; the absolute difference between senior examiner and assistant examiner mark; whether an adjustment had been made to the assistant examiner’s marks and a rating of the examiner’s performance (from A - consistently excellent, to E - unsatisfactory not to be re-employed). She found that the composition of an examiner’s script allocation in terms of centre type had far more influence on accuracy than accessible aspects of an examiner’s background, such as years since appointment. The only personal characteristic found to be significant in explaining examiner reliability was the number of years of marking experience. Royal-Dawson (2004) pointed out however that this characteristic was confounded because reliable examiners are engaged year after year and poor markers are not, so quality of marking and length of service are not mutually exclusive. Royal-Dawson (2004) explored whether it is necessary for a marker of Key Stage 3 English to be a qualified teacher with three years’ teaching experience. She examined the marking reliability of four types of markers with an academic background in English but different amounts of teaching experience: English graduates, PGCE graduates, teachers with three of more years’ teaching experience and experienced examiners. Reliability was defined in a number of ways: the correlation between the marks awarded to the 98 scripts by the Lead Chief Marker and the marker; the agreement between the levels assigned to a pupil by a marker compared to those assigned by the Lead Chief Marker; the frequency of administrative errors. Overall there was little difference in the marking reliability of the different types of marker. There were more or less accurate markers in each of the groups, but no group had more or fewer accurate markers than any other. Marking reliability as defined by the correlation between each marker and the Lead Chief Marker indicated that some teaching experience was a contributing factor to higher reliability estimates on some tasks but not on others. There was no difference in lenience or severity between the marker groups except on a sub-test for reading where the experienced markers were more lenient than the other marker groups. Royal-Dawson concluded that the criterion of teaching experience could be relaxed to allow markers with graduate-level subject knowledge to mark Key Stage 3 English tests. Powers and Kubota (1998a) investigated whether individuals not involved in post-secondary teaching could accurately mark essays written by college students seeking admission to graduate programmes in business management. To this end they compared the quality of marking of experienced and inexperienced examiners. The experienced markers had previously participated in the holistic scoring of essays for one or more Educational Testing Service (ETS) administered testing programs. All had graduate degrees and taught in university-level courses involving critical thinking skills or writing. The inexperienced group either did not have graduate degrees or were not currently teaching college level courses involving critical thinking skills or writing and had no experience of the holistic scoring of essays. All had a baccalaureate degree. Essays were marked before and after training. After training, inexperienced markers especially, improved significantly in their ability to assign ‘correct’ scores. However, several of the inexperienced markers were as accurate as the experienced markers even before the training. Powers and Kubota concluded that there were ‘few significant relations between background
33

and accuracy’ and that the current pre-requisites for ETS essay markers would automatically disqualify a proportion of potential markers, who could, after training, mark accurately. It is unfortunate that the design does not extricate teaching experience and subject knowledge. It is likely that these are differentially important. Ham (2001) studied moderation systems in New Zealand and found that moderator and assessor experience was more important than subject experience for consistency of judgement. Powers and Kubota (1998b) extended their previous study to a second kind of essay writing prompt – ‘analysis of argument’ which is used to select candidates for graduate programs in management. As in the previous study the results suggested that inexperienced markers without the currently required credentials can be trained to score ‘argument’ essays with a high degree of accuracy. They also collected logical reasoning scores for the markers. The results suggested a possible link between logical reasoning and marking accuracy. Examiner traits Attempts to link personality traits with marking performance have been made. However, the small scale nature of these studies, and rather ambiguous personality measures, preclude sensible interpretation of the effect that examiner characteristics can exert on marking reliability. Branthwaite, Trueman and Berrisford (1981) examined the relationship between markers’ scores on the Eysenck Personality Questionnaire and the marks they awarded to essays. The marks given were unrelated to extroversion, neuroticism or psychoticism scores but were positively correlated with scores on the lie scale. This was interpreted as suggesting that marking may be influenced by desire for social acceptance. If this were the case then one explanation for low reliability in marking would be the differential desire among tutors to appear socially acceptable. Pal (1986) compared the Meenakshi Personality Inventory scores of two groups of four examiners labelled as efficient and inefficient on the basis of the reliability with which they had marked twenty scripts of high school students in the subject of Hindi. Compared with inefficient examiners, efficient examiners had high needs for achievement and dominance, but low needs for affiliation. Greatorex and Bell (2002a and b) had examiners of GCSE English, Food Technologies and History complete the Bem Sex Role Inventory which provides a measure of self-reported possession of socially desirable, stereotypically masculine and feminine personality traits. Examiners who rated themselves highly on the masculinity scales were more likely to be Team Leaders. The masculinity scales are made up of dominant/assertive traits and self-sufficiency/decisive traits. Greatorex and Bell saw this as unsurprising since Team Leaders need to be decisive. The appointment of Team Leaders is under the control of awarding body staff, who presumably perceive these traits to be important in fulfilling the Team Leader role. Team Leaders did not however rate themselves highly on traits that could be useful for developing people skills, which is another important aspect of the role. Transient examiner traits Other aspects of the marker that may have important effects on marking reliability are transient, fatigue and mood for example. Townsend, Yong Kek and Tuck (1989) had markers watch a film designed to induce either a positive or a negative mood state. The markers then graded nine essays, including a number of target essays. Secondary school children wrote the essays on the topic of their hopes and aspirations in the next decade. Mood affected only the grade
34

awarded to the first essay. Although there was no significant effect of mood on scoring (with the exception of the first essay scored) there was a trend, albeit relatively transient, for higher grades to be awarded in the negative mood condition. Townsend et al explained their findings with reference to the theory that helping or pro social behaviour possesses a self-gratifying quality that helps individuals to relieve their own sadness (Cialdini, Darby and Vincent, 1973). In an unpublished study, Wilkinson (1952: cited by Pillner, 1968) investigated the effect of fatigue the essay marking of a team of examiners. He found that the average mark per hour tended to increase over time and the scatter of the marks awarded to decrease. Humphris and Kaney (2001) investigated the issue of fatigue in examiners in objective structured clinical examinations (OSCEs). Live patient-clinician interactions are assessed in such examinations. The aim of the study was to determine whether marking varied over the duration of a single session of testing (two hours). They found little evidence of a systematic bias that could be interpreted as being due to fatigue or tiredness. The marks which were analysed for bias were composite scores from four examiners. “Bias due to poor concentration, lack of vigilance or stereotypical judgements, which might be indicative of fatigue, may not be shown when the marks of four individual examiners are pooled” (p. 448). The research reviewed in this section shows that marking can be biased by contrast effects that stem from a comparison of the standard of the script relative to others in the marking allocation, the text of the script itself, the candidate, or the examiner. Marking bias is less likely to occur when questions are closely defined with unambiguously right or wrong answers and when mark schemes are tightly prescribed. A more detailed consideration of the effect of these kinds of factors on marking reliability follows. THE EFFECT OF QUESTION FORMAT, SUBJECT AND CHOICE OF ESSAY TOPIC ON MARKING RELIABILITY Question format Numerous studies have shown that more closely defined questions, which demand definite answers, are associated with higher reliability (for example, Hill, 1973; James, 1974; Murphy, 1978). The ultimate closed response test is the multiple choice test. Multiple choice tests are often called ‘objective tests’ because no-judgement is required on the part of the scorer. This means that they can be scored with perfect reliability. The US has the most extensive development and the widest use of objective tests for educational purposes at all levels. In the UK development has been more cautious (Pillner, 1968). Wolf (1995) explained the US reliance on the multiple choice test in terms of its strengths. Such tests provide fair or objective testing on a huge scale and at a small cost. Moreover, since results do not vary according to marker, there is less scope for candidates to appeal (a factor that is particularly important in a country where litigation is widespread). Pillner (1968) noted that the technical quality of objective tests is illustrated by the fact that the correlation between two NFER or two Moray House reasoning or attainment tests administered up to forty days apart, is typically 0.95 or above; and the coefficient of equivalence (based on the notion of substituting one test for another on the single occasion of testing) is rarely below
35

0.98. He appeared to have few reservations over using objective tests as a means of educational measurement, but states that
“where the nature of the domain examined allows of it, ‘objective’ questions which require no evaluative judgement in their marking should be used. Where the nature of the domain calls for extended writing, the attendant difficulties of marking consistently have to be accepted.” (p. 170)
Although objective tests repeatedly produce more reliable results than short-answer or essay questions, it is vehemently debated whether such tests achieve high reliability at the expense of validity. Objective tests are often viewed as an invalid way to measure writing ability, for example. Nonetheless research has demonstrated a correlation between holistic ratings of essays and objective test scores (Charney, 1984), and has shown objective tests to be a more valid predictor of the quality of essays than other essay tests (Breland, 1977; Hartson, 1930; Huddleston, 1954; McKee, 1934; Stalnaker, 1933). Wilmut, Wood and Murphy (1996) recommend the reconsideration of objective tests, bearing in mind the increased ingenuity and sophistication of response formats (Case and Swanson, 1993). Concerns regarding the validity of assessment mean that these types of questions tend to be used in certain subject areas, making question type and subject intrinsically connected. By their very nature, examinations in subjects that are predominately mathematically based require tightly prescribed questions with definite answers, which in turn result in high interrater correlations. More rigid disciplines also tend to have more detailed mark schemes which further contribute to higher marker reliability. Precise mark schemes minimise the need for individual examiners to exercise discretion in marking. It is often the case, however, that in subjects such as English it is not possible to specify precisely how each mark will be allocated. In these subjects the task of the examiner is to interpret the quality of candidates’ work. Essays are problematic because they are extended, free-response items that preclude reliance on a detailed mark scheme that can be set in advance, applied systematically and without requiring an examiner’s professional judgement. This emphasis on interpretation brings scope for genuine differences in opinion and inevitably the reliability of marking is lower. Hill (1975) studied the reliability of the marking of BSc examinations in Engineering. He found that the correlations between marks awarded by different markers were much higher when ‘problem’ type questions rather than essays were being marked. Similarly, Murphy (1982), in a study of marking reliability across several O and A level subjects, observed that the least reliably marked examinations tended to be those that placed the most dependence on essay-type questions and the most reliably marked tended to be those made up of highly structured, analytically marked questions. James (1974) investigated the marking of physics scripts, which by their nature contain a high proportion of derivations and manipulations of formulae. Fifteen papers were marked by six examiners. The standard deviation of the raw marks of the six examiners about the mean mark for individual candidates was only 4.1 marks on a paper whose maximum was 100 marks. The average value of the correlation coefficient was extremely high (0.94), indicating high interrater reliability. Data provided by Hartog and Rhodes (1935) similarly suggests that in rigid disciplines such as mathematics, in which questions have definite answers, the greatest
36

consistency in marking is to be anticipated. In their work concerning interrater correlations for university mathematical honours, it was found that the average interrater correlation coefficient was 0.96 for 23 scripts marked by 6 examiners. Murphy (1978, 1982) conducted in-depth meta-analysis of the reliability of marking conducted on the behalf of the AEB on 20 different O and A level examinations. A senior examiner for each of the subjects re-marked scripts from a randomly selected sample of around 200 candidates. Of the eight subjects he studied English was the least reliably marked and Mathematics the most reliably marked. In a later study, Newton (1996) questioned whether standards of marking reliability had been maintained in the face of changes to assessment, for example the replacement of O level with GCSE. He compared the reliability of the 1994 SEG GCSE examinations in mathematics and English. He found the reliability of marking in mathematics was “extremely high” whereas that in English was “notably lower” (p. 405). He argued that one cause of the difference in reliability was the nature of what was being assessed. According to Newton, the highly detailed mark schemes in mathematics are partly responsible for the high reliability obtained. He did not conclude that the awarding bodies were failing in their assessment of English. He argued instead that any awarding body must trade reliability of assessment against considerations of validity and cost-effectiveness. He concluded that problems of inconsistency in English are largely inevitable as long as current assessment formats are valued. The value of the essay as an assessment tool has been highly debated. Some authors have argued that the essay represents a serious threat to examination reliability. Both the interrater reliability and intrarater reliability of essays have been shown to be problematic. As early as the 19th century, concerns about essay marking were being expressed (Edgeworth, 1888). Ballard (1923) reported that the correlation coefficient between two markings of essays by different examiners was as low as 0.66. Akeju (1972) had photocopies of the same 100 West African Examinations Council GCE English composition scripts marked by ten different examiners and obtained correlations between examiners varying from 0.51 to 0.76.
Eells (1930) demonstrated intrarater unreliability when 61 teachers marked two history and two geography essays. After an interval of eleven weeks they re-marked the scripts and the average correlation between the two markings of each essay was 0.37 indicating little agreement between the first and second marks given by the same person. Nearly forty years later, McNamara and Madaus (1969) studied the Irish Leaving certificate and commented that the level of agreement between marks awarded to essays by the same examiner over time was no better than the level of agreement between two different examiners.
Lucas (1971) investigated the interrater reliability of essay tests under operational conditions, using scripts completed as part of an Australian Matriculation Biology examination. The experiment entailed six examiners assessing the same 44 scripts during their official examination marking. The opportunity for large discrepancies between markers to emerge was reduced in various ways. For instance, a restricted mark range of 0-6 was used, with 0 reserved for candidates who failed to answer the question or answered it completely irrelevantly. Further, the markers were instructed to mark to a distribution of scores. Notwithstanding these attempts to limit marker variability, the results showed that only one of the 44 scripts had been awarded the same mark by all six examiners; 19 scripts had a range of two marks; 12 had a range of three marks; 12 scripts were awarded a mark of 0 by one examiners and 3 by another. Another script was awarded both a 0 and a 4. Lucas observed “Clearly there was not agreement on what constitutes completely false interpretation of biological concepts or complete irrelevance” (p. 82).
37

Twenty years later, Lehmann (1990) designed a study to investigate four sources of variance (between and within markers, between topics and within students) in the measurement of writing achievement. In spite of the application of clear criteria for assessment, almost 12 per cent of the variance in final scores could be attributed to differences between and within markers. The lack of inter-rater reliability and intra-rater reliability in the evaluation of essays seems to be a historical fact. Valentine, however, (1932) presented evidence that suggests that disagreement between examiners is influenced by the quality of the written sample being examined. Valentine conducted an experiment where 13 student teachers were given 17 essays to mark out of a maximum mark of 20. One essay was outstanding and was placed first by ten of the markers. One essay was placed last by 7 markers. But the intermediate essays had varied places assigned. It is likely that there was less scope for disagreement between the examiners in judging extremely good or poor work because of the bounded nature of the mark scheme. Candidates’ choice of essay topic It appears that the problem of low reliability in the marking of essays is exacerbated by the issue of candidates’ choice of essay topic. Vernon and Millican (1954) argued that inadequate correlations between different markers of the same English essays chiefly occur when the candidates are homogenous in ability, when the writers are mature, the essays short, or the markers relatively inexperienced. However, it was the varying performance of candidates when writing on different topics, which they earmarked as the most serious source of inconsistency in assessing English ability. They conduced an experiment with 224 students in the London Institute of Education which showed virtually no consistent English ability when different essay topics were marked by different markers. Nevertheless, a combination of two persons’ markings of seven essays provided a ‘reasonably’ reliable criterion of ability. Coffman (1971) pointed out that the reliability of essay marking will be lower if the subject matter is discursive and inexact. Hake (1986) found that essays that were pure narratives of personal experience were misgraded much more frequently than were expository essays using personal narration to illustrate or support an assertion. Hamp-Lyons and Mathias (1994) found that essay topics that were judged more difficult by composition specialists tended to get higher scores than those judged to be easier, and suggested that raters may be unconsciously rewarding test takers who choose the more difficult prompt or may have lower expectations for that topic. Despite the effects of essay choice on marking reliability, there are a number of educational advantages to offering a choice. It is desirable that candidates differing in aptitude be able to choose a topic to suit their abilities. Wiseman and Wrigley (1958) found that marks awarded by examiners were affected by the question answered by the candidates, but that this was mostly accounted for by differences in the quality of the candidates' answers. They concluded that the advantages of offering a choice of questions outweighed the disadvantages of reduced marking reliability. Studies of the process by which examiners rate essays It is believed that an understanding of the processes by which examiners rate essays is needed to inform techniques to improve essay marking reliability. Until recently research concerning the reliability of essays has typically focussed upon the product of raters’ evaluations – the scores –
38

and on the material being evaluated – the essays themselves. But, of late commentators (Vaughan, 1991; Milanovic, Saville and Shuhong, 1996) have noted it is also important to examine the process by which raters make their decisions. Milanovic, Saville and Shuhong (1996) argue that lack of knowledge about the decision-making process makes it difficult to train markers to make valid and reliable assessments. An understanding of what actually goes on in trained raters’ minds when they are evaluating essays may go some way to explaining why essay scoring has proved historically unreliable. Cumming (1990) studied markers’ decision-making behaviour in analytic marking. Twenty-eight common decision-making behaviours were revealed in markers’ introspective verbal reports. It seems likely that the less analytic the mark scheme the greater the variety of processes that underlie examiners’ decisions. Vaughan (1991) investigated the processes that operate when raters evaluate essays holistically, a technique that rests on the assumption that trained raters will respond to an essay in the same way if they are given a set of characteristics to guide them. Vaughan employed a technique used by Raimes (1985) and others to elicit writers’ thoughts: the think-aloud protocol analysis. Raters, all experienced in holistic assessment in the same university system, were asked to read through and holistically grade six essays (on a six-point scale), verbally commenting into a tape recorder as they read. Analysis of the transcribed tapes revealed that “despite their similar training, different raters focus on different essay elements and perhaps have individual approaches to reading essays” (p. 120). Vaughan argued that frequent end-of-tape comments such as “I don’t know what someone else might say”, were indicative of rater uncertainty regarding whether their judgements were within the established criteria. Each rater is subsequently forced to rely on his own method. Furthermore, salient features not mentioned in the guideline characteristics had an impact on the raters. Handwriting was one of the most frequently cited problems; the longest essay was passed by everyone; and the principal reason cited by the raters for passing one of the essays was its unique use of an extended metaphor. This finding confirms those of Stewart and Grobe (1979), Grobe (1981) and Charney (1984) that markers are influenced by factors other than candidates’ writing ability. Finally, Vaughan believed that because raters were asked to read papers quickly, one after another, they became one long discourse in the rater’s mind. For example, most raters made comparative statements such as “This essay is better/worse than the previous one or than other” as they read. Vaughan argues therefore, that the effect of the papers taken as a whole on each other should be taken into consideration. Unfortunately since only nine raters were used in this study, these findings cannot be generalised. Milanovic, Saville and Shuhong (1996) reported a similar study designed to explore the thought processes of examiners for Cambridge EFL compositions. The examiners in this study also used holistic marking. Milanovic et al used retrospective written reports, introspective verbal reports and group interviews to collect data. As Vaughan (1991) suggested, examiners developed their own individual approach to reading essays, irrespective of mark schemes and training. The examiners used four identifiable approaches to marking: principled two-scan/read; pragmatic two-scan/read; read through; provisional mark. Markers adopting the principled two-scan/read approach scan or read the script twice before deciding on the final mark. The second reading was ‘principled’ being undertaken indiscriminately with all scripts. Markers adopting the pragmatic two-scan/read approach also read the scripts twice before assigning a mark, but they differed in their motivation for taking this approach. They only had recourse to this approach in the event of the failure of another method to generate a confident mark. The read through
39

approach was the least sophisticated of the marking approaches. It consists of reading a script though once to pick up its good and bad points. The provisional mark approach also involved a single reading of the script, but with a break in the marking flow, usually towards the start of reading the script, which prompts an initial assessment of its merits before reading is resumed to discover whether the rest of the answer conforms or denies that assessment. As in previous research, Milanovic et al found that the examiners focused on a variety of composition elements in their marking: length, legibility, grammar, structure, communicative effectiveness, tone, vocabulary, spelling, content, task realisation, and punctuation. They varied in the extent to which these factors influenced their marking, supporting the proposition that different markers respond to different facets of writing (Diederich, French and Carlton, 1961). In a self-initiated study reported by Barritt, Stock and Clark (1986), the English Composition Board (ECB) of The University of Michigan sought to answer the following general questions:
“What do we, as teachers who read to evaluate, do when we judge student essays holistically? What are the salient characteristics of a student’s writing that lead us to decide at what writing level to place that student? And what are the discernible sources of disagreement among us raters?” (p. 316)
Teachers met and re-read and re-evaluated students’ placement essays and then discussed their evaluations. Over a period of two-years they read approximately 100 different texts, and recorded hundreds of reader reactions to assessment essays, and were able to group these reactions into three categories: comments about the written text itself (impressive sentences, for example); comments about the imagined student writer (is an exceptional student, for example); and comments about the prospective student (student could learn much from introductory composition, for example). The teachers were surprised by the occurrence of comments that focussed upon imagined student writers rather than the actual written text. The type of comments made about a given text depended upon the conventionality/unconventionality of its content. In responding to essays that resembled those of most of the students they had come to know through their teaching experience (conventional essays), the teachers found that they tended to focus on the text itself. However, even in these cases they felt that the apparently exclusive focus on the written test was a misleading indication of the basis for the teachers’ judgements and evaluations. In evaluating conventional essays, the teacher implicitly judged that the student was the one expected: a typical eighteen-year old college student. When an essay matched the expectations of the teachers, the student as author went unnoticed. In contrast, in unconventional essays, where the expected student was not found, the teachers began their active characterisation of the author, so that they could work together with the student writer to construct a coherent text. In light of their findings, members of the ECB argue that it is only possible for raters to achieve a measure of consistency in their judgements when marking a conventional essay. This is because the raters find the student they expect to find. Alternatively, “when Jane or Bill or someone else “who isn’t 17” or is “not your typical freshman” appears, consistency between evaluators began to erode” (p. 323). Their argument is consistent with the findings of Freedman (1984, cited by Barritt et al, 1986). She studied teacher judgements of impromptu essays written by both student and professional writers. She found that whilst raters were very reliable when
40

rating student essays, when it came to professional essays, the raters disagreed vehemently with one another. On closer inspection of the professional essays, Freedman discovered that “the professionals violated their expected student roles: they were threateningly familiar, some defied the task, they wrote too definitely about novel ideas, and they displayed a literally unbelievable amount of knowledge.” (Freedman, 1984: cited by Barritt et al, 1986, p. 323) As in Barritt et al’s study, the raters did not find the student they unknowingly expected to find and so became ‘active readers’, which ultimately lead to a lack of consensus amongst raters. According to Barritt et al the insistence that examiners rate consistently rests on the naïve assumption that the text is fixed, once a student has committed it to paper. Rather the reader acts as a filter, interpreting the text. The active role of the examiner is an important key to understanding the source of discrepant judgements of placement essays. To summarise, research has highlighted a number of detrimental processes that occur when raters mark essays holistically. First, raters may be differentially influenced by composition elements within the written text, such as handwriting, word choice, length etc. Second, raters may develop their own distinct method of reading essays. Third, rater expectations of the ‘conventional’ essay, written by the typical student, may mean that any divergence from these expectations result in disputes between raters – who are all active readers of the same text. All of these processes are almost exclusive to essays and consequently help to explain their inherent unreliability. Improving the reliability of essay marking
Despite the apparent unreliability of essays, in comparison to other methods of assessment, commentators argue that this unreliability can be reduced by the operation of particular procedures. Meckel (1963) lists a number of practices suggested by Diederich for increasing reliability of ratings of English essays. The suggested practices comprise: having all candidates write on the same topic and on the same materials; removing the names from the essays; training markers in marking practices; the double marking of essays; and averaging the grades of two samples of writing obtained from each student at different sessions. Both McColly (1970) and Myers (1980) argued that examiners marking essays should be instructed to read quickly, to score their first impressions rather than thinking about a paper too much. According to McColly if a rater takes too much time, he or she may well be influenced by ‘tangential or irrelevant qualities’, therefore he recommends that the examiners be monitored to keep up a steady pace of about 400 words per minute. Some attempts to improve the reliability of essay marking have been empirically tested. For example in the US, Quality Rating Scales were developed to provide exemplification material at various levels. Examiners were instructed to finalise their awards by matching scripts against the exemplification material. In England, attempts to improve marking reliability entailed identifying the criteria that should inform an assessment and assessing each one separately (for example, Steel and Talman, 1936). The final mark was therefore the product of several separate assessments, all made by the same assessor. Unfortunately none of these initiatives yielded the desired increase in interrater reliability.
41

THE EFFECT OF THE MARK SCHEME/RATING SYSTEM ON MARKING RELIABILITY Research has revealed that an unsatisfactory mark scheme can be the principal source of unreliable marking. For example, Delap (1993a and b) conducted marking reliability studies in the 1992 AEB GCSE Business Studies and Geography examinations. The aims of the studies were to determine the extent of any unreliability in marking and to provide ‘diagnostic’ information useful for examiners to minimise the source of variation in the marking between examiners. Following the re-marking of scripts, meetings were held with examiners to discuss the results and any difficulties they experienced during marking. In both subjects the source of most difficulties was traced back to the mark scheme. In particular, there was widespread confusion amongst examiners over the use of a ‘levels of response’ marking scheme in which examiners were required to place candidates within a specific level based on level descriptors. It is not surprising, then, that improvements to the mark scheme have frequently been cited as a means for achieving greater marking reliability. Price and Rust (1999), for example, argued that with some exceptions, the introduction of detailed assessment criteria leads to improvements in marking consistency. Similarly, Moskal and Leydens (2000), in their work on how teachers can improve the reliability of their assessments of students’ work, argued that improving the scoring rubric is likely to improve both interrater and intrarater reliability. They postulate several questions that may be useful in evaluating the clarity of a given rubric: are the scoring categories well defined?; are the differences between the score categories clear?; and would two independent markers arrive at the same score for a given response given the scoring rubric? If the answer to any of these questions is no, then the unclear score categories should be revised. They also recommend the use of exemplars. These are a set of scored responses illustrating the nuances of the scoring rubric. The marker may refer to the exemplars throughout the scoring process to illuminate the differences between the score levels. They also argue that the rubric be piloted. Any differences in interpretation should be discussed and adjustments to the rubric negotiated. This can take time but greatly enhances reliability (Yancey, 1999). Despite their emphasis on the importance of the scoring rubric in producing reliable marking, Moskal and Leydens maintain that teachers who depend solely upon the scoring criteria during the evaluation process may be less likely to recognise inconsistencies between the observed performances and the final score awarded to the candidate. In other words, unexpected but correct responses may be mistakenly marked down. Saunders and Davis (1998) examined the development and use of assessment criteria for the undergraduate dissertations of management students. Drawing on data from two workshops in which lecturers assessed the same undergraduate dissertation, using the criteria, along with lecturer and student feedback, the authors make several recommendations for good practice. First, they argue that the joint development of criteria by those assessing the work provides a useful start for ensuring that each lecturer understands them in the same way. This is likely to be important because it is one way in which a community of assessment practice is fostered (discussed in detail later). Second, they postulate that since “over time understanding and application of criteria will alter” (p.167), criteria need to be debated periodically if consistency is to be maintained. Finally, they stress the importance of clear assessment procedures and the notion that these procedures need not act as a constraint.
“What is clear from other research and emphasised by our experience, is that criteria which are designed carefully and used with
42

clear procedures can reduce inconsistencies in assessment. They enable lecturers to be more certain they are following the same process and judging each piece of work against the same criteria, thereby assessing each student the same way.” (p. 165)
Specifically, they suggest that procedures should not just relate to administrative issues, but also to factors such as time spent assessing each piece of work. Their research indicated that spending longer over assessing a student’s work is likely to result in a lower grade. Although Saunders and Davis’ focus was on the consistency of assessing dissertations from a lecturer’s perspective, their points are obviously applicable to the use of mark schemes in evaluating examination scripts. Despite the pervasive view that a clear and detailed mark scheme results in higher marker reliability, intended improvements to the mark scheme do not always bring about expected improvements in reliability. Penfold (1956) attempted to make analytical marking more reliable. Markers were involved in constructing the mark scheme with the intention of securing their full agreement and understanding of the requirements. This was followed by a period of standardisation and practice marking sessions. Despite this, Penfold concluded that the variance ratio between markers was still very high. Later studies report similar failures to increase marking reliability. Baird and Pinot de Moira (1997) made changes to the GCE Business Studies mark scheme in order to evaluate its influence on the marking process. Baird, Greatorex and Bell (2002, 2003) performed further research considering the effect of increasing the detail in the mark scheme and introducing different styles of standardisation meeting. Neither analysis supported the hypothesis that marking reliability was affected by the different conditions applied. Moreover, there is evidence to suggest that sometimes consistency in judgements can be achieved when there are no assessment criteria and the assessors use their own criteria. For example, Wiliam (1996) reports that teachers from a 100 per cent coursework GCSE in English learned to agree what grade an example of work was worth. But there were no specific criteria and the teachers did not necessarily agree on which aspects of the work were most significant in making the work worthy of a particular grade. This is described as construct referencing. Mark schemes vary in the extent to which they are judged to involve objective or subjective methods of scoring. If no judgement is required on the part of the scorer, the scoring is said to be objective. As mentioned earlier, multiple choice or objective tests, where the correct response can unequivocally be identified, epitomise this type of scoring method. Where judgement is required, as in the case of short answer responses and even more so with extended writing, scoring is said to be subjective. “In general, the less subjective the scoring, the greater agreement there will be between two different scorers (and between the scores of one person scoring the same test paper on different occasions).” (Hughes, 2003, p. 22) Commentators have argued, however, that no test is ever truly objective. Hamp-Lyons (1990) argues that “’Objective scoring’ can be carried out only when humans have decided what the correct answers are” (p.78). Pilliner (1968) also made it clear that objective tests are subjective in most respects, including qualitative decisions about what to include, and how to subdivide the subject being assessed.
43

The use of a pre-defined mark scheme (scoring rubric or rating system) during the evaluation process is thought to reduce the subjectivity involved in rating short answer questions and essays, thus increasing rater reliability (Moskal, 2000). Several scoring methods are currently in use, but two main types can be identified – holistic and analytic. In Britain, Cast (1939) was responsible for the definitive studies of ‘analytic marking’, and Wiseman (1949) and Finlayson (1951) for those of (general) ‘impression’ marking – the predecessor of the holistic method. Holistic scoring involves the assignment of a single score to a piece of work on the basis of an overall impression of it. Individual features of the text, such as grammar, spelling, and organisation are not viewed as separate entities. According to Hamp-Lyons (1990) “Holistic reading is based on the view that there are inherent qualities of written text which are greater than the sum of the text’s countable elements and that this quality can be recognized only by carefully selected and trained readers, not by any objectifiable means.” (p.79) In a typical holistic scoring session, each script is read quickly and then judged against a rating scale, or scoring rubric, that outlines the scoring criteria. Holistic scoring rubrics usually consist of four to ten levels or bands, each of which corresponds to a score and a set of descriptors. These descriptors in the rubric can vary in their degree of specificity. Park (n.d.) maintained that it is the existence of a scoring rubric that distinguishes holistic scoring from its predecessor, general impression marking, in which criteria are never explicitly stated. Holistic scoring has the advantage of being very rapid (Hughes, 1989). Its major disadvantage arises from the limitations of the single score, which provides useful ranking information but little detail. That is, “holistic scoring cannot provide useful diagnostic information about a person’s writing ability, as a single score does not allow raters to distinguish between various aspects of writing…” (Park, n.d.). Consequently, the same holistic score assigned to two separate scripts may represent two entirely distinct sets of characteristics, even if raters’ scores reflect a disciplined and consistent application of the rubric. In contrast, analytic scoring procedures require markers to assign a discrete score to each of a number of aspects of a task. In an essay, for example, these might be as follows: grammatical accuracy, vocabulary, idiomatic expression, organization, relevance, or coherence. Thus, analytic scoring is slower than holistic, but provides more diagnostic information about candidates’ ability. Research has compared the reliability of either general impression (where no criteria are used) or holistic and analytic methods of marking. Cast (1939, 1940) asked twelve examiners to mark forty English essays according to four methods: individual (the method the examiner would normally adopt); achievement of aim; general impression and analytic method (marks were allocated separately for each of the main aspects of ‘good’ English composition). Examiners marked the essays using each of the methods in turn with periods of eight weeks between (it is unclear whether order effects were controlled for). In general the analytic method was shown to be the most reliable method, but the impression method was a close second. Hartog and Rhodes (1935) also found that compared with impression marking, analytical marking slightly reduced the variation of marks awarded by different examiners. However, in Kaczmarek’s (1980) study of the marking of essays produced by students learning English as a second language, the marks generated by holistic or analytic scoring rubrics correlated highly. Kaczmarek concluded that subjective methods of evaluating essays ‘work about as well’ as objective scoring techniques for students learning English as a second language. Follman and Anderson (1967) compared the reliability of five holistic procedures for grading English essays. The California Essay Scale is a format-type rating system which focuses on the
44

content, style, organisation, mechanics and wording of the essay. A similar system is the Cleveland Composition Rating Scale. This features a similar format to the latter scale, but also provides a percentage weighting for each major facet of the essay being judged. Another approach to essay marking is to use point-scale ratings, for example Diederich’s (1964) approach of having the examiners sort the essays into nine piles. Some systems have a combination of the format and point-scale ratings. For example the Diederich Rating Scale which is composed of eight facets, each to be evaluated on a five point rating scale. A fourth system consists of a specific checklist of errors the examiner uses as a guide to evaluate themes, for example the Follman English Mechanics Guide. The final means of evaluation used in this study was the Everyman’s Scale, in which an examiner individually judges essays by whatever criteria he or she chooses. Ten different essay titles were marked. Five were essentially expository and five argumentative. The essays were graded by five groups of five examiners, each group used a different rating procedure. The grades awarded using the different systems were highly correlated (0.94+) with the exception of the Diederich scale, suggesting that the evaluation systems measured a substantial number of common elements. There was also a very high within group examiner consistency (0.81+) even for the group using the Everyman’s Scale (0.95). The authors suggested that the unreliability usually obtained in the evaluation of essays occurs because the examiners have different academic and experiential backgrounds (the participants in the study were almost all School of Education English majors). They suggested that a rating system would have its greatest effect in raising the reliability of grading when used by a group with heterogeneous training backgrounds. There is some evidence that under certain conditions the analytic method may be more reliable than marking by holistically or by impression, but it is more laborious and time-consuming. Wood (1991) noted this reliability-time trade-off in the comparison of analytic and holistic scoring methods. Pillner (1968) argued that in terms of hours, several impression markers are no more expensive than one analytic marker. In a comparative study of the two methods, English essays were marked by Israeli teachers of English. It was found that a pool of four impression markers was superior in reliability to a single analytic marker. The pooled marks of several analytic markers correlated strongly (0.9) with the pooled marks of several impression markers. In general, Pillner’s study suggests that impression marking can achieve comparable levels of reliability to analytic marking (at no extra cost) when several markers are used. The issue of using multiple markers, however, is controversial. On the one hand, Cox (1966) criticised the use of several markers on the grounds that reliability may be increased at the expense of meaning – “the improvement does not represent greater agreement on the value of essays, it is merely a device for getting the same mark every time” (Cox, 1966, p.8: cited by Pillner, 1968). On the other hand, it has been argued that when a number of holistic readings can be given to a script in the time that it takes to arrive at an analytic score, it is preferable to opt for a score based on the sum of readings of several examiners rather than compound error by having a single examiner assign three or more different scores (Cooper, 1984). The benefits of multiple marking are discussed in detail later. A number of doubts over the effectiveness of analytic scoring methods have been expressed. Using an analytic marking procedure, Stalnaker (1951: cited by Pillner, 1968) found that marker reliability decreased as the level of sophistication of the essay increased. Farrell and Gilbert (1960) argued that markers’ powers of discrimination increase with time and that this effect may be more pronounced with impression-marked questions than analytically marked questions since there is more interpretative latitude with impression marking.
45

Moreover, Hamp-Lyons, (1986: cited by Park n.d.) maintained that with some analytic scoring schemes even experienced essay judges sometimes find it difficult to assign numerical scores based on certain descriptors. This seemed to be the case in the study reported by Delap (1993a and b) (see above) and in a study conducted by UCLES (2000). Their study investigated three possible ways of maintaining consistency between markers of Key Stage 3 English by comparing the marking of four different groups of markers who marked the same scripts. All examiners were experienced in marking of the subject. The marking of the group assigned the analytical method was considerably affected by this procedure; their marks were both depressed and more erratic than the other groups. Hughes (1989) argued that applying an analytical mark scheme requires markers to concentrate on individual aspects of the work and that this may divert attention from the overall effect of the piece of writing. In as much as the whole is often greater than the sum of its parts, a composite score may be very reliable, but not valid. As argued by Park (n.d.) “measuring the quality of a text by tallying accumulated sub-skill scores diminishes the interconnectedness of written discourse, and gives the false impression that writing can be understood and fairly assessed by analysing autonomous text features.” Foley (1971) also suggested that markers employ a global or holistic method in assigning scores, rather than an analytic one to take into account the whole rather than the part phenomenon. This is articulated in a study by Eley (1953) “an essay [is] in some way a whole which [can] not be defined by simple addition of its parts” (p.3). The analytic method of scoring may fragment effects that remain intact in global reading. Interestingly, however, the holistic scoring method of marking writing has also been criticised on the grounds of invalidity. Charney (1984) makes the following comments
“Early attempts at qualitative evaluation of writing samples were abandoned because they were unreliable, not because they were invalid. However, the widespread confidence in the validity of current qualitative assessments must surely be tempered by considering the method of obtaining those assessments. Not any qualitative method will automatically be valid, even if it produces reliable results.” (p. 77-78) “[T]he validity of holistic scoring remains an open question despite such widespread use [;] the question of whether holistic ratings produce accurate assessment of true writing ability has very often been begged; their validity is asserted, but has never been convincingly demonstrated.” (p. 206)
According to Charney holistic ratings may produce high statistical interrater reliability “largely because they depend on characteristics in the essays which are easy to pick out but which are irrelevant to ‘true’ writing ability” (p. 75). Among such characteristics she notes four: quality of handwriting, word choice, length of essay, and spelling errors. Vaughan (1991) made similar comments following an examination of what goes on in a rater’s mind when they mark an essay holistically. Think-aloud protocol analysis revealed that
“raters are not a tabula rasa, they do not, like computers, internalize a predetermined grid that they apply uniformly to every essay. Despite
46

their similar training, different raters focus on different essay elements and perhaps have individual approaches to reading essays.” (p.120)
Furthermore, the reading environment in which holistic scoring typically takes place is unnatural. Charney (1984) describes the methods used for keeping readers using holistic rating in line as “peer pressure, monitoring and (insistence upon) rating speed.” (p.73) Huot (1990) lists four serious objections to holistic scoring: (1) that holistic ratings correlate with appearance and length; (2) that the product orientation of holistic rating is unsuitable for informed decisions about composition instruction or student writing; (3) that holistic ratings cannot be used beyond the population which generated them, so holistic scoring is useless as an overall indicator of writing quality; and (4) that holistic training procedures alter the process of scoring and reading and distort the raters’ ability to make sound choices concerning writing ability. Rather than addressing these criticisms, Huot claims that research has mistakenly focused its effects on developing procedures that ensure consistency in scoring. According to Huot, this has resulted in the inflated position of reliability and the neglected status of validity in the field of holistic scoring, and perhaps accounts for the current vulnerability of the procedure. Recommendations exist for maximising the potential of mark schemes to increase marker reliability. Whether these recommendations are effective is debatable. In fact, evidence suggests that reliability can sometimes be obtained in the complete absence of any scoring rubric. Another method of improving marking reliability might be to have more than one examiner mark scripts and then reach a consensus as to the mark that best represents the achievement of the candidate. This could be applied to all scripts (the literature on double marking is discussed later in the report) or to a limited number of scripts, perhaps focusing on scripts that are not easily assessed by the mark scheme. The advantages and disadvantage of a consensual approach to marking are discussed in the next section. PROCEDURAL INFLUENCES ON MARKING RELIABILITY Consensus versus hierarchical approaches to achieving marking reliability
“In the Japanese director Kurosawa’s classic film Rashomon, the accounts of four witnesses to a dramatic incident are presented; they are profoundly different. Where does the truth lie? Each of the accounts is plausible, each deceptive, all frustratingly at odds with each other, but also, paradoxically, mutually illuminating. The same may be said (more trivially!) of assessments of human performance: in a matter of some complexity, no one judgement may be said to be definitive, although there is likely to be considerable overlap between judgments.” (McNamara, 1996, p.126-127)
According to classical test theory, a candidate’s ‘true mark’ would be that given by the pooled judgement of an infinite number of markers. In reality, the mark a candidate receives for an individual paper is likely to be the result of the assessment of one, perhaps two examiners. The question is, given the limited resources available, how can one achieve the best estimate of a candidate’s true mark?
47
The Qualifications and Curriculum Authority (QCA) regulates UK examinations requiring that awarding bodies follow a series of quality procedures to standardise marking (make marking reliable). These procedures are detailed in a Code of Practice (QCA, ACCAC, CCEA, 2005). Intrinsic to the code of practice is the view that awarding bodies should take a hierarchical approach to the maintenance of examination standards and so to the estimation of candidates’ true marks. At the head of the hierarchy is the chair of examiners, who is responsible for maintaining standards across different specifications in a subject area. The chief examiner is responsible to the chair of examiners for ensuring that the examination as a whole - including both internal and external assessment - meets the requirements of the specification and maintains standards. The principal examiner is responsible for the setting of a question paper/task and the standardising of its marking. The accumulated wisdom and experience of these individuals makes them the repository of standards for examinations in a particular subject. The principal examiner who originally sets the question paper devises the provisional marking scheme which determines how marks will be awarded for candidates’ answers. For examinations with a large number of candidates, the principal examiner will appoint senior assistant examiners (team leaders) to help ensure the consistency of marking. Each senior assistant examiner monitors the progress of a team of assistant examiners. After the examination has been sat the principal examiner finalises the marking scheme. If team leaders have been appointed a pre-standardisation meeting of the principal and the team leaders is held. The principal explains the details of the mark scheme to the team leaders and they have the opportunity to suggest changes. A standardisation meeting is then held and the mark scheme is explained to the body of assistant examiners. At smaller standardisation meetings there may be opportunity for the assistant examiners to influence the mark scheme. The system is built on acceptance that marks are more ‘true’ the higher up the hierarchy the marker is. When senior examiners re-mark assistant examiners work they do so in full knowledge of the marks first awarded and any annotations. Pilliner (1965) argued that one of the critical factors affecting the re-marking of scripts is whether or not the second re-marking examiner is aware of the marks awarded by the first examiner. Murphy (1979) showed that when experienced GCE examiners were asked to re-mark some scripts from which all previous marks and comments had been removed and some which carried them, the correlations between two independent re-markers and the correlations between both re-markers and the initial marking were all lower for the cleaned scripts (reducing them from around 0.95 to about 0.85). McVey (1975) had encountered the same phenomenon in a higher education context in the marking of scripts in electronic engineering. He concluded that
“when the second of the two scrutineers has before him the marks awarded by the first he tends to ‘lock’ to these. The marks he awards are not really his own – they are those of the first scrutineer, slightly modified.” (p.212)
McVey was particularly concerned that the examiners’ marks were influenced without them knowing the credentials or experience of the examiner who had assigned the initial marks. Examiners’ re-marking seems to be more influenced by the marks than the comments of the first examiner. Newton (1996) studied the effect of eliminating examiners’ comments from scripts from the 1994 GCSE Mathematics examination. The marks were removed from the
48
scripts but the comments, ticks, crosses and so on remained. Analysis of the data did not reveal an effect of leaving prime examiners’ comments on scripts; that is, the estimates of reliability were not significantly higher when they were present than when obscured. However, there was a non-significant trend in the predicted direction. Wilmut (1984) compared the marking of copied scripts with all marks and annotations removed, with marks only removed and with marks and annotations present and found no differences in marker decisions. Welsh Joint Education Committee (WJEC) (2004) reported the outcome of a pilot of e-marking in GCSE ICT and GCE Computing. One interesting aspect of the pilot in GCSE ICT was that the re-marking of samples of assistant examiners marking by senior examiners had to be carried out blind. Senior examiners were unable to see the marks awarded by the assistant examiners until they had completed their marking of the sample (this had not been the case in previous examination series). The question paper was relatively straightforward and had a fairly objective mark scheme. Nevertheless, there was evidence of greater variation between senior and assistant examiners than had historically been the case. The report concluded that there is a clear difference between asking a senior examiner to mark blind and requiring them to make a professional judgement about the appropriateness of an assistant’s marking. Murphy (1979) considered that
“Where previous marks and comments are not removed from a script these are likely to influence considerably the …re-marking” and suggested that “Whether the additional examiner’s mark is to be used as a check on the marking standards of the first examiner or whether it is to be combined with it as in the case of multiple marking procedures, it would seem necessary to obtain …a mark which is unbiased by the previous mark.” (p. 77)
Massey and Foulkes (1994) disagreed. They argue that whilst cleaning scripts may be a necessary feature of marker reliability studies, it does not automatically follow that taking the arithmetic average of two marks is the best way to reconcile their differences or that independent re-marking is the optimal form of checking procedure. Massey and Foulkes described other successful approaches. For instance, they report that the Faculty of Law of the University of Cambridge sets some essay examinations where students attempt four questions. The first two are marked by one examiner and the last two by another. Disagreement is unsurprising as students sometimes perform unevenly, but the two markers provide a check on one another, especially as pairs of questions are compared. If the two examiners don’t agree, they complete the full double marking of all four questions to test whether the student has performed unevenly. If this isn’t the case then there is genuine disagreement between themselves which must be resolved. Some History examinations in the same university consist of six papers, each of which is fully double marked, yielding twelve scores for each student. The examiners than meet and a form of majority voting occurs. If most think the student First Class, for example, discussion is unnecessary, even if this leaves discrepant judgements on a particular paper unresolved. If there is no majority for a particular degree class, discussion aims to reconcile differences. Reconciliation does not only focus on the pairs who marked a particular paper nor assume that one or other must be wrong. Each has the right to be an examiner and may see merits the other does not or give different credence to different aspects of performance.
49

Massey and Foulkes argued that two points are at issue here which do not always represent competing alternatives: the increased amount of information from two or more markers and the means of resolving their differences. It remains at least arguable that the greater the distance between the two independent markers, the more likely it is that one has seen something that the other has not, either in the candidates work or in the mark scheme. The higher levels of agreement observed between two examiners when the second knows how (and perhaps why) the first marked each paper may suggest that he or she has taken advantage of the extra information available when trying to judge the best mark for each candidate. In the ‘live’ examining procedures, employed for example in the UK, this may be seen as an advantage rather than a procedural flaw. Processes for reconciling differences are likely to prove superior to averaging because they take better advantage of the information available or even gather and use some more. Massey and Foulkes argue that “Independence between assessment judgements is not itself virtuous. What is important is to get as close as possible to a fair mark for all those assessed.” (p. 123) They are not alone in this view, a number of authors have argued that the value of marker agreement is far from clear and does not, of itself, guarantee marking quality (Buckner, 1959; Freeberg, 1969, cited in Saal, Downey and Lahey, 1980). Indeed a number of writers (Barritt, Stock and Clark, 1986; Hake, 1986; Linacre, 2002; Lumley and McNamara, 1995; Weigle, 1994) have warned of the dangers of forced agreement and have highlighted individual self-consistency as a more worthy aim of training programs. Britton (1950) did not regard differences between the marks awarded to English compositions as detrimental, as long as the markers were self-consistent. He argued that allowance for a subjective element in the assessment of writing composition is appealing. However, in public examinations the grades awarded have great currency so consistency between examiners is crucial. Whilst senior examiners are aware of and are influenced by the marks awarded by the assistant examiner, the hierarchical approach adopted by awarding bodies is still a long way from a consensus approach to marking where two or more examiners mark the same script and come to an agreement as to the correct mark. Spencer (1981) suggested that a move to consensus standards, rather than ones imposed by the senior examiner, might improve marking reliability. It is difficult to see, however, how a consensus approach might transfer to large scale public examinations (Massey and Foulkes, 1994). Moreover it is unclear whether it is necessary for examiners to reach a consensus. Dracup (1997) found that having first and second examiners agree marks for the assessment of psychology undergraduates produced results which were almost identical to a simple averaging of first and second marks. The process of reaching a consensus regarding the best mark for a script may serve a useful training function, improving the accuracy with which examiners apply the marking scheme. While no empirical investigation of this possibility has been uncovered in producing this review, there have been many studies of the effectiveness of other methods of examiner training, which will be discussed in the following section. Training and feedback Alderson, Clapham and Wall (1995) state that “The training of examiners is a crucial component of any testing programme since if the marking of a test is not valid and reliable, then all of the other work undertaken earlier to construct a ‘quality’ instrument will have been a waste of time.” (p.105). Training is often cited as such a ‘crucial component’ because it is believed to compensate for different examiner backgrounds, adjusting examiner expectations so that any
50

variability in the marking process caused by divergent expectations is diminished (Charney, 1984; Huot, 1990). However, as Weigle (1998) has noted, little is known about what actually occurs during examiner training and how it affects the examiners themselves. There has been little detailed empirical research to assess which elements of a training programme are effective and why (Weigle, 1994). Rudner (1992) does, however, suggest that to best minimise rater errors, rater training programs should familiarise examiners with the measures that they will be working with, ensure that examiners understand the sequence of operations that they must perform, and explain how the examiners should interpret any normative data that they are given. Wigglesworth (1994) argued that the main purpose of training is to orient the rater to the rating scale. For Milanovic, Saville and Shuhong (1996), the key to training examiners to make valid and reliable assessments is by gaining “a better understanding of the processes by which a rater arrives at a rating” (p.93). Although few studies have experimentally manipulated examiner training to assess which aspects of a training programme are effective and why, there have been a number of studies conducted to investigate the overall effectiveness of particular examples of examiner training. Weigle (1994) analysed the marking and verbal protocols of four inexperienced raters of the ESL composition placement test at UCLA, before and after training. She found that training was effective in bringing the four new, initially aberrant raters ‘more or less in line with the rest’ in terms of both marks and the procedures by which they arrived at those marks. Other training attempts have been less successful. Black (1962) examined the usefulness of briefing sessions that assistant examiners received in O level English Language. Nineteen examiners marked the same script ten days after they had been briefed and whilst they were in the middle of their official marking stint. The marks for the essay varied from 54 to 24 per cent. Clearly the examiner briefing had not been effective in standardising the examiners marking. Lumley and McNamara (1995) used multi-faceted Rasch analysis to compare ratings given on three occasions, before and after training, by experienced raters for the speaking sub-test of the Occupational English Test. They found that “a substantial variation in rater harshness, which training has by no means eliminated, nor even reduced to a level which should permit reporting of raw scores for candidate performance” (p.69). They raise the question of the stability of rater characteristics over time, and point to evidence suggesting that the beneficial effects of training may not last long after a training session. Reviewing the research evidence of differences in severity between raters after training, McNamara (1996) concludes that “assessment procedures which rely on single ratings by trained and qualified raters are hard to defend” (p. 235). He argued that the traditional aim of rater training “to eliminate as far as possible differences between raters – is unachievable and possibly undesirable” (p. 232). The proper aim of training, he believes, is to get new raters to concentrate and to become self-consistent. There is substantial empirical evidence to support McNamara’s (1996) viewpoint. Lunz, Wright, and Linacre (1990) Stahl and Lunz (1991), and Weigle (1998) all concluded that whilst rater training cannot make raters into duplicates of each other, it can make raters more self-consistent. Weigle (1998) argues that such self-consistency will actually result in improved accuracy in examinee measurement as predictable variations in severity among raters can be
51
modelled and compensated for mathematically. Methods of adjusting examiners’ marks are discussed in detail later in the report. Feedback from senior examiners to examiners represents another form of guidance in the marking process that may impact on marker consistency. Freedman (1981) found that just a few key words by the head examiner at the start of a session could significantly influence the marker consistency. Moreover, in testing English as a Foreign Language, Wigglesworth (1993) found some evidence that examiner biases were reduced following feedback and that interrater reliability improved. Breland and Jones (1988) had essays written by undergraduates scored first by examiners working in a conference setting and second by another set of examiners working in their own homes or offices. The conference markers were trained on the specific topics to be scored and were monitored by table leaders (standard scoring procedures for this ETS assessment). The remote markers received only written instructions by post and there was no monitoring of their scoring. There was therefore no opportunity to discuss the scoring with other markers or for the monitoring to be done by table leaders. Reliability comparisons favoured the conference method over the remote method (0.75 for conference scoring versus an average of 0.62 for remote scoring of two essays by three examiners), suggesting that interactions with table leaders and other markers that occur during reading sessions serve to enhance marker reliability. Shaw (2002) tested whether an iterative standardisation procedure improved the interrater reliability of multiple rating of the same set of scripts. The examiners were first trained at a face to face hierarchical style of co-ordination meeting. This training included marking a set of scripts. The examiners then received training materials with each batch of scripts sent to them. This included explicit feedback notes on each script in the batch previously marked. It was hypothesised that a steady improvement in interrater correlation would take place with each successive iteration of the standardisation exercise. However, the results revealed that while the interrater reliabilities were fairly high (0.77) they did not improve with time and standardisation but remained constant. Even before any training and standardisation, examiners’ marking did not differ grossly from the standard. Shaw suggested that “the mark scheme, comprising a set of detailed and explicit descriptors, engenders a standardising effect even in the absence of a formalised training programme” (p.16). Furneaux and Rignall (in press) investigated the judgements made by twelve trainee examiners for an International English Language Testing System writing module. On successive occasions, before and after training, the examiners rated a set of eight scripts and wrote brief retrospective reports about their rating of four of the scripts. The examiners’ scores before training did not differ as greatly from the standard as might have been expected. Furneaux and Rignall drew a similar conclusion to Shaw (2002), that the use of a rating scale with detailed band descriptors may have had a standardising effect. In addition, they postulated that the examiners’ similar professional background may have helped. The use of an explicit mark scheme may negate the need for examiner training altogether. Examiner training, however, often occurs in groups. It is an opportunity for examiners to meet together and discuss issues related to marking or related to their subject area. These meetings may help engender a ‘community of practice’, which some believe to be crucial for reliable marking.
52

Community of practice Recently, a theory of marking reliability has evolved which is fundamentally concerned with procedures that may improve the consistency of marking between examiners. Specifically, reliable marking is postulated to be the product of an effective community of practice. The theory of community of practice literature originated from the work of Lave and Wenger (1991). Wenger (1998) stated that “practice includes both the explicit and the tacit” (p.47). Therefore standards do not solely reside in explicit assessment criteria or mark schemes, some knowledge cannot be committed to paper. The latter tacit knowledge is instinctive and commonly held. Hall and Harding (2002) were responsible for coining the term ‘community of assessment practice’ in their investigation into whether communities of practice exist in UK primary schools, for the purpose of enhancing the consistent application of assessment criteria from the National Curriculum in English. Ecclestone (2001) considered assessment boards in Higher Education to be communities of academics and cited tacit knowledge as a feature of these communities. She argued that on their own assessment criteria cannot generate common interpretations of the required level and standard of work. Instead internalising and using criteria requires a more strategic approach to inducting and socialising staff into an academic community. Unless this socialisation takes account of professional social and affective dimensions, criteria and guidelines will not fully communicate reliable standards. Wolf (1995) argued that assessor networks or discussion between examiners is needed for reliability. There is considerable empirical evidence to support this argument. A report by the Higher Education Quality Council (HEQC, 1997) on assessment in higher education, for example, suggests that administrative procedures and documentation, intended to make standards explicit, can contribute only a limited amount to reliability; and that what is really important is the nature of assessor networks. The report maintains that consistent assessment decisions among assessors are the product of interactions over time; the internalisation of exemplars, and of inclusive networks. Written instructions, mark schemes and criteria, even when used with scrupulous care, cannot substitute for these. This perhaps helps explain why Orr and Nuttall (1983) found that in English GCE and GCSE examinations it is the examiners’ meetings rather than the mark schemes which are the crucial mechanism for promoting reliability, and why Breland and Jones (1988) observed that greater consistency of marking is achieved when markers work in teams (a 'conference' setting) than when they work singly, even when monitored. To support her argument that discussion between assessors is a key part in developing reliability, Wolf (1995) drew on work by Black, Hall, Martin and Yates (1989). They reported that, for the communication module in the Scottish National Certificate, the assessors had found it difficult to interpret the criteria. They therefore founded a network where standards were discussed, which led to a common understanding of the criteria and produced an improvement in reliability. It is assumed that Wolf is referring to interrater reliability in this context. Baird, Greatorex and Bell (2002, 2003) postulated that examiners’ knowledge (both collectively and individually) can be viewed as comprising subject knowledge and knowledge about standards. From this perspective, application of the mark scheme at the question (item) level is a social construct negotiated by members of the community (or passed on by the principal examiner) and an individual’s (examiner-specific) tacit knowledge. Wenger (1998) argued that being a member of a community of practice gives people a sense of ownership of knowledge and practice, and that it is flat hierarchies or sharing decision making which most facilitates
53

learning. Indeed Barrett (2000) found that for a university level Communication and Media examination there were unacceptably low levels of interrater reliability. One examiner, however, was particularly free from error. Barrett suggested that this was a matter of ownership; the examiner was the subject co-ordinator. He suggested that increased ownership might improve inter and intra reliability. Clearly, Wenger’s emphasis on shared decision making has implications for the way in which co-ordination meetings should be conducted. If examiners are to gain the most from meetings they should be conducted on the basis of consensus, rather than the final decision residing with the principal examiner (a hierarchical approach to co-ordination meetings). Co-ordination meetings in which flat hierarchies and shared decision-making prevail are most likely to benefit examiner understanding, since they promote a sense of ownership of knowledge and practice. If the literature is correct, and the establishment of a community of practice via certain procedures, does indeed improve reliability, then trends noted by the HEQC (1997) are worrying. The council observed that changes in the structure and organisation of higher education (trends towards fragmented marking, formula-driven awards and small examination boards) seem to be lessening opportunities through which common understandings of standards can be formed, shared and transmitted. If this continues the reliability of assessment may be threatened. Baird, Greatorex and Bell (2002, 2003) observed that no experimental research had been conducted to actually verify empirically the aspects of a community of practice claimed to result in marking reliability. Hence, they set out to investigate the effects of discussion of the marking scheme during co-ordination meetings in GCSE English Literature and History. They investigated the effectiveness of different styles of co-ordination meeting. There were three groups of examiners; one group did not attend a co-ordination meeting; one group attended a hierarchical co-ordination meeting; one attended a consensual co-ordination meeting. It was predicted that consensual co-ordination meetings would produce greater marker reliability meetings because decisions about adjustments to the mark scheme that are negotiated and shared will produce a greater sense of being part of a team, greater ownership of the mark scheme and more learning of the mark scheme. The data, however, did not support this idea; consensual discussion did not lead to more reliable marking. Nonetheless Baird et al maintained that the notion of a community of assessment practice is important to understanding the outcomes of this study. The mark scheme had a strong standardising effect even without a coordination meeting. They argue that this might be partly because the examiners were already part of a community of assessment practice for other papers which they had marked for between 2 and 15 years. The tacit knowledge from these papers may have been sufficient to facilitate the examiners' having a shared understanding mark scheme of the paper in question. The results of this study appear to indicate that when a sufficiently well developed community of practice exists, the type and amount of discussion might become less important in producing reliability. Standardisation meetings may be particularly important for new examiners. Greatorex, Baird and Bell (2002) report the findings of a follow-up questionnaire sent to the History examiners who participated in the second experiment. Some of the responses contradict the findings of the main experiment. Although different styles of co-ordination meeting and whether a co-ordination meeting was held did not affect marking reliability, questionnaire responses revealed that examiners did not like marking without first attending a
54
co-ordination meeting. They valued the opportunity to maintain a community of practice through discussion with colleagues. Further, those examiners who attended the consensual co-ordination meeting appreciated the discussion, negotiation and direct contact with senior examiners. Examiners considered all aspects of marking standardisation to be important, particularly the mark scheme and the co-ordination meeting. The responses to the questionnaires illustrated that levels of attainment required to gain marks were communicated by discussing mark schemes in relation to exemplars. A small number mentioned that exemplar answers should be included with the mark scheme. Although it has been suggested that not everything can be written down and some understanding of how to apply mark schemes remains tacit, examiners maintained that what is written, and how it is written is very important. Baird et al (2002) concluded that
“the community of practice literature has great descriptive utility, but its prescriptive utility has yet to be established. How does one know whether a community of practice has already been formed and will fostering the features of a community of practice engender reliable marking?” (p. 18)
Clearly, there is much experimental research still to be done with regards to establishing a coherent and comprehensive theory of a community of practice. One development that may be particularly pertinent to a future theory of a community of practice is the growth in e-assessment and e-marking. Such technological advances may lead to examiners communicating by secure websites or other means (Greatorex et al, 2002). Hence, the advantages and disadvantages of electronic versus face to face communities of assessment practice might be investigated. Exemplar material Exemplars are cited as one method of ‘inducting and socialising staff into an academic community’. Wolf (1995) suggested that standards are communicated by examples of students’ work rather than by assessment criteria. She argues that if assessment criteria are separated from work they could be interpreted as appropriate for many different levels of achievement. According to Wenger (1998) the process of reification means that examiners must discuss exemplar material. He defines reification as giving an aspect of human experience the status of an object, for example, treating the concept of mathematical ability as though it is an object. In producing mark schemes, we reify the constructs we are assessing and it is necessary for examiners to discuss examples before they can gain a shared understanding of the concepts. Lave and Wenger (1991) suggested that the finished products of ‘masters’ can act as exemplars in the process of ‘apprentices’ becoming full participants. This implies that assistant examiners should use more experienced examiners’ marked scripts as an example to follow. Indeed this technique of improving marking reliability is used by UK awarding bodies. Despite some commentators’ insistence upon the discussion of exemplars amongst examiners during the marking process, it is important to note that there are some difficulties with this method of familiarising examiners with standards. Different examiners read exemplars differently (Baird, Greatorex and Bell, 2002, 2003). Further, as Sadler (1987) points out exemplars of the same standard differ and they are limited as an indicator of standards as they can incorporate factors like cultural tradition and current technology, which means they soon
55
become out of date. He concluded that a small number of exemplars alone cannot adequately define a standard when multiple criteria are used. Responding to Wolf’s (1995) comment there had been surprisingly little empirical research on the utility of exemplars in producing common standards. Baird, Greatorex and Bell (2002, 2003) investigated the impact of exemplar work on marking reliability. They compared the effect of prototypical band exemplar scripts and cut score exemplar scripts to clarify whether scripts that provide prototypical examples of a particular band are more useful than scripts that provide examples at the cut score between bands. There were three groups of examiners; one marked using no exemplar scripts, one used prototypical exemplar scripts and one used cut score exemplar scripts. Surprisingly, the most accurate marking was that of the group who had no exemplars. Examiners who had received prototypical exemplars marked to a more severe standard than those who received no exemplars or cut-score exemplars. Baird et al suggest that examiners might be accustomed to thinking about cut-scores and cut-score performances and it could be that the prototypical exemplars were interpreted as cut-score performances by the examiners. As the prototypical exemplars were on higher marks than the cut-score, this would serve to make their marking more severe. Baird et al suggest that examiners should be given exemplars which illustrate the range of achievement associated with each mark band. Double and multiple marking In double marking two examiners independently, assess each script. The final mark is usually a combination of two separate marks. ‘Multiple marking’ refers to two or more examiners independently, assessing each script, the final mark being some combination of the separate marks. As early as 1949 Wiseman reported the results of a study based on multiple marking of the composition scripts of 11-plus candidates. Teams of four markers marked each script independently so that the final mark for each script was the sum of four independent assessments. He claimed that the multiple marking produced reliability coefficients of up to 0.95 – so high that they approached those expected from objective tests – although other researchers (e.g. Lucas, 1971) questioned whether Wiseman was actually measuring interrater reliability or the mark-re-mark consistency of his markers. Markers were trained to use general impression marking to make marking quick enough to be viable. Nonetheless, the viability of such multiple marking was questioned (for example by Penfold, 1956). It is noteworthy that markers were not expected to agree with one another. They were selected for their high levels of self-consistency (they had to achieve a mark re-mark correlation of 0.7 or above to be included in the pilot). Wiseman was possibly the first to acknowledge the value of differences between markers. “Provided markers are experienced teachers, lack of high inter-correlation is desirable, since it points to a diversity of view-point in the judgement of complex material, i.e., each composition is illuminated by beams from different angles, and the total mark gives a truer ‘all-round’ picture” (p. 206). Wood and Quinn (1976) observed that since the work of Hartog and Rhodes (1936) disagreement between examiners was to be discouraged. Britton Martin and Rosen (1966), however, supported Wiseman, in arguing that differences lie in the most sensitive areas of discrimination, which one would want to incorporate into assessment. Cox (1967) argued that the improvement in reliability gained by multiple marking does not represent greater agreement on the value of the essays, but is merely a method for getting the same mark every time. Pilliner (1969), however, demonstrated statistically that Cox’s criticism was valid in only extremely limited circumstances where each marker was highly self-consistent
56

and at the same time agreed poorly with all other markers. He argued that where there were such large differences they were probably a reflection of the intransigence of the markers rather than differences in the scripts. When there is a reasonable measure of agreement among individual markers about the scripts’ merits, the aggregated marks from a team of markers will be a valid expression of the team’s consensus of opinion, the reliability of which will increase as the size of the team increases. Research demonstrating the large gains in reliability made from double marking motivated its use by awarding bodies in examinations with subjective assessment and in newer subjects, in the 1960s and 1970s. For example, Brooks (1980) reported that in the late 1970s a substantial minority of GCE and CSE boards were using more than one marker to assess English Language composition scripts completed as part of O-Level or CSE examinations. The awarding bodies conducted a number of unpublished studies of the gains in reliability achieved through double marking. For example, in 1969 the Joint Matriculation Board (JMB) Research Unit conducted an evaluation of double marking in two A level General Studies papers and two O level English Language papers. In evaluating double marking in English one examiner marked scripts by impression and one marked analytically. The final mark awarded to the candidate was the total of the two scaled marks. There was no difference between the mean marks awarded by the two marking methods. The correlation between the two markers was 0.45 for one paper and 0.60 for the other. If just the analytical marks had been used then 6.1 per cent of candidates would have changed grade on one paper and 6.4 per cent on the other paper. For General Studies each essay was marked twice and awarded an impression mark on a scale of 1 to 9. The marks were summed to produce the final mark awarded to the candidate. The marks correlated at 0.70. If just the first impression marks had been used then 6.9 per cent of candidates would have changed grade; if just the second impression marks had been used then 7.3 per cent of candidates would have changed grade. The research concluded that double marking continue. Other evaluations were published, for example, Britton, Martin and Rosen (1966) devised an experiment in which a sample of 500 O-Level English Language essay scripts was marked experimentally by multiple marking teams as well as undergoing the board’s official marking procedure. Each script was independently assessed by four markers, three marking by general impression and a fourth for mechanical accuracy. Marking by individual examiners with very careful briefing and moderation was significantly less reliable than a multiple mark. The use of impression marking, they argued, made multiple marking practicable for awarding bodies. Double marking was piloted as part of the Nuffield Foundation O-Level Biology Project (Head, 1966). The O-Level Biology examination paper included multiple choice, short-answer questions, open-ended items and essays. A sample of essay answers from 290 scripts was impression marked by four experienced teachers. The marks assigned by the teachers correlated at 0.64 which was considered inadequate. However, when the marks of two examiners for each script were added and the sums correlated with those of other examiners the average correlation was 0.84. Lucas (1971) also investigated double marking using Biology essays, but under operational conditions. During their official marking, six examiners also marked the same 44 scripts by general impression based on a scale from 0-6. Interrater reliability was calculated according to whether one, two, three or four separate marks contributed to the final award. This allowed the relative gains from scaling up from single, to double, to multiple marking to be assessed. Lucas
57

found that multiple marking significantly increased the reliability of the marks awarded, but that the greatest increase in reliability resulted from an increase from one to two markers. The improvement in reliability due to each additional marker diminished as the number of markers increased. Any additional benefits derived from using teams of three or four markers were statistically significant but much smaller. Akeju (1972) verified this. Lucas argued that the increase in reliability has to be offset against the additional sources required. Wood and Quinn (1976) investigated whether these gains in reliability from multiple marking would generalise to a different subject area – English. Scripts from O-level English Language were marked by examiners under conditions as similar as possible to operational marking. The scripts included essays and summaries. Before their briefing in analytical marking, the method employed by the board, ten examiners marked the same 100 scripts using general impression marking on a nine-point scale. Wood and Quinn emphasised that although reliability can be undermined by marker bias and inconsistency, bias can be easily corrected, the real threat is inconsistency because it is more difficult to correct. They found that double marking did lead to greater consistency than single marking. They also explored the effects of pairing examiners systematically to take into account known characteristics of their marking behaviour but found little advantage in a systematic approach over a random approach. They also commented that between marker correlations in the region of 0.50 to 0.60 were acceptable since one would want some disagreement but not too much. They argued that the advantages of double marking in terms of increased reliability offset the reduced spread of marks caused by regression to the mean and the consequent reduced discrimination between different levels of achievement. Wood and Quinn also concluded that the effect of switching from analytical marking to impression marking (even without introducing multiple marking at the same time) would affect a candidate’s result no more than if a different examiner marked him or her. Double marking within awarding bodies has now vanished, partly because of growing problems with the supply of examiners. Awarding bodies struggle to recruit enough examiners to mark scripts once, never mind twice. Double marking of all examination papers is not a feasible option. There were approximately 5,712,588 GCSE and 2,794,188 GCE examination scripts marked in summer 2004 by the AQA alone. Double marking is, however, prevalent in Higher Education and there has been some evaluation its effectiveness (e.g. Partington, 1994; Smith, Sinclair, Simpson, van Teijlingen, Bond and Taylor, 2002; Sparks and Ballantyne, 1997). For example, Chaplen (1969) conducted a study of blind double marking of an essay subtest in a university entrance test in English for non-native speakers of English. The examiners also re-marked the essays after three months. The two sets of marks were then correlated to provide an index of self-consistency of each examiner. The essays were marked by impression on an eight point scale. Each point on the scale was described in detail. As one would expect having examiners mark two rather than one essay increased reliability and having examiners double mark increased reliability. The overall reliability of having examiners double mark two essays was 0.92. Evaluation of the effectiveness of double marking is important because it can lead to surprising findings. Newstead and Dennis (1994) asked 14 experienced Psychology examiners, all of whom acted as external examiners on other courses, to mark the same six undergraduate scripts. Their marks varied dramatically, the most extreme example involving an essay that received an excellent first from one examiner and a borderline second/third classification from another. They argued however, that as students’ degree classes are assessed over a number
58

of examinations rather than just one, measurement error like that would be likely to lead to misclassification only for students who were very close to degree-class borderlines. Partington (1994) discussed the value of double marking in Higher Education. He argued that double marking cannot substitute for clear assessment guidelines and marking criteria. Further, double marking would not be effective in the absence of the latter. More recently, Smith, Sinclair, Simpson, van Teijlingen, Bond and Taylor (2002) conducted a study of double marking of an essay assessment on an undergraduate medical course. There was poor agreement between the two markers. The markers were either academic (not involved in teaching the course) or generalist (involved in teaching the course). Agreement was poor whether the two markers were the same (both academics or generalists) or different and it was unclear how disagreement between markers should be reconciled. A large number of students would have received palpably different grades in the event of single rather than double marking. Despite resource difficulties, the double marking of public examinations has recently received renewed interest. In 2002, QCA published the report of an independent panel of experts into maintaining standards at A level. In the section on quality of marking, the report recommended “limited experimental double marking of scripts in subjects such as English to determine whether the strategy would significant reduce errors in assessment’”(p. 24). Newton (1966) however, argued that it is unclear which papers would benefit from double marking to offset the increased costs. GCSE mathematics, for example, would not. If the marking of two examiners were completely reliable the correlation coefficient between each set of marks would be +1.00; a high correlation in the region of +0.80 or 0.90 would indicate that the order of merit of the candidates was the very similar for both markers. It is likely (but not certain) that the markers are awarding similar marks to the candidates. This might mean that double marking is unnecessary. A low co-efficient, less than +0.30 would indicate little relationship between the marks in most pairs and suggests that examiners are not assessing the same criteria. Using an aggregate of the two marks under these circumstances may bunch the candidates about the mean. Double marking strategies may be most appropriate when the coefficient is intermediate in value. The introduction by awarding bodies of double marking would require a philosophical shift. In the current hierarchical system, the work of assistant examiners is overseen by senior examiners who report to chief examiners, whose accumulated wisdom and experience makes them the repository of standards for particular examinations. This system is built on the assumption that marks are ‘true’ the higher up the hierarchy the marker is. Double marking rests on a different view of what constitutes a ‘true mark’. Wiseman argued that the ‘true mark’ would be that given by the pooled judgement of an infinite number of markers. Wood and Quinn agreed; defining the true mark as the average mark awarded by all the examiners. The best way of combining the marks generated by multiple marking has also generated some discussion in the literature. Cresswell (1985) identified four approaches to double marking. Firstly, and according to Cresswell ideally, the second consideration could be an independent replication of the first marking, using the original marking scheme and without knowledge of the original marks awarded to the scripts. Secondly, it could be a re-marking using the original marking scheme, but with knowledge of the original marks. Thirdly, it could be less formal re-assessment of the scripts on an impressionistic basis but acknowledging that assessment criteria the same as those in the original marking scheme should be used and without
59

knowledge of the original marks. Finally, it could be impressionistic re-assessment but with knowledge of the original marks. Smith et al (2002) listed the options for combining the marks awarded to undergraduate medical essays: taking an average of the two marks; employment of a third marker; and discussion and negotiation between the two markers. The usual recommendation (e.g. Coffman, 1971) is that the marks from more than one marker be added together to form candidates’ final scores. Wiseman (1949, 1956) and Pilliner (1969) showed that where there is ‘fair’ measure of interrater agreement, averaging the marks enhances assessment. Cresswell (1983a) took a more sophisticated approach. He demonstrated that the simple addition of the two markers’ scores will rarely produce a composite score with the highest reliability possible, and derived formulae for the weights that should be used to form a weighted composite that gives optimum reliability. Whatever the improvements in reliability brought about by double marking, the resource implications of its introduction may make it impossible to implement in the public examination system. Lamprianou (2004) suggested that a solution might be to have each script marked by a human marker and by software. In the case of a marking discrepancy, a second human marker would be called in for a second blind marking. This solution may be made possible by the range of writing assessment programs available: Project Essay Grade (Page, 1966), Intelligent Essay Assessor (Landauer and Dumais, 1997) and E-rater (Educational Testing Service), for example. Advocates of these programs cite evidence that the programs correlate as well with human raters as the raters do with each other (e.g. Chung and O’Neil, 1997). The validity of the assessments made by this method are nonetheless questionable. While awarding bodies are unable to conduct double marking on a large scale, it is used to monitor the marking of examiners and to calculate appropriate adjustments to examiners marks where apposite. A discussion of methods of detecting and correcting inaccurate marking follows. REMEDIAL MEASURES TO DETECT/CORRECT UNRELIABLE MARKING With the exception of the use of statistical adjustments to marks, there is little information available regarding the remedial measures used to detect/correct unreliable marking outside of the UK. The specific quality procedures used by UK awarding bodies are detailed in a code of practice (QCA, ACCAC, CCEA, 2005) and are discussed earlier (in the section titled: Consensus versus hierarchical approaches to achieving marking reliability). In order to detect and therefore correct unreliable marking, senior examiners monitor the marking teams of assistant examiners. They re-mark initial samples of marked work (in full knowledge of the marks first awarded and any annotations). Feedback is provided to help examiners conform to standard practice and an examiner is brought into line if s/he has misinterpreted the mark scheme. If, at the end of the period of marking, an examiner is deemed to have marked erratically than her or his entire work is re-marked. If an examiner is deemed to have marked consistently too strictly or leniently, then a recommendation will be made to adjust all of her or his marks accordingly. Adjustments to marks Baird and Mac (1999) discuss the issues surrounding how these adjustments should be calculated. Complete agreement between the original markers and the re-marker is very rare, but when do differences between the sets of marks become a problem? Awarding bodies deal with this issue by having a tolerance limit associated with each question paper, but there is a
60
view that an adjustment should be applied to all consistent differences, even if they are small. The use of tolerance recognises that there may be legitimate differences in professional judgement. Small adjustments are also difficult to justify when only a small sample of scripts have been re-marked. It is possible that a different adjustment would be applied if a different sample had been drawn. Baird and Mac list a number of methods of evaluating whether an adjustment should be applied: percentage of marks that lie within tolerance of the senior examiners marks; average absolute mark difference between the assistant and senior examiners marks; confidence intervals (within what range of marks are we confident the true adjustment should lie?); background information about the reliability of the examiners marking; direction of adjustment (should positive adjustments be favoured over negative?). There are a number of adjustments possible: mean (the mean difference between the assistant and senior examiners’ marks is applied to the assistant examiners’ marks); median (the median difference between the assistant and senior examiners’ marks is applied to the assistant examiners’ marks); complex (different adjustments applied to different mark ranges), regression adjustment (a line of best fit is calculated between the senior and assistant examiners’ marks). Rudner (1992) expands upon some of the regression adjustments that can be made to marks. Theses include: ordinary least squares regression (where the observed mark is viewed as the sum of candidate’s true ability, a marker effect, and random error); weighted least square regression (where each marker’s score is weighted by a measure of the marker’s consistency); and the imputation of missing data (where actual mark information is used to estimate marks for the candidates that the marker did not evaluate). Rudner reports that when these techniques are applied they typically produce substantial adjustments to marks and change significant numbers of pass/fail decisions. Al-Bayatti (2005) details the relationship between the number of scripts sampled from examiners’ marking allocations and the ability to recognise whether the marker is reliable. He uses the concept of diminishing return to denote the diminishing efficiency with which larger numbers of scripts can recognise errant marking. Reliability was measured by the standard error (SE) of the mean difference between the Principal Examiner and the assistant examiner marks. For three types of marker (BA graduate, practising teacher, experienced examiner) and a simulated marker, a similar pattern in the fall of SE as the sample size of scripts increased was identified. Al-Bayatti concluded that there is little to be gained from increasing sample size beyond a certain number of scripts. It was also found that the minimum number of scripts required for recognising errant marking was lowest for the experienced examiner group. He was unable, however, to draw any firm conclusions regarding the exact number of scripts that should be sampled. Bridgeman, Morgan and Wang (1996) made two arguments for adjusting scores. First, even though the impact of score adjustment may be small on average, a few individuals can be significantly affected if they are unlucky enough to be marked by an especially severe examiner on most of their work. In this case small severity errors may accumulate rather than cancel each other out. Second, the adjustment process can be completed relatively quickly and inexpensively by computer. Compared to the cost of additional markers, the adjustment is very cost effective. However, they argue though that the psychological impact on markers of knowing
61

that adjustments will be applied may be damaging. They may become more inconsistent, and it is impossible to adjust for inconsistency. Further, adjustment may disadvantage individuals who write very good answers that would receive the highest scores even from the strictest markers. If these scripts are read by lenient markers, the adjustment process will unfairly assign them lower scores than they deserve. Murphy (1977) studied the validity of mark adjustment in eight subjects at AEB/SEG by comparing the marks awarded to candidates following adjustment (as part of normal marking procedures) with the marks that would have been awarded by senior examiners who re-marked the scripts as part of the investigation. He showed that mark adjustment tended to be effective in bringing the majority of candidates closer to marks that would be awarded by senior examiners. However, a considerable minority of candidate marks were also taken further away: 44 per cent, 38 per cent, and 43 per cent for English A level, English Literature O level and English Language O level, respectively. Concern was also raised that even if marks were adjusted in the right direction, the magnitude of change tended not to be large enough to compensate for the mark discrepancies involved. Murphy suggests two possible reasons for the ineffectiveness of the examiner adjustments to satisfactorily reduce the size of discrepancies. Firstly, it may have been due to inappropriate adjustments being made to individual assistant examiners, both in terms of their size and whether they were made in the positive or negative direction. Secondly, and perhaps more likely, it could reflect the inability of examiner adjustments to deal with the type of marking variations which might exist in the marking of individual assistant examiners;
“Clearly, only where an Assistant Examiner consistently marks either too harshly or too leniently is an overall examiner adjustment, made to all his marks, going to be appropriate and effective. If these marking variations were of a more haphazard nature, then there is no way in which overall examiner adjustments may be used to rectify them” (p.6)
Murphy concluded that the examiner adjustment procedures, in operation at the time of his investigation, would benefit from a review. Following Murphy’s study, procedures for mark adjustment at the AEB/SEG became more formalised; for instance, general rules were laid down, such as that an adjustment should not be made unless the marks of at least 75 per cent of the sample re-marked by the Senior Assistant Examiner are brought closer to her or his marks. Newton (1996) sought to investigate whether with more formal guidelines the process of mark adjustments had achieved greater validity. The process of adjustment led to a ranking of candidates that was closer to that of the senior examiners. The resultant correlation between the senior examiners’ marks and the post-adjusted scripts was nearly as high as for the unadjusted scripts. However, some adjustments still took some candidates marks away from the marks awarded by the re-marking examiners. Adjustment was unsuccessful for approximately a third of candidates. Newton and Murphy (1978, 1982) argued that scaling examiners’ marking at the question paper level cannot overcome all the inconsistencies in examiners' marking when candidates are asked to perform different tasks in one examination. Increasingly sophisticated methods for adjusting scores to allow for differences in examiner severity are available through many faceted Rasch (FACETS) analysis. According to Linacre,
62

Wright and Lunz (1990) “the facets model yields greater freedom from judge bias and greater generalizability of the resulting examinee measures than has previously been available.” (p.10) Engelhard (1994) investigated the calibration of markers using Rasch (FACETS) analysis. He examined several categories of marker errors (marker severity, the halo effect, central tendency and restriction of range) in the assessment of written composition and demonstrated how each of these errors can be detected using FACETS analysis. He argued that the potential effects of these errors can be minimised using on-going quality control procedures including the statistical adjustment of marks. He suggests that if markers are consistently lenient or severe, it may be possible to calibrate markers and to adjust the marks for differences in severity. This calibration of markers is achieved by designing a calibration study in which a common set of student compositions are rated by multiple raters. Myford, Marr and Linacre (1996) piloted the use of FACETS analysis to calibrate markers within and across two administrations of the Test of Written English but found it hard to defend adjusting for reader effects because they were too unstable within and across administrations of the test. The correlation between marker severity measures across the administrations (over one month) was just 0.30, and within an administration it was 0.46. Braun (1986, 1988) showed that ‘operational calibration’ improved the reliability of single marking. This statistical technique was designed to remove error relating to differences in marker severity. A marking experiment was embedded within an operational setting. A small, random sub-set of scripts was selected, photocopied and marked by each examiner alongside their normal marking allocation. Statistical techniques were then used to determine the contribution of different sources of systematic variation (the maker and the stage in the marking period, for example) to the unreliability of the scoring. Marks were adjusted accordingly. Braun reported that this technique significantly improved reliability and was more cost effective than multiple marking. One concern raised by this approach is that examiners could identify the experimental scripts (photocopied). Indeed, some of Braun’s markers admitted to treating the photocopied scripts differently even though they were instructed to treat the experimental grading as if it were operational. The use of seeded items in e-marking would overcome this difficulty. There has also been some investigation of the effectiveness of mark adjustment in higher education. Elander and Hardman (2002) studied the judgments of first and second markers of Psychology essays for an undergraduate programme. The markers had to give a holistic rating of each essay and mark individual aspects of each essay as specified in the assessment criteria. They found that the first markers were more able than second markers to award overall marks reflecting the range of aspects specified in the assessment criteria. The overall marks awarded by second markers were much less well predicted by their ratings of individual aspects of the essays. First markers had taught the material being examined and set the questions and would be expected to be in a better position to award marks that reflected a wider range of attributes. They found that the statistical calculation of marks from the ratings of individual aspects of the essay would improve the reliability of the second, but not first, markers marking. Mark adjustment can only be used where the examiner has been consistently severe or lenient. It is of no help when markers are inconsistent. Longford (1993) studied the reliability of marking of Advanced Placement examinations in Biology and Studio Art. Marker inconsistency was a much larger contributor to error in scores than was marker severity. In a subsequent study Longford (1994) studied examinations in Psychology, English Language and Computer
63

Science. Once again severity variance was small relative to inconsistency variance, although the relative size of these components varied considerably between subjects. In the case of the Advanced Placement examinations where students write several essays each read by a different marker, severity errors tended to have a minimal impact on overall score reliability. Methods for detecting unreliable examiners used by UK awarding bodies Enquiries on results In UK high stakes testing, following the issue of results candidates are able for a limited period to query the grades they have received. They may request a range of checks varying from a clerical check that all marks had been included and correctly summed, for example, to a full re-mark of their script. A number of internal awarding body reports chart changes in the number of enquiries after results associated with particular subject areas (Baird, 1999, for example). The volume of enquires and number of grade changes gives some indication of the reliability of marking. Of course awarding bodies attempt to rectify errors prior to the issue of results and have developed a number of methods for detecting unreliable examiners. Centre grade comparison list Baird (1997) reports a procedure where examiners with low mean marks and large deviations between candidates’ estimated and achieved grades were sample re-marked following the Summer 1996 examinations in four subjects with a relatively large number of enquires after results. On the basis of this sample re-marking, some examiners’ marking was adjusted, usually by adding or subtracting a constant, although more complex adjustments were possible. Eighty per cent of re-marked examiners were adjusted in GCSE English, thirty-three per cent in GCSE Geography, seventeen per cent in A level Business Studies and eighty-two per cent in A level Theatre Studies. Despite the fact that the method had a substantial effect on the grade distributions it did not have any effect on the number of enquires after results. They were not avoided in the subjects in general, or in the specific centres which were included in the procedure. Neither did it reduce the number of grade increases. Office review The main aim of the office review is to ensure that as far as possible, no examiners whose marking of scripts may be suspect remain undetected at the time of grade awarding. Additional samples of scripts from targeted examiners are re-marked and adjustments made if appropriate. It is usually carried out in subjects with a high number of enquiries after results. If the examiners’ marking is considered too lenient or too severe an adjustment is applied to their marks. The AEB conducted an office review in nine subjects in 1998: GCSE English and English Literature; A Level Business Studies, English Literature, English Language and Literature, Geography, Psychology, Sociology and Theatre Studies. Pinot de Moira (1999) studied whether the office review reduced the proportion of upgrades from enquires upon results in GCSE English and English Literature and A level Sociology. The office review only had a marginal effect on the proportion of upgrades following enquires after results. For those office review examiners where an adjustment was applied, the proportion of upgrades was similar to or slightly lower than that for examiners not referred to office review. It was not possible to anticipate how many upgrades were avoided as a result of the corrective action taken for these office review examiners but it was clear that the adjustments did not totally remove all problems. There were a considerably higher proportion of upgrades for examiners referred to the office review and for whom no adjustment was recommended. These examiners included a proportion where earlier sample re-marking evidence contradicted the office review evidence and a proportion where the median adjustment would have been zero but the script level differences from the team leader included large positives and negatives.
64
Morrissy (1999) expanded the study to include all the subjects in which the office review was conducted. Overall, a quarter of examiners were referred to the office review. In contrast to Pinot de Moira’s findings, examiners who were referred to the office review but for whom no adjustment was made appeared to have least proportion of upgrades. Morrissy believed this suggested that several of these examiners need not have been referred to the office review at all. Office review examiners whose marking was adjusted also attracted a relatively low level of post-results. Morrissy showed that it is likely that this was because the adjustments made were sufficient and accurate enough to correct many problematic markers. In neither study was it possible to determine how many upgrades were prevented by using the office review procedure. Borderline reviews Since the marks that candidates’ receive on an examination are rarely perfectly accurate there is a high probability that some of those whose marks fall close to a grade borderline have a true achievement which would place them on the other side of it. For this reason awarding bodies give extra scrutiny to the work of those candidates whose marks fall near grade borderlines. Such checks are known as borderline reviews and are intended to ensure that more candidates receive their true grade than would otherwise be the case. According to Cresswell (1983a, 1983b, 1985) borderline reviews fall into four types: an independent re-mark of the candidates’ scripts, using the original marking scheme and without knowledge of the original marks; a re-mark using the original marking scheme, but with knowledge of the original marks; a re-assessment of the scripts on a somewhat different basis without knowledge of the original marks; a re-assessment on a somewhat different basis with knowledge of the original marks. In the latter two cases the re-assessment would be holistic in nature. He suggested that borderline reviews may identify and thus lead to the correction of the following errors in candidates’ marks: clerical errors; unacceptably frequent errors made by individual assistant examiners, whether systematic or unsystematic; errors due to other defects in the examination or marking process, for example the presence of difficult or severely marked questions in a paper which allows candidates a choice of question. He also argued that they may have the functions of identifying qualities in the candidates’ scripts which despite the candidates’ overall marks merit the award of a higher grade; and of reducing the intrinsic inaccuracy of candidates’ marks which is due to the imperfect nature of any practical educational measurement. However, he pointed out a number of limitations of borderline reviews. They are restricted to a few ‘key’ grades which seems unfair because from a candidates’ point of view all grades are important. Further they are only carried out for candidates one or two marks away from the grade boundaries – which given what we know about the unreliability of examinations may be unfair. He suggested that although some errors may be identified during a borderline review there are more efficient methods of detecting such errors; in particular, the double marking of scripts. Cresswell points out that for practical and resource reasons borderline reviews hardly ever take the form of an independent re-marking of the borderline candidates’ scripts. Instead holistic judgements are made concerning the grades which the scripts merit. He claimed that it is unlikely that reliability is enhanced by this approach. This practice of basing borderline decisions
65

upon holistic impressions of candidates’ work only seems appropriate when the original marks were awarded on a similar holistic basis. Indeed from studying the effects of different methods of conducting borderline reviews Cresswell concluded that this approach to borderline reviewing, in which holistic judgements completely over-rule the original marks, usually worsens rather than improves the reliability of the borderline candidates. However, if the holistic judgements are combined appropriately with the original marks, a composite can be formed which will always be more reliable than either, provided that the holistic judgements are correlated to some extent with the original marks. He proposed that to improve the effectiveness of the procedure, the results of the borderline review should be combined with the candidates ‘original marks. This is facilitated if the borderline review gives rise to marks rather than grades. Further, the common practice of only reviewing the work of candidates below a borderline implies that it is more acceptable for a candidate to receive too high a grade than too low a grade. The ultimate aim should be for candidates to receive the grades which most accurately reflect their achievement. Consequently, the work of candidates on both sides of any given boundary should be reviewed and grades adjusted downwards as well as upwards as a result. There is, however, evidence of systematic bias in the re-markers’ treatment of candidates selected for review (Scharaschkin, 1997). Scharaschkin investigated the nature of mark changes made by examiners carrying out reviews in six AEB A level subjects. There were significant differences between the mark changes in Sociology and English Literature on the one hand, and French, Geography, Mathematics and Psychology on the other. The re-marking examiners in Sociology, in particular, and, to a lesser degree, English Literature, increased marks more often than would be expected. Meyer (2000a, 2000b) investigated methods for identifying examiners over whose marking doubt remains even after their marks have been adjusted, so that their marking can be considered at a borderline review. She put forward possibilities for identifying lingering doubt examiners, including candidates’ estimated grades, the pattern of grades at the same centre in the previous year and candidates’ performance on the individual components. She explored the use of regression analysis to compare the actual marks for each examiner for a component with the predicted marks for the set of candidates marked by each examiner based on their estimated grades and their marks on other papers. Examiners were then ranked in terms of the closeness of the means of their actual and predicted marks. Although poor agreement between actual and predicted marks could be a function of the centres or the examination, it could also be consistent with poor marking. Using these methods, between 33 and 41 per cent (depending on statistical indicator used) of those selected were considered after subjective investigation, to need adjustment. Checking for clerical errors Clerical errors are errors in the recording of marks awarded. They can affect the reliability of marking just as much as inappropriate application of the mark scheme. Checkers verify that every answer on the script has been marked, that the marks have been added up correctly, and the mark on the script has been transferred correctly to the mark sheet. Each year the AQA and its predecessor boards has collected and analysed data concerning clerical errors made by examiners (e.g. Jones, 2000, 2001, 2002; Pinot de Moira and Davies, 2001, 2002a and b). Jones (2002) found that 38 per cent of GCE examiners made errors. Seventy per cent of GCSE examiners made errors, although 31 per cent made errors on only 1 per cent of their script
66

allocation. This study did not differentiate between errors that would and would not have affected the candidate’s grade if undetected. An advantage of electronic marking (e-marking) is that these kinds of errors, and the need to check for them, are eradicated. The reliability of e-marking is discussed next. The reliability of e-marking In theory the introduction of e-marking should produce an increase in marking reliability compared to traditional paper based approaches. E-marking allows more effective monitoring of examiner reliability while marking is underway, allowing the identification and investigation of problems at an early stage, when interventions can be made most efficiently. Further the e-capture of marks prevents examiners from recording marks that are out of the range prescribed by the mark scheme. Given the amount of e-marking which occurs in the US and the huge increases in the amount of e-marking planned by UK awarding bodies, there are surprisingly few published studies of the relative reliability of paper-based and electronic marking. Available studies show small and inconsistent differences in the reliability of the marking methods. Twing and Harrison (2003) compared paper-based and image-based marking of a writing assessment in the US. The marks generated under the paper-based system were slightly more reliable than the marks generated under the image-based system. This was true of all measures of reliability used: grades were the same or adjacent in 90.1 per cent of cases for image-based marking and 91.8 per cent for paper-based marking; the correlation between marks assigned by the first and second marker was 0.64 for image-based marking and 0.70 for paper based marking; the Kappa coefficient (which adjusts the measure of reliability for chance agreement) was 0.32 for image-based marking and 0.35 for paper-based marking. The authors described the differences in reliability between the two methods of marking as statistically significant, but not practically meaningful. Sturman and Kispal (2003) compared electronic and paper based marking of three papers assessing reading, writing and spelling in pupils aged seven to ten. The marks generated varied by paper, age and method of marking. On some occasions paper marking was more generous, on others e-marking was. They suggested that different issues of marker judgement arise in particular aspects of e-marking and conventional marking, but will not advantage or disadvantage pupils in a consistent way. At the test level, analysis showed highly comparable outcomes between the methods. Unfortunately no double marking using each method was included so it was not possible to comment on the relative reliabilities of each method. Raikes (2002) compared the reliability of paper-based and image-based marking of GCE Mathematics, Geography and English Literature scripts. Two types of on-screen marking were investigated: whole script marking and individual question marking. In English Literature examiners were a little more severe on screen than on paper. They were most consistent when marking on paper and least consistent when marking individual items on screen. This may have been because examiners were unable to be influenced by a candidate’s performance on other questions when the scripts were split by question. In Mathematics, examiners applied similar standards and were similarly consistent across the three methods. In Geography one examiner was a little more severe when marking on screen and one was less consistent when marking on screen than on paper. The increased severity associated with on-screen marking is not a problem as long as it affects all candidates equally. Raikes concluded that screen based marking of whole scanned paper scripts would be likely to be as reliable as conventional marking, but individual question marking would require further investigation.
67

Fowles (2002) compared e-marking and conventional marking in GCE Chemistry. There was a close relationship between the two sets of marks. Examiners were no more severe or lenient when e-marking. The mean difference in total marks over all the scripts was a mere 0.13 marks. There was also a very high correlation (0.99) between the two sets of total marks. E-marking often involves examiners marking individual items rather than whole scripts. Although part versus whole marking is a topic that might be expected to have received research attention, Fowles (2005) found little reference to this aspect of marking. She suggested that as e-marking is extended there will be more opportunities for empirical study of the view that segmentation can ‘add to the objectivity of the marking’ (Bakker and van Lent, 2003). Williams and van Lent (2002) identified three particular factors expected to contribute to the fairness of e-marking of parts: (a) the complete anonymity of the responses being marked (the items being marked carry no name, gender or centre information); (b) minimal opportunity to build up a ‘halo’ effect’; and (c) the random allocation of a candidate’s responses to a range of markers, which means that any examiner error in marking will be randomly distributed across individual candidates. This last factor means that mark/re-mark reliability should be higher than if one marker had marked all the items. CONCLUSIONS The literature reviewed has made clear the inherent unreliability associated with assessment in general, and associated with marking in particular. The extent of this unreliability may vary across subjects and assessment formats, and may be improved through marker training, attention to marking schemes and so on. Nonetheless while particular assessment formats, for example essays, are valued by those involved in education there has to be an acceptance that the marks or grades that candidates receive will not be perfectly reliable. There are two possible responses to that acceptance, report the level of reliability associated with marks/grades, or find alternatives to marking. These possibilities are discussed below. The need to routinely report reliability statistics alongside grades Please (1971) and Newton (2003) pointed out that even with high values of the marker reliability coefficient, the proportion of candidates likely to be wrongly graded is likely to be large. Indeed Baird and Mac (1999) reported a meta-analysis of reliability studies conducted by the AEB in the early 1980s to show the relationship between inter-marker reliability measures and the proportion of candidates getting the same grade. They demonstrate that even near perfect reliability estimates of 0.98 are associated with up to 15 per cent of the candidates not achieving the same grade. A reduction in reliability to 0.90, which is still a reasonable figure, saw between 40 per cent and 50 per cent of candidates not receiving the same grade. As discussed earlier, given the variability in the marker reliability estimates that has been documented, teachers, examiners and the consumers of examination results need to be better informed about the importance and limitations of reliability in the evaluation of attainment. This has been argued for a long time and by a number of authors. As early as 1968, Skurnik and Nuttall voiced concern that awarding bodies issue certificates which conceal margins of error of unstated magnitude. Skurnik and Nuttall cited the good practice of a number of public examination bodies in the USA that attempt to communicate the margin of error inherent in the assessment. They issue the results of tests in the form of a band of scores for each candidate, based upon the standard error, as well as a single score for each person. They also publish the reliability coefficient associated with the examination.
68

This was also the view held by the Joint Matriculation Board (JMB) in 1969 when it proposed a revision to the A level grade scale that recognised the uncertainty in the measurement. The proposal was taken up by the government but abandoned by the Secretary for State for Education and Science after extensive consultations. The JMB continued to draw attention to its suggestion that “results should be accompanied by a statement of the possible margin of error” (JMB, 1983, p.65-66). More recently Wiliam (2003) was extremely vocal in arguing for the routine provision of reliability data for national curriculum assessments, GCSE and GCE examinations. He believes that as long as we accept the notion that for a given assessment a particular candidate will have a ‘true score’ then a candidate will have a true grade or level. For candidates whose true score is close to a grade boundary, even if the test is highly reliable then they will sometimes get a grade other than their true grade. He pointed out that in the 1970s the examination boards openly admitted that grades were accurate to at most one grade either way. The reporting of reliability data would adhere to the recommendations of the American Educational Research Association, American Psychological Association and the National Council on Measurement in Education (1999). They state that for each score reported estimates of relevant reliabilities and standard errors of measurement should be provided in adequate detail to enable the test user to judge whether scores are sufficiently accurate for the intended use of the test. There have been a number of suggestions as to how the reporting of reliability statistics to the public should be approached. Please (1971) proposed that candidates should be awarded a range of grades as a way of indicating the reliance which may be put on the results. Newton (2003) argued that confidence intervals might be used to make clear the limits of the reliability of testing in the national curriculum. Instead of simply reporting a single mark for each student, a range of marks would be reported beyond which it seems unlikely that the student would have achieved. Wiliam (2003) made the case that reliability data should be presented in a form that reflects how the results of the assessments are actually used. Traditional definitions of reliability as a form of ‘signal-to-noise’ ratio designed for continuous variables creates an unwarranted sense of security when used to describe assessments that are reported on discrete scales that are used to support dichotomous decisions. Wiliam demonstrates that the reliability of an assessment system looks very different when presented as a correlation coefficient or in the form of the number of candidates getting their ‘correct’ grades. As shown by Baird and Mac (1999) a correlation coefficient of 0.98 could be associated with as many as 15 per cent of candidates receiving the wrong grade. So reliability should be defined as the accuracy of the grades or levels. Great care would need to be taken in the reporting the accuracy of the grades or levels. For example, Newton (2003) warns against using the term ‘misclassification’ when a change results from a small mark difference. He argues that it suggests a kind of precision that is not appropriate for describing the ‘fuzzy folk constructs’ that are being assessed. There would need to be further empirical and conceptual groundwork aimed at reaching consensus on the degree of reliability that is acceptable and unacceptable for the uses to which test results are put. This would require research not only into the technical properties of the tests but also into the meanings and consequences of the test results for stakeholders.
69

However, to not routinely report the levels of unreliability associated with examinations leaves awarding bodies open to suspicion and criticism. For example, Satterly (1994) suggests that the dependability of scores and grades in many external forms of assessment will continue to be unknown to users and candidates because reporting low reliabilities and large margins of error attached to marks or grades would be a source of embarrassment to awarding bodies. Indeed it is unlikely that an awarding body would unilaterally begin reporting reliability estimates or that any individual awarding body would be willing to accept the burden of educating test users in the meanings of those reliability estimates. Alternatives to marking Thurstone paired comparison of scripts Pollitt (2004) and Pollitt and Crisp (2004) suggested replacing traditional marking with Thurstone paired comparison of scripts based upon the examiners’ impression of the work. Instead of counting the number of correct points students make, the method relies on judgement of the comparative quality of responses in entire scripts (or even each candidate’s entire set of work for a subject). This provides a method of constructing an interval scale from judgements. Pollitt argued that this is possible because although human judges are likely to have their own internalised standards about what constitutes an item of a certain quality, if they compare two things then their own standard cancels out. A true measurement scale can be constructed which shows the value of performances relative to each other. The method generates a measurement parameter estimate for each script and also the standard error of that estimate. This method could also make awarding meetings (where grade boundaries are decided) redundant if some of last year’s scripts were included. In addition, scripts that lie close to a boundary between grades and where the standard error goes over the boundary could be sent for extra comparisons to reduce the risk of misgrading. The statistical analysis would also pick up misfitting scripts (where there is inconsistency in the judgements about a script). Such scripts, which are proving difficult to judge could be sent to a senior examiner for further judgements. The statistics also allow for the consistency of individual judges to be monitored and could lead to early decisions to stop an examiner. Pollitt and Crisp (2004) presented evidence that this method could lead to a more valid assessment by reducing the restrictions placed on the way that questions are written when the traditional marking is to be used. However, this method requires more than one examiner to make comparisons about the same script (on average each script would need to be compared to 20 other scripts). Unless comparisons can be made quickly this could increase examiners’ workload. Given that multiple assessments of scripts are required, the pros and cons of this approach compared to that of double-marking need to be investigated. Computer marking Computer marking of candidates’ responses to closed questions is used routinely, but automated scoring of open responses is the focus of ongoing research. A number of approaches have been taken to automatic scoring. Cohen, Ben-Simon and Hovav (2003) took the approach of having the computer analyse the surface features of the response, such as the number of characters entered, the number of sentences, sentence length, the number of low-frequency words used, and so on. The success of methods such as this has been judged by comparing the correlation between computer and human markers, and the correlation between scores given by two sets of human markers. Cohen et al looked at the scoring of a range of
70
essay types by humans and computer, and reported that the correlation between the number of characters keyed by the candidate, and the scores given by human markers are as high as the correlation between scores given by human markers. Ridgway and McCusker (2004) argued that it is unlikely that this kind of computer marking would be used in the UK. The UK culture requires that mark schemes be described in ways that are useful to teachers and candidates. Moreover the consequential validity of such marking systems would be “dire” (p.23). The advice to candidates would be to improve their scores simply by using more keystrokes. A second approach to automated scoring assesses student responses on tasks where the range of acceptable responses can be well defined; such as in short answer science tasks (Sukkarieh, Pulman and Raikes, 2003, for example). Based on analyses of large numbers of student responses, lists of appropriate and inappropriate responses, synonyms for nouns and verbs and alternative grammatical forms are produced. Student responses are parsed using techniques borrowed from Natural Language Processing, and are compared with stored appropriate and inappropriate responses, using a variety of Information Extraction techniques (see Cowie and Lehnert 1996). A similar approach to marking tasks with a more limited range of acceptable responses has been used by AQA (Fowles, 2005) which they refer to as ‘automatic marking’. Responses to items identified for automatic marking are all double-keyed. A list of all responses with their frequencies is given to the senior examiner, whose task is to mark each response on the list. The computer then allocates the mark determined for each candidate’s response according to the senior examiner’s marking rules. Fowles points out that automatic marking is perfectly reliable in the sense that it will produce the same set of marks on a second occasion of marking. Nonetheless, a second set of marks might differ if a second examiner were to provide the marking rules. It is unlikely that marking solely by computer will be acceptable in the foreseeable future. It has been suggested (Lamprianou, 2004, for example) that a pragmatic and effective way of improving marking reliability might be to have each script marked by a human marker and by software. In the case of a marking discrepancy, a second human marker would be called in for a second blind marking. Michelle Meadows and Lucy Billington, May 2005, W:\Michelle\Michelle Meadows\Quality of Marking\Lit Review\Review Sections\A Review of the Literature on Marking Reliability.doc
71

REFERENCES
Akeju, S. A. (1972) The reliability of General Certificate of Education Examination English composition papers in West Africa. Journal of Educational Measurement, v9 n2 p175-179.
Al-Bayatti, M. (2005) Effect of sample size on diminishing returns of differences in marking. Report
produced for the National Assessment Agency. Alderson, J. C., Clapham, C. & Wall, D. (1995) Language test construction and evaluation. Cambridge:
Cambridge University Press. Alton, A. (1991) Pilot studies into teacher accreditation: pilot study A. University of Oxford Delegacy of
Local Examinations (UODLE). American Educational Research Association, American Psychological Association, National Council on
Measurement in Education (1999) Standards for educational and psychological testing. Washington, DC: American Educational Research Association.
Archer, J. & McCarthy, B. (1988) Personal biases in student assessment. Education Research, v30 n2
p142-145. Arnold, V., Legas, Obler, S., Pacheco, M., Russell ,C. & Umbdenstock, L. (1990) Do students get higher
scores on their word processed papers? A study of bias in scoring handwritten versus word processed papers. Whittier, CA: Rio Hondo College.
Babad, E. Y. (1980) Expectancy bias in scoring as a function of ability and ethnic labels. Psychological
Reports, v46 p625-626. Baird, J. (1997) Can enquiries be avoided? The effects of the new CGCL procedures. AEB Research
Report, 748. Baird, J. (1988) What's in a name? Experiments with blind marking in A-level examinations. Educational
Research, v40 n2 p191-202. Baird, J. (1999) Blind marking in GCSE and A-level examinations. AEB Research Report, RC/10. Baird, J. & Bridle, N. (2000) A feasibility study on anonymised marking in large-scale public
examinations. AQA Research Report, RC/91. Baird, J., Greatorex, J. & Bell, J. F. (2002) What makes marking reliable? Experiments with UK
examinations. AQA Research Report, RC191. Baird, J., Greatorex, J. & Bell, J. F. (2003) What makes marking reliable? Experiments with UK
examinations. AQA Research Report, RC217. Baird, J. & Mac, Q. (1999) How should examiner adjustments be calculated? - A discussion paper. AEB
Research Report, RC13. Baird, J. & Pinot de Moira, A. (1997) Marking reliability in summer 1996 A level business studies. AEB
Research Report, RAC/760. Bakker, S. & van Lent, L. G. (2003) National testing on line how far can we go? Paper presented at the
IAEA Conference, Manchester. Retrieved 5 January 2005 from http://www.aqa.org.uk/support/iaea/papers.html.
Ballard, P. B. (1923) The new examiner. London. University of London Press. Barrett, S. (2000) HECS lotto: Does marker variability make examinations a lottery? University of South
Australia.
72

Barritt, L., Stock, P.L. & Clark, F. (1986) Researching practice: evaluating student essays. College Composition & Communication, v37 p315-327.
Belsey, C. (1988) Marking by numbers. AUT Women, v15. Berkowitz, D., Wolkowitz, B., Fitch, R. & Kopriva, R. (2000) The use of tests as part of high-stakes
decision-making for students: a resource guide for educators and policy makers. Washington, DC: US Department for Education.
Black, E. L. (1962) The marking of GCE scripts. British Journal of Educational Studies, v11 p61-71. Black, J. H., Hall, J., Martin, S. & Yates, J. (1989) The quality of assessments: Case studies in the
national certificate. Scottish Council for Research in Education. Bradley, C. (1984) Sex bias in the evaluation of students. British Journal of Social Psychology, v23
p147-153. Branthwaite, A., Trueman, M. & Berrisford, T. (1981) Unreliability of marking: further evidence and a
possible explanation. Educational Review, v33 n1 p41-46. Braun, H. I. (1986) Calibration of essay readers: final report. (Technical Report No. 86-68) Princeton,
NJ: Educational Testing Service. Braun, H. I. (1988) Understanding score reliability: experiments in calibrating essay readers. Journal of
Educational Statistics, v13 n1 p1-18. Breland, H. M. (1977) Can multiple-choice tests measure writing skills? The College Board Review,
v103 p2-6. Breland, H. M. & Jones, R.J. (1988) Remote scoring of essays (ETS RR 88-4) New York: College
Entrance Examination Board. Brennan, R. L. (1992) Elements of generalizability theory. Iowa City: ACT Publications. Brennan, R. L. (2000) Performance assessments from the perspective of generalizability theory. Applied
Psychological Measurement, v24 n4 p339-353. Brennan, R. L. (2001) Generalizability Theory. New York: Springer. Bridgeman, B. & Cooper, P. (1998) Comparability of scores on word-processed and handwritten essays
on the graduate management admissions test. A paper presented at the American Educational Research Association Conference, San Diego, CA, April 1998.
Bridgeman, B., Morgan, R. & Wang, M. (1996) Reliability of advanced placement examinations (RR-96-
3) Princeton, NJ: Educational Testing Service. Briggs, D. (1970) The influence of handwriting on assessment. Educational Research, v13 p50-55. Briggs, D. (1980) A study of the influence of handwriting upon grades using examination scripts.
Educational Review, v32 n2 p185-193 Britton, J. N. (1950) The meaning and marking of imaginative composition. New Era, v31 n7 p137-143. Britton, J. N., Martin, N.C. & Rosen, H. (1966) Multiple marking of English compositions: an account of
an experiment. Schools Council Examinations Bulletin, v12, (London, HMSO). Brooks, V. (1980) Improving the reliability of essay marking: a survey of the literature with particular
reference to the English language composition. (CSE Research Project Report 5) Leicester: Leicester University.
73

Brown, A. (1995) The effect of rater variables in the development of an occupation specific language performance test. Language Testing, v12 n1 p1-15.
Buckner, D. N. (1959) The predictability of ratings as a function of inter-rater agreement. Journal of
Applied Psychology, v43 p60-64. Bull, G. M. (1956) An examination of the final examination in medicine. The Lancet, p368-372. Bull, R. & Stevens, J. (1979) The effects of attractiveness of writer and penmanship on essay grades.
Journal of Occupational Psychology, v52 p53-59. Byrne, C. (1979) Tutor-marked assignments at the Open University: A question of reliability. Teaching at
a Distance, v15 p34-43. Case, S.M. & Swanson, D.B. (1993) Extended matching items: a practical alternative to free response
questions. Teaching and Learning in Medicine, v5 p107-115. Cast, B. M. D. (1939) The efficiency of different methods of marking English composition. British Journal
of Educational Psychology, vIX p257-269. Cast, B. M. D. (1940) The efficiency of different methods of marking English composition. British Journal
of Educational Psychology, vX p49-60. Chaplen, E. F. (1969) The reliability of the essay subtest in a university entrance test in English for non-
native speakers of English. In G. E. Perren, & J.L.M. Trim (Eds.), Applications of Linguistics - papers from the second International Congress of Applied Linguistics, Cambridge, 1969. Cambridge: Cambridge University Press.
Charney, D. (1984) The validity of using holistic scoring to evaluate writing. Research in the Teaching of
English, v18 p65-81. Chase, C. (1968) The impact of some obvious variables on essay test scores. Journal of Educational
Measurement, v5 p315-318. Chase, C. I. (1983) Essay test scores and reading difficulty. Journal of Educational Measurement, v20
n3 p293-297. Chung, G. K. W. K. & O’Neil, H.F., Jr. (1997) Methodological approaches to on-line scoring of essays.
ERIC Document Reproduction Service No. ED 418 101. Cialdini, R. B., Darby, B. L., & Vincent, J.E. (1973) Transgression and altruism: a case for hedonism.
Journal of Experimental Social Psychology, v9 p502-516. Ciechanowicz, A. (1983) Effect of author's and subject's gender on perception of author and text. Polish
Psychological Bulletin, v14 p107-112. Clark-Carter, D. (1997) Doing quantitative psychological research: From design to report. Hove:
Psychology Press Ltd. Clark, L., & Wolf, A. (1991) Assessing the knowledge of Blue Badge Guides.: Final Report to the
Employment Department. London: Institute of Education. Coffman, W. E. (1971) Essay examinations. In R. L. Thorndike (Ed.), Educational measurement.
Washington DC: American Council on Education. Coffman, W., & Kurfman, D. (1968) A comparison of two methods of reading essay examinations.
American Educational Research Journal, v5 n1 p11-120. Cohen, J. (1960) A coefficient for agreement for nominal scales. Educational & Psychological
Measurement, v20 p37-46.
74

Cohen, J. (1968) Weighted kappa: Nominal scale agreement with provision for scale disagreement or
partial credit. Psychological Bulletin, v70 p213-220. Cohen, Y., Ben-Simon, A. & Hovav, M. (2003) The effect of specific language features on the
complexity of systems for automated essay scoring. Paper presented at the 29th Annual Conference of the International Association for Educational Assessment, Manchester, October 2003.
Congdon, P. J. & McQueen, J. (2000) The stability of rater severity in large-scale assessment programs.
Journal of Educational Measurement, v37 n2 p163-178. Cooper, P.L. (1984) The assessment of writing ability: A review of research. (GRE Board Research
Report No. 82-15R, ETS RR-84-12) Princeton, NJ: Educational Testing Service. Cox, R. (1967) Examinations and Higher Education: Survey of the literature. London: Society for
Research into Higher Education. Cowie, J. & Lehnert, W. (1996) Information extraction. Communications of the ACM, v39 n1 p80-91. Craig, D. A. (2001) Handwriting legibility and word-processing in assessing rater reliability. Unpublished
MA thesis, University of Illinois. Cresswell, M. J. (1983a) Optimum weighting for double marking procedures. AEB Research Report,
RAC/281. Cresswell, M. J. (1983b) A theoretical look at borderline reviewing. AEB Research Report, RAC/274. Cresswell, M. J. (1985) A review of borderline reviewing. AEB Research Report, RAC/353. Crocker, L., & Algina, J. (1986) Introduction to classical and modern test theory. Orlando, FL: Harcourt
Brace Jovanovich. Cronbach, L.J. (1951) Coefficient alpha and the internal structure of tests. Psychometrika, v16 n3 p297-
334. Cronbach, L. J., & Gleser, G. C. (l964). The signal/noise ratio in the comparison of reliability coefficients.
Educational and Psycholoogical Measurement, v24 p467-480. Cronbach, L.J., Gleser, G.C., Nanda, H., & Rajaratnam, N. (1972) The dependability of behavioural
measurements: theory of generalizability for scores and profiles. New York: Wiley. Cronbach, L.J., Nageswari, R., & Gleser, G.C. (1963) Theory of generalizability: A liberation of reliability
theory. The British Journal of Statistical Psychology, v16 p 137-163. Cronbach, L. J., & Shavelson, R.J. (2004) My current thoughts on coefficient alpha and successors.
procedures. (CSE Report 643) Los Angeles, CA: Centre for the Study of Evaluation (CSE). Cumming, A. (1990) Expertise in evaluating second language compositions. Language Testing, v7 p31-
51. Daly, J. A. & Dickson-Markman, F. (1982) Contrast effects in evaluating essays. Journal of Educational
Measurement, v19 n4 p309-315. Deaux, K. & Taynor J. (1973) Evaluation of male and female ability: bias works two ways. Psychological
Reports, v32 p261-261. Delap, M. R. (1993a) Marking reliability study in Business Studies (665) AEB Research Report
RAC/609.
75

Delap, M. R. (1993b) Marking reliability study in GCSE Geography (1163) AEB Research Report RAC/610.
Diederich, P. B. (1964) Problems and possibilities of research in the teaching of English. In D. H.
Russell and others (Eds.), Research design and the teaching of English. Champaign, III., National Council of Teachers of English (NCTE).
Diederich, P. B., French, J.W., & Carlton, S.T. (1961) Factors in judgements of writing ability (ETS
research bulletin RB-61-15) Princeton, N.J.: Educational testing service. Dracup, C. (1997) The reliability of marking on a psychology degree. British Journal of Psychology, v88
p691-708. Ebel, R. L. (1972) Why is a longer test usually a more reliable test? Educational & Psychological
Measurement, v32. Ebel, R. L. & Frisbie, D.A. (1991) Essentials of Educational Measurement (5th ed.) New Jersey:
Prentice Hall. Ecclestone, K. (2001) "I know a 2:1 when I see it": Understanding degree standards in programmes franchised to colleges. Journal of Further & Higher Education, v25 n4 p301- 313. Edgeworth, F. Y. (1888) The statistics of examinations, Journal of the Royal Statistical Society, v51
p599 – 635. Eells, W. C. (1930) Reliability of reported grading of examinations. Journal of Educational Psychology,
v21 p48-52. Elander, J., & Hardman, D. (2002) An application of judgement analysis to examination marking in
psychology. British Journal of Psychology, v93 n3 p303-328. Eley, E. G. (1953) An analysis of writing competence. Unpublished doctoral dissertation, University of
Chicago. Engelhard, G. J. (1994) Examining rater errors in the assessment of written composition with a many-
faceted Rasch model. Journal of Educational Measurement, v31 p93-112. Engvik, H., Kvale, S. & Havik, O.E. (1970) Rater reliability in evaluation of essay and oral examinations.
Scandinavian Journal of Educational Research, v14 p195-220. Erwin, P. G. & Calev, A. (1984) The influence of Christian name stereotypes on the marking of children's
essays. British Journal of Educational Psychology, v54 p223-227. Fan, X. & Yin, P. (2003) Examinee characteristics and score reliability: An empirical investigation.
Educational & Psychological Measurement, v63 n3 p357-368. Fajardo, D. M. (1985) Author race, essay quality and reverse discrimination. Journal of Applied Social
Psychology, v15 p255-268. Farrell, M. J. & Gilbert, N. (1960) A type of bias in marking examination scripts. British Journal of
Educational Psychology, v30 p47-52. Finlayson, D. S. (1951) The reliability of the marking of essays. British Journal of Educational
Psychology, v21 p126-134. Fitz-Gibbon, C. T. (1996) Monitoring education: Indicators, quality and effectiveness. London: Cassell. Foley, J. J. (1971) Evaluation of learning in writing. In B. S. Bloom, J.T. Hastings, & G.F. Madans (Eds.),
Handbook on formative and summative evaluation. New York: McGraw Hill.
76
Follman, J. C. & Anderson, U.A. (1967) An investigation into the reliability of five procedures for grading English themes. Research in the Teaching of English, v1 n2 p190-200.
Fowles, D. (2002) Evaluation of an e-marking pilot in GCE Chemistry: Effects on marking and
examiners' views. AQA Research Report, RC/190. Fowles, D. (2005) Literature review on effects on assessment of e-marking. AQA Research Report. Freeberg, N.E. (1969) Relevance of rater-ratee acquaintance in the validity and reliability of ratings.
Journal of Applied Psychology, v53 p518-524. Freedman, S. (1981) Influences on evaluators of expository essays: Beyond the text. Research in the
Teaching of English, v15 p245-255. Freedman, S. W. (1984) The registers of student and professional expository writing: Influences on
teachers' responses. In R. Beach & L. S. Bridwell (Eds.), New Directions in Composition Research. New York: The Guilford Press. Cited in Barritt, L., Stock, P.L., & Clark, F. (1986) Researching practice: evaluating student essays. College Composition & Communication, v37, p315-327.
Furneaux, C. & Rignall, M. (forthcoming) The effect of standardisation-training on rater-judgements for
the IELTS Writing Module. In L. Taylor, & P Falvey (Eds.), IELTS collected papers: research in speaking and writing assessment. Cambridge: Cambridge University Press/UCLES Cambridge ESOL.
Goddard-Spear, M. (1984) The biasing influence of pupil sex in a science marking exercise. Research in
Science & Technological Education, v2 n1 p55-60. Greatorex, J., Baird, J., & Bell, J.F. (2002) 'Tools for the trade': What makes GCSE marking reliable?
Paper presented at the EARLI Special Interest Group on Assessment & Evaluation, University of Northumbria, UK, August 2002.
Greatorex, J. & Bell, J.F. (2002a) Does the gender of examiners influence their marking? Paper
presented at the Learning communities and assessment cultures: Connecting research with practice, University of Northumbria.
Greatorex, J. & Bell, J.F. (2002b) What makes a senior examiner? Paper presented at the British
Educational Research Association, University of Exeter. Grobe, C. (1981) Syntactic maturity, mechanics and vocabulary as predictors of quality ratings.
Research in the Teaching of English, v15 p75-86. Hake, R. (1986) How do we judge what they write? In K.L. Greenberg, H.S. Wiener,& R.A. Donovan
(Eds.), Writing assessment: Issues and strategies. New York: Longman. Hales, L. W., and Tokar, E. (1975) The effect of the quality of preceding responses on the grades
assigned to subsequent responses to an essay question. Journal of Educational Measurement, v12 p115-117.
Hall, C. G. & Daglish N. D. (1982) Length and quality: An exploratory study of inter-marker reliability. Assessment & Evaluation in Higher Education, v7 n2 p186-191.
Hall, K. & Harding, A. (2002) Level descriptions and teacher assessment in England: Towards a
community of assessment practice. Educational Research, v44 n1 p1- 16. Ham, V. (2001) Maintaining National Standards in Standards Based Assessment: The New Zealand
Experience. Paper presented at the British Educational Research Association, University of Leeds, September 2001.
Hamp-Lyons, L. (1989) Raters resond to rhetoric in writing. In H.W. Dechert and Raupauch (Eds),
Interlingual Processes. Tubingen: Gunter Narr.
77

Hamp-Lyons, L. (1990) Second language writing: Assessment issues. In B. Kroll (Ed.), Second
Language Writing. Cambridge: Cambridge University Press. Hamp-Lyons, L., & Mathias, S. (1994). Examining expert judgments of task difficulty on essay tests.
Journal of Second Language Writing, v3 n1 p49-68. Harper, A. E. (1967) Ninety marking ten: a study of examinations. Indian Educational Review, v2 n1
p26-41. Harman, H. H. (1967) Modern factor analysis. Chicago: University of Chicago Press. Harris, M. B. (1975) Sex role stereotypes and teacher evaluations. Journal of Educational Psychology,
v67 p751-756. Hartson, L. D. (1930) A five-year study of objective-tests for sectioning courses in English composition.
Journal of Applied Psychology, v14 p202-210. Hartog, P. & Rhodes, E. C. (1935) An examination of examinations. London: Macmillan. Hartog, P. & Rhodes, E. C. (1936) The marks of examiners. London: Macmillan. Hayes, J. R., & Hatch, J. A. (1999) Issues in measuring reliability: Correlation versus percentage of
agreement. Written Communication, v16 n3 p354-367. Head, J. J. (1966) Multiple marking of an essay item in experimental O-level Nuffield biology
examinations. Educational Review, v19 n1 p65-71. Higher Education Quality Council (1997) Assessment in Higher Education and the role of
'Graduateness'. London: H.E.Q.C., Graduate Standards Programme. Hill, B. J. (1975) Reliability of marking in BSc examinations in engineering. International Journal for
Mechanical Engineering Education, v32 p97-106. Hill, B. J. (1978) Examination paper length: how many questions? British Journal of Educational
Psychology, v29 p213-216. Houston, J. G. (1983) Internal assessment: some reflections. AEB Research Report, RAC/245. Huddleston, E. M. (1954) Measurement of writing ability at the college-entrance level: objective vs.
subjective testing techniques. Journal of Experimental Education, v22 p165-213. Hughes, A. (1989) Testing for language teachers. Cambridge: Cambridge University Press. Hughes, A. (2003) Testing for language teachers (Second edition.) Cambridge: Cambridge University
Press. Hughes, D. C., Keeling, B., & Tuck, B.F. (1980a) Essay marking and the context problem. Educational
Research, v22 n2 p147-148. Hughes, D. C., Keeling, B., & Tuck, B.F. (1980b) The influence of context position and scoring method
on essay scoring. Journal of Educational Measurement, v17 p131-135. Hughes, D. C., Keeling, B., & Tuck, B.F. (1983) The effects of instructions to scorers intended to reduce
context effects in essay scoring. Educational & Psychological Measurement, v34. Hughes, D. C. & Keeling., B. (1984) The use of model essays to reduce context effects in essay scoring.
Journal of Educational Measurement, v21 p277-281.
78

Humphris, G. M. & Kaney, S. (2001) Examiner fatigue in communication skills OSCEs. Medical Education, v35 p444-449.
Huot, B. (1988) The validity of holistic scoring: A comparison of the talk-aloud protocols of novice and
expert holistic raters. Indiana University. Huot, B. (1990) Reliability, validity and holistic scoring: What we know and what we need to know.
College Composition & Communication, v41 p201-213. Husbands, C. T. (1976) Ideological bias in the marking of examinations. Research in Education, v15
p17-38. Jacobson, M. B., & Effertz, J. (1974) Sex roles and leadership perceptions of the leaders and the led.
Organizational Behaviour and Human Performance, v12 p383-397. James, C. (1974) The consistency of marking a physics examination. Physics Education, v9 p271-274. James, H. (1927) The effect of handwriting on grading. English Journal, v16 p180-205. Joint Matriculation Board (1969) Report on double marking of essays in General Studies (Advanced)
1969. JMB Research Report Joint Matriculation Board (1969) Report on double marking of essays in English Language (Ordinary)
Papers B and C, 1969. JMB Research Report. Joint Matriculation Board (1983) Problems of the GCE advanced level grading scheme. JMB Research
Report. Jones, B. E. (2000) Evaluation of the AQA (north)’s script checking exercise, Summer 2000. AQA
Research Report, RC/92. Jones, B. E. (2001) Checking the checkers – a report on a script re-checking exercise undertaken in the
Manchester office of the AQA, Summer 2001. AQA Research Report, RC/154. Jones, B. (2002) Clerical errors in marking - Manchester office- year 2001 summer examinations. AQA
Research Report, RC177. Kaczmarek, C. (1980) Scoring and rating essay tasks. In O. A. Perkins (Ed.), Research in Language
Testing. Rowley, MA: Newbury House. Laming, D. (1990) The reliability of a certain university examination compared with the precision of
absolute judgments. Quarterly Journal of Experimental Psychology, v42 p239-254. Lamprianou, J. (2004) Marking quality assurance procedures: identifying good practice internationally.
Report prepared for the National Assessment Agency. Landauer, T. K., & Dumais, S.T. (1997) A solution to Plato's problem: The Latent Semantic Analysis
theory of the acquisition, induction and representation of knowledge. Psychological Review, v104 p211-240.
Lave, J. & Wenger, E. (1991) Situated learning legitimate peripheral participation. Cambridge:
Cambridge University Press. Linacre, J. M. (1994) Many-facet Rasch measurement. Chicago: MESA Press. Linacre, J. M. (2002) Judge ratings with forced agreement. Rasch Measurement Transactions, v16 n1
p857-858.
79

Linacre, J. M., Englehard, G., Tatem, D. S., & Myford, C. M. (1994) Measurement with judges: many-faceted conjoint measurement. International Journal of Educational Research, v21 n4 p569-577.
Linacre, J. M., Wright, B.D. & Lunz, M.E. (1990) A Facets Model for judgmental scoring. Accepted for a
special issue of Applied Measurement in Education, but not published due to lack of space. Lee, Y. W., Kantor, R. & Mollaun, P. (2002) Score dependability of the writing and speaking sections of
new TOEF. Princeton, NJ: Educational Testing Service. Lehmann, R. H. (1990) Reliability and generalizability. Studies in Educational Evaluation, v16 p501-512. Lenney, E., Mitchel, L., & Browning, C. (1983) The effect of clear evaluation criteria on sex bias in
judgements of performance. Psychology of Women Quarterly, v7 n4 p313-327. Longford, N. T. (1993) Reliability of essay rating and score adjustment (RR-93-52) Princeton, NJ:
Educational Testing Service. Longford, N. T. (1994) A case for adjusting subjectively rated scores in the Advanced Placement tests.
(Program Statistics Research Technical report, No. 94-5) Princeton, NJ: Educational Testing Service.
Lucas, A. M. (1971) Multiple marking of a matriculation biology essay question. British Journal of
Educational Psychology, v41 n1 p78-84. Lumley, T. L., Lynch, B.K. & McNamara, T.F. (1994) A new approach to standard setting in language
assessment. Melbourne Papers in Language Testing, v3 n2 p19-40. Lumley, T. & McNamara, T.F. (1995) Rater characteristics and rater bias: Implications for training.
Language Testing, v12 n1 p54-71. Lunz, M. E., & Stahl, J. A. (1990) Judge consistency and severity across grading periods. Evaluation &
the Health Professionals, v13 n4 p425-444. Lunz, M. E., & O'Neill, T.R. (1997) A longitudinal study of judge leniency and consistency. Paper
presented at the Annual meeting of the American Educational Research Association, Chicago Illinois, March 24-28 1997.
Lunz, M. E., Stahl, J. A., & Wright, B.D. (1994) Interjudge reliability and decision reproducibility.
Educational & Psychological Measurement, v54 p913-925. Lunz, M. E., Stahl, J. A., & Wright, B.D. (1996) The invariance of judge severity calibrations. In J. M.R.
Wilson & G. Engelhard (Eds.), Objective Measurement Theory into Practice. Norwood, NJ: Ablex.
Lunz, M. E., Wright, B.D. & Linacre, J.M. (1990) Measuring the impact of judge severity on examination
scores. Applied Measurement in Education, v3 p331-345. Macnamara, J. & Madaus, G.F. (1969) Marker reliability in the Irish leaving certificate. Irish Journal of
Education, v3 n1 p5-21 Magnusson, D. (1967) Test theory. Reading. MA: Addison Wesley. Markham, L. R. (1976) Influence of handwriting quality on teacher evaluation of written work. American
Educational Research Journal, v13 p277-283. Massey, A. (1983) The effects of handwriting and other incidental variables on GCE 'A' level marks in
English Literature. Educational Review, v35 n1 p45-50.
80

Massey, A. & Foulkes, J. (1994) Audit of the 1993 KS3 Science National Test Pilot and the concept of quasi-reconciliation. Evaluation & Research in Education, v8 n3 p119-132.
McColly, W. (1970) What does educational research say about the judging of writing ability? Journal of
Educational Research, v64 p147-156. McCullough, M. L. (1987) Blind marking and gender identity. Bulletin of the British Psychological
Society, v40 p103. McDavid, J. W., & Harari, H. (1973) Name stereotypes and teacher expectations. Journal of Educational
Psychology, v65 p222-225. McKee, J. H. (1934) Subjective and (or versus) objective. English Journal (College Edition), v23 p127-
133. McNamara, T. (1996) Measuring second language performance. Harlow: Longman. McNamara, T. F. & Lumley, T. (1993) The effects of interlocutor and assessment made variables in
offshore assessment of speaking skills in occupational settings. Paper presented at the 15th annual Language Testing Research Colloquium, Cambridge, August 1993.
McVey, P. J. (1975) The errors in marking examination scripts in electronic engineering. International
Journal of Electronic Engineering Education, v12 p203-216. McVey, P. J. (1976) The 'paper error' of two examinations in electronic engineering. Physics Education,
v11 n1 p58-60. Meckel, H. C. (1963) Research on teaching composition and literature. In N. L. Gage (Ed.), Handbook of
research on teaching. Chicago: Rand McNally. Meyer, L. (2000a) The ones that got away - development of a safety net to catch lingering doubt
examiners. AQA Research Report, RC50. Meyer, L. (2000b) Lingering doubt examiners: results of pilot modelling analyses, summer 2000: AEB
Research Report. Michael, W. B., Cooper, T., Shaffer, P. & Wallis, E. (1980) A comparison of the reliability and validity of
ratings of student performance on essay examinations by professors of English and professors of other disciplines. Educational & Psychological Measurement, v40 p183-195.
Milanovic, M., Saville, N. & Shuhong, S. (1996) A study of the decision making behaviour of
composition-markers. In M. Milanovic, & N. Saville (Eds.), Performance testing, cognition and assessment. Cambridge: Cambridge University Press.
Morris, S. (2004) Pupils 'suffering from exam overkill'. Guardian 12 August. Morrissy, M. (1999) Office Review and post-results upgrades. AEB Research Report, RC32. Morrissy, M. (2000) Do examiners go off? - Accuracy of examiners' marking. AQA Research Report,
RC76. Moskal, B. M. (2000) Scoring Rubrics: What, When and How? Practical Assessment, Research &
Evaluation, v7 n3 p1-7. Moskal, B. M., & Leydens, J.A. (2000) Scoring rubric development: validity and reliability. Practical
Assessment, Research & Evaluation, v7 n10. Murphy, R.J. (1977) The effect of examiner adjustments on the results of the 1976 re-marking
investigation. AEB Research Report, RAC/37.
81

Murphy, R. J. (1978) Reliability of marking in eight GCE examinations. British Journal of Educational Psychology, v48 n2 p196-200.
Murphy, R. J. L. (1979) Removing the marks from examination scripts before re-marking them: Does it
make any difference? British Journal of Educational Psychology, v49 n1 p73-78. Murphy, R. J. (1982) A further report of investigations into the reliability of marking of GCE
examinations. British Journal of Educational Psychology, v52 n1 p58-63. Myers, M. (1980) A procedure for writing assessment and holistic scoring. Urbana, IL: National Council
of teachers of English, and Educational Resources Information Centre. Myford, C. M. (1991) Judging acting ability: the transition from novice to expert. Paper presented at the
American Educational Research Association, Chicago, IL, April 1991. Myford, C., Marr, D.B.. & Linacre, J.M. (1996) Reader calibration and its potential role for equating for
the test of written English. (Report No. 52) Princeton, NJ: Educational Testing Service. Myford, C.M., & R. J. Mislevy (1994) Monitoring and Improving a Portfolio Assessment System.
Princeton, NJ: Educational Testing Service. National Union of Students (NUS) (1969) NUS executive report on examinations. London: NUS. Newstead, S. E. & Dennis, I. (1990) Blind marking and sex bias in student assessment. Assessment &
Evaluation in Higher Education, v15 n12 p132-139. Newstead, S. E. & Dennis, I. (1994) Examiners examined: The reliability of exam marking in
psychology. The Psychologist: Bulletin of the British Psychological Society, v7 p216-219. Newton, P. (1996) The reliability of marking General Certificate of Secondary Education Scripts:
Mathematics and English. British Journal of Educational Research, v22 n4 p405 - 420. Newton, P. (2003) The defensibility of national curriculum assessment in England. Research in Papers
in Education, v18 n2 p101-127. Orr, L. & Nuttall, D. (1983) Determining standards in the proposed single system of examining at 16+.
London: Schools Council. Page, E. B. (1966) Grading Essays by Computer: Progress Report. Notes from the 1966 Invitational
Conference on Testing Programs, p87-100. Pal, S. K. (1986) Examiners' efficiency and the personality correlates. Indian Educational Review, v21
n1 p158-163. Park, T. (n.d.) Scoring procedures for assessing writing. Retrieved 29 April 2005 from
http://www.tc.columbia.edu/tesolalwebjournal/Park_Forum.pdf#search='holistic%20analytic%20scoring.
Partington, J. (1994) Double marking students' work. Assessment & Evaluation in Higher Education, v19
n1 p57-60. Penfold (1956) Essay marking experiments: shorter and longer essays. British Journal of Educational
Psychology, v16 p128-136. Pinot de Moira, A. (1999) Office Review evaluation. AEB Research Report, RC12. Pinot de Moira, A. (2003) Examiner background and the effect on marking reliability. AQA Research
Report, RC218.
82

Pinot de Moira, A. (Forthcoming) Do examiner characteristics affect marking reliability? AQA Research Report.
Pinot de Moira, A., & Davies, C. (2001) Clerical errors in marking - Guildford office - Year 2000
examinations. AQA Research Report, RC/123. Pinot de Moira, A.,& Davies, C. (2002a) Clerical errors in marking new specification A-levels, AS, VCE &
GNVQ exams plus SEG Legacy syllabuses, summer 2002 examinations. AQA Research Report, RC/192.
Pinot de Moira, A. and Davies, C. (2002b) Clerical errors in marking - Guildford Office - Year 2001
Examinations. AQA Research Report, RC176. Pinot de Moira, A., Massey, C., Baird, J., & Morrissy, M. (2001) Marking consistency over time. AQA
Research Report, RC/129. Pilliner, A. E. G. (1965) Review of the marking of scripts in A level History. British Journal of Educational
Psychology, v35 p110-111. Pilliner, A. E. G. (1968) Examinations. In H. J. Butcher (Ed.), Educational research in Britain. London:
University of London Press. Pilliner, A. E. G. (1969) Multiple marking: Wiseman or Cox? British Journal of Educational Psychology,
v39 p313-315. Please, N. W. (1971) Estimation of the proportion of examination candidates who are wrongly graded.
British Journal of Mathematics, Statistics & Psychology, v24 p230-238. Pollitt, A. (2004) Let's stop marking exams. Paper presented at the IAEA Conference, Philadelphia,
June 2004. Pollitt, A., & Crisp, V. (2004) Could comparative judgements of script quality replace traditional marking
and improve the validity of exam questions? Paper presented at the BERA Annual Conference, UMIST Manchester, September 2004.
Price, M. & Rust. C. (1999) The experience of introducing a common criteria assessment grid across an
academic department. Quality in Higher Education, v5 p133-144. Powers, D., & Kubota, M. (1998a) Qualifying essay readers for an online scoring network (OSN). (RR-
98-22) Princeton, NJ: Educational Testing Service. Powers, D., & Kubota, M. (1998b) Qualifying readers for the online scoring network: scoring argument
essays. (RR-98-28) Princeton, NJ: Educational Testing Service. Punter, A. & Burchell, H. (1996) Gender issues in GCSE English assessment. British Journal of
Curriculum and Assessment, v6 n2 p20 – 23. Qualifications and Curriculum Authority (QCA) (2002) Maintaining GCE A Level standards:The findings
of an independent panel of experts. London: QCA. Qualifications and Curriculum Authority (QCA) (2005) Code of practice 2005/6. Great Britain: QCA. Raikes, N. (2002) On screen marking of scanned paper scripts. Cambridge: University of Cambridge
Local Examinations Syndicate (UCLES). Raimes, A. (1985) What unskilled ESL students do as they write: A classroom study of composing.
TESOL Quarterly, v19 p229-258. Rasch, G. (1960) Probabilistic models for some intelligence and attainment tests. Chicago: University of
Chicago Press.
83

Rasch, G. (1980) Probabilistic models for some intelligence and attainment tests. (Expanded edition)
Chicago: University of Chicago Press. Ridgway, J. & McCusker, S. (2004) Literature review of E-assessment. (Report 10) NESTA Futurelab
Series. Royal-Dawson, L. (2004) Is teaching experience a necessary condition for markers of Key Stage 3
English? AQA Research Report, RC261. Rudner, L. M. (1992) Reducing errors due to the use of judges. Practical Assessment, Research &
Evaluation, v3 n3. Rudner, L. M. (2001) Computing the expected proportions of misclassified examinees. Practical
Assessment, Research & Evaluation, v7 n14. Rudner, L. M., & Schafer, W.D. (2001) Reliability. ERIC Digest. Russell, M. (2002) The influence of computer- print on rater scores. Retrieved 5 January 2005 from
http://www.bc.edu/research/intasc/PDF/ComputerPrintRaterScores.pdf. Ruth, L., & Murphy, S. (1988) Designing writing tasks for the assessment of writing. Norwood, NJ: Ablex
Publishing Corp. Sadler, D. R. (1987) Specifying and promulgating achievement standards. Review of Education, v13 n2
p191-209. Satterly, D. (1994) Quality in external assessment. In W. Harlen (Ed.), Enhancing Quality in Assessment
London: Paul Chapman. Saunders, M. N. K. &. Davis, S.M. (1998) The use of assessment criteria to ensure consistency of
marking: Some implications for good practice. Quality Assurance in Education, v6 n3 p162-171. Scharaschkin, A. (1997) A comparison of the outcomes of the Summer 1996 borderline review in six A-
level subjects. AEB Research Report, RAC/732. Scottish Examination Board (1992) Investigation into the effects of the characteristics of candidates and
presenting centres on possible marker bias. Edinburgh: Scottish Examination Board. Shannon, C. & Weaver, W. (1994) The mathematical theory of communication. Urbana, IL: University
of Illinois Press. Shavelson, R. J., & Webb, N. M. (1991) Generalizability theory: A primer. Newbury Park, CA: Sage
Publications. Shaw, S. (2002) The effect of standardisation training on rater judgement and inter-rater reliability for
the revised CPE writing paper 2. Research Notes, v8. Shepherd, E. (1929) The effect of quality of penmanship on grades. Journal of Educational Research,
v19 p102-105. Shohamy, E., Gordon, C., & Kramer, R. (1992) The effect of raters’ background and training on the
reliability of direct writing tests. Modern Language Journal, v76 n1 p27-33. Skurnik, L. S., & Nuttall, D.L. (1968) Describing the reliability of examinations. The Statistician, v18
p119-128. Smith, B., Sinclair, H., Simpson, J., van Teijlingen, E., Bond, C., & Tyalor, R. (2002) What is the role of
double-marking? Evidence from an undergraduate medical course. Education for Primary Care, v1 n4 p497-503.
84

Sparks, R. & Ballantyne, R. (1997) Quality control methods in large-scale assessment procedures using 'double-marking' or 'partial double-marking'. Quality Control & Applied Statistics, v42 n1 p45-48.
Spear, M. (1996) The influence of halo effects upon teachers' assessments of written work. Research in
Education, v56 p85-87. Spear, M. (1997) The influence of contrast effects upon teachers' marks. Educational Research, v39 n2
p229-233. Spearman, C. E. (1904a) ‘General intelligence’ objectively determined and measured. American Journal
of Psychology, v5 p201-293. Spearman, C. E. (1904b) Proof and measurement of association between two things. American Journal
of Psychology, v15 p72-101. Spearman, C. E. (1927) The abilities of man, their nature and measurement. New York: Macmillan. Spencer, E. (1981) Inter-marker unreliability in SCE "O" Grade English Composition. Is improvement
possible? Scottish Educational Review, v13 n1 p44-55. Stahl, J. A., & Lunz, M.E. (1991) Judge performance reports: media and message. Paper presented at
the Annual meeting of the American Educational Research Association, San Francisco, CA. Stalnaker, J. M. (1933) Essay and objective writing tests. English Journal (College Edition), v22 p217-
222. Stalnaker, J.M. (1951) The essay type of examination. In E.F. Lindquist (Ed.), Educational
Measurement. Washington D.C.: American Council on Education. Starch, D., & Elliot, E.C. (1912) Reliability of grading high school work in English. School Review, v20
p442-457. Starch, D. & Elliot, E.C. (1913a) Reliability of grading high school work in History. School Review, v21,
p676-681. Starch, D., & Elliot, E.C. (1913b) Reliability of grading high school work in Mathematics. School Review,
v21 p254-259. Steel, J. H. & Talman, J. (1936) The marking of English composition. London: Nisbet. Stemler, S. E. (2004) A comparison of consensus, consistency, and measurement approaches to
estimating interrater reliability. Practical Assessment, Research & Evaluation, v9 n4. Stewart, M. & Grobe, C. (1979) Syntactic maturity, mechanics of writing and teachers' quality ratings.
Research in the Teaching of English, v13 p207-215. Cited in Vaughan, C. (1991) Holistic assessment: What goes on in the rater's mind? In L. H.-. Lyons (Ed.), Assessing Second Language Writing in Academic Contexts (p111-126) Norwood, N.J.: Ablex Publishing Corporation.
Sturman, L. & Kispal, A. (2003) To e or not to e? A comparison of electronic marking and paper-based
marking. Paper presented at the 29th International Association of Educational Assessment Conference, Manchester, UK, October 2003.
Sukkarieh, J. Z., Pulman, S.G. & Raikes, N. (2003) Auto-marking: using computational linguistics to
score short, free text responses. Paper presented at the 9th Annual Conference of the International Association for Educational Assessment, Manchester, UK.
Swanson, D.B., Noreini, J.J. & Grosso, I.J. (1987) Assessment of clinical competence: written and
computer based simulations. Assessment and Evaluation in Higher Education, v12 p220-246.
85
Sweedler-Brown, C.O. (1991) Computers and assessment: The effect of typing versus handwriting on the holistic score of essays. Research and Teaching in Developmental Education, v8 p5-14.
Sweedler-Brown, C.O. (1992) The effect of training on the appearance bias of holistic essay graders.
Journal of Research and Development in Education, v26 n1 p24-29. Taylor, M. (1992) The reliability of judgements made by coursework assessors. AEB Research Report,
RAC/577. Townsend, M. A. R., Yong Kek, L.Y. & Tuck, B.F. (1989) The effect of mood on the reliability of essay
assessment. British Journal of Educational Psychology, v59 p232-240. Twing, J. S. & Harrison, I. (2003) The comparability of paper-based and imaged-based marking of a
large-scale high-stakes writing assessment in the United States. Paper presented at the 29th Annual IAEA conference, Manchester, UK.
Uebersax, J. (1987) Diversity of decision-making models and the measurement of interrater agreement.
Psychological Bulletin, v101 n1 p140-146. University of Cambridge Local Examinations Syndicate (2000) Key Stage 3 English - A study of marking
reliability which investigates three different methods of maintaining consistency between markers. Report produced for the Qualifications and Curriculum Authority.
Valentine, C. W. (1932) The reliability of examinations. London: University of London Press. Vaughan, C. (1991) Holistic assessment: What goes on in the rater's mind? In L. H.-. Lyons (Ed.),
Assessing Second Language Writing in Academic Contexts. Norwood, N.J.: Ablex Publishing Corporation.
Vernon, P. E. & Milican, G. D. (1954) A further study of the reliability of English essays. British Journal
of Statistics in Psychology, v7 p65-74. Wade, B. (1978) Responses to written work. Educational Review, v30 p149-158. Webb, L. C., Raymond, M.R., & Houston, W.M. (1990) Rater stringency and consistency in performance
assessment. Paper presented at the American Educational Research Association, Boston, MA., April 1990.
Wegner, E. (1998) Communities of practice learning, meaning and identity. Cambridge: Cambridge
University Press. Weigle, S. (1994) Effects of training on raters of ESL compositions: Quantitative and qualitative
approaches. Unpublished PhD dissertation, University of California, Los Angeles. Weigle, S. (1998) Using FACETS to model rater training effects. Language Testing, v15 n2 p263-287. Weigle, S. (1999) Investigating Rater/Prompt Interactions in Writing Assessment: Quantitative &
Qualitative Approaches. Assessing Writing, v6 n2 p145-178. Welsh Joint Education Committee (2004) CMI/CMS 2004 Pilot Evaluation: Welsh Joint Education
Committee. Whetton, C. & Newton, P. (2002) An evaluation of on-line marking. Paper presented at the 28th
International Association for Educational Assessment Conference, Hong Kong, September 2002.
White, E. (1984) Holisticism. College Composition & Communication, v35 p400-409. Cited in Vaughan,
C. (1991) Holistic assessment: What goes on in the rater's mind? In L. H.-. Lyons (Ed.), Assessing Second Language Writing in Academic Contexts. Norwood, N.J.: Ablex Publishing Corporation.
86
Wigglesworth, G. (1993) Exploring bias analysis as a tool for improving rater consistency in assessing oral interaction. Language Testing, v10 n3 p129-138.
Wigglesworth G. (1994) The investigation of rater and task variability using multi-faceted measurement.
Report for the National Centre for English Language Teaching and Research, Macquarie University.
Wiliam, D. (1993) Validity, dependability and reliability in national curriculum assessment. The
Curriculum Journal, v4 n3 p335-350. Wiliam, D. (1996) National curriculum assessments and programmes of study: validity and impact.
British Educational Research Journal, v22 n1 p129-141. Wiliam, D. (2000) Reliability, validity, and all that jazz. Education, v29 n3 p9-13. Wiliam, D. (2003) National Curriculum assessment: how to make it better. Research Papers in
Education, v18 n2 p129-136. Wilkinson, N. W. (1952) An inquiry into the reliability and validity of essay marks. Unpublished M.Ed.
thesis, University of Edinburgh. Cited in Pilliner, A. E. G. (1968) Examinations. In H. J. Butcher (Ed.), Educational research in Britain. London: University of London Press.
Williams, H. G. & van Lent, L. G. (2002) Project 2F.1: Impact of e-marking on test design. Utrecht: ETS
Europe. Wilmut, J. (1984) A pilot study of the effects of complete or partial removal of marks and comments from
scripts before re-marking them. AEB Research Report, RAC 315. Wilmut, J., Wood, R. & Murphy, R. (1996) A review of research into the reliability of examinations. A
discussion paper prepared for the School Curriculum, & Assessment Authority. Wiseman, S. (1949) The marking of English composition in grammar school selection. British Journal of
Educational Psychology, v19 p200-209. Wiseman, S. (1956) The use of essays in selection at 11 plus. British Journal of Educational
Psychology, v26 p172-179. Wiseman, S. & Wrigley, J. (1958) Essay-reliability: the effect of choice and essay title. Educational &
Psychological Measurement, v18 n1 p129-138. Wolf, A. (1995) Competence Based Assessment. Buckingham: Open University Press. Wolf, A. & Silver, R. (1986) Work-Based Learning: Trainee Assessment by Supervisors (R & D Series
No. 33), Sheffield. Wood, R. (1991) Assessment and Testing: A survey of research. Cambridge: Cambridge University
Press. Wood, R. & Quinn, B. (1976) Double impression marking of English language essay and summary
questions. Educational Review, v28 n3 p229-246. Wright, B. D., & Stone, M. H. (1979) Best test design. Chicago: MESA. Yancey, K. B. (1999) Looking back as we look forward: Historicizing writing assessment. College
Composition & Communication, v50 p483-503.
87
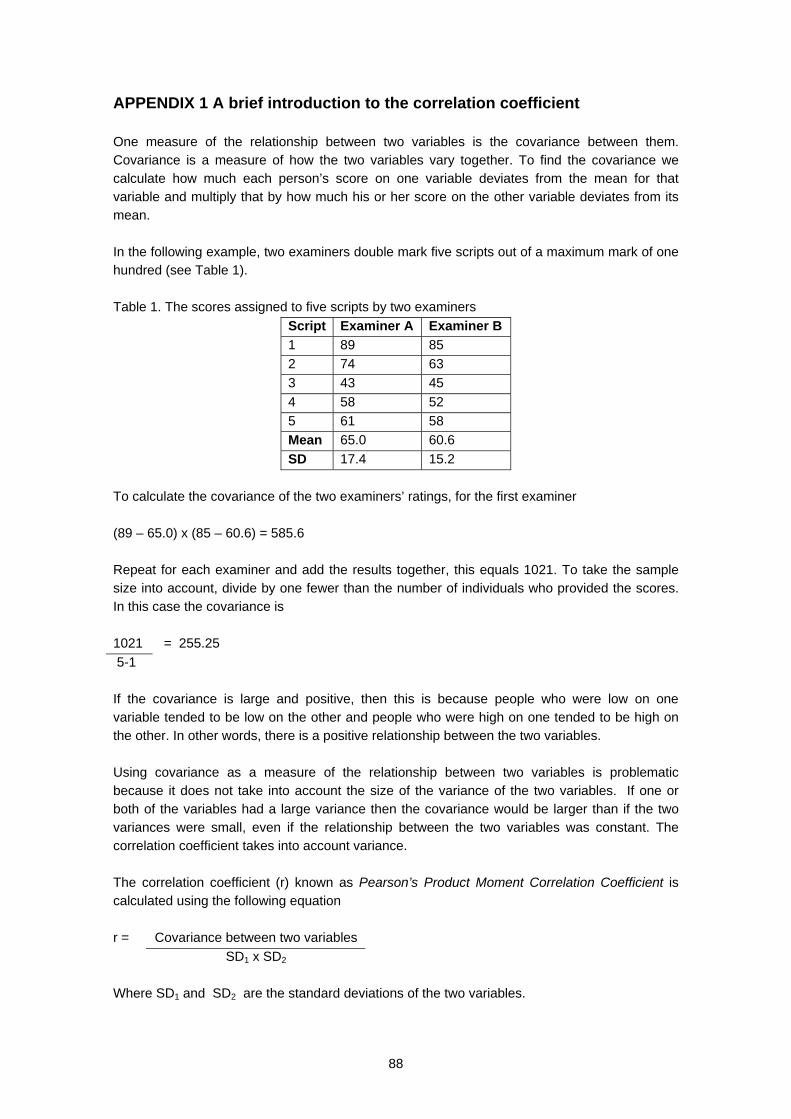
APPENDIX 1 A brief introduction to the correlation coefficient One measure of the relationship between two variables is the covariance between them. Covariance is a measure of how the two variables vary together. To find the covariance we calculate how much each person’s score on one variable deviates from the mean for that variable and multiply that by how much his or her score on the other variable deviates from its mean. In the following example, two examiners double mark five scripts out of a maximum mark of one hundred (see Table 1). Table 1. The scores assigned to five scripts by two examiners
Script Examiner A Examiner B 1 89 85 2 74 63 3 43 45 4 58 52 5 61 58 Mean 65.0 60.6 SD 17.4 15.2
To calculate the covariance of the two examiners’ ratings, for the first examiner (89 – 65.0) x (85 – 60.6) = 585.6 Repeat for each examiner and add the results together, this equals 1021. To take the sample size into account, divide by one fewer than the number of individuals who provided the scores. In this case the covariance is 1021 = 255.25 5-1 If the covariance is large and positive, then this is because people who were low on one variable tended to be low on the other and people who were high on one tended to be high on the other. In other words, there is a positive relationship between the two variables. Using covariance as a measure of the relationship between two variables is problematic because it does not take into account the size of the variance of the two variables. If one or both of the variables had a large variance then the covariance would be larger than if the two variances were small, even if the relationship between the two variables was constant. The correlation coefficient takes into account variance. The correlation coefficient (r) known as Pearson’s Product Moment Correlation Coefficient is calculated using the following equation r = Covariance between two variables SD1 x SD2
Where SD1 and SD2 are the standard deviations of the two variables.
88

In the example given r = 255.25 17.4 x 15.2 = 0.97 Dividing by the standard deviations limits the range of r to +1.00 to -1.00. A large positive correlation indicates a strong relationship between the variables such that as one increases so does the other. A large negative correlation indicates a strong relationship between the variables such that as one increases the other decreases. If the r is near zero there is no relationship between the variables. Spearman correlation coefficient is one of a number of different correlation coefficients appropriate in different circumstances (see Clark-Carter, 1997).
89