a review of pedestrian safety research in the united ... · administration (fhwa) in synthesis of...
TRANSCRIPT

A Review of Pedestrian SafetyResearch in the United Statesand AbroadPUBLICATION NO. FHWA-RD-03-042 JANUARY 2004
Research, Development, and TechnologyTurner-Fairbank Highway Research Center6300 Georgetown PikeMcLean, VA 22101-2296

FOREWORD
The overall goal of the Federal Highway Administration’s (FHWA) Pedestrian and Bicycle SafetyResearch Program is to increase pedestrian and bicycle safety and mobility. From better crosswalks,sidewalks, and pedestrian technologies to expanded public educational and safety programs, the FHWA’sPedestrian and Bicycle Safety Research Program aims to pave the way for a more walkable future.
The following document summarizes research on pedestrian safety in the United States with a focus oncrash characteristics and the safety effects of various roadway features and traffic-control devices; it alsoconsiders pedestrian educational and enforcement programs. This pedestrian safety synthesis was part ofa large FHWA study (“Evaluation of Pedestrian Facilities”) that has generated several other documents onthe safety of pedestrian crossings and the effects of innovative engineering treatments on pedestriansafety. These other reports on pedestrian safety likely will interest readers.
The results of this research will be useful to transportation researchers, engineers, planners, and safetyprofessionals involved in improving pedestrian safety and mobility.
Michael F. TrentacosteDirector, Office of Safety Research and Development
NOTICE
This document is disseminated under the sponsorship of the U.S. Department of Transportation in theinterest of information exchange. The U.S. Government assumes no liability for its contents or usethereof. This report does not constitute a standard, specification, or regulation.
The U.S. Government does not endorse products or manufacturers. Trade or manufacturers’ namesappear herein only because they are considered essential to the purpose of the document.

i
Technical Report Documentation Page 1. Report No.
FHWA-RD-03-0422. Government Accession No. 3. Recipient's Catalog No.
4. Title and Subtitle
A Review of Pedestrian Safety Research in the United States and Abroad 5. Report Date
January 20046. Performing Organization Code
7. Author(s) B.J. Campbell, Charles V. Zegeer, Herman H. Huang, and Michael J. Cynecki
8. Performing Organization Report No.
9. Performing Organization Name and Address
University of North Carolina Highway Safety Research Center 730 Airport Rd, CB #3430 Chapel Hill, NC 27599-3430
10. Work Unit No. (TRAIS)
11. Contract or Grant No.
DTFH61-92-C-0013812. Sponsoring Agency Name and Address
Office of Safety Research and Development Federal Highway Administration 6300 Georgetown Pike McLean, VA 22101-2296
13. Type of Report and Period Covered
Final Report 1999-200214. Sponsoring Agency Code
15. Supplementary Notes
This report is part of a larger study for FHWA entitled, “Evaluation of Pedestrian Facilities.” FHWA Contracting Officer’s Technical Representatives (COTRs): Carol Tan Esse and Ann Do, HRDS.16. Abstract
The purpose of this report is to provide an overview of research studies on pedestrian safety in the United States;some foreign research also is included. Readers will find details of pedestrian crash characteristics, measures ofpedestrian exposure and hazard, and specific roadway features and their effects on pedestrian safety. Such featuresinclude crosswalks and alternative crossing treatments, signalization, signing, pedestrian refuge islands, provisionsfor pedestrians with disabilities, bus stop location, school crossing measures, reflectorization and conspicuity, grade-separated crossings, traffic-calming measures, and sidewalks and paths. Pedestrian educational and enforcementprograms also are discussed.
This report is an update resulting from two earlier reports. The most recent was Synthesis of Safety Research:Pedestrians, by C.V. Zegeer (FHWA-SA-91-034, Aug. 1991). The earlier work was Chapter 16, “Pedestrian Ways”by R.C. Pfefer, A. Sorton, J. Fegan, and M.J. Rosenbaum, which was published by the Federal HighwayAdministration (FHWA) in Synthesis of Safety Research Related to Traffic Control and Roadway Elements (fromVolume 2, Dec. 1982). This updated report includes results from numerous studies, foreign and domestic. A reviewof pedestrian safety research from Australia, Canada, the Netherlands, Sweden, and the United Kingdom is given at:www.walkinginfo.org/rd/international.htm.
17. Key Words:
Pedestrians, safety research, crashes, countermeasures, education, enforcement
18. Distribution Statement
No restrictions. This document is available to the publicthrough the National Technical Information Service,Springfield, VA 22161
19. Security Classif. (of this report)
Unclassified20. Security Classif. (of this page)
Unclassified21. No. of Pages
15022. Price
Form DOT F 1700.7 (8-72) Reproduction of form and completed page is authorized

ii
ii
SI*
(MO
DER
N M
ETR
IC) C
ON
VER
SIO
N F
AC
TOR
SA
PP
RO
XIM
ATE
CO
NV
ER
SIO
NS
TO
SI U
NIT
SA
PP
RO
XIM
ATE
CO
NV
ER
SIO
NS
FR
OM
SI U
NIT
S
SYM
BO
LW
HEN
YO
UK
NO
WM
ULT
IPLY
BY
TO F
IND
SYM
BO
LSY
MB
OL
WH
EN Y
OU
KN
OW
MU
LTIP
LYB
YTO
FIN
DSY
MB
OL
LEN
GTH
LEN
GTH
inin
ches
25.4
mill
imet
ers
mm
mm
mill
imet
ers
0.03
9in
ches
inft
feet
0.30
5m
eter
sm
mm
eter
s3.
28fe
etft
ydya
rds
0.91
4m
eter
sm
mm
eter
s1.
09ya
rds
ydm
im
iles
1.61
kilo
met
ers
kmkm
kilo
met
ers
0.62
1m
iles
mi
AR
EAA
REA
in2
squa
re in
ches
645.
2sq
uare
mill
imet
ers
mm
2m
m2
squa
re m
illim
eter
s0.
0016
squa
re in
ches
in2
ft2sq
uare
feet
0.09
3sq
uare
met
ers
m2
m2
squa
re m
eter
s10
.764
squa
re fe
etft2
yd2
squa
re y
ard
0.83
6sq
uare
met
ers
m2
m2
squa
re m
eter
s1.
195
squa
re y
ards
yd2
acac
res
0.40
5he
ctar
esha
hahe
ctar
es2.
47ac
res
acm
i2sq
uare
mile
s2.
59sq
uare
kilo
met
ers
km2
km2
squa
re k
ilom
eter
s0.
386
squa
re m
iles
mi2
VOLU
ME
VOLU
ME
fl oz
fluid
oun
ces
29.5
7m
illili
ters
mL
mL
mill
ilite
rs0.
034
fluid
oun
ces
fl oz
gal
gallo
ns3.
785
liter
sL
Llit
ers
0.26
4ga
llons
gal
ft3cu
bic
feet
0.02
8cu
bic
met
ers
m3
m3
cubi
c m
eter
s35
.314
cubi
c fe
etft3
yd3
cubi
c ya
rds
0.76
5cu
bic
met
ers
m3
m3
cubi
c m
eter
s1.
307
cubi
c ya
rds
yd3
NO
TE: v
olum
es g
reat
er th
an 1
000
L sh
all b
e sh
own
in m
3
MA
SSM
ASS
ozou
nces
28.3
5gr
ams
gg
gram
s0.
035
ounc
esoz
lbpo
unds
0.45
4ki
logr
ams
kgkg
kilo
gram
s2.
202
poun
dslb
Tsh
ort t
ons
(20
00lb
)0.
907
meg
agra
ms
(or
"met
ric to
n")
Mg
(or "
t")M
g (o
r "t")
meg
agra
ms
(or
"met
ric to
n")
1.10
3sh
ort t
ons
(200
0 lb
)T
TEM
PER
ATU
RE
(exa
ct d
egre
es)
TEM
PER
ATU
RE
(exa
ct d
egre
es)
o FFa
hren
heit
5 (F
-32)
/9
or (F
-32)
/1.8
Cel
sius
o Co C
Cel
sius
1.8C
+32
Fahr
enhe
ito F
ILLU
MIN
ATI
ON
ILLU
MIN
ATI
ON
fcfo
ot-c
andl
es10
.76
lux
lxlx
lu
x0.
0929
foot
-can
dles
fcfl
foot
-Lam
berts
3.42
6ca
ndel
a/m
2cd
/m2
cd/m
2ca
ndel
a/m
20.
2919
foot
-Lam
berts
fl
FOR
CE
and
PRES
SUR
E or
STR
ESS
FOR
CE
and
PRES
SUR
E or
STR
ESS
lbf
poun
dfor
ce 4
.45
ne
wto
nsN
Nne
wto
ns0.
225
poun
dfor
celb
flb
f/in2
poun
dfor
ce p
ersq
uare
inch
6.89
kilo
pasc
als
kPa
kPa
kilo
pasc
als
0.14
5po
undf
orce
per
squa
re in
chlb
f/in2
*SI i
s th
e sy
mbo
l for
the
Inte
rnat
iona
l Sys
tem
of U
nits
. Ap
prop
riate
roun
ding
sho
uld
be m
ade
to c
ompl
y w
ith S
ectio
n 4
of A
STM
E38
0.
(
Rev
ised
Mar
ch 2
003)

iii
TABLE OF CONTENTS
Page
PART 1. INTRODUCTION . . . . . . . . . . . . . . . . . . . . . . . . . . . . . . . . . . . . . . . . . . . . . . . . . . . . . . 1Organization of this Report . . . . . . . . . . . . . . . . . . . . . . . . . . . . . . . . . . . . . . . . . . . . . . . . . . . . . . . . . . . 2Summary of Main Findings . . . . . . . . . . . . . . . . . . . . . . . . . . . . . . . . . . . . . . . . . . . . . . . . . . . . . . . . . . . 2Evolution of Vehicle/Pedestrian Collision Problems . . . . . . . . . . . . . . . . . . . . . . . . . . . . . . . . . . . . . . 4Guides and Model Programs . . . . . . . . . . . . . . . . . . . . . . . . . . . . . . . . . . . . . . . . . . . . . . . . . . . . . . . . . . 6
PART 2. CRASHES INVOLVING PEDESTRIANS . . . . . . . . . . . . . . . . . . . . . . . . . . . . . . 13Introduction . . . . . . . . . . . . . . . . . . . . . . . . . . . . . . . . . . . . . . . . . . . . . . . . . . . . . . . . . . . . . 13Limitations of National Pedestrian Crash Data . . . . . . . . . . . . . . . . . . . . . . . . . . . . . . . . . . . . . . . . . . 13The Number of Pedestrian Fatalities . . . . . . . . . . . . . . . . . . . . . . . . . . . . . . . . . . . . . . . . . . . . . . . . . . 13When Do Pedestrian Collisions Occur? . . . . . . . . . . . . . . . . . . . . . . . . . . . . . . . . . . . . . . . . . . . . . . . . 15Who Is Involved in Pedestrian Crashes? . . . . . . . . . . . . . . . . . . . . . . . . . . . . . . . . . . . . . . . . . . . . . . . 24Where Do Pedestrian Collisions Occur? . . . . . . . . . . . . . . . . . . . . . . . . . . . . . . . . . . . . . . . . . . . . . . . 32How Do Pedestrian Collisions Occur? . . . . . . . . . . . . . . . . . . . . . . . . . . . . . . . . . . . . . . . . . . . . . . . . . 38How Severe Are Pedestrian Collisions? . . . . . . . . . . . . . . . . . . . . . . . . . . . . . . . . . . . . . . . . . . . . . . . . 47Summary of Pedestrian Collision Statistics . . . . . . . . . . . . . . . . . . . . . . . . . . . . . . . . . . . . . . . . . . . . . 49Exposure-Based Hazard Index . . . . . . . . . . . . . . . . . . . . . . . . . . . . . . . . . . . . . . . . . . . . . . . . . . . . . . . 51Conflict Analysis Hazard Formula . . . . . . . . . . . . . . . . . . . . . . . . . . . . . . . . . . . . . . . . . . . . . . . . . . . . 53
PART 3. OVERVIEW OF PEDESTRIAN CRASH COUNTERMEASURES ANDSAFETY PROGRAMS . . . . . . . . . . . . . . . . . . . . . . . . . . . . . . . . . . . . . . . . . . . . . . . . . . . 57Cautions Regarding Design Problems in Studies of Countermeasure Effectiveness . . . . 57
Marked Crosswalks . . . . . . . . . . . . . . . . . . . . . . . . . . . . . . . . . . . . . . . . . . . . . . . . . . . . . . . . . . . . . . . . . 58Crash Studies . . . . . . . . . . . . . . . . . . . . . . . . . . . . . . . . . . . . . . . . . . . . . . . . . . . . . . . . . . . . . . . 58Behavioral Studies . . . . . . . . . . . . . . . . . . . . . . . . . . . . . . . . . . . . . . . . . . . . . . . . . . . . . . . . . . . 63Assessment of Literature . . . . . . . . . . . . . . . . . . . . . . . . . . . . . . . . . . . . . . . . . . . . . . . . . . . . . . 66
Alternative Crossing Treatments . . . . . . . . . . . . . . . . . . . . . . . . . . . . . . . . . . . . . . . . . . . . . . . . . . . . . . 66Crosswalk Illumination . . . . . . . . . . . . . . . . . . . . . . . . . . . . . . . . . . . . . . . . . . . . . . . . . . . . . . . . . . . . . . 68Barriers, Signals, and Signage to Restrict Pedestrian Movements . . . . . . . . . . . . . . . . . . . . . . . . . . 70
Median Barriers . . . . . . . . . . . . . . . . . . . . . . . . . . . . . . . . . . . . . . . . . . . . . . . . . . . . . . . . . . . . . 70Freeway Barriers . . . . . . . . . . . . . . . . . . . . . . . . . . . . . . . . . . . . . . . . . . . . . . . . . . . . . . . . . . . . 70Roadside/Sidewalk Barriers . . . . . . . . . . . . . . . . . . . . . . . . . . . . . . . . . . . . . . . . . . . . . . . . . . . 70
Signalization . . . . . . . . . . . . . . . . . . . . . . . . . . . . . . . . . . . . . . . . . . . . . . . . . . . . . . . . . . . . . . . . . . . . . . . 71Signing . . . . . . . . . . . . . . . . . . . . . . . . . . . . . . . . . . . . . . . . . . . . . . . . . . . . . . . . . . . . . . . . . . . . . . . . . . . 75Right Turn on Red . . . . . . . . . . . . . . . . . . . . . . . . . . . . . . . . . . . . . . . . . . . . . . . . . . . . . . . . . . . . . . . . . . 75Innovative Traffic Control Devices . . . . . . . . . . . . . . . . . . . . . . . . . . . . . . . . . . . . . . . . . . . . . . . . . . . 79Pedestrian Refuge Areas . . . . . . . . . . . . . . . . . . . . . . . . . . . . . . . . . . . . . . . . . . . . . . . . . . . . . . . . . . . . 85Provisions for Pedestrians with Disabilities . . . . . . . . . . . . . . . . . . . . . . . . . . . . . . . . . . . . . . . . . . . . 86
Countermeasures for Pedestrians with Vision Impairments . . . . . . . . . . . . . . . . . . . . . . . . . 87Safety Measures for Pedestrians with Hearing Impairments . . . . . . . . . . . . . . . . . . . . . . . . 89Guides and Manuals for Accommodating Pedestrians with Disabilities . . . . . . . . . . . . . . 89
Bus Stop Location . . . . . . . . . . . . . . . . . . . . . . . . . . . . . . . . . . . . . . . . . . . . . . . . . . . . . . . . . . . . . . . . . . 90

iv
TABLE OF CONTENTS (Con’t) Page
School Trip Safety . . . . . . . . . . . . . . . . . . . . . . . . . . . . . . . . . . . . . . . . . . . . . . . . . . . . . . . . . . . . . . . . . . 91Alternatives to Signalization for School Crossings . . . . . . . . . . . . . . . . . . . . . . . . . . . . . . . . . . . . . . 93Reflectorization and Conspicuity . . . . . . . . . . . . . . . . . . . . . . . . . . . . . . . . . . . . . . . . . . . . . . . . . . . . . 94One-Way Streets as a Pedestrian Crash Countermeasure . . . . . . . . . . . . . . . . . . . . . . . . . . . . . . . . . 96Pedestrian Overpasses and Underpasses . . . . . . . . . . . . . . . . . . . . . . . . . . . . . . . . . . . . . . . . . . . . . . . 96Traffic Calming . . . . . . . . . . . . . . . . . . . . . . . . . . . . . . . . . . . . . . . . . . . . . . . . . . . . . . . . . . . . . . . . . . . . 99
What is Traffic Calming? . . . . . . . . . . . . . . . . . . . . . . . . . . . . . . . . . . . . . . . . . . . . . . . . . . . . . 99Traffic-Calming Measures . . . . . . . . . . . . . . . . . . . . . . . . . . . . . . . . . . . . . . . . . . . . . . . . . . . 100
1. Play Streets . . . . . . . . . . . . . . . . . . . . . . . . . . . . . . . . . . . . . . . . . . . . . . . . . . . . . . . . . . 1022. Community Streets . . . . . . . . . . . . . . . . . . . . . . . . . . . . . . . . . . . . . . . . . . . . . . . . . . . . 1033. Woonerf . . . . . . . . . . . . . . . . . . . . . . . . . . . . . . . . . . . . . . . . . . . . . . . . . . . . . . . . . . . . 1034. Transit Malls: Shared Use of Pedestrian-Oriented Space . . . . . . . . . . . . . . . . . . . 1035. Area-Wide Traffic Restrictions . . . . . . . . . . . . . . . . . . . . . . . . . . . . . . . . . . . . . . . . . . 1046. Speed Humps and Speed Tables . . . . . . . . . . . . . . . . . . . . . . . . . . . . . . . . . . . . . . . . . 1047. Effects of Speed Humps . . . . . . . . . . . . . . . . . . . . . . . . . . . . . . . . . . . . . . . . . . . . . . . . 1058. Experience with Speed Humps . . . . . . . . . . . . . . . . . . . . . . . . . . . . . . . . . . . . . . . . . . 1069. Guidelines for Speed Hump Use . . . . . . . . . . . . . . . . . . . . . . . . . . . . . . . . . . . . . . . . 10810. Bulbouts and Street Narrowing . . . . . . . . . . . . . . . . . . . . . . . . . . . . . . . . . . . . . . . . . 10811. Roundabouts . . . . . . . . . . . . . . . . . . . . . . . . . . . . . . . . . . . . . . . . . . . . . . . . . . . . . . . . 11012. Cul de sacs . . . . . . . . . . . . . . . . . . . . . . . . . . . . . . . . . . . . . . . . . . . . . . . . . . . . . . . . . . 11013. Emergency Vehicles . . . . . . . . . . . . . . . . . . . . . . . . . . . . . . . . . . . . . . . . . . . . . . . . . . 11014. Traffic Diversion . . . . . . . . . . . . . . . . . . . . . . . . . . . . . . . . . . . . . . . . . . . . . . . . . . . . . 111
Traffic Calming in Original Construction . . . . . . . . . . . . . . . . . . . . . . . . . . . . . . . . . . . . . . . 112Effectiveness Evaluation . . . . . . . . . . . . . . . . . . . . . . . . . . . . . . . . . . . . . . . . . . . . . . . . . . . . . 112
Sidewalks and Pedestrian Paths . . . . . . . . . . . . . . . . . . . . . . . . . . . . . . . . . . . . . . . . . . . . . . . . . . . . . 113Education Countermeasures . . . . . . . . . . . . . . . . . . . . . . . . . . . . . . . . . . . . . . . . . . . . . . . . . . . . . . . . . 115Enforcement and Regulations . . . . . . . . . . . . . . . . . . . . . . . . . . . . . . . . . . . . . . . . . . . . . . . . . . . . . . . 119
PART 4. SUMMARY AND DISCUSSION . . . . . . . . . . . . . . . . . . . . . . . . . . . . . . . . 121Introduction . . . . . . . . . . . . . . . . . . . . . . . . . . . . . . . . . . . . . . . . . . . . . . . . . . . . . . . . . . . . . . . . . . . . . . . 121Pedestrian Crash Experience . . . . . . . . . . . . . . . . . . . . . . . . . . . . . . . . . . . . . . . . . . . . . . . . . . . . . . . . . . 121Overview of Pedestrian Crash Countermeasures and Safety Programs . . . . . . . . . . . . . . . . . . . . . . . . . 122Annotated Bibliography . . . . . . . . . . . . . . . . . . . . . . . . . . . . . . . . . . . . . . . . . . . . . . . . . . . . . . . . . . . . 127
REFERENCES . . . . . . . . . . . . . . . . . . . . . . . . . . . . . . . . . . . . . . . . . . . . . . . . . . . . . . . . . . . . . . . . . 129
APPENDIX A. REVIEW OF PEDESTRIAN SAFETY RESEARCH IN AUSTRALIA, CANADA, THE NETHERLANDS, SWEDEN, AND THE UNITED KINGDOM
AustraliaCanadaNetherlandsSwedenUnited Kingdom
(Appendix A reports may be found at: www.walkinginfo.org/rd/international.htm)

v
LIST OF FIGURESPage
Figure 1. Pedestrians include a wide range of ages and physical abilities . . . . . . . . . . . . . . . . . . . . . . . 1
Figure 2. School-trip safety can be enhanced by well-trained adult crossing guards . . . . . . . . . . . . . . . 3
Figure 3. Pedestrian capacity of CBD sidewalks is reduced by light posts, mailboxes, parking meters, etc. . . . . . . . . . . . . . . . . . . . . . . . . . . . . . . . . . . . . . . . . . . . . . . . . . . . . . . . . . 5
Figure 4. Pedestrians in rural and developing areas need to be able to get from one place to another safely and conveniently . . . . . . . . . . . . . . . . . . . . . . . . . . . . . . . . . . . . . . . . . . . . . . 10
Figure 5. Pedestrian fatalities as a percentage of total traffic fatalities, 1927-1996 . . . . . . . . . . . . . . . 16
Figure 6. A disproportionately high percentage of pedestrian deaths occur at night . . . . . . . . . . . . . . 18
Figure 7. Pedestrian injuries by time of day for urban and rural land use . . . . . . . . . . . . . . . . . . . . . . 20
Figure 8. Pedestrian fatalities by time of day for urban and rural land use . . . . . . . . . . . . . . . . . . . . . 20
Figure 9. Pedestrian fatalities by day of week for urban and rural land use . . . . . . . . . . . . . . . . . . . . . 22
Figure 10. Pedestrian crashes by age and occurring in fall or winter months (September—February) . 23
Figure 11. Pedestrian fatalities by month . . . . . . . . . . . . . . . . . . . . . . . . . . . . . . . . . . . . . . . . . . . . . . . . 23
Figure 12. Pedestrian groups overrepresented in pedestrian crashes include males and children. Older adults are more at risk for serious injury or death than younger pedestrians if struck by a motor vehicle . . . . . . . . . . . . . . . . . . . . . . . . . . . . . . . . . . . . . . . . . . . . . . . . . . . 26
Figure 13. Studies have found that between 42 and 61 percent of pedestrian fatalities in motor vehiclecrashes involve pedestrians under the influence of alcohol . . . . . . . . . . . . . . . . . . . . . . . . . . 29
Figure 14. Percent of crashes involving pedestrians drinking alcohol . . . . . . . . . . . . . . . . . . . . . . . . . . 29
Figure 15. Rural areas account for 23.1 percent of non-fatal injury pedestrians crashes, but 45.2 percent of pedestrians deaths . . . . . . . . . . . . . . . . . . . . . . . . . . . . . . . . . . . . . . . . . . . . . 32
Figure 16. Pedestrian crashes (fatal and nonfatal) by age and intersection vs. nonintersection . . . . . . . 36
Figure 17. Approximately 60 percent of U.S. urban pedestrians crashes occur at places other thanintersections . . . . . . . . . . . . . . . . . . . . . . . . . . . . . . . . . . . . . . . . . . . . . . . . . . . . . . . . . . . . . . 37
Figure 18. Pedestrians running into the road without looking are a factor in approximately
15 percent of pedestrian collisions . . . . . . . . . . . . . . . . . . . . . . . . . . . . . . . . . . . . . . . . . . . . 40
Figure 19. Turning vehicles pose a particular threat to pedestrians at intersections . . . . . . . . . . . . . . . . 46
Figure 20. Percentage of pedestrian/motor vehicle crashes resulting in death, by pedestrian age, 1980-1990, North Carolina data . . . . . . . . . . . . . . . . . . . . . . . . . . . . . . . . . . . . . . . . . . . . . . 49
vi
LIST OF FIGURES (Con’t) Page
Figure 21. Some pedestrian crash types are overrepresented in fatal outcomes, including walking along road . . . . . . . . . . . . . . . . . . . . . . . . . . . . . . . . . . . . . . . . . . . . . . . . . . . . . . . . . . . . . . . 51
Figure 22. Relative hazard of selected pedestrian characteristics . . . . . . . . . . . . . . . . . . . . . . . . . . . . . . 54
Figure 23. Crosswalk marking patterns . . . . . . . . . . . . . . . . . . . . . . . . . . . . . . . . . . . . . . . . . . . . . . . . . 58
Figure 24. Pedestrian crash rates at types of crossing . . . . . . . . . . . . . . . . . . . . . . . . . . . . . . . . . . . . . . . 60
Figure 25. Unsafe motorist behavior at marked crosswalks is one of the causes of pedestriancrashes at marked crosswalks . . . . . . . . . . . . . . . . . . . . . . . . . . . . . . . . . . . . . . . . . . . . . . . . 63
Figure 26. Crosswalk treatments such as lighted signs have been used in an attempt to affect pedestrian and/or motorist behaviors . . . . . . . . . . . . . . . . . . . . . . . . . . . . . . . . . . . . . . . . . . . 67
Figure 27. Directional movements of pedestrians and bicyclists involved in right-turn-on-red crashes 76
Figure 28. Examples of treatments that have been tested to reduce pedestrian crashes related to right-turn-on-red (RTOR) motorists . . . . . . . . . . . . . . . . . . . . . . . . . . . . . . . . . . . . . . . . . . . 80
Figure 29. These innovative pedestrian crossing signs had mixed results . . . . . . . . . . . . . . . . . . . . . . . 81
Figure 30. Examples of innovative pedestrian signalization alternatives . . . . . . . . . . . . . . . . . . . . . . . . 82
Figure 31. The Clearwater pedestrian crossing treatment resulted in a positive influence on pedestrian and driver behavior . . . . . . . . . . . . . . . . . . . . . . . . . . . . . . . . . . . . . . . . . . . . . . . 83
Figure 32. Illuminated pedestrian push buttons were not found to alter pedestrian crossing behavior . 84
Figure 33. Automatic pedestrian detectors have been found to significantly reduce pedestrianviolations of the DON’T WALK indication and reduce pedestrian vehicle conflicts . . . . . . 84
Figure 34. Some pedestrians are not able to cross an intersection within the signal time provided . . . . 85 Figure 35. Raised median and pedestrian islands may provide a measure of safety to pedestrians . . . . 86
Figure 36. Without adequate facilities, vision-impaired pedestrians are at increased risk . . . . . . . . . . . 88
Figure 37. Studies have found that uniformed crossing guards are safer than other control devicessuch as signs or markings alone . . . . . . . . . . . . . . . . . . . . . . . . . . . . . . . . . . . . . . . . . . . . . . 91
Figure 38. School regulatory flashes have been found to have only limited success in reducing vehiclespeeds in school zones, unless adult crossing guards are also helping to control traffic . . . . 92
Figure 39. Reflectorization has been shown to result in a major increase in the visibility of a pedestrian at night . . . . . . . . . . . . . . . . . . . . . . . . . . . . . . . . . . . . . . . . . . . . . . . . . . . . . . . . . 95
Figure 40. Nighttime detection and recognition distance of pedestrians . . . . . . . . . . . . . . . . . . . . . . . . 95

vii
LIST OF FIGURES (Con’t) Page
Figure 41. Expected usage rate of pedestrian bridges and underpasses, relative to time needed tocross at street level . . . . . . . . . . . . . . . . . . . . . . . . . . . . . . . . . . . . . . . . . . . . . . . . . . . . . . . . . 97
Figure 42. Grade-separated crossings can be beneficial to pedestrians under certain situations but are verycostly and may not be used by pedestrians if not planned properly . . . . . . . . . . . . . . . . . . . 99
Figure 43. Illustrative traffic calming devices . . . . . . . . . . . . . . . . . . . . . . . . . . . . . . . . . . . . . . . . . . . 101
Figure 44. Many traffic-calming measures create an improved environment for pedestrians byreducing vehicle speeds or volumes, and/or shortening crossing distances for pedestrians 102
Figure 45. Street narrowing can reduce vehicle speeds and provide pedestrians with a narrower street to cross . . . . . . . . . . . . . . . . . . . . . . . . . . . . . . . . . . . . . . . . . . . . . . . . . . . . . . . . . . . . 109
Figure 46. Traffic diversion projects are designed to shift traffic off neighborhood streets . . . . . . . . . 111
Figure 47. Pedestrians are safer in areas with sidewalks than in areas without them . . . . . . . . . . . . . . 113
Figure 48. “Looking behavior” is encouraged in pedestrian education programs . . . . . . . . . . . . . . . . 115
Figure 49. Effects of “Willie Whistle” educational campaign on pedestrian crashes . . . . . . . . . . . . . 116
Figure 50. Preschool and elementary school children are the target of many pedestrian educationprograms . . . . . . . . . . . . . . . . . . . . . . . . . . . . . . . . . . . . . . . . . . . . . . . . . . . . . . . . . . . . . . . 117
Figure 51. Undivided highways had the highest crash risk for pedestrians . . . . . . . . . . . . . . . . . . . . . 123
Figure 52. Textured pavements at crosswalks may help vision-impaired pedestrians to cross streets . 124

viii
LIST OF TABLES Page
Table 1. Matrix of potential engineering countermeasures for urban pedestrian crashes . . . . . . . . . . . 7
Table 2. Matrix of potential “performance objectives” for urban pedestrian crashes . . . . . . . . . . . . . . 9
Table 3. Partial summary of pedestrian facility problems and possible solutions . . . . . . . . . . . . . . . . 11
Table 4. Estimated national traffic fatalities by year . . . . . . . . . . . . . . . . . . . . . . . . . . . . . . . . . . . . . . 14
Table 5. Ranking of state pedestrian fatality rates per 100,000 residents, 1994 . . . . . . . . . . . . . . . . . 17
Table 6. Pedestrian collisions by time of day . . . . . . . . . . . . . . . . . . . . . . . . . . . . . . . . . . . . . . . . . . . 18
Table 7. Fatal and nonfatal pedestrian crash types by light condition . . . . . . . . . . . . . . . . . . . . . . . . . 21
Table 8. Pedestrian deaths, injuries, and total collisions by gender of victim . . . . . . . . . . . . . . . . . . . 25
Table 9. Pedestrian crash types by age of pedestrian . . . . . . . . . . . . . . . . . . . . . . . . . . . . . . . . . . . . . 27
Table 10. Pedestrian crash types by pedestrian sobriety . . . . . . . . . . . . . . . . . . . . . . . . . . . . . . . . . . . . 30
Table 11. Pedestrian injuries and fatalities by area type . . . . . . . . . . . . . . . . . . . . . . . . . . . . . . . . . . . . 32
Table 12. Pedestrian crash types by traffic control . . . . . . . . . . . . . . . . . . . . . . . . . . . . . . . . . . . . . . . . 34
Table 13. Pedestrian crash types by speed limit . . . . . . . . . . . . . . . . . . . . . . . . . . . . . . . . . . . . . . . . . . 35
Table 14. Factors contributing to pedestrian collisions . . . . . . . . . . . . . . . . . . . . . . . . . . . . . . . . . . . . . 39
Table 15. Pedestrian crash fault . . . . . . . . . . . . . . . . . . . . . . . . . . . . . . . . . . . . . . . . . . . . . . . . . . . . . . . 40
Table 16. Pedestrian crash types by party at fault . . . . . . . . . . . . . . . . . . . . . . . . . . . . . . . . . . . . . . . . . 41
Table 17. Urban pedestrian collision types and critical behavior descriptors . . . . . . . . . . . . . . . . . . . . 42
Table 18. Rural pedestrian collision types and critical behavior descriptors . . . . . . . . . . . . . . . . . . . . 43
Table 19. Freeway pedestrian collision types and critical behavior descriptors . . . . . . . . . . . . . . . . . . 44
Table 20. Driver activity leading to pedestrian collisions on freeways . . . . . . . . . . . . . . . . . . . . . . . . . 45
Table 21. Pedestrian activity leading to pedestrian collisions on freeways . . . . . . . . . . . . . . . . . . . . . . 45
Table 22. Pedestrian crash types by pedestrian injury severity . . . . . . . . . . . . . . . . . . . . . . . . . . . . . . . 48
Table 23. Pedestrian action and crash data with resulting hazard index . . . . . . . . . . . . . . . . . . . . . . . . 52
Table 24. Vehicle action and pedestrian collision data with resulting hazard index . . . . . . . . . . . . . . . 52
Table 25. Crash effects of providing sodium floodlights at pedestrian crossings (Perth, Australia) . . 69
Table 26. Effects of crosswalk illumination on pedestrian crashes (Israel) . . . . . . . . . . . . . . . . . . . . . 69
Table 27. Summary of effects of pedestrian signal timing on pedestrian crashes . . . . . . . . . . . . . . . . . 74
Table 28. Violations and conflicts related to right turn on red . . . . . . . . . . . . . . . . . . . . . . . . . . . . . . . 77
Table 29. Summary of traffic conflicts related to right-turn-on-red pedestrian crashes . . . . . . . . . . . . 78
Table 30. Comparison of crashes before and after installation of pedestrian overpasses (Tokyo, Japan) 97
Table 31. Recommended guidelines for new sidewalk/walkway installation . . . . . . . . . . . . . . . . . . . 114

1
Figure 1. Pedestrians include a wide range ofages and physical abilities.
PART 1. INTRODUCTION
Walking, the most traditional mode of transportation, can carry a high risk of injury or death onmany of our Nation’s streets and highways. Motor vehicles only have been around for about a century,but during that comparatively short time, they often have made walking hazardous.
Emphasis on highway transportation historically has focused on increasing the safety andmobility of motor vehicles; less attention has been given to pedestrians. The trend has begun to shift inrecent years. Several detailed studies have been conducted on various aspects of pedestrian safety. Thesestudies have attempted to quantify the magnitude and characteristics of pedestrian collisions and identifythe traffic and roadway characteristics associated with such crashes. Some research has also involvedattempts to evaluate the safety effects of various roadway and educational treatments. (Editor’s note: The terms “accident”, “collision”, and “crash” are used throughout this report. Some authors use oneterm and some another. All of these terms should be assumed to mean a crash between a pedestrian anda motor vehicle.)
The purpose of this report is to provide an overview of research studies on pedestrian safety,including details of pedestrian crash characteristics, measures of pedestrian exposure and hazard, andspecific roadway improvements and their effects on pedestrian safety. Pedestrian educationalconsiderations and enforcement programs also are discussed. Because this report is confined to a reviewof safety research, it follows that other important topics are left out. Thus, we do not address matters offacility design, finance, pedestrian comfort, convenience, factors affecting the amount of walking bypedestrians, and other salient issues.
This report is an update resulting from two earlier reports. The most recent was Synthesis ofSafety Research: Pedestrians, by C.V. Zegeer (FHWA-SA-91-034, August 1991). Before that wasChapter 16, “Pedestrian Ways,” by R.C. Pfefer, A. Sorton, J. Fegan, and M.J. Rosenbaum, which waspublished by the Federal Highway Administration (FHWA) in Synthesis of Safety Research Related toTraffic Control and Roadway Elements (Volume 2, December 1982). This updated report includes resultsfrom numerous foreign and domestic studies. A review of pedestrian safety research from Australia,Canada, the Netherlands, Sweden, and the United Kingdom is given at:www.walkinginfo.org/rd/international.htm.

2
Organization of this Report
This report consists of five parts. Part 1 is an executive summary followed by introductory text. Part 2 deals with statistics regarding traffic collisions and injuries to pedestrians. Part 3 reviewspublished research on the effectiveness of facilities and other measures adopted for increased pedestriansafety. Most research cited was carried out in the United States; many studies are recent, but some dateback to the 1960s. Some older studies now may be less valid. There is also a series of reviews ofpedestrian safety research in several foreign countries, authored by research professionals in Australia,Canada, United Kingdom, the Netherlands, and Sweden. These may be found atwww.walkinginfo.org/rd/international.htm.
Summary of Main Findings
! In terms of marked vs. unmarked crosswalks at uncontrolled intersections (i.e., no stop signor traffic signal on the approach roadway) on a two-lane road, the presence of a markedcrosswalk alone is associated with no difference in pedestrian crash rate compared to anunmarked crosswalk. On multilane roads with traffic volumes above 12,000 vehicles perday, having a marked crosswalk alone (without other substantial improvements) isassociated with a higher pedestrian crash rate (after controlling for other site factors)compared to an unmarked crosswalk. More substantial improvements are recommended toprovide for safer pedestrian crossings at such pedestrian crossings, such as adding trafficsignals (with pedestrian signals) when warranted, providing raised medians, installing speed-reducing measures, and/or others.
! Providing raised medians on multilane roads can substantially reduce pedestrian crash risk(and can also make it easier to cross the street).
! There is evidence that substantially improved nighttime lighting can enhance pedestriansafety in certain situations.
! At intersections with traffic signals, adding a WALK/DON’T WALK signal with a standardtiming scheme (i.e., motorists move parallel to pedestrians and may turn right or left on agreen light across pedestrians’ path) has no significant effect on pedestrian crashes. Providing an exclusive pedestrian interval (i.e., motorists are stopped in all directions duringthe same interval each cycle while pedestrians cross in any direction) reduces pedestriancollisions by 50 percent. However, exclusive timing schemes can increase pedestrian andmotorist delay and are most appropriate at downtown intersections with a combination ofheavy pedestrian volumes, good pedestrian compliance, and low vehicle volumes.
! Allowing vehicles to make a right-turn-on-red (RTOR) maneuver appears to result in a smallbut clear safety problem for pedestrians. In fact, 21 percent of motorists violate NO TURNON RED (NTOR) signs if given the opportunity, and 23 percent of RTOR violations resultin a conflict with a pedestrian. Countermeasures that have been effective in reducingpedestrian risks related to RTOR include illuminated NTOR signs, offset stop bars atintersections where RTOR is allowed (i.e., motorists are more likely to make a full stopoften), variations in NTOR signs, and others.
! Various pedestrian and motorist warning signs have been found to reduce vehicle speeds orconflicts between pedestrians and motorists. These devices include the “strong yellowgreen” pedestrian warning sign, YIELD TO PEDESTRIANS WHEN TURNING sign,PEDESTRIANS WATCH FOR TURNING VEHICLES sign, three-section WALK WITH

3
Figure 2. School-trip safety can beenhanced by well-trained adultcrossing guards.
CARE signal head, a DON’T START display to replace the flashing DON’T WALKdisplay, and others.
! Curb medians provide a safer environment for pedestrians compared with two-way, left-turnlanes (TWLTLs), while undivided highways have the highest crash risk for pedestrians inTWLTLs setings.
! Numerous treatments exist to address the needs of pedestrians with disabilities, such astextured pavements, audible and vibrating pedestrian signals, larger signs and pedestriansignals, wheelchair ramps, and others. While formal safety studies are difficult to conducton such treatments, benefits may result from such devices, depending on site conditions andpedestrian needs.
! Careful placement of bus stops can affect pedestrian safety. Use of bus stops on the far sideof an intersection and at locations with good sight distance and alignment (e.g., not on steepgrades or on horizontal curves) is important.
! Safety of trips to and from school can be enhanced by sidewalks and proper signalization,but also by well-trained adult crossing guards and selective police enforcement. Certainwarning signs (e.g., flashing school speed limit signs) and markings (e.g., schoolcrosswalks) are also appropriate and beneficial to pedestrians in many school zones.
! Pedestrian safety and mobility are enhanced by sidewalks and walkways. This is a criticalcomponent of a pedestrian transportation network in urban and suburban areas. Rural roadsshould also provide shoulders for pedestrian travel.
4
! Overpasses and underpasses can substantially improve safety for pedestrians needing tocross freeways or busy arterial streets at certain locations. However, such facilities must becarefully planned and designed to encourage pedestrians to use the facilities and notcontinue to cross at street level.
! Countermeasures to improve conspicuity of pedestrians include a flashlight, jogger’s vest,dangle tags, and rings (retroreflective material on the head band, wrist bands, belt, and ankleband). Such measures can increase a motorist’ visibility distance of a pedestrian up to 1,300feet, compared with about 200 feet for a “base pedestrian” wearing blue jeans and a white t-shirt.
! Several studies have shown that converting from two-way to one-way streets can substan-tially reduce pedestrian collisions. In many cases, however, converting from two-way toone-way streets may not be solely justified by pedestrian safety considerations. More often,several concerns such as capacity, traffic circulation, and overall traffic safety are majorconsiderations. However, one-way streets can greatly simplify the task of crossing a street,particularly if the one-way street conversion does not result in increased vehicle speeds.
! While traffic-calming measures are primarily intended for neighborhood streets to reducevehicle speeds and/or reduce cut-through vehicle traffic, measures such as street closures,speed humps, chicanes (series of alternating curb extensions), traffic curbs, diverters, andothers are in use in various U.S. cities. While controversial, many of these measures havebeen found to effectively improve safety for pedestrians and/or traffic as a whole based onreductions in crashes, vehicle speeds, and/or reductions in cut-through traffic onneighborhood streets.
! Educational measures have been found to reduce crashes involving child pedestrians to agegroups receiving the educational program. However, most U.S. educational programs havereceived few if any formal evaluations and had limited measurable effects.
! Enforcement of traffic laws and regulations represents another important element in safepedestrian activity in a roadway environment. This includes not only the enforcement ofpedestrian regulations (e.g., jaywalking, crossing against the signal) but also motorist actionsrelated to pedestrians (e.g., speeding, yielding to pedestrians when turning, drunk driving). While a number of U.S. cities (including Seattle, Milwaukee, and San Diego) have hadactive police enforcement programs in recent years, no quantitative studies have been doneto deter- mine the specific effects of police enforcement on pedestrian crashes and injuries. Such a study would be difficult to conduct because of many other contributing crash factorsin a city.
Evolution of Vehicle/Pedestrian Collision Problems
Even the ancients knew it was a good idea to separate pedestrians from vehicles roadways. Fruin(1973) presents a comprehensive historical perspective of the methods used in the past to limit vehicularintrusion into cities; regulations prohibiting heavy wagons within the central city after dusk; vehicle/pedestrian separation using stone barriers and metal spikes; and special areas along main thoroughfareswhere pedestrians could rest. Medieval city planners provided central pedestrian plazas as an open spacefor the marketplace and the cathedral, as well as a location for festive occasions and recreation. In anumber of cities, pedestrians were protected from the elements by galleries, canopies, colonnades, andporticos.

5
The introduction and increased use of motor vehicles in urban areas has made it much moredifficult to ensure pedestrian mobility and safety. Most space provided for pedestrians has beensacrificed to provide space for motor vehicle traffic. Both motorist and pedestrian face visual clutter oftraffic signals and signs.
The central business district (CBD) of a city hosts various land uses: office buildings,government, shopping, entertainment centers, restaurants, historical sites, and high-rise residentialdevelopments. The CBD is the focal point of the regional transportation network and the confluence oftransit and highways. Because of its flexibility, walking is the only means of transportation satisfying the short, dispersed trip linkages required in the CBD. Downtown-origin-and-destination surveys in mostcities show that approximately 90 percent of all internal trips within the CBD are made on foot.
The traditional urban core is often superimposed on an archaic street system surviving from pastland use and a smaller population. The street system of the Manhattan financial district of New YorkCity, for example, dates to colonial times when the tallest structure was two or three stories. Now thesesame streets serve buildings rising 50 to 100 stories, representing millions of square feet of office space.Thousands of workers and visitors enter and leave these buildings each day, exceeding the capacity of thesidewalk and spilling over into the roadway. In such situations, maximum use of sidewalk area and flowcapacity is a necessity.
In many high-density CBDs, the sidewalk width has been reduced to facilitate vehicular trafficmovement. This reduces pedestrian traffic capacity, but does not always produce a commensurateincrease in vehicle capacity. The wider streets increase the likelihood of pedestrian-vehicle crosswalkconflicts, which limits vehicle capacity at intersections.
The potential pedestrian capacity of the CBD sidewalks is further reduced by the intrusion ofrefuse cans, fire hydrants, fire alarm boxes, parking meters, traffic signals, control boxes and poles,signposts, newsstands, telephone booths, mailboxes, bus benches, planters, sewer and ventilation gratings,
Figure 3. Pedestrian capacity of CBD sidewalks is reduced by light posts, mailboxes, parking meters, etc.

6
and other street furniture. In addition, building service operations, such as unloading or loadingof trucks, often inconvenience and sometimes endanger the pedestrian. Many intersections were built withlittle control over the location of fixed sidewalk furniture and utilities that often appear in clusters atintersections, the most critical points in the pedestrian circulation network.
Pedestrians waiting at intersections need space, and intersections must accommodate weaving,opposing pedestrian flows. The intersection is also the most common location for bus stops and rapidtransit entrances. The pedestrian is further harassed by vehicles stopped in the crosswalk or turning intothe path of crossing pedestrians. When a rapid transit entrance is situated along a narrow sidewalk near anintersection, narrow subway stairs can cause pedestrian queues both in the transit station below and on thesurface.
This all adds to inconvenience, potential danger, and delay for the pedestrian. Although the totalamount of pedestrian delay time may far exceed driver delay time within the CBD, traffic signalization isusually designed to facilitate vehicular flow. Often, the only consideration given to pedestrians at signalsis to meet the minimum pedestrian WALK and clearance times, which may not be sufficient forpedestrians with special crossing needs. Where automatic detection is provided for motor vehicles,pedestrians typically must push a button to be detected. In some cases, long cycle lengths encouragepedestrians to cross against a signal.
The rectangular grid pattern of the typical CBD is not conducive to characteristically shortpedestrian trips. In some instances, the grid pattern of Manhattan's streets requires a time- and energy-consuming 1,000-foot walk for a straight-line trip distance of only 200 feet. Larger midblock buildingswith frontages on adjacent streets are often used as through-routes so the pedestrian can reduce tripdistances. This practice is more common in inclement weather. Depending on city location, one day infour may be too windy, cold, wet, or hot for the pedestrian's comfort. But, protection of the pedestrianfrom the elements is a low priority in most cities.
Guides and Model Programs
There is some variation among the States’ laws and regulations for pedestrian movement, thoughthe Uniform Vehicle Code (1992) and the Manual on Uniform Traffic Control Devices (1998 and 2001)have helped to reduce this variability. Since the early 1970s, numerous publications have discussedalternative measures to prevent pedestrian crashes. Several studies in the 1970s suggested possiblecountermeasures for predominant pedestrian crash types, such as dart-outs, midblock dash crashes, andothers. Brief synopses of some of these are provided in the following paragraphs.
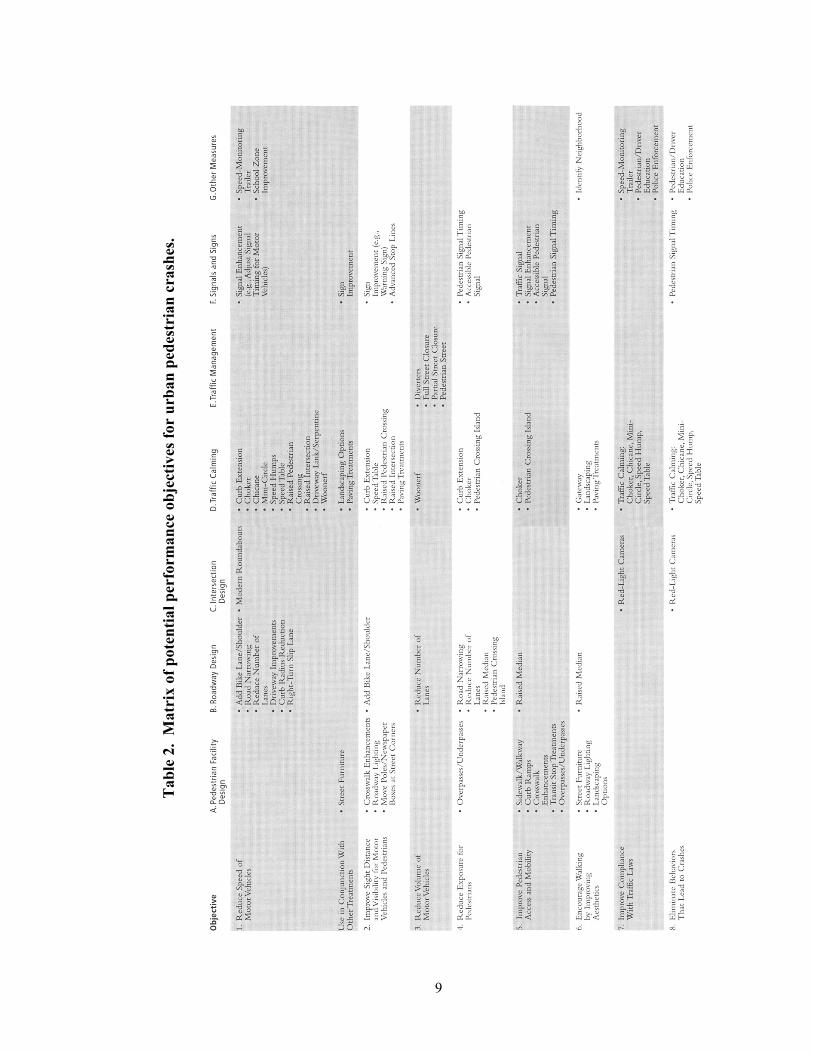
A recent FHWA guide provides a matrix of 47 possible pedestrian treatments for 13 groups ofpedestrian crashes (Zegeer et al., Pedestrian Facilities Users Guide: Providing Safety and Mobility,FHWA, March, 2002). The matrix of candidate engineering countermeasures is given in table 1. Thisguide provides information for each of the 47 engineering treatments, including a description of thecountermeasure, considerations for using it, implementation cost, and a photo and/or sketch. Acountermeasure matrix is also provided in that report (see table 2) for use in addressing variousperformance objectives (e.g., reducing vehicle speeds, reducing vehicle volume). Finally, the guideprovides examples of pedestrian case studies and success stories, as well as recommendations andpriorities for installing sidewalks and walkways, marked crosswalks and other pedestrian crossingtreatments. This guide may be found at http://www.walkinginfo.org/rd/for_ped.htm#guide.
FHWA's Model Pedestrian Safety Program, written in 1977 and updated in 1987, provides a six-step process for planning, implementation, and evaluation relative to an agency's pedestrian safety
7
Tab
le 1
. M
atri
x of
pot
entia
l eng
inee
ring
cou
nter
mea
sure
s for
urb
an p
edes
tria
n cr
ashe
s.
8
Tab
le 1
. M
atri
x of
pot
entia
l eng
inee
ring
cou
nter
mea
sure
s for
urb
an p
edes
tria
n cr
ashe
s. (C
on’t
)
Tab
le 2
. M
atri
x of
pot
entia
l per
form
ance
obj
ectiv
es fo
r ur
ban
pede
stri
an c
rash
es.
9

10
Figure 4. Pedestrians in rural and developing areasneed to be able to get from one place to anothersafely and conveniently.
program. The User's Guide Supplement presents detailed information on the various countermeasures forpedestrian crashes, including their advantages and disadvantages and implementation considerations. Details on work-zone management for improved pedestrian protection is given in Work Zone TrafficManagement, a report published by FHWA in 1989.
In 1981, a report by Vallette and McDivitt reviewed available pedestrian literature andoperational experiences of 19 U.S. cities concerning pedestrian safety programs. The study included thedevelopment of a matrix of 450 pedestrian-related articles and publications by 71 subject categories.Operational experiences of 19 city agencies were provided based on visits and interviews with thoseagencies relevant to their safety program coordination, traffic engineering, school and child safetyprograms, provisions for the handicapped, public information and education, enforcement of pedestrian-related laws, safety analysis, and safety program recommendations and philosophy.
The WALK ALERT program is a national pedestrian safety program, a cooperative effort of theNational Safety Council, FHWA, National Highway Traffic Safety Administration (NHTSA), and morethan 100 service and community organizations. The primary objective is to reduce pedestrian crashes.The 1989 WALK ALERT Program Guide (National Safety Council, 1988) provides the steps needed toorganize and implement a local pedestrian safety effort. The guide includes information on engineeringimprovements, educational materials for all age levels, and possible enforcement/laws and ordinances toimprove pedestrian safety. Information is also provided for working with the news media, along with aresource guide that lists pedestrian safety programs, audiovisuals, and print materials recommended forthe WALK ALERT program.
In 1988, a Transportation Research Board (TRB) synthesis, Pedestrians and Traffic-ControlMeasures, was published by C. Zegeer and S. Zegeer. This report provides details on publications andinformation related to 21 specific types of engineering traffic-control measures. This information is basedon question- naire responses from 48 city and state transportation agencies on pedestrian facilities,including traffic and roadway conditions under which each measure is most and least effective. The reportincludes discussions of special pedestrian situations (e.g., work-zone travel) and traffic-control needs forspecial pedestrian groups (e.g., college students, children in school zones, older and handicapped adults).Recommendations are provided for selecting effective traffic-control measures to improve pedestriansafety and movement.
A 1987 National Cooperative Highway Research Program (NCHRP) report, Planning andImplementing Pedestrian Facilities in Suburban and Developing Rural Areas contains information on
11
Tab
le 3
. Pa
rtia
l sum
mar
y of
ped
estr
ian
faci
lity
prob
lem
s and
pos
sibl
e so
lutio
ns.*
Des
crip
tion
of P
robl
emM
agni
tude
ofPr
oble
mPo
ssib
le S
olut
ions
Cur
rent
Lev
elof
Use
or
Acc
epta
nce
Lim
itatio
ns in
A
pplic
abili
tyPo
tent
ial
Effe
ctiv
enes
s
Bar
riers
toIm
plem
en-ta
tion
Cos
tIm
pact
on
Oth
er G
roup
sC
omm
ent
Cro
ssSe
ctio
n D
esig
n
Diff
icul
ty o
f cro
ssin
g w
ide,
arte
rial s
treet
s, es
peci
ally
undi
vide
d ar
teria
ls
Maj
or1.
Ins
tall
med
ians
on
all n
ew
subu
rban
hig
hway
s of 4
or
m
ore
lane
s.
2. I
nsta
ll Eu
rope
an-s
tyle
refu
ge is
land
s in
stra
tegi
c lo
catio
ns o
n e
xist
ing
undi
vide
d hi
ghw
ays.
3. D
esig
n fo
r red
uced
stre
et w
idth
be
twee
n si
gnal
ized
inte
rsec
-
tions
(sin
ce c
apac
ity c
onst
rain
ts
are
at si
gnal
[s].
4. I
ntro
duce
add
ition
al tr
affic
sign
als t
o fa
cilit
ate
ped.
cr
ossi
ngs.
5. P
rovi
de m
idbl
ock
actu
ated
flash
ing
ped.
sign
al.
6. P
rovi
de p
ed. o
verp
ass.
Mod
erat
e
Low
Low
Low
Low
Low
Virt
ually
no
limita
tions
for n
ewhw
ys. H
owev
er, s
ome
limita
tions
are
curr
ently
per
ceiv
ed.
Mus
t nar
row
lane
s on
exis
ting
hwys
. to
acco
mm
odat
e re
fuge
isla
nds.
Mus
t be
wel
l lig
hted
.
Cou
ld o
nly
be d
one
whe
re sp
acin
gbe
twee
n in
ters
ectio
ns is
hig
h.
Cou
ld o
nly
be d
one
in a
few
sele
cted
loca
tions
.
Shou
ld o
nly
be in
stal
led
in k
eylo
catio
ns.
Onl
y ef
fect
ive
whe
re a
t-gra
decr
ossi
ng is
blo
cked
or i
sin
conv
enie
nt.
Hig
h
Hig
h
Mod
erat
e
Mod
erat
e
Mod
erat
e
Mod
erat
e- d
epen
ds o
n n
o. o
f ped
s
Mod
erat
e
Mod
erat
e
Hig
h
Hig
h
Mod
erat
e
Mod
erat
e
Mod
erat
e
Low
to m
oder
ate
Low
Mod
erat
e
Low
Hig
h
Posi
tive
Min
imal
Neg
ativ
e
Hig
hly
nega
tive
Slig
htly
nega
tive
Posi
tive
Pote
ntia
lly th
e m
ost
effe
ctiv
e so
lutio
n to
st
reet
cro
ssin
g pr
oble
ms.
This
solu
tion
is g
reat
lyun
deru
tiliz
ed in
U.S
.
Prob
ably
not
feas
ible
as
a ge
nera
l pra
ctic
e.
Mor
e fe
asib
le w
here
ped.
cro
ssin
gs a
reco
ncen
trate
d at
a p
oint
Des
igne
d to
info
rmdr
iver
of p
rese
nce
ofpe
d; m
ayno
t mak
e cr
ossi
ng e
asie
r.La
ck o
f use
of f
acili
tyco
ntin
ues t
o be
apr
oble
m.
Diff
icul
ty o
f cro
ssin
ghi
ghw
ays w
ith tw
o-w
ay le
fttu
rn la
nes
Mod
erat
e
to M
ajor
1. R
educ
e us
e of
this
tech
niqu
e an
dpr
ovid
e m
edia
ns to
con
trol
acce
ss.
2. I
nsta
l ref
uge
isla
nds i
n sp
ots
whe
re n
o tu
rnin
g is
nec
essa
ry.
Low
Low
Wou
ld n
eed
to d
esig
n in
freq
uent
U-tu
rn c
apab
ility
.
Mus
t hav
e at
leas
t som
e “d
ead
spot
s” w
here
turn
ing
wou
ld n
otge
nera
lly o
ccur
.
Hig
h
Hig
h
Hig
h
Mod
erat
e
Mod
erat
e to
hig
h
Low
Neg
ativ
e
Min
imal
Mer
chan
ts a
nd d
river
sw
ill o
bjec
t hea
vily
.
Isla
nds m
ust b
e w
ell-
light
ed a
nd m
arke
d.
No
faci
litie
s pro
vide
d fo
r ped
.to
wal
k al
ong
side
of r
oad
Maj
or1.
Req
uire
side
wal
k/pa
thw
ay w
ith
all n
ew h
wy.
con
stru
ctio
n. P
aved
or st
abili
zed
shou
lder
ade
quat
e in
outly
ing
area
s.
2. P
rovi
de e
asie
r met
hods
for
obta
inin
g ea
sem
ents
to a
ddre
ss
exis
ting
high
way
s con
stra
ined
by
right
of w
ay.
Mod
erat
e
Low
Onl
y al
low
ed e
xclu
sion
shou
ld b
elo
w-v
olum
e re
side
ntia
l stre
ets.
Prob
ably
wou
ld b
e vi
ewed
as
givi
ng e
xces
s aut
horit
y to
pub
licag
enci
es.
Hig
h
Hig
h
Mod
erat
e H
igh
Mod
erat
e
Low
Min
imal
Neg
ativ
e
Cou
ld b
e re
quire
d by
FHW
A fo
r Fed
eral
proj
ects
.
Wou
ld p
ut p
rope
rtyow
ners
at a
disa
dvan
tage
.
Nar
row
brid
ges w
ith n
ope
dest
rian
acco
mm
odat
ions
Mod
erat
e1.
Des
ign
all n
ew b
ridge
s with
sh
ould
er o
r rai
sed
wal
kway
.
2. D
esig
n lo
w-c
ost w
alkw
ay
syst
em f
or a
ttach
ing
to o
utsi
de
of b
ridge
.
Mod
erat
e
Low
Non
e
Feas
ibili
ty a
nd d
esig
n de
pend
ent
on st
ruct
ural
nat
ure
of e
xist
ing
brid
ge
Mod
erat
e to
hig
h
Mod
erat
e to
hig
h
Mod
erat
e
Mod
erat
e
Mod
erat
e to
hig
h
Mod
erat
e
Posi
tive
Posi
tive
*So
urce
: Sm
ith, S
.A.,
et a
l., 1
987.

12
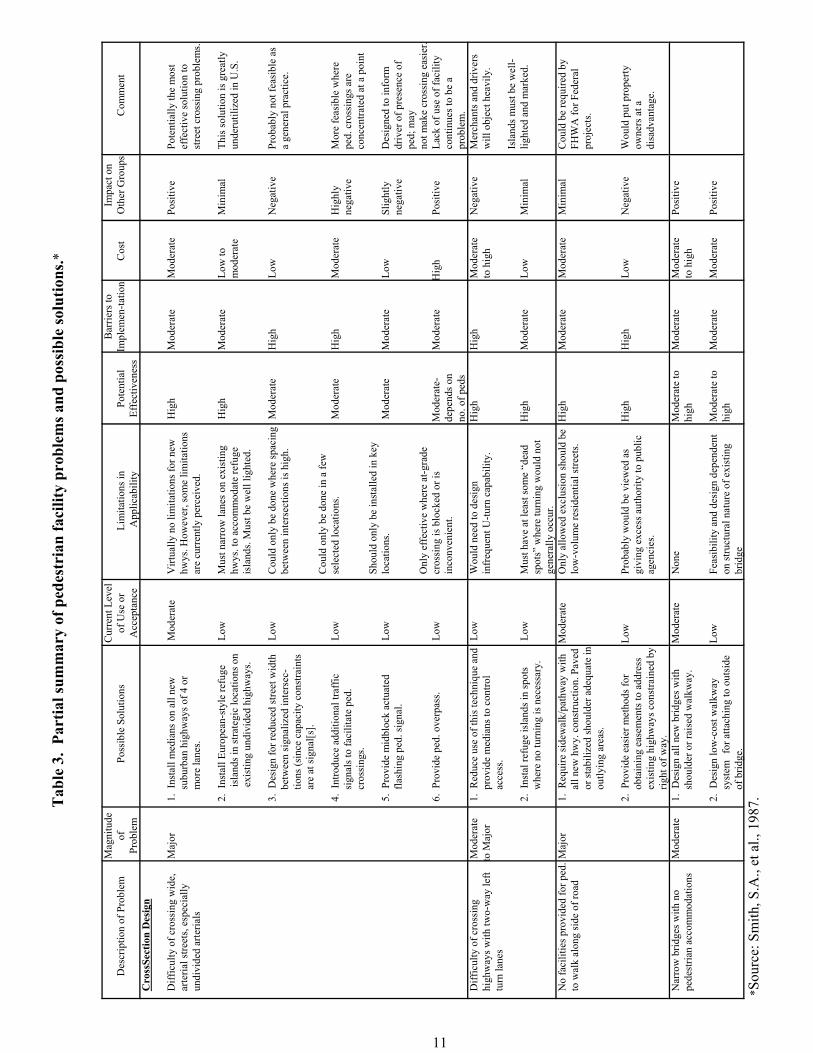
providing for pedestrian needs outside of urban areas. The report discusses the nature of suburban andrural pedestrian problems and how they occur, the planning process, pedestrian facilities within highwayright-of-way, and practical considerations for providing such facilities. A summary addresses pedestrianfacility problems and possible solutions, and a sample of such information is given in table 1. Many of thedeficiencies that were found in suburban and developing rural areas were attributed to planners’ failure tothink about how to get pedestrians safely and conveniently from one place to another.
A report entitled, Handbook on Planning, Design, and Maintenance of Pedestrian Facilities(Bowman, Fruin, and Zegeer, 1989) assembled current information to help design, construct, andmaintain pedestrian facilities. The planning and design details are emphasized for such facilities assidewalks and walkways, crosswalks, curb ramps and refuge islands, overpasses and underpasses,pedestrian priority zones (e.g., malls, auto-restricted zones, and temporary street closings), traffic-controldevices, and pedestrian facilities in work zones. The report also provides information on pedestriancharacteristics and how to conduct pedestrian traffic and safety studies.
Planning Community Pedestrian Safety Programs— An Agenda for Action (NHTSA, 1980) is a guide to assist local communities in either integrating pedestrian safety into an existing community trafficsafety program or developing and implementing a new and independent pedestrian safety program. Thecomponents of community programs are discussed in addition to methods for developing the plan ofaction and program evaluation.
As discussed above, a number of user guides and procedural manuals have been written ondeveloping local or statewide pedestrian safety programs (e.g., WALK ALERT Program Guide, PlanningCommunity Pedestrian Safety Programs, Model Pedestrian Safety Program User's Guide) (NationalSafety Council, 1988; Planning Community Safety Programs, 1980; Work Zone Traffic Management,1989). Other publications document city pedestrian safety programs and/or provide information fromprevious pedestrian literature in selected areas (e.g., Vallete and McDivitt, 1981; Zegeer and Zegeer,1988). Still others assist the planning, design, implementation, and maintenance of pedestrian facilities(e.g., Smith et. al., 1987 and Bowman et. al. 1989).

13
PART 2. CRASHES INVOLVING PEDESTRIANS
Introduction
The sheer number of pedestrians killed or seriously injured in U.S. traffic collisions each year isan important consideration in the Nation’s highway transportation system. The NHTSA estimated that5,300 pedestrians were killed in the United States during 1997 (Traffic Safety Facts, 1997). NHTSA alsoreported 77,000 nonfatal injuries. Casualties of this magnitude take on even greater meaning in view ofthe national policy to encourage increased walking as a matter of both transportation and health.
Limitations of National Pedestrian Crash Data
Pedestrian crash statistics must be considered with two caveats: First, the numbers presented inthis report are estimates, aggregated from information compiled in 50 States plus the District ofColumbia, or taken from studies that sample pedestrian collisions. Predictably, there is some uncertaintyin the reporting processes and expectable variations due to sampling differences. Second, definitions varyamong agencies. Thus, fatality estimates from the National Safety Council (NSC) differ somewhat fromthose of the NHTSA due to their definitions of death. NSC counts a traffic fatality as any crash death thatensues within 1 year after the crash, whereas NHTSA only counts those deaths that occur within 30 days. Other totals would result if, for example, traffic death counts were confined to victims who died at thecrash scene.
Another caution pertains to interpreting the following data tables, which may themselves beoverly simplistic. A collision may be associated with several factors, therefore a table that displays onlytwo or three factors leaves much unsaid. For example, a table depicting pedestrian crashes by time ofoccurrence will show that a certain proportion occurs at night. However, not all of the observed trendsshown in such a table would be caused by reduced nighttime visibility. Although reduced visibility atnight plays an important role in the likelihood of a crash, the nighttime figures are also influenced by thenumber of people who are exposed to risk at night as opposed to in the daytime, the ages of thepedestrians, and the role of alcohol. Thus, any table of crash data reflects the influence of variables notshown, as well as the influence of the variables that are depicted.
Moreover, many studies do not consider the number of people actually exposed to risk.
Reports reviewed here span the period during which standardized terminology was evolving. Thus, various authors use the term “accident”, “collision”, or “crash” to describe the phenomena underexamination here. While the terms are sometimes used interchangeably, “crash” has become the termpreferred by safety organizations.
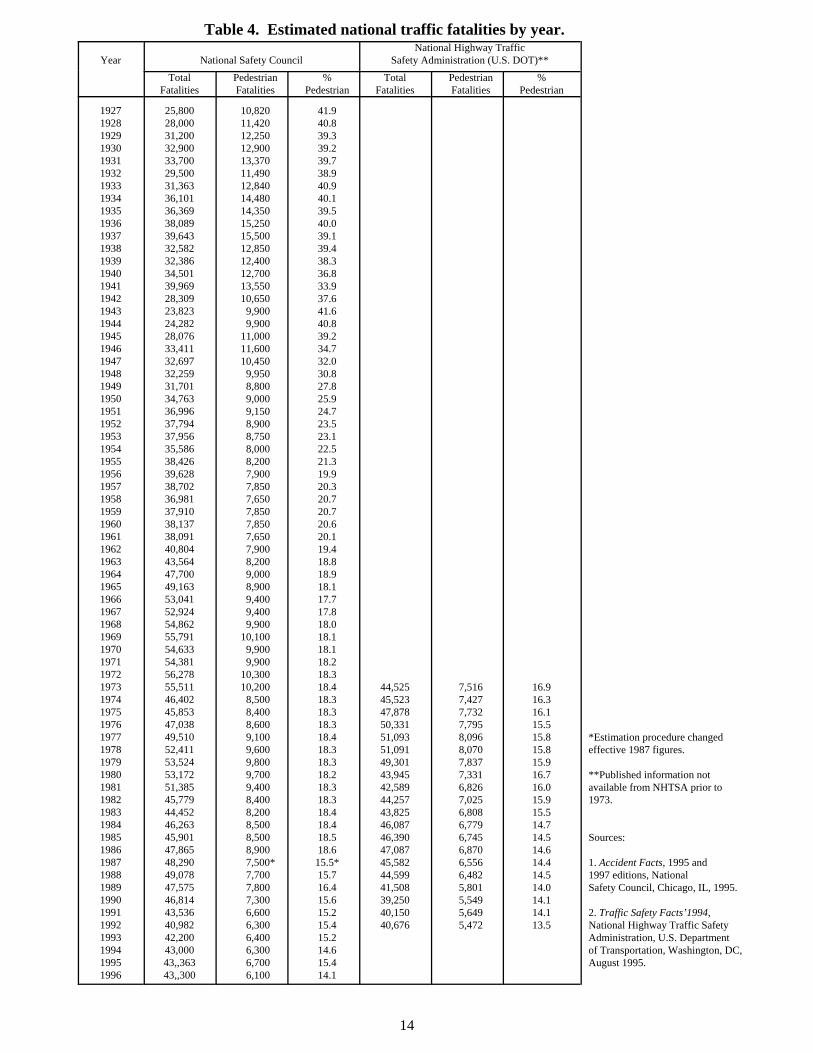
The Number of Pedestrian Fatalities
The NSC annually publishes an estimate of U.S. pedestrian deaths for the most recent yearavailable, as well as for years as far back as 1927 (Accident Facts, 1995, 1996, 1997 editions). Theestimated number of pedestrian fatalities for 1927 was 10,820, as shown in table 4. The pedestrian deathcount irregularly grew until 1937, when 15,500 pedestrian deaths were reported, the largest number inU.S. history. Thereafter, the number declined. The number of pedestrian fatalities exceeded 10,000during 1969, 1972, and 1973, and since then decreased to 6,100 in 1996. It should be noted that the NSCestimating procedure was changed in 1987 and the annual number of deaths it reported becamesubstantially lower beginning that year.
14
Table 4. Estimated national traffic fatalities by year.
Year National Safety CouncilNational Highway Traffic
Safety Administration (U.S. DOT)**Total
FatalitiesPedestrianFatalities
%Pedestrian
TotalFatalities
PedestrianFatalities
%Pedestrian
1927192819291930193119321933193419351936193719381939194019411942194319441945194619471948194919501951195219531954195519561957195819591960196119621963196419651966196719681969197019711972197319741975197619771978197919801981198219831984198519861987198819891990199119921993199419951996
25,80028,00031,20032,90033,70029,50031,36336,10136,36938,08939,64332,58232,38634,50139,96928,30923,82324,28228,07633,41132,69732,25931,70134,76336,99637,79437,95635,58638,42639,62838,70236,98137,91038,13738,09140,80443,56447,70049,16353,04152,92454,86255,79154,63354,38156,27855,51146,40245,85347,03849,51052,41153,52453,17251,38545,77944,45246,26345,90147,86548,29049,07847,57546,81443,53640,98242,20043,00043,,36343,,300
10,82011,42012,25012,90013,37011,49012,84014,48014,35015,25015,50012,85012,40012,70013,55010,650 9,900 9,90011,00011,60010,450 9,950 8,800 9,000 9,150 8,900 8,750 8,000 8,200 7,900 7,850 7,650 7,850 7,850 7,650 7,900 8,200 9,000 8,900 9,400 9,400 9,90010,100 9,900 9,90010,30010,200 8,500 8,400 8,600 9,100 9,600 9,800 9,700 9,400 8,400 8,200 8,500 8,500 8,900
7,500* 7,700 7,800 7,300 6,600 6,300 6,400 6,300 6,700 6,100
41.940.839.339.239.738.940.940.139.540.039.139.438.336.833.937.641.640.839.234.732.030.827.825.924.723.523.122.521.319.920.320.720.720.620.119.418.818.918.117.717.818.018.118.118.218.318.418.318.318.318.418.318.318.218.318.318.418.418.518.615.5*15.716.415.615.215.415.214.615.414.1
44,52545,52347,87850,33151,09351,09149,30143,94542,58944,25743,82546,08746,39047,08745,58244,59941,50839,25040,15040,676
7,5167,4277,7327,7958,0968,0707,8377,3316,8267,0256,8086,7796,7456,8706,5566,4825,8015,5495,6495,472
16.916.316.115.515.815.815.916.716.015.915.514.714.514.614.414.514.014.114.113.5
*Estimation procedure changedeffective 1987 figures.
**Published information notavailable from NHTSA prior to1973.
Sources:
1. Accident Facts, 1995 and 1997 editions, NationalSafety Council, Chicago, IL, 1995.
2. Traffic Safety Facts’1994, National Highway Traffic SafetyAdministration, U.S. Departmentof Transportation, Washington, DC,August 1995.

15
It is also of interest to consider pedestrian fatalities as a percentage of total traffic fatalities. During 1927, pedestrian deaths accounted for 41.9 percent of total traffic deaths. That percentage has declined and was 14.1 percent of the total in 1996, a substantial decline from 1927 (figure 5). Increasedtravel by car is one factor in that change. Evans (1991), among others, has reported that the higher thedegree of motorization in a country, the number of motor vehicles per 100,000 population, the lower theproportion of pedestrian deaths to total traffic deaths. The proportion of pedestrian deaths declined as theUnited States progressively became more motorized. This trend also is seen in less motorized countries(Choueiri et al., 1993).
This influence of car travel was highlighted by the U.S. experience during World War II whenthere was an interruption in the steady decline in pedestrian fatalities as a percentage of total trafficfatalities. The pedestrian fatalities were 33.9 percent in 1941. During the war years (1942-1945) the totalabruptly jumped to values between 38 and 41 percent. In 1947, the figure reversed again to a new low of32 percent, and after 1949 did not again reach 30 percent (See table 4). The increase during World War IIprobably reflected the fact that motor vehicle mileage fell during those years because civilian vehicleproduction gave way to military needs, and the existing civilian motor vehicle fleet amassed drasticallyfewer miles because of gasoline and tire (that is, rubber) rationing. It is also likely that the characteristicsof highway users changed during that period, what with millions of young men away in the military, plusunprecedented numbers of women in the work force. It should be noted that Choueiri et al. (1993) show agreater pedestrian death decline in Europe during recent years than in the United States.
Table 5 shows a comparison of States (and Puerto Rico), using NHTSA data (Traffic SafetyFacts, 1995) from highest rank to lowest according to pedestrian deaths per 100,000 population. Thetable is reproduced here to suggest some of the complexities that underlie pedestrian crash and deathfigures. The 10 States with the highest pedestrian death rate per 100,000 population vary significantly:two are urban and densely populated (DC and Puerto Rico), 3 are sparsely populated desert states, and 3are among the 11 most populous states (California, Florida, and North Carolina). This suggests that thecomplex of factors producing high pedestrian death rates may differ from one State to another. Also,none of these rates consider pedestrian exposure or vehicle exposure, the proportion of pedestrians byage, or many other possible contributing factors.
At the other end of the spectrum, the 10 States with the lowest pedestrian death rate per 100,000population also differ. The lowest 10 include rural States, cold weather States, industrial heartland states,and the agricultural midwest. This may be indicative of lower amounts of walking by pedestrians and/orless pedestrian interaction with high volumes of motor vehicles.
When Do Pedestrian Collisions Occur?
A. TIME OF DAY
Collisions can and do occur at any time, but there are trends involving the time of occurrence. Table 6 shows how pedestrian crashes, injuries, and fatalities vary by time of day.

16
Pedestrian Fatalities as a Percentage of All Fatalities
0
5
10
15
20
25
30
35
40
45
1927
1930
1933
1936
1939
1942
1945
1948
1951
1954
1957
1960
1963
1966
1969
1972
1975
1978
1981
1984
1987
1990
1993
1996
Year
Percent
Figure 5. Pedestrian fatalities as a percentage of total traffic fatalities, 1927-1996.

17
Table 5. Ranking of State pedestrian fatality rates per 100,000 residents , 1994.
Rank StatePedestrians
KilledPopulation
(Thousands)
Pedestrian FatalityRate per 100,000
Population
12345
6789
10
1112131415
1617181920
2122232425
2627282930313233
3435363738
3940414243
4445464748
495051
New MexicoDistrict of ColumbiaFloridaNevadaArizona
South DakotaSouth CarolinaCaliforniaNorth CarolinaMaryland
DelawareLouisianaTexasGeorgiaArkansas
OregonHawaiiNew YorkUtahNew Jersey
MississippiAlaskaIllinoisAlabamaConnecticut
MichiganTennesseeMaineMissouriOklahomaRhode IslandWest VirginiaVirginia
WashingtonPennsylvaniaKentuckyMassachusettsColorado
IndianaMontanaNorth DakotaMinnesotaOhio
NebraskaNew HampshireWisconsinKansasIowa
WyomingIdahoVermont
USA
Puerto Rico
7223
53154
148
23108843184129
18103436163
55
6926
39740
165
5412
2328163
182972085521629
102
83171
548551
8011
853
127
1711492224
482
5,472
205
1,654570
13,9531,4574,075
7213,664
31,4317,0705,006
7064,315
18,3787,0552,453
3,0861,179
18,1691,9087,904
2,669606
11,7524,2193,275
9,4965,1751,2405,2783,258
9971,8226,552
5,34312,052
3,8276,0413,656
5,752856638
4,56711,102
1,6231,1375,0822,5542,829
4761,133
580
260,341
3,700
4.354.043.813.713.63
3.192.952.682.602.58
2.552.392.372.312.24
2.242.212.192.102.09
2.021.981.971.921.92
1.921.871.611.611.601.601.591.56
1.551.421.411.411.39
1.391.291.251.161.14
1.050.970.960.860.85
0.840.710.34
2.10
5.54Source: Traffic Safety Facts, 1994: 1994 Motor Vehicle Crash Data from FARS and GES National Highway TrafficSafety Administration, US DOT, Washington, D.C., 1995.

18
Figure 6. A disproportionately highpercentage of pedestrian deaths occurat night.
Table 6. Pedestrian collisions by time of day.
National Fatalities1 National Injuries1 Sample of Crashes2
% N % N % N
6-9 AM9 AM-NoonNoon-3 PM3-6 PM6-9 PM9 PM-MidnightMidnight-3 AM3-6 AM
7.56.98.8
13.924.819.411.76.5
409377480760
13591062
638353
9.59.3
18.425.521.210.7
4.31.1
9,0008,000
16,00023,00019,00010,000
4,0001,000
8.99.3
32.2020.211.3
6.01.99.2
420440735
1271954536283
92
100% 5472 100% 90,000 100% 4,731
1Estimates of national figures. Source: Traffic Safety Facts, 1994: 1994 Motor VehicleCrash Data from FARS and GES, National Highway Traffic Safety Administration, USDOT, Washington, D.C., August 1995. 2Sample data from six states. Source:Derived from database used in Pedestrian and Bicycle Crash Types of the Early 1990s, Hunter, W., Stutts, J., Pein, W., Cox, C., UNC HSRC, FHWA-RD-95-163, 1996. The sample noted crashes of all severities ranging from fatal to no injury, and was drawn from California, Florida, Maryland, Minnesota,
North Carolina, and Utah, covering collisions that occurred in 1991 or 1992.
Table 6 can be used to contrast the time of occurrence for “all” pedestrian crashes, fatally injuredpedestrians, and pedestrians injured but not killed.
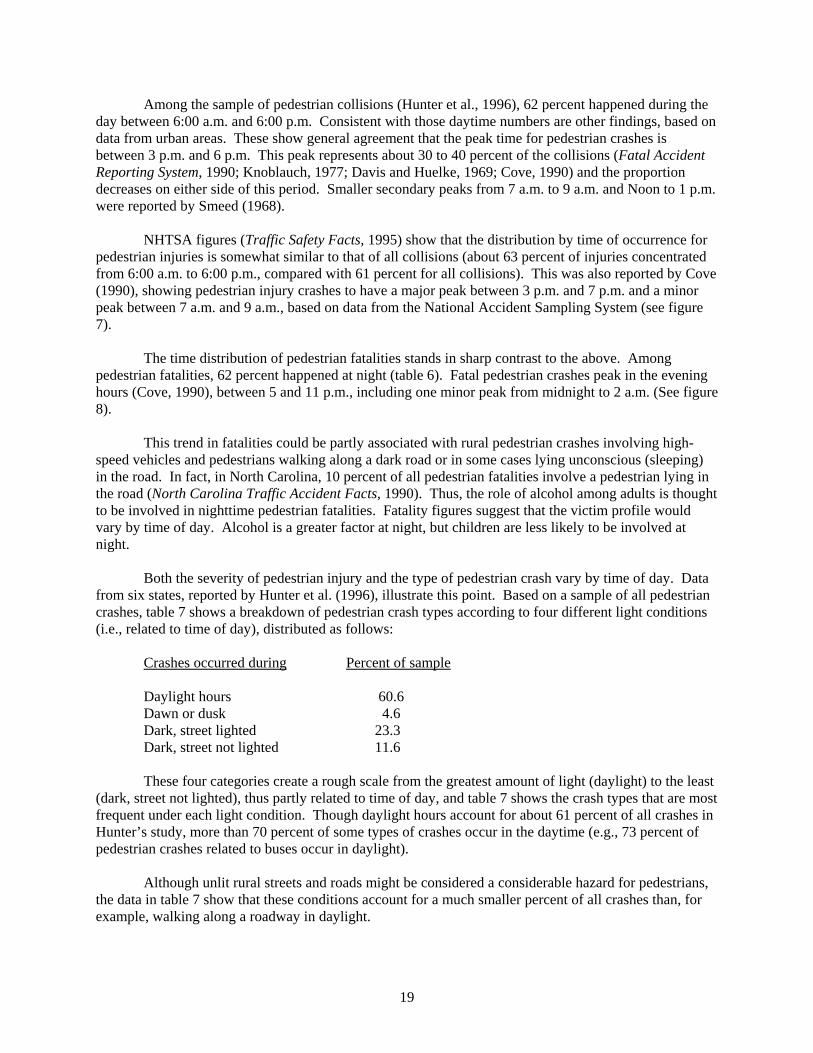
19
Among the sample of pedestrian collisions (Hunter et al., 1996), 62 percent happened during theday between 6:00 a.m. and 6:00 p.m. Consistent with those daytime numbers are other findings, based ondata from urban areas. These show general agreement that the peak time for pedestrian crashes isbetween 3 p.m. and 6 p.m. This peak represents about 30 to 40 percent of the collisions (Fatal AccidentReporting System, 1990; Knoblauch, 1977; Davis and Huelke, 1969; Cove, 1990) and the proportiondecreases on either side of this period. Smaller secondary peaks from 7 a.m. to 9 a.m. and Noon to 1 p.m.were reported by Smeed (1968).
NHTSA figures (Traffic Safety Facts, 1995) show that the distribution by time of occurrence forpedestrian injuries is somewhat similar to that of all collisions (about 63 percent of injuries concentratedfrom 6:00 a.m. to 6:00 p.m., compared with 61 percent for all collisions). This was also reported by Cove(1990), showing pedestrian injury crashes to have a major peak between 3 p.m. and 7 p.m. and a minorpeak between 7 a.m. and 9 a.m., based on data from the National Accident Sampling System (see figure7).
The time distribution of pedestrian fatalities stands in sharp contrast to the above. Amongpedestrian fatalities, 62 percent happened at night (table 6). Fatal pedestrian crashes peak in the eveninghours (Cove, 1990), between 5 and 11 p.m., including one minor peak from midnight to 2 a.m. (See figure8).
This trend in fatalities could be partly associated with rural pedestrian crashes involving high-speed vehicles and pedestrians walking along a dark road or in some cases lying unconscious (sleeping)in the road. In fact, in North Carolina, 10 percent of all pedestrian fatalities involve a pedestrian lying inthe road (North Carolina Traffic Accident Facts, 1990). Thus, the role of alcohol among adults is thoughtto be involved in nighttime pedestrian fatalities. Fatality figures suggest that the victim profile wouldvary by time of day. Alcohol is a greater factor at night, but children are less likely to be involved atnight.
Both the severity of pedestrian injury and the type of pedestrian crash vary by time of day. Data from six states, reported by Hunter et al. (1996), illustrate this point. Based on a sample of all pedestriancrashes, table 7 shows a breakdown of pedestrian crash types according to four different light conditions(i.e., related to time of day), distributed as follows:
Crashes occurred during Percent of sample
Daylight hours 60.6Dawn or dusk 4.6Dark, street lighted 23.3Dark, street not lighted 11.6
These four categories create a rough scale from the greatest amount of light (daylight) to the least(dark, street not lighted), thus partly related to time of day, and table 7 shows the crash types that are mostfrequent under each light condition. Though daylight hours account for about 61 percent of all crashes inHunter’s study, more than 70 percent of some types of crashes occur in the daytime (e.g., 73 percent ofpedestrian crashes related to buses occur in daylight).
Although unlit rural streets and roads might be considered a considerable hazard for pedestrians,the data in table 7 show that these conditions account for a much smaller percent of all crashes than, forexample, walking along a roadway in daylight.
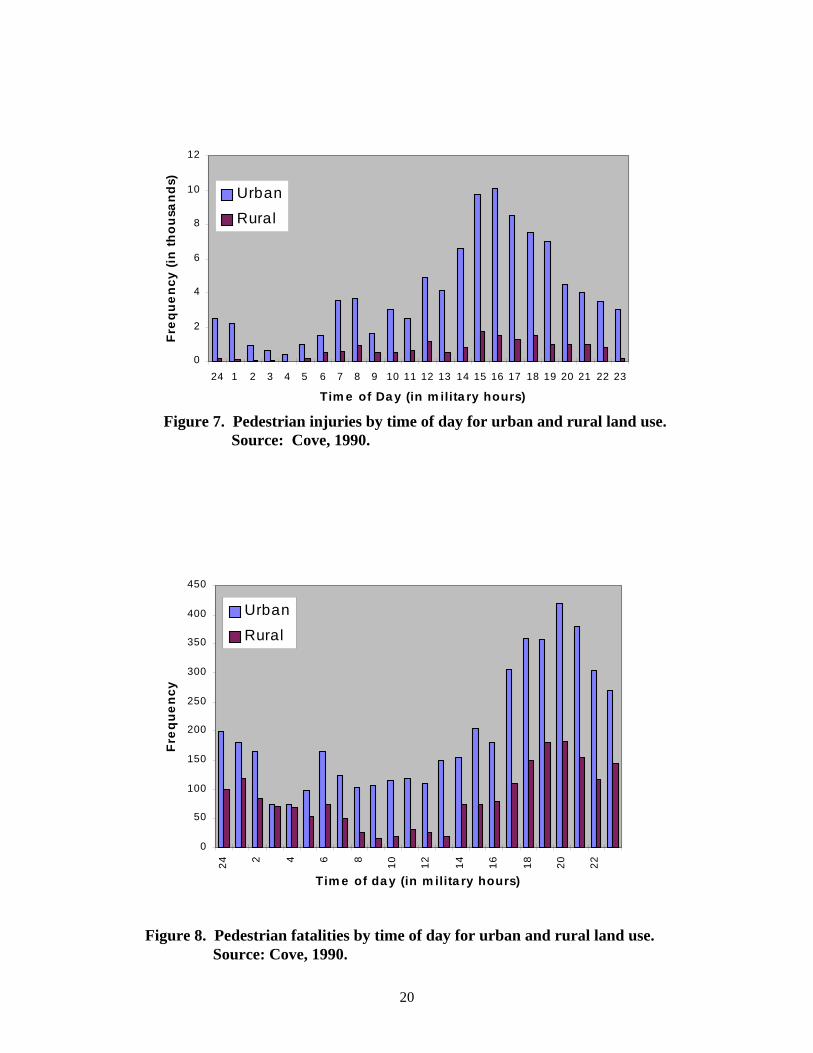
20
0
2
4
6
8
10
12
24 1 2 3 4 5 6 7 8 9 10 11 12 13 14 15 16 17 18 19 20 21 22 23
Tim e of Da y (in m ilita ry hours)
Freq
uenc
y (in
thou
sand
s)
Urban
Rural
0
50
100
150
200
250
300
350
400
450
24 2 4 6 8 10 12 14 16 18 20 22
Tim e of da y (in m ilita ry hours)
Freq
uenc
y
Urban
Rural
Figure 8. Pedestrian fatalities by time of day for urban and rural land use. Source: Cove, 1990.
Figure 7. Pedestrian injuries by time of day for urban and rural land use. Source: Cove, 1990.

21
Table 7. Fatal and non-fatal pedestrian crash types by light condition.
Light Condition*/Percent of All Crashes
PedestrianCrash Type Daylight Dawn/Dusk
Dark,Street Light
Dark, NoStreet Light
Bus related 72.7 4.5 20.5 2.3
Other vehicle specific 74.2 2.2 13.5 10.1
Driverless vehicle 82.4 4.1 4.1 9.5
Backing vehicle 72.0 3.2 19.1 5.7
Disabled vehicle 40.0 6.7 16.7 36.7
Working/playing in road 74.7 8.2 11.6 5.5
Walking along roadway 33.5 5.5 19.4 41.6
Not in road 67.8 4.2 22.6 5.4
Vehicle turning at intersection 72.0 5.3 20.5 2.2
Intersection dash 70.9 4.5 20.4 4.2
Driver violation at intersection 63.1 2.7 32.9 1.2
Other intersection 53.8 4.4 34.8 7.0
Midblock dart/dash 73.4 5.7 14.7 6.2
Other midblock 46.8 3.4 32.1 17.7
Miscellaneous 49.5 3.8 28.6 18.1
ALL CRASHES 60.6 4.6 23.3 11.6
*Cases with unknown light condition excluded. Source: Pedestrian and Bicycle Crash Types of the Early 1990s Hunter, W., Stutts, J.,Pein, W., Cox, C., UNC HSRC,
FHWA-RD-95-163, 1996.
The nighttime association with fatal crashes is emphasized in a study of the effects of daylightsavings time (DST) (Ferguson et al., 1995). This study asserts that if DST were retained year-round,approximately 900 additional traffic deaths would be avoided (727 pedestrians and 174 motor vehicleoccupants, say the authors) because the DST clock setting results in more daylight at the end of the day,when fatal crashes are more likely, an advantage that is apparently not fully offset by the comparably lessdaylight during the morning hours.
B. DAY OF WEEK
Pedestrian crashes also vary by day of week. Available data indicate that pedestrian crashes areoverrepresented on Friday and Saturday and are underrepresented on Sunday. These trends may be relatedto such factors as: the amount of walking by day of week; less pedestrian interaction with rush-hourtraffic; and/or less late-night drinking and walking. A Wayne County, MI, study (Davis and Huelke, 1969)reported that 35 percent of the crashes there occurred on Friday and Saturday. This was especially true forchildren, with Friday being the highest crash day. Similar patterns were found for urban, suburban, and
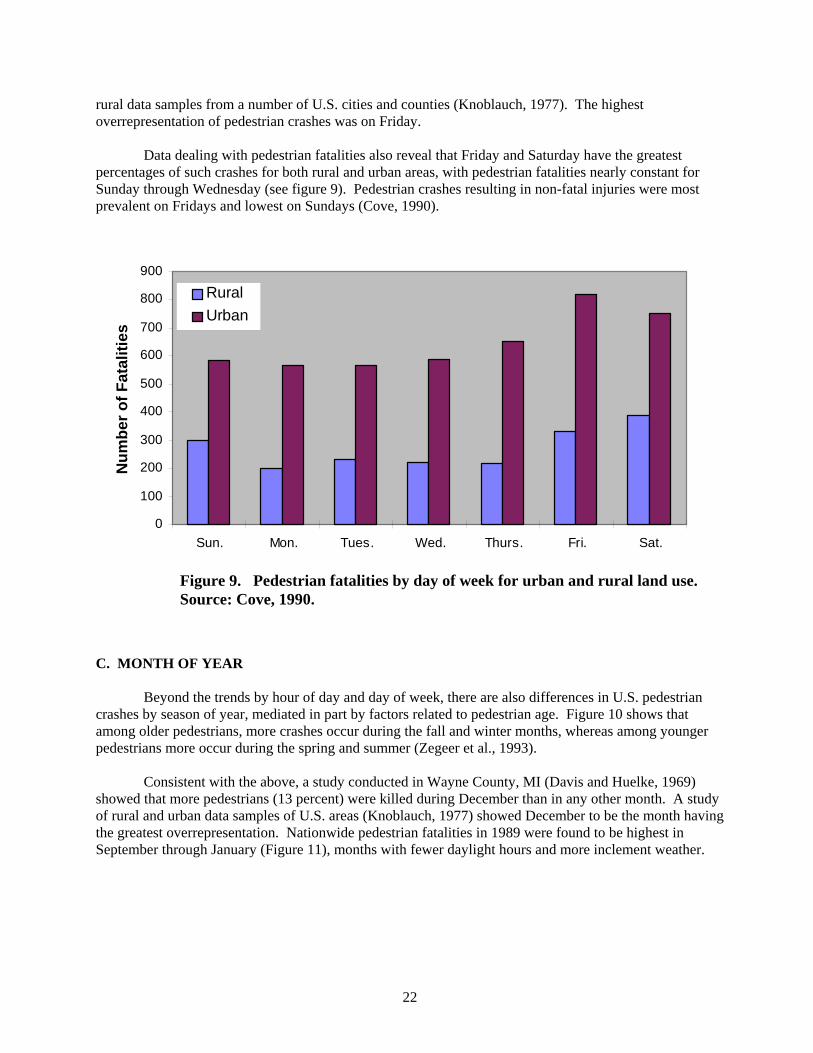
22
0
100
200
300
400
500
600
700
800
900
Sun. Mon. Tues. Wed. Thurs. Fri. Sat.
Num
ber o
f Fat
aliti
es
RuralUrban
Figure 9. Pedestrian fatalities by day of week for urban and rural land use.Source: Cove, 1990.
rural data samples from a number of U.S. cities and counties (Knoblauch, 1977). The highestoverrepresentation of pedestrian crashes was on Friday.
Data dealing with pedestrian fatalities also reveal that Friday and Saturday have the greatestpercentages of such crashes for both rural and urban areas, with pedestrian fatalities nearly constant forSunday through Wednesday (see figure 9). Pedestrian crashes resulting in non-fatal injuries were mostprevalent on Fridays and lowest on Sundays (Cove, 1990).
C. MONTH OF YEAR
Beyond the trends by hour of day and day of week, there are also differences in U.S. pedestriancrashes by season of year, mediated in part by factors related to pedestrian age. Figure 10 shows that among older pedestrians, more crashes occur during the fall and winter months, whereas among youngerpedestrians more occur during the spring and summer (Zegeer et al., 1993).
Consistent with the above, a study conducted in Wayne County, MI (Davis and Huelke, 1969)showed that more pedestrians (13 percent) were killed during December than in any other month. A studyof rural and urban data samples of U.S. areas (Knoblauch, 1977) showed December to be the month havingthe greatest overrepresentation. Nationwide pedestrian fatalities in 1989 were found to be highest inSeptember through January (Figure 11), months with fewer daylight hours and more inclement weather.

23
0
100
200
300
400
500
600
700
Jan Feb Mar April May June July Aug Sept Oct Nov Dec
Freq
uenc
y
Figure 11. Pedestrian fatalities by month. Source: Cove, 1990.
51.7
44.4
57.460.1 59.6
49.6
44.2
35.0
52.956.0 56.5
52.549.3 49.6
35.5
52.9
0
10
20
30
40
50
60
70
0-4 5-9 10-14 15-24 25-44 45-64 65-74 75+
Age
Perc
ent
NC 1980-1990 CrashesFARS 1980-1989 Crashes
Figure 10. Pedestrian crashes by age and occurring in fall or winter months. (September—February).Source: Zegeer et al., 1993.

24
D. SUMMARY: WHEN DO PEDESTRIAN COLLISIONS OCCUR?
1. Fatal pedestrian crashes tend to occur during nighttime hours.
2. Non-fatal pedestrian crashes tend to occur during daytime hours.
3. Pedestrian crashes are more frequent on Friday and Saturday and less frequent on Sunday.
4. Child-pedestrian crashes occur more often during summer.
5. Adult pedestrian crashes occur more often in the winter.
6. Type of pedestrian crashes also varies with time of day, day of week, and season.
Who Is Involved in Pedestrian Crashes?
A. AGE
Table 8 shows that the largest percentage of pedestrian deaths is seen for the two age groups thatspan the 25-44 year age range. A total of 31.8 percent (15.4 percent + 16.4 percent) of pedestrian fatalitiesoccur in this age range, a greater percentage than for the 5 preceding age groups combined. (Note thevarying age intervals used in this table prepared by NHTSA [Traffic Accident Facts, 1995.] The 25-34 agecategory spans 10 years while the next lower category (21-24) only covers 4 years. Thus, the 15.4 percentof fatalities that falls in the 25-34 year category is not as much greater as might appear when comparedwith the next younger category, since the latter includes data from less than half as many years. Note alsothat 13.9 percent of fatalities fall in the oldest category [greater than 75 years old]; however, theopen-ended age span of this category includes data from more years than the immediately precedingcategory. Overall, more than twice as many male pedestrians (3742) are killed as female (1727)pedestrians.
The final column shows fatalities expressed as deaths per 100,000 persons in a given age category. The oldest age category stands in greatest contrast to the rest.
The oldest age category does not contrast as sharply to the next younger age groups in terms ofinjury statistics (non-fatal). This may stem in part from the fact that older pedestrians are more likely tosuccumb to their injuries than younger adults. Children may be more likely to survive collisions on lowerspeed neighborhood streets. The difference in injuries between male and female pedestrians is less thanthat for fatalities. The ratio of male/female pedestrian injuries is 1.4 while the ratio of male/femalepedestrian deaths is 2.2.
For “all” pedestrian crashes (Hunter et al., 1996), the distribution by age is more similar to injury
crashes than to fatal crashes. Also, the ratio of male to female differs. In fatal crashes, there are moremales in every age category, but in “all” crashes, males make up fewer than half of the cases in several agecategories, including the 10-20 year age range and the categories that include persons 55 years old andolder. In this database, 61 percent of the pedestrians involved in a collision were males. In short, samplesof fatal pedestrian crashes are more likely to involve males and ages 25-54 compared to nonfatalpedestrian crashes.

25
Table 8. Pedestrian deaths, injuries, and total collisions by gender of victim.
Killed1
Male Female TotalM/F
Deaths/100,000 pop.N % N % N %
Age <5 5-9 10-15 16-20 21-24 25-34 35-44 45-54 55-64 65-74 75+
148196179188221637670439305288427
3.95.24.85.05.9
17.017.911.7
8.27.7
11.4
8696
1018261
207227172152200334
5.05.65.84.73.5
12.013.110.0
8.811.619.3
234292280270282844897611457488761
4.35.35.14.95.2
15.416.411.2
8.48.9
13.9
1.72.01.82.33.63.13.02.62.01.41.3
1.21.61.21.51.92.02.22.02.22.65.3
Unknown 44 9 56 Total 3742 1727 5472 2.2
Injured1
Age <55-9
10-1516-2021-2425-3435-4445-5455-6465-74
75+
22297523800750302357745673074355376413742121
4.314.615.5
9.84.6
14.514.2
8.57.32.74.1
18104629663750383778373348183024126617191636
4.812.217.413.2
9.99.8
12.67.93.34.54.3
4039121521464210068
61351118812124
7379503030933757
4.513.616.311.2
6.812.513.5
8.25.63.54.2
1.21.61.21.00.62.01.51.43.00.81.3
Total 51520 38088 89608 1.4Total Collisions2
Age <55-9
10-1516-2021-2425-3435-4445-5455-6465-74
75+
173390341265213556346189140109120
6.113.712.0
9.37.5
19.612.2
6.64.93.84.2
96207292202124286193104
9583
115
5.311.516.211.2
6.915.910.7
5.85.34.66.4
269597633467337842539293235192235
5.812.913.610.1
7.318.211.6
6.35.14.15.1
1.21.20.74
0.83 1.11.21.11.10.920.830.66
Total 2842 1797 4639 1.6
1Source: Traffic Safety Facts 1994: Motor Vehicle Crash Data from FARS and GES National Highway Traffic Safety Administration, US DOT, Washington, D.C., 1995.2Source: Pedestrian and Bicycle Crash Types of the Early 1990s, Hunter, W., J. Stutts, W. Pein, C. Cox, UNC HSRC, FHWA-RD-95-163, 1996.
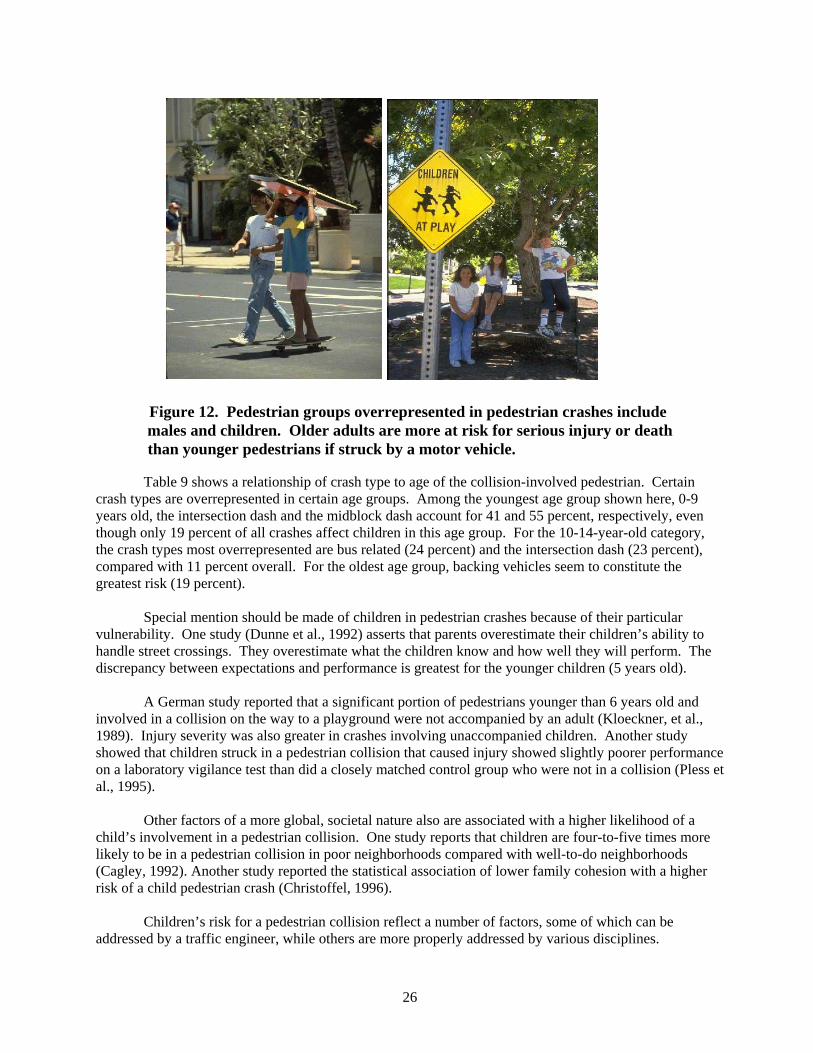
26
Figure 12. Pedestrian groups overrepresented in pedestrian crashes include males and children. Older adults are more at risk for serious injury or death than younger pedestrians if struck by a motor vehicle.
Table 9 shows a relationship of crash type to age of the collision-involved pedestrian. Certaincrash types are overrepresented in certain age groups. Among the youngest age group shown here, 0-9years old, the intersection dash and the midblock dash account for 41 and 55 percent, respectively, eventhough only 19 percent of all crashes affect children in this age group. For the 10-14-year-old category,the crash types most overrepresented are bus related (24 percent) and the intersection dash (23 percent),compared with 11 percent overall. For the oldest age group, backing vehicles seem to constitute thegreatest risk (19 percent).
Special mention should be made of children in pedestrian crashes because of their particularvulnerability. One study (Dunne et al., 1992) asserts that parents overestimate their children’s ability tohandle street crossings. They overestimate what the children know and how well they will perform. Thediscrepancy between expectations and performance is greatest for the younger children (5 years old).
A German study reported that a significant portion of pedestrians younger than 6 years old and involved in a collision on the way to a playground were not accompanied by an adult (Kloeckner, et al.,1989). Injury severity was also greater in crashes involving unaccompanied children. Another studyshowed that children struck in a pedestrian collision that caused injury showed slightly poorer performanceon a laboratory vigilance test than did a closely matched control group who were not in a collision (Pless etal., 1995).
Other factors of a more global, societal nature also are associated with a higher likelihood of achild’s involvement in a pedestrian collision. One study reports that children are four-to-five times morelikely to be in a pedestrian collision in poor neighborhoods compared with well-to-do neighborhoods(Cagley, 1992). Another study reported the statistical association of lower family cohesion with a higherrisk of a child pedestrian crash (Christoffel, 1996).
Children’s risk for a pedestrian collision reflect a number of factors, some of which can beaddressed by a traffic engineer, while others are more properly addressed by various disciplines.
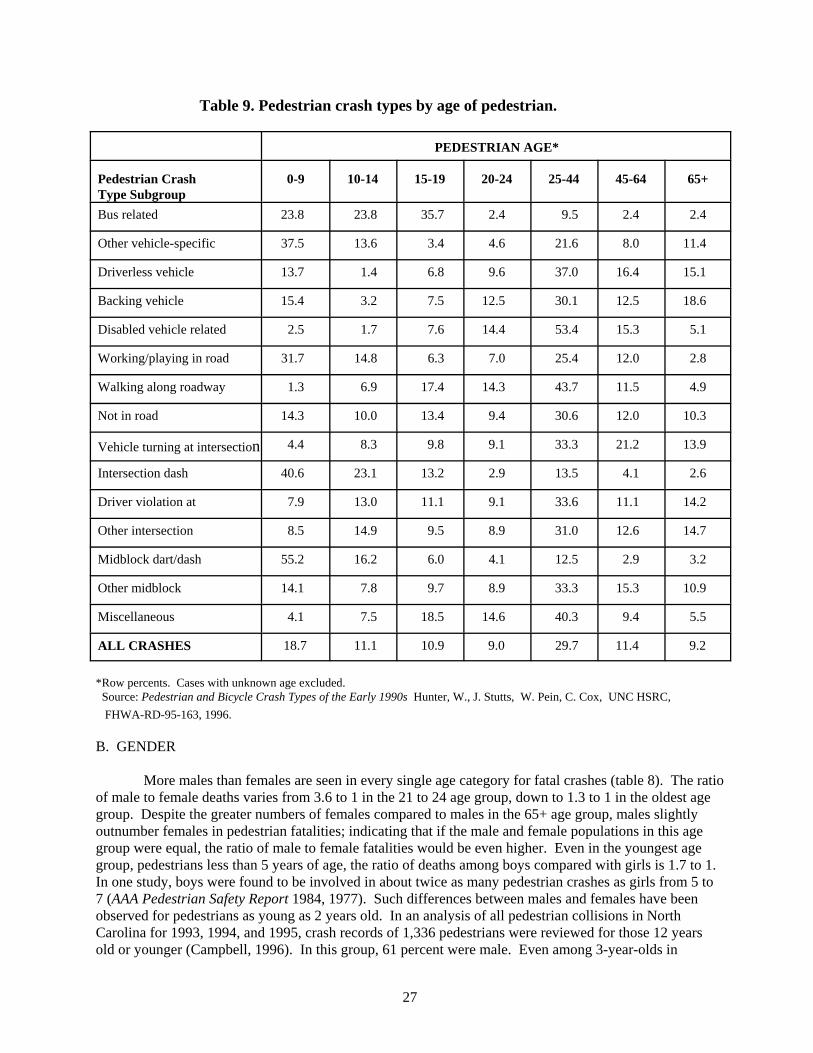
27
Table 9. Pedestrian crash types by age of pedestrian.
PEDESTRIAN AGE*
Pedestrian Crash Type Subgroup
0-9 10-14 15-19 20-24 25-44 45-64 65+
Bus related 23.8 23.8 35.7 2.4 9.5 2.4 2.4
Other vehicle-specific 37.5 13.6 3.4 4.6 21.6 8.0 11.4
Driverless vehicle 13.7 1.4 6.8 9.6 37.0 16.4 15.1
Backing vehicle 15.4 3.2 7.5 12.5 30.1 12.5 18.6
Disabled vehicle related 2.5 1.7 7.6 14.4 53.4 15.3 5.1
Working/playing in road 31.7 14.8 6.3 7.0 25.4 12.0 2.8
Walking along roadway 1.3 6.9 17.4 14.3 43.7 11.5 4.9
Not in road 14.3 10.0 13.4 9.4 30.6 12.0 10.3
Vehicle turning at intersection 4.4 8.3 9.8 9.1 33.3 21.2 13.9
Intersection dash 40.6 23.1 13.2 2.9 13.5 4.1 2.6
Driver violation at 7.9 13.0 11.1 9.1 33.6 11.1 14.2
Other intersection 8.5 14.9 9.5 8.9 31.0 12.6 14.7
Midblock dart/dash 55.2 16.2 6.0 4.1 12.5 2.9 3.2
Other midblock 14.1 7.8 9.7 8.9 33.3 15.3 10.9
Miscellaneous 4.1 7.5 18.5 14.6 40.3 9.4 5.5
ALL CRASHES 18.7 11.1 10.9 9.0 29.7 11.4 9.2
*Row percents. Cases with unknown age excluded. Source: Pedestrian and Bicycle Crash Types of the Early 1990s Hunter, W., J. Stutts, W. Pein, C. Cox, UNC HSRC, FHWA-RD-95-163, 1996.
B. GENDER
More males than females are seen in every single age category for fatal crashes (table 8). The ratioof male to female deaths varies from 3.6 to 1 in the 21 to 24 age group, down to 1.3 to 1 in the oldest agegroup. Despite the greater numbers of females compared to males in the 65+ age group, males slightlyoutnumber females in pedestrian fatalities; indicating that if the male and female populations in this agegroup were equal, the ratio of male to female fatalities would be even higher. Even in the youngest agegroup, pedestrians less than 5 years of age, the ratio of deaths among boys compared with girls is 1.7 to 1. In one study, boys were found to be involved in about twice as many pedestrian crashes as girls from 5 to7 (AAA Pedestrian Safety Report 1984, 1977). Such differences between males and females have beenobserved for pedestrians as young as 2 years old. In an analysis of all pedestrian collisions in NorthCarolina for 1993, 1994, and 1995, crash records of 1,336 pedestrians were reviewed for those 12 yearsold or younger (Campbell, 1996). In this group, 61 percent were male. Even among 3-year-olds in
28
pedestrian crashes, 62 percent were male; among 2-year-olds, 66 percent were males. Only for the 2-year-old and younger category (54 percent male) did the proportion approach the baseline proportion of malesseen in birth statistics. This indicates the possibility of fundamental differences between the behavior ofyoung boys and girls, and/or in the way they are supervised, even as toddlers.
The trends for pedestrian crashes by gender are somewhat different when looking at non-fatalinjuries (table 8). The heavy preponderance of males is not seen in each and every category. Also, the 5-to-9 and 10-to-15 age categories account for a larger proportion of total injuries than any other agecategories, contrary to the trends seen when only fatalities are considered. For the sample of all crashes,female involvement is relatively greater. Males are overrepresented, and the degree of overrepresentationis greater in fatal crashes than in non-fatal crashes.
C. ALCOHOL
Studies have reported that alcohol impairment is a major problem for pedestrians and drivers. Most states have a statutory definition of driver impairment of 0.08 or 0.10 blood-alcohol concentration(BAC). While it is illegal to drive a motor vehicle with BACs of 0.10, there is no such prohibition forwalking.
One study reported that from 1980 and 1989, between 37 and 44 percent of fatally injuredpedestrians had BACs of 0.10 percent or greater (Alcohol Fatality Facts, 1990). These percentages wereslightly lower than for fatalities involving passengers, vehicle operators, and motorcycle operators. Among adults pedestrians killed in 1989 nighttime collisions with motor vehicles, 59 percent had BACs of0.10 percent or greater, while only 31 percent had no alcohol in their blood.
One Phoenix study showed that 29 percent of all pedestrians involved in collisions had beendrinking, while only 4.4 percent of the drivers had been drinking before the collision (another 13 percentof these drivers had an “unknown” physical condition, likely due to “Hit and Run” [Cynecki, 1998]. Considering that many pedestrians are younger than legal drinking age, but most of the drivers are of legaldrinking age, this difference is substantial.
The percentage of fatally injured pedestrians with high BACs (0.10 percent or more) did notdecline during the 1980s. This contrasts a 20-percent decrease in high BACs for drivers during that period(Alcohol Fatality Facts, 1990; Williams and Lund, 1990).
A study of motor vehicle fatalities in North Carolina between 1972 and 1989 (figure 13) showedthat between 42 and 61 percent of pedestrian fatalities involved pedestrians under the influence of alcohol(i.e., BAC of 0.10 percent or greater). This compared with the range of 53 to 64 percent of drivers ofsingle-vehicle collisions who were under the influence. Among 176 fatally injured pedestrians tested in1989 (Rehabilitation Alcohol Test, 1990), the following distribution was reported:
Number Percentage of Pedestrian fatalities of cases total casesBACs of 0.10% or above 81 46BAC less than 0.10% but had been drinking 5 3No alcohol 90 51
-----------------------------Total 176 100

29
Figure 13. Studies have found that approxi-mately half of pedestrian fatalities in motorvehicle crashes involve pedestrians under theinfluence of alcohol.
22.0
36.4
32.1
15.4
3.21.9
30.9
5.5
27.8
34.9
14.8
0
5
10
15
20
25
30
35
40
0-4 5-9 10-14 15-24 25-44 45-64 65-74 75+
Age
Perc
ent
NC 1980-1990 CrashesFARS 1980-1989 Crashes
(negligible alcohol involvement)
Figure 14. Percent of crashes involving pedestrians drinking alcohol. Source: Zegeer et al., 1993.
Alcohol and age are associated in pedestrian crashes (Zegeer et al., 1993). The North Carolinadata shown in figure 14 are the distribution by age of pedestrians in all reported crashes involving use ofalcohol. The FARS data address alcohol use among fatally injured pedestrians, broken down by pedestrian age.

30
Alcohol is most often present for pedestrians 25-44 years old, with the proportion declining for olderpedestrian age categories. These findings indicate that part of the overall age distribution in pedestriancrashes is related to alcohol use, although the involvement of the elderly in fatal pedestrian crashes seemslikely to be attributable to factors other than alcohol.
As might be expected, pedestrian sobriety is also related to crash type (Hunter, et al., 1996). Asseen in Table 10, 15.4 percent of all pedestrians in a collision were reported to be using alcohol or drugsbefore the collision. For certain crash types, however, the proportion is higher. For the crash type ofwalking along the roadway, the alcohol percentage for pedestrians is nearly double (29.6 percent). Addingto the significance of that figure is the fact that for drivers, the “walking along the road” crash type islikewise more frequent for drivers using alcohol or drugs (Hunter, et al., 1996).
Table 10. Pedestrian crash types by pedestrian sobriety.
SOBRIETY*
PedestrianCrash TypeSubgroup
NoAlcoholor Drugs
Alcoholor
Drugs Other
Bus-related 97.1 2.9 0.0
Other vehicle-specific 87.2 5.1 7.7
Driverless vehicle 96.7 1.7 1.7
Backing vehicle 85.6 10.8 3.6
Disabled vehicle related 84.8 7.1 8.1
Working/playing in road 97.5 0.8 1.7
Walking along roadway 62.4 29.6 8.0
Not in road 85.0 10.6 4.4
Vehicle turning atintersection
91.1 5.3 3.6
Intersection dash 86.0 9.0 5.0
Driver violation atintersection
88.0 8.3 3.7
Other intersection 70.5 23.0 6.5
Midblock dart/dash 89.4 7.8 2.8
Other midblock 61.9 30.6 7.5
Miscellaneous 71.3 22.0 6.7
ALL CRASHES 79.4 15.4 5.2
*Cases with unknown sobriety excluded. Source: Pedestrian and Bicycle Crash Types of the Early 1990s, Hunter,
W., J. Stutts, W. Pein, C. Cox, UNC HSRC, FHWA-RD-95-163, 1996.
31
A 1992 study by Dickman and Cope (1992) reported on 4,329 injured pedestrians, of whom 2,109(49 percent) had been drinking. The blood alcohol levels were:
BAC level Number Percent of total
0 2,220 51.20.01 - 0.099% 586 13.60.10 - 0.199% 486 11.20.20 - 0.299 686 15.90.30 or higher 351 8.1
A substantial proportion of those who had been drinking had seriously elevated BACs. Not only isalcohol use by pedestrians a significant factor associated with involvement in a crash, but it is alsoreported that excessive amounts of alcohol significantly increased the likelihood that death will result fromthe collision (Miles-Doan, 1996).
D. VEHICLE TYPE
Another factor related to the “who” of pedestrian crashes is vehicle type. In a NHTSA report (Traffic Safety Facts, 1995, table 93), pedestrian collision percentages with regard to vehicle type are:
Pedestrians PedestriansVehicle Type Killed Injured
Passenger car 55.8% 76.5%Light truck 29.2% 20.0%Other (including motor- 15.0% 3.5%cycles & heavy trucks) ___________________
100% 100%
Light trucks as well as the “other” vehicle classes are more often represented in fatal pedestriancrashes than in injury crashes.
E. SUMMARY: WHO IS INVOLVED IN PEDESTRIAN COLLISIONS?
1. The largest percentage of pedestrian fatalities falls into the 25-44 age category.
2. However, when fatalities per 100,000 population is calculated, the oldest age category standsout higher than the rest.
3. Nevertheless, compared with their proportion in the U.S. population, children and young adultsages 2-22 are overrepresented in terms of pedestrian deaths and injuries.
4. More male than female fatalities are seen in every age category.
5. Even in the youngest age group, pedestrians less than 5 years of age, the population pedestriandeath rate for males is 1.7 times greater than females, and males outnumber females inpedestrian collisions at the age of 2.
6. Alcohol is an important factor in pedestrian crashes. A North Carolina study showed thatbetween 42 and 61 percent of fatally-injured pedestrians had BAC levels of 0.10 or greater.

32
Figure 15. Rural areas account for 23.1 percent ofnon-fatal injury pedestrian crashes, but 45.2 percentof pedestrian deaths.
There is some indication that pedestrians who have been drinking pose a greater threat topedestrian safety than do drinking drivers.
7. Light trucks and “other” vehicles (e.g., heavy trucks) are overrepresented in pedestrianfatalities.
Where Do Pedestrian Collisions Occur?
A. RURAL VERSUS URBAN
The rural/urban distribution of pedestrian crashes is given in table 11, based on estimates by theNSC (Accident Facts, 1994). Of the estimated 71,200 pedestrian collisions in the United States in 1993,75 percent occurred in urban areas, where pedestrian traffic is much higher than in rural areas. The table
Table 11. Pedestrian injuries and fatalities by area type.
AreaType
Non-fatal Injury Fatal Totals
NumberPercent (Raw %) Number
Percent (Raw %) Number
Percent (Raw %)
Rural Urban
15,00050,000
23.1 76.9
2,8003,400
45.2 54.8
17,80053,400
25.0 75.0
Totals 65,000 100.0 6,200 100.0 71,200 100.0
Source: Crash Facts, 1994
also shows that rural areas account for only 23.1 percent of nonfatal injury pedestrian crashes, but 45.2percent of fatal pedestrian crashes. The overrepresentation of fatalities in rural areas is most likely becauseof the higher speeds and more severe crash types in rural areas.

33
B. LAND USE
Several studies that categorized pedestrian crashes by land use are summarized below:
Thirteen major cities (Snyder and Knoblauch, 1971)Sample - 2,100 pedestrian crashes
Place Percent of Crashes
Central business district 1Residential area 50Mixed commercial 7Commercial area 40School area 2
Wayne County, MI (Davis and Huelke, 1969)Sample - 268 Fatal pedestrian crashes
Shopping business area 58Residential area 29School area 2Expressway area 2Other 9
Rural and suburban area sample (Knoblauch, 1977)
Residential area 50Commercial area 24Open area 16School area 7Other 3
Tucson, AZ (Nizlek, 1984)
Business area 60Residential area 37School crossing 1Other 2
The four studies vary in definition of categories and outcome, but they are similar in theprominence of pedestrian crashes in residential and commercial areas where most pedestrian exposureoccurs.
C. TRAFFIC CONTROL BY CRASH TYPE
Another way of describing pedestrian crashes is by the nature of any traffic control present at thepedestrian crash site. Table 12 is based on the aforementioned 1992 sample of 4,329 pedestrian crashes ofall kinds (Diekman and Cope, 1992), and the following overall distribution is seen with respect to trafficcontrols:

34
Traffic Control Type Percent of Pedestrian Collisions
No traffic control 74.4Stop sign 7.0Traffic signal 17.3Other 1.4
---------------100
Specific types of crashes markedly depart from the above distribution. Thus, whereas 74 percentof pedestrian crashes happen where there is no traffic control, the value is 96 percent for crashes involvingwalking along the roadway. On the other hand, only 15.5 percent of pedestrian crashes that involveturning at an intersection occur where there is no traffic control (as compared with 74 percent overall). Overall, 7 percent of pedestrian crashes occur where a stop sign is the traffic control, but for vehiclesturning at an intersection, the value is higher at 20 percent. As a final example, 17.3 percent of allpedestrian crashes occur at signalized locations, but the value is 63 percent for crashes involving vehiclesturning at an intersection. Thus, a strong association with crash type accompanies the overall distributionof pedestrian crashes with respect to traffic control types.
Table 12. Pedestrian crash types by traffic control.
TRAFFIC CONTROL*Pedestriancrash type
Nocontrol
Stopsign
Trafficsignal
Other trafficcontrol**
Bus-related 79.1 11.6 9.3 0.0Other vehicle specific 90.6 4.7 4.7 0.0Driverless vehicle 97.6 1.2 1.2 0.0Backing vehicle 96.1 1.1 2.2 0.7Disabled vehicle related 87.3 2.5 7.6 2.5Working/playing in road 77.9 8.6 5.0 8.6Walking along roadway 96.1 2.1 1.3 0.5Not in road 94.3 3.1 0.9 1.7Vehicle turning at intersection 15.5 20.0 63.3 1.2Intersection dash 66.0 9.8 24.0 0.3Driver violation at intersection 38.8 24.7 34.1 2.4Other intersection 47.5 9.6 42.2 0.6Midblock dart/dash 94.4 1.9 2.9 0.8Other midblock 91.1 1.0 6.6 1.4Miscellaneous 85.0 5.3 7.2 2.5ALL CRASHES 74.4 7.0 17.3 1.4
*Cases with unknown traffic control excluded. **Flashing signal, yield sign, railroad crossing, official flagger. Source: Pedestrian and Bicycle Crash Types of the Early 1990s, Hunter, W., J. Stutts, W. Pein, C. Cox, UNC HSRC, FHWA-RD-95-163, 1996.

35
SPEED LIMIT BY CRASH TYPE
Table 13 shows pedestrian crashes according to the speed limit posted where the collision tookplace. The posted speed limit is certainly not a perfect indication of the actual speed at which a collisionmay occur. The overall distribution is: Percent
Speed Limit Pedestrian CrashesSpeed limit to 40 km/h 27.048-56 km/h 46.964-73 km/h 14.381 km/h or greater 118.0
100
Table 13. Pedestrian crash types by speed limit.
SPEED LIMIT*PedestrianCrash Type
< 40km/h
48 to 56km/h
64 to 73km/h
81+km/h
Bus related 23.7 68.4 5.3 2.6
Other vehicle specific 44.9 38.5 6.4 10.3
Driverless vehicle* 45.7 30.4 0.0 23.9
Backing vehicle** 50.0 38.7 2.8 8.5
Disabled vehicle related 4.7 24.3 16.8 54.2
Working/playing in road 39.2 36.8 8.0 16.0
Walking along roadway 14.3 32.7 16.2 36.8
Vehicle turning at intersection 20.8 65.8 11.9 1.6
Intersection dash 24.0 54.8 17.4 3.7
Driver violation at intersection 32.1 56.7 10.3 0.9
Other intersection 18.0 56.4 20.4 5.2
Midblock dart/dash 34.7 41.8 14.7 8.8
Other midblock 21.7 47.4 19.2 11.8
Miscellaneous 30.1 40.6 12.0 17.4
ALL CRASHES 27.0 46.9 14.3 11.8 *Cases with unknown speed limit excluded. Source: Pedestrian and Bicycle Crash Types of the Early 1990s Hunter, W., J. Stutts. W. Pein, C. Cox,
UNC HSRC, FHWA-RD-95-163, 1996.
Some specific crash types markedly differ from this breakdown. Pedestrian crashes involving abacking vehicle are higher on roads with low speed limits than overall (50 percent versus 27 percent). Incontrast, for pedestrian crashes involving walking in the roadway, sites with higher speed limits accountfor more than expected (37 percent versus 12 percent), with a correspondingly smaller proportion at thelower speed limit sites (14 percent versus 27 percent).

36
6,000
20,000
9,000
7,0006,000
21,000
10,000
4,000
6,0005,000
3,000
7,000 7,000
4,000
0
5,000
10,000
15,000
20,000
25,000
0-9 10-14 15-19 20-24 25-44 45-64 65+
Age group
Num
ber o
f inj
ured
or k
illed
IntersectionNon-Intersection
Figure 16. Pedestrian crashes (fatal and nonfatal) by age and intersection vs. nonintersection.
Source: General Estimates System, NHTSA, 1990.
E. INTERSECTION VERSUS NON-INTERSECTION
Almost 60 percent of U.S. urban pedestrian crashes occur at places other than intersections. Inrural areas, the figure is closer to 67 percent. When considering fatalities, the proportion remainsessentially the same in urban areas. In rural areas, approximately 85 percent of the deaths occur at placesother than intersections (Accident Facts, 1988).
A 1977 survey of child pedestrian crashes in more than 1,900 cities indicated that approximately75 percent occurred at non-intersection locations. This increases to between 80 and 90 percent for the5-year-old-and-under age group (AAA Pedestrian Safety Report, 1984). This high percentage is likelyassociated in part with the high incidence of young children running into the street at midblock locations.
A 1989 summary of pedestrian injuries and deaths by age was estimated by NHTSA forintersections and nonintersections. As illustrated in figure 16, a majority of crashes involving pedestriansup to age 44 occurs at nonintersections. For ages 45-64, there almost is an equal number of pedestrian
crashes at intersections and nonintersections. For pedestrians age 65 and older, the trend reverses, andmore are struck at intersections than at nonintersections. Although only limited pedestrian behavioral andsurvey data are available concerning choice of crossing locations, older pedestrians generally are morelikely to cross at intersections than are younger ones (General Estimates System, 1990).
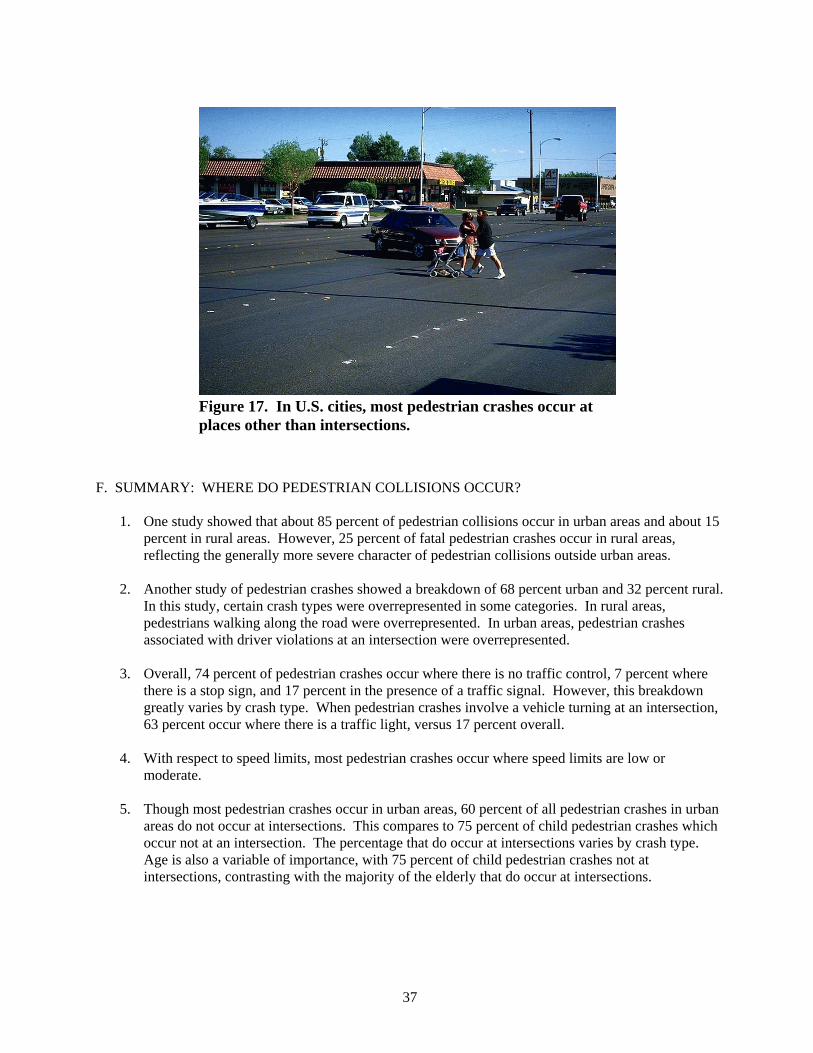
37
Figure 17. In U.S. cities, most pedestrian crashes occur atplaces other than intersections.
F. SUMMARY: WHERE DO PEDESTRIAN COLLISIONS OCCUR?
1. One study showed that about 85 percent of pedestrian collisions occur in urban areas and about 15percent in rural areas. However, 25 percent of fatal pedestrian crashes occur in rural areas,reflecting the generally more severe character of pedestrian collisions outside urban areas.
2. Another study of pedestrian crashes showed a breakdown of 68 percent urban and 32 percent rural. In this study, certain crash types were overrepresented in some categories. In rural areas,pedestrians walking along the road were overrepresented. In urban areas, pedestrian crashesassociated with driver violations at an intersection were overrepresented.
3. Overall, 74 percent of pedestrian crashes occur where there is no traffic control, 7 percent wherethere is a stop sign, and 17 percent in the presence of a traffic signal. However, this breakdowngreatly varies by crash type. When pedestrian crashes involve a vehicle turning at an intersection,63 percent occur where there is a traffic light, versus 17 percent overall.
4. With respect to speed limits, most pedestrian crashes occur where speed limits are low ormoderate.
5. Though most pedestrian crashes occur in urban areas, 60 percent of all pedestrian crashes in urbanareas do not occur at intersections. This compares to 75 percent of child pedestrian crashes whichoccur not at an intersection. The percentage that do occur at intersections varies by crash type. Age is also a variable of importance, with 75 percent of child pedestrian crashes not atintersections, contrasting with the majority of the elderly that do occur at intersections.
38
How Do Pedestrian Collisions Occur?
A. CONTRIBUTING FACTORS
A considerable number of factors, singly or in combination, increase the likelihood of a pedestriancollision. Table 14 shows the breakdown of a series of contributing factors related to 5,073 pedestriansinvolved in crashes (Hunter, et al., 1996). These are shown in four groups:
Pedestrian contributing factorsRoadway/environment factorsDriver contributing factorsVehicle factors.
It is noteworthy that for each of the four major data groupings, the largest single category is “Noneindicated.” Thus, despite numerous categories for assigning crashes, an appreciable portion of crashesdefy such categorization. (This is all the more noteworthy because a main purpose of Hunter’s study wasto categorize pedestrian crashes.)
With respect to “Pedestrian Factors”, the largest single category is “ran into road.” Yet thiscategory accounts for only 15 percent of collisions. Many other contributing factors are cited, but each isidentified in only a small percent of cases. The largest specific “Roadway Factor” is "vision obstruction"(11 percent). For drivers, the largest category is "failure to yield right-of-way."
"Hit and run" is a somewhat larger category in the driver group, but such a classification tellsnothing about the driver’s actions that contributed to the crash, only that unlawful flight took placeafterwards. Some characteristics of the hit-and-run situation are presented for fatal crashes in a 1995 study(Solnick and Hemenway, 1995). The authors examined the FARS database for 1989-1991 and listedfactors that were over- or underrepresented in fatal hit-and-run situations. Overall, 20 percent of driversleft the scene:
Hit and run was less likely when: victim was a child or was elderly
Hit and run was more likely when: crash was in an urban area crash was outside of southern U.S.crash was at night or on a weekenddriver was maledriver was drunkdriver had a bad past driving record
Vehicle factors are cited in only 12 percent of the cases. Because numerous factors can contributeto pedestrian collisions, and because each individual factor accounts for only a small portion of the crashtotal, a successful pedestrian collision prevention program must pursue many different countermeasures. Only a small portion of total collisions will be reduced by any given countermeasure.
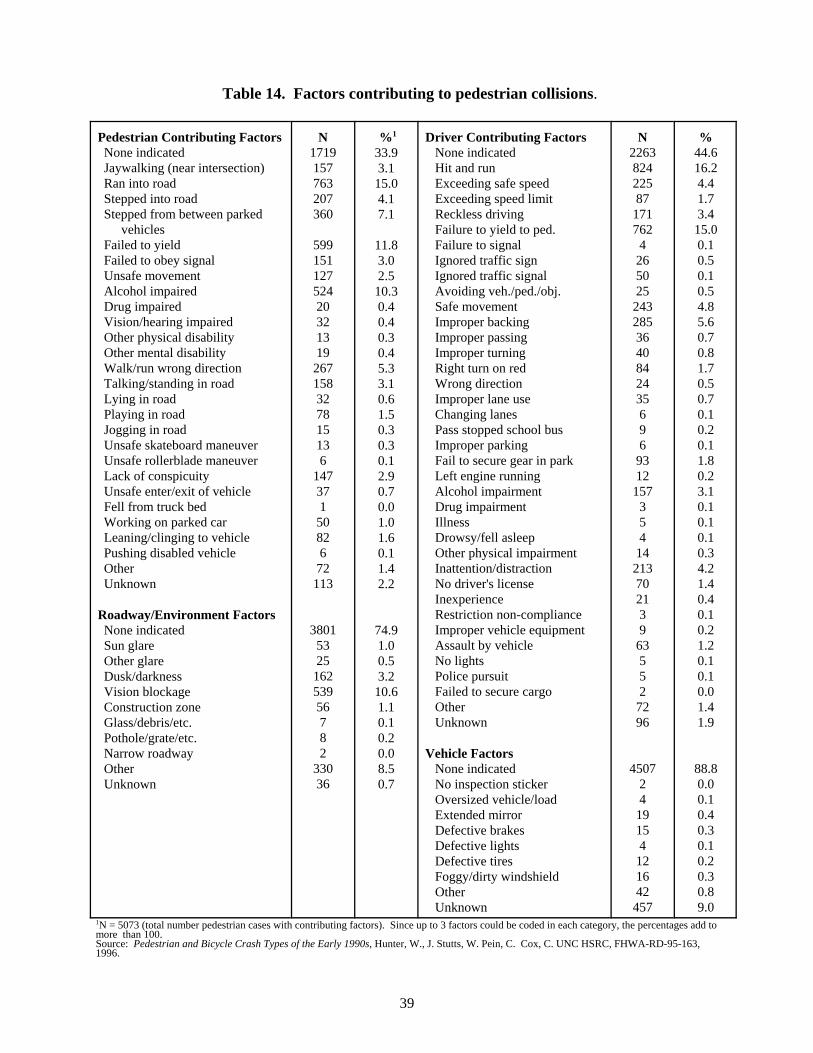
39
Table 14. Factors contributing to pedestrian collisions.
Pedestrian Contributing FactorsNone indicatedJaywalking (near intersection)Ran into roadStepped into roadStepped from between parked
vehiclesFailed to yieldFailed to obey signalUnsafe movementAlcohol impairedDrug impairedVision/hearing impairedOther physical disabilityOther mental disabilityWalk/run wrong directionTalking/standing in roadLying in roadPlaying in roadJogging in roadUnsafe skateboard maneuverUnsafe rollerblade maneuverLack of conspicuityUnsafe enter/exit of vehicleFell from truck bedWorking on parked carLeaning/clinging to vehiclePushing disabled vehicleOtherUnknown
Roadway/Environment FactorsNone indicatedSun glareOther glareDusk/darknessVision blockageConstruction zoneGlass/debris/etc.Pothole/grate/etc.Narrow roadwayOtherUnknown
N1719157763207360
59915112752420321319267158327815136
147371
50826
72113
3801532516253956782
33036
%1
33.93.115.04.17.1
11.83.02.510.30.40.40.30.45.33.10.61.50.30.30.12.90.70.01.01.60.11.42.2
74.91.00.53.210.61.10.10.20.08.50.7
Driver Contributing FactorsNone indicatedHit and runExceeding safe speedExceeding speed limitReckless drivingFailure to yield to ped.Failure to signalIgnored traffic signIgnored traffic signalAvoiding veh./ped./obj.Safe movementImproper backingImproper passingImproper turningRight turn on redWrong directionImproper lane useChanging lanesPass stopped school busImproper parkingFail to secure gear in parkLeft engine runningAlcohol impairmentDrug impairmentIllnessDrowsy/fell asleepOther physical impairmentInattention/distractionNo driver's licenseInexperienceRestriction non-complianceImproper vehicle equipmentAssault by vehicleNo lightsPolice pursuitFailed to secure cargoOtherUnknown
Vehicle FactorsNone indicatedNo inspection stickerOversized vehicle/loadExtended mirrorDefective brakesDefective lightsDefective tiresFoggy/dirty windshieldOtherUnknown
N226382422587171762
42650252432853640842435696
9312157
354
14213702139
63552
7296
450724
19154
121642457
%44.616.24.41.73.415.00.10.50.10.54.85.60.70.81.70.50.70.10.20.11.80.23.10.10.10.10.34.21.40.40.10.21.20.10.10.01.41.9
88.80.00.10.40.30.10.20.30.89.0
1N = 5073 (total number pedestrian cases with contributing factors). Since up to 3 factors could be coded in each category, the percentages add tomore than 100. Source: Pedestrian and Bicycle Crash Types of the Early 1990s, Hunter, W., J. Stutts, W. Pein, C. Cox, C. UNC HSRC, FHWA-RD-95-163,1996.
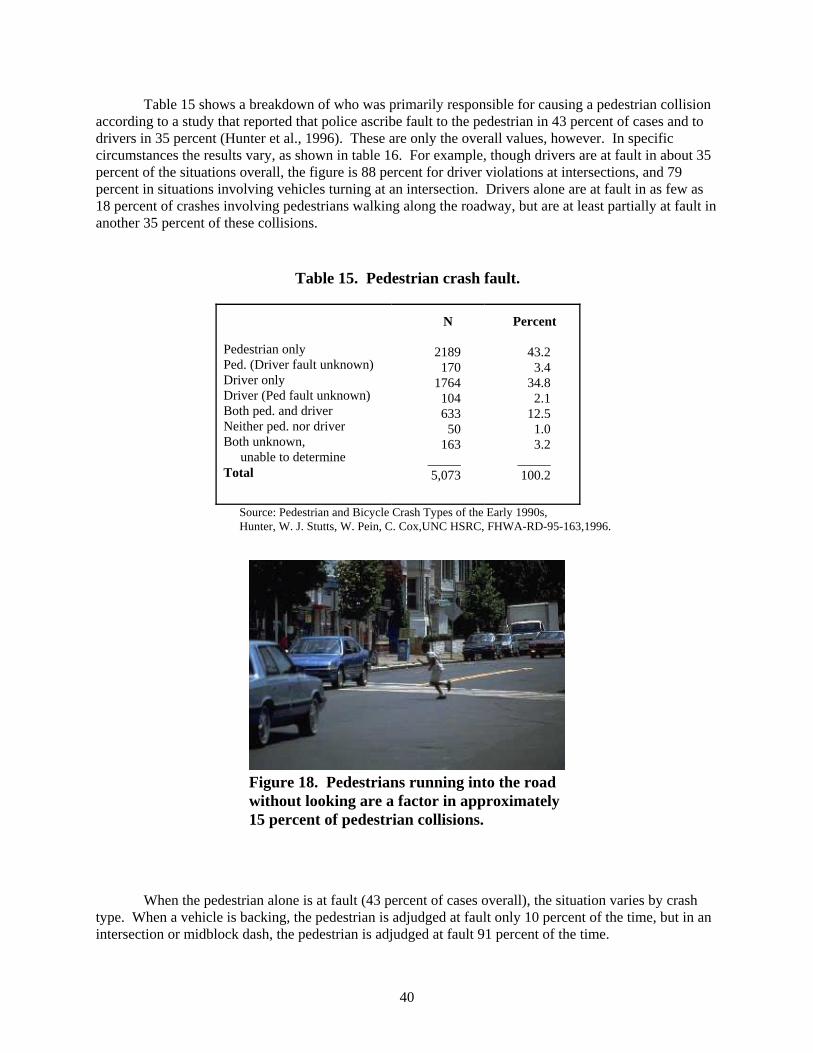
40
Figure 18. Pedestrians running into the roadwithout looking are a factor in approximately15 percent of pedestrian collisions.
Table 15 shows a breakdown of who was primarily responsible for causing a pedestrian collisionaccording to a study that reported that police ascribe fault to the pedestrian in 43 percent of cases and todrivers in 35 percent (Hunter et al., 1996). These are only the overall values, however. In specificcircumstances the results vary, as shown in table 16. For example, though drivers are at fault in about 35percent of the situations overall, the figure is 88 percent for driver violations at intersections, and 79percent in situations involving vehicles turning at an intersection. Drivers alone are at fault in as few as18 percent of crashes involving pedestrians walking along the roadway, but are at least partially at fault inanother 35 percent of these collisions.
Table 15. Pedestrian crash fault.
Pedestrian onlyPed. (Driver fault unknown)Driver onlyDriver (Ped fault unknown)Both ped. and driverNeither ped. nor driverBoth unknown,
unable to determineTotal
N
2189170
1764104633
50163
_____5,073
Percent
43.23.4
34.82.1
12.5 1.0 3.2
_____100.2
Source: Pedestrian and Bicycle Crash Types of the Early 1990s, Hunter, W. J. Stutts, W. Pein, C. Cox,UNC HSRC, FHWA-RD-95-163,1996.
When the pedestrian alone is at fault (43 percent of cases overall), the situation varies by crashtype. When a vehicle is backing, the pedestrian is adjudged at fault only 10 percent of the time, but in anintersection or midblock dash, the pedestrian is adjudged at fault 91 percent of the time.
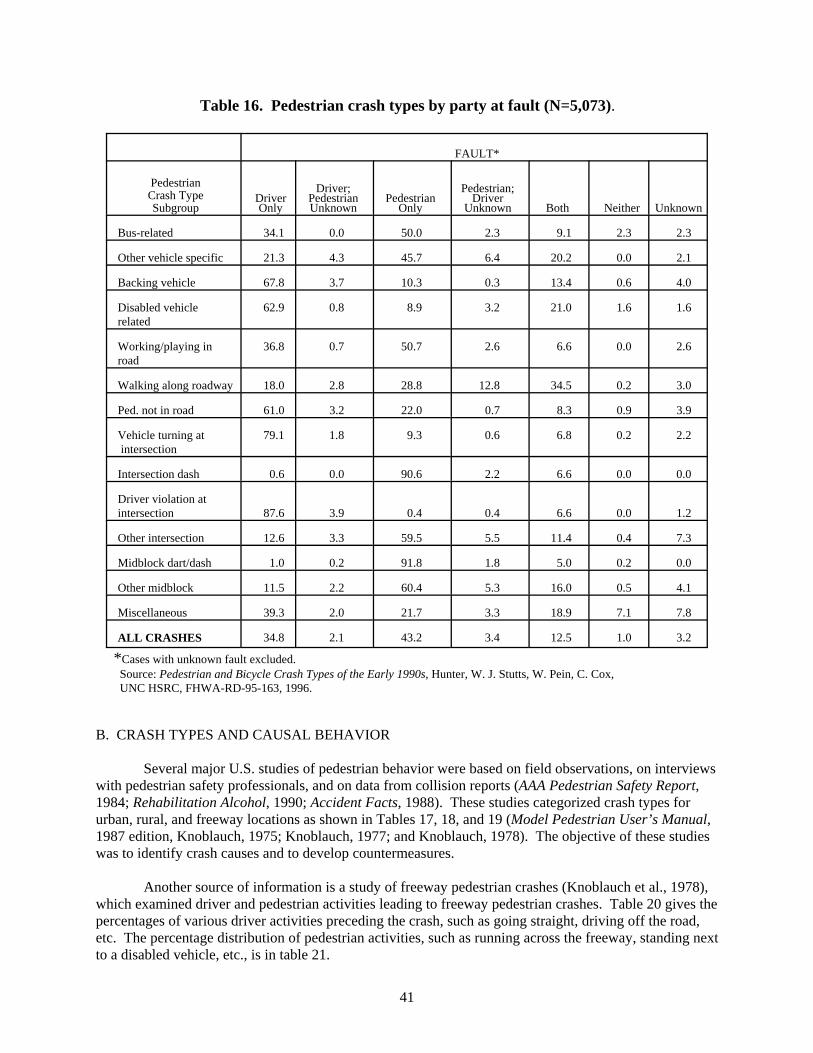
41
Table 16. Pedestrian crash types by party at fault (N=5,073).
FAULT*
PedestrianCrash TypeSubgroup
DriverOnly
Driver;PedestrianUnknown
PedestrianOnly
Pedestrian;Driver
Unknown Both Neither Unknown
Bus-related 34.1 0.0 50.0 2.3 9.1 2.3 2.3
Other vehicle specific 21.3 4.3 45.7 6.4 20.2 0.0 2.1
Backing vehicle 67.8 3.7 10.3 0.3 13.4 0.6 4.0
Disabled vehiclerelated
62.9 0.8 8.9 3.2 21.0 1.6 1.6
Working/playing inroad
36.8 0.7 50.7 2.6 6.6 0.0 2.6
Walking along roadway 18.0 2.8 28.8 12.8 34.5 0.2 3.0
Ped. not in road 61.0 3.2 22.0 0.7 8.3 0.9 3.9
Vehicle turning at intersection
79.1 1.8 9.3 0.6 6.8 0.2 2.2
Intersection dash 0.6 0.0 90.6 2.2 6.6 0.0 0.0
Driver violation atintersection 87.6 3.9 0.4 0.4 6.6 0.0 1.2
Other intersection 12.6 3.3 59.5 5.5 11.4 0.4 7.3
Midblock dart/dash 1.0 0.2 91.8 1.8 5.0 0.2 0.0
Other midblock 11.5 2.2 60.4 5.3 16.0 0.5 4.1
Miscellaneous 39.3 2.0 21.7 3.3 18.9 7.1 7.8
ALL CRASHES 34.8 2.1 43.2 3.4 12.5 1.0 3.2
*Cases with unknown fault excluded. Source: Pedestrian and Bicycle Crash Types of the Early 1990s, Hunter, W. J. Stutts, W. Pein, C. Cox, UNC HSRC, FHWA-RD-95-163, 1996.
B. CRASH TYPES AND CAUSAL BEHAVIOR
Several major U.S. studies of pedestrian behavior were based on field observations, on interviewswith pedestrian safety professionals, and on data from collision reports (AAA Pedestrian Safety Report,1984; Rehabilitation Alcohol, 1990; Accident Facts, 1988). These studies categorized crash types forurban, rural, and freeway locations as shown in Tables 17, 18, and 19 (Model Pedestrian User’s Manual,1987 edition, Knoblauch, 1975; Knoblauch, 1977; and Knoblauch, 1978). The objective of these studieswas to identify crash causes and to develop countermeasures.
Another source of information is a study of freeway pedestrian crashes (Knoblauch et al., 1978),which examined driver and pedestrian activities leading to freeway pedestrian crashes. Table 20 gives thepercentages of various driver activities preceding the crash, such as going straight, driving off the road,etc. The percentage distribution of pedestrian activities, such as running across the freeway, standing nextto a disabled vehicle, etc., is in table 21.

42
Table 17. Urban pedestrian collision types and critical behavior descriptors (N=2,044).
Collision Type
Percent ofCollisions
StudiedLocation and/or CriticalBehavioral Descriptors
Dart out (first half) 23 Midblock (not at intersection). Pedestrian sudden appearance and short time exposure.Driver has no time to react to avoid collision.Pedestrian crossed less than halfway.
Dart out (second half) 9 Same as above except pedestrian gets more thanhalfway across before being struck.
Midblock dash 7 Midblock (not at intersection). Pedestrian running but not sudden appearanceor short-term exposure as above.
Intersection dash 12 Intersection.Short time exposure or running.Same as “dart out” except occurs at intersection.
Vehicle turn merge with attention conflict
4 Intersection or vehicle merge location.Vehicle turning or merging into traffic.Driver attending to auto traffic in one directioncollides with pedestrian located in direction differentfrom driver’s attention.
Turning vehicle 5 Intersection or vehicle merge location.Vehicle turning or merging into traffic.Driver attention not documented.Pedestrian not running.
Multiple threat 3 One or more vehicles stop in traffic lane (e.g., lane 1)for pedestrian. Pedestrian hit stepping into parallel samedirection traffic lane (e.g., Lane 2) by vehicle moving insame direction as stopped vehicle.Collision vehicle driver’s vision of pedestrian obstructed by stopped vehicle.
Bus stop related 2 At bus stop.Pedestrian steps out from in front of bus at bus stop andis struck by vehicle moving in same direction as buswhile passing bus.Same as “multiple threat” except stopped vehicle isbus at bus stop.
Vendor, ice cream truck
2 Pedestrian struck while going to or from vendor invehicle on street.
Disabled vehicle related
2 Pedestrian struck while working on or next to disabledvehicle.
Result of vehicle- vehicle crash
3 Pedestrian hit by vehicle(s) as result of vehicle-vehiclecollision
Trapped 1 Signalized intersection.Pedestrian hit when traffic light turned red (for pedestrian) and cross-traffic vehicles started moving.
Source: Knoblauch, 1975 and Model Pedestrian User’s Manual, 1987 edition.

43
Table 18. Rural pedestrian collision types and critical behavior descriptors (N=1,750).
Collision TypePercent ofCollisions
StudiedLocation and/or CriticalBehavioral Descriptors
Dart out (first half) 11 Pedestrian sudden appearance, short time exposure. Driver does not have time to react to avoid collision.Pedestrian crossed less than halfway.
Dart out (second half) 10 Same as above except pedestrian more than halfway across before being struck.
Midblock dash 10 Midblock (not at intersection). Pedestrian running but not sudden appearanceor short-term exposure as above.
Intersection dash 10 Intersection.Short time exposure or running.Same as “dart out” except occurs at intersection.
Vehicle turn merge with attention conflict
1 Intersection or vehicle merge location.Vehicle is turning or merging into traffic.Driver attending to auto traffic in one directioncollides with pedestrian located in different directionthan that of driver’s attention.
Turning vehicle 2 Intersection or vehicle merge location.Vehicle turning or merging into traffic.Driver attention not documented.Pedestrian not running.
Multiple threat 2 One or more vehicles stop in traffic lane (e.g., Lane 1)for pedestrian.Pedestrian hit stepping into next parallel same direction traffic lane (e.g., Lane 2) by vehicle going in samedirection as stopped vehicle.Collision vehicle driver’s vision of pedestrian obstructed by stopped vehicle.
School bus related 3 Pedestrian hit while going to or from school bus or school bus stop.
Vendor, ice cream truck 1 Pedestrian struck while going to or from vendor invehicle on street.
Disabled vehicle related 6 Pedestrian struck while working on or next to disabledvehicle.
Result of vehicle-vehicle crash
1 Pedestrian hit by vehicle(s) as result of vehicle-vehiclecollision
Backing up 2 Pedestrian hit by vehicle backing up.
Walking along roadway 12 Pedestrian struck while walking along edge of highway or on shoulder.Can be walking facing or in same direction as traffic.
Hitchhiking 2 Pedestrian hit while attempting to thumb ride.
Weird 8 Unusual circumstances.Not countermeasure corrective.
Source: Knoblauch, 1977 and Model Pedestrian User’s Manual, 1987 edition.

44
Table 19. Freeway pedestrian collision types and critical behavior descriptors (N=236).
Collision TypePercent of
Collisions StudiedLocation and/or CriticalBehavioral Descriptors
Disabled vehicle related 20 Pedestrian struck while working on or next to disabledvehicle.
Result of vehicle-vehicle crash
10 Pedestrian hit by vehicle(s) as result of vehicle-vehiclecollision.
Weird 10 Unusual circumstances.Not countermeasure corrective.
Hitchhiking 9 Pedestrian hit while attempting to thumb ride.
Walking to/from disabled vehicle
8 Pedestrian struck while walking along edge or shoulder of highway.Reason for walking because of disabled vehicle.Can be walking facing or in same direction as traffic.
Dart out 5 Not at interchange.Pedestrian sudden appearance and short time exposure.Driver does not have time to react to avoid collision.
Walking along roadway 5 Pedestrian struck while walking along edge of highway or on shoulder.Can be walking facing or in same direction as traffic.
Working on roadway 3 Pedestrian (flagperson or other construction worker) struck while working on roadway or shoulder.
Midblock dash * Not at interchange.Pedestrian running but not sudden appearance or short time exposure.
Vehicle turn-merge with attention conflict
* Vehicle merge location.Vehicle merging into traffic.Driver attending to auto traffic in one direction collides with pedestrian located in different direction than that of driver’s attention.
Turning vehicle * Vehicle merge location.Vehicle merging into traffic.Driver attention not documented.Pedestrian not running.
*Less than 1 percent. Source: Knoblauch, 1978 and Model Pedestrian User’s Manual, 1987 Edition.
A 1980 study by Habib identified causal factors related to pedestrian crashes at intersectioncrosswalks and recommended possible solutions. While 51.4 percent of such pedestrian crashes inHabib’s study involved a through vehicle, left-turn vehicle maneuvers were involved twice as often asright-turn crash maneuvers (24.8 percent vs. 13.1 percent). The left-turn maneuver was nearly four timesas hazardous as the through-movement in terms of collisions and exposure. Also, driver error was foundto increase when the left-turn movement was made as compared with right-turn maneuvers. Factorsidentified as contributing to the left-turn crashes with pedestrians include driver visibility problems, poordriver habits, and signal location.

45
Table 20. Driver activity leading to pedestrian collisions on freeways (N=236).
Percent ofPedestrianCollisions
Driver Activity
5115
9843311111
Going straight and/or sustaining speedDriving off traveled way or out of controlDeceleratingUnknownOtherChanging lanesSpeedingNegotiating curveStarting from stopped positionBacking upPassingMerging
Source: Knoblauch et al., 1978.
Table 21. Pedestrian activity leading to pedestrian collisions on freeways (N=236).
Percent ofPedestrianCollisions
Pedestrian Activity
21111010108654333221
Crossing, runningStanding next to a disabled vehicleCrossing, walkingWorking on a vehicleOtherWalking with trafficStandingFlagging vehicleCrossing, not further specifiedEntering or exiting vehiclePushing vehicleUnknownSitting or lying downWalking against trafficWorking on roadway
Source: Knoblauch et al., 1978.
Obviously, a left-turning driver has a complex task. Oncoming traffic must be monitored toidentify a safe gap to permit the turn. Traffic coming up from behind is also factor in the safety of theleft-turning driver (risk of turning vehicle’s being struck from rear). Add to this the necessity to monitor
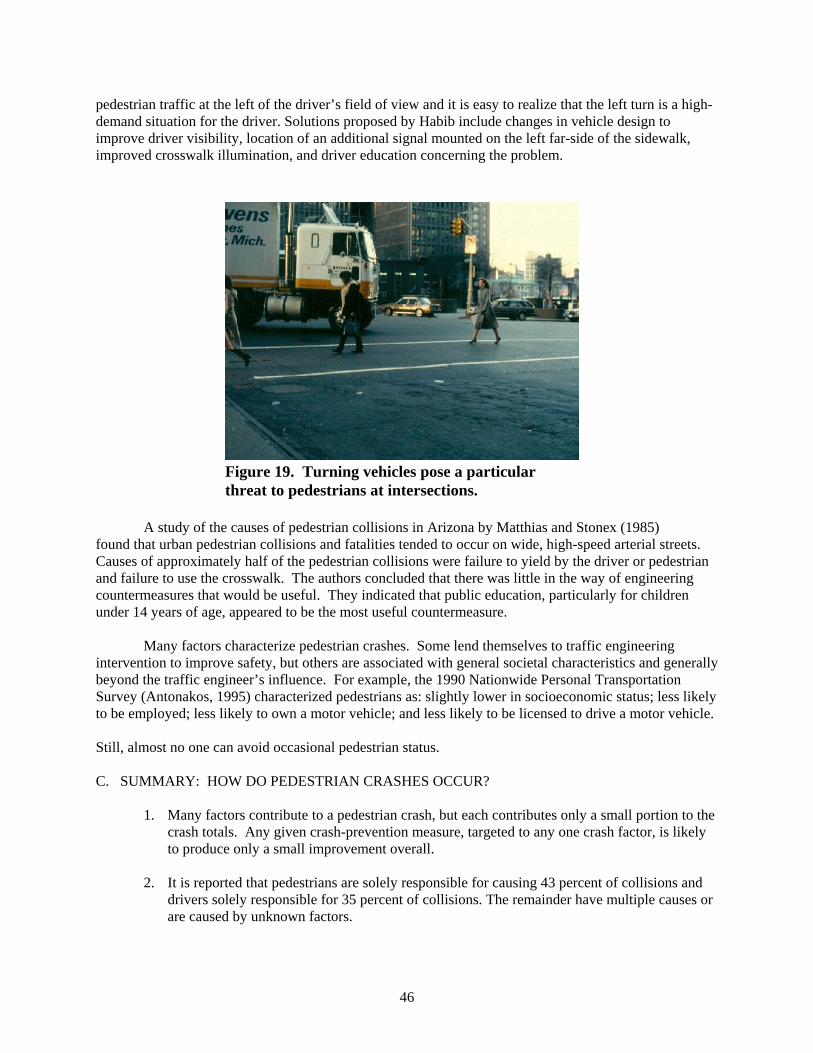
46
Figure 19. Turning vehicles pose a particularthreat to pedestrians at intersections.
pedestrian traffic at the left of the driver’s field of view and it is easy to realize that the left turn is a high- demand situation for the driver. Solutions proposed by Habib include changes in vehicle design toimprove driver visibility, location of an additional signal mounted on the left far-side of the sidewalk,improved crosswalk illumination, and driver education concerning the problem.
A study of the causes of pedestrian collisions in Arizona by Matthias and Stonex (1985)found that urban pedestrian collisions and fatalities tended to occur on wide, high-speed arterial streets. Causes of approximately half of the pedestrian collisions were failure to yield by the driver or pedestrianand failure to use the crosswalk. The authors concluded that there was little in the way of engineeringcountermeasures that would be useful. They indicated that public education, particularly for childrenunder 14 years of age, appeared to be the most useful countermeasure.
Many factors characterize pedestrian crashes. Some lend themselves to traffic engineeringintervention to improve safety, but others are associated with general societal characteristics and generallybeyond the traffic engineer’s influence. For example, the 1990 Nationwide Personal TransportationSurvey (Antonakos, 1995) characterized pedestrians as: slightly lower in socioeconomic status; less likelyto be employed; less likely to own a motor vehicle; and less likely to be licensed to drive a motor vehicle.
Still, almost no one can avoid occasional pedestrian status.
C. SUMMARY: HOW DO PEDESTRIAN CRASHES OCCUR?
1. Many factors contribute to a pedestrian crash, but each contributes only a small portion to thecrash totals. Any given crash-prevention measure, targeted to any one crash factor, is likelyto produce only a small improvement overall.
2. It is reported that pedestrians are solely responsible for causing 43 percent of collisions anddrivers solely responsible for 35 percent of collisions. The remainder have multiple causes orare caused by unknown factors.

47
3. Culpability varies by crash type, as would be expected. For crashes involving a midblockdash, pedestrians are judged at fault most of the time. Driver culpability is rated high forpedestrian crashes involving vehicles turning at an intersection.
How Severe Are Pedestrian Collisions? A. FINDINGS
Although many pedestrians are killed in motor vehicle collisions, most pedestrian collisions do notresult in fatal injuries, in spite of pedestrians’ vulnerability in a collision with a 908-kg or 2000-lb rigidmotor vehicle. Data from NHTSA (Traffic Safety Facts, 1995) show that in 1994 there were:
Pedestrian deaths 5,472Incapacitating injuries 22,000Not incapacitating injuries 30,000Other injuries 38,000
Other data sources indicate that, in some pedestrian crashes, the police report indicates that thepedestrian is not injured. The injury scale shown here is one used by many police departments. The five-category scale is shown below along with the injury distribution reported by Hunter et al., 1996, whoreported on 5,073 pedestrian crashes.
Percent
No injury 3“C” Injury (minor) 29“B” Injury (moderate) 35“A” Injury (severe) 27 Fatal 6
Table 22 shows how this injury distribution differs according to type of crash. Note the crash typecategories that indicate most and least severe injuries. As to the fatal category, the greatest risk is "Walking along the roadway" (13.3 percent versus 6.1 percent fatal overall). At the other end of the scale,the crash types in which the largest number of pedestrians who escape with minor injuries or no injuries(that is, “C” injuries plus “No injuries”) are those involving a backing vehicle, 42 percent compared with31 percent overall. Speed is a likely factor in these differences. Pedestrian crashes resulting in little or no injury are more likely to go unreported than those in which the pedestrian was seriously injured orkilled.

48
Table 22. Pedestrian crash types by pedestrian injury severity (N=5,073).
INJURY SEVERITY*PedestrianCrash TypeSubgroup
NoInjury
Minor(C)
Moderate(B)
Severe(A) Fatal
Bus related 2.3 25.0 45.5 22.7 4.5
Other vehicle specific 0.0 24.7 43.8 25.8 5.6
Driverless vehicle 1.4 24.3 36.5 35.1 2.7
Backing vehicle 2.4 39.2 35.8 20.8 1.7
Disabled vehicle related 2.5 24.2 31.7 32.5 9.2
Working/playing in road
3.5 32.2 37.1 25.9 1.4
Walking along roadway 1.5 23.9 34.3 27.2 13.2
Not in road 3.3 31.9 36.4 24.7 3.6
Vehicle turning at intersection
2.4 44.6 34.5 16.6 1.8
Intersection dash 3.4 25.4 37.6 29.4 4.2
Driver violation at intersection
2.4 32.2 37.6 22.7 5.1
Other intersection 3.0 27.2 33.6 30.8 5.4
Midblock dart/dash 2.4 23.2 38.8 30.0 5.6
Other midblock 1.5 23.0 28.7 35.7 11.1
Miscellaneous 3.8 26.5 36.8 25.7 7.3
ALL CRASHES 2.5 28.7 35.3 27.4 6.1
*Cases with unknown injury severity excluded.Source: Pedestrian and Bicycle Crash Types of the Early 1990s, Hunter, W., J. Stutts, W. Pein, C. Cox,
UNC HSRC, FHWA-RD-95-163, 1996.

49
7.66.1
4.9
8.3
10.5
15.3
18.6
25.1
0
5
10
15
20
25
30
0-4 5-9 10-14 15-24 25-44 45-64 65-74 75+
Age
Perc
ent f
atal
Figure 20 Percentage of pedestrian/motor vehicle crashes resulting in death, by pedestrian age, 1980-1990, North Carolina data.
Source: Zegeer et al., 1993.
Figure 20 shows that injury severity is also related to age (Zegeer et al., 1993). Older personssuccumb to injuries that a younger person might survive. Fatal injuries among the youngest age groupalso are elevated relative to the lowest point of the curve. Fatalities among those 0-4 years are greaterthan for the next two older age groups.
B. SUMMARY: HOW SEVERE ARE PEDESTRIAN COLLISIONS?
1. Although too many pedestrian crashes result in fatal injuries, the great majority of pedestriancollisions do not produce fatal injuries.
2. Some crash types are overrepresented in fatal outcomes. The walking-along-the-roadwaycrash type is an example.
3. Some crash types are overrepresented in less severe outcomes. This includes pedestriancrashes involving backing vehicles and those involving driver violations at an intersection.
4. Older pedestrians are more likely to die from injuries in a collision than are youngerpedestrians.
Summary of Pedestrian Collision Statistics
1. Fatal pedestrian crashes tend to occur at night.
2. Nonfatal pedestrian crashes tend to occur during the day.
3. Pedestrian crashes are more frequent on Friday and Saturday and less frequent on Sunday.
4. Child pedestrian crashes occur more often in the summer.

50
5. Adult pedestrian crashes occur more often in the winter.
6. The largest percentage of fatal pedestrian crashes is in 25-44 age category.
7. The oldest age category (75 years or older) shows higher percentages of collisions per unitpopulation.
8. Compared with their proportion in the U.S. population, children ages 21–22 are overrepresented in pedestrian deaths and injuries.
9. More male than female pedestrian fatalities are seen in every age category.
10. Some data show that even for children 2 and 3 years old, more males than females arestruck.
11. Alcohol use by pedestrians is an important factor in pedestrian crashes. A North Carolinastudy showed that between 42 and 61 percent of fatally injured pedestrians were under theinfluence of alcohol (i.e., BAC of 0.10 or greater).
12. As might be expected, pedestrian sobriety is also associated with crash type. For the crashtype of walking along the roadway, alcohol involvement is overrepresented for both driversand pedestrians. While alcohol-related collisions are dropping in the driving population,there has been little change in alcohol-related collisions involving drinking pedestrians.
13. Vehicle types overrepresented in fatal pedestrian crashes include the light truck category aswell as heavy trucks and motorcycles.
14. One study shows that approximately 85 percent of pedestrian crashes occur in urban areasand approximately 15 percent in rural areas. However, 25 percent of fatal pedestrian crashesoccur in rural areas, showing the disproportionately severe character of such pedestriancrashes.
15. Another study of pedestrian collisions showed a breakdown of 68 percent urban and 32percent rural. Certain crash types were overrepresented in each category. In rural areas, pedestrian crashes involving walking along the road were overrepresented. In urban areas, pedestrian crashes involving driver violations at an intersection were overrepresented.
16. Three-quarters of pedestrian crashes occur where there are no traffic controls, 7 percentwhere there is a stop sign, and 17 percent where there is a traffic signal. However, thisvaries by crash type. For the crash type of walking along the roadway, 96 percent occurwhere there is no traffic control versus 74 percent overall. For the category of vehicleturning at an intersection, 63 percent occur where there is a traffic light, versus 17 percentoverall.
17. With respect to speed limits, most pedestrian crashes occur where speed limits are low ormoderate (consistent with the fact that most pedestrian crashes occur in urban areas).
18. Approximately 40 percent of pedestrian crashes occur at intersections, although 75 percentof child pedestrian crashes are not at intersections. The majority of pedestrian crashesinvolving the elderly do occur at intersections.

51
Figure 21. Some pedestrian crash types are overrepre-sented in fatal outcomes, including walking along road.
19. Many factors contribute to a pedestrian crash, but no single factor accounts for a sizablepercentage of crashes. Thus, any given crash prevention measure, targeted to address anyone factor, can produce only a small overall improvement.
20. Pedestrians are solely culpable in 43 percent of crashes and drivers in 35 percent of crashes.
21. Culpability varies by crash type. For crashes involving a midblock dash, pedestrians arefound at fault most of the time. Drivers are more often categorized as culpable in crashesinvolving vehicles turning at an intersection.
22. Some crash types are overrepresented in fatal outcomes. Walking along the road is anexample.
23. Some crash types are overrepresented in less severe outcomes. This includes pedestriancrashes involving backing vehicles.
Exposure-Based Hazard Index
Several studies have addressed the need for a measure of the relative exposure to hazards based onpedestrian crash statistics (Knoblauch, 1977; Lea et al., 1978; Goodwin and Hutchinson, 1977).
In 1977, Knoblauch developed a hazard index, defined as the ratio of the frequency with whichany particular attribute was present in the crash sample to the frequency with which it was present in thegeneral population at the site (base rate), at approximately the same time of day. Tables 23 and 24 showthe relative hazards of pedestrian and vehicle actions derived in this manner. Table 23 shows that whilecrossing at a location other than an intersection was the most frequent action identified in the pedestriancrash sample, when compared with non-involved pedestrian actions at the site, it is a substantially lesshazardous action than, for example, standing in the roadway. Similarly, out-of-control and backingvehicles are shown to be extremely hazardous to the pedestrian compared with turning vehicles. This
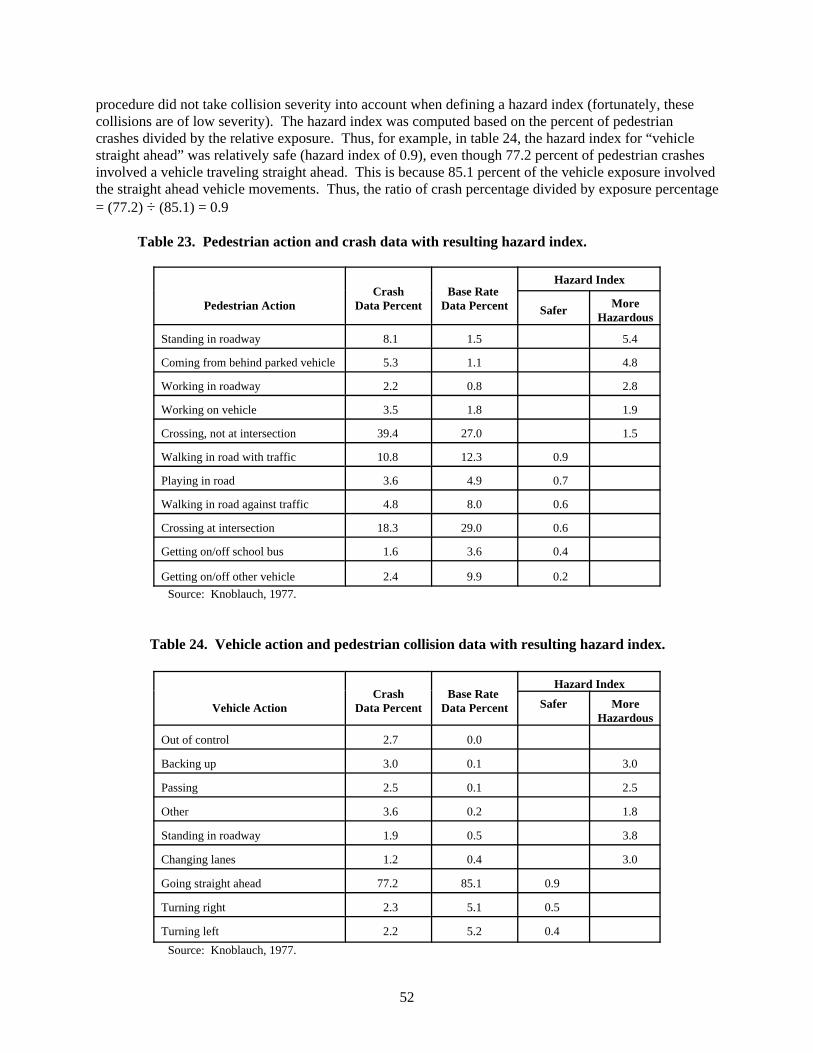
52
procedure did not take collision severity into account when defining a hazard index (fortunately, thesecollisions are of low severity). The hazard index was computed based on the percent of pedestriancrashes divided by the relative exposure. Thus, for example, in table 24, the hazard index for “vehiclestraight ahead” was relatively safe (hazard index of 0.9), even though 77.2 percent of pedestrian crashesinvolved a vehicle traveling straight ahead. This is because 85.1 percent of the vehicle exposure involvedthe straight ahead vehicle movements. Thus, the ratio of crash percentage divided by exposure percentage= (77.2) ÷ (85.1) = 0.9
Table 23. Pedestrian action and crash data with resulting hazard index.
Pedestrian ActionCrash
Data PercentBase Rate
Data Percent
Hazard Index
Safer MoreHazardous
Standing in roadway 8.1 1.5 5.4
Coming from behind parked vehicle 5.3 1.1 4.8
Working in roadway 2.2 0.8 2.8
Working on vehicle 3.5 1.8 1.9
Crossing, not at intersection 39.4 27.0 1.5
Walking in road with traffic 10.8 12.3 0.9
Playing in road 3.6 4.9 0.7
Walking in road against traffic 4.8 8.0 0.6
Crossing at intersection 18.3 29.0 0.6
Getting on/off school bus 1.6 3.6 0.4
Getting on/off other vehicle 2.4 9.9 0.2 Source: Knoblauch, 1977.
Table 24. Vehicle action and pedestrian collision data with resulting hazard index.
Vehicle ActionCrash
Data PercentBase Rate
Data Percent
Hazard Index
Safer MoreHazardous
Out of control 2.7 0.0
Backing up 3.0 0.1 3.0
Passing 2.5 0.1 2.5
Other 3.6 0.2 1.8
Standing in roadway 1.9 0.5 3.8
Changing lanes 1.2 0.4 3.0
Going straight ahead 77.2 85.1 0.9
Turning right 2.3 5.1 0.5
Turning left 2.2 5.2 0.4 Source: Knoblauch, 1977.
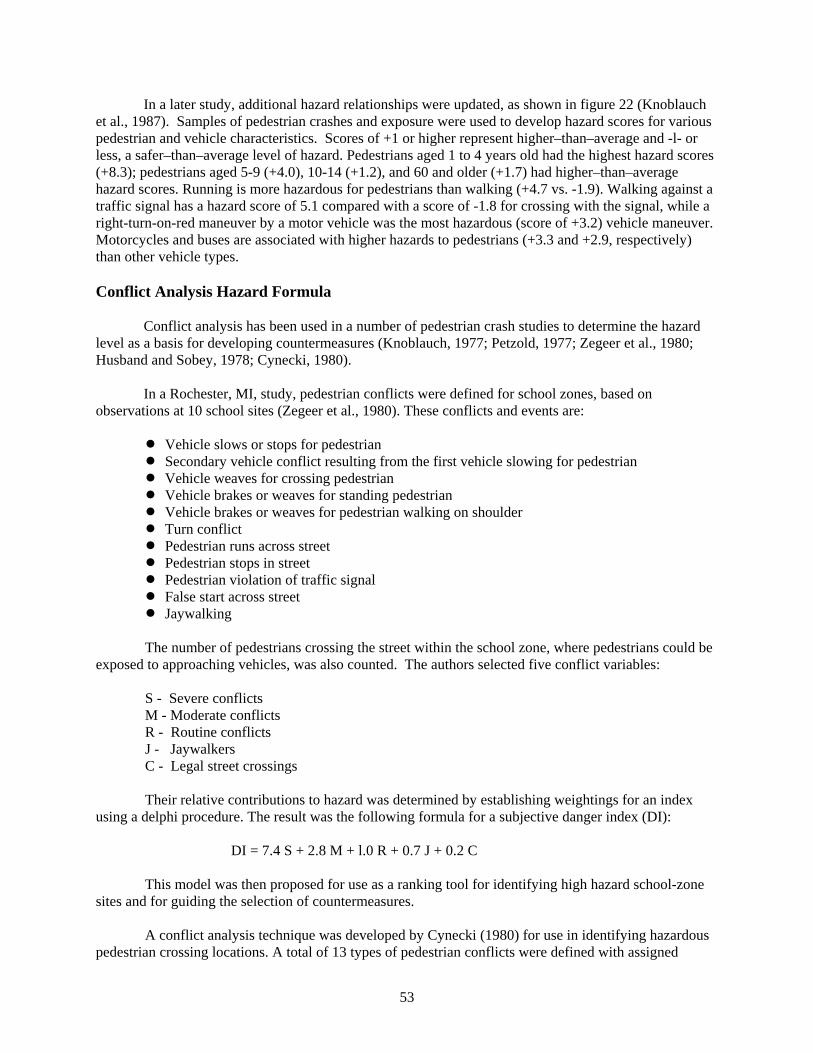
53
In a later study, additional hazard relationships were updated, as shown in figure 22 (Knoblauchet al., 1987). Samples of pedestrian crashes and exposure were used to develop hazard scores for variouspedestrian and vehicle characteristics. Scores of +1 or higher represent higher–than–average and -l- orless, a safer–than–average level of hazard. Pedestrians aged 1 to 4 years old had the highest hazard scores(+8.3); pedestrians aged 5-9 (+4.0), 10-14 (+1.2), and 60 and older (+1.7) had higher–than–averagehazard scores. Running is more hazardous for pedestrians than walking (+4.7 vs. -1.9). Walking against atraffic signal has a hazard score of 5.1 compared with a score of -1.8 for crossing with the signal, while aright-turn-on-red maneuver by a motor vehicle was the most hazardous (score of +3.2) vehicle maneuver.Motorcycles and buses are associated with higher hazards to pedestrians (+3.3 and +2.9, respectively)than other vehicle types.
Conflict Analysis Hazard Formula
Conflict analysis has been used in a number of pedestrian crash studies to determine the hazardlevel as a basis for developing countermeasures (Knoblauch, 1977; Petzold, 1977; Zegeer et al., 1980;Husband and Sobey, 1978; Cynecki, 1980).
In a Rochester, MI, study, pedestrian conflicts were defined for school zones, based onobservations at 10 school sites (Zegeer et al., 1980). These conflicts and events are:
! Vehicle slows or stops for pedestrian! Secondary vehicle conflict resulting from the first vehicle slowing for pedestrian! Vehicle weaves for crossing pedestrian! Vehicle brakes or weaves for standing pedestrian! Vehicle brakes or weaves for pedestrian walking on shoulder! Turn conflict! Pedestrian runs across street! Pedestrian stops in street! Pedestrian violation of traffic signal! False start across street! Jaywalking
The number of pedestrians crossing the street within the school zone, where pedestrians could beexposed to approaching vehicles, was also counted. The authors selected five conflict variables:
S - Severe conflictsM - Moderate conflictsR - Routine conflictsJ - JaywalkersC - Legal street crossings
Their relative contributions to hazard was determined by establishing weightings for an indexusing a delphi procedure. The result was the following formula for a subjective danger index (DI):
DI = 7.4 S + 2.8 M + l.0 R + 0.7 J + 0.2 C
This model was then proposed for use as a ranking tool for identifying high hazard school-zonesites and for guiding the selection of countermeasures.
A conflict analysis technique was developed by Cynecki (1980) for use in identifying hazardouspedestrian crossing locations. A total of 13 types of pedestrian conflicts were defined with assigned

54
Pedestrian andVehicle Characteristics Pedestrian
Accidents
Pedestriansor VehiclesObserved
Less Hazard More Hazard
Pedestrian Age1-4 8.3 1.05-9 21.6 5.4 4.010-14 12.2 10.1 1.215-19 10.9 11.5 -1.120-29 18.4 22.6 -1.230-59 15.8 41.7 -2.660+ 12.8 7.7 1.7
Pedestrian ModeWalking 47.1 88.8 -1.9Running 52.9 11.2 4.7
Pedestrian Crossing LocationCrosswalk 24.0 54.3 -2.3Within 50' of Intersection 24.1 9.4 2.6Diagonally Across Intersection 0.9 1.7 -1.9Midblock 51.0 34.6 1.5
Pedestrian Signal ResponseWith Signal: Green 51.3 90.4 -1.8Against Signal: Red 48.7 9.6 5.1
Vehicle ActionGoing Straight 90.0 84.6 1.1Turning Right 3.8 7.7 -2.0Turning Left 4.6 7.2 -1.6Right Turn on Red 1.6 0.5 3.2
Vehicle TypeCars 79.3 83.5 -1.1Vans, Pickups 12.4 11.6 1.1Trucks, Other 2.3 2.4 -1.0Buses 2.0 0.7 2.9Taxis 0.7 0.8 -1.1Motorcycles 3.3 1.0 3.3
Percentage of Hazard Score
8.3
+5-5 -1-3 +1 +3
Figure 22. Relative hazard of selected pedestrian characteristics.Source: Knoblauch et al., 1987

55
severity levels. The technique was tested at five locations and used to select pedestrian crashcountermeasures. The author recommended further investigation of relationships among pedestrianconflicts and vehicle-pedestrian crashes.
Another study that attempted to determine the relationship between pedestrian-vehicle conflictsand pedestrian crashes based on a predictive model used discriminate analysis to develop crash-groupmodels for the cities of Washington, DC and Seattle, WA (Davis et al., 1989). These models were used topredict intersection groups expected to have, for example, 0, 1, 2, or 3 or more pedestrian crashes. The crash groups were defined based on conflicts, as well as such exposure measures as pedestrian volume,vehicle volume, number of lanes, and type of traffic control. The models were considered particularlyuseful in setting priorities for hazardous locations and for evaluating various traffic control strategies. Themodel was developed using a subset of the crash data, and then was at least partly validated by beingapplied to the remaining crash data.

56
57
PART 3. OVERVIEW OF PEDESTRIAN CRASH COUNTERMEASURES ANDSAFETY PROGRAMS
Cautions Regarding Design Problems in Studies of Countermeasure Effectiveness
This report is based on a review of many evaluation studies of pedestrian safety initiatives, so it isuseful to comment on the difficulties inherent in this kind of research and the study design problems thatplague such research efforts.
First, research on the effectiveness of pedestrian safety initiatives is inherently difficult because pedestrian crashes are generally quite rare at any given location; therefore, a study may not have enoughdata for numerical stability. It is common that years will pass between instances of a pedestrian-vehiclecollision at a given site. While the rarity of pedestrian collisions at a site is fortunate, it makes the studyof countermeasures difficult.
To compensate for small numbers, investigators often aggregate data from many sites. Manyintersections will be studied, and the study period will be extended for as long as possible because this isthe only way that usable numbers of crashes can be accumulated. However, such aggregation of sites andlong time periods creates other sources of crash variability, perhaps partly offsetting the benefit of thelarger sample size.
The other significant problem is the almost inevitable study design flaws in many researchefforts. These critical study design flaws include selection bias and regression to the mean. Theseparticular study design problems generally are encountered because of the procedures used to decidewhere to install treatments.
Given limited funds and great needs, authorities earmark countermeasure sites based on somekind of priority procedure. It may be a formal warranting procedure, or an informal approach of placingthe remedies where the problem is judged to be greatest. This latter procedure is prudent, and iscompletely justified from an operational standpoint. However, from a research standpoint it can betroublesome, especially in assessing pre- and post-treatment data.
The problem is that the sites where the treatments are introduced were usually different from thecomparison sites before the interventions were introduced. That is why the treatments were put thererather than somewhere else.
This pre-existing difference is very likely to overwhelm the effect of the treatment. If the “after”experience is different from the “before” experience, one cannot know how much of the change wasproduced by the treatment and how much is a continuation of the pre-existing difference.
A special case of selection bias is regression to the mean. If the pretreatment collision record isthe basis for introducing an intervention at a particular site, and if the “worst” sites are selected forintroduction of countermeasures, then the after-crash experience will be better than before the experiencebecause of the operation of the probability phenomenon called “regression to the mean.” When thatparticular flaw is embedded in a study design, one cannot know whether the favorable results are from thecountermeasure, from the regression effects, or from a combination of the two.
Many studies reviewed herein likely suffer from one or the other of these study design flaws. This is not said as a particular criticism of the study authors: Sometimes it is virtually impossible to carryout a study without such flaws, given the manner in which operational decisions are made to installtreatments.
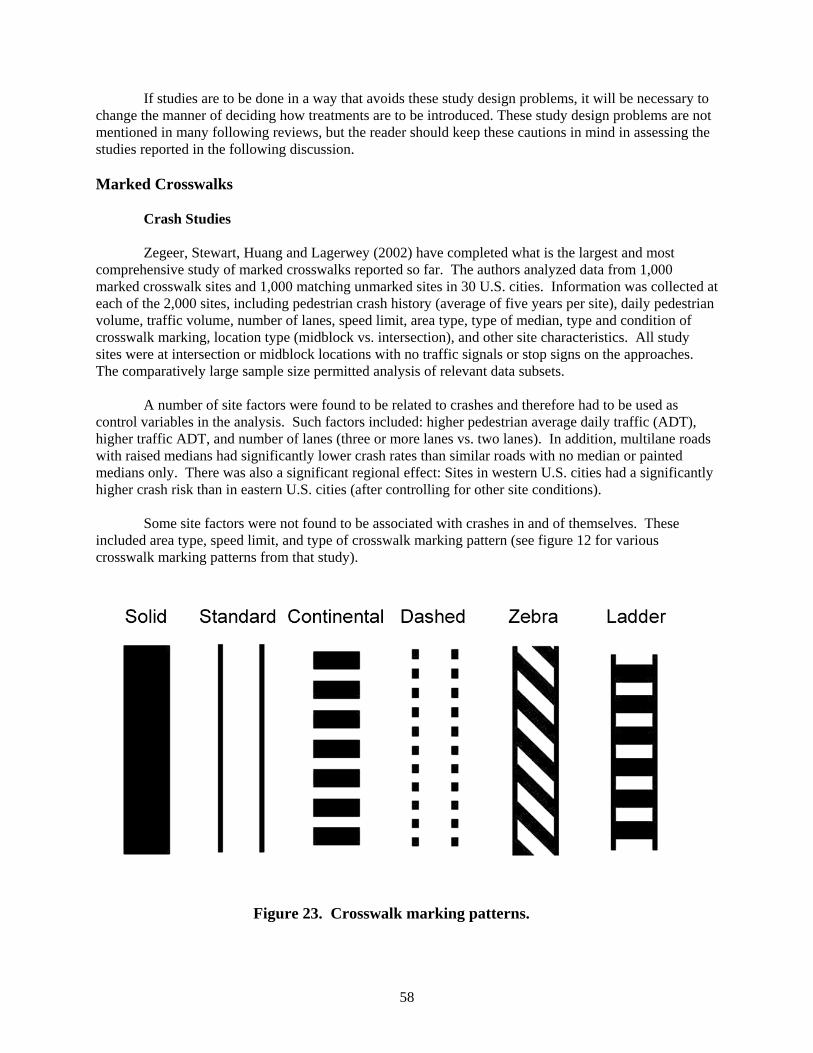
58
Figure 23. Crosswalk marking patterns.
If studies are to be done in a way that avoids these study design problems, it will be necessary tochange the manner of deciding how treatments are to be introduced. These study design problems are notmentioned in many following reviews, but the reader should keep these cautions in mind in assessing thestudies reported in the following discussion.
Marked Crosswalks
Crash Studies
Zegeer, Stewart, Huang and Lagerwey (2002) have completed what is the largest and mostcomprehensive study of marked crosswalks reported so far. The authors analyzed data from 1,000marked crosswalk sites and 1,000 matching unmarked sites in 30 U.S. cities. Information was collected ateach of the 2,000 sites, including pedestrian crash history (average of five years per site), daily pedestrianvolume, traffic volume, number of lanes, speed limit, area type, type of median, type and condition ofcrosswalk marking, location type (midblock vs. intersection), and other site characteristics. All studysites were at intersection or midblock locations with no traffic signals or stop signs on the approaches. The comparatively large sample size permitted analysis of relevant data subsets.
A number of site factors were found to be related to crashes and therefore had to be used ascontrol variables in the analysis. Such factors included: higher pedestrian average daily traffic (ADT),higher traffic ADT, and number of lanes (three or more lanes vs. two lanes). In addition, multilane roadswith raised medians had significantly lower crash rates than similar roads with no median or paintedmedians only. There was also a significant regional effect: Sites in western U.S. cities had a significantlyhigher crash risk than in eastern U.S. cities (after controlling for other site conditions).
Some site factors were not found to be associated with crashes in and of themselves. Theseincluded area type, speed limit, and type of crosswalk marking pattern (see figure 12 for variouscrosswalk marking patterns from that study).
59
All site factors that were related to crashes (i.e., pedestrian ADT, traffic ADT, number of lanes,median type, and region of the country) were then included in the statistical models used to determineeffects of marked vs. unmarked crosswalks. (Poisson and negative binomial regression models wereused.)
The study found that on two-lane roads, the presence of a marked crosswalk alone at anuncontrolled location was associated with no difference in pedestrian crash rate, compared to anunmarked crosswalk. Further, on multilane roads with traffic volumes above about 12,000 vehicles perday, having a marked crosswalk alone, without other substantial improvements, was associated with ahigher pedestrian crash rate after controlling for other site factors, compared to an unmarked crosswalk(see figure 13). Raised medians provided significantly lower pedestrian crash rates on multilane roads,compared to roads with no raised median. Older pedestrians’ crash rates were high relative to theircrossing exposure.
The authors state (page 1): “Pedestrians are legitimate users of the transportation system, andthey should, therefore, be able to use this system safely. Pedestrian needs in crossing streets should beidentified, and appropriate solutions should be selected to improve pedestrian safety and access.”
Some improvements suggested by the authors at unsignalized crossing locations:
! Providing raised medians on multilane roads, which can substantially reduce pedestriancrash risk and also facilitate street crossing
! Installing traffic signals (with pedestrian signals) where warranted and/or where seriouspedestrian crossing problems exist
! Reducing the effective street-crossing distance for pedestrians by providing curb extensionsand/or raised pedestrian islands, "road diets" (i.e., reducing four-lane undivided roads to twothrough-lanes with left-turn lane)
! Installing raised crossings (raised crosswalk, raised intersection, speed humps)
! Providing street-narrowing measures (chicanes, slow points, "skinny street," etc.)
! Using intersection designs (traffic mini-walks, diagonal diverters)
! Providing adequate nighttime lighting for pedestrians
! Designing safer intersections and driveways for pedestrians (e.g., tighter turn radii)
! Constructing grade-separated crossings or pedestrian-only streets
! Using innovative signs, signals and markings shown to be effective
Two studies by Knoblauch were conducted on pedestrian and motorist behavior as part of theoverall FHWA study on crosswalks in conjunction with the study summarized above.
60
0.120.17
0.63
1.37
0.17
0.74
0.12
0.25
0.15
0.28
0
0.17
0
0.2
0.4
0.6
0.8
1
1.2
1.4
1.6
u u u u u u
Type of Crossing
Pede
stria
n C
rash
Rat
e(P
edes
tria
n C
rash
es p
er M
illio
n C
ross
ings
)
M= Marked
U= Unmarked
M UNo MedianAll ADTs2 Lanes
(914 Sites)
M UNo Raised Median
< 12,000 ADT3 to 8 Lanes(260 Sites)
M UNo Raised Median12,000-15,000 ADT
3 to 8 Lanes(149 Sites)
M U No Raised Median
> 15,000 ADT3 to 8 Lanes(417 Sites)
M URaised Median< 15,000 ADT3 to 8 Lanes
(87 Sites)
M URaised Median> 15,000 ADT3 to 8 Lanes(173 Sites)
Sig. = Significant DifferenceN.S. = No Significant Difference
Crosswalk Type
(p=0.62)*
N.S.
(p=0.00)
(p=0.02)
(p=0.87) (p=0.59)N.S.
Sig.
Sig.
Sig.
N.S.
(p=0.004)
Figure 24. Pedestrian crash rates at types of crossing.
61
One study was conducted to determine the effect of crosswalk markings on driver and pedestrianbehavior at unsignalized intersections (Knoblauch, Nitzburg, and Seifert, 2000). A before-and-afterevaluation of crosswalk markings was conducted at 11 locations in 4 U.S. cities. Behavior observedincluded: pedestrian crossing location, vehicle speeds, driver yielding, and pedestrian crossing behavior.The authors found that drivers approach a pedestrian in a crosswalk somewhat slowly, and that crosswalkusage increases after markings are installed. No evidence was found indicating that pedestrians are lessvigilant in a marked crosswalk. No changes were found in driver yielding or pedestrian assertiveness as aresult of adding the marked crosswalk. Marking pedestrian crosswalks at relatively low-speed, low-volume, unsignalized intersections was not found to have any measurable negative effect on pedestrian or motorist behavior at the selected sites, which were all 2- or 3-lane roads with speed limits of 35 or 40mph.
In a comparison study, a before-and-after evaluation of pedestrian crosswalk markings wasperformed in Maryland, Virginia, and Arizona (Knoblauch and Raymond, 2000). Six sites were selectedthat had been recently resurfaced. All sites were at uncontrolled intersections with a speed limit of 56km/h (35 mi/h). “Before data” were collected after the centerline and edgeline delineation was installedbut before the crosswalk was installed. “After” data were collected after the crosswalk markings wereinstalled. Speed data were collected under three conditions: no pedestrian present, pedestrian looking,and pedestrian not looking. All pedestrian conditions involved a staged pedestrian. The results indicate aslight reduction at most, but not all, of the sites. Overall, there was a significant reduction in speed underboth the no-pedestrian and the pedestrian-not-looking conditions.
These more recent studies must be considered in the context of contradictory results amongseveral earlier studies. The above study shows that marked crosswalks do not differ in safety fromunmarked crosswalks under most circumstances, while in the high-volume, multilane case, the use ofmarked crosswalks alone is associated with increased pedestrian risk. This does not fully agree withseveral other studies that reported that marked crosswalk crashes in general were much more frequentthan at unmarked crosswalks. However, most of the older studies typically did not analyze the effects ofmarked crosswalks as a function of number of lanes, traffic volume, or other roadway factors.
For example, Herms (1972) authored an early and oft-quoted (and sometimes mis-quoted) studyfrom San Diego, CA, reporting that crashes on marked crosswalks were twice as frequent per unitpedestrian volume. In this study, 400 intersections were selected, each having one marked and oneunmarked crosswalk leg on the same street.
Herms made no mention in 1972 of warrants used to determine where to paint crosswalks, but anearlier version of the study did (Herms, 1970). The warrant directive for San Diego (January 15, 1962)established a point system calling for painting crosswalks when: 1) traffic gaps were fewer rather thanmore numerous; (2) pedestrian volume was high; (3) speed was moderate; and (4) "other" factorsprevailed, such as previous crashes. Thus, it is possible that crosswalks may have been more likely to bepainted in San Diego where the conditions were most ripe for pedestrian collisions, compared tounmarked sites.
In a 1994 study, Gibby et al. revisited the issue in an analysis of crashes at 380 Californiahighway intersections. These were picked in a multi-step selection process from among more than 10,000intersections. Results showed that crash rates at the selected 380 unsignalized intersections were 2 or 3times higher in marked than in unmarked crosswalks when expressed as crash rates per pedestrian-vehiclevolume.
62
Other studies on crosswalk effects have also been conducted. Gurnett (1974) described a projectto remove painted stripes from some crosswalks that had shown a bad crash experience in the recent past. This is a before-after study of three locations picked because they had a recent bad crash record. Crosswalk paint was removed. Subsequent crashes were tallied and fewer were found. The findings ofthis study are likely an artifact of the well-known statistical phenomenon of regression to the mean.
Another study of marked crosswalks at non-signalized intersections was reported by the LosAngeles County Road Department in July, 1967. In a before-after study of 89 intersections, paintedcrosswalks were added at each site. Collisions increased from 4 during the before period to 15 in the afterperiod. All sites that showed crash increases after crosswalks were installed had ADT of less than 10,900vehicles. At sites with smaller ADT volume, no change in crashes was seen.
The above finding regarding ADT above approximately 11,000 is consistent with the findings ofZegeer, Stewart, and Huang and Lagerwey (2002) reported at the beginning of this section. Moreover,Zegeer et al. attempted to compare their results with those of Herms. They lumped all their study sitestogether and computed a simple ratio of crashes divided by pedestrian crossing volume, as did Herms. Byreplicating the Herms analysis method on the 2000-site (30-city) data set, they too found the markedcrosswalks were worse by slightly more than 2-to-1 than the unmarked. It is only when the data weredisaggregated (and more appropriate Poisson and negative binomial modelling analyses were done) that itwas seen that higher pedestrian crash risk of marked crosswalks is confined to the high volume,multi-lane case.
In contrast to the foregoing, however, Tobey and colleagues (1983) reported reduced crashesassociated with marked crosswalks. They examined crashes at marked and unmarked crosswalks as afunction of pedestrian volume (P) multiplied by vehicle volume (V). When the P x V product was usedas a denominator, crashes at unmarked crosswalks were overrepresented, and considerablyunderrepresented at marked crosswalks. Communication with the authors indicates that this studyincluded controlled (signalized) as well as uncontrolled crossings. It seems likely that more markedcrosswalks were at controlled crossings than were unmarked crosswalks, which could partially explain thedifferent results compared to other studies.
It should be noted that the study methodology was useful for determining pedestrian crash risk fora variety of human and location features. It was never intended, however, to be used for quantifying thespecific safety effects of marked vs. unmarked crosswalks for various traffic and roadway situations.
Results of a study of pedestrian crossings in London, England calculated crash risk as the ratio ofcrashes per unit time to pedestrian volume counts (Mackie and Older, 1965). The authors found that therisk was lower in zebra crosswalks than in areas up to 45.7 m (50 yards) away from the crosswalks. There was a gradient effect, with crash risk highest nearer to the zebra crossing, but the risk was lower inthe crossing. They found similar results for zebra crossings near a signalized crossing.
However, Ekman of the University of Lund in Sweden found in 1988 that "a pedestrianexperiences approximately a double risk of being injured when crossing on a zebra crossing compared toa crossing location without any signs or road markings, presupposed that all other conditions are equal." Ekman contrasted his results with those from a similar Norwegian study, which reported that pedestrianrisk associated with Norwegian zebra crossings was significantly lower than on the Swedish counterparts.
In 1985, Yagar reported the results of introducing marked crosswalks at 13 Toronto, Ontario, intersections. The basis for selecting the intersections was not described. A before-after study wascarried out and it was found that crashes had been increasing during the before period and continued toincrease at the same pace after crosswalks were installed. It would appear that marking the crosswalksdid not have much of an effect. However, the author pointed to an increase in tailgating crashes after

63
Figure 25. Unsafe motorist behavior at markedcrosswalks is one of the causes of pedestriancrashes at marked crosswalks.
crosswalk painting. He also reported that the increased crashes during the after phase seemed to beexplained by involvement of out-of-town drivers.
It is difficult to summarize these disparate findings, but it can be said that marked crosswalkshave little or no association with pedestrian crash risk on two-lane roads and also on multilane roads withADT less than approximately 10,000. However, for multilane facilities with ADT greater than 10,000, asignificant crash risk is associated with using marked crosswalks alone without other, more substantialpedestrian safety treatments.
Behavioral Studies
It is logical to expect behavioral studies of driver and pedestrian reaction to marked crosswalks inview of the counterintuitive crash results reported in the literature. In his 1972 study, Herms stated: "Evidence indicates that the poor crash record of marked crosswalks is not due to the crosswalk beingmarked as much as it is a reflection on the pedestrian's attitude and lack of caution when using the markedcrosswalk."
No behavioral data were presented in that study, however. Other authors advanced similarassertions with regard to pedestrian behavior in marked crosswalks (Public Works, 1969) (Los AngelesCounty Road Department, 1967). In a 1994 study, Gibby et al. provided a thorough review of theliterature including behavioral studies. Some are reviewed here in a separate consideration of pedestrianvs. motorist behavior.
PEDESTRIAN BEHAVIOR
In 1999, Knoblauch and his colleagues carried out a study intended to directly observe incautiousor reckless pedestrian behavior, such as Herms and others postulated to exist, and that might account forthe negative crash results reported in some studies. They found no such behavior (Knoblauch, 1999).
The research team collected data at eleven sites before and after crosswalks were marked. Theymeasured vehicle speed and volume, pedestrian volume, and recorded pedestrian and motorist behavior. Their study addressed three hypotheses related to pedestrian behavior:

64
Hypothesis: Will pedestrians, perhaps feeling more protected, act more aggressively whencrossing a marked crosswalk compared to one not marked?
No difference was seen in blatantly aggressive pedestrian behavior whether the crossing wasmarked or not.
Hypothesis: Will pedestrians keep in the corridor defined by the stripes?
Pedestrians walking alone tended more to use marked crosswalks, especially at busyintersections. Pedestrians in groups tended not to use the marked crosswalks. Overall, crosswalk usageincreased once markings were in place.
Hypothesis: Will marked crosswalks result in less pedestrian "looking behavior," perhaps becausethey feel more protected?
Looking behavior increased significantly after crosswalk markings were installed. No evidencewas seen that the pedestrians were less vigilant in a marked crosswalk compared to one not marked.
The findings are generally consistent with an earlier study that likewise addressed pedestrianlooking behavior and how well they kept within the area defined by the markings (Knoblauch et al.,1987). Of one case study, these authors said, "The analysis of behavioral data indicates that there werelittle or no changes in pedestrian behavior resulting from the installation of the pedestrian crosswalk markings." (p. 21)
Of a second case study, the authors said, "...pedestrians tended to stay in the crosswalk. Therewas no change in the number of pedestrians looking before entering the roadway; fewer pedestrianscontinued to look during the first half of the crossing. There was no change in looking behavior duringthe second half of the crossing. (pp. 25-26)
Hauck (1979) reported a before-after study done in Peoria, IL, in which 17 crosswalks at trafficsignals were re-painted. Operational evaluation at the sites showed a general decrease in both pedestrianand motorist violations when comparing "before-and-after results. It was found that the percentage ofpedestrians who stepped out in front of traffic during the after period decreased at 12 of the 17 locations;crossing against the DON’T WALK phase (signalized intersections) decreased at 13 of the 17 locations,though jaywalking was unchanged.
These studies show pedestrian behavior to be generally better in the presence of markedcrosswalks. Certainly there is no indication of incautious or reckless pedestrian behavior associated withthe marked crosswalks. What would be of interest, however, would be a study of pedestrian behavior atthe kind of high ADT multilane facility where crashes at marked crosswalks were significantly higherthan at unmarked. A study under those circumstances might not be advisable, however. It should benoted that the study by Zegeer and colleagues found that much of the increase in pedestrian crashes atmarked crosswalks on multilane roads (above 10,000 ADT) involved “multiple-threat” crashes, where avehicle stops in the curb lane to let a pedestrian cross and the pedestrian steps into the street and is struckby a vehicle in the adjacent lane (whose view of the pedestrian is blocked by the stopped vehicle). Someagencies have used an advance stop bar with the sign STOP HERE FOR PEDESTRIANS to improvesight distance (i.e., when stopping vehicles stop further back from the crosswalk) and reduce the risk ofthis type of crash.

65
MOTORIST BEHAVIOR
Motorist behavior changes at marked (vs. unmarked) crosswalks, have been studied by looking atspeed (with and without pedestrians present), yielding, and other factors.
In 1998, Knoblauch reported results of speed measurements at six locations before and aftercrosswalk markings were applied. Some measurements were made with no pedestrians present, somewith a pedestrian present and looking at traffic (the pedestrian was a member of the research team) andanother condition in which the pedestrian approached and stood at the edge of the curb, looked straightacross the road and not at traffic. The results were not clear-cut. Traffic behavior at the sites was notconsistent. One site showed a considerably slower speed after the markings were painted even though nopedestrian was present. This speed change was unexpected and could not be explained; such changeswere not seen at other crossings.
When the pedestrian was present and looking at traffic, the result summed over all six sites was asmall speed decrease of less than 1 kph (.6 mph), which was not statistically significant. However, onesite showed a significant decrease in speed and one showed a significant increase. The author pointed outthat given the overall speed of the vehicles and the point at which the measurements were taken, areasonable driver would assume that a pedestrian looking at traffic would not begin to cross. The driverwould therefore see no need to slow down.
When the driver was present and not looking, however, overall the speeds were about 4 kph (2.5mph) lower after the markings were applied; a statistically significant change. The author concluded thatdrivers are aware of and respond to the crosswalk markings in most cases, particularly when a pedestrianis present but does not look toward the motorist.
In a 1999 study, Knoblauch and colleagues observed motorist behavior to address two questions:
1. Did crosswalk markings affect the ways drivers respond to pedestrians? The differences weresmall, but drivers appear to drive slightly slowly when approaching a pedestrian in a markedcrosswalk compared to one that is unmarked.
2. Might crosswalk markings disrupt vehicle flow by causing drivers to stop and yield topedestrians? No change was observed. Drivers were neither more nor less likely to yield topedestrians in a marked crosswalk than they had been when the crosswalk was not marked. Itshould be mentioned that all sites used in Knoblauch’s 1999 study were two or three lanes(no four-lane roads) and all had speed limits of 56-64 kph (35 or 40 mph).
Ekman reported in 1988 that motorists in Sweden did not reduce their speeds when approachingzebra crossings. Insofar as this study measured vehicle speed when no one was present in the crosswalkor at the curb, one might expect speed to change little or not at all.
In another 1996 Swedish study, Varhelyi measured motorist behavior at non-signalized zebracrossings. He reported that in 73 percent of "critical" cases, the vehicle maintained or even increasedspeed and in only 27 percent of cases did they slow down as required. Despite what the motoristsactually do, it was found in a separate survey that motorists in 67 percent of the cases say they "always"or "very often" slow down.
In 1992, Van Houten studied factors that might influence motorists to yield for pedestrians inmarked crosswalks. He measured several behaviors at intersections in Dartmouth, Nova Scotia, where aseries of interventions was sequentially introduced to increase the vividness of crosswalks. First signs

66
were added, then a stop line, and then amber lights activated by pedestrians and displayed to motorists. The percentage of vehicles stopping when they should do so increased by amounts up to 50 percent. Conflicts dropped from 50 percent to about 10 percent at one intersection and from 50 to about 25 percentat another. The percentage of motorists who yielded increased from about 25 percent up to 40 percent atone intersection and from about 35 to about 45 percent at another.
Malefant and Van Houten studied in 1989 ways to increase the percentage of drivers who yield topedestrians. An experiment was conducted in St. John's, Newfoundland, and Fredericton andMoncton-Dieppe, New Brunswick, Canada. Countermeasures included additional markings, feedback tothe pedestrians as to compliance, warning signs for motorists, and enforcement. Associated with thesemultiple interventions were large increases in the proportion of motorists who yielded to pedestrians,ranging from 50 percent (before) to 70 percent (after) in one city; from 10 to 60 percent in another, andfrom 40 to 60 percent in the third.
In 1975, Katz et al. carried out an experimental study of driver-pedestrian interaction when thepedestrian crossed. The pedestrians in question were members of the study team and they crossed under avariety of conditions in 960 trials. It was found that drivers stop for pedestrians more often when thevehicle approach speed is low, when the pedestrian is in a marked crosswalk, when the distance betweenvehicle and pedestrian is greater rather than less, when pedestrians are in groups, and when the pedestriandoes not make eye contact with the driver.
Cynecki and Associates, 1993 reported the results after rumble strips were installed in advance ofmarked crosswalks. The strips were placed at 19 uncontrolled locations. After installation, there waslittle change in vehicle speed. The authors also reported that 85th percentile speeds showed essentially nochange. Presumably most of the time when the motorist encountered the rumble strip, the markedpedestrian crosswalk ahead would have been empty.
Assessment of Literature
It appears that there is a greater crash risk associated with marked crosswalks alone (i.e., if noother substantial improvement also is present) on multi-lane facilities with ADT greater thanapproximately 10,000. Otherwise, it appears that marking a crosswalk has no clear effect one way oranother on pedestrian crashes. The apparent large negative effect reported by earlier authors disappearson two-lane roads and multi-lane roads having ADT’s below approximately 10,000. The pedestrianbehavior hypothesized to account for the negative results was not observed under the circumstancesdiscussed.
Alternative Crossing Treatments
Innovative approaches to pedestrian crossing protection were tested in Detroit, MI (Malo et al.,1971). Combinations of signing, marking, lighting, and pedestrian signal actuation were installed. Thealternative configurations included overhead signs with internal illumination, flashing beacons, andpedestrian signals.
Thirteen sites were chosen on the basis of poor crash records and/or judgment that indicated anunusual hazard. Implementation of the devices was preceded by a considerable educational and publicityeffort by the Traffic Safety Association of Detroit, using leaflets, demonstration installations, pressreleases, and other public information methods. Field measurements included approach speeds, gaps,volumes, driver response (slowing), pedestrian attributes, gap acceptance, and behavior. In addition to the engineering studies, opinion surveys were conducted of both pedestrians and drivers as well asevaluations by experts.
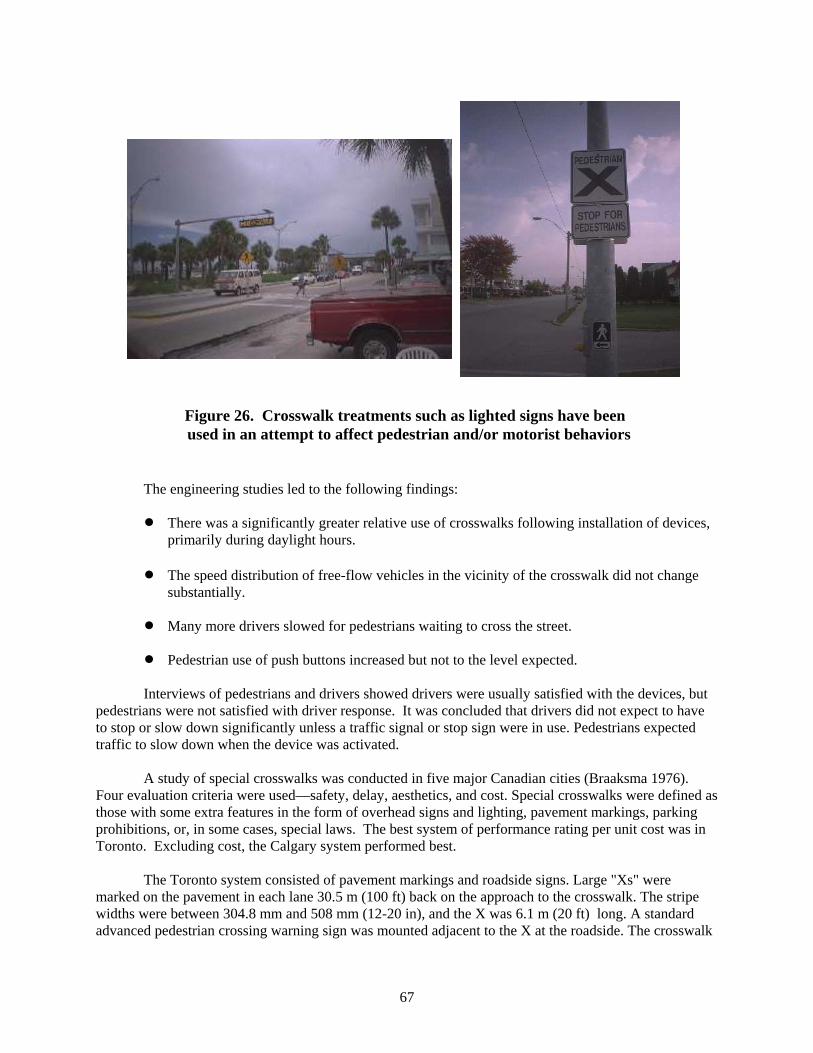
67
Figure 26. Crosswalk treatments such as lighted signs have been used in an attempt to affect pedestrian and/or motorist behaviors
The engineering studies led to the following findings:
! There was a significantly greater relative use of crosswalks following installation of devices, primarily during daylight hours.
! The speed distribution of free-flow vehicles in the vicinity of the crosswalk did not change substantially.
! Many more drivers slowed for pedestrians waiting to cross the street.
! Pedestrian use of push buttons increased but not to the level expected.
Interviews of pedestrians and drivers showed drivers were usually satisfied with the devices, butpedestrians were not satisfied with driver response. It was concluded that drivers did not expect to haveto stop or slow down significantly unless a traffic signal or stop sign were in use. Pedestrians expectedtraffic to slow down when the device was activated.
A study of special crosswalks was conducted in five major Canadian cities (Braaksma 1976). Four evaluation criteria were used—safety, delay, aesthetics, and cost. Special crosswalks were defined asthose with some extra features in the form of overhead signs and lighting, pavement markings, parkingprohibitions, or, in some cases, special laws. The best system of performance rating per unit cost was inToronto. Excluding cost, the Calgary system performed best.
The Toronto system consisted of pavement markings and roadside signs. Large "Xs" weremarked on the pavement in each lane 30.5 m (100 ft) back on the approach to the crosswalk. The stripewidths were between 304.8 mm and 508 mm (12-20 in), and the X was 6.1 m (20 ft) long. A standardadvanced pedestrian crossing warning sign was mounted adjacent to the X at the roadside. The crosswalk
68
was marked no less than 2.44 m (8 ft) wide with two 152.4-mm to 203.2-mm (6-8 in) stripes, 2235.2 mm(88 in) apart, delineating each side of the crosswalk.
The Calgary system employed a large overhead sign bearing the word PEDESTRIAN with twolarge “Xs” on either side of the word. On either side of the "Xs" were mounted 203.2-mm (8-in) flasherunits. Below the word PEDESTRIAN a smaller flasher was mounted for pedestrian viewing. The flasherswere activated by a pedestrian button having an appropriate sign instructing the pedestrian to push thebutton and cross with caution. Standard crosswalk markings were employed. A sign was post mounted atthe roadside 45.75 m - 76.25 m (150 ft to 250 ft) before each approach, containing the words WHENLIGHT FLASHING-MAXIMUM 20*-DO NOT PASS-HERE TO CROSSWALK. A flasher was placedabove the sign. The flasher was also activated by the pedestrian button.
Before-and-after studies in Toronto showed a marked decline in pedestrian fatalities, althoughtwo hazardous behavior patterns were noted. First, some pedestrians would step off the curb withoutsignaling their intention to cross the roadway; they apparently expected vehicles to stop instantaneously.Second, pedestrians noted that vehicles passed each other just before the crosswalk. The need forconsistent laws regarding crosswalks, pedestrian, and driver education in this regard, and improvedenforcement, were also cited.
Illuminated crosswalk signs were installed and evaluated at 20 locations in Tokyo, Japan, usingbefore-after comparisons of crashes (Accident Prevention Effects, 1969). Findings show both pedestriancrossing–related and other unrelated crashes increased after the installation of the signs by 4.8 and 2.4percent, respectively, in 200-m (218-yd) sections on either side of the installation. Both crash typesincreased 11.4 percent in 50-m (55-yd) sections. It was concluded that the illuminated crosswalk signs didnot seem to be effective in reducing crashes; whether this type of device increases crashes, however, isunclear, as the average annual rate of crash growth on major streets in Tokyo is approximately 24 percent.
Crosswalk Illumination
A two-stage study of floodlighting of pedestrian crossings was conducted in Perth, Australia(Pegrum, 1972). A pilot study showed sufficient success to initiate a broader scale lighting program.Sixty-three sites were studied. The illumination consisted of two floodlights, one on each side of theroadway, on either side of the crosswalk, mounted about 3.66 m (12 ft) from the crosswalk at a height of5.185 m (17 ft), and aimed at a point .915 m (3 ft) above the pavement. The luminaire was a 100-wattsodium lamp. The ambient lighting was not from sodium luminaires. The author found sodiumfloodlighting resulted in a significant decrease in nighttime pedestrian crashes, as shown in table 25.
A combined illumination and signing system for pedestrian crosswalks was developed and testedin Israel (Polus and Katz, 1978). The nighttime crash change at the 99 illuminated study sites and 39unilluminated control sites is shown in table 26 on the following page. The reductions were concluded tobe primarily due to the illumination, since daylight crashes were relatively unchanged. Other threats tovalidity were checked, including changes in pedestrian and vehicle flow, weather differences, andnational crash trends. None of these showed any effect on the results.
________________*The sign indicating “maximum 20" refers to kph.

69
Table 25. Crash effects of providing sodium floodlights at pedestrian crossings (Perth, Australia).
Crashes Involving Pedestrian Crashes Vehicles Alone Day Night Total Day Night Total
Pilot Test: 6 crossings5 years before 19(1) 7(1) 26(2) 5 1 65 years after 21(1) 2 23(1) 9 0 9
Follow On Test: 57 additional crossings2 years before 57(2) 32(1) 89(3) 19 2 212 years after 58(2) 13(1) 71(3) 18(1) 1 19(1)
Fatalities shown in parentheses.Source: Pegrum, 1972.
Table 26. Effects of crosswalk illumination on pedestrian crashes (Israel).
Number of Night Crashes
Before After
Illuminated Sites 28 16
UnilluminatedControl Sites 10 16
Source: Polus and Katz, 1978
A study in Philadelphia assessed the impacts of installing improved lighting at seven sites(Freedman et al., 1975). The impacts were evaluated on the basis of behavior as measured for 728pedestrians and 191 drivers at the 7 study sites and 7 control sites. The study sites were high-crashlocations, while the control sites were low-crash locations. The illumination improvement consisted of90-watt low-pressure sodium lamps. Each system was controlled by a photocell that energized the circuitat sundown and turned it off at sunrise. Experimenter override was possible.
The evaluation was conducted using two primary comparisons of pedestrian attribute changes.One approach used five basic factors—search behavior, crossing path, concentration, erratic behavior, andclothing brightness. The results of comparing the five basic factors before and after lightingimprovements showed that "perceived clothing brightness" increased significantly on the basis of allcomparisons for high-crash locations with the installation of the special illumination. Observers searchingthe street in a fashion similar to drivers perceived the general appearance of pedestrians as brighter. Therewas significant improvement in the apparent concentration of pedestrians to the crossing task at allsignalized locations. Search behavior was found to improve significantly under all conditions. Driversappeared more aware of approaching hazardous crosswalks when the illumination was present. It shouldbe noted that the crash data changes in both groups moved as if toward the mean, consistent with whatwould be expected since one group consisted of high-crash sites and the other low-crash sites. However,the behavioral measures should not have been influenced by regression to the mean.

70
Barriers, Signals, and Signage to Restrict Pedestrian Movements
Median Barriers
As part of a test of various countermeasures, median fence barriers were installed at two sites(Washington, D.C., with a 1.22-m- [4-ft-] high fence, and New York City, with a 1.83-m- [6-ft-) highfence) (Berger, 1975). One site had two gaps at intersecting minor streets. After installation of thebarrier, 61 percent of the pedestrians identified the barrier as the reason for using the crosswalk. Whenasked whether the barrier affected the manner in which they crossed the street, 52 percent stated it had noeffect, while 48 percent indicated the only effect was to force them to cross at the intersection.
Of those who were crossing midblock before the installation, 61 percent did so out ofconvenience. About one-third indicated they would use the crosswalk only if midblock traffic were "veryheavy." After the fence was installed, 32 percent of the 22 pedestrians interviewed who previously mademidblock crossings stated inconvenience as the major factor, with high turning volume at the intersectionas a close second (23 percent). Older pedestrians were generally concerned with the intersection turning-traffic problem. Many cited recent crash experience. Almost one-quarter of those interviewed indicatedthey had walked along the median to the end of the barrier, or an opening, before completing the crossing. While merchants at a control site did not indicate anticipating much effect from a median barrier, 58percent of those at the experimental sites indicated their belief that its major effect was to discouragecustomers from shopping both sides of the street. Most residents accepted the barrier. Only 7 percentwanted it removed. A few complained about inconvenience and its unsightly appearance.
Freeway Barriers
As part of the analysis of freeway pedestrian crashes, attempts were made to estimate themaximum national impact of right-of-way fencing and/or median barriers on freeway crashes if thesepedestrian barriers were employed and were completely effective in controlling crashes identified asrelated to this countermeasure (Knoblauch et al., 1978). The field investigators estimated that 14 percentof freeway pedestrian crashes were susceptible to this countermeasure. One analysis of the crash typesand the contributing factors suggested that these countermeasures could address between 160 and 222 ofthese usually severe nationwide crashes per year.
Roadside/Sidewalk Barriers
Chains, fences, guardrails, and other similar devices have been proposed in several studies as ameans for channelizing and protecting pedestrians (Knoblauch, 1977; Snyder and Knoblauch, 1971;Knoblauch et al., 1978; Model Pedestrian Safety Program, 1987 edition).
Parking meter post barriers were tested at three sites in urban areas (Berger, 1975). All involved use of chains that connected parking meter posts. The barrier was .9 m (3 ft) high and involved 1, 2, or 3chains. In Washington, DC, 6 parking meter post barriers were created on one side of a street, resulting ina series of 3.66-m (12-ft) long single chain sections. In New York City, 19 posts were utilized, 9 on oneside of the street and 10 on the other. These were 3.66-m- (12-ft-) sections with 2 chains. The third sitewas a section of one-way street along which three-chain sections were installed on eight posts. The resultswere mixed. A vandalism problem (stolen chains) interfered with the experiment, a noteworthy concern.Twenty-six percent of those interviewed who crossed at the intersections after the installation mentionedthat a factor in their choice of crossing location was the illegality of crossing elsewhere. Since only 12per- cent had mentioned this before the change, the barriers may have reminded pedestrians that it isillegal to jaywalk. While 65 percent of merchants perceived no negative effects from the countermeasure,15 percent noted interference to street crossing, and 18 percent cited a problem when loading orunloading goods.
71
In London, research was done on a 548.4-m (600-yd) road segment that had been provided withpedestrian barriers on both sides (Jacobs, 1966). The access openings were not directly across from eachother. Pedestrian crossing movements were mapped and crash data were compiled. Crashes during theprevious 8 years were shown as a ratio to 4-hour pedestrian volume, fewer than 20,000 people. Theresult- ing risk ratio was compared with that for 11 other sites in London that did not have pedestrianbarriers. The only significant differences occurred at points within 45.7 m (50 yds) of a signalized intersection (more than twice the risk ratio with the pedestrian barrier) and at other midblock locationswithin 18.28 m (20 yds) of an intersection where controlled crossings were not present and approximately10 times the risk ratio. The overall risk ratio was lower at the test site but was not found to be statisticallysignificant.
The longitudinal path taken by each pedestrian was studied. This was the distance between barrieropenings used to get on and off the roadway, measured parallel to the curb. The results indicate mostpedestrians would cross away from the crosswalk when the longitudinal distance between barrieropenings on either side of the street was less than 9 m (10 yds). It was suggested by the author thatlongitudinal distances between the openings on opposite sides of a street be greater than 9 m (10 yds).
Pedestrian barrier fences were installed along 18 sections of road in Tokyo (Accident PreventionEffects, 1969). Crashes were analyzed before and after the installation. Crashes related to crossingpedestrians declined by nearly 20 percent. An overall 4-percent reduction was observed, including non-pedestrian crashes. It had been thought that even though crashes related to pedestrians’ crossing out ofcrosswalks might decrease, crashes related to pedestrians crossing in the crosswalks might increase. Theresults indicated both types of pedestrian collisions were reduced equally by 20 percent.
Signalization
Signals are widely employed to direct and assist pedestrians at crossings. A study of 30 locationsin Tokyo where pedestrian-activated signals were installed showed that crashes declined by 37.5 percent(Accident Prevention Effects, 1969). Little difference was noted in the severity of crashes between thebefore and after periods. The effective range of the signal influence seems to be between 25-50 m (27-55yds) on either side of the signal. The pedestrian-activated signals were found to be much more effective inreducing night crashes than daylight crashes. Rear-end vehicular crashes, which are usually expected toincrease after signalization, decreased by 12 percent.
Several behavioral studies of pedestrian signals have been conducted in the U.S. Most havefound pedestrian compliance to be poor. One study compared pedestrian crossing behavior at sites withand without standard pedestrian signals (Mortimer, 1973). Observers noted specific behaviors twice ondifferent days. A total of 24 sites in Detroit, MI, were analyzed, 12 of which had pedestrian signals. Morethan 3,200 pedestrians were observed. Illegal starts on amber/DON’T WALK were about 4 percent less atsites with pedestrian signals. The percent arriving at the far side of the green/WALK was 20 percenthigher at the sites with pedestrian signals.
An observational sampling study of pedestrian behavior at a site in Brooklyn, NY, noted any change occurring with the installation of a pedestrian signal (Fleig and Duffy, 1967). A before-after crashanalysis was also performed on 11 additional sites at which pedestrian signals had been installed. Neitherthe behavioral analysis nor the crash analysis showed any significant difference between the before andafter periods.
As part of a behavioral analysis at a variety of intersections in Washington, DC, San Franciscoand Oakland, CA (Petzold, 1977), observations were made of compliance with pedestrian signals at sixintersections. Based on four intersections with pedestrian signals displaying a flashing WALK indication(550 pedestrians) and two intersections having steady WALK indications (139 pedestrians), no difference
72
was observed between flashing and steady WALK signals in terms of pedestrian usage of the cycle. Avery large portion of the users paid little, if any, attention to the pedestrian signal. This same studydemonstrated that few pedestrians understand the meaning of flashing WALK and DON'T WALKpedestrian signals, whereas symbolic pedestrian signalization such as the walking pedestrian and upheldhand offers an improved understanding over word messages. One study showed that, at most, only abouthalf of the pedestrians pressed the button to activate the WALK light (Palamarthy et al., 1994).
A comparison was made in Massachusetts of the behavior of pedestrians at intersections withflashing and solid WALK segments of the pedestrian signals (Sterling, 1974). The sites were controlled by vehicle-actuated signals having a fixed pedestrian phase length. Sites with high pedestrian and traffic volumes were chosen. Pedestrians at the sites with flashing WALK were found to cross in a legal manneronly 29 percent of the time compared with 51 percent who did so at the sites with a steady WALKindication. The percentage of crossings for which a vehicular conflict occurred was 6 percent for thesteady indication and 8 percent for the flashing indication. This difference was statistically significant.
An area-wide, centralized computer-controlled signal system was installed in West London. Theimpact on pedestrian safety and other impacts were studied (Crook, 1970). A significant 5-percentreduction in pedestrian crashes occurred in the experimental area while a 20-percent increase inpedestrian crashes occurred in a comparison (control) area.
Studies in the U.S. and Israel have quantified the effects of pedestrian signals and signal timingon pedestrian crashes. The most comprehensive study involved the collection and analysis of pedestriancrashes, traffic and pedestrian volume, signal timing, roadway geometrics, and other data at 1,297signalized intersections (2,081 total pedestrian crashes) in 15 U.S. cities. The following pedestrian signalstrategies existed (Zegeer et al., 1982, 1983):
! Concurrent (standard) timing allows pedestrians a WALK interval concurrently (parallel) totraffic flow, while vehicles are generally permitted to turn right or left on a green light acrossthe pedestrian’s path. These represented 658 intersections, or over 50.7 percent of the sample,and is by far the most common type of pedestrian signal timing in the U.S.
! Exclusive timing refers to a pedestrian signal timing where pedestrians are given an exclusiveinterval each signal cycle while traffic is stopped in all directions. "Scramble" or "BarnesDance" timing is exclusive timing where pedestrians are also permitted to cross the streetdiagonally. There were 109 such intersections, or 8.4 percent of the total, in the database.
! Other timing patterns include early release, where pedestrians are given a head start in thecycle before motor vehicles are permitted to turn behind pedestrians. Late-release timingholds pedestrians until motor vehicles make their right (and/or left) turns before pedestriansare allowed to cross. Only 22 intersections, or 1.7 percent of the total, had one of these timingpatterns.
! Pedestrian signal indications were not present at 508, or 39.2 percent, of the sampleintersections.
The study found that the factors significantly related to increased pedestrian crashes includehigher pedestrian and traffic volumes, street operation (two-way streets have higher pedestrian crashesthan one-way streets), wider streets, higher bus use, and greater percentage of turning movements. Thepresence of concurrently timed pedestrian signals had no significant effect on pedestrian crashes whencompared with intersections with traffic signals alone. Sites with exclusive pedestrian signal timing hadsignificantly lower pedestrian experience (about half as many) as sites with either standard timing or with

73
no pedestrian signals. This exclusive timing scheme was effective, however, only at intersections withmore than 1,200 pedestrians per day. The authors controlled for pedestrian volume, traffic volume,intersection geometrics, and other factors in their analysis. A summary of results for various signal timingschemes is given in table 27.
Of possible relevance to the issue of early or late release timing is a study of pedestrian trafficconflicts at T intersections (Lord, 1996). This study confirmed earlier work that showed more pedestrianconflicts with left-turning vehicles at T intersections than at standard X intersections. Because left-turning traffic at T intersections has no oncoming vehicle traffic to cause a delay, the driver can initiatethe turn immediately and may intercept a pedestrian who starts at the same time. At an X intersection,left-turning traffic may have to wait for oncoming vehicle traffic to pass, which may amount to an earlyrelease for the pedestrians.
Zegeer and colleagues (1982, 1983) cite these explanations for the possible lack of effectivenessof concurrent signal timing:
! The possibility that many pedestrians of pedestrians misunderstand pedestrian signalmessages, such as the flashing DON'T WALK (i.e., pedestrian clearance interval meaningdon't start, but finish crossing if already in the street)
! The false sense of security that some pedestrians may have regarding the WALK interval(e.g., they sometimes incorrectly believe that a WALK interval protects them by stoppingtraffic in all directions including turns, such as with exclusive signal timing)
! Poor compliance by many pedestrians to pedestrian signals in the 15 test cities (65.9 percentof pedestrians were found to begin crossing during the flashing or steady DON'T WALK at64 intersection approaches)
! Reluctance by many pedestrians to activate the push-button pedestrian signals (e.g., the studyfound that 51.3 percent of all crossing pedestrians pushed the button to activate the signal)
The study concluded that highway agencies should not indiscriminately install pedestrian signalsat all traffic signalized locations. Instead, the cost of pedestrian signals should be weighed against theireffectiveness at a given location. On the other hand, the authors cite a need for pedestrian signals at somesignalized locations (e.g., within established school crossings, wide street crossings, or where vehiclesignals are not visible to pedestrians) as discussed in the Manual on Uniform Traffic Control Devices(1988).
In a 1987 study from Israel by Zaidel and Hocherman, pedestrian crashes were used to comparethe safety of various types of pedestrian signal options at signalized intersections in Tel Aviv, Jerusalem,and Haifa. These included sites with a concurrently-timed pedestrian signal, an exclusively timedpedestrian interval, and no pedestrian control. Extensive control data were collected for use in theanalysis.
A total of 1,310 pedestrian crashes and 5,132 vehicle crashes were analyzed at 320 intersections.The factors most strongly associated with higher pedestrian crashes include increased pedestrian andtraffic volume and greater intersection complexity (as evidenced by number of intersection legs ornumber of conflict points). The type of pedestrian crossing provision was found to have only a slighteffect on pedestrian crashes, and no effect on vehicle injury crashes, particularly where vehicle volumeswere relatively low (i.e., less than 18,000 vehicles per day). Exclusively timed pedestrian signals showedevidence of crash reduction where high vehicle and pedestrian volumes existed.

74
Table 27. Summary of effects of pedestrian signal timing on pedestrian crashes.
ComparisonDependentVariable
Adjusted Means(Sample Sizes in
Parentheses)Control Variables
SignificantDifference (atthe 0.05 level)
Level ofSignificance
1. All Ped. Signal Alternatives
A. Mean Pedestrian Crashes per Year
No Ped. Signal: 0.36 (508)Concurrent: 0.40 (658)Exclusive: 0.22 (109)Other: 0.38 (22)
Pedestrian Volume (AADT)Total Traffic Volume (AADT)Street Operation (One-Way/Two-Way)Ped. Signal Alternatives
Yes 0.001
B. Mean Pedestrian Turning Crashes per Year
No Ped. Signal: 0.13 (508)Concurrent: 0.17 (658)Exclusive: 0.01 (109)Other: 0.20 (22)
Pedestrian Volume (AADT)Total Traffic Volume (AADT)Street Operation (One-Way/ Two-Way)Ped. Signal Alternatives
Yes 0.001
2. No Ped. Signal Indication vs. Concurrent Ped. Signal Timing
A. Mean Pedestrian Crashes per Year
No Ped. Signal: 0.36 (508)Concurrent: 0.40 (658)
Pedestrian Volume (AADT)Total Traffic Volume (AADT)Street Operation (One-Way/ Two-Way)Ped. Signal Alternatives
No 0.130
B. Mean Pedestrian Turning Crashes per Year
No Ped. Signal: 0.12 (508)Concurrent: 0.15 (658)
Pedestrian Volume (AADT)Total Traffic Volume (AADT)Street Operation (One-Way/ Two-Way)Ped. Signal Alternatives
Yes 0.048
3. No Ped. Signal Indication vs. Exclusive Ped. Signal Timing
A. Mean Pedestrian Crashes per Year
No Ped. Signal: 0.33 (508)Exclusive: 0.15 (109)
Pedestrian Volume (AADT)Total Traffic Volume (AADT)Street Operation (One-Way/ Two-Way)Ped. Signal Alternatives
Yes 0.001
B. Mean Pedestrian Turning Crashes per Year
No Ped. Signal: 0.11 (508)Exclusive: 0.00 (109)
Pedestrian Volume (AADT)Total Traffic Volume (AADT)Street Operation (One-Way/ Two-Way)Ped. Signal Alternatives
Yes 0.001
4. Concurrent Ped. Signal Timing vs. Exclusive Ped. Signal Timing
A. Mean Pedestrian Crashes per Year
Concurrent Timing: 0.43 (658)Exclusive: 0.27 (109)
Pedestrian Volume (AADT)Total Traffic Volume (AADT)Street Operation (One-Way/ Two-Way)Ped. Signal Alternatives
Yes 0.001
B. Mean Pedestrian Turning Crashes per Year
Concurrent Timing: 0.17 (658)Exclusive: 0.03 (109)
Pedestrian Volume (AADT)Total Traffic Volume (AADT)Street Operation (One-Way/ Two-Way)Ped. Signal Alternatives
Yes 0.001
Source: Zegeer et al., 1983 *Average Annual Daily Traffic (AADT)

75
A 1984 study by Robertson and Carter examined the safety, operational, and cost impacts ofpedestrian signal indications at signalized intersections. The study was based on information obtainedfrom existing literature, an analysis of pedestrian crashes, a delay analysis, and a benefit-cost analysis.The authors concluded that pedestrian signal indications appear to reduce pedestrian crashes at someintersections, have little or no effect at others, and even increase such crashes at other intersections. Also,while the presence of pedestrian signals apparently did not significantly offset pedestrian and vehicledelay, the operation of pedestrian and vehicular signals (i.e., signal timing) had a profound effect ondelay. The authors recommended that further efforts be made to determine intersection conditions foreffective use of pedestrian signals.
As stated above, many pedestrians do not fully understand the meaning of pedestrian signals andmarkings, nor the legal obligations underlying them, and that may explain, in part, the less-than-perfectperformance associated with these devices. A 1995 study by Tidwell and Doyle reported survey resultsbased on data collected in 48 states. The following survey responses were reported:
! 86-94 percent say crossing should be at intersections or marked midblock crossings. ! 92-97 percent understand that motorists should give way to pedestrians in a marked
crosswalk.! 79-87 percent know that RTOR vehicles should yield to pedestrians in the crosswalk.! 59-61 percent did not know that motorists are not obliged to stop when a pedestrian
is waiting on the sidewalk.! 42-46 percent erroneously believe the DON’T WALK signal means return to the original curb.! 47 percent think a WALK signal means there will be no conflict with turning vehicles.
Signing
A variety of pedestrian-related signs are used by state and local agencies. Examples of regulatorysigns include PEDESTRIANS PROHIBITED, WALK ON LEFT FACING TRAFFIC, NOHITCHHIKING, and others. Warning signs for pedestrians include the advance pedestrian crossing sign,school warning sign, and others. Guide signs provide travel information and can direct pedestrians tosidewalks, walkways, hiking trails, overpasses, and other facilities. Criteria for the design and placementof signs are contained in the Manual on Uniform Traffic Control Devices (MUTCD) (1988) andsupplemented by the Traffic Control Devices Handbook, (1988). A 1988 study for the TransportationResearch Board summarizes experiences from 48 state and local agencies regarding traffic and roadwayconditions where certain signs are most (and least) effective (Zegeer and Zegeer, 1988).
An experiment was conducted using a novel flourescent yellow-green sign warning motorists ofpedestrians (Clark et al., 1996). A before-and-after study was done, including a comparison group whereno such sign was deployed. An increase was found in the proportion of vehicles slowing or stopping forpedestrians. However, no decrease was seen in conflict events.
Right Turn on Red
The effects of RTOR on pedestrian safety was investigated in a 1981 study by Preusser andAssociates. Right turn crashes increased from 1.47 percent before RTOR to 2.28 percent of all pedestriancrashes after RTOR went into effect. A common RTOR pedestrian crash resulted when a motorist wasstopped at the intersection looking for approaching vehicles from the left and failed to see a pedestriancrossing from the right side. Directional movements related to RTOR crashes involving pedestrians andbicyclists are illustrated in figure 27. The study concluded that there was a small but clear safety problemfor pedestrians because of RTOR. A 1994 NHTSA report to Congress said that about two-tenths of 1percent of all fatal pedestrian and bike crashes result from RTOR (Compton and Milton, 1994).

76
Figure 27. Directional movements of pedestrians and bicyclists involved in right-turn-on-red crashes.Source: Preusser et al., 1981.
A 1986 study by Zegeer and Cynecki investigated motorist violation rates related to NO TURNON RED (NTOR) signs and resulting pedestrian-vehicle conflicts. Observational data for more than67,000 drivers at 110 intersections were collected at intersections in Washington, DC, Dallas, Austin,Detroit, Lansing, and Grand Rapids. It was found that 3.7 percent of all right-turning motorists at RTOR-prohibited intersections violate the NTOR signs. However, approximately 21 percent violate the NTORsigns if given an opportunity (e.g., first in line at the intersection with no pedestrians in front of them andno vehicle coming from the left). A summary of motorist violations and resulting conflicts at RTOR-prohibited sites is shown in table 28.
According to Zegeer and Cynecki’s findings, approximately 23.4 percent of all RTOR violationsresult in a conflict with a pedestrian. These types of conflicts are summarized in table 29 for the near andfar crosswalks. At intersections where RTOR is allowed, 56.9 percent of motorists fail to make a full stopbefore turning right on red. This compared with 68.2 percent of vehicles that failed to make a completestop at other intersections with stop-sign control. The higher violation rate (i.e., not fully stopping) at stopsign intersections was attributed in part to the greater opportunity for a rolling stop or no stop (because oflower side street volumes and pedestrian activity at stop-sign locations compared with signalizedlocations). Based on locational factors, 30 candidate countermeasures were developed to improvepedestrian safety relative to RTOR.
A follow-up evaluation of promising countermeasures was conducted for RTOR pedestriancrashes. Seven countermeasures were tested at 34 intersection approaches in six U.S. cities on the basis of motorist violations and pedestrian-vehicle conflicts related to RTOR and right turn on green (RTOG).

77
Table 28. Violations and conflicts related to right turn on red.
TotalNumberof Hours
Number ofIntersectionApproaches
Number of RTOR
Maneuvers(No. perHour)
Number of RTORConflicts
(No. per Hour)
Percent of RTOR VehiclesInvolved in Conflict
Number of RTORConflicts Plus
Interactions (No.Per Hour)
Percent of RTOR VehiclesInvolved in Conflicts
or Interactions
CrossStreet
Vehicles
Pedestrians CrossStreet
Vehicles
Pedestrians Total PedestriansPedestrians
PedestriansPlus Cross
Street Traffic
RTOR-AllowedSites
496.7 108 8,507(17.13)
324(0.65)
428(0.86)
3.8 5.0 8.8 792(1.59)
9.3 13.1
RTOR-ProhibitedSites
435.8 91 2,225(5.11)
133(0.31)
135(0.31)
6.0 6.0 12.0 222(0.51)
10.0 16.0
Total Sites 932.5 199 10,732(11.51)
457(0.49)
563(0.60)
4.3 5.2 9.5 1,014(1.09)
9.4 13.7
Source: Zegeer and Cynecki, 1986.

78
Table 29. Summary of traffic conflicts related to right-turn-on-red pedestrian crashes.
Types ofSites
Hours of Data
CollectedType ofConflict
Near Crosswalk Far Crosswalk Total Crosswalks
Conflicts Interactions Totals Conflicts Interactions Totals Conflict Interactions Total
RTOR- Allowed
496.7 RTOG 118(0.24)
161(0.32)
279(0.56)
5,018(10.10)
2404(4.84)
7,422(14.94)
5,136(10.34)
2,565(5.16)
7,701(15.50)
RTOR 151(0.30)
185(0.37)
336(0.67)
277(0.56)
179(0.36)
456(0.92)
428(0.86)
364(0.73)
792(1.59)
Totals 269(0.54)
346(0.70)
615(1.24)
5,295(10.66)
2,583(5.20)
7,878(15.86)
5,564(11.20)
2,929(5.90)
8,493(17.10)
RTOR- Prohibited
435.8 RTOG 181(0.42)
140(0.32)
321(0.74)
5,234(12.01)
2,654(6.09)
7,888(18.10)
5,415(12.43)
2,794(6.41)
8,209(18.84)
RTOR 40(0.09)
44(0.10)
84(0.19)
95(0.22)
43(0.10)
138(0.32)
135(0.31)
87(0.20)
222(0.51)
Totals 221(0.51)
184(0.42)
405(0.93)
5,329(12.23)
2,697(6.19)
8,026(18.42)
5,550(12.74)
2,881(6.61)
8,431(19.35)
Source: Zegeer and Cynecki, 1986.
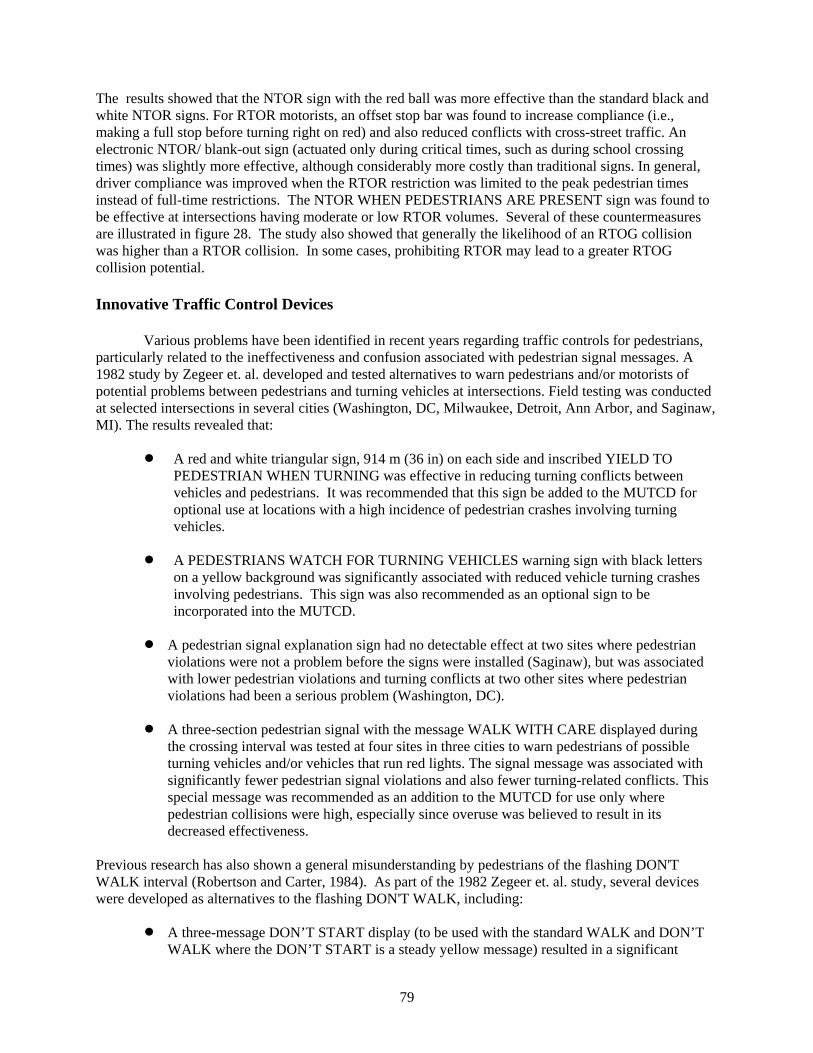
79
The results showed that the NTOR sign with the red ball was more effective than the standard black andwhite NTOR signs. For RTOR motorists, an offset stop bar was found to increase compliance (i.e.,making a full stop before turning right on red) and also reduced conflicts with cross-street traffic. Anelectronic NTOR/ blank-out sign (actuated only during critical times, such as during school crossingtimes) was slightly more effective, although considerably more costly than traditional signs. In general,driver compliance was improved when the RTOR restriction was limited to the peak pedestrian timesinstead of full-time restrictions. The NTOR WHEN PEDESTRIANS ARE PRESENT sign was found tobe effective at intersections having moderate or low RTOR volumes. Several of these countermeasuresare illustrated in figure 28. The study also showed that generally the likelihood of an RTOG collisionwas higher than a RTOR collision. In some cases, prohibiting RTOR may lead to a greater RTOGcollision potential.
Innovative Traffic Control Devices
Various problems have been identified in recent years regarding traffic controls for pedestrians,particularly related to the ineffectiveness and confusion associated with pedestrian signal messages. A1982 study by Zegeer et. al. developed and tested alternatives to warn pedestrians and/or motorists ofpotential problems between pedestrians and turning vehicles at intersections. Field testing was conductedat selected intersections in several cities (Washington, DC, Milwaukee, Detroit, Ann Arbor, and Saginaw,MI). The results revealed that:
! A red and white triangular sign, 914 m (36 in) on each side and inscribed YIELD TOPEDESTRIAN WHEN TURNING was effective in reducing turning conflicts betweenvehicles and pedestrians. It was recommended that this sign be added to the MUTCD foroptional use at locations with a high incidence of pedestrian crashes involving turningvehicles.
! A PEDESTRIANS WATCH FOR TURNING VEHICLES warning sign with black letterson a yellow background was significantly associated with reduced vehicle turning crashesinvolving pedestrians. This sign was also recommended as an optional sign to beincorporated into the MUTCD.
! A pedestrian signal explanation sign had no detectable effect at two sites where pedestrianviolations were not a problem before the signs were installed (Saginaw), but was associatedwith lower pedestrian violations and turning conflicts at two other sites where pedestrianviolations had been a serious problem (Washington, DC).
! A three-section pedestrian signal with the message WALK WITH CARE displayed duringthe crossing interval was tested at four sites in three cities to warn pedestrians of possibleturning vehicles and/or vehicles that run red lights. The signal message was associated withsignificantly fewer pedestrian signal violations and also fewer turning-related conflicts. Thisspecial message was recommended as an addition to the MUTCD for use only where pedestrian collisions were high, especially since overuse was believed to result in itsdecreased effectiveness.
Previous research has also shown a general misunderstanding by pedestrians of the flashing DON'TWALK interval (Robertson and Carter, 1984). As part of the 1982 Zegeer et. al. study, several deviceswere developed as alternatives to the flashing DON'T WALK, including:
! A three-message DON’T START display (to be used with the standard WALK and DON’TWALK where the DON’T START is a steady yellow message) resulted in a significant
80
Figure 28. Examples of treatments that have been tested to reducepedestrian crashes related to right-turn-on-red (RTOR) motorists.

81
Figure 29. These innovative pedestriancrossing signs had mixed results.
reduction in pedestrian violations and conflicts compared with the flashing DON’T WALKwithout the DON’T START message. This finding prevailed at three of four test sites. It’sfurther testing was recommended for possible eventual adoption nationwide.
! A steady DON'T WALK message for the clearance and pedestrian prohibition intervalsprovided no improvement over the flashing DON'T WALK interval and was notrecommended.
An illustration of some of these innovative traffic control alternatives is shown in figure 29.
Huang, Zegeer, and Nassi conducted an evaluation of innovative pedestrian signs at unsignalizedlocations in conjunction with marked crosswalks to improve the crosswalk visibility and increase thelikelihood that motorists would yield to pedestrians. Their study evaluated three such devices: (1) anoverhead CROSSWALK sign in Seattle, WA; (2) pedestrian safety cones with the message, “STATELAW - YIELD TO PEDESTRIANS IN CROSSWALK IN YOUR HALF OF ROAD” in NY State andPortland, OR; and (3) pedestrian-activated “STOP FOR PEDESTRIAN IN CROSSWALK” overheadsigns in Tucson, AZ. The signs were used under different traffic and roadway conditions.
The New York cones and Seattle signs were effective in increasing the number of motorists whostopped for pedestrians. At one location in Tucson, the overhead sign increased instances of motorists’yielding to pedestrians. The signs in Seattle and Tucson were effective in reducing the number ofpedestrians who had to run, hesitate, or abort their crossing. None of the treatments had a clear effect onwhether people crossed in the crosswalk.
The authors concluded that these devices by themselves cannot ensure that motorists will slowdown and yield to pedestrians, and that it is essential to use such devices together with education andenforcement. Finally, the authors recommended that traffic engineers should use other measures,including designing “friendlier” pedestrian environments at the outset.
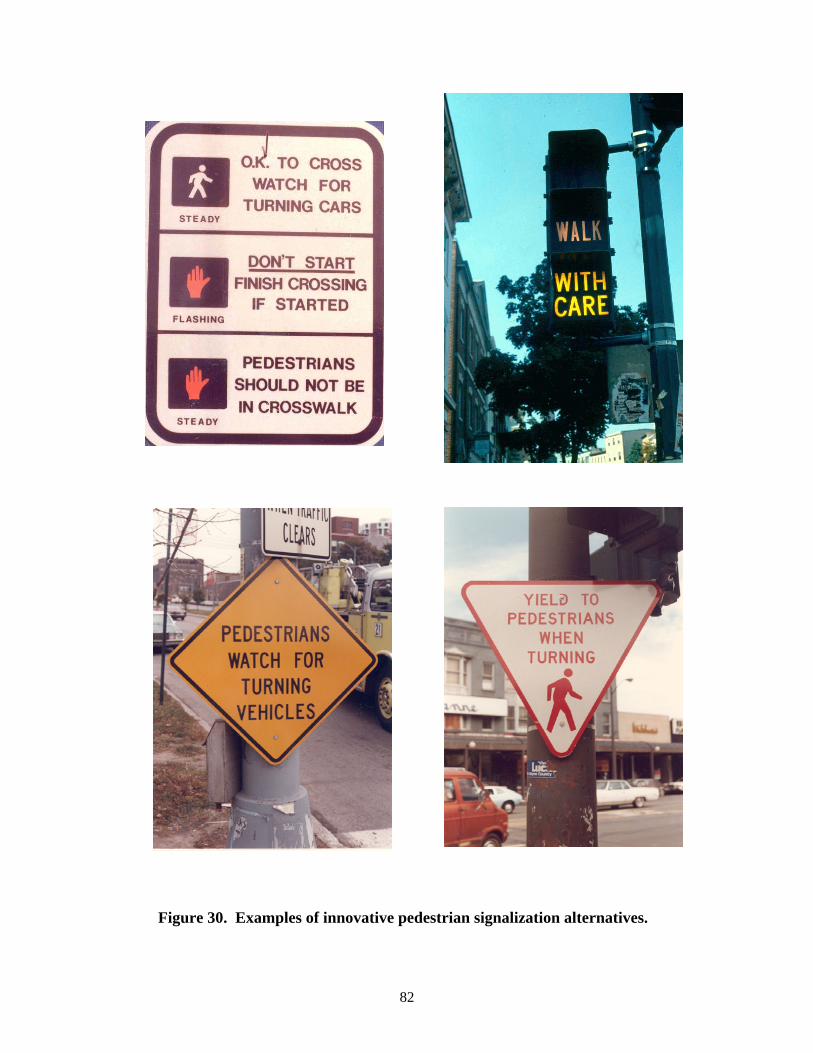
82
Figure 30. Examples of innovative pedestrian signalization alternatives.

83
Figure 31. The Clearwater pedestrian crossingtreatment resulted in a positive influence onpedestrian and driver behavior.
A novel overhead illuminated crosswalk sign and high-visibility ladder style crosswalk wereevaluated in Clearwater, FL by Nitzburg and Knoblauch (2000) using an experimental/control design. The effect of the novel treatments on driver and pedestrian behavior was determined. A significant 30-40percent increase in daytime driver yielding behavior was found. A smaller (8 percent) and insignificantincrease in nighttime driver yielding behavior was observed. A large (35 percent) increase in crosswalkusage by pedestrians was noted along with no change in pedestrian overconfidence, running, or conflicts. It was concluded that the high-visibility crosswalk treatments had a positive effect on pedestrian anddriver behavior on the relatively narrow low-speed crossings that were studied. Additional work wasrecommended to determine whether they also have a desirable effect on wider roadways where speeds aregreater.
At many intersections, pedestrians must push buttons to activate the WALK phase. However,they often do not know whether the button has been pressed and whether it is functional. If the WALKphase does not appear soon after the button has been pressed, they may believe that it does not work andstart crossing early, while the steady DON’T WALK is still being displayed. When a pedestrian pressesan illuminated push button, a light near the button turns on, indicating that the WALK phase has beenactivated and will appear. Huang and Zegeer conducted in 2000 a study to evaluate the effects ofilluminated push buttons on pedestrian behavior. In general, illuminated push buttons did not have astatistically significant effect on how often the pedestrian phases were activated, how many peoplepushed the button, how many people complied with the WALK phase, or such pedestrian behaviors asrunning, aborted crossings, and hesitation before crossing. Only 17 and 13 percent of pedestrians pushedthe button in the “before” and “after” periods, respectively. In both the before and after periods, someonepushed the button in 32 percent of signal cycles with pedestrians. The majority of pedestrians (67.8percent with, and 72.3 percent without illuminated push button) who arrived when parallel traffic had thered and who pushed the button complied with the WALK phase.
Automated pedestrian detection systems provide the means to detect the presence of pedestriansas they approach the curb before crossing the street, and then “call” the WALK signal without any actionrequired on the part of the pedestrian. Hughes, Huang, Zegeer, and Cynecki conducted a study todetermine whether automated pedestrian detectors, when used in conjunction with standard pedestrianpush buttons, would result in fewer overall pedestrian-vehicle conflicts and fewer inappropriate crossings

84
Figure 32. Illuminated pedestrianpush buttons were not found to alterpedestrian crossing behavior.
Figure 33. Automatic pedestrian detectorshave been found to significantly reducepedestrian violations of the DON’T WALKindication and reduce pedestrian vehicleconflicts.
(i.e., beginning to cross during the DON’T WALK signal). “Before” and “after” video data werecollected at intersection locations in Los Angeles, CA (infrared and microwave), Phoenix, AZ(microwave), and Rochester, NY (microwave). The results indicated a significant reduction in vehicle-pedestrian conflicts as well as a reduction in the number of pedestrians beginning to cross during theDON’T WALK signal. The differences between microwave and infrared detectors were not significant. Detailed field testing of the microwave equipment in Phoenix revealed that fine tuning of the detectionzone is still needed to reduce the number of false calls and missed calls.

85
Figure 34. Some pedestrians arenot able to cross an intersectionwithin the signal time provided.
Pedestrian Refuge Areas
Some pedestrians cannot cross an intersection within the signal time provided, and somemidblock crossings are too wide for the available gaps. Running across intersections has been shown tobe a common cause of pedestrian crashes. Pedestrian refuge areas between traffic lanes offer a placewhere pedestrians may pause while crossing a multilane street. They also allow pedestrians to cross onedirection of travel at a time. Refuge areas may be delineated by markings on the roadway or raised abovethe surface of the street.
The use of central refuge islands, or medians, for pedestrians is often proposed but seldomstudied. One analysis reports before-after comparisons of personal injury crashes at sites where pedestrianrefuges were installed (Lalani, 1976). "Double-D" shaped islands were installed at 120 sites in London.The installations were in conjunction with other roadway improvements, including anti-skid surfacing, illuminated bollards, bus lanes, and cross-hatch markings. The crash records for comparable before-and-after periods were subjected to statistical tests to determine significant changes. It was found thatprovision of refuges, thought of as a facility for pedestrians, reduced vehicle crashes but increased pedestrian crashes. Significant pedestrian crash reduction at intersections could be identified only wherethe purpose of the refuge was very clearly established, such as: provision of the refuge specifically on thebasis of safety, reinforcement of the refuge with cross-hatch markings, or provision of the refuge forchannelization or vehicular traffic. For single refuges not at junctions, it was possible to identifysignificant reductions in vehicle crashes when the refuges were fitted with fully illuminated bollards. Itwas possible to identify overall significant reductions in crashes where the refuges were provided in thevicinity of active pedestrian areas.
Additional studies do not fully remove the ambiguity cited above. Bowman and Vecellio(1994A, 1994B) reported comparisons of several kinds of medians, including undivided multi-laneroadway, TWLTL, and raised curb medians. Raised curb facilities seem to be associated with lower pedestrian crash rates, as might be expected. But the authors say, “ . . . it appears that both raised andTWLTL medians significantly reduce the number and severity of vehicular crashes . . . . The literaturedid not provide a conclusive indication that medians improved pedestrian safety,” (Bowman and Vecellio,1994B, p. 186).
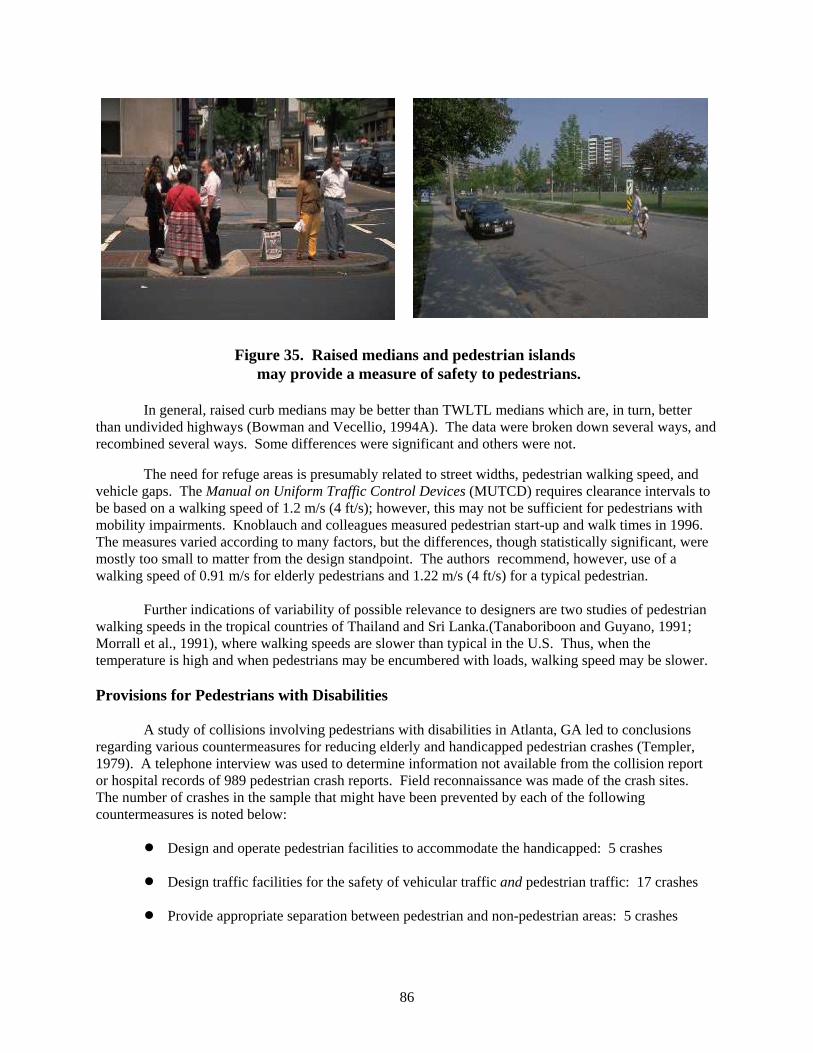
86
Figure 35. Raised medians and pedestrian islands may provide a measure of safety to pedestrians.
In general, raised curb medians may be better than TWLTL medians which are, in turn, betterthan undivided highways (Bowman and Vecellio, 1994A). The data were broken down several ways, andrecombined several ways. Some differences were significant and others were not.
The need for refuge areas is presumably related to street widths, pedestrian walking speed, andvehicle gaps. The Manual on Uniform Traffic Control Devices (MUTCD) requires clearance intervals tobe based on a walking speed of 1.2 m/s (4 ft/s); however, this may not be sufficient for pedestrians withmobility impairments. Knoblauch and colleagues measured pedestrian start-up and walk times in 1996. The measures varied according to many factors, but the differences, though statistically significant, weremostly too small to matter from the design standpoint. The authors recommend, however, use of awalking speed of 0.91 m/s for elderly pedestrians and 1.22 m/s (4 ft/s) for a typical pedestrian.
Further indications of variability of possible relevance to designers are two studies of pedestrianwalking speeds in the tropical countries of Thailand and Sri Lanka.(Tanaboriboon and Guyano, 1991;Morrall et al., 1991), where walking speeds are slower than typical in the U.S. Thus, when thetemperature is high and when pedestrians may be encumbered with loads, walking speed may be slower.
Provisions for Pedestrians with Disabilities
A study of collisions involving pedestrians with disabilities in Atlanta, GA led to conclusionsregarding various countermeasures for reducing elderly and handicapped pedestrian crashes (Templer,1979). A telephone interview was used to determine information not available from the collision reportor hospital records of 989 pedestrian crash reports. Field reconnaissance was made of the crash sites. The number of crashes in the sample that might have been prevented by each of the followingcountermeasures is noted below:
! Design and operate pedestrian facilities to accommodate the handicapped: 5 crashes
! Design traffic facilities for the safety of vehicular traffic and pedestrian traffic: 17 crashes
! Provide appropriate separation between pedestrian and non-pedestrian areas: 5 crashes

87
! Use traffic engineering measures to ensure each street is used for its intended purpose: 2crashes
! Provide a safer school trip for young pedestrians: 3 crashes
! Encourage parents to take more responsibility for the supervision and education of theirchildren in pedestrian safety: 24 crashes
! Provide information to school children and safety personnel about safe and proper pedestrianbehavior: 17 crashes
! Provide information to elderly people about safe and proper pedestrian behavior: 11 crashes
! Prosecute drivers for repeated violations of traffic regulations: 14 crashes
! Keep the pedestrian environment clean and free from debris: 2 crashes
! Remove objects that obstruct visibility between drivers and pedestrians: 3 crashes
! Provide information about the dangers of alcohol overconsumption : 1 crash
In addition to those crashes analyzed for Atlanta, the same study sampled reactions toenvironmental hazards by handicapped people in five U.S. cities. Four elements of the pedestrian systemwere identified as accounting for 81 percent of the crashes they reported:
Walks and corridors 36 percentStreets and crosswalks 17 percentCurbs and curb ramps 11 percentStairs 17 percent
Countermeasures for Pedestrians with Vision Impairments
Crossing the street is a major hazard for people with vision impairments. A non-visual system toassist the vision-impaired has two distinct aspects, according to Hulscher (1975).
! Making the person with vision impairments aware of any special facility so it can be usedproperly
! Conveying the information normally displayed by visual means
From a series of interviews with 10 persons with vision impairments in Washington, DC,Hulscher showed the need for careful consideration of this impairment when widening streets andintersections, or accomplishing other physical changes. Major recommendations by those interviewedincluded:
! Greater separation between vehicle and pedestrian facilities, such as grade-separatedcrossings
! Use of textured pavements! Angular, instead of round, corners (better for directional orientation)! Braille maps at strategic points
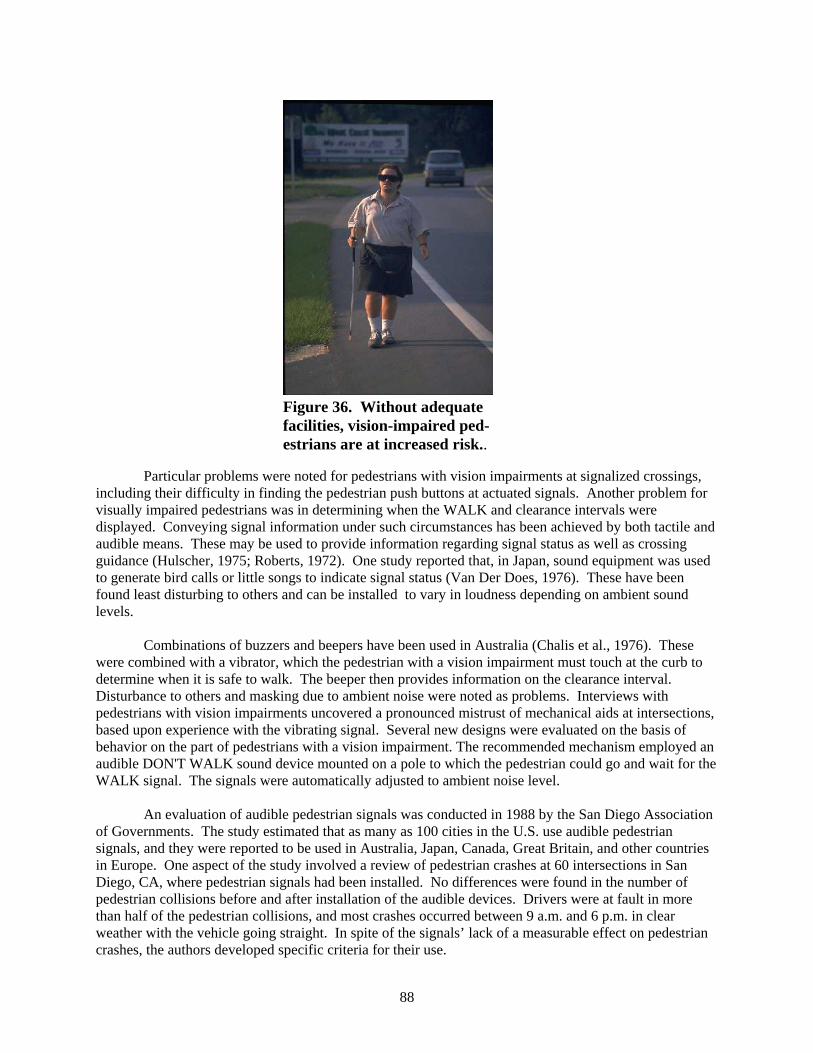
88
Figure 36. Without adequatefacilities, vision-impaired ped-estrians are at increased risk..
Particular problems were noted for pedestrians with vision impairments at signalized crossings,including their difficulty in finding the pedestrian push buttons at actuated signals. Another problem forvisually impaired pedestrians was in determining when the WALK and clearance intervals weredisplayed. Conveying signal information under such circumstances has been achieved by both tactile andaudible means. These may be used to provide information regarding signal status as well as crossingguidance (Hulscher, 1975; Roberts, 1972). One study reported that, in Japan, sound equipment was usedto generate bird calls or little songs to indicate signal status (Van Der Does, 1976). These have beenfound least disturbing to others and can be installed to vary in loudness depending on ambient soundlevels.
Combinations of buzzers and beepers have been used in Australia (Chalis et al., 1976). Thesewere combined with a vibrator, which the pedestrian with a vision impairment must touch at the curb todetermine when it is safe to walk. The beeper then provides information on the clearance interval. Disturbance to others and masking due to ambient noise were noted as problems. Interviews withpedestrians with vision impairments uncovered a pronounced mistrust of mechanical aids at intersections,based upon experience with the vibrating signal. Several new designs were evaluated on the basis ofbehavior on the part of pedestrians with a vision impairment. The recommended mechanism employed anaudible DON'T WALK sound device mounted on a pole to which the pedestrian could go and wait for theWALK signal. The signals were automatically adjusted to ambient noise level.
An evaluation of audible pedestrian signals was conducted in 1988 by the San Diego Associationof Governments. The study estimated that as many as 100 cities in the U.S. use audible pedestriansignals, and they were reported to be used in Australia, Japan, Canada, Great Britain, and other countriesin Europe. One aspect of the study involved a review of pedestrian crashes at 60 intersections in SanDiego, CA, where pedestrian signals had been installed. No differences were found in the number ofpedestrian collisions before and after installation of the audible devices. Drivers were at fault in morethan half of the pedestrian collisions, and most crashes occurred between 9 a.m. and 6 p.m. in clearweather with the vehicle going straight. In spite of the signals’ lack of a measurable effect on pedestriancrashes, the authors developed specific criteria for their use.
89
Tactile strips have been laid down to assist pedestrians with a vision impairment in crossing thestreet. In San Diego, tests at three sites showed tactile guide strips made of epoxy cement and pea gravelto be effective and durable under sustained traffic and weather conditions (Herms et al., 1975). Theyreported no evidence that the raised strip (102 mm [4 in] wide with 6-mm [0.25-in.] gravel) caused anysubsidiary problems for motorists, bicyclists, or other pedestrians. The authors cautioned that these tactilestrips should not be applied on an areawide basis but rather at selected locations of proven need, underjoint supervision of a traffic engineering specialist and a trained mobility expert. This will help insurethat such devices are provided consistently and to warn visually-impaired pedestrians where it isappropriate to do so.
Research was done by Gallon and colleagues on the use and utility of tactile surfaces in the trafficenvironment for people with visual impairments (Gallon et al., 1991; Gallon, 1992). The 1991 reportincluded four study parts:
1. A review of literature, and usage practices current in England during the late 1980s2. A survey of the walking habits of people with visual impairments3. An experimental search among 20 different surfaces for a subset whose members were mutually distinguishable4. An evaluation of how well people with visual impairments could distinguish among the selected surfaces, and how well they learned the intended uses
Five or six surfaces were found to be reliably distinguished, though none was “perfect,” and colordifferences were important for people with some sight. The study also called for training people withvisual impairments and consistent deployment of the various surfaces. In the 1992 study, Gallon reportedthat the selected surfaces posed no problems for those with mobility impairments. In contrast, O’Leary etal. (1995) cite some concerns by people with mobility impairments to the surfaces that assisted peoplewith visual impairments.
Another device for pedestrians with a visual impairment, tested in Japan is a radio receivercarried by the vision-impaired pedestrian to receive information on traffic signal status from the signalinstallation (Van Der Does, 1976). For the color-blind, red and green are most often difficult todistinguish, so blue has been included in the green signal, or replaced green, for easier identification.
These “system” approaches can augment motorist behavior in response to seeing a handicappedpedestrian. In one experiment, a member of the research team crossed traffic with and without carrying acane (Harrell, 1992). Drivers stopped more often when the cane was carried, but even under thiscondition, an average of three cars passed by before one stopped.
Safety Measures for Pedestrians with Hearing Impairments
A survey of 60 people with hearing impairments in Washington, DC, emphasized the visualdimension of travel on foot (Roberts, 1972). These pedestrians indicated the need for better, clearer signsat more appropriate locations; the use of audible crossing signals at various frequencies for the hearingimpaired; more and better lighting facilities along pedestrian routes; and support structures, such ashandrails, at critical locations such as bus boarding areas.
Guides and Manuals for Accommodating Pedestrians with Disabilities
Several published reports, guides, and manuals provide guidance on the selection and use offacilities for pedestrians with physical or mental impairments. For example, Earnhart and Simon in 1987

90
prepared a manual entitled, Accessibility for Elderly and Handicapped Pedestrians - A Manual for Cities,written to provide guidance to planners and other officials in the development of a program for improvedaccessibility. The manual includes information on planning, programing, and design of such facilities,and also provides example problems and solutions along with a checklist that can be used to solve variousproblems. Design details are provided relative to walkways and sidewalks, curb ramps, crosswalks,refuge islands, parking and loading areas, ramps and stairs, handrails, signing, street furniture, lightingand illumination, traffic signals, and tactile surface treatments.
Several FHWA reports address efforts to improve accommodation for elderly and handicappedpedestrians in U.S. cities. They involve the priority accessible network (PAN) approach, which is basedon planning principles designed to provide for the special needs of these pedestrian populations. (Larsen,1984; Hawkins, 1984). The goals of the PAN approach are to:
! Provide continuous accessibility to all desired pedestrian destinations.
! Provide a transportation network tailored to the special needs of all handicapped users (e.g.,wheelchair users, and those with vision impairments).
! Efficiently use resources so the highest priority routes are constructed first.
The PAN process has been applied successfully and documented in, among other cities, Seattle,WA; New Orleans, LA; and Baltimore, MD (Larsen, 1984; Hawkins 1984; Zegeer and Zegeer, 1989). Asummary of the various types of roadway and engineering improvements for elderly and handicappedpedestrians has been documented in a 1989 publication by Zegeer and Zegeer, which discusses the manypossible measures related to traffic signals, sidewalks, signs, and design features.
The FHWA’s two-part Designing Sidewalks and Trails for Access report provides furtherguidance on designing sidewalks and walkways for people with disabilities. Part I: Review of ExistingGuidelines and Practices looks at existing sidewalk and trail conditions for people with disabilities. Byconducting a literature search and site visits around the U.S., the authors compiled data and revieweddesigns to identify factors that affect accessibility for all populations (Axelson et al., 1999). Building onthe foundation of Part I, Part II: Best Practices Design Guide was created to improve understandingamong city planners, urban designers, and transportation engineers with respect to how sidewalks andtrails can be developed to promote pedestrian access for all users, including people with disabilities(Kirschbaum et al., 2001).
Bus Stop Location
Two percent of all pedestrian collisions in urban areas can be classified as pedestrian collisions atbus stops. Most do not involve a pedestrian’s being struck by a bus; rather, the bus creates a visual screenbetween approaching drivers and pedestrians crossing in front of the bus. In rural areas, pedestriancrashes related to school bus stops were identified in 3 percent of all pedestrian crashes. Thecountermeasure proposed for the urban crashes involved bus stop relocation to the far side of theintersections to encourage pedestrians to cross behind the bus instead of in front. This allows thepedestrian to be seen and to see oncoming traffic closest to the bus. To determine the effect of suchrelocation on pedestrian crossing behavior, two studies addressed before-and-after bus stop relocation. One was a site in Miami, FL, on a two-way, four-lane street intersecting with a two-way, two-lane streetat an unsignalized location. The other was in San Diego, CA, on a two-way, four-lane street intersectingwith a one-way, three-lane street at a signalized location that included pedestrian signals (Berger, 1975). The relocation of the bus stops to the far side eliminated the undesired crossing behavior; previously, halfthose crossing after disembarking were crossing in front of the bus.

91
Figure 37. Studies have found that uniformedcrossing guards are safer than other controldevices such as signs or markings alone.
An analysis of pedestrian crashes in Sweden found school bus stops were not located with thegreatest care regarding pedestrian safety factors (Sandels, 1979). They concluded bus stops should belocated:
! So as not to be hidden by vegetation or other obstacles! Away from roadway curves or superelevated locations! To provide adequate standing and playing area for the waiting passengers! So that each location provides maximum sight distance to all critical elements
A U.S. study of crashes involving trips to and from schools investigated the location of schoolbus stops and developed guidelines for planning, routing, and scheduling school buses (Reiss, 1975A).
School Trip Safety
Pedestrian safety dealing with the school trip has received much attention from the public andresearchers. It is therefore treated as a separate entity here, referencing a variety of traffic guidance andcontrol countermeasures.
An inventory of crashes in 1,335 U.S. cities revealed that 25.4 percent of 220 child pedestriandeaths reported for 1967 occurred as the children were en route to or from school (AAA Special Study,1968). Among 1,854 child pedestrian injuries, 18.6 percent took place en route to or from school. Fromthis study, a national estimate was made of 500 fatalities and 11,000 injuries resulting from the walk toschool. The highest proportion of these occur at ages 12 to 14. This is the junior high school age whenthe student is usually without the presence of student crossing controls for the first time. Further analysisshowed about 93 percent of all children involved were struck at locations where no school safety patrols,adult guards, or police officers were stationed. (This study was carried out many years ago and may nowbe out of date.)
An intensive study of the school trip was conducted at sites in New York, Maryland, and Virginia(Reiss, 1975A), surveying both students and drivers. Crashes were also analyzed. The studentsurveys sought information on knowledge, behavior, and possible means for modifying these. Driversurveys sought data regarding perceptions, motivational factors, and reactions to the school zoneenvironment and their correlation to actual behavior.
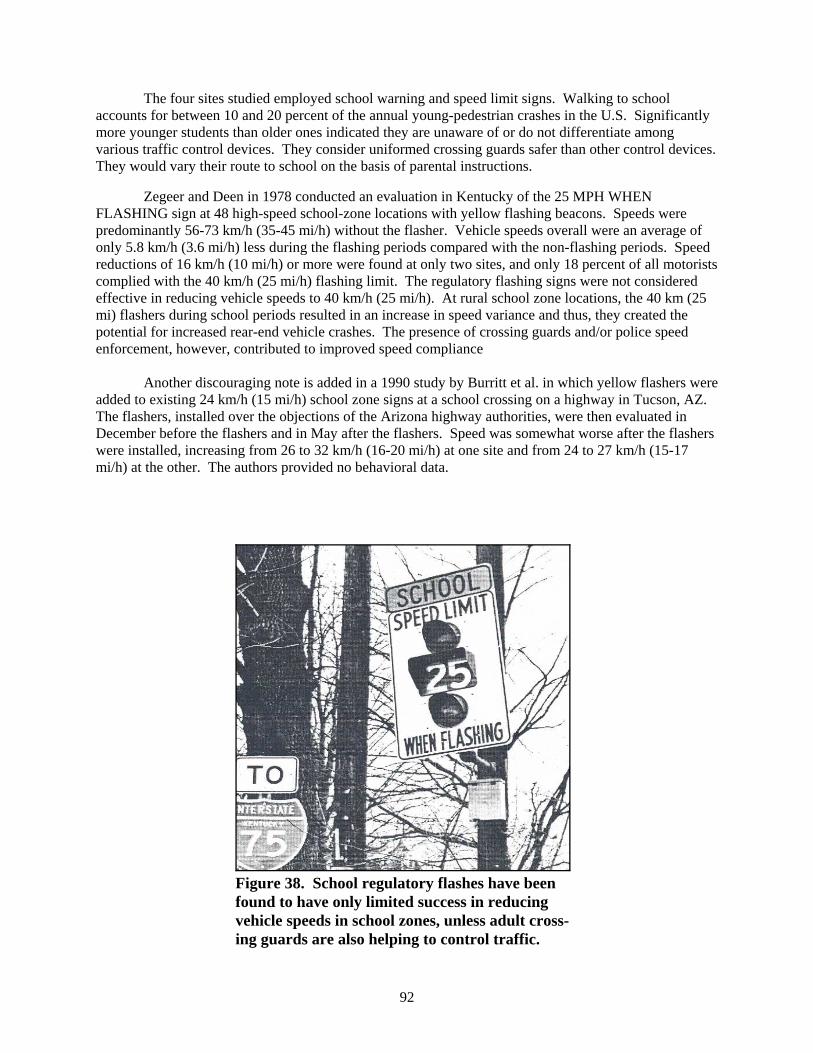
92
Figure 38. School regulatory flashes have beenfound to have only limited success in reducingvehicle speeds in school zones, unless adult cross-ing guards are also helping to control traffic.
The four sites studied employed school warning and speed limit signs. Walking to schoolaccounts for between 10 and 20 percent of the annual young-pedestrian crashes in the U.S. Significantlymore younger students than older ones indicated they are unaware of or do not differentiate amongvarious traffic control devices. They consider uniformed crossing guards safer than other control devices. They would vary their route to school on the basis of parental instructions.
Zegeer and Deen in 1978 conducted an evaluation in Kentucky of the 25 MPH WHENFLASHING sign at 48 high-speed school-zone locations with yellow flashing beacons. Speeds werepredominantly 56-73 km/h (35-45 mi/h) without the flasher. Vehicle speeds overall were an average ofonly 5.8 km/h (3.6 mi/h) less during the flashing periods compared with the non-flashing periods. Speedreductions of 16 km/h (10 mi/h) or more were found at only two sites, and only 18 percent of all motoristscomplied with the 40 km/h (25 mi/h) flashing limit. The regulatory flashing signs were not consideredeffective in reducing vehicle speeds to 40 km/h (25 mi/h). At rural school zone locations, the 40 km (25mi) flashers during school periods resulted in an increase in speed variance and thus, they created thepotential for increased rear-end vehicle crashes. The presence of crossing guards and/or police speedenforcement, however, contributed to improved speed compliance
Another discouraging note is added in a 1990 study by Burritt et al. in which yellow flashers wereadded to existing 24 km/h (15 mi/h) school zone signs at a school crossing on a highway in Tucson, AZ.The flashers, installed over the objections of the Arizona highway authorities, were then evaluated inDecember before the flashers and in May after the flashers. Speed was somewhat worse after the flasherswere installed, increasing from 26 to 32 km/h (16-20 mi/h) at one site and from 24 to 27 km/h (15-17mi/h) at the other. The authors provided no behavioral data.

93
Alternatives to Signalization for School Crossings
A school pedestrian signal design concept has been used with stop signs on the minor approachand traffic signals on the major approach. Some western states have used these devices to create adequatepedestrian crossing gaps across high-speed, high-volume facilities used by school children, the elderly,and/or those with disabilities where full signalization was not warranted.
A 1977 study by Petzold was directed at identifying and evaluating alternatives to fullsignalization at school pedestrian crossings. These crossings were located at the intersection of a high-volume arterial street and a low-volume residential street where traffic gaps are inadequate to allowpedestrians to cross the arterial street safely without an unreasonable delay. These locations would nototherwise warrant full signalization.
The following five school pedestrian crossing designs were selected for field testing atinstallations in six U.S. cities:
! Sign and beacon: Sign and beacon on the major street approach and stop sign on the localresidential street
! Flashing yellow signal and flashing red beacon: Standard traffic signal dwelling in flashingyellow on the major street and a flashing red beacon on the local residential street
! Flashing green signal and stop sign: Standard traffic signal dwelling in flashing green on themajor street and stop signs on the local residential street
! Signal and stop sign: Standard traffic signal dwelling in solid green on the major street andstop sign on the local residential street
! Crossing guard: Crossing guard on the major street and stop signs on local residential street
The five school pedestrian crossing designs were evaluated in a time series, matchedexperimental-control design. Six measures of effectiveness were used: compliance, behavior, andvolume, for both pedestrians and vehicles; vehicle delay; gaps in the major street vehicular traffic stream;and driver understanding. In all experiments, a fully signalized intersection was used as a control site. Based on the data analysis and observations at each school pedestrian crossing design, Petzold (1977)listed the following advantages as compared with full signalization:
! Increased pedestrian compliance with the pedestrian signal
! Reduction in the percentage of vehicles stopping on the major street approach
! Reduction in the stop time per vehicle on the major street approach
! Reduction in installation costs
Disadvantages to the full signal alternatives as found by Petzold include:
! Reduction in both pedestrians' and drivers' understanding of how the traffic control devicesoperate
! Increase in conflicts between vehicles approaching at a right angle (not significant).
94
Based on the comparison between each school pedestrian crossing design and its fully signalizedcontrol site, the authors made these conclusions:
! The sign and beacon design revealed many undesirable characteristics, especially concerningvehicle compliance with the flashing red beacon. It was concluded that full signalization ismore desirable than the beacon and stop sign design
! The flashing yellow signal and flashing red beacon show characteristics similar to thoseobtained at the fully signalized control site. The flashing yellow signal and flashing redbeacon are judged equivalent to full signalization, except full signalization could generatethrough traffic on the minor street approach
! The remaining three school pedestrian crossing designs (crossing guard, signal and stop sign,and flashing green signal and stop sign) were judged to have operating characteristics moredesirable than those measured at the fully signalized control site
Based on the comparison of mean rank scores among the five school pedestrian crossing designs,the crossing guard had significantly better operating characteristics than the beacon and stop sign or theflashing yellow signal and flashing red beacon designs. The crossing guard operating characteristics werenot significantly different from the operating characteristics observed at the signal and stop sign andflashing green signal and stop sign designs.
Reflectorization and Conspicuity
Research has identified reflectorization as a highly effective means of improving visibility (Allenet al., 1969; Hazlett and Allen, 1968; Jacobs, 1968b). In a survey of safety specialists, reflectorizationcountermeasures were identified as having the highest overall rating to reduce school children crashesoccurring during darkness (Reiss, 1975). The key issue is attaining proper usage. A study of reflectorization treatments showed that a person dressed in black wearing a thumb-sized retroreflectivetag is detected at greater distances than a person completely dressed in white (Rumar, 1966). Maintainingthe retroreflective power of the tag was also shown to be important to achieve good results, thushighlighting the need to regularly replace or clean the tag.
A 1984 study by Blomberg et al. investigated countermeasures to improve the conspicuity ofpedestrians and bicyclists. Nighttime field tests were conducted for baseline pedestrians (i.e., wearing awhite tee shirt and blue jeans), compared with pedestrians with dangle tags, a flashlight, jogger's vest, andretroreflective material on head band, wrist bands, belt, and ankle bands (“rings”). On average, the flash-light was detected by a driver at 420.5 m (1,379 ft). This was slightly more than 183 m (600 ft) furtheraway than rings, which were the next best target (at 231.8 m [760 ft]) and jogging vest (227 m [744 ft]),as shown in figure 40. The average detection distance of the baseline pedestrian was 68 m (224 ft).
Owens and Antonoff in 1994 conducted an experiment in which retroreflective materials wereplaced on different body locations. Pedestrians with reflective materials on knees, waist, elbows, andshoulders were seen more readily than when placed on a pedestrian (e.g., chest or back) where nomovement was evident. Authors said “biological motion” was an important part of detection andrecognition. Seen at night, such motions of the reflectorized materials are more pronounced and are morereadily interpreted as characteristic of human motion.
As an engineering countermeasure, retroreflective materials are used for roadway markings suchas crosswalks, stop lines, and lane markings. These materials reflect light from vehicle headlights and from roadway illumination. Reflective vests and other clothing for pedestrians have also been made with

95
Figure 39. Reflectorizationhas been shown to result in amajor increase in the visibilityof a pedestrian at night.
224
532
1379
744 760
105144
316 322
436
0
200
400
600
800
1000
1200
1400
1600
Base Ped Dangle Tags Flashlight Jogging Vest Rings
Target
Feet
DetectionRecognition
Figure 40. Nighttime detection and recognition distance of pedestrians.Source: Blomberg et al., 1984.
reflective materials. Reflectorization has been shown to increase the visibility of a pedestrian by a factorof five. The difficulty is making retroreflective clothing that can last more than a few wash cycles.

96
One-Way Streets as a Pedestrian Crash Countermeasure
A comprehensive study of pedestrian and bicycle crashes in several Canadian cities found fewercrashes on one-way streets in the core of a city than on two-way streets (Lea, 1978). Thus, conversion toa one-way street system may also be a relatively low-cost pedestrian countermeasure, having as high as40-60 percent effectiveness on amenable crashes. However, the applicable crashes were estimated torepresent only about 10 percent of the city total.
A study in Manhattan, NY highlighted the aspects of one-way street grids that tend to providesafer traffic operation (Fruin, 1973). The simplification of the crossing and turning conditions, which hasbeen noted to occur for vehicles at the intersection of two one-way streets, is also helpful to pedestrians. Two-hundred fifty-three pedestrian crashes, occurring over a 5-year period in an 8-by-4 grid, werestudied. Almost 70 percent of these occurred at intersections. Only five fatalities occurred in the areaduring the 5 years; all were males over age 60.
The four crosswalks at each intersection were divided into two groups, two where there was aconflict with a vehicle completing a turn (conflict side), and two with no turning conflict. The results ofthat study showed that crossings on the turning conflict side of the intersection accounted for 69.7 percentof the intersection crashes. This total consisted of 44.7 percent turning crashes, 17.5 percent straightcrashes, and 7.5 percent backup crashes. A pedestrian is more than twice as likely to be struck by avehicle when crossing on the turning conflict side than when crossing on the non-turning conflict side.
Short vehicle and pedestrian counts were taken at the intersections in the study area. While theconclusions were not statistically significant, the results offer some useful perspectives. Although vehicleturning movements averaged only 14 percent of the total intersection volume, turning crashes were almost45 percent of the total. Left-turn crashes exceeded right-turn crashes by a ratio of two to one. The frontleft vehicle window post was suggested as a factor, blocking the driver's view of a critical part of thecrosswalk area. Of course, the left turn is inherently a more complex task for the driver.
In many cases, converting two-way streets to one-way streets may not be justified solely bypedestrian safety considerations. Several concerns such as capacity, traffic circulation, and overall trafficsafety are the major considerations. Vehicle speeds may also increase after conversion from two-way toone-way street patterns. However, one-way streets can greatly simplify the task of crossing a street and insome cases may improve safety for pedestrians.
Pedestrian Overpasses and Underpasses
An analysis was made of reported pedestrian crashes for 6 months before and 6 months after theinstallation of pedestrian overpasses at 31 locations in Tokyo, Japan (Accident Prevention Effects, 1969). The overall results are shown in table 30. The table shows data for 200-m (218-yd) sections and 100-m(109-yd) sections on either side of each site. The “related” crashes (assumed to be pedestrian crossingcrashes) decreased substantially after overpass installation, but non-related crashes (not defined) increasedby 23 percent in the 200-m (218-yd) sections. There was also a greater reduction in daylight pedestriancollisions than in those occurring at night.
The effectiveness of pedestrian overpasses depends largely on the amount of use by pedestrians. A 1965 study by Moore and Older found that use depended on walking distances and convenience of the

97
Figure 41. Expected usage rate of pedestrian bridges and underpasses, relative to time needed to cross at street level.Source: Moore and Older, 1965.
Table 30. Comparison of crashes before and after installation of pedestrian overpasses(Tokyo, Japan).
Type of 200-M Section 100-M SectionsCrashes Before After Reduction Before After Reduction
RelatedCrashes 2.16 0.32 85.1% 1.81 0.16 91.1%
Non-relatedCrashes 2.26 2.77 22.9% 1.65 1.87 -13.7%
Total 4.42 3.09 29.9% 3.46 2.03 41.1%
Source: Accident Prevention Effects, 1969
facility. A convenience measure (R) was defined by the authors as the ratio of the time to cross the streeton an overpass divided by the time to cross at street level. As illustrated in figure 41, the study found thatapproximately 95 percent of pedestrians will use an overpass if the walking time in using the overpass is the same as crossing at street level (i.e., R = l). However, if crossing the overpass takes 50 percentlonger than crossing at street level (R = l.5), almost no one will use the overpass. Usage of pedestrianunderpasses (subway) was not as high as overpasses for similar values of R.

98
Problems have also been identified relative to pedestrians' use of overpasses. A panel of peoplewith disabilities was asked to comment on problems after using three pedestrian overpasses in SanFrancisco, CA (Swan, 1978). The major elements identified as creating a barrier or hazard to the userwith disabilities included:
! Lack of adequate or no railings to protect pedestrians from dropoffs on the bridge approaches
! Greater than acceptable cross slopes
! No level area at terminals of bridge ramps on which to stop wheelchairs before going into thestreet
! Lack of level resting areas on spiral bridge ramps
! Railings difficult to grasp for wheelchair users
! Lack of sight distance to opposing pedestrian flow on spiral ramps
! Use of maze-like barriers on bridge approaches (to slow bicyclists) that create a barrier tothose who use wheelchairs or who are visually impaired
! Lack of sound screening on the bridge to permit people with visual impairments to hearoncoming pedestrian traffic, and otherwise more easily detect direction and avoid potentialconflicts
A study in 1980 by Templer et al. investigated the feasibility of accommodating pedestrians withphysical disabilities on existing overpass and underpass structures. A review of 124 crossing structuresrevealed that 86 percent presented at least one major barrier to the physically handicapped, the mostcommon being:
! Stairs only (i.e., no ramps for wheelchair users) leading to the overpass or underpass! Ramp or pathway to ramp that is too long and steep! Physical barriers along the access paths on structure! Sidewalk on the structure that is too narrow! Cross slope on the ramp that is too steep
Various solutions to these access problems were developed and compared based on cost-effectiveness.
The Americans with Disabilities Act (ADA) law of 1990 has since required the barriers towheelchair users to be removed, requiring more gentle slopes. While these gentle slopes make it easierfor bicyclists and other users, it has also greatly increased the length of ramps, which may discourageusage. Methods such as carefully planned fencing have been used to channel pedestrians to theoverpasses and underpasses to increase usage.
Grade separations such as overpasses and underpasses for pedestrian crossing can be beneficialunder certain circumstances if the pedestrian can be persuaded to use the grade-separated crossing (i.e.,perceive it as safer, convenient). However, they are very costly and may not be used by pedestrians if notplanned properly.

99
Figure 42. Grade-separated crossings can be beneficial topedestrians under certain situations but are very costly andmay not be used by pedestrians if not planned properly.
Traffic Calming
What is Traffic Calming?
At an Institute of Traffic Engineers (ITE) meeting attended by traffic calming experts, thefollowing definition was prepared:
“Traffic calming is the combination of mainly physical measures that reduce thenegative effects of motor vehicle use, alter driver behavior and improveconditions for non-vehicular traffic.” (Lockwood, 1997, page 22)
The need for a definition process grew out of the fact that a variety of activities are called trafficcalming by one person or another. Lockwood (1997) said:
“...traffic calming could mean anything from lowering motor vehicle speeds to anall-encompassing transportation policy.” (page 22) and “... everything fromslowing down motor vehicles to changing tax laws.” (page 24)
According to Lockwood, the term “mainly physical measures” is meant to include the supportingpolitical environment, policy, and legislation. The “negative effect of motor vehicle use” refers tospeeding, neighborhood intrusion, energy consumption, pollution, urban sprawl, etc. Many trafficcalming measures typically create an improved environment for pedestrians by reducing vehicle speeds orvolumes, and/or shortening the crossing distances for pedestrians.

100
Traffic-Calming Measures
Many measures can be considered traffic calming. A 1995 document prepared by the Institute ofTraffic Engineers (ITE) (Kemper and Fernandez, 1994) discusses “neighborhood traffic controlmeasures” and lists 13 types, and other initiatives are not included on the ITE list. :
1. Street closures2. Cul-de-sacs3. Diverters (diagonal or semi-diagonal)4. Traffic circles5. Woonerfs6. Chicanes7. Flares, chokers8. Speed humps9. Speed limit signs and speed zones
10. Speed watch and enforcement programs11. Walkways12. Parking controls13. Other signage
Other measures include traffic diversion, which involves moving traffic onto other streets, whilestill others, such as speed limit signs and enforcement, fall into traditional traffic engineering approaches. Figure 43 illustrates some of the above.
A study in 2000 by Huang and Cynecki evaluated the effects of a variety of traffic-calmingmeasures on pedestrian and motorist behavior at midblock and intersection locations. “Before” and“after” data were collected in Cambridge, MA (bulbouts and raised intersection), Corvallis, OR(pedestrian refuge island), and Seattle, WA (bulbouts). Data were also collected at “treatment” and“control” sites in Durham, NC (raised crosswalks), Greensboro, NC (bulbouts), Montgomery County,MD (raised crosswalks), Richmond, VA (bulbouts), and Sacramento, CA (bulbouts). The key findingsinclude:
! Overall vehicle speeds were often lower at treatment than control sites.
! The combination of a raised crosswalk with an overhead flasher increased the percentage ofpedestrians for whom motorists yielded. It is not known what part of the improvement wasattributable to the raised crosswalk and what part was attributable to the flasher. None of theother treatments had a significant effect on the percentage of pedestrians for whom motoristsyielded.
! The treatments usually did not have a significant effect on average pedestrian waiting time.
! Refuge islands often served to channelize pedestrians into marked crosswalks. The raisedintersection in Cambridge also increased the percentage of pedestrians who crossed in thecrosswalk.
In conclusion, these devices have the potential for improving the pedestrian environment. However, these devices by themselves do not guarantee that all motorists will slow down or yield topedestrians.

101
Figure 43. Illustrative neighborhood traffic control devices.
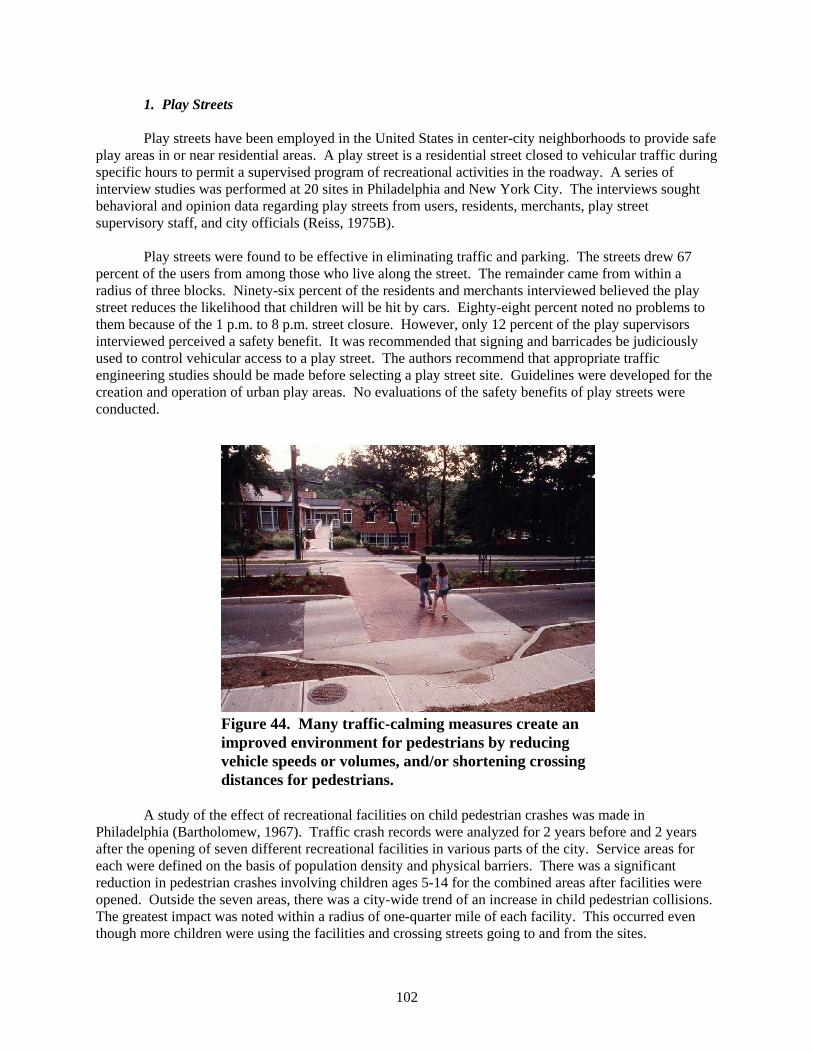
102
Figure 44. Many traffic-calming measures create animproved environment for pedestrians by reducingvehicle speeds or volumes, and/or shortening crossingdistances for pedestrians.
1. Play Streets
Play streets have been employed in the United States in center-city neighborhoods to provide safeplay areas in or near residential areas. A play street is a residential street closed to vehicular traffic duringspecific hours to permit a supervised program of recreational activities in the roadway. A series ofinterview studies was performed at 20 sites in Philadelphia and New York City. The interviews soughtbehavioral and opinion data regarding play streets from users, residents, merchants, play streetsupervisory staff, and city officials (Reiss, 1975B).
Play streets were found to be effective in eliminating traffic and parking. The streets drew 67percent of the users from among those who live along the street. The remainder came from within aradius of three blocks. Ninety-six percent of the residents and merchants interviewed believed the playstreet reduces the likelihood that children will be hit by cars. Eighty-eight percent noted no problems tothem because of the 1 p.m. to 8 p.m. street closure. However, only 12 percent of the play supervisorsinterviewed perceived a safety benefit. It was recommended that signing and barricades be judiciouslyused to control vehicular access to a play street. The authors recommend that appropriate trafficengineering studies should be made before selecting a play street site. Guidelines were developed for thecreation and operation of urban play areas. No evaluations of the safety benefits of play streets wereconducted.
A study of the effect of recreational facilities on child pedestrian crashes was made inPhiladelphia (Bartholomew, 1967). Traffic crash records were analyzed for 2 years before and 2 yearsafter the opening of seven different recreational facilities in various parts of the city. Service areas foreach were defined on the basis of population density and physical barriers. There was a significantreduction in pedestrian crashes involving children ages 5-14 for the combined areas after facilities wereopened. Outside the seven areas, there was a city-wide trend of an increase in child pedestrian collisions. The greatest impact was noted within a radius of one-quarter mile of each facility. This occurred eventhough more children were using the facilities and crossing streets going to and from the sites.

103
2. Community Streets
Japan's traffic-calming strategies have been directed toward community streets. Communitystreets rely on treatments such as speed humps, bulbouts, chicanes, and other devices to slow down motorvehicle traffic (Replogle, 1992). In addition, motorists and pedestrians are separated. Community streetsare most appropriate when traffic volumes are 200 vehicles per hour or less.
Road-pia are neighborhood-wide installations of community streets that give priority topedestrians and cyclists. In the Koraku district of Nagoya, a road-pia scheme introduced communitystreets to connect schools and transit stations to homes. The number of car-pedestrian crashes resulting ininjury or death fell from 32 in the 4 years before the road-pia scheme was installed to only 2 in the 2 yearsafter. While the effects of individual components such as speed humps or bulbouts was not known, thecombination of these devices was effective in reducing traffic, vehicle speeds, and collisions (Replogle,1992).
3. Woonerf
The Netherlands is one of the leaders in traffic calming. They developed the “woonerf” based onthe concept of the residential yard (Kraay, 1976). These are areas where the physical and visualtreatments of the public right-of-way create a pedestrian-oriented area. Only local traffic is allowed touse the roadway and all modes are “forced” to travel almost as slow as the slowest mode (the pedestrian)through design features. The residential yard's function differs from a conventionally designed residentialstreet. The paved area is used in common for various functions, including driving, playing, cycling,walking, and parking. This is intended for application only along low-volume streets having minimalparking demand.
Special legal and behavioral rules apply to traffic in the residential yard:
! Roads located within a designated residential yard may be used over their entire width bypedestrians and children at play.
! Drivers must move with the greatest caution, being intruders within the residential yard.
! The speed of all modes is limited to about 11.3 km/h (7 mi/h).
! Pedestrians must not unnecessarily obstruct vehicle progress.
! Motor vehicles with more than two wheels can park in a residential yard only at places with aparking sign or a letter "P" in spaces on the road surface.
! A new traffic sign indicates residential areas designated as residential yards.
4. Transit Malls: Shared Use of Pedestrian-Oriented Space
The use of transit malls is common in Europe, and is increasing in U.S. cities.
Studies were conducted of crashes occurring before and after implementation of transit malls inPhiladelphia and Minneapolis (Edminster and Koffman, 1979). Analysis showed non-pedestriancollisions decreasing sharply on transit malls with no evidence of an increase on nearby streets. Totalpedestrian crashes appear stable with the only increase related to an increase in the exposure rates ofpedestrian and vehicular volumes. Bus-pedestrian conflicts are much higher on transit malls than on otherstreets. Fortunately, creating the malls has not resulted in a higher number of bus-pedestrian collisions. Factors related to pedestrian crashes in Philadelphia include:

104
! Change from a one-way street to a two-way bus flow appears to cause confusion andcarelessness on the part of pedestrians.
! Illegal pedestrian behavior, particularly jaywalking, results in more collisions in whichpedestrians are at fault.
! Jaywalking is partly encouraged by a low volume of buses.
! Inadequate mall design included roadways that were too narrow, and the lack of barriers todiscourage jaywalking.
! Jaywalking was encouraged by certain amenities such as phone booths used by pedestriansand placed too close to the curb.
! Construction of bus shelters too far away from crosswalks encouraged bus riders to cross theroadway outside the crosswalks.
! Midblock pedestrian crossings caused the entire roadway to be viewed in a casual manner bypedestrians.
! Operational problems may contribute to pedestrian crashes.
Although some people believed speeding buses, encouraged by the freedom from other traffic,were a danger to pedestrians, there was no evidence of buses speeding.
As a result of a review of studies involving shared use of pedestrian-oriented space, it wasconcluded that plans that restrict private vehicles from small sections of the roadway but allow otherpublic service vehicles have only marginal or small positive safety benefits (Edminster and Koffman,1979; Katz, 1978). Other pedestrian measures, such as pedestrian delay, are improved.
5. Area-wide Traffic Restrictions
Area-wide traffic restriction plans have been employed in town centers and residential areas. Observations of pedestrian risk were made in Upsala, Sweden, both before and after the implementationof an area-wide traffic restriction plan in the center of town (Lovemark, 1974). This involved closingstreets to vehicular traffic, institution of one-way flow on bypass routes, and bus-only streets. Risk wasdefined as the probability of a collision occurring that would result in personal injury and was predictedfrom serious traffic conflicts for various types of pedestrian and driver behaviors. Risk for pedestrians inthe restricted area declined by 29 percent. Risk for pedestrians on surrounding streets outside therestricted area, which experienced a 30-percent increase in volume after the restrictions wereimplemented, increased 12 percent.
In similar traffic management efforts in London, the impact of street closures and a few otherdevices on pedestrian safety was analyzed for 19 areas (Brownfield, 1980). Ten sites showed declines inpedestrian collisions and two sites remained the same. The overall result was a pedestrian crash declineof 24.4 percent. However, this decline was not statistically significant.
6. Speed Humps and Speed Tables
Also known as road humps, undulations, or "sleeping policemen," speed humps were developedby the Transport and Road Research Laboratory in Great Britain. The purpose of speed humps is topromote the smooth flow of traffic at slow speeds, around 32-40 km/h (20-25 mi/h). The speed hump is
105
an elongated bump with a circular-arc cross-section, rising to a maximum height of 76 mm (3 in) abovethe normal pavement surface and having a length of 3.7 m (12 ft) in the direction of vehicular travel. Speed humps usually extend the full width of the road.
Speed tables are flat-topped or trapazoidal speed humps. When used in conjunction withcrosswalks, the flat top of the hump can extent the width of the crosswalk. Speed tables are generally thesame height of speed humps, and the raised portion can be built with brick pavers. Speed tables are morecommon in Europe and Australia than in the U.S.
The ITE notes that,
Speed humps have the advantage of being largely self-enforcing and of creating a visualimpression, real or imagined, that a street is not intended for speeding or ‘through’ traffic. Some items to consider before speed hump installation are their initial construction andcontinuing maintenance costs, any potential negative impact on emergency and servicevehicles, increases in vehicle noise, inconvenient access, and to some, their unsightliness. They must be appropriate for use at all hours, day and night. In addition, it is mandatorythat they be supplemented with a combination of signs and/or pavement markings towarn motorists. (ITE Technical Council, 1993)
Other concerns related to speed humps and speed tables include the effect on drainage, snowremoval, and the effect on emergency access of fire trucks and ambulances.
7. Effects of Speed Humps
According to the ITE, speed hump research and testing have found that:
! Traffic speeds decrease at the humps and at locations between properly spaced successivehumps. Speeds of the fastest drivers are affected as well as those of average drivers. Thespeed distribution generally narrows, with the greatest effect on higher vehicle speeds.
! A single hump will only act as a point speed control. A series of humps is usually needed toreduce speeds along an extended section of street. On long straight streets, speed humps willbe needed about every 153 m (1 block) to more uniformly control speeds.
! Speed humps may divert traffic to other streets, especially in those situations where asignificant amount of traffic is using the street as a shortcut, detour, or overflow from acongested collector or arterial roadway. Volume reduction is affected by the number andspacing of humps and availability of alternative routes.
! Studies indicate that speed humps do not have the same effect on all vehicles. Humps tend tohave a more significant impact on longer wheel-base vehicles such as pickup trucks, buses,and fire trucks, and less of an impact on vehicles with good suspension.
! Speed humps are said not to pose a traffic safety hazard when properly designed andinstalled. In fact, crash experience generally remains stable or decreases due to reducedspeeds and volume (ITE Technical Council, 1993). Surveys of various agencies have failedto identify any clear liability problems associated with the use of speed humps.

106
8. Experience with Speed Humps
Several agencies have reported on the use of speed humps.
OMAHA, NE (Klik and Faghri, 1993)
! Humps installed on 60 residential streets
! Before-after measurements of 85th percentile speeds at 10 locations showed significant speedreductions (5 percent significance level)
! Personal injury crashes decreased at 19 locations
! Some residents complained about increased noise levels, vehicle damage, and that speedingstill existed
! Officials were concerned about emergency vehicle response, potential liability, and need formonitoring signs and pavement markings near speed humps
BELLEVUE, WA (Clarke and Dornfield, 1994)
! Sixteen speed humps installed in five residential neighborhoods
! 85th percentile speeds declined from before level of 58-63 km/h (36-39 mi/h), to 39-43 km/h(24-27 mi/h) after installation
! Traffic volumes declined when alternate routes existed
! Most residents said humps were effective and favored continued use
HOWARD COUNTRY, MD (Walter, 1995)
! Seven humps on Baltimore Avenue lowered 85th percentile speeds from 61 km/h (38 mi/h) to43-47 km/h (27 to 29 mph) between humps, and 24 km/h (15 mi/h) at humps; no crashes in 4years after vs. 4 crashes in the 2 years before
! Four humps on Dogwood Drive reduced the 85th percentile speed from 64 km/h to 45 km/h(40 mi/h to 28 mi/h); volumes fell 24 percent
! On Shaker Drive, 85th percentile speed fell from 69 km/h to 47 km/h (43 mi/h to 29 mi/h)following the installation of two flat-top humps; speed between humps and at humps wasessentially the same
AGOURA HILLS, CA (Cline, 1993)
! Five speed humps were built along a 0.8-km (0.5-mi) stretch of Grey Rock Road. The humpswere 70 mm (2.75 in) high instead of 76 mm (3 in)
! 85th percentile speeds fell 10-15 km/h (6-9 mi/h) after installation
! Volumes remained constant. Observations indicated motorists did not speed up between thehumps, drive in the gutter, or divert to other residential streets

107
WESTLAKE VILLAGE, CA (Cline, 1993)
! Humps were 67 mm (2.625 in) high
! 85th percentile speed fell 15-23 km/h (9-14 mi/h) after the humps were installed
Several other demonstration projects in Los Angeles used the 67-mm (2.625-in) speed humps,with results similar to Agoura Hills and Westlake Village
CORIO, VICTORIA, AUSTRALIA (McDonald and Jarvis, 1981)
! Two residential streets each had three road humps. The separation between the humps was110 to 150 m (361 to 492 ft)
! 85th percentile traffic speeds at humps dropped by nearly half
! Volume fell 28 percent on one street and 24 percent on the other
STIRLING, WESTERN AUSTRALIA (Richardson and Jarvis, 1981)
! Eight humps installed, with 115 to 160 m (377 to 525 ft) between humps
! 85th percentile traffic speeds at humps dropped from 65 km/h (40 mi/h) to 21 km/h (13 mi/h)
! Speeds between the humps fell from 70 to 45 km/h (43 to 28 mi/h)
! Volumes fell by roughly half
Other Australian cities conducted evaluations on speed tables. In Croydon, Victoria, the 85th percentile speeds between speed tables fell as much as 36 percent (Hawley et al., 1992). In Mosman,New South Wales, the noise levels after speed tables were installed fell by up to 11 decibels, partly theresult of lower traffic volumes (Hawley et al., 1992). With speed tables in place, the character of vehiclenoise changes to thumping (as motorists drive over the tables) and acceleration (as motorists speed upbetween tables). Nearby residents may perceive these changes as increased noise.
A Danish study developed a regression model to calculate expected speed changes associatedwith speed humps, lateral dislocations, and street narrowing (Engel and Thomsen, 1992). According totheir model, every centimeter in height is expected to reduce speed by 1.0 km/h (0.6 mi/h). (Streetnarrowing is predicted to produce a 4.7-km/h (2.9-mi/h) speed reduction. A single lateral dislocation ispredicted to reduce speed by 2.0 km/h (1.2 mi/h), while a double lateral dislocation by 4.7 km/h (2.9mi/h).)
Zaidel et al. in 1992 surveyed individuals and organizations about speed-reduction devices. Based on 23 responses from 13 countries, they concluded that "many communities in several countriesexperienced neither vehicle damage nor driver loss of control when passing over humps. Also, no realoperational or comfort problems with bus, truck, or emergency vehicles were reported."
9. Guidelines for Speed Hump Use
Drawing upon experiences with speed humps, the ITE proposed the following guidelines:

1As used in England, pelican crossings are midblock crossings controlled by traffic signals and pushbuttonpedestrian signals. The pushbutton hardware lights up and conveys specific messages to pedestrians during eachinterval (walk phase, clearance phase, and don’t walk phase), with dashed (not solid) parallel lines to mark thecrosswalk (Zegeer, et al., 1994).
108
! A traffic engineering study, including consideration of alternative traffic control measures,should precede any installation.
! Speed humps should only be installed on local two-lane residential streets with less than3,000 vehicles per day, with a posted speed or prima facie speed of 48 km/h (30 mi/h) or less.
! Hump locations should be coordinated with street geometry and grades.
! Speed humps should not be installed on streets with significant numbers of emergencyvehicles, transit, or long wheelbase vehicles.
! Support from a documented majority of affected residents should be obtained before anyinstallation (ITE Technical Council, 1993).
In the United Kingdom, road hump regulations were first issued in 1983, with more flexibleregulations in 1986 and 1990 (Road Safety Division, 1993). Among other changes, the 1990 regulationsallowed tapered-edge and flat-top humps in addition to the conventional round-top, curb-to-curb hump. The new regulations allow humps at pelican1 crossings and do not limit the number of humps in a series. When a hump coincides with a crossing, only flat-top humps should be used. Humps may not be placedcloser than 30 m (98 ft) from a pelican or zebra crossing. Pavement markings delineating a crossingshould be placed along the flat top of the hump, not on the ramps leading to and from the hump. A tactilesurface may be necessary to indicate the sidewalk/street edge for pedestrians with vision impairments. Atjunctions, humps across side streets can be set back 5-8 m (16-26 ft) from the main road to discouragepedestrians from crossing the side street to near the main road and thereby reduce conflicts betweenpedestrians and turning traffic (Speed Control Humps, 1990).
Although speed humps reduce vehicular speeds and volumes to the benefit of pedestrians, theyhave their disadvantages. Adjacent residential streets and arterials are likely to experience higher levelsof traffic as motorists are diverted from the treated street. The noise caused by vehicle acceleration and “thumping” over humps may disturb residents who live near the humps. Signing and pavement markingscan render humps unattractive. Because humps reduce speeds, emergency response time may increase. They can impede maintenance activities such as sweeping and snowplowing and may affect drainage(Clarke and Dornfield, 1994). Speed humps also require extra care when resurfacing of the street isrequired.
Thus, speed humps are certainly not a cure-all for traffic problems on residential streets. Lessrestrictive and more passive devices that may address these problems should be considered first. However, where high vehicle speeds create an unsafe environment on local streets, speed humps may beone possible treatment. Care should be taken to inform the residents of the advantages and disadvantagesof the humps before they are installed. Residents should provide a show of consensus for the humps,particularly those who will be most directly affected.
10. Bulbouts and Street Narrowing
The purpose of a bulbout, also known as a choker, bulbout, or curb bulb, is to reduce the width ofthe vehicle travel way at either an intersection or a midblock pedestrian crossing location. It shortens the

109
Figure 45. Street narrowing can reduce vehiclespeeds and provide pedestrians with anarrower street to cross.
street crossing distance for pedestrians, may slow vehicle speeds, and provides pedestrians and motoristswith an improved view of one another, thereby reducing the risk of a motor vehicle-pedestrian collision.
In two Australian cities, Keilor (Queensland) and Eltham (Victoria), "curb blisters" (i.e.,bulbouts) had little effect on reducing vehicle speeds (Hawley et al., 1992). However, in Concord, NewSouth Wales, a comparison of a subarterial street with both curb blisters and marked parking lanes versusan untreated street showed that the crash rate on the treated street was only one-third that of the untreatedstreet (Hawley et al., 1992). The number of these crashes involving pedestrians was not stated, nor is itknown how the streets compared before treatment.
Australia's "wombat" crossings usually consist of a raised platform with a marked crosswalk ontop, and a refuge and curb blisters where space permits. Thus, they combine features of speed tables andbulbouts. They are designed to slow motorists, shorten pedestrian exposure to motor vehicles, andincrease pedestrian visibility to motorists. Wombat crossings have generally reduced 85th percentilevehicle speeds by 40 percent (Hawley et al., 1992).
Anne Arundel County, MD, has been using a combination of medians and bulbouts nearintersections. The medians narrow the traveled way, while the bulbouts force drivers to make a lateraldeflection as they enter the narrowed area. Medians with lateral deflection have reduced the 85th
percentile speeds by 3-8 km/h (2-5 mi/h) (Walter, 1995).
The Dutch towns of Oosterhout and De Meern have installed street-narrowing variations. TheOosterhout project consisted of installing two bulbouts so as to require motorists to deviate from astraight path. Both the 85th percentile vehicle speed and the degree of pedestrian-motor vehicle conflictfell after the deviation was installed. De Meern's deviation was created by placing two bulbouts oppositeone another to narrow the width of the traveled way. A significant reduction in the 85th percentile vehiclespeed was observed at the deviation. Opinions of the deviation in De Meern were mixed. There was nota strong sense of neighborhood improvement among residents. Swerving cars were thought to endangerbicyclists. School teachers thought that children would be confused by the deviation. Retailers wereconcerned about accessibility and parking. There was little concern about emergency vehicle access(Replogle, 1992).
110
Macbeth in 1995 reported favorable speed changes seen on five raised and narrowed intersectionsand seven midblock bulbouts (two raised). The speed limit was also lowered to 30 km/h (19 mi/h). Theresults of speed changes are given below.
Percent Exceeding 30km/h 40km/h 50km/h
Before 86 54 13After 20 3 2
11. Roundabouts
In a Toronto traffic engineering workshop, Frederick (1995) reported modest reductions in 85th percentile speed after traffic circles were installed. It was reported that local citizens asked for traffic-calming measures (Herget, 1995). Before the installation, the 85th percentile speed was 43-50 km/h (27-31 mi/h) and 81 percent of traffic was non-local. Two roundabouts were installed and 81 percent ofcitizens in the area approved. Herget said there was no measurable effect of the application.
More recently, the Insurance Institute for Highway Safety found in 2000 that roundabouts reducecrashes when compared to intersections with signals or stop signs, especially when injuries areconsidered. Researchers at the University of Maine, Ryerson Polytechnic University, and the Institutestudied crashes and injuries at 24 intersections before and after the construction of roundabouts. Thoughthe study found that fewer pedestrian crashes occurred when roundabouts were installed, the numberswere too small to be statistically significant. Accordingly, the topic of roundabouts and pedestrian safetyremain controversial, especially for people with disabilities. For motorists, however, the study found a39-percent overall decrease in crashes, a 76-percent decrease in injury-producing crashes, and a 90-percent decrease in crashes involving fatal or incapacitating injuries.
12. Cul de sacs
In the 1970's, Australia implemented street closures “on the grounds that the problem was causedby excessive connectivity in the network” (Brindle, 1997, page 26), but now latter-day planners want toreturn to connective local street networks as part of a neotraditional neighborhood design. Adisadvantage to cul de sacs is that extra right-of-way is needed to build the turnarounds. If completeclosures are built, blocking pedestrian and bicycle access, it may make travel by automobile moreattractive.
The authors cite the “benefits” of the neotraditional designs as coming from “increased density, amix of land uses, and a grid transportation system” (Szplett and Sale, 1997, page 42), but they acknowledge the opposing view, saying “The volume of traffic is often a rallying point for the neighborsin an adjoining residential area who are opposed to the project. The authors’ experience is that the higherdensity is another element of citizen complaints” (p. 43).
13. Emergency Vehicles
Some apprehensions about certain traffic-calming measures relate to fears that emergencyvehicles will be delayed in responding, and the traffic-calming facilities will make vehicle access moredifficult. Atkins and Coleman (1997) report the results of their study of several types of emergencyvehicles, with several drivers, in negotiating several types of traffic-calming devices including humps androundabouts. This was carried out as an experiment in non-emergency situations. They report that thedelay was 0 or 1 second in some cases, ranging up to 10 seconds, maximum, in others. They did not
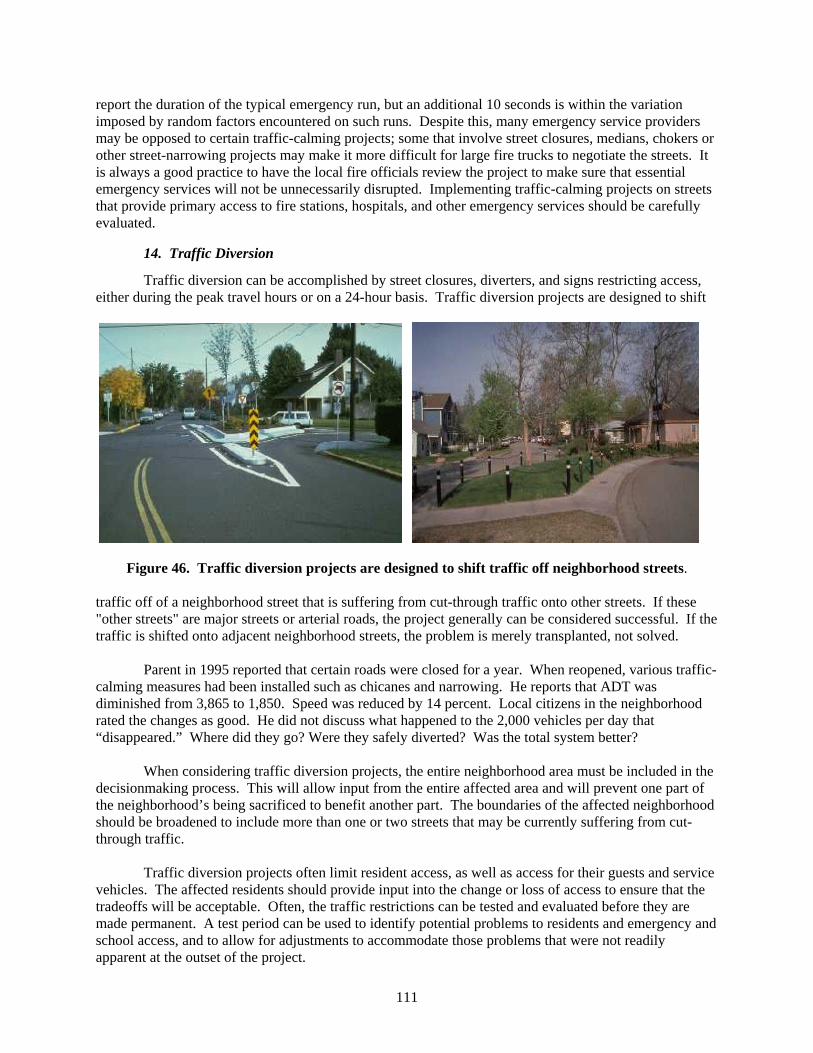
111
report the duration of the typical emergency run, but an additional 10 seconds is within the variationimposed by random factors encountered on such runs. Despite this, many emergency service providersmay be opposed to certain traffic-calming projects; some that involve street closures, medians, chokers orother street-narrowing projects may make it more difficult for large fire trucks to negotiate the streets. Itis always a good practice to have the local fire officials review the project to make sure that essentialemergency services will not be unnecessarily disrupted. Implementing traffic-calming projects on streetsthat provide primary access to fire stations, hospitals, and other emergency services should be carefullyevaluated.
14. Traffic Diversion
Traffic diversion can be accomplished by street closures, diverters, and signs restricting access,either during the peak travel hours or on a 24-hour basis. Traffic diversion projects are designed to shift
Figure 46. Traffic diversion projects are designed to shift traffic off neighborhood streets.
traffic off of a neighborhood street that is suffering from cut-through traffic onto other streets. If these"other streets" are major streets or arterial roads, the project generally can be considered successful. If thetraffic is shifted onto adjacent neighborhood streets, the problem is merely transplanted, not solved.
Parent in 1995 reported that certain roads were closed for a year. When reopened, various traffic-calming measures had been installed such as chicanes and narrowing. He reports that ADT wasdiminished from 3,865 to 1,850. Speed was reduced by 14 percent. Local citizens in the neighborhoodrated the changes as good. He did not discuss what happened to the 2,000 vehicles per day that“disappeared.” Where did they go? Were they safely diverted? Was the total system better?
When considering traffic diversion projects, the entire neighborhood area must be included in thedecisionmaking process. This will allow input from the entire affected area and will prevent one part ofthe neighborhood’s being sacrificed to benefit another part. The boundaries of the affected neighborhoodshould be broadened to include more than one or two streets that may be currently suffering from cut-through traffic.
Traffic diversion projects often limit resident access, as well as access for their guests and servicevehicles. The affected residents should provide input into the change or loss of access to ensure that thetradeoffs will be acceptable. Often, the traffic restrictions can be tested and evaluated before they aremade permanent. A test period can be used to identify potential problems to residents and emergency andschool access, and to allow for adjustments to accommodate those problems that were not readilyapparent at the outset of the project.
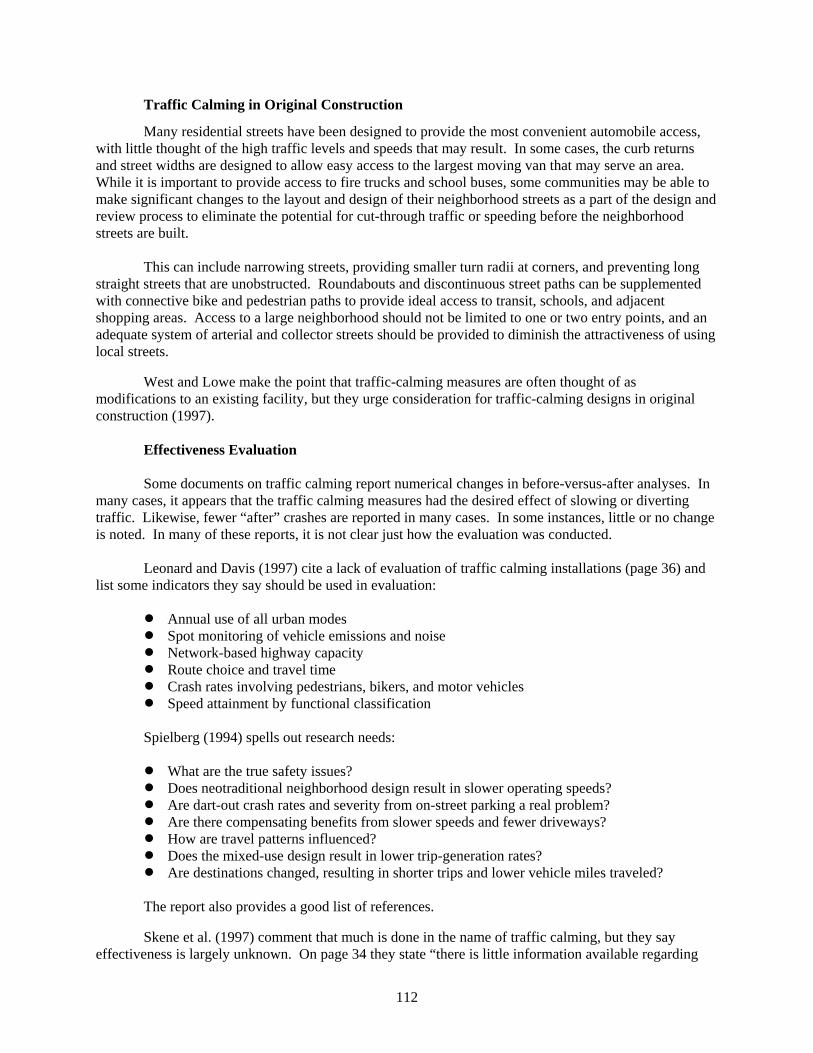
112
Traffic Calming in Original Construction
Many residential streets have been designed to provide the most convenient automobile access, with little thought of the high traffic levels and speeds that may result. In some cases, the curb returnsand street widths are designed to allow easy access to the largest moving van that may serve an area. While it is important to provide access to fire trucks and school buses, some communities may be able tomake significant changes to the layout and design of their neighborhood streets as a part of the design and review process to eliminate the potential for cut-through traffic or speeding before the neighborhoodstreets are built.
This can include narrowing streets, providing smaller turn radii at corners, and preventing longstraight streets that are unobstructed. Roundabouts and discontinuous street paths can be supplementedwith connective bike and pedestrian paths to provide ideal access to transit, schools, and adjacentshopping areas. Access to a large neighborhood should not be limited to one or two entry points, and anadequate system of arterial and collector streets should be provided to diminish the attractiveness of usinglocal streets.
West and Lowe make the point that traffic-calming measures are often thought of asmodifications to an existing facility, but they urge consideration for traffic-calming designs in originalconstruction (1997).
Effectiveness Evaluation
Some documents on traffic calming report numerical changes in before-versus-after analyses. Inmany cases, it appears that the traffic calming measures had the desired effect of slowing or divertingtraffic. Likewise, fewer “after” crashes are reported in many cases. In some instances, little or no changeis noted. In many of these reports, it is not clear just how the evaluation was conducted.
Leonard and Davis (1997) cite a lack of evaluation of traffic calming installations (page 36) andlist some indicators they say should be used in evaluation:
! Annual use of all urban modes! Spot monitoring of vehicle emissions and noise! Network-based highway capacity! Route choice and travel time! Crash rates involving pedestrians, bikers, and motor vehicles! Speed attainment by functional classification
Spielberg (1994) spells out research needs:
! What are the true safety issues?! Does neotraditional neighborhood design result in slower operating speeds?! Are dart-out crash rates and severity from on-street parking a real problem? ! Are there compensating benefits from slower speeds and fewer driveways? ! How are travel patterns influenced?! Does the mixed-use design result in lower trip-generation rates?! Are destinations changed, resulting in shorter trips and lower vehicle miles traveled?
The report also provides a good list of references.
Skene et al. (1997) comment that much is done in the name of traffic calming, but they sayeffectiveness is largely unknown. On page 34 they state “there is little information available regarding
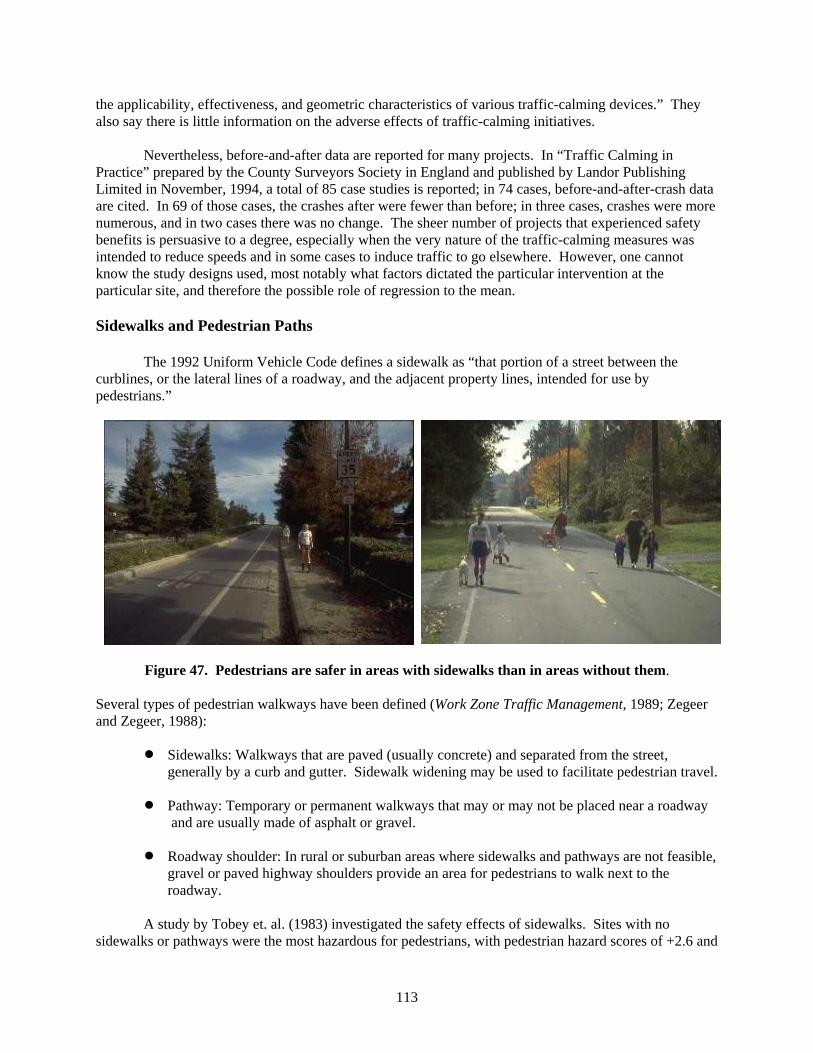
113
the applicability, effectiveness, and geometric characteristics of various traffic-calming devices.” Theyalso say there is little information on the adverse effects of traffic-calming initiatives.
Nevertheless, before-and-after data are reported for many projects. In “Traffic Calming inPractice” prepared by the County Surveyors Society in England and published by Landor PublishingLimited in November, 1994, a total of 85 case studies is reported; in 74 cases, before-and-after-crash dataare cited. In 69 of those cases, the crashes after were fewer than before; in three cases, crashes were morenumerous, and in two cases there was no change. The sheer number of projects that experienced safetybenefits is persuasive to a degree, especially when the very nature of the traffic-calming measures wasintended to reduce speeds and in some cases to induce traffic to go elsewhere. However, one cannotknow the study designs used, most notably what factors dictated the particular intervention at theparticular site, and therefore the possible role of regression to the mean.
Sidewalks and Pedestrian Paths
The 1992 Uniform Vehicle Code defines a sidewalk as “that portion of a street between thecurblines, or the lateral lines of a roadway, and the adjacent property lines, intended for use bypedestrians.”
Figure 47. Pedestrians are safer in areas with sidewalks than in areas without them.
Several types of pedestrian walkways have been defined (Work Zone Traffic Management, 1989; Zegeerand Zegeer, 1988):
! Sidewalks: Walkways that are paved (usually concrete) and separated from the street,generally by a curb and gutter. Sidewalk widening may be used to facilitate pedestrian travel.
! Pathway: Temporary or permanent walkways that may or may not be placed near a roadway and are usually made of asphalt or gravel.
! Roadway shoulder: In rural or suburban areas where sidewalks and pathways are not feasible,gravel or paved highway shoulders provide an area for pedestrians to walk next to theroadway.
A study by Tobey et. al. (1983) investigated the safety effects of sidewalks. Sites with nosidewalks or pathways were the most hazardous for pedestrians, with pedestrian hazard scores of +2.6 and

114
a PxV exposure score (i.e., exposure measure equals pedestrian volumes [P] times traffic volume [V]) of+2.2. This indicates that crashes at sites without sidewalks are more than twice as likely to occur than expected. Sites with sidewalks on one side of the road had pedestrian volume and PxV hazard scores of+1.2 and +1.1, compared with scores of -1.2 and -1.2 for sites with sidewalks on both sides of the road. Thus, sites with no sidewalks were the most hazardous to pedestrians, and sites where sidewalks werepresent on both sides of the road were least hazardous. A later study by Knoblauch et al. (1987)developed guidelines for sidewalk installation separately for new and existing streets.
A variety of factors are widely acknowledged to have an impact on the risk of pedestrian motorvehicle injuries. Those most extensively researched are geometric characteristics of the road, includingthe presence of sidewalks. However, until recently, factors relating to demographics and neighborhoodcharacteristics have been mentioned but not sufficiently researched. To address that problem, McMahon,et al. (2000) used a case-control methodology and applied conditional and binary logistic models todetermine the effects of cross-sectional roadway design attributes and socioeconomic and other censusblock group data on the likelihood that a site is a crash site. A total of 47 crash sites and 94 comparisonsites were analyzed. Physical design factors found to be associated with significantly higher likelihood ofbeing a crash site are higher speed limit, the lack of wide grassy walkable areas, and the absence ofsidewalks. When these roadway factors are controlled for, non-geometric factors associated withsignificantly higher likelihood of being a crash site are high levels of unemployment, older housing stock, and more single parents. This information suggest that some neighborhoods may, due to increasedexposure or specific types of exposure, be especially appropriate sites for pedestrian safety measures suchas sidewalks, lower speed roadway designs, and the addition of wide grassy shoulders. That FHWAstudy also developed guidelines and priorities for installing sidewalks and walkways, as shown in table31.
Table 31. Recommended guidelines for new sidewalk/walkway installation. Roadway Classification/Land Use Sidewalk/Walkway Requirements Future PhasingRural highways (<400 average dailytraffic [ADT])
Shoulders preferred, with a minimum widthof 0.9 m (3 ft)
Secure/preserve right-of-way(ROW) for future sidewalks.
Rural highways(400 to 2000 ADT)
1.5-m (5-ft) shoulders preferred, andminimum of 1.2-m (4-ft) shoulders required.
Secure/preserve ROW for futuresidewalks.
Rural/suburban highway(ADT >2,000 and less than 1 dwelling unit (d.u.)/.4 hectares (ha)
Sidewalks or side paths preferred; minimumof 1.8-m (6-ft) shoulders required.
Secure/preserve ROW for futuresidewalks.
Suburban highway (1 to 4 d.u/.4 ha) Sidewalks on both sides required.Major arterial (residential) Sidewalks on both sides required.Urban collector and minorarterial (residential)
Sidewalks on both sides required.
Urban local street(residential—less than 1 d.u /.4 ha)
Sidewalks on both sides preferred; minimumof 1.5-m (5-ft) shoulders required.
Secure/preserve (ROW) for futuresidewalks.
Urban local street(residential—1 to 4 d.u./.4 ha)
Sidewalks on both sides preferred. Both sides required if density becomes greater than 4 d.u./ .4 ha (4d.u./acre) or if schools, bus stops,etc. are nearby.
Local street(residential—more than 4 d.u./.4 ha)
Sidewalks on both sides required.
All commercial urban streets(commercial areas)
Sidewalks on both sides required.
All streets in industrial areas Sidewalks on both sides preferred; minimumof 1.5-m (5-ft) shoulders required.
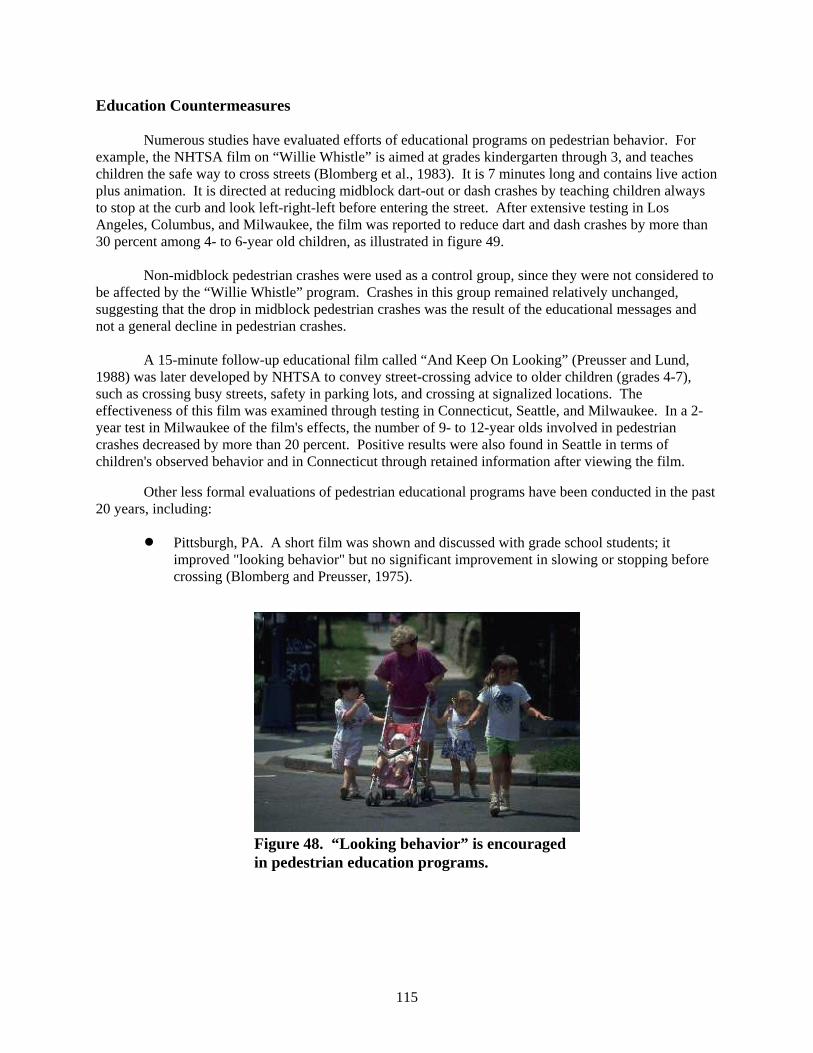
115
Figure 48. “Looking behavior” is encouragedin pedestrian education programs.
Education Countermeasures
Numerous studies have evaluated efforts of educational programs on pedestrian behavior. Forexample, the NHTSA film on “Willie Whistle” is aimed at grades kindergarten through 3, and teacheschildren the safe way to cross streets (Blomberg et al., 1983). It is 7 minutes long and contains live actionplus animation. It is directed at reducing midblock dart-out or dash crashes by teaching children alwaysto stop at the curb and look left-right-left before entering the street. After extensive testing in LosAngeles, Columbus, and Milwaukee, the film was reported to reduce dart and dash crashes by more than30 percent among 4- to 6-year old children, as illustrated in figure 49.
Non-midblock pedestrian crashes were used as a control group, since they were not considered tobe affected by the “Willie Whistle” program. Crashes in this group remained relatively unchanged,suggesting that the drop in midblock pedestrian crashes was the result of the educational messages andnot a general decline in pedestrian crashes.
A 15-minute follow-up educational film called “And Keep On Looking” (Preusser and Lund,1988) was later developed by NHTSA to convey street-crossing advice to older children (grades 4-7),such as crossing busy streets, safety in parking lots, and crossing at signalized locations. Theeffectiveness of this film was examined through testing in Connecticut, Seattle, and Milwaukee. In a 2-year test in Milwaukee of the film's effects, the number of 9- to 12-year olds involved in pedestriancrashes decreased by more than 20 percent. Positive results were also found in Seattle in terms ofchildren's observed behavior and in Connecticut through retained information after viewing the film.
Other less formal evaluations of pedestrian educational programs have been conducted in the past20 years, including:
! Pittsburgh, PA. A short film was shown and discussed with grade school students; itimproved "looking behavior" but no significant improvement in slowing or stopping beforecrossing (Blomberg and Preusser, 1975).

116
Figure 49. Effects of “Willie Whistle” educational campaign on pedestrian crashes. Source: Blomberg et al, 1983.
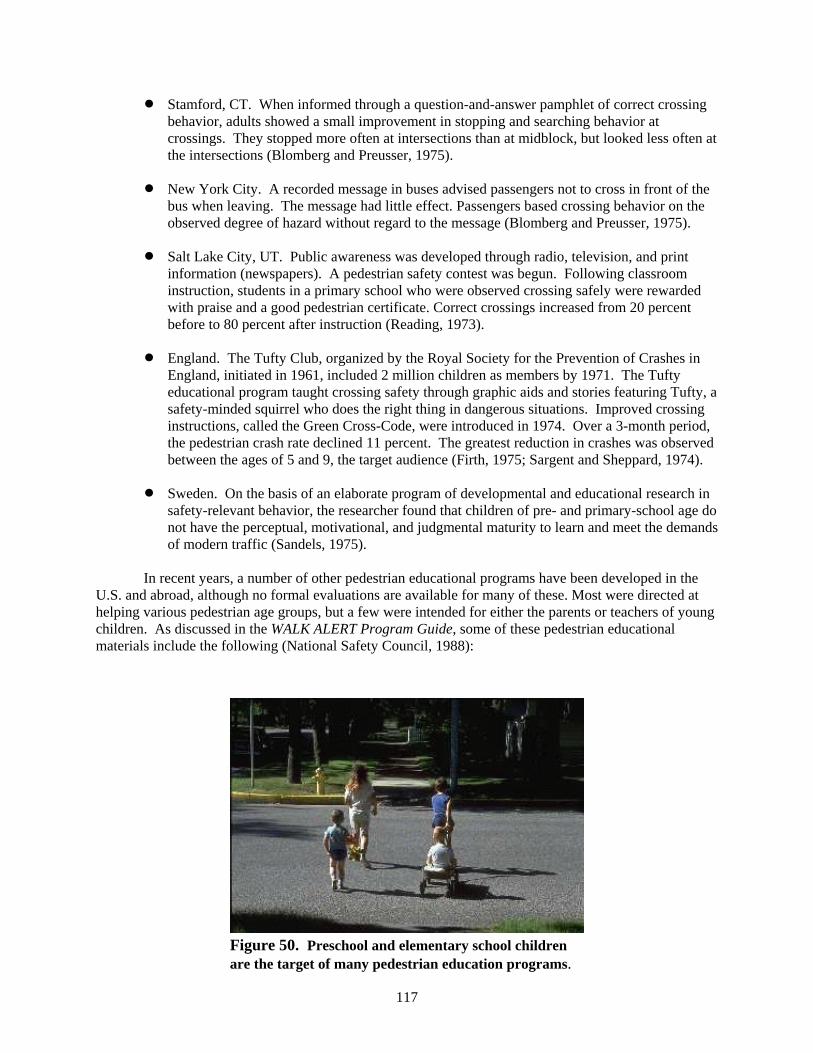
117
Figure 50. Preschool and elementary school childrenare the target of many pedestrian education programs.
! Stamford, CT. When informed through a question-and-answer pamphlet of correct crossingbehavior, adults showed a small improvement in stopping and searching behavior atcrossings. They stopped more often at intersections than at midblock, but looked less often atthe intersections (Blomberg and Preusser, 1975).
! New York City. A recorded message in buses advised passengers not to cross in front of thebus when leaving. The message had little effect. Passengers based crossing behavior on theobserved degree of hazard without regard to the message (Blomberg and Preusser, 1975).
! Salt Lake City, UT. Public awareness was developed through radio, television, and printinformation (newspapers). A pedestrian safety contest was begun. Following classroominstruction, students in a primary school who were observed crossing safely were rewardedwith praise and a good pedestrian certificate. Correct crossings increased from 20 percentbefore to 80 percent after instruction (Reading, 1973).
! England. The Tufty Club, organized by the Royal Society for the Prevention of Crashes inEngland, initiated in 1961, included 2 million children as members by 1971. The Tuftyeducational program taught crossing safety through graphic aids and stories featuring Tufty, asafety-minded squirrel who does the right thing in dangerous situations. Improved crossinginstructions, called the Green Cross-Code, were introduced in 1974. Over a 3-month period, the pedestrian crash rate declined 11 percent. The greatest reduction in crashes was observedbetween the ages of 5 and 9, the target audience (Firth, 1975; Sargent and Sheppard, 1974).
! Sweden. On the basis of an elaborate program of developmental and educational research insafety-relevant behavior, the researcher found that children of pre- and primary-school age donot have the perceptual, motivational, and judgmental maturity to learn and meet the demandsof modern traffic (Sandels, 1975).
In recent years, a number of other pedestrian educational programs have been developed in theU.S. and abroad, although no formal evaluations are available for many of these. Most were directed athelping various pedestrian age groups, but a few were intended for either the parents or teachers of youngchildren. As discussed in the WALK ALERT Program Guide, some of these pedestrian educationalmaterials include the following (National Safety Council, 1988):

118
! For preschool children, various programs are directed at children, their parents, and/orteachers regarding the need to recognize and avoid streets and traffic hazards. The programsinclude:
- Walking in Traffic Safely (WITS)- Watchful Willie- “Children in Traffic—Why Are They Different?” (a West German film)- Child and Traffic- Parents, Children and Traffic
! Elementary children (grades kindergarten to 3) represent the age group most at risk, and morethan half of all pedestrian deaths and injuries to children ages 5 to 9 involve crossing orentering residential streets. These educational programs emphasize safe street crossingbehavior and include:
- Willie Whistle Safe Street Crossing Program (discussed earlier)- I'm No Fool As a Pedestrian- Walk Safely- AAA Poster Contest
! Elementary children (grades 4-6) need more complex safety messages, such as crossing atsignalized intersections, multiple threat situations, right turn on red, walking in parking lots,and others. Examples of educational programs include:
- And Keep on Looking (discussed earlier)- Walk Safely- Safety on Streets and Sidewalks- The National Student Traffic Safety Test- Guidelines for a K-12 Traffic Safety Educational Curriculum
! Junior high and high school students should also be taught about more complex streetsituations, but also about being seen at night, dangers of alcohol use and walking, recreationalwalking, commercial bus stops, and others. Examples of programs include:
- Guidelines for a K-12 Traffic Safety Educational Curriculum- WALK ALERT—A Pedestrian Safety Booklet for Junior High Students- Driver Education- Substance Abuse Programs- Teaching About the Child
! Adult (including older adults) educational programs are more commonly in the form of:
- Walking tours led by traffic safety officers or civic leaders- Public service announcements- Print media- Work place programs- Hospitals and health-related print material
Since driver education is also an important component of pedestrian safety, numerous programsdirected at drivers are also available, including:
! AAA's School's Open Drive Carefully

119
! Parents Can Be Serious Traffic Hazards! About Children and Traffic! Give Older Pedestrians a Break at Crossings
Education is certainly an essential ingredient of pedestrian safety programs along withengineering and enforcement. Cities that historically have had a low incidence of pedestrian crashes havetypically had active pedestrian-education programs. More information on various educational programsfor pedestrian safety and specific messages is available (National Safety Council, 1988; Preusser, 1988).
Media campaigns are one form of education, and they are sometimes accompanied by the promiseof intensified law enforcement. Two studies carried out in Canada are illustrative. In one, a multimediacampaign targeted left turns, aimed at increasing the proportion of drivers who yield to pedestrians(Koenig and Wu, 1994). No enforcement emphasis was mentioned. Failure to yield was 25 percentbefore and 17 percent after. No change was seen in right-turn behavior, which was not targeted.
Another study, in Seattle, reported little success (Britt et al., 1995). These authors evaluated a 4-year study in Seattle. Driver behavior at crosswalks was observed; compliance with the yield law was notgreat (15 to 20 percent). A media campaign accompanied the enforcement effort, but it is not clearwhether the intensity of either was maintained during the full 4-year period. Enforcement seemed toproduce a slight improvement in compliance, but the authors said they were “ . . . unable to demonstratethat law enforcement efforts directed at motorists’ violations of crosswalk laws significantly orconsistently increase drivers’ willingness to stop for pedestrians.” (p. 166)
It seems reasonable to believe that many pedestrian collisions are the result of poor behavior onthe part of pedestrians and drivers. This would indicate that educational countermeasures could improvepedestrian safety. Many public information and education campaigns have been conducted to improvepedestrian and driver behavior. However, there is a clear need for further development and widespreaduse of effective pedestrian-safety programs that are targeted at children of various ages, parents, anddrivers.
Enforcement and Regulations
In addition to engineering and education, enforcement of traffic laws and regulations is anotherimportant element in safe pedestrian activity. This means curtailing dangerous motorist actions that relateto pedestrians. Motorists who exceed the speed limit, fail to yield the right of way to pedestrians whenturning, run a red light or stop sign, and/or drink and drive can place pedestrians in jeopardy. Strongpolice enforcement programs are needed to help reduce these violations (National Safety Council, 1988). Giving citations to pedestrians (for jaywalking, etc.) has not been shown to be effective in improvingbehavior, and can create a public-relations problem for local police departments.
Unfortunately, no quantitative studies could be found that determined the specific effects ofvarious types of police enforcement on pedestrian crashes and injuries. However, many U.S. cities withexemplary pedestrian safety achievements (such as Milwaukee, Seattle, and San Diego) have maintainedactive enforcement programs along with other pedestrian safety measures (National Safety Council,1988). The effect of enforcement alone is difficult to quantify because so many factors affect pedestriancrash experience over a given time period.
Several model pedestrian ordinances have been developed by NHTSA that have the potential toreduce certain types of pedestrian crashes. These include the following (National Safety Council, 1988;
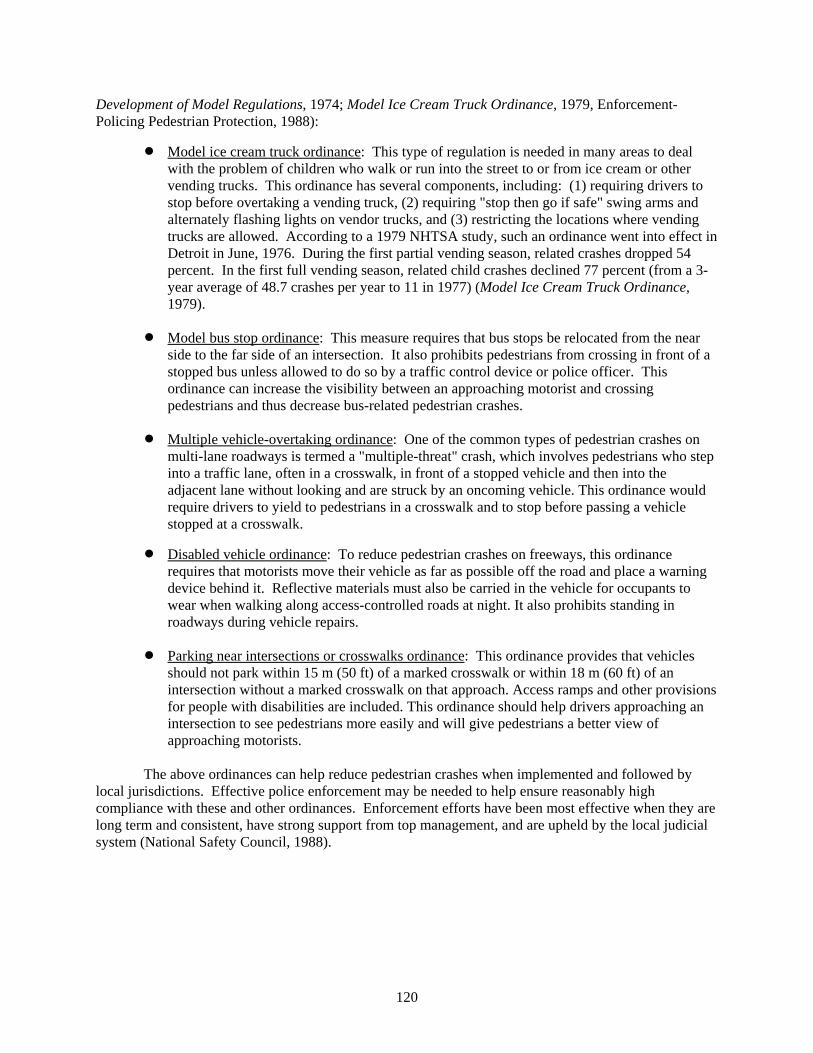
120
Development of Model Regulations, 1974; Model Ice Cream Truck Ordinance, 1979, Enforcement-Policing Pedestrian Protection, 1988):
! Model ice cream truck ordinance: This type of regulation is needed in many areas to dealwith the problem of children who walk or run into the street to or from ice cream or othervending trucks. This ordinance has several components, including: (1) requiring drivers tostop before overtaking a vending truck, (2) requiring "stop then go if safe" swing arms andalternately flashing lights on vendor trucks, and (3) restricting the locations where vendingtrucks are allowed. According to a 1979 NHTSA study, such an ordinance went into effect inDetroit in June, 1976. During the first partial vending season, related crashes dropped 54percent. In the first full vending season, related child crashes declined 77 percent (from a 3-year average of 48.7 crashes per year to 11 in 1977) (Model Ice Cream Truck Ordinance,1979).
! Model bus stop ordinance: This measure requires that bus stops be relocated from the nearside to the far side of an intersection. It also prohibits pedestrians from crossing in front of astopped bus unless allowed to do so by a traffic control device or police officer. Thisordinance can increase the visibility between an approaching motorist and crossingpedestrians and thus decrease bus-related pedestrian crashes.
! Multiple vehicle-overtaking ordinance: One of the common types of pedestrian crashes onmulti-lane roadways is termed a "multiple-threat" crash, which involves pedestrians who stepinto a traffic lane, often in a crosswalk, in front of a stopped vehicle and then into theadjacent lane without looking and are struck by an oncoming vehicle. This ordinance wouldrequire drivers to yield to pedestrians in a crosswalk and to stop before passing a vehiclestopped at a crosswalk.
! Disabled vehicle ordinance: To reduce pedestrian crashes on freeways, this ordinancerequires that motorists move their vehicle as far as possible off the road and place a warningdevice behind it. Reflective materials must also be carried in the vehicle for occupants towear when walking along access-controlled roads at night. It also prohibits standing inroadways during vehicle repairs.
! Parking near intersections or crosswalks ordinance: This ordinance provides that vehiclesshould not park within 15 m (50 ft) of a marked crosswalk or within 18 m (60 ft) of anintersection without a marked crosswalk on that approach. Access ramps and other provisionsfor people with disabilities are included. This ordinance should help drivers approaching anintersection to see pedestrians more easily and will give pedestrians a better view ofapproaching motorists.
The above ordinances can help reduce pedestrian crashes when implemented and followed bylocal jurisdictions. Effective police enforcement may be needed to help ensure reasonably highcompliance with these and other ordinances. Enforcement efforts have been most effective when they arelong term and consistent, have strong support from top management, and are upheld by the local judicialsystem (National Safety Council, 1988).

121
PART 4. SUMMARY AND DISCUSSION
This synthesis report reviewed existing pedestrian research, particularly as it relates to pedestriancrash characteristics and the effects of various engineering and roadway safety treatments (much lessattention was given to educational and enforcement measures related to pedestrians). Emphasis wasplaced on pedestrian research conducted in the past 10 years.
In addition to reviewing research published in U.S. literature, this report features a limitednumber of research studies from other countries, and authors in five other countries were hired to conductsimilar summaries of pedestrian research in the United Kingdom, Canada, the Netherlands, Australia, andSweden. This process resulted in the consideration of non-English articles and reports from thosecountries, with key results given in the research summary. These summaries are provided as separateattachments to this report and are found at the following Web site:http://www.walkinginfo.org/rd/international.htm
Introduction
Part 1 of this report provides an introduction to the pedestrian safety problem. Guides and modelpedestrian programs developed in the U.S. in recent years are also discussed, along with illustrations ofsome of the major pedestrian crash types and countermeasures.
It is clear that pedestrian safety has emerged in recent years as a topic of growing interest andconcern. As far back as the 1920s, pedestrian collisions resulted in about 40 percent of all trafficfatalities, annually reaching more than 15,000 pedestrian deaths in the 1930s.
As motorization advanced, that proportion fell, and pedestrian deaths now annually numberapproximately 5,000 to 6,000 and represent approximately 12-15 percent of traffic deaths each year. Thisdecline is presumably the product of: increased attention to pedestrian control and safety measures andpedestrian safety education; and a change in exposure factors on trips that formerly would have beenmade on foot that came to be made in a motor vehicle. Other factors also may play a role. Detailedpedestrian exposure data are not available that illuminate pedestrian trip choices and amount of walkingon a nationwide basis.
Pedestrian Crash Experience
Part 2 of this report deals with pedestrian crash characteristics. Research since the 1970s ofpedestrian crash databases has given us a better understanding of crash causes and related factors. Forexample, night conditions greatly increase pedestrian crash risk, and, while pedestrian collisions primarilyoccur in urban areas, higher speed rural collisions more often result in pedestrian deaths. Fridays andSaturdays are the most common days for pedestrian collisions, perhaps because of increased drinking bypedestrians and motorists and more walking exposure on these days.
We know that children are over-involved in pedestrian collisions per population. This isparticularly true for males age 5-9. Older pedestrians (particularly above age 65) are much more likely tobe killed as pedestrians, possibly because of their increased frailty. Alcohol consumption by thepedestrian is a factor in 40 percent or more of pedestrian deaths, and is a particular factor for malepedestrians age 25-44.
The most common pedestrian crash types include dart-outs, intersection dash, and turning-vehiclecollisions. Pedestrians are cited as being solely at fault 43.2 percent of the time, compared with

122
34.8 percent solely motorist fault. Of course, the assignment of fault depends to an extent on thejudgment and biases of the reporting police officers.
Overview of Pedestrian Crash Countermeasures and Safety Programs
The U.S. is the most motorized nation on earth (motor vehicles per capita), and priorities haveskewed in favor of the motorist and against the pedestrian. In recent years, however, some attempts havebeen made to give more consideration to pedestrians. Sometimes this is addressed directly in terms ofincreased safety for pedestrians accomplished through a variety of traffic calming and other measures. Sometimes the effort is framed as creating a more pedestrian-friendly walking environment in the interestof an improved quality of life, but increased safety is clearly a benefit.
Traffic professionals have had to proceed with less comprehensive knowledge than is desirableabout the effectiveness of some measures. While many evaluation results are reported in the literature, itis not always possible to know with sufficient confidence what works and what does not, particularlyunder specific traffic and roadway situations, because of difficulties in conducting crash evaluations ofpedestrian treatments. Low crash samples and threats of regression to the mean, among other difficulties,confound firm conclusions. Thus, when reviewing dozens of published articles and papers on pedestrianresearch for this report, efforts were made to summarize the results of the best available information andstudies.
Many studies were excluded from this synthesis because of questionable research methods or insufficient sample sizes, or because they did not specifically address the safety effects of pedestriantreatments. While this does not imply that every study mentioned in this report is of the highest possiblequality, there is a considerable amount of valuable information on the effectiveness of roadway and othertreatments for pedestrians. In addition to pedestrian crash data, numerous studies use pedestrian andmotorist behavior, vehicle speeds, conflicts, and other measures when analyzing the effects of differentpedestrian treatments.
Some major findings are:
! There is evidence that substantially improved nighttime lighting can enhance pedestriansafety in certain situations.
! At uncontrolled crosswalks (i.e., no stop sign or traffic signal on the approach roadway)on a two-lane road, the presence of a marked crosswalk is associated with no differencein pedestrian crash rate, compared to an unmarked crosswalk. On multi-lane roads withtraffic volumes above 12,000 vehicles per day, having a marked crosswalk alone, withoutother substantial improvements, is associated with a higher pedestrian crash rate (aftercontrolling for other site factors) compared to an unmarked crosswalk. More substantialimprovements are recommended to provide for safer pedestrian crossings at many suchpedestrian crossings, such as adding traffic signals with pedestrian signals whenwarranted, providing raised medians, initiating speed-reducing measures, and/or others.
! Providing raised medians on multi-lane roads can substantially reduce pedestrian crashrisk and can help pedestrians cross the street.
! At intersections with traffic signals, adding a WALK/DON’T WALK signal with astandard timing scheme (i.e., motorists move parallel to pedestrians and may turn right orleft on a green light across pedestrians’ path) has no significant effect on pedestriancrashes. Providing an exclusive pedestrian interval (i.e., motorists are stopped in all
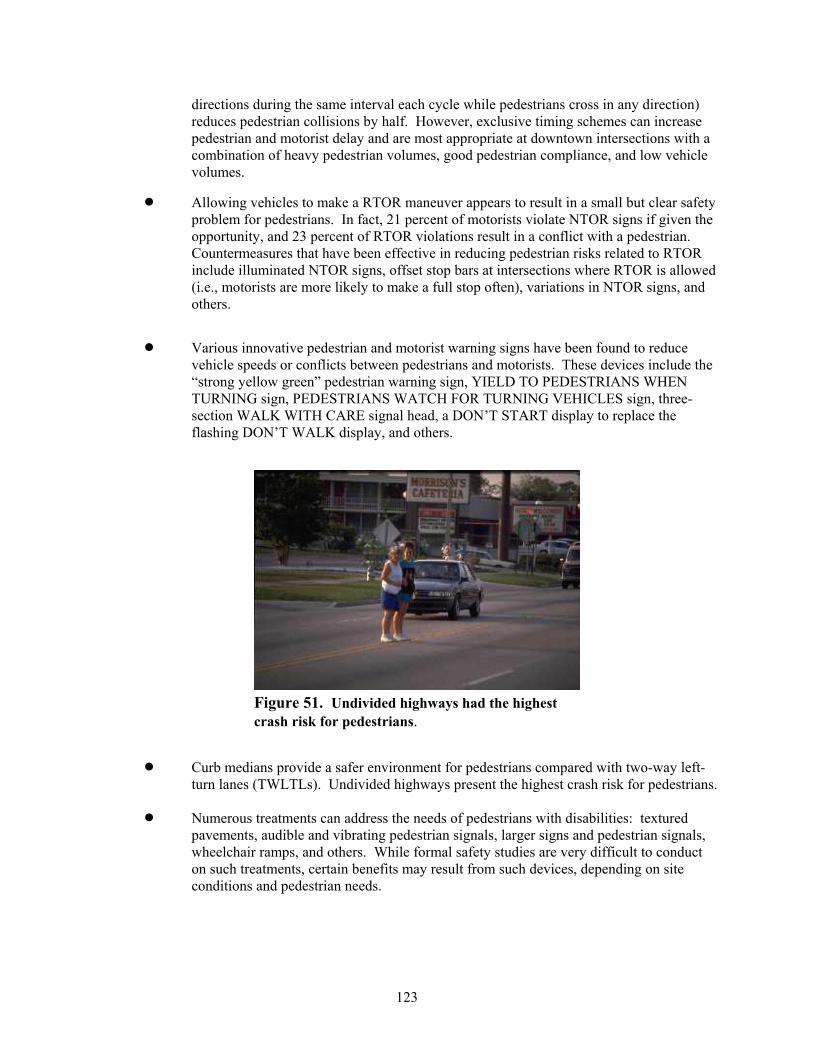
123
Figure 51. Undivided highways had the highestcrash risk for pedestrians.
directions during the same interval each cycle while pedestrians cross in any direction)reduces pedestrian collisions by half. However, exclusive timing schemes can increasepedestrian and motorist delay and are most appropriate at downtown intersections with acombination of heavy pedestrian volumes, good pedestrian compliance, and low vehiclevolumes.
! Allowing vehicles to make a RTOR maneuver appears to result in a small but clear safetyproblem for pedestrians. In fact, 21 percent of motorists violate NTOR signs if given theopportunity, and 23 percent of RTOR violations result in a conflict with a pedestrian. Countermeasures that have been effective in reducing pedestrian risks related to RTORinclude illuminated NTOR signs, offset stop bars at intersections where RTOR is allowed(i.e., motorists are more likely to make a full stop often), variations in NTOR signs, andothers.
! Various innovative pedestrian and motorist warning signs have been found to reducevehicle speeds or conflicts between pedestrians and motorists. These devices include the“strong yellow green” pedestrian warning sign, YIELD TO PEDESTRIANS WHENTURNING sign, PEDESTRIANS WATCH FOR TURNING VEHICLES sign, three-section WALK WITH CARE signal head, a DON’T START display to replace theflashing DON’T WALK display, and others.
! Curb medians provide a safer environment for pedestrians compared with two-way left-turn lanes (TWLTLs). Undivided highways present the highest crash risk for pedestrians.
! Numerous treatments can address the needs of pedestrians with disabilities: texturedpavements, audible and vibrating pedestrian signals, larger signs and pedestrian signals,wheelchair ramps, and others. While formal safety studies are very difficult to conducton such treatments, certain benefits may result from such devices, depending on siteconditions and pedestrian needs.
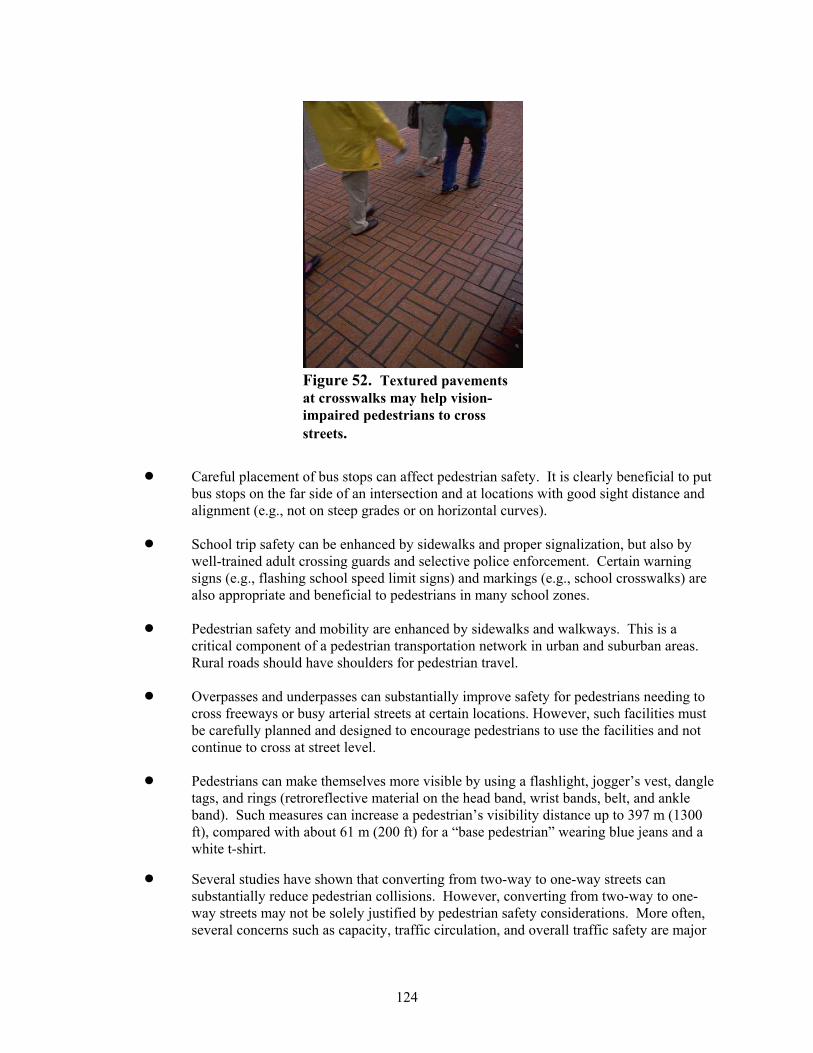
124
Figure 52. Textured pavementsat crosswalks may help vision-impaired pedestrians to crossstreets.
! Careful placement of bus stops can affect pedestrian safety. It is clearly beneficial to put bus stops on the far side of an intersection and at locations with good sight distance andalignment (e.g., not on steep grades or on horizontal curves).
! School trip safety can be enhanced by sidewalks and proper signalization, but also bywell-trained adult crossing guards and selective police enforcement. Certain warningsigns (e.g., flashing school speed limit signs) and markings (e.g., school crosswalks) arealso appropriate and beneficial to pedestrians in many school zones.
! Pedestrian safety and mobility are enhanced by sidewalks and walkways. This is acritical component of a pedestrian transportation network in urban and suburban areas. Rural roads should have shoulders for pedestrian travel.
! Overpasses and underpasses can substantially improve safety for pedestrians needing tocross freeways or busy arterial streets at certain locations. However, such facilities mustbe carefully planned and designed to encourage pedestrians to use the facilities and notcontinue to cross at street level.
! Pedestrians can make themselves more visible by using a flashlight, jogger’s vest, dangletags, and rings (retroreflective material on the head band, wrist bands, belt, and ankleband). Such measures can increase a pedestrian’s visibility distance up to 397 m (1300ft), compared with about 61 m (200 ft) for a “base pedestrian” wearing blue jeans and awhite t-shirt.
! Several studies have shown that converting from two-way to one-way streets cansubstantially reduce pedestrian collisions. However, converting from two-way to one-way streets may not be solely justified by pedestrian safety considerations. More often,several concerns such as capacity, traffic circulation, and overall traffic safety are major

125
considerations. One-way streets can greatly simplify the task of crossing a street,particularly if the one-way street conversion does not result in increased vehicle speeds.
! While traffic-calming measures are primarily intended for neighborhood streets to reducevehicle speeds and/or reduce cut-through vehicle traffic, such measures as street closures,speed humps, chicanes, traffic curbs, diverters, and others are in use in various U.S.cities. While controversial, many of these measures have been found to be effective inimproving safety for pedestrians and/or traffic as a whole based on reductions in crashes,vehicle speeds, and/or reductions in cut-through traffic on neighborhood streets.
! Education for pedestrians has been found in a few studies to reduce crashes involvingchild pedestrians. However, most U.S. educational programs were found to havereceived little if any formal evaluations or to have had only limited measurable effects.
! Enforcement of traffic laws and regulations represents another important element in safepedestrian activity in a roadway environment. This includes not only enforcingpedestrian regulations (e.g., jaywalking, crossing against the signal) but also motoristactions related to pedestrians (e.g., speeding, yielding to pedestrians when turning, drunkdriving). While a number of U.S. cities (e.g., Seattle, Milwaukee, San Diego) have hadactive police enforcement programs in recent years, no quantitative studies are knownthat have determined the specific effects of police enforcement on pedestrian crashes andinjuries. Further, such a study would be very difficult to conduct because of the manyother contributing crash factors in a city.
Summary reports of pedestrian research are provided at http://www.walkinginfo.org/rd/international.htm for the United Kingdom, Canada, the Netherlands, Scandinavia, and Australia. Whilemuch has been learned from pedestrian research over the past two or three decades, there is still much todiscover about measures that might affect safety and mobility for those who choose to walk.

126
127
Annotated Bibliography on Traffic Calming Measures
Several sources exist with extensive text, illustrations, etc. Some are listed here:
! Traffic Calming: State of the Practice, FHWA, Report RD-99-135, August, 1999, Ewing,R.H.
This report looks at the design, impact, and other considerations surrounding traffic-calmingmeasures in the U.S. and Canada. It covers information on traffic-calming in different contexts fromurban residential areas to areas where high-speed rural highways transition into rural communities. Thereport is based on detailed information collected on traffic-calming programs in 20 featured communities,another 30 communities surveyed less extensively, and a parallel Canadian effort by the Canadian ITE(CITE) and the Transportation Association of Canada (TAC).
! Traffic Calming in Practice, County Surveyors Society, Landor Publishing Limited,Quadrant House, London, SE11 5RD, November, 1994.
With a considerable list of references and lavishly illustrated, this report claims to be “anauthoritative source book with 85 case studies.” Among the 85 case studies are 18 different types ofinterventions. Each case study is laid out in a two-page spread with photos, schematics, speed and crashdata, etc. In 72 of the 85 cases, before- and after-crash data are presented, and in 69 of the 72, crashes arelower in the after period than they were before. However, this is not a research document; what might bethe nature or strength of the study designs cannot readily be ascertained from the discussions.
! Towards Traffic Calming: A Practitioner’s Manual, Hawkey, L., Henson C., Hulse, A., andBrindle, R., Federal Office of Road Safety, Canberra, Australia, August, 1992.
This manual shows numerous methods of slowing down vehicular traffic, the presumedbeneficiaries being pedestrians and bicyclists, and cites the need for evaluation of effectiveness and lackthereof. It contains good visuals and descriptions: humps, narrowing, mini-roundabouts. There is asection on international references.
! National Bicycle and Walking Study: Case Study 19: Traffic Calming, FHWA, Report PD-93-028, January, 1994, Clarke, A. And Dornfield, M.
This report contains a discussion of pros and cons of the “Woonerven” (the Netherlands). Several efforts produced good results: less speed, fewer crashes, lower volume (though of course lessspeed and volume are good for some and bad for others). This report also addresses U.S. traffic-calminginitiatives: speed humps, mini-roundabouts, chicanes, bike boulevards, channelization changes, slowstreets, traffic diverters, and corner treatments.
! FHWA Study Tour for Pedestrian and Bicyclist Safety in England, Germany, and theNetherlands, October 1994, FHWA, DOT, Zegeer, C., Cynecki, M., Fegan, J., Gilleran, B.,Lagerway, P., Tan, C, and Works, B.
Countermeasures discussed include:
England: chicanes, narrowing, humps, roundabouts (humps are sometimes designed to allow widetrucks, buses, or emergency vehicles to pass unimpeded. City dwellers like the restrictions, and countrypeople want to retain the diminished access.
128
Netherlands: low speed limits, diverters, narrowing, block through-access
Germany: self-enforcing speed control, road narrowing
! “Traffic Calming, 1995,” Traffic Engineering Committee Workshop, Proceedings from 21papers, Ontario Traffic Conference, 20 Carlton Street, Toronto, M5B 2H5, November, 1995.
This compilation of papers describes a number of traffic-calming initiatives installed in variouscities and towns in Canada. The nature of the interventions is described and, in a number of instances,before-and after-data are presented. Drawings and photographs illustrate the installations.
! Slow Down You're Going Too Fast: The Community Guide to Traffic Calming, PublicTechnology, Inc., 1301 Pennsylvania Avenue, Washington, DC, 1998.
This guide contains 25 case studies designed to meet local government and communitydemands for information on traffic calming to provide a better quality of life for residents.
! “Traditional Neighborhood Development Street Design Guidelines,” Prepared by ITETransportation Planning Council Committee 5P-8, A Proposed Recommended Practice of theITE, 525 School St. NW, Suite 140, Washington, DC, June 1997.
This document presents a discussion of the concepts of traditional neighborhood development, also referred to as "The New Urbanism," as they relate to the role of streets in traditional neighborhooddevelopment communities. The document also includes a discussion of community design guidelines,specific guidance on geometric street design, and an appendix that summarizes some of the recentfindings on the relationship between urban design and travel demand.
! “Guidelines for the Design and Application of Speed Humps, A Recommended Practice of theInstitute of Traffic Engineers,” ITE Traffic Engineering Council Speed Humps Task ForceTENC-5TF-01, Douglas W. Wiersig, Chair, 525 School St. NW, Suite 140, Washington, DC,1997.
This document provides information on the recommended practice for the guidelines for usingspeed humps, community relations and administrative procedures, design and construction considerations,monitoring and evaluation of speed humps over time, and other considerations, such as liability,aesthetics, maintenance and enforcement needs. An extensive listing of source materials is also included.

129
REFERENCES
AAA Pedestrian Safety Report or Special Survey on Pedestrian Deaths and Injuries for Ages 0 through29. American Automobile Association, No. 7, February, 1984. Also 1977 edition.
AAA Special Study of School Child Pedestrian Accidents. AAA Pedestrian Safety Report, AmericanAutomobile Association, June 1968.
Accident Facts. 1988 Edition, National Safety Council, (and earlier editions), 1988.
Accident Facts. 1994 Edition, National Safety Council, Chicago, IL, 1994
Accident Facts. 1995 Edition, National Safety Council, Chicago, IL, 1995.
Accident Facts. 1996 Edition, National Safety Council, Chicago, IL, 1996.
Accident Facts. 1997 Edition, National Safety Council, Chicago, IL, 1997.
Accident Prevention Effects of Road Safety Devices - Annual Report. Japan Road Association, 1969.
Alcohol Fatality Facts 1990, Insurance Institute for Highway Safety, July 1990.
Allen, M.J., R.D. Hazlett, H.L. Tacker, and B.V. Graham. “Actual Pedestrian Visibility and thePedestrian's Estimate of His Own Visibility,” Conference Proceedings, American Association forAutomotive Medicine, October 1969.
Antonakos, C.L. Nonmotor Vehicle Travel in the 1990 Nationwide Personal Transportation Survey,Transportation Research Record 1502: Transportation Research Board, National Research Council,Washington, DC, p. 75, 1995.
Atkins, C. and M. Coleman. “The Influence of Traffic Calming on Emergency Response Times,” ITEJournal, August 1997, pp. 42-46.
Axelson, P.W., D.A. Chesney, D.V. Galvan, J.B. Kirschbaum, P.E. Longmuir, C. Lyons, and K.M.Wong. Designing Sidewalks and Trails for Access, Part I of II: Review of Existing Guidelines andPractices, Federal Highway Administration, Report No. FHWA HEP-99-006, July 1999.
Bartholomew, W.M. “Pedestrian Accidents in Service Areas of Selected City Recreation Facilities,”Traffic Safety Research Review, Vol. II, No. 4, December 1967.
Berger, W.G. Urban Pedestrian Accident Countermeasures Experimental Evaluation Studies. Vol. I--Behavioral Evaluation Studies. Vol. II-Accident Studies. Vol. III -Appendix A, Report Nos. DOT-HS-801-346, 347, and 348, National Highway Traffic Safety Administration, February 1975.
Blomberg, R.D. and D.F. Preusser. Identification and Test of Pedestrian Safety Messages for PublicEducation Programs, Report No. ED-74-3, National Highway Traffic Safety Administration, April 1975.
Blomberg, R.D., D.F. Preusser, A. Hale, and W.A. Leaf. Experimental Field Test of Proposed PedestrianSafety Messages, NHTSA, Nov. 1983.

130
Blomberg, R.D., A. Hale, and D.F. Preusser. Conspicuity for Pedestrians and Bicyclists: Definition ofthe Problem. Development and Test of Countermeasures, NHTSA, April, 1984.
Bowman, B.L., J.J. Fruin, and C.V. Zegeer. Handbook on Planning, Design, and Maintenance ofPedestrian Facilities, Federal Highway Administration, Report No. FHWA IP-88-019, March 1989.
Bowman, B.L. and R.L. Vecellio. “Effects of Urban and Suburban Median Types on Both Vehicular andPedestrian Safety,” Transportation Research Record 1445: Cross Section and Alignment Design Issues,Transportation Research Board, National Research Council, Washington, DC, p.169, 1994A.
Bowman, B.L. and R.L. Vecellio. “Assessment of Current Practice in Selection and Design of UrbanMedians to Benefit Pedestrians,” Transportation Research Record 1445: Cross Section and AlignmentDesign Issues, Transportation Research Board, National Research Council, Washington, DC, p. 180,1994b.
Braaksma, J.P. A Survey of Special Crosswalks in Canada, Report No. TP981 CR7708, CanadianDepartment of Transportation, The Directorate of Road and Motor Vehicle Traffic Safety, September1976.
Brindle, R. “Traffic Calming in Australia: More than Neighborhood Traffic Management,” ITE Journal,July 1997, pp. 26-33.
Britt, J.W., A.B. Bergman and J. Moffatt. “Law Enforcement, Pedestrian Safety, and Driver Compliancewith Crosswalk Laws: Evaluation of a Four-year Campaign in Seattle,” Transportation Research Record1485: Transportation Research Board, National Research Council, Washington, DC, 1995.
Brownfield, D.J. “Environmental Areas—Interim Report on a Before-After Accident Study,” TrafficEngineering and Control, Vol. 21, No. 5, May 1980.
Burritt, B.E., R.C. Buchanan, and E.I. Kalidova. “School Zone Flashers—Do They Really Slow Traffic?” ITE Manual, pp. 29-31, January 1990.
Cagley, C. “The Urban Setting of Juvenile Pedestrian Injuries: a Study of Behavioral Ecology andSocial Disadvantage,” Accident Analysis and Prevention, Vol. 24, No. 6, pp. 673-678, 1992.
Campbell, B.J. Unpublished tabulation of North Carolina accident data prepared for this report, 1996.
Chalis, L.A. and Associates, Pty., Ltd. “Development of an Audio Tactile Signal to Assist the Blind atPedestrian Crossings,” Melbourne, Australia, 1976.
Choueiri, E.M., R. Lamm, G.M. Choueiri, and B.M. Choueiri. “Pedestrian Accidents: A 15-year surveyfrom the United States and Western Europe,” ITE Journal, July, 1993, pp. 36-42.
Christoffel, K.K., M. Donovan, J. Schofer, K. Wills, and J.V. Lavinnge, Psychosocial Factors inChildhood Pedestrian Injury: A Matched Case-Control Study. Pediatrics, Vol. 97, No. 1, pp. 33-42, Jan.1996.
Clark, K.L., J.E. Hummer, and N. Dutt. “Field Evaluation of Fluorescent Strong Yellow-greenPedestrian Warning Signs,” Transportation Research Record 1538, Transportation Research Board,National Research Council, Washington, DC, p. 39, 1996.

131
Clarke, A. and M.J. Dornfeld. Traffic Calming, Auto-Restricted Zones and Other Traffic ManagementTechniques - Their Effects on Bicycling and Pedestrians, Case Study No. 19, National Bicycling and Walking Study, Publication No. FHWA-PD-93-028, Federal Highway Administration, Washington, DC,January 1994.
Clarke, A. and M. Dornfield., National Bicycle and Walking Study: Case Study No. 19: Traffic Calming,FHWA, Report PD-93-028, January, 1994.
Cline, E. "Design of Speed Humps...Or ‘The Kinder, Gentler Speed Hump,” Presented at the 45thCalifornia Symposium on Transportation Issues, May 12-14, 1993.
Compton, R.P. and E.V. Milton. “Safety Impact of Permitting Right-Turn-On-Red: a Report to Congressby the National Highway Traffic Safety Administration,”US DOT, December 1994.
Cove, L. “Pedestrian Accident Characteristics,” Federal Highway Administration, 1990.
Crook, A.D. “Effect on Accidents of Area Traffic Control in West London,” Traffic Engineering andControl, Vol. 12, No. 1, May 1970.
Cynecki, M.J. Personal communication, April 1998.
Cynecki, M.J., J.W. Sparks, and J.L. Grote. “Rumble Strips and Pedestrian Safety,” ITE Journal, August,1993, p. 18.
Cynecki, M.J. “Development of a Conflicts' Analysis Technique for Pedestrian Crossings,”Transportation Research Board, Record No. 743, TRB, 1980.
Davis, R.A. and D.F. Huelke. “Pedestrian Fatalities,” Highway Safety Research Institute, University ofMichigan, 1969.
Davis, S.E., H.D. Robertson, and L.E. King. “Pedestrian/Vehicle Conflicts: An Accident PredictionModel,” Transportation Publication Report No. 6, University of North Carolina at Charlotte, 1989.
Development of Model Regulations for Pedestrian Safety. U.S. Department of Transportation, NationalHighway Traffic Safety Administration, Washington, DC, Report No. DOT-HS-801-287, Nov. 1974.
Dickman, F.B. and W.S. Cope. “Drug Related Pedestrian and Bicyclist Crash Injuries,” TransportationResearch Circular 397, Transportation Research Board, National Research Council, Washington, DC,May 1992.
Dunne, R.G., K.N. Asher, and F.P. Rivara. “Behavior and Parental Expectations of Child Pedestrians,”Pediatrics, Vol. 89, No. 3, pp. 486-490, March 1992.
Earnhart, G. and L. Simon. Accessibility for Elderly and Handicapped Pedestrians-A Manual for Cities,Federal Highway Administration, Washington, DC, 1987.
Edminster, R. and D. Koffman. Streets for Pedestrians and Transit: An Evaluation of Three TransitMalls in the United States, Report No. UMTA-MA-06-00049-79-1, Urban Mass TransportationAdministration, February 1979.
132
Ekman, L. Fotgargares risker pa markerat overgangsstalle jamfort med andra korsningspunkter. Bulletin76. University of Lund, Lund, Sweden, 1988.
“Enforcement-Policing Pedestrian Protection,” Traffic Safety Magazine, National Safety Council, Vol.88, No. 1, Jan./Feb., 1988.
Engel, U. and Lars K. Thomsen. “Safety Effects of Speed Reducing Measures in Danish ResidentialArea,” Accident Analysis and Prevention, Vol. 24, No. 1, February 1992, pp. 17-28.
Evans. L. “Factors Influencing Pedestrian and Motorcyclist Fatality Risk,” Journal of Traffic Medicine,Vol. 19, No. 2, 1991.
Ewing, R.H. Traffic Calming: State of the Practice, Federal Highway Administration, Report No. FHWARD-99-135, August 1999.
Ewing, R. and C. Kooshian. “U.S. Experience with Traffic Calming,” ITE Journal, August 1997, pp. 28-33.
Fatal Accident Reporting System 1989 - A Decade of Progress. National Highway Traffic SafetyAdministration, 1990.
Ferguson, S.A., A.K. Lund, P.L. Zador, and R.G. Ulmer. “Daylight Saving Time and Motor VehicleCrashes: the Reduction of Pedestrian and Vehicle Occupant Fatalities,” American Journal of PublicHealth, January 1995.
Firth, D.E. Roads and Road Safety: Descriptions Given by Four Hundred Children, Report SR 138 UC,Transport and Road Research Laboratory, Crowthorne, England, 1975.
Fleig, P.H. and D.G. Duffy. “A Study of Pedestrian Safety Behavior Using Activity Sampling,” TrafficSafety Research Review, Vol. 11, No. 4, December 1967.
Frederick, M. “Yoeman’s Road” in “Traffic Calming, 1995,” Traffic Engineering Committee Workshop,Proceedings from 21 papers, Ontario Traffic Conference, 20 Carlton Street, Toronto, M5B 2H5,November 1995.
Freedman, M., M.S. Janoff, B.W. Koth, and W. McCunney. Fixed Illumination for PedestrianProtection, Report No. FHWA-RD-76-8, Federal Highway Administration, December 1975.
Fruin, J.J. “Pedestrian Accident Characteristics in a One-Way Grid,” Highway Research Record 436,Highway Research Board, 1973.
Gallon, C., P. Oxley, and B. Simms. “Tactile footway surfaces for the blind,” Transport ResearchLaboratory (report 257), Crowthorne, England, 1991.
Gallon, C., “Tactile surfaces in the pedestrian environment: Experiments in Wolverhampton,” TransportResearch Laboratory (report 317), Crowthorne, England, 1992.
General Estimates System 1989—A Review of Information On Police-Reported Traffic Crashes in theUnited States, National Highway Traffic Safety Administration, 1990.
133
Gibby, A.R., J.L. Stites, G.S. Thurgood, and T.C. Ferrara. “Evaluation of Marked and UnmarkedCrosswalks at Intersections in California,” Chico State University, Report Number FHWA/CA/TO-94/1,June 1994.
Goodwin, P.W. and T.P. Hutchinson. “The Risk of Walking,” Transportation (The Netherlands), Vol. 6,No. 3, September 1977.
Gurnett, G. “Marked Crosswalk Removal Before and After Study,” Los Angeles County RoadDepartment, November 1974.
Habib, P.A. “Pedestrians Safety: The Hazards of Left-Turning Vehicles,” ITE Journal, Institute ofTransportation Engineers, April 1980.
Harrell, W.A. “Driver Response to a Disabled Pedestrian Using a Dangerous Crosswalk,” Journal ofEnvironmental Psychology, Vol.12, pp. 345-354, 1992.
Hauck, J. “Well-Marked Crosswalks are a Pedestrian's Best Friend,” Rural and Urban Roads, Vol. 17,No. 3, March 1979.
Hawkey, L., C. Henson, A. Hulse, and R. Brindle. “Towards Traffic Calming: a Practitioners Manual,”Federal Office of Road Safety, Canberra, Australia, August 1992.
Hawkins, A.F. Priority Accessible Network for the Elderly and Handicapped Pedestrians in NewOrleans, Federal Highway Administration, Report No. FHWA-TS-84-206, June 1984.
Hawley, L., Colin Henson, Andrew Hulse, and Ray Brindle. Towards Traffic Calming: A Practitioners'Manual of Implemented Local Area Traffic Management and Blackspot Devices, Publication No. CR126, Federal Office of Road Safety, Canberra, Australian Capital Territory, Australia, August 1992.
Hazlett, R.D. and M.J. Allen. “The Ability to See A Pedestrian at Night: The Effects of ClothingReflectorization, and Driver Intoxication,” American Journal of Optometry, Vol. 45, No. 4, April 1968.
Herget, H. “Willowbrook Road Traffic Calming Project,” Frederick, M., in “Traffic Calming, 1995,”Traffic Engineering Committee Workshop, Proceedings from 21 papers, Ontario Traffic Conference, 20Carlton Street, Toronto, M5B 2H5, November 1995.
Herms, B. “Pedestrian Crosswalk Study: Accidents in Painted and Unpainted Crosswalks,” City of SanDiego Traffic Engineering Study, Project pp-69-2-001, 1970.
Herms, B. “Pedestrian Crosswalk Study: Accidents in Painted and Unpainted Crosswalks,” HighwayResearch Record Number 406 Pedestrian Protection, Highway Research Board, pp. 1-13, WashingtonDC, 1972.
Herms, B., et al. “Guidestrips for Visually Handicapped Pedestrians,” Proceedings, Seminar onPlanning, Design, and Implementation of Bicycle/Pedestrian Facilities, Institute of Transportation andTraffic Engineering, University of California, May 1975.
Huang, H. and C. Zegeer. “An Evaluation of Pedestrian Countdown Signals,” Report No. FHWADTFH61-92-R-00138. University of North Carolina Highway Safety Research Center, Chapel Hill, NC,1999.

134
Huang, H. An Evaluation of Illuminated Pedestrian Push Buttons, Report No. FHWA DTFH61-92-R-00138, University of North Carolina Highway Safety Research Center, Chapel Hill, NC, 1999.
Huang, H.F. and C.V. Zegeer, “An Evaluation of Illuminated Pedestrian Push Buttons in Windsor,Ontario,” Report No. FHWA-RD-00-102, University of North Carolina Highway Safety Research Center,Chapel Hill, NC, August 2000.
Huang, H.F. and M.J. Cynecki. “The Effects of Traffic Calming Measures on Pedestrian and MotoristBehavior,” Report No. FHWA-RD-00-104, University of North Carolina Highway Safety ResearchCenter, Chapel Hill, NC & City of Phoenix, Street Transportation Dept., Phoenix, AZ, August 2000.
Huang, H., C. Zegeer, R. Nassi, and B. Fairfax. “The Effects of Innovative Pedestrian Signs atUnsignalized Locations: A Tale of Three Treatments,” Report No. FHWA-RD-00-098, University ofNorth Carolina Highway Safety Research Center, Chapel Hill, NC & City of Tucson, Department ofTransport, Tucson, AZ, August 2000.
Hughes, R., H. Huang, M. Cynecki, and C. Zegeer. “Automated Pedestrian Detection Used inConjunction with Standard Pedestrian Push Buttons at Signalized Intersections,” Report No. FHWADTFH61-92-R-00138, University of North Carolina Highway Safety Research Center, Chapel Hill, NC,March 1999.
Hughes, R., H. Huang, C. Zegeer, and M. Cynecki, “Evaluation of Automated Pedestrian Detection atSignalized Intersections.” Report No. FHWA-RD-00-097, University of North Carolina Highway SafetyResearch Center, Chapel Hill, NC & City of Phoenix, Street Transportation Dept., Phoenix, AZ, August2000.
Hulscher, F.R. “Traffic Signal Facilities for Blind Pedestrians,” Preliminary Report, New South WalesDepartment of Motor Transport, Australia, January 1975.
Hunter, W., J. Stutts, W. Pein, and C. Cox. “Pedestrian and Bicycle Crash Types of the Early 1990s,”February 1995, University of North Carolina Highway Safety Research Center, Contract numberFHWA-RD 95-163, 1996.
Husband, P. and I. Sobey. Factors Contributing to Pedestrian Involvement in Road Crashes, JointARRB/DOT Pedestrian Conference, Australian Road Research Board, 1978.
ITE Technical Council Task Force on Speed Humps. Guidelines for the Design and Application ofSpeed Humps, ITE Journal, Vol. 63, No. 5, May 1993, pp. 11-17.
Jacobs, G.D. “Pedestrian Behavior on a Length of Road Containing Guard Rails,” Traffic Engineeringand Control, January 1966.
Jacobs, G.D., S.J. Older, and D.G. Wilson. A Comparison of Road User Behavior at X-Way and OtherPedestrian Crossings; Report TRRL 145, Transport and Road Research Laboratory, Crowthorne,England, 1968A.
Jacobs, G.D. The Effect of Vehicle Lighting on Pedestrian Movement in Well-Lighted Streets, Report 214,Transport and Road Research Laboratory, Crowthorne, England, 1968B.
Katz, A., D. Zaidel, and A. Elgrishi. “An Experimental Study of Driver and Pedestrian Interaction Duringthe Crossing Conflict,” Human Factors, Vol. 17, No. 5, pp. 514-527, 1975.
135
Katz, A. Designing Safety and Comfort into the Environment, Joint ARRB/DOT Pedestrian SafetyConference, Australian Road Research Board, Sydney, Australia, November 1978.
Kemper, B. and P. Fernandez. “Design and Safety of Pedestrian Facilities,” ITE Technical Committee5A-5, December 1994.
Kirschbaum, J.B., P.W. Axelson, P.E. Longmuir, K.M. Mispagel, J.A. Stein, and D.A. Yamada. Designing Sidewalks and Trails for Access, Part II of II: Best Practices Design Guide, Federal HighwayAdministration, Report No. FHWA EP-01-027, September 2001.
Klik, M. and Ardeshir Faghri. “A Comparative Evaluation of Speed Humps and Deviations,” Transportation Quarterly, Vol. 47, No. 3, July 1993, pp. 457-469.
Kloeckner, J.H., R. Lamm, E.M. Choueiri, and T. Mailaender. “Traffic Accidents InvolvingAccompanied and Unaccompanied Children in the Federal Republic of Germany,” TransportationResearch Record 1210, Transportation Research Board, National Research Council, Washington, DC,1989.
Knoblauch, R.L., “Urban Pedestrian Accident Countermeasures Experimental Evaluation, NationalHighway Traffic Safety Administration, DOT-HS-801-347, February 1975.
Knoblauch, R., "The Effect of Crosswalk markings on Vehicle Speeds in Maryland, Virginia, andArizona", Center for Applied Research, Inc., Great falls, VA, FHWA Contract DTFH61-92-C-00138,July 1998.
Knoblauch, R.L, M.T. Pietrucha, and M. Nitzburg. “Field Studies of Pedestrian Walking Speed andStart-Up Time,” Transportation Research Record 1538: Pedestrian and Bicycle Research, TransportationResearch Board, National Research Council, Washington, DC, p. 27, 1996.
Knoblauch, R.L. Causative Factors and Countermeasures for Rural and Suburban Pedestrian Accidents:Accident Data Collection and Analysis, Report No. DOT-HS-802-266, National Highway Traffic SafetyAdministration, June 1977.
Knoblauch, R.L., W. Moore, Jr., and P.R. Schmitz. Pedestrian Accidents Occurring on Freeways: AnInvestigation of Causative Factors. Accident Data Collection and Analysis, Report Nos. FHWA-RD-78-169/171, Federal Highway Administration, 1978.
Knoblauch, R., M. Nitzburg, and R. Seifert. “Pedestrian Crosswalk Case Studies: Sacramento,California; Richmond, Virginia; Buffalo, New York, Stillwater, Minnesota,” Center for AppliedResearch, Inc., Great falls, VA, FHWA Contract DTFH61-92-C-00138, March 1999.
Knoblauch, R.L., B.H. Tustin, S.A. Smith, and M.T. Pietrucha. Investigation of Exposure BasedPedestrian Accident Areas: Crosswalks. Sidewalks. Local Streets and Major Arterials, Federal HighwayAdministration, Report No. FHWA/RD-87-038, February 1987.
Knoblauch, R.L. and P.D. Raymond, “The Effect of Crosswalk Markings on Vehicle Speeds in Maryland,Virginia, and Arizona,” Report No. FHWA-RD-00-101, Center for Applied Research, Inc., Great Falls,VA, August 2000.

136
Knoblauch, R.L., M. Nitzburg, and R.F. Seifurt. “Pedestrian Crosswalk Case Studies: Sacramento,California; Richmond, Virginia; Buffalo, New York; Stillwater, Minnesota,” Report No. FHWA-RD-00-103, Center for Applied Research, Inc., Great Falls, VA, August 2000.
Koenig, D.J. and Z. Wu. “The Impact of a Media Campaign in the Reduction of Risk-Taking Behavior onthe Part of Drivers,” Accident Analysis and Prevention, vol. 26, pp. 625-633, 1994.
Kraay, J.H. “Strategies in Pedestrian Road Safety Research,” Reprinted in Voice of the Pedestrian,International Federation of Pedestrians, Autumn 1976.
Lalani, N. “Road Safety at Pedestrian Refuges,” Transportation Engineering, Vol. 18, No. 9, September1976.
Larsen, C.A. Priority Accessible Network for the Elderly and Handicapped in Seattle, Federal HighwayAdministration, Report No. FHWA-TS-84-205, June 1984.
Lea, N.D. and Associates. A Study of Measures to Improve Pedestrian and Bicycle Safety, Report No. TP1004, Canadian Department of Transport, 1978.
Leonard, J. and J. Davis. “Urban Traffic Calming Treatments: Performance Measures and DesignConformance,” ITE Journal, August 1997, pp. 34-39.
Lockwood, I. “ITE traffic calming definition,” ITE Journal, July 1997, pp. 22-24.
Lord, D. “Analysis of Pedestrian Conflicts with Left Turning Traffic,” Transportation Research Record1538: Pedestrian and Bicycle Research, Transportation Research Board, National Research Council,Washington, DC, p. 61, 1996.
Los Angeles County Road Department. “Marked Crosswalks at Non-Signalized Intersections,” Trafficand Lighting Division, July 1967.
Lovemark, O. “Pedestrians in Town Centers—A Summary of Some Research Project,” Pedestrian SafetyProject Report No. 27, North American Treaty Organization Committee on the Challenge of ModernSociety, National Highway Traffic Safety Administration, March 1974.
Macbeth, A. “Balliol Street,” in Traffic Calming, 1995, Traffic Engineering Committee Workshop,Proceedings from 21 papers, Ontario Traffic Conference, 20 Carlton Street, Toronto, M5B 2H5,November 1995.
Mackie, A.M. and S.J. Older. “Study of Pedestrian Risk in Crossing Busy Roads in London InnerSuburbs,” Traffic Engineering and Control, October 1965.
Malefant, L. and R. Van Houten. “Increasing the Percentage of Drivers Yielding to Pedestrians in ThreeCanadian Cities with a Multifaceted Safety Program,” Health Education Research, Vol. 5, No. 2, pp.275-279, 1989.
Malo, A.F., A. Freed, D.E. Cleveland, J.V. Arthungal, and C. Jorgenson. An Innovative PedestrianCrosswalk Safety Device Demonstration, Report TRS-8, Highway Safety Research Institute, 1971.
Manual on Uniform Traffic Control Devices for Streets and Highways. Federal Highway Administration,1988.
137
Matthias, J.S., and A. Stonex. Pedestrian Accidents in Arizona: An Investigation of Causative Factorsand Recommendations for Safety Improvements. Report No. FHWA/AZ-84/210. Arizona Department ofTransportation, 1985.
McDonald, P.E., and J.R. Jarvis. The Use of Road Humps on Residential Streets in the Shire of Corio,ARRB Internal Report, AIR 335-2, Australian Road Research Board, 1981.
McMahon, P.J., A.J. Khattak, C. Duncan, J.R. Stewart, & C.V. Zegeer. “An Analysis of FactorsContributing to “Walking Along Roadway” Crashes: Research Study and Guidelines for Sidewalks andWalkways.” Report No. FHWA-RD-01-101. University of North Carolina Highway Safety ResearchCenter, Chapel Hill, NC, November 2000.
Miles-Doan, R. “Alcohol Use Among Pedestrians and the Odds of Surviving an Injury: Evidence FromFlorida Law Enforcement Data,” Accident Analysis and Prevention, Vol. 28, No. 1, pp. 23-31, 1996.
Model Pedestrian Safety Program. User's Manual Report No. FHWA-IP-78-6, Federal HighwayAdministration, 1977 and 1987 editions.
Model Ice Cream Truck Ordinance, U.S. Department of Transportation, National Highway Traffic SafetyAdministration, Report No. DOT-HS-804829, August 1979.
Moore, R.L. and S.J. Older. “Pedestrians and Motor Vehicles are Compatible in Today's World,” TrafficEngineering, Vol. 35, No. 12, Sept. 1965.
Morrall, J.F., L.L. Ratnayake, and P.N. Seneviratne. “Comparison of CBD Pedestrian Characteristics inCanada and Sri Lanka,” Transportation Research Record 1294: Non-Motorized transportation,Transportation Research Board, National Research Council, Washington, DC, 1991.
Mortimer, R.G. “Behavioral Evaluation of Pedestrian Signals,” Traffic Engineering, Vol. 44, No. 2,1973.
National Safety Council. Walk Alert - National Pedestrian Safety Program 1988 Program Guide,National Safety Council, Chicago, Illinois, 1988.
Nitzbgurg, M. and R. L. Knoblaugh, “An Evaluation of High Visibility Crosswalk Treatments,” ReportNo. FHWA DTFH61-92-R-00138, Center for Applied Research, Great Falls, VA, 1999.
Nitzburg, M. and R.L. Knoblauch. “An Evaluation of High-Visibility Crosswalk Treatment - Clearwater,Florida,” Report No. FHWA-RD-00-105, Center for Applied Research, Inc., Great Falls, VA, August2000.
Nizlek, M.C. “Pedestrian Traffic Accident Characteristics, Tucson, Arizona,” 23rd Annual ArizonaConference on Roads and Streets, April 18, 1984.
North Carolina Traffic Accident Facts - 1989. Division of Motor Vehicles, North Carolina DOT, 1990.
Owens, D.A. and R.J. Antonoff. “Biological Motion and Nighttime Pedestrian Conspicuity,” HumanFactors, Vol. 36, No. 4, pp. 718-732, 1994.
138
O’Leary, A.A., P.B. Lockwood, and R.V. Taylor. “Evaluation of Detectable Warning Surfaces forSidewalk Curb Ramps,” Transportation Research Record 1538, Pedestrian and Bicycle Research,Transportation Research Board, National Research Council, Washington, DC, p. 47, 1996.
Palamarthy, S., H.S. Mahmassani, and R.B. Machemehl. “Models of Pedestrian Crossing Behavior atSignalized Intersections,” Report 1296-1, Center for Transportation Research, University of Texas atAustin, January 1994.
Parent, A. “Heritage Drive” in “Traffic Calming, 1995,” Traffic Engineering Committee Workshop,Proceedings from 21 papers, Ontario Traffic Conference, 20 Carlton Street, Toronto, M5B 2H5,November 1995.
Pegrum, B.V. “The Application of Certain Traffic Management Techniques and Their Effect on RoadSafety,” National Road Safety Symposium, March 1972.
Petzold, R.G. Urban Intersection Improvements for Pedestrian Safety. Vol. I-Executive Summary,Report No. FHWA-RD-77-142, Federal Highway Administration, December 1977.
Pfefer, R.C., A. Sorton, J. Fegan, and M.J. Rosenbaum. “Pedestrian Ways-Chapter 16, Synthesis ofSafety Research Related to Traffic Control and Roadway Elements,” Federal Highway Administration,Washington, DC, December 1982.
Planning Community Pedestrian Safety Programs - An Agenda for Action. National Highway TrafficSafety Administration Report No. DOT-HS-807-578, June 1980.
Pless, I.B. , H.G. Taylor, and L. Arsenault. “The Relationship Between Vigilance Deficits and TrafficInjuries Involving Children,” Pediatrics, Vol. 95, No. 2, pp. 219-224, February 1995.
Polus, A. and A. Katz. “An Analysis of Nighttime Pedestrian Accidents at Specially IlluminatedCrosswalks,” Accident Analysis and Prevention, Vol. 10, No. 3, September 1978.
Preusser, D. “Education: Training Walkers to Watch,” Traffic Safety Magazine, National SafetyCouncil, Vol. 88, No. 1, Jan./Feb. 1988.
Preusser, D.F. and A.K. Lund. “And Keep on Looking: A Film to Reduce Pedestrian Crashes Among 9to 12 Year Olds,” Journal of Safety Research, Vol. 19, 1988.
Preusser, D.F., W.A. Leaf, K.B. Debartla, and R.D. Blomberg. The Effects of Right-Turn-On-Red onPedestrians and Bicycle Accidents, NHTSA-DOT/HS-806/182, Dunlap and Associates, Inc., Darien, CT,October 1981.
Public Works. “To Paint or Not to Paint,” April 1969, pp. 70-72.
Reading, J.B. “Pedestrian Protection Through Behavior Modification,” Traffic Engineering, Vol. 43, No.10, July 1973.
Reclaiming Our Streets: A Community Action Plan, Portland Bureau of Traffic Management, Portland,Oregon, February 1993.
Rehabilitation Alcohol Test, Evaluation, and Retrieval System - 1989 Annual Report. North CarolinaDepartment of Transportation, Division of Motor Vehicle, Drivers License Section, 1990.

139
Reiss, M. School Trip Safety and Play Areas. Vol. I—Executive Summary, Report No. FHWA-RD-75-104, Federal Highway Administration, November 1975A.
Reiss, M. Guidelines for the Location and Operation of Urban Play Streets, Vol. VII, Report No.FHWA-RD-75-ll0, Federal Highway Administration, November 1975B.
Replogle, M. Bicycle and Pedestrian Policies and Programs in Asia, Australia, and New Zealand. CaseStudy 17, National Bicycling and Walking Study. Report No. FHWA-PD-93-016. Federal Highway Administration, Washington, DC, April 1992.
Retting, R.A., B.N. Persaud, P.E. Garder, and D. Lord. “Crash and injury reduction followinginstallation of roundabouts in the United States,” American Journal of Public Health, Vol. 91, 2001, pp.628-31.
Richardson, E., and J.R. Jarvis. The Use of Road Humps on Residential Streets in the City of Stirling,Western Australia. ARRB Internal Report, AIR 335-3, Australian Road Research Board, 1981.
Road Safety Division. “Fact Sheet - Road Humps,” Department of Transport, London, United Kingdom,August 1993.
Roberts, D.C. “Pedestrian Needs: Insights From a Pilot Survey of Blind and Deaf Individuals,”Highway Research Record 403, Highway Research Board, 1972.
Robertson, H.D. and E.C. Carter. “The Safety, Operational, and Cost Impacts of Pedestrian Indicationsat Signalized Intersections,” Record No. 959, TRB, 1984.
Rumar, K. “Night Driving: Visibility of Pedestrians,” Seventh International Road Safety Congress,London, England, September 1966.
San Diego Association of Governments. Evaluation of Audible Pedestrian Traffic Signals, December1988.
Sandels, S. Children in Traffic. Paul Elek, London, 1975.
Sandels, S. “The Skandia Report III, Unprotected Road Users, A Behavioral Study,” Skandia InsuranceCo., 1979.
Sargent, K.J. and D. Sheppard, The Development of the Green Cross Code, Report LR 605, Transport andRoad Research Laboratory, Crowthorne, England, 1974.
Sarker, S. “Evaluation of Different Types of Pedestrian-vehicle Separations,” Transportation ResearchRecord 1502: Bicycle and Pedestrian Research, Transportation Research Board, National ResearchCouncil, Washington, DC, p. 83, 1995.
Sarker, S., J. Nederveen, and A. Pols. “Role of Traffic Calming in Improving Pedestrian Safety,” August1996, unpublished.
Schalbbach, K. “Traffic calming in Europe,” ITE Journal, July 1997, pp. 38-40.
Skene, M., G. Chartier, D. Erickson, G. Mack, and R. Drdul, “Developing a Canadian Guide to TrafficCalming,” ITE Journal, July 1997, pp. 34-36.

140
Smeed, R.J. “Some Aspects of Pedestrian Safety,” Journal of Transport Economics and Policy, Vol. 2,No. 3, September 1968.
Smith, S.A., et al. Planning and Implementing Pedestrian Facilities in Suburban and Developing RuralAreas, National Cooperative Highway Research Program Report 294A, Transportation Research Board,Washington, DC, June 1987.
Snyder, M.B. and R.L. Knoblauch. Pedestrian Safety: The Identification of Precipitating Factors andPossible Countermeasures, Report No. DOT-HS-800-403, 2 Vols., National Highway Traffic SafetyAdministration, January 1971.
Solnick, S.J. and D. Hemenway. “The Hit and run in Fatal Pedestrian Accidents: Victims,Circumstances, and Drivers,” Accident Analysis and Prevention, Vol. 27, No. 5, pp. 643-649, 1995.
“Speed Control Humps.” Traffic Advisory Leaflet 2/90, Department of Transport, London, UnitedKingdom, October 1990.
Spielberg, P. “Traffic Engineering for Neotraditional Neighborhood Design,” ITE TechnicalCommittee, 5P-8, February 1994, ITE, Washington, DC
Sterling, C.F. “An Analysis of Pedestrian Reaction to the Flashing WALK Indication,” TrafficEngineering, Vol. 44, No. 14, November 1974.
Swan, S. “Treatments of Overpasses and Undercrossing for the Disabled: Early Report on the State-of-the Art,” Transportation Research Record 683, Transportation Research Board, 1978.
Szplett, D. And L. Sale. “Some Challenges in Developing Neotraditional Neighborhood Designs,” ITEJournal, July 1997, pp. 42-45.
Tan, C.H. and C.Z. Zegeer. “European Practices and Innovations for Pedestrian Crossings,” ITEJournal, pp. 24-31, November 1995.
Tanaboriboon., Y. and J.A. Guyano. “Analysis of Pedestrian Movements in Bangkok,” TransportationResearch Record 1294: Non-Motorized Transportation, Transportation Research Board, NationalResearch Council, Washington, DC, 1991.
Templer, J., et al. Development of Priority Accessible Networks - An Implementation Manual -Provisions for the Elderly and Handicapped Pedestrians, Report No. FHWA/IP80/8, Federal HighwayAdministration, Washington, DC., 1980.
Templer, J. Provisions for Elderly and Handicapped Pedestrians, Report Nos. FHWA-RD-79-l, 2, and 3,Federal Highway Administration, January 1979.
Tidwell, J.E. and D.P. Doyle. “Driver and Pedestrian Comprehension of Pedestrian Law and TrafficControl Devices,” Transportation Research Record 1502, Title, Transportation Research Board, NationalResearch Council, Washington, DC, p. 119, 1995.
Tobey, H.N., E.M. Shunamen, and R.L. Knoblauch. Pedestrian Trip Making Characteristics andExposure Measures, DTFH61-81-C-00020, Federal Highway Administration, 1983.

141
“Traffic Calming in Practice,” County Surveyors Society, Landor Publishing Limited, Quadrant House,London, SE11 5RD, November 1994.
Traffic Safety Facts; 1994. National Highway Traffic Safety Administration of the US Department ofTransportation, August 1995.
Traffic Safety Facts, 1997. National Highway Traffic Safety Administration, US Department ofTransportation, November 1998 (http://www.nhtsa.dot.gov/people/ncsa/index.html).
Transportation in an Aging Society: Improving Mobility and Safety for Older Pedestrians, SpecialReport No. 218, Vol.1, Transportation Research Board, 1988.
“Uniform Vehicle Code and Model Traffic Ordinance, Revised 1992,” National Committee on UniformTraffic Laws and Ordinances, Evanston, IL 60201.
Vallette, G.R. and J.A. McDivitt. Pedestrian Safety Programs - A Review of the Literature andOperational Experience, Report No. FHWA/RD-80/190, Federal Highway Administration, Washington,DC, January 1981.
Van Houten, R. “The Influence of Signs Prompting Motorists to Yield Before Marked Crosswalks onMotor Vehicle-pedestrian Conflicts at Crosswalks with Flashing Amber,” Accident Analysis andPrevention, Vol. 24, No. 3, pp. 217-225, 1992.
Van der Does, V.1. “Crossing the Road in Japan,” Reprinted in Voice of the Pedestrian, InternationalFederation of Pedestrians, Autumn 1976.
Varhelyi, A. “Driver’s Speed Behavior at a Zebra Crossing,” Lund Institute of Technology, Lund,Sweden, 1996.
Walter, E. “Suburban Residential Traffic Calming,” ITE Journal, Vol. 65, No. 9, pp. 44-48, September1995.
West, J. and A. Lowe. “Integration of Transportation and Land Use Planning Through Residential StreetDesign,” ITE Journal, August 1997, pp. 48-51.
Whitlock and Weinberger Transportation, “Evaluation of an In-Pavement Flashing Lights CrosswalkWarning System,” Report No. FHWA DTFH61-92-R-00138, University of North Carolina HighwaySafety Research Center, Chapel Hill, March 1999.
Williams, A.F. and A.K. Lund. “Alcohol Impaired Driving and Crashes Involving Alcohol in the UnitedStates During the 1970s and 1980s,” Proceedings of the 11th International Conference on Alcohol, Drugsand Traffic Safety, Chicago, Illinois, National Safety Council, 1990.
Work Zone Traffic Management Synthesis: Work Zone Pedestrian Protection, Federal HighwayAdministration, 1989.
Yagar, S. “Safety Impacts of Installing Pedestrian Crosswalks,” Proceedings of the ConferenceEffectiveness of Highway Safety Improvements, American Society of Civil Engineers, New York, NY,March 1985.
142
Zaidel, D., A.S. Hakkert, and A.H. Pistiner. “The Use of Road Humps for Moderating Speeds on UrbanStreets,” Accident Analysis and Prevention, Vol. 24, No. 1, February 1992, pp. 45-56.
Zaidel, D.M. and I. Hocherman. “Safety of Pedestrian Crossings at Signalized Intersections,” Record No.1141, Transportation Research Board, 1987.
Zegeer, C., P.A. Lagerwey, M. Cynecki, A. Ross, and M. Ronkin. “Providing Places for Pedestrians toWalk Along Streets and Highways,” Report No. FHWA DTFH61-92-R-00138, University of NorthCarolina Highway Safety Research Center, Chapel Hill, 1999.
Zegeer, C., M. Cynecki, J. Fegan, B. Gilleran, P. Lagerway, C. Tan, and B. Works. “FHWA Study Tourfor Pedestrian and Bicyclist Safety in England, Germany, and the Netherlands,” FHWA, DOT, October1994.
Zegeer, C.V. Synthesis of Safety Research: Pedestrians, Report No. FHWA-SA-91-034, U.S. Departmentof Transportation, Federal Highway Administration, Washington, DC, August 1991.
Zegeer, C., J. Stutts, H. Huang, M. Zhou, and E. Rodgman. “Analysis of Elderly Pedestrian Crashes andRecommended Countermeasures,” Transportation Research Board, January 1993.
Zegeer, C.V. and S.F. Zegeer. “Providing Safer Urban Streets for Elderly and HandicappedPedestrians,” Paper Presented at the Fifth International Conference on “Mobility and Transport forElderly and Handicapped Pedestrians,” Stockholm, Sweden, May 1989.
Zegeer, C.V. and M.J. Cynecki. Methods of Increasing Pedestrian Safety at Right-Turn-On-RedIntersections, Final Report, Report No. FHWA/IP-86/l0, U.S. Department of Transportation, FederalHighway Administration, Washington, DC, 1986.
Zegeer, C.V. and S.F. Zegeer. Pedestrians and Traffic Control Measures. Synthesis of Current Practice,Synthesis Report No. 139. Transportation Research Board, Washington, DC, 1988.
Zegeer, C. and R. Deen. “Speed Reductions in School Zones,” Transportation Research Record 597,Transportation Research Board, 1978.
Zegeer, C.V., D.A. Randolph, M.A. Flak, and R.K. Bhatacharya. “Use of Pedestrian Conflict Analysesfor Hazard Assessment in School Zones,” Record No. 743, Transportation Research Board, 1980.
Zegeer, C.V., K.S. Opiela, and M.J. Cynecki. “Effect of Pedestrian Signals and Signal Timing onPedestrian Accidents,” in Transportation Research Record 847, Analysis of Highway Accidents.Pedestrian Behavior and Bicycle Program Implementation, Transportation Research Board, NationalResearch Council, Washington, DC, 1982, pp. 62-72.
Zegeer, C.V., K.S. Opiela, and M.J. Cynecki. Pedestrian Signalization Alternatives, Report No.FHWA/RD-83/102, U.S. Department of Transportation, Federal Highway Administration, Washington,DC, 1983.
Zegeer, C.V., J.R. Stewart, and H. Huang. “Safety Effects of Marked vs. Unmarked Crosswalks atUncontrolled Locations: Analysis of Pedestrian Crashes in 30 Cities.” University of North CarolinaHighway Safety Research Center, Chapel Hill, NC. Submitted to Transportation Research Board,Washington, DC, November 2000.

APPENDIX A
REVIEW OF PEDESTRIAN SAFETY RESEARCH IN AUSTRALIA,
CANADA, THE NETHERLANDS, SWEDEN, AND THE UNITED KINGDOM
(Appendix A reports may be found at www.walkinginfo.org/rd/international.htm)