a review of nitrogen and sugarcane - assct s/volume 24/a03-11 muchovej... · muchovej: nitrogen...
TRANSCRIPT

NITROGEN FERTILIZATION OF SUGARCANE ON A SANDY SOIL: II. SOIL AND GROUNDWATER ANALYSES
R. M. Muchovej and P. R. Newman
Southwest Florida Research and Education Center, University of Florida, Institute of Food and Agricultural Science, 2686 State Road 29 North, Immokalee, FL 34142-9514
ABSTRACT
There is limited information on the impact of N fertilizer applied to sugarcane on sandy
soils regarding soil and groundwater quality. This study determined soil and groundwater characteristics as affected by varying N rates on a sandy soil planted to sugarcane cultivar CP 78-1628. Three rates of N fertilizer (170, 280, and 390 kg N ha-1 yr-1) were evaluated. The N rates were divided into four split applications. After planting, piezometers were installed in the center of each plot to a soil depth of 1.3 m. Rainfall and temperature data were recorded by a weather station located <1 km from the study site. Soil macro- and micro-nutrients plus Al, Na, Cl, pH, buffer pH, organic matter, and electrical conductivity were not affected by the N rates when sampled at 0-15 and 15-30 cm depths between the plant-cane, first and second ratoon crops. Soil and groundwater N concentrations indicated a rapid loss of the applied N due to leaching after the split application. Lowering the quantity of N ha-1 with each split application and increasing the frequency of the splits may increase the N utilization efficiency of sugarcane. Based on results from this study, it is suggested that split application rates of ammonium nitrate fertilizer to sugarcane grown on sandy soils in south Florida during June through September should be lower than 70 kg N ha-1 and at time intervals between 2.5 and 6.5 wk.
INTRODUCTION Sugarcane (Saccharum spp. hybrids) was grown on at least 40,500 ha of sandy soils in
Florida in 2001 (Glaz and Gilbert, 2003). These soils require N fertilization for adequate production (Rice et al., 2002). Pre-plant field laser leveling and field ditches are used to maintain a water table at 61 cm during the dry season (October-May) and 76 cm during the rainy season (June-September) (Lang et al., 2002). Split application of N fertilizer is recommended for sugarcane production on sandy soils of Florida because it compensates for soil N leached away during the large rainfall events during the growing season (Rice et al., 2002). The rainy season in south Florida during the period 1996 to 2003 was primarily during the months of June through September, averaging 200 mm for each month in that period (FAWN, 2004). The other months averaged between 32 and 112 mm rainfall (FAWN, 2004).
Nitrogen concentrations in soil and groundwater have not been documented for sugarcane
production at varying N rates on sandy soils in Florida. However, in Australia, Verburg et al. (1998) related groundwater NO3-N loading to rates of N fertilizer for sugarcane on an imperfectly drained red-yellow podzolic soil and a well-drained red earth soil. The authors determined N loading rates lower than 26 kg N ha-1 at N rates of 80 to 180 kg N ha-1 from a single spring application or two split applications separated by 90 days for both soils. However, at the 320 kg N ha-1 fertilizer rate, groundwater NO3-N loading increased to 60 and 125 kg N ha-1 for the imperfectly drained red-yellow podzolic soil and a well-drained red earth soil,
225

Journal American Society Sugar Cane Technologists, Vol. 24, 2004
respectively, with the split application having just slightly less NO3-N loading than the single application. Verburg et al. (1998) concluded that if the soil permeability is high and the rooting depth of the crop is shallow, the quantity of NO3
- leaching between split applications of N fertilizer would be positively related to the frequency and amount of rainfall/drainage events within the post-fertilization period.
Rasiah et al. (2003) documented groundwater NO3-N concentrations near sugarcane
fields in Australia on a Ferrosol (acidic clay) but made no comparisons of these values with non-sugarcane fields or between different rates of N fertilization. The authors reported spatio-temporal dynamics for groundwater NO3-N concentration that ranged from 0.60 to 3.7 mg N L-1 and a yearly groundwater NO3-N load of 40 to 110 kg N ha-1.
The extent of NO3-N loading to Florida aquifers from sand-land sugarcane production is
unknown, but the concentrations of NO3-N in south Florida groundwater sampled from 1996 to 1998 was reported to be below 10 mg L-1 (McPherson et al., 2000), the EPA minimum contamination level for drinking water sources (USEPA, 2002). Muchovej and Rechcigl (1994) concluded in a review of N fertilization of pastures and turfgrasses on water quality that the complete elimination of NO3
– leaching on coarse-textured soils might be impossible to achieve, if adequate yield and quality are desired. The authors also concluded that NO3
– leaching below established grasses on sandy soil is minimal when N is applied in quantities less than 200 kg ha-1 yr-1, however leaching may increase rapidly at higher rates.
Cultural methods have been tested to reduce the quantity of soil NO3
- leaching in Florida soils for citrus. Deep tillage plus lime (105 cm depth with 56 Mg limestone ha-1) reduced the leaching of NO3
- from a sub-surface drained Spodosol in Florida (Mansell et al., 1980). In another study, deep tillage plus lime incorporation into the profile of a Spodosol was an effective treatment to enhance citrus root absorption of N fertilizer and reduced the risk of N losses (Mansell et al., 1986).
The current recommended rate for N in Florida for sugarcane is 90 kg ha-1 yr-1 but that
rate was derived from research for sugarcane produced for syrup (Kidder et al., 2002). However, the N requirement of sugarcane grown on sandy, mucky-sand, and sandy-muck soils appears to be 202, 123, and 34 kg N ha-1 yr-1, respectively, by split applications during the growing season according to Rice et al. (2002). On a sandy soil with organic matter content less than 2 %, sugarcane and sugar yields did not differ for N rates varying between 170 and 392 kg N ha-1 yr-1 when the fertilization was made in four split applications (Muchovej and Newman, 2004). The authors stated that lack of response to N fertilizer rates used in this study indicates that even the lowest rate tested (170 kg N ha-1) may have been at or above the critical N rate for sugarcane production. The current University of Florida N recommendation for sugarcane grown on sandy soils in Florida is 202 kg N ha-1 yr-1 (Rice et al. 2002).
The objective of this study was to assess the potential leaching losses of N under a split
application schedule for two sugarcane ratoon crop cycles at three rates of N. The hypothesis is that soil and groundwater N concentrations do not differ between N rates and do not change with time.
226

Muchovej: Nitrogen Fertilization of Sugarcane on a Sandy Soil: II. Soil and Groundwater Analyses
MATERIALS AND METHODS
The study was conducted during 1999 through 2003 at the Southwest Florida Research and Education Center, UF/IFAS, at Immokalee, FL (27°25' N, 81°25' W). Study site history and weed control methods were described by Muchovej and Newman (2004).
The experiment was a randomized complete block design (RCBD) with three N fertilizer
rate treatments and four replications. The blocking gradient was from east to west due to the irrigation pattern verified in the experimental area. The treatments were 170, 280, and 390 kg N ha-1 yr-1 delivered in four split applications. Twelve plots (13.6 m x 24.4 m; 1.5 m row spacing) were planted to sugarcane cultivar CP 78-1628 in December 1999. This experimental site was surrounded by a 1.5 m deep rim ditch for surface and groundwater control. During dry periods, the ditch also supplied the water for seepage irrigation from a deep well. Each plot had a 1 m deep rim ditch with a 15 m buffer zone between plots. Buffer zones between plots were unfertilized bahiagrass (Paspalum notatum Flugge). The plot ditches were interconnected by buried 7 cm diameter polyvinyl chloride (PVC) pipe. The potential for lateral movement of soil N between plots was considered nil, but was not tested. In the plant-cane crop, the four split applications of N were divided between the December planting, and three other dates separated by 8 to 11 wk starting in April. For the first ratoon and second ratoon crops, the four split applications were started in March and then separated by 8 wk intervals. Each plot received the same treatments in each of the three years of the study. Measured quantities of the fertilizer were applied by hand at even rates along the length of each planted row. The N source was ammonium nitrate at all applications except for the first split application fertilizer mix where the N source was 66.7 % ammonium nitrate and 33.3 % ammonium sulfate. The N rate at the first split application at the beginning of the growing season (March) was the same for all treatments at 66 kg N ha-1. At the second and third split applications (late April – early May and mid June – mid July, respectively), the N rates for the low, medium, and high N treatments were 34, 78, and 112 kg N ha-1, respectively. At the fourth split application (late August – early September), the N rates for the low, medium, and high N treatments were 34, 56, and 101 kg N ha-1, respectively. Phosphorus and K were included in the first and second split application fertilizer mixes but at the same rate for all plots. Muchovej and Newman (2004) described the proportion of the total N fertilizer at each split application and how it varied for each N fertilizer treatment.
Irrigation and drainage was provided to target a water-table depth between 46 and 76 cm
from the soil surface. There was no pre-harvest burning for each crop. Most of the sugarcane crop residue (trash) was removed after the plant-cane crop but none was removed after the first-ratoon crop, leaving a trash blanket that was not tilled into the soil.
After planting, piezometers made of 1.5 m x 7 cm diameter PVC pipe with fine slits in
the lower two-thirds and wrapped with plastic screen cloth were installed in the center of each plot to a soil depth of 1.3 m. The water table was recorded bi-weekly during the ratoon crops but not during the plant-cane crop. Water-table depth was measured by recording the vertical distance between the soil surface and the surface of the groundwater in the piezometers. Rainfall and temperature data were recorded by a weather station operated by FAWN (2004), located less than 1 km from the study site.
227

Journal American Society Sugar Cane Technologists, Vol. 24, 2004
Soil Sampling
Soil was sampled at 0 to 15 cm and 15 to 30 cm depths below the surface during the first ratoon and second ratoon crops only. Soil samples were analyzed for N (NH4-N and NO3-N) at 2.5 and 6.5 wk following each split application of fertilizer during the first ratoon and second ratoon crops. Soil samples were taken for routine analysis on 27 February 2001 (3 days before the first split fertilizer application of the first ratoon crop), on 21 December 2001 (3 wk before removal of the first ratoon crop), and on 12 December 2002 (before the removal of the second ratoon crop). Soil analyses included pH, buffer pH, organic matter (OM), electrical conductivity (EC), NH4-N, NO3-N, P, K, Ca, Mg, Zn, Mn, Cu, Fe, Al, Na, and Cl.
At each sampling date, soil samples were removed from two sites within each plot with a
5 cm diameter stainless steel auger to form a plot composite sample. The samples were placed into labeled plastic bags, kept cool, and then placed into larger paper bags for drying within the same day (38°C for 3 days). The dried soil samples were passed through a 10 mm sieve. The Analytical Research Laboratory (ARL), UF-IFAS, at Gainesville, FL, performed analyses by methods described by Mylavarapu and Kennelley (2002). The Adams-Evans Buffer solution was used in determining buffer pH (Adams and Evans, 1962). The Walkley-Black method was used to determine soil OM concentrations (Nelson and Sommers, 1982). Soil NH4-N was determined by direct colorimetric analysis using EPA Method 350.1 on the filtered extract collected following a 4 hr mixing of soil and pure water (1:2 V/V) (USEPA, 1993). Soil NO3-N was determined on filtered extract from a 4 hr mixing of soil and pure water (1:2 V/V) by Technicon II Auto-Analyzer or equivalent calibrated as per manufacturers as directed by EPA Method 353.2 (USEPA, 1978b). Soil P, K, Ca, Mg, Zn, Mn, Cu, Fe, Al, and Na were determined by Mehlich-1 extraction solution (0.0125 M H2SO4 and 0.05 M HCl). For these elements, a 5 min agitation of soil and Mehlich-1 solution (1:4 V/V) was followed by inductively coupled plasma (ICP) of the filtrate. Phosphorus was determined by atomic absorption spectrophotometry (AAS) in combination with colorimetric analysis by the ascorbic acid method (APHA-AWWA-WPCF, 1989b). Soil Cl was determined by direct colorimetric analysis by EPA Method 325.2 of the filtered extract from a 4 hr mixing of soil and pure water (1:2 V/V) (USEPA, 1978a).
Groundwater Sampling
Groundwater samples were collected from the piezometers for N analysis during the
ratoon crops at 2.5 and 6.5 wk following each split application of fertilizer. Additional groundwater samples were collected at 4-wk intervals in October and November. If the distance between the soil surface and the ground-water table was greater than 1.2 m at the scheduled sampling date, no sample was collected. Groundwater analyses consisted of NH4-N, NO3-N, and organic N determination.
The groundwater samples from each piezometer in each plot were collected after purging
the piezometer three times using an electric bale pump with PVC tubing. A battery operated peristaltic pump equipped with PVC and silicone tubing was used to take the groundwater sample. The samples were placed into labeled high-density polyethylene (HDPE) 250 mL bottles chilled in a cooler to approximately 4°C with ice. One duplicate, split, and equipment
228

Muchovej: Nitrogen Fertilization of Sugarcane on a Sandy Soil: II. Soil and Groundwater Analyses
blank sample was collected at each sampling event to check the water-sampling technique. For NH4-N and NO3-N analysis, two 20 ml aliquots were filtered (FisherbrandTM Q2 filter) into 20 ml HDPE scintillation vials and then acidified to pH 2 with one drop of 50 % concentrated H2SO4. These two sub samples from each plot were kept frozen until shipping in ice pack to ARL for NH4-N and NO3-N analysis, usually within 28 days from the sampling day. For total N analysis, one 20 ml aliquot was placed into a 20 ml HDPE scintillation vial without filtering and then acidified to pH 2 with one drop of 50 % concentrated H2SO4. This unfiltered sub sample from each plot was kept at 4°C by refrigeration until Kjeldahl N digestion could be completed (APHA-AWWA-WPCF, 1989a). The Kjeldahl N digestates were kept frozen until shipping in ice pack to ARL for NH4-N analysis, usually within 28 days from the sampling day. Three additional 50 ml aliquots of the field samples were individually used to determine pH, conductivity, and temperature. The method used by ARL to determine NH4-N was direct colorimetric analysis using EPA Method 350.1 (USEPA, 1993). Nitrate N was determined by Technicon II Auto-Analyzer or equivalent calibrated as per manufacturers according to EPA Method 353.2 (USEPA, 1978b). For each sample, organic N was calculated by subtracting NH4-N from Kjeldahl N according to APHA-AWWA-WPCF (1989a).
Statistical Analysis
Soil and groundwater data were analyzed as a repeated-measures experiment with the
three N fertilizer rates (whole plots) arranged in four randomized complete blocks. The sampling dates after the split application (sub plot), the split application (sub-sub plots), and the crop (sub-sub-sub plots) were considered repeated measure factors. The data were tested for main effect interactions before graphing the means in bar charts.
RESULTS AND DISCUSSION
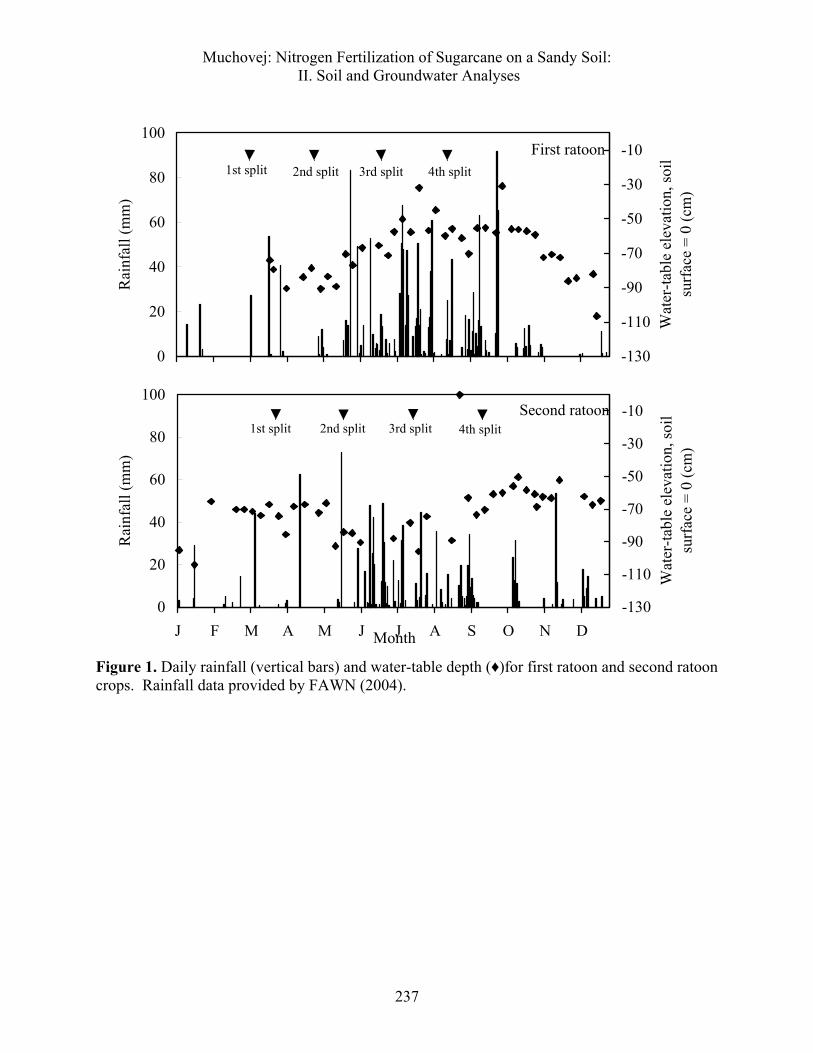
The water-table depths ranged from 30.9 to 90.6 cm below the soil surface during the
first ratoon crop and from 50.4 to 96.0 cm for the second ratoon crop during the March to October growing season (Figure 1). In late August 2002, during the second ratoon crop, the water table reached the soil surface because of a malfunctioning irrigation pump.
The total rainfall from January to December was 1603 and 1180 mm for the first ratoon
and second ratoon crops, respectively. The rainfall during the first ratoon crop was concentrated during the second part of the growing season, July to October, while the second ratoon crop had a more even distribution of rainfall throughout the season (Figure 1). Soil N
Prior to N fertilizer application, the 0 to 30 cm depth soil NO3-N concentration ranged
from 2.1 to 9.0 and from 1.0 to 11.6 mg N kg-1in the first ratoon and second ratoon crops, respectively. The before-crop 7 mg NO3-N kg-1 critical soil N concentration mentioned by Thomas et al. (1985) was met for just one plot in both first ratoon and second ratoon crops in late February, but the plot was not the same in the two crops. This observation indicated that the initial soil N concentration was limiting for sugarcane production in both ratoon crops.
229

Journal American Society Sugar Cane Technologists, Vol. 24, 2004
Soil depth was averaged since sampling depth did not interact with the other factors (N rate, sample time, split application, and crop or in combinations of these effects). Soil N concentrations of both NH4-N and NO3-N at 2.5 wk following the second split application in both ratoon crops did not reflect the N application rates and were depleted at 6.5 wks (Figure 2). Soil N concentrations of both NH4-N and NO3-N at 2.5 wk following the third and fourth split applications in the first ratoon crop reflected the N application rates (Figure 2). At 6.5 wk, however, soil N concentrations were lower and uncharacteristic of the N application rates (Figure 2). This soil N response indicated that the soil N concentration gradient did not always match the N fertilizer rate treatments leading to a conclusion that the dynamics of N in the soil was changing quickly with time following the split application of N fertilizer. These relatively rapid changes in available soil N would explain why Obreza et al. (1998) determined that sugarcane yield of cultivar CP 72-1210 on a Basinger sand was greater with more split applications than less split applications. The soil data presented here suggest that the effects of increasing N fertilization rates on increased soil N during June through September were present up to 2.5 wk following the split applications, but were not generally observed at the 6.5 wk sampling.
Soil N concentrations during the second ratoon crop differed markedly from those
recorded during first ratoon crop. In the first ratoon crop, increases in soil NH4-N and NO3-N concentrations in response to N rates were much higher than those verified for the second ratoon crop at 2.5 wk after the third and fourth split applications. However, at 6.5 wk after the fourth split, the NO3-N concentrations increased sharply for all N rates in the second ratoon crop (Figure 2). Two inseparable factors may have influenced the soil N response in the second ratoon crop: rainfall and the presence of a trash blanket. Rainfall for the period April to October was 1408 and 939 mm in the first ratoon and second ratoon crop, respectively. The lower quantity of rainfall in the second ratoon crop may have prevented or reduced N leaching, thus resulting in greater N soil concentrations at 6.5 wk following split applications in that crop. However, regardless of the difference in rainfall between the first ratoon and second ratoon crop, the presence of a trash blanket on the second ratoon crop may have contributed to the delay in release of the applied N to the soil until late in the second ratoon crop (Figure 2). This statement is based on the verification that leaf tissue N concentration increased to above the critical value (>11.0 g N kg-1) for all three N rates at 4 wk after the fourth split in the second ratoon crop (Muchovej and Newman 2004). This observation coincides with greater soil NO3-N values at 6.5 wk after the fourth split in the second ratoon crop (Figure 2). In this study, the applied N fertilizer over a sugarcane trash blanket was likely susceptible to N immobilization by microorganisms that break down crop residues. The later release of microorganism immobilized N was supported by both soil and leaf tissue data. The timing of the release of residue immobilized N was not synchronized to the demands of the sugarcane crop growth cycle and likely contributed to depressed sugarcane yield reported by Muchovej and Newman (2004) in the second ratoon crop. Gava et al. (2003) have reported that sugarcane trash N was available to the ratoon crop towards the late crop cycle.
Soil macro- and micro-nutrients plus Al, Na, Cl, pH, buffer pH, OM, and electrical
conductivity were not affected by the N rates when sampled between the three crops (P>0.05). However, there were significant sampling date and sampling depth effects for these soil analyses (Table 1). All soil macro-nutrients and Zn, Al, Na, and Cl decreased with time from post plant-cane crop sampling to the end of the second ratoon crop. Soil Ca, Mg, Zn, and Mn
230

Muchovej: Nitrogen Fertilization of Sugarcane on a Sandy Soil: II. Soil and Groundwater Analyses
concentrations were lower in the 15 to 30 cm depth sample than in the 0 to 15 cm depth samples. Sampling depth did not affect the soil concentrations of NO3-N, P, Fe, Al or Cl. The lower K concentrations in the soil sampled later in the experiment (Table 1) may explain the lower K concentrations in leaf tissue sampled at 4 wk post third and fourth split application of fertilizer (Muchovej and Newman, 2004).
Groundwater Nitrogen
Groundwater N concentrations were influenced by N fertilizer application rates. Ammonium N ranged between 0.1 and 6.7 mg L-1 and increased with increasing N rate at 2.5 wk after the split application of N fertilizer in June-July in the first ratoon crop and in August-September in both first and second ratoon crops (Figure 3). Nitrate N ranged from 0.1 to 28.4 mg L-1 and increased with increasing N rates at 2.5 and 6.5 wk after the split application of N fertilizer in both first and second ratoon crops (Figure 3). Organic N ranged from 0.0 to 17.7 mg L-1 and did not increase with increasing N rates (Figure 3).
Groundwater NO3-N concentrations were higher than NH4-N concentrations across all
three rates (Figure 3), indicating that a portion of the NH4-N component of the ammonium nitrate fertilizer mix may have been nitrified to NO3-N. Immobilization of fertilizer NH4-N by soil cation exchange was considered unlikely since the sandy soil at the test site had a low pH and low organic matter content (Table 1).
All of the groundwater NO3-N treatment means for the two lower rates of N fertilizer
(170 and 280 kg N ha-1 yr-1) were below the EPA minimum contamination level (10 mg NO3-N L-1) for drinking water sources (USEPA, 2002). However, the highest rate of N fertilizer (390 kg N ha-1 yr-1) exceeded the 10 mg NO3-N L-1 limit in nine out of the 12 sampling events during the growing period. Results from this study indicate that in order to limit the concentration of NO3-N in groundwater to EPA standards for drinking water at 2.5 wk post application, split applications of ammonium nitrate fertilizer should be limited to 70 kg N ha-1 (Figure 4).
CONCLUSIONS
For the sugarcane cultivar CP 78-1628 grown on a sandy soil in south Florida, positive
relationships between rates of ammonium nitrate fertilizer and plant available soil N concentrations at 2.5 wk after application were verified. However, the effects of varying N rates were not always present at 6.5 wk after the split applications. The groundwater NO3-N response to increasing rates of N fertilizer in the first ratoon crop indicated that leaching might be a major cause of low N use efficiency of sugarcane on sandy soils in south Florida. Based on the regression analysis of collected groundwater data, split applications of ammonium nitrate fertilizer should be lower than 70 kg N ha-1 to prevent groundwater NO3-N enrichment above the acceptable EPA drinking water concentrations and to provide the needed N fertilizer to the sugarcane crop during the growing season.
ACKNOWLEGEMENTS
231

Journal American Society Sugar Cane Technologists, Vol. 24, 2004
This research was supported by the Florida Agricultural Experiment Station and approved for publication as Journal Series No. R-10319. Received 1 July 2004. In addition, sugarcane growers supported this research through ‘Share’ donations to the Southwest Florida Research and Education Center Sugarcane Program.
The authors thank John Perry of Moore Haven, Florida who supplied the seed-cane for
this study. In addition, we recognize Ann Summeralls, Rudy Aragus, and Michael Obern for technical assistance. We are also thankful to Dr. Thomas Obreza, Univ. of Florida/Soil and Water Science Dept., for comments and review of the manuscript.
DISCLAIMER
The product names and trademarks are mentioned only to report factually on available
data. The University of Florida does not guarantee or supply warrantee to the use of these products and does not imply the exclusion of other products that may be suitable.
REFERENCES
1. Adams, F., and C.E. Evans. 1962. A rapid method for measuring lime requirement of red-
yellow podzolic soils. Soil Sci. Soc. Am. Proc. 26:355-357. 2. APHA-AWWA-WPCF. 1989a. Nitrogen (organic): 4500-Norg. Pages: 4.143-4.147. In:
Standard Methods for the Examination of Water and Wastewater, 17th edition, M.A.H. Franson., ed. Am. Public Health Assoc., Am. Water Works Assoc., and Water Pollut. Control Fed., American Public Health Association, Washington, DC.
3. APHA-AWWA-WPCF. 1989b. Phosphorus: 4500-P. Pages: 4.166-4.181. In: Standard
methods for the examination of water and wastewater, 17th edition, M.A.H. Franson, ed. Am. Public Health Assoc., Am. Water Works Assoc., and Water Pollut. Control Fed., American Public Health Association, Washington, DC.
4. FAWN. 2004. Immokalee monthly rainfall data. [Online]. Florida Agricultural Weather
Network, Univ. of Fla., Gainesville. 5. Gava, G.J.C., P.C.O. Trivelin, A.C. Vitti, and M.W. Oliveira. 2003. Recovery of nitrogen
(N-15) from urea and cane trash by sugarcane ratoon (Saccharum spp.). R. Bras. Ci. Solo. 27:621-630.
6. Glaz, B., and R.A. Gilbert. 2003. Sugarcane Variety Census: Florida 2001. [Online]. Fla.
Coop. Ext. Ser. Doc. SS ARG 198. Univ. of Fla., Inst. Food Agric. Sci., Gainesville. 7. Kidder, G., C.G. Chambliss, and R. Mylavarapu. 2002. UF/IFAS Standardized
Fertilization Recommendations for Agronomic Crops. [Online]. Florida Coop. Ext. Ser., UF/IFAS, Doc. SL-129. Univ. of Fla., Inst. Food Agric. Sci., Gainesville.
232

Muchovej: Nitrogen Fertilization of Sugarcane on a Sandy Soil: II. Soil and Groundwater Analyses
8. Lang, T.A., S.H. Daroub, and R.S. Lentini. 2002. Water Management for Florida Sugarcane Production. [Online]. Fla. Coop. Ext. Ser. Doc. SS ARG 231. Univ. of Fla., Inst. Food Agric. Sci., Gainesville.
9. Mansell, R.S., J.G.A. Fiskell, D.V. Calvert, and J.S. Rogers. 1986. Distributions of
labeled nitrogen in the profile of a fertilized sandy soil. Soil Sci. 141:120-126. 10. Mansell, R.S., H.M. Selim, D.V. Calver, E.H. Stewart, L.H. Allen, D.A. Graetz, J.G.A.
Fiskell, and J.S. Rogers. 1980. Nitrogen and water distributions in fertilized sandy soil during irrigation and drainage. Soil Sci. Soc. Am. J. 44:95-102.
11. McPherson, B.F., R.L. Miller, K.H. Haag, and A. Bradner. 2000. Water Quality in
Southern Florida, 1996-98. [Online]. Circ. 1207. U.S. Geol. Surv. 12. Muchovej, R.M., and P.R. Newman. 2004. Nitrogen fertilization of sugarcane on a sandy
soil: I. Yield and leaf nutrient composition. J. Amer. Soc. Sugar Cane Technol. 24:210-224.
13. Muchovej, R.M., and J.E. Rechcigl. 1994. Impact of nitrogen fertilization of pastures and
turfgrasses on water quality. Pages: 91-135. In: Soil Processes and Water Quality, Adv. Soil Sci., R. Lal and B.A. Stewart, eds. CRC Press, Boca Raton, FL.
14. Mylavarapu, R.S., and E.D. Kennelley. 2002. UF/IFAS Extension Soil Testing
Laboratory (ESTL) Analytical Procedures and Training Manual. [Online]. Circ. 1248. Univ. Fla. Inst. Food Agric. Sci., Gainesville.
15. Nelson, D.W., and L.E. Sommers. 1982. Total carbon, organic carbon, and organic
matter. Pages 539-579. In: Methods of Soil Analysis: Part 2. 2nd Edition, A.L. Page, R.H. Miller, and D.R. Keeney, eds. Book Series No. 9. Amer. Soc. Agron. Madison, WI.
16. Obreza, T.A., D.L. Anderson, and D.J. Pitts. 1998. Water and nitrogen management of
sugarcane on sandy, high water-table soil. Soil Sci. Soc. Am. J. 62:992-999. 17. Rasiah, V., J.D. Armour, T. Yamamoto, S. Mahendrarajah, and D.H. Heiner. 2003.
Nitrate dynamics in shallow groundwater and the potential for transport to off-site water bodies. [Online, Kluwer]. Water Air Soil Pollut. 147:183-202.
18. Rice, R.W., R.A. Gilbert, and R.S. Lentini. 2002. Nutritional Requirements for Florida
Sugarcane. [Online]. Florida Coop. Ext. Ser., UF/IFAS, Doc. SS-ARG-228. Univ. of Fla., Inst. Food Agric. Sci., Gainesville.
19. Thomas, J.R., A.W. Scott, Jr., and R. P. Wiedenfeld. 1985. Fertilizer requirements of
sugarcane in Texas. J. Amer. Soc. Sugar Cane Technol. 4:62-72. 20. USEPA. 1978a. Method 325.2: Chloride: colorimetric, automated ferricyanide AAII.
[Online]. U.S. Environmental Protection Agency, Cincinnati, OH.
233

Journal American Society Sugar Cane Technologists, Vol. 24, 2004
21. USEPA. 1978b. Method 365.5: Nitrogen, nitrate-nitrite: colorimetric, automated,
cadmium reduction. [Online]. U.S. Environmental Protection Agency, Cincinnati, OH. 22. USEPA. 1993. Method 350.1: Determination of ammonia nitrogen by semi-automated
colorimery. [Online]. U.S. Environmental Protection Agency, Cincinnati, OH. 23. USEPA. 2002. Consumer Factsheet on: nitrates/nitrites. [Online]. United States
Environmental Protection Agency. 24. Verburg, K., B.A. Keating, M.E. Probert, K.L. Bristow, and N.I. Huth. 1998. Nitrate
leaching under sugarcane: Interactions between crop yield, soil type and management strategies. [Online]. Proc. 9th Aust. Agron. Conf., Wagga Wagga. July 1998. Aust. Soc. Agron., Australia.
234

Muchovej: Nitrogen Fertilization of Sugarcane on a Sandy Soil: II. Soil and Groundwater Analyses
Table 1. Soil analyses at two depths (0-15 and 15-30 cm) between the plant-cane and first ratoon crops (27 Feb. 2001), before the first ratoon crop removal (21 December 2001), and before the second ratoon crop removal (12 December 2002). Sample date Between date Soil test1 Depth 27 Feb. 2001 21 Dec. 2001 12 Dec. 2002 L.S.D. (P<0.05) – cm pH 0-15 4.99 ** 2 4.07 4.50 ns 0.21 15- 5.25 – 3 4.73 0.23 Buffer pH 0-15 7.80 ** – 7.77 ** ns 15- 7.84 – 7.86 ns ––––––––––––––––––––––––––––––––– % –––––––––––––––––––––––––OM 0-15 1.43 ** 1.48 1.28 ** ns 15- 0.94 – 0.73 ns ––––––––––––––––––––––––––––––––– dS m-1 –––––––––––––––––––––EC 0-15 – 0.065 0.047 ns ns 15- – – 0.042 – ––––––––––––––––––––––––––––––––– mg kg-1 ––––––––––––––––––––NH4-N 0-15 3.24 ns 4.82 0.43 * 0.57 15- 3.03 – 0.37 0.36 NO3-N 0-15 4.78 ns 3.91 0.90 ns 1.19 15- 3.88 – 0.74 0.73 1 OM = Organic Matter and EC = Electrical Conductivity. Buffer pH was determined by using
the Adams-Evans Buffer solution (Adams and Evans, 1962), OM was determined from the Walkley-Black method (Nelson and Sommers, 1982), soil NH4-N was determined by direct colorimetric analysis using EPA Method 350.1 on the filtered extract from a 4 h mixture of soil and pure water (1:2 V/V) (USEPA, 1993), and soil NO3-N was determined on filtered extract from a 4 h soil and pure water mixture (1:2 V/V) by Technicon II Auto-Analyzer or equivalent calibrated as per manufacturers as directed by EPA Method 353.2 (USEPA, 1978b).
2 Between depths within sample date: ns, non-significant; *, **, significance of P<0.05 and 0.01, respectively.
3 Sampling depth 15-30 cm was not available.
235

Journal American Society Sugar Cane Technologists, Vol. 24, 2004
Table 1. (Continued) Soil analyses at two depths (0-15 and 15-30 cm) between the plant-cane and first ratoon crops (27 Feb. 2001), before the first ratoon crop removal (21 December 2001), and before the second ratoon crop removal (12 December 2002). Sample date Between date Soil test1 Depth 27 Feb. 2001 21 Dec. 2001 12 Dec. 2002 L.S.D. (P<0.05) – cm P 0-15 16.00 ns2 11.99 12.70 ns 3.87 15- 21.68 –3 14.64 6.88 K 0-15 10.48 ** 7.57 4.80 ns 5.58 15- 8.70 – 1.53 1.88 Ca 0-15 328.25 ** 238.93 170.09 * 55.84 15- 254.83 – 126.50 53.58 Mg 0-15 13.90 ** 6.68 5.97 ** 3.46 15- 7.35 – 2.49 1.86 Zn 0-15 2.83 ** 3.43 2.33 ** 0.87 15- 1.67 – 1.06 0.37 Mn 0-15 2.46 ** 2.26 2.04 * ns 15- 1.75 – 1.16 ns Cu 0-15 3.47 * 2.77 2.91 ns ns 15- 2.80 – 1.39 1.11 Fe 0-15 41.30 ns 39.67 31.92 ns ns 15- 49.70 – 26.56 12.45 Al 0-15 66.65 ns 56.36 52.08 ns 13.83 15- 80.93 – 53.13 ns Na 0-15 8.89 ** 7.07 4.56 ns 2.89 15- 6.02 – 4.26 1.39 Cl 0-15 2.87 ns 5.84 2.33 ns 1.65 15- 2.76 – 2.33 ns 1 Soil P, K, Ca, Mg, Zn, Mn, Cu, Fe, Al, and Na were determined by Mehlich-1 extraction
solution (0.0125M H2SO4 and 0.05M HCl). For these elements, a 5 min agitation of soil and Mehlich-1 solution (1:4 V/V) was followed by inductively coupled plasma (ICP) of the filtrate. Phosphorus was determined by atomic absorption spectrophotometry (AAS) in combination with colorimetric analysis. Soil Cl was determined by direct colorimetric analysis by EPA Method 325.2 of the filtered extract from a 4 h soil and pure water mixture (1:2 V/V) (USEPA, 1978a).
2 Between depths within sample date: ns, non-significant; *, **, significance of P<0.05 and 0.01, respectively.
3 Sampling depth 15-30 cm was not available.
236
Muchovej: Nitrogen Fertilization of Sugarcane on a Sandy Soil: II. Soil and Groundwater Analyses
0
20
40
60
80
100R
ainf
all (
mm
)
-130
-110
-90
-70
-50
-30
-10
Wat
er-ta
ble
elev
atio
n, so
il su
rfac
e =
0 (c
m)
First ratoon1st split 2nd split 3rd split 4th split
0
20
40
60
80
100
J F M A M J J A S O N DMonth
Rai
nfal
l (m
m)
-130
-110
-90
-70
-50
-30
-10
Wat
er-ta
ble
elev
atio
n, so
il su
rfac
e =
0 (c
m)
Second ratoon1st split 2nd split 3rd split 4th split
Figure 1. Daily rainfall (vertical bars) and water-table depth (♦)for first ratoon and second ratoon crops. Rainfall data provided by FAWN (2004).
237

Journal American Society Sugar Cane Technologists, Vol. 24, 2004
First ratoon crop Second ratoon crop
Apr.-May split
0.0
4.0
8.0
12.0
16.0
2.5 6.5
soil NH4-N
soil NO3-N
kg N ha-1 at split (NH4NO3)
Soil
N c
once
ntra
tion
(mg
kg-1
) June-July split
0.0
4.0
8.0
12.0
16.0
2.5 6.5
soil NH4-N
soil NO3-N
kg N ha-1 at split (NH4NO3)June-July split
0.0
4.0
8.0
12.0
16.0
2.5 6.5
soil NH4-N
soil NO3-N
kg N ha-1 at split (NH4NO3)
Aug.-Sept. split
0.0
4.0
8.0
12.0
16.0
2.5 6.5
soil NH4-N
soil NO3-N
kg N ha-1 at split (NH4NO3)Aug.-Sept. split
0.0
4.0
8.0
12.0
16.0
2.5 6.5
soil NH4-
soil NO3-
kg N ha-1 at split (NH4NO3)
Time after split (wk)
Apr.-May split
0.0
4.0
8.0
12.0
16.0
2.5 6.5
34 78 112
34 78 11234 78 112
34 78 112
34 78 112
34 78 11234 78 11234 78 112
34 56 101
34 56 101
34 56 101
34 56 101
soil NH4-N
soil NO3-N
kg N ha-1 at split (NH4NO3)
Figure 2. Soil N concentrations (NH4-N and NO3-N) at 0-30 cm depth after 2.5 and 6.5 weeks following split application of N fertilizer.
238

Muchovej: Nitrogen Fertilization of Sugarcane on a Sandy Soil: II. Soil and Groundwater Analyses
First ratoon crop Second ratoon crop Apr.-May split
0.0
10.0
20.0
30.0
40.0
50.0
2.5 6.5
water NH4-N
water NO3-N
kg N ha-1 at split (NH4NO3)
water org.-N
Gro
undw
ater
N c
once
ntra
tion
(mg
L-1)
June-July split
0.0
10.0
20.0
30.0
40.0
50.0
2.5 6.5
water NH4-N
water NO3-N
kg N ha-1 at split (NH4NO3)
water org.-N
June-July split
0.0
10.0
20.0
30.0
40.0
50.0
2.5 6.5
water NH4-N
water NO3-N
kg N ha-1 at split (NH4NO3)
water org.-N
Aug.-Sept. split
0.0
10.0
20.0
30.0
40.0
50.0
2.5 6.5
water NH4-Nwater NO3-N
kg N ha-1 at split (NH4NO3)
water org.-N
Aug.-Sept. split
0.0
10.0
20.0
30.0
40.0
50.0
2.5 6.5
water NH4-N
water NO3-N
kg N ha-1 at split (NH4NO3)
water org.-N
Time after split (wk)
Apr.-May split
0.0
10.0
20.0
30.0
40.0
50.0
2.5 6.5
34 78 112
34 78 112
34 78 112
34 78 112
34 78 112
34 78 112
34 78 112
34 78 112
34 78 112
34 78 112
34 78 112
34 78 112
34 56 101
34 56 101
34 56 101
34 56 101
34 56 101
34 56 101
water NH4-N
water NO3-N
kg N ha-1 at split (NH4NO3)
water org.-N
Figure 3. Groundwater N concentrations (NH4-N, NO3-N, organic N) after 2.5 and 6.5 weeks following split application of N fertilizer.
239

Journal American Society Sugar Cane Technologists, Vol. 24, 2004
240
0
10
20
30
40
0 10 20 30 40 50 60 70 80 90 100 110 120NH4NO3 N fertilizer rate, kg ha-1
Gro
undw
ater
NO
3-N
con
cent
ratio
n, m
g L-1
(69.6 kg N ha-1 NH4NO3, 10 mg L-1 NO3-N)
mg L-1 NO3-N = 0.26 kg N ha-1 - 8.3r2 = 0.30 (P = 0.0001)
Figure 4. Groundwater NO3-N concentrations during June and September 2001 at 2.5 wk following ammonium nitrate (NH4NO3) fertilizer applications to sugarcane grown on a sandy soil as affected by rate of application.