a review of ionospheric effects in low-frequency sar...
TRANSCRIPT
F.J Meyer1) 2), P. Rosen, A. Freeman, K. Papathanassiou, J. Nicoll, B. Watkins, M. Eineder, R. Bricic, Thomas Ainsworth
1)Earth & Planetary Remote Sensing, University of Alaska Fairbanks2)Alaska Satellite Facility (ASF)
A Review of Ionospheric Effects in Low-Frequency
SAR Data
Signals, Correction Methods, and Performance Requirements
Collaborating Organizations:

F. Meyer et al.IGARSS’10, Honolulu 2
Outline
• An Introduction to the Topic:
– Interaction of the Ionosphere with Traversing Microwave Signals
– Spatio-Temporal Structure of Ionospheric Delay
• Current Ionospheric Conditions
• Temporal Variability
• Descriptors for Small-Scale Spatial Structure
– Examples of Ionospheric Effects on SAR, PolSAR and InSAR Data
– Requirements and Methods for Ionospheric Correction
• An Introduction to the Session

Signal Propagation through the Ionosphere
EUV radiation of
the sun ionizes
neutral atoms and
molecules
Typical vertical
profiles of the
plasma density
3
Refractive Index:
Two-way phase shift of frequency f due to
the ionosphere (nadir looking Radar):
TEC = Total Electron Content
@ L-band: ~ 2 phase cycles
@ C-band: ~ .5 phase cycles
@ X-band: ~ .3 phase cycles
F. Meyer et al.IGARSS’10, Honolulu 4
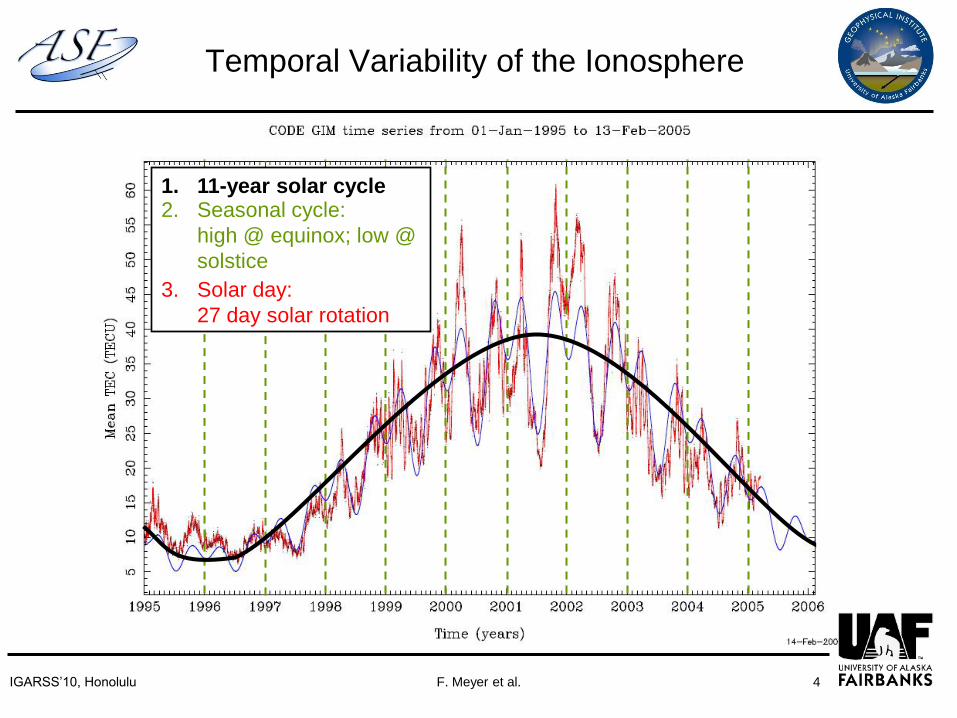
Temporal Variability of the Ionosphere
1. 11-year solar cycle2. Seasonal cycle:
high @ equinox; low @
solstice
3. Solar day:
27 day solar rotation
F. Meyer et al.IGARSS’10, Honolulu 5
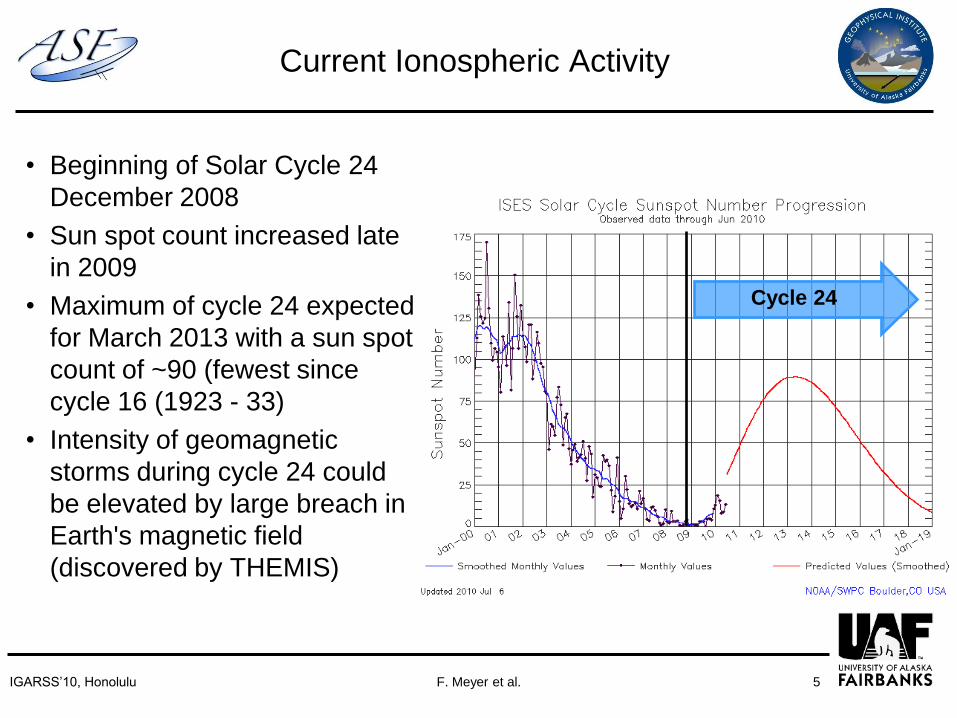
Current Ionospheric Activity
• Beginning of Solar Cycle 24
December 2008
• Sun spot count increased late
in 2009
• Maximum of cycle 24 expected
for March 2013 with a sun spot
count of ~90 (fewest since
cycle 16 (1923 - 33)
• Intensity of geomagnetic
storms during cycle 24 could
be elevated by large breach in
Earth's magnetic field
(discovered by THEMIS)
Cycle 24
F. Meyer et al.IGARSS’10, Honolulu 6
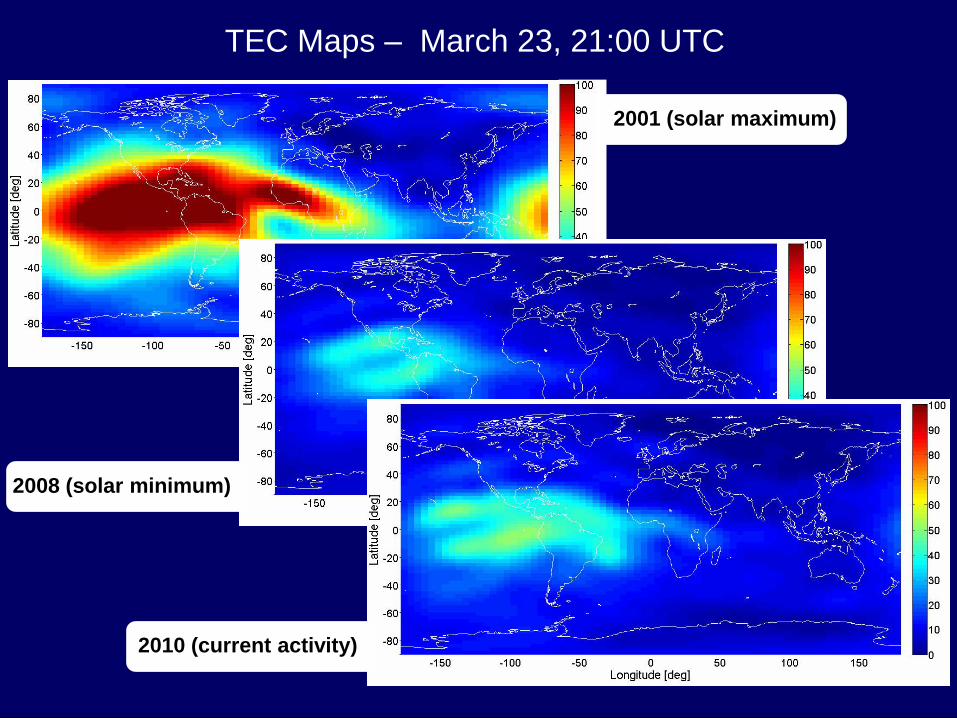
TEC Maps – March 23, 21:00 UTC
2001 (solar maximum)
2008 (solar minimum)
2010 (current activity)
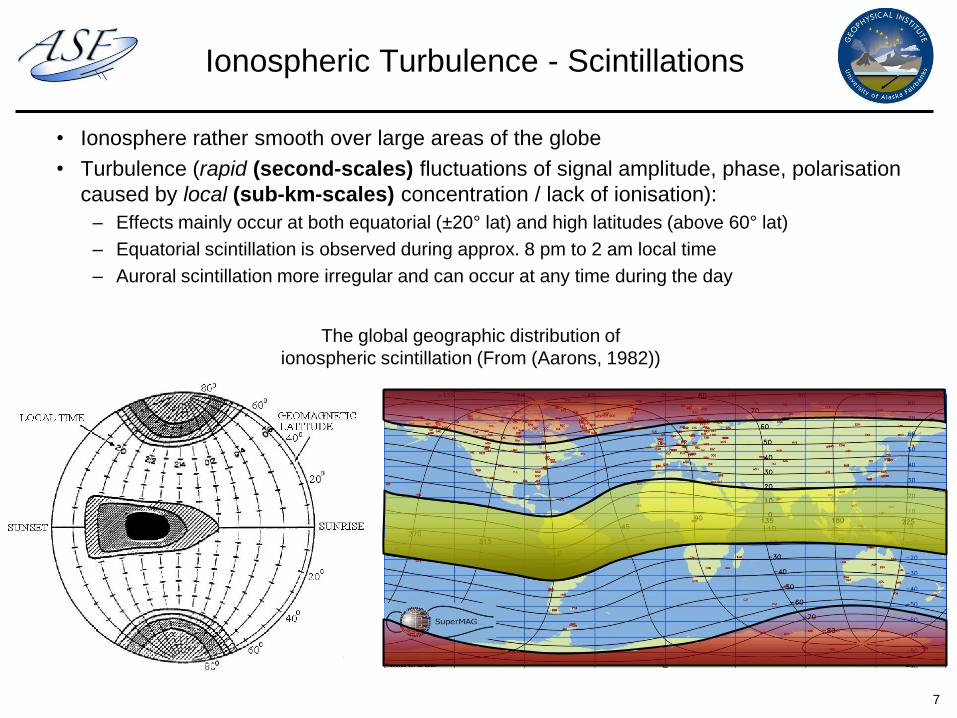
Ionospheric Turbulence - Scintillations
• Ionosphere rather smooth over large areas of the globe
• Turbulence (rapid (second-scales) fluctuations of signal amplitude, phase, polarisation
caused by local (sub-km-scales) concentration / lack of ionisation):
– Effects mainly occur at both equatorial (±20° lat) and high latitudes (above 60° lat)
– Equatorial scintillation is observed during approx. 8 pm to 2 am local time
– Auroral scintillation more irregular and can occur at any time during the day
The global geographic distribution of
ionospheric scintillation (From (Aarons, 1982))
7

F. Meyer et al.IGARSS’10, Honolulu 8
• Most small scale variability can be described as featureless noise like
signal→stationary and scale-invariant
→can be described by power spectra, structure functions, covariance functions,
and fractal dimensions
Can be used for data analysis, statistical modeling, signal representation, and simulation
• A Suitable model for small-scale turbulence spectra?
Small Scale Spatial Variability
22222
01
zaP
Scaling factor
x, y, z = coordinates of spatial wavenumbers related to earth’s magnetic field
222
yx
Spectral index
Anisotropy factor
F. Meyer et al.IGARSS’10, Honolulu 9
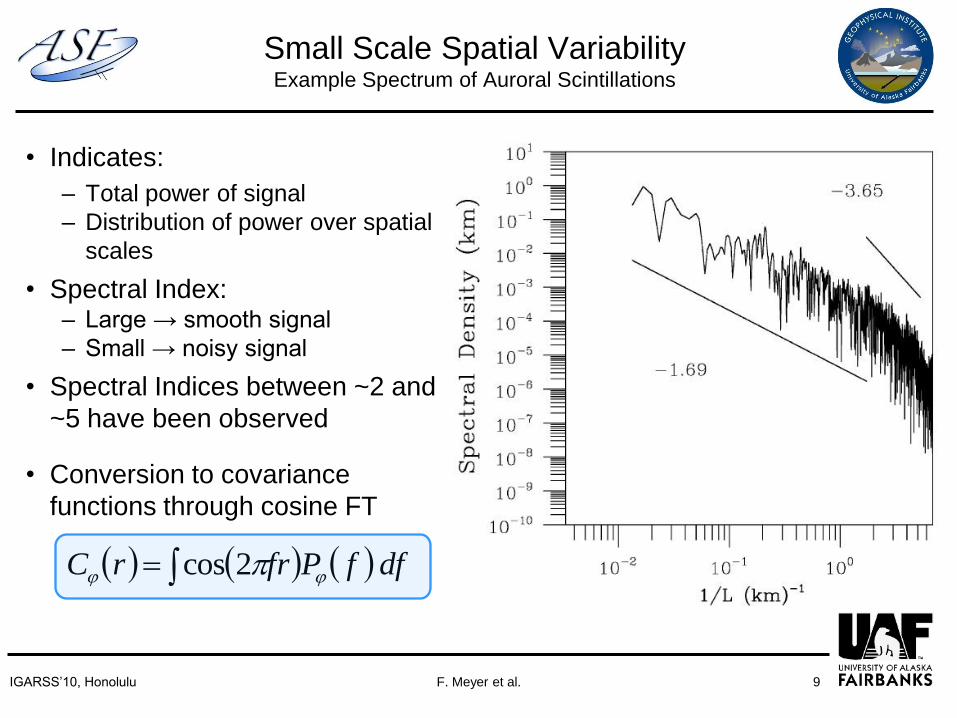
• Indicates:
– Total power of signal
– Distribution of power over spatial
scales
• Spectral Index:– Large → smooth signal
– Small → noisy signal
• Spectral Indices between ~2 and
~5 have been observed
• Conversion to covariance
functions through cosine FT
Small Scale Spatial VariabilityExample Spectrum of Auroral Scintillations
dffPfrrC 2cos
F. Meyer et al.IGARSS’10, Honolulu 10
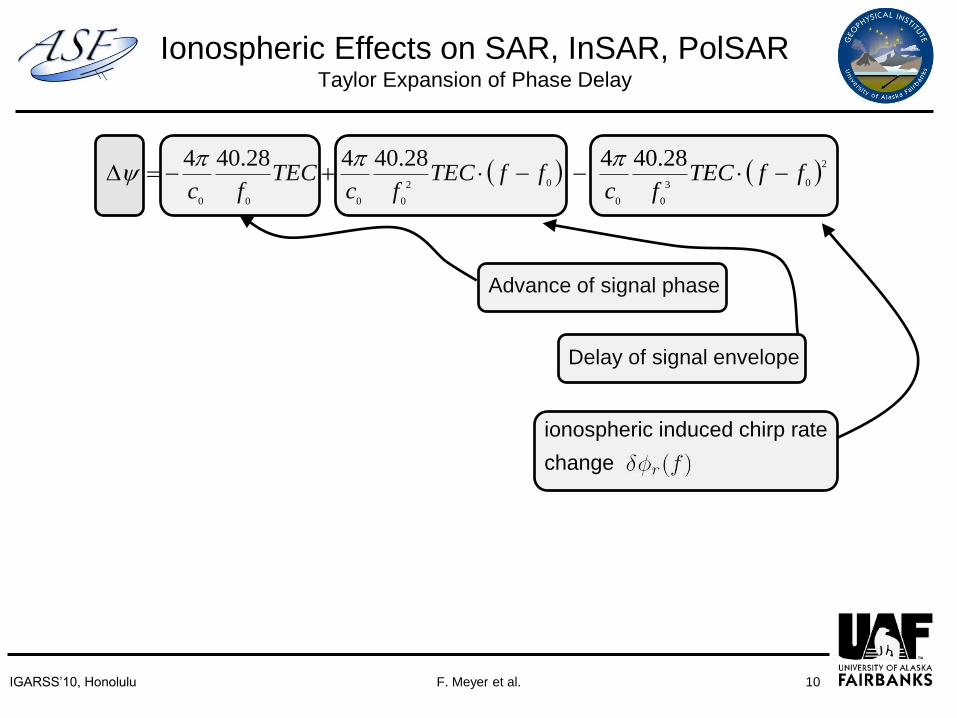
Ionospheric Effects on SAR, InSAR, PolSAR Taylor Expansion of Phase Delay
2
03
00
02
0000
28.40428.40428.404ffTEC
fcffTEC
fcTEC
fc
Advance of signal phase
Delay of signal envelope
ionospheric induced chirp rate
change
F. Meyer et al.IGARSS’10, Honolulu 11
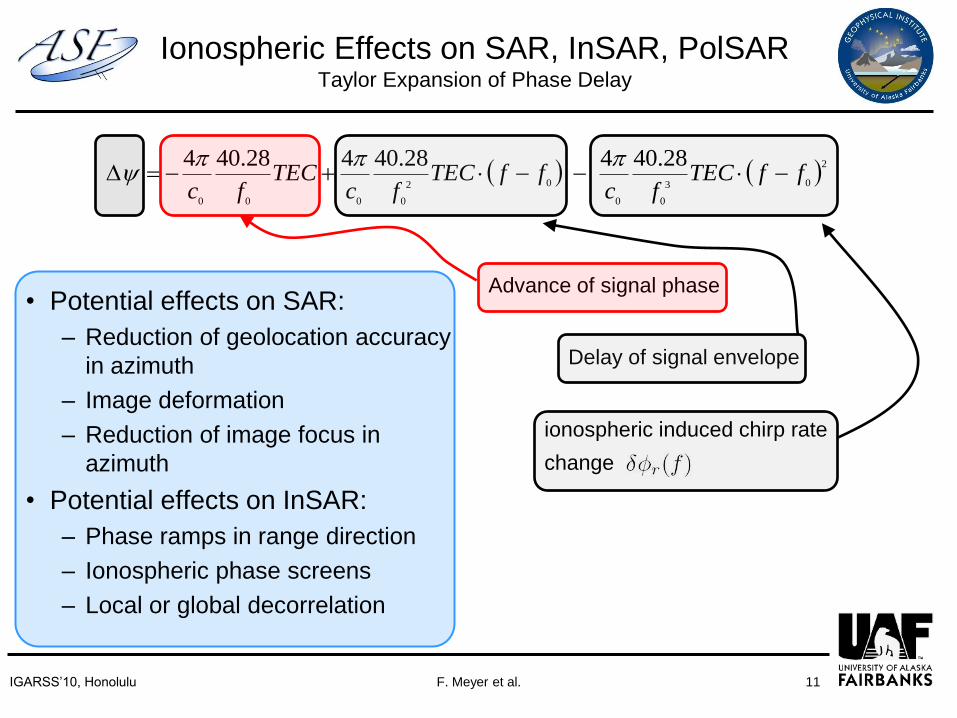
Ionospheric Effects on SAR, InSAR, PolSAR Taylor Expansion of Phase Delay
• Potential effects on SAR:
– Reduction of geolocation accuracy
in azimuth
– Image deformation
– Reduction of image focus in
azimuth
• Potential effects on InSAR:
– Phase ramps in range direction
– Ionospheric phase screens
– Local or global decorrelation
2
03
00
02
0000
28.40428.40428.404ffTEC
fcffTEC
fcTEC
fc
Advance of signal phase
Delay of signal envelope
ionospheric induced chirp rate
change
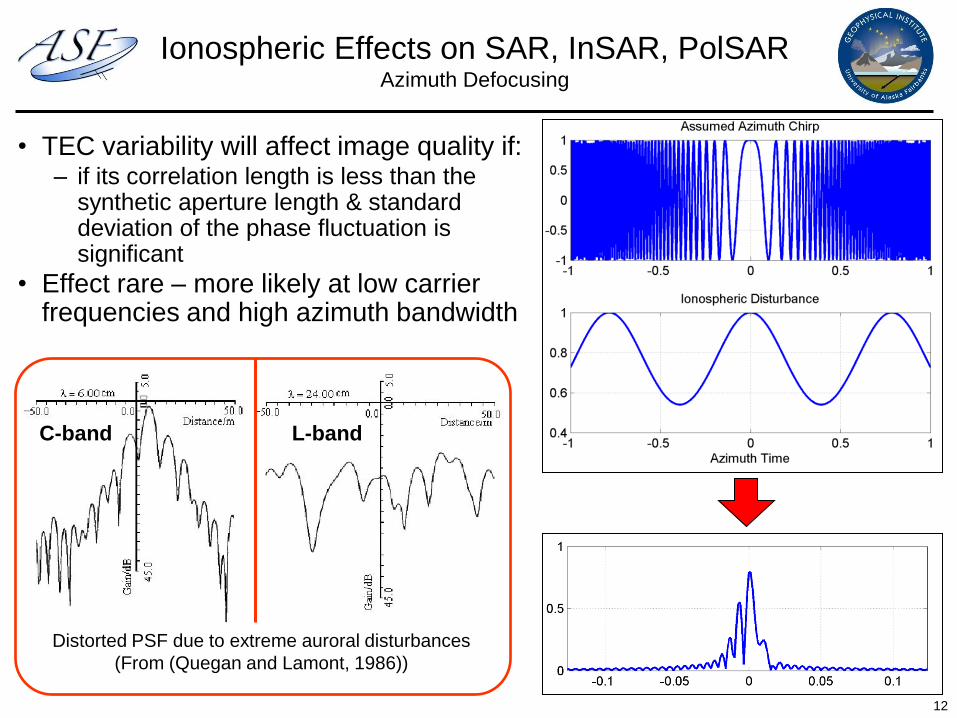
• TEC variability will affect image quality if: – if its correlation length is less than the
synthetic aperture length & standard deviation of the phase fluctuation is significant
• Effect rare – more likely at low carrier frequencies and high azimuth bandwidth
Ionospheric Effects on SAR, InSAR, PolSARAzimuth Defocusing
12
C-band L-band
Distorted PSF due to extreme auroral disturbances
(From (Quegan and Lamont, 1986))
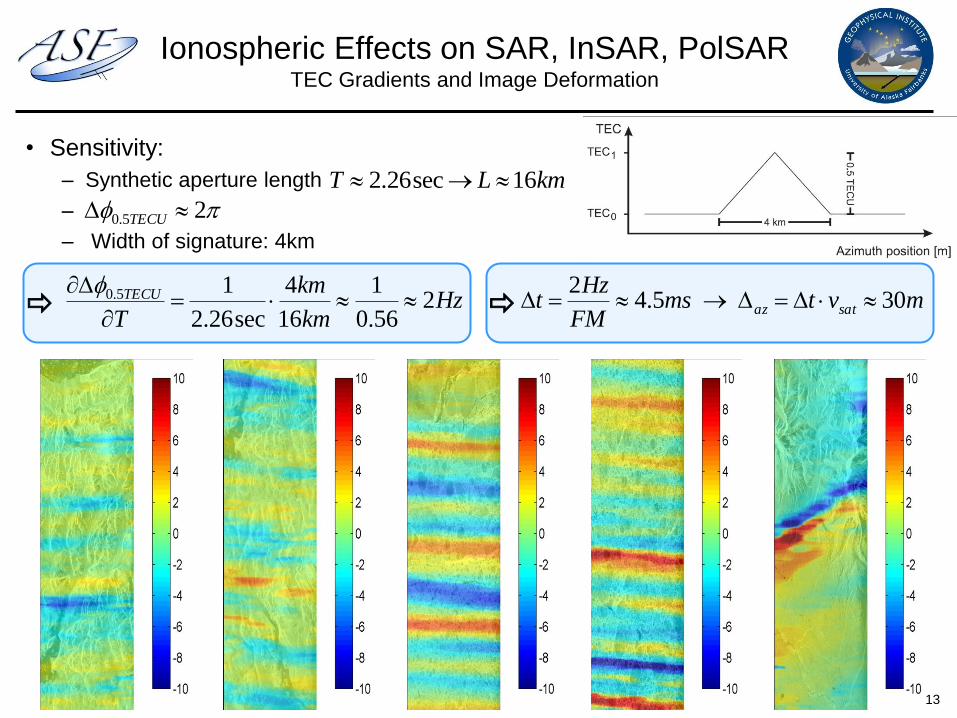
Ionospheric Effects on SAR, InSAR, PolSAR TEC Gradients and Image Deformation
• Sensitivity:
– Synthetic aperture length
–
– Width of signature: 4km
kmLT 16sec26.2
25.0 TECU
Hzkm
km
T
TECU 256.0
1
16
4
sec26.2
15.0
mvtms
FM
Hzt sataz 305.4
2
13
F. Meyer et al.IGARSS’10, Honolulu 14
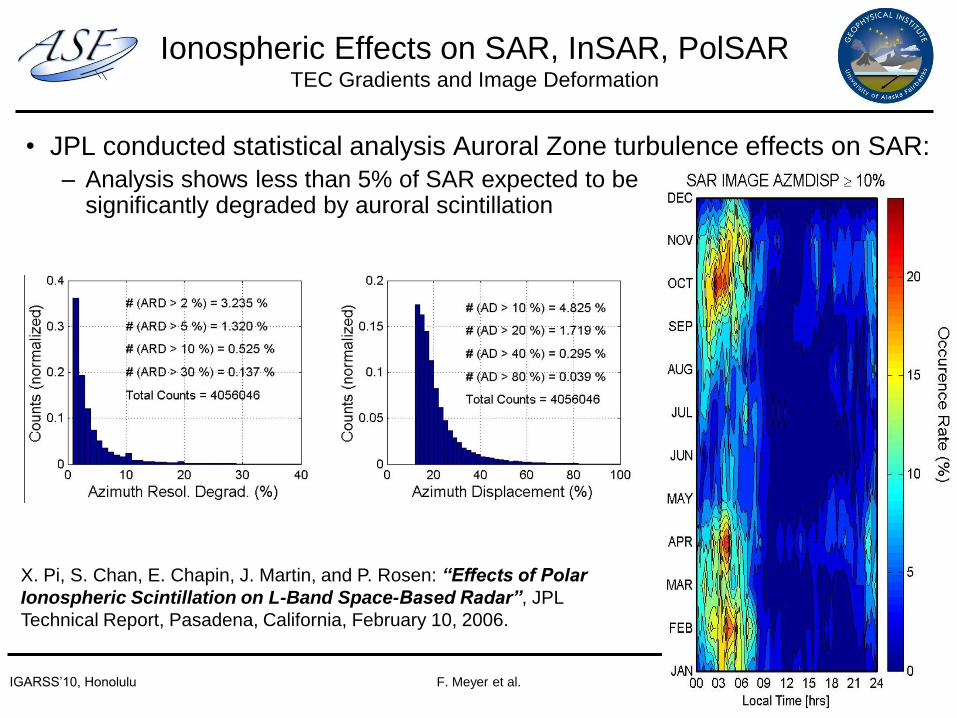
Ionospheric Effects on SAR, InSAR, PolSAR TEC Gradients and Image Deformation
• JPL conducted statistical analysis Auroral Zone turbulence effects on SAR:
– Analysis shows less than 5% of SAR expected to be significantly degraded by auroral scintillation
X. Pi, S. Chan, E. Chapin, J. Martin, and P. Rosen: “Effects of Polar
Ionospheric Scintillation on L-Band Space-Based Radar”, JPL
Technical Report, Pasadena, California, February 10, 2006.
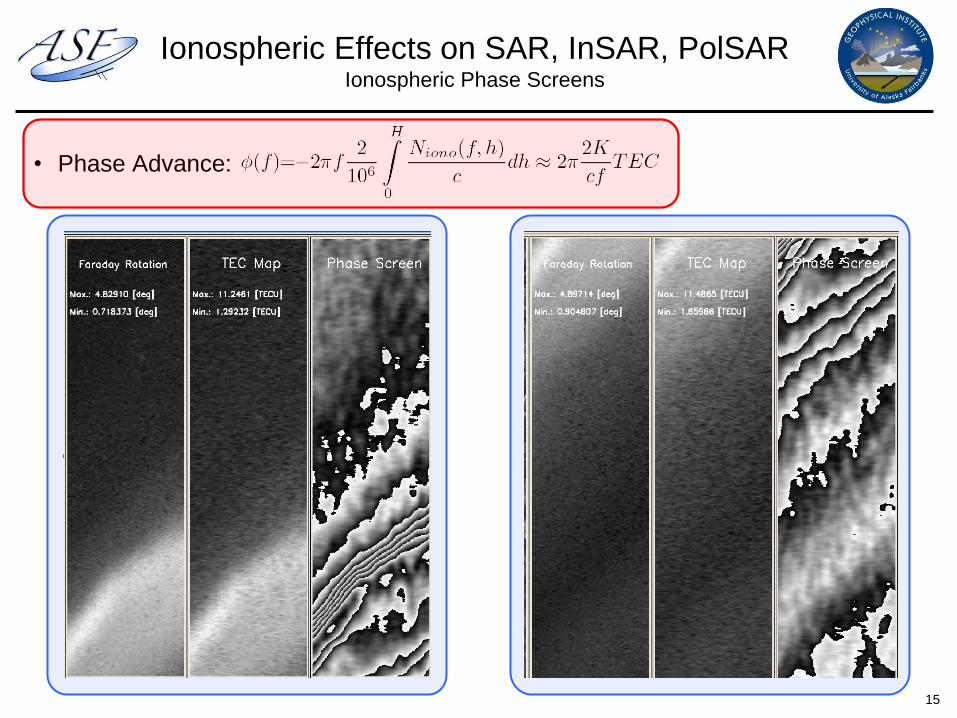
• Phase Advance:
c
Ionospheric Effects on SAR, InSAR, PolSARIonospheric Phase Screens
15

Ionospheric Effects on SAR, InSAR, PolSARIonospheric Phase Screens – Polar Examples
16
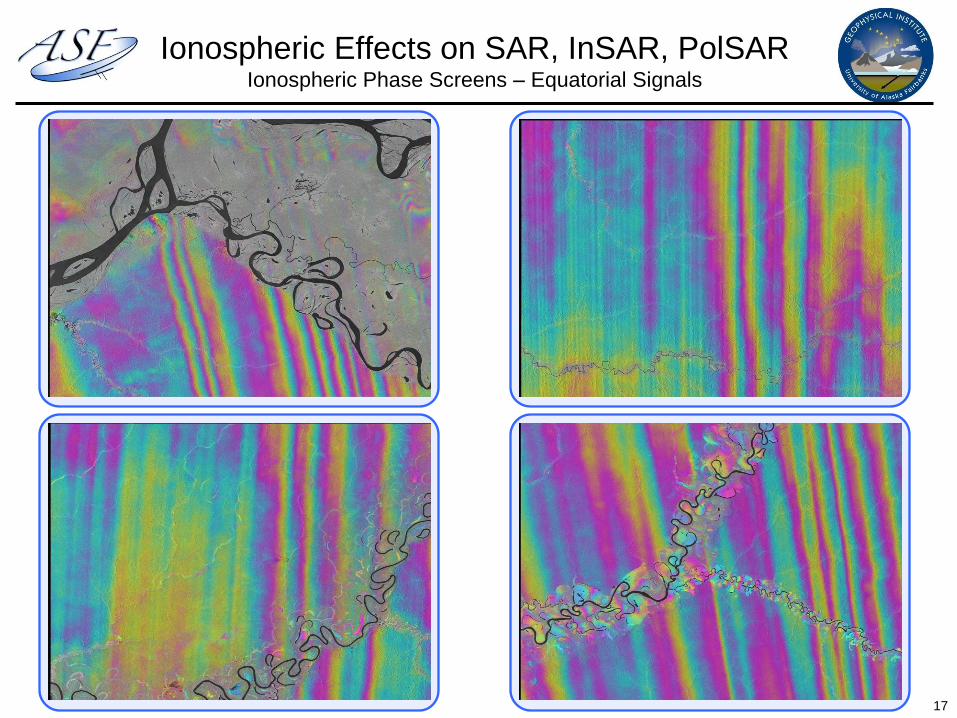
Ionospheric Effects on SAR, InSAR, PolSARIonospheric Phase Screens – Equatorial Signals
17
F. Meyer et al.IGARSS’10, Honolulu 18
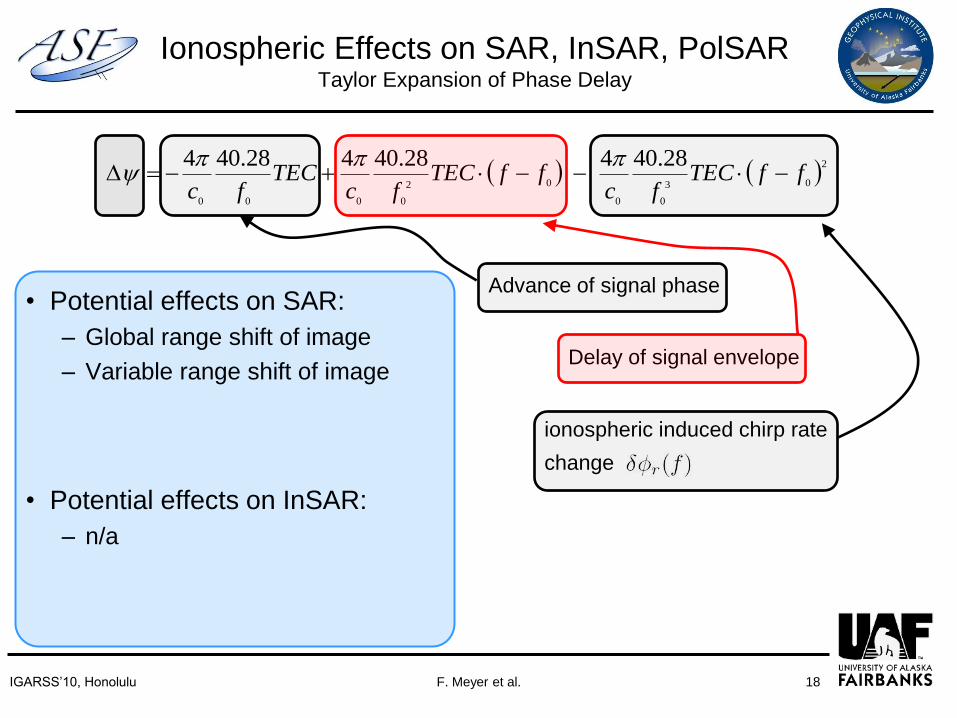
Ionospheric Effects on SAR, InSAR, PolSAR Taylor Expansion of Phase Delay
• Potential effects on SAR:
– Global range shift of image
– Variable range shift of image
• Potential effects on InSAR:
– n/a
2
03
00
02
0000
28.40428.40428.404ffTEC
fcffTEC
fcTEC
fc
Advance of signal phase
Delay of signal envelope
ionospheric induced chirp rate
change
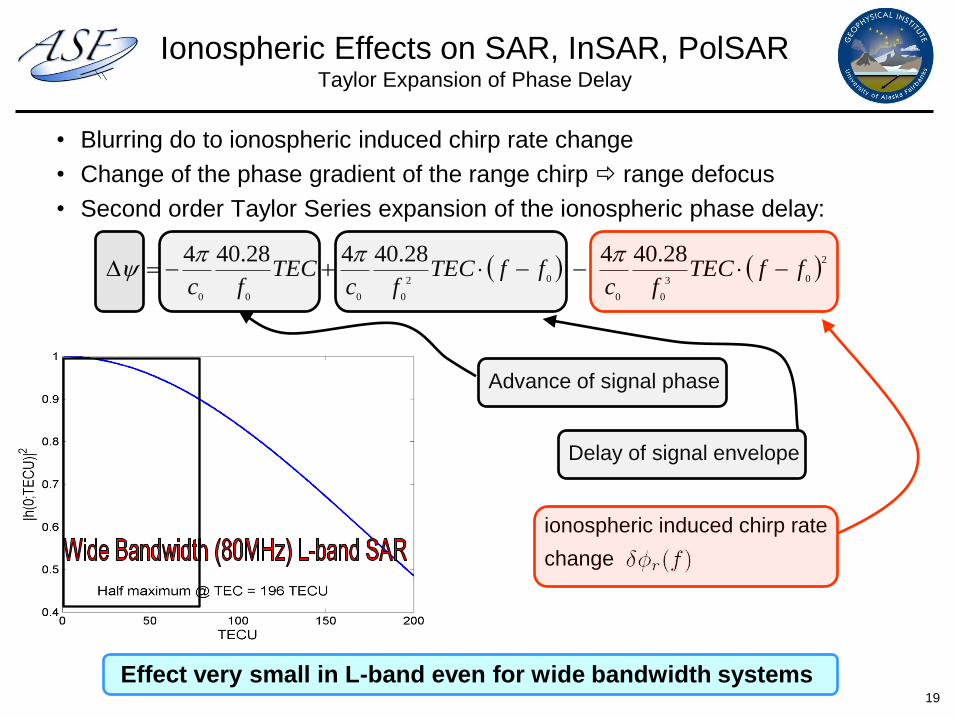
Ionospheric Effects on SAR, InSAR, PolSAR Taylor Expansion of Phase Delay
• Blurring do to ionospheric induced chirp rate change
• Change of the phase gradient of the range chirp range defocus
• Second order Taylor Series expansion of the ionospheric phase delay:
2
03
00
02
0000
28.40428.40428.404ffTEC
fcffTEC
fcTEC
fc
Advance of signal phase
Delay of signal envelope
ionospheric induced chirp rate
change
Effect very small in L-band even for wide bandwidth systems 19
F. Meyer et al.IGARSS’10, Honolulu 20
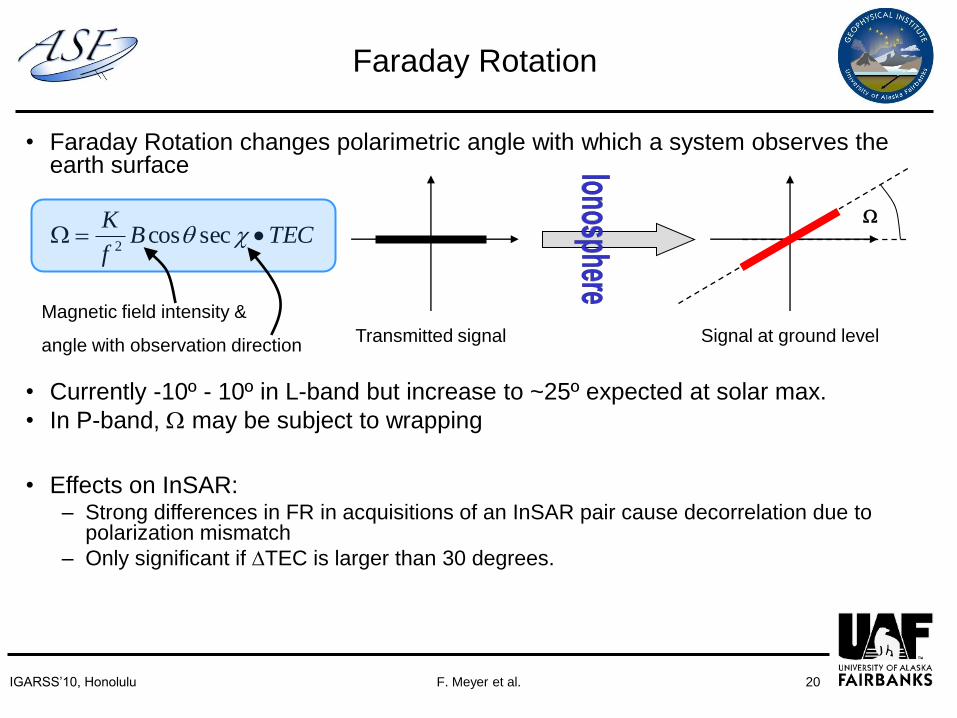
Faraday Rotation
• Faraday Rotation changes polarimetric angle with which a system observes the earth surface
• Currently -10º - 10º in L-band but increase to ~25º expected at solar max.
• In P-band, W may be subject to wrapping
Transmitted signal Signal at ground level
WTECB
f
KW seccos
2
Magnetic field intensity &
angle with observation direction
• Effects on InSAR:– Strong differences in FR in acquisitions of an InSAR pair cause decorrelation due to
polarization mismatch
– Only significant if TEC is larger than 30 degrees.
F. Meyer et al.IGARSS’10, Honolulu 21
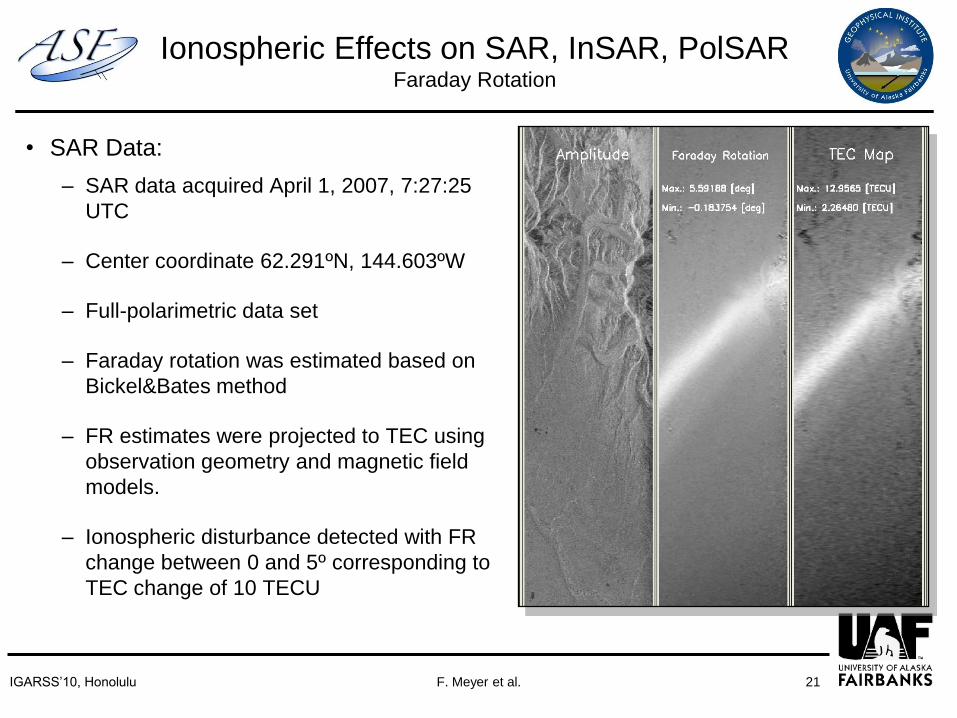
Ionospheric Effects on SAR, InSAR, PolSAR Faraday Rotation
• SAR Data:
– SAR data acquired April 1, 2007, 7:27:25
UTC
– Center coordinate 62.291ºN, 144.603ºW
– Full-polarimetric data set
– Faraday rotation was estimated based on
Bickel&Bates method
– FR estimates were projected to TEC using
observation geometry and magnetic field
models.
– Ionospheric disturbance detected with FR
change between 0 and 5º corresponding to
TEC change of 10 TECU

F. Meyer et al.IGARSS’10, Honolulu 22
Ionospheric Effects on SAR, InSAR, PolSAR Faraday Rotation
• Cross validation of geocoded
datasets:
– SkyCam data geocoded using
star coordinates
– SAR data geocoded to
ionospheric center at 100km
altitude
Gakona, AK
F. Meyer et al.IGARSS’10, Honolulu 23
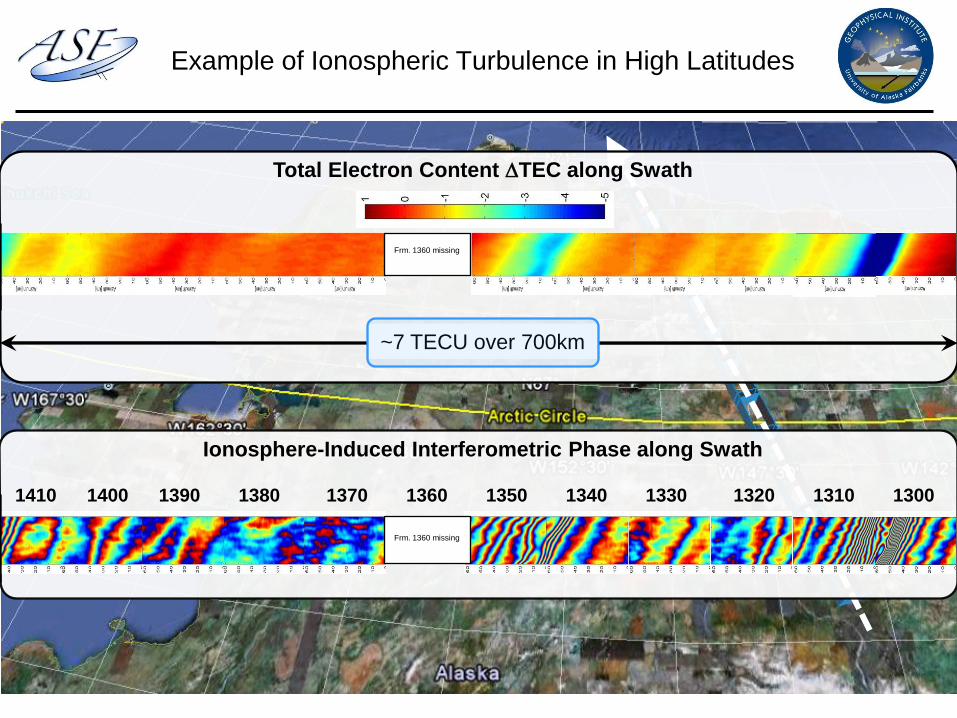
Example of Ionospheric Turbulence in High Latitudes
Frm. 1360 missing
Ionosphere-Induced Interferometric Phase along Swath
13001310132013301340135013701380139014001410 1360
Total Electron Content TEC along Swath
Frm. 1360 missing
~7 TECU over 700km

F. Meyer et al.IGARSS’10, Honolulu 24
Methods for Ionospheric Correction
Faraday Rotation (FR) Based Correction
• FR estimation from quad-pol data – Freeman, 2004;
Quegan, 2010
• FR estimation from HH-HV correlation – Nicoll & Meyer, 2008
Range Split-Spectrum Based Correction
• Distributed targets in Repeat-pass InSAR →tsTEC – Rosen, 2009, 2010
• Coherent Targets in single image → sTEC – Papathanassiou, 2009
• Amplitude correlation of sub-looks → TEC – Meyer & Bamler, 2005
Transmitted ground levelW

F. Meyer et al.IGARSS’10, Honolulu 25
Methods for Ionospheric Correction
Azimuth Autofocus Based Correction
• Contrast maximization for point targets – several authors
• Coherent AF: Phase Curvature analysis – Papathanassiou, 2008
• Incoherent AF: Sub-look co-registration (MLR) – Meyer & Nicoll, 2008
Hybrid Methods
• Combination of range and phase offsets in InSAR – Meyer, 2005
• Two dimensional phase signature of point targets – Papathanassiou
• …

F. Meyer et al.IGARSS’10, Honolulu 26
• Question to Answer: How accurate does correction have to be?
• Requirements were defined such that corrected data meets calibration
specs and advertised system capabilities
• Requirements for a PALSAR-like system:
– Polarimetry:
– Image geolocation:
– Image geometry
– Topographic Mapping from InSAR:
– Deformation mapping from InSAR:
• Based on the developed parameters, existing ionospheric correction
methods can be tested for their applicability for operational
implementation
Requirements for Ionospheric Correction
TECUECT
1ˆ
2ˆ W
TECUECT
01.0ˆ
TECUECT
1.005.0ˆ
TECUECT
005.0ˆ
For more information: F. Meyer (2010): “Performance Requirements for Correction of Ionospheric Signals in L-band SAR
Data”, Proceedings of EUSAR'10 Conference, 2010, Aachen, Germany, pp: 1106–1109.

F. Meyer et al.IGARSS’10, Honolulu 27
An Introduction to the Session
• Program Session I (13:35 – 15:15):
– 14:15:Masanobu Shimada: “Ionospheric Streaks Appearing in PALSAR
Images”
– 14:35: Jun Su Kim et al.: “Impact & Mitigation Strategy of Ionospheric
Effects In the Context of Low-Frequency (L-/P-
Band) SAR Missions Scenarios”
– 14:55: Shaun Quegan et al: “Assessment of new Correction Techniques
for Faraday Rotation and Ionospheric
Scintillation: A BIOMASS Perspective”

F. Meyer et al.IGARSS’10, Honolulu 28
An Introduction to the Session
• Program Session II (15:40 – 17:20):
– 15:40:Ch. Carrano et al.: “A Phase Screen Simulator for Predicting the
Impact on Small-Scale Ionospheric Structure
on SAR Image Formation and Interferometry”
– 16:00: Xiaoqing Pi et al.: “Measurements and Corrections of
Ionospheric Effects in InSAR Imagery”
– 16:20: Phillip Roth et al: “Simulating and Mitigating Ionospheric
Effects in Synthetic Aperture Radar”
– 16:40: Paul Rosen et al: “Further Developments in Ionospheric
Mitigation of Repeat-Pass InSAR Data”
– 17:00: J. Nicoll & F. Meyer: “Faraday Rotation Detection and Correction
for Dual-Polarization L-Band Data”
F. Meyer et al.IGARSS’10, Honolulu 29
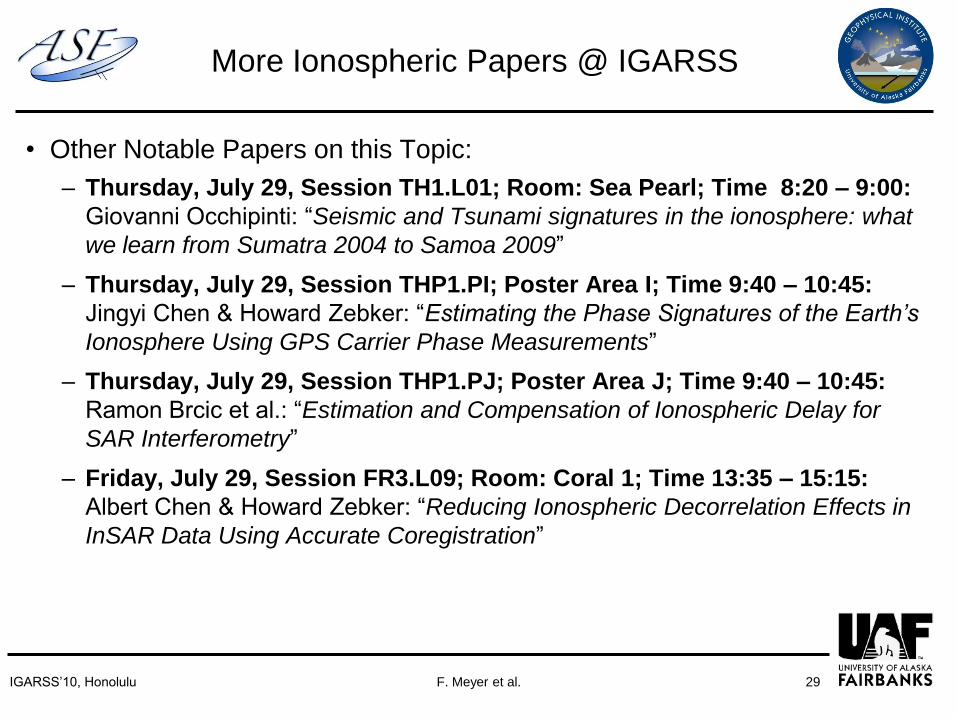
More Ionospheric Papers @ IGARSS
• Other Notable Papers on this Topic:
– Thursday, July 29, Session TH1.L01; Room: Sea Pearl; Time 8:20 – 9:00:
Giovanni Occhipinti: “Seismic and Tsunami signatures in the ionosphere: what
we learn from Sumatra 2004 to Samoa 2009”
– Thursday, July 29, Session THP1.PI; Poster Area I; Time 9:40 – 10:45:
Jingyi Chen & Howard Zebker: “Estimating the Phase Signatures of the Earth’s
Ionosphere Using GPS Carrier Phase Measurements”
– Thursday, July 29, Session THP1.PJ; Poster Area J; Time 9:40 – 10:45:
Ramon Brcic et al.: “Estimation and Compensation of Ionospheric Delay for
SAR Interferometry”
– Friday, July 29, Session FR3.L09; Room: Coral 1; Time 13:35 – 15:15:
Albert Chen & Howard Zebker: “Reducing Ionospheric Decorrelation Effects in
InSAR Data Using Accurate Coregistration”
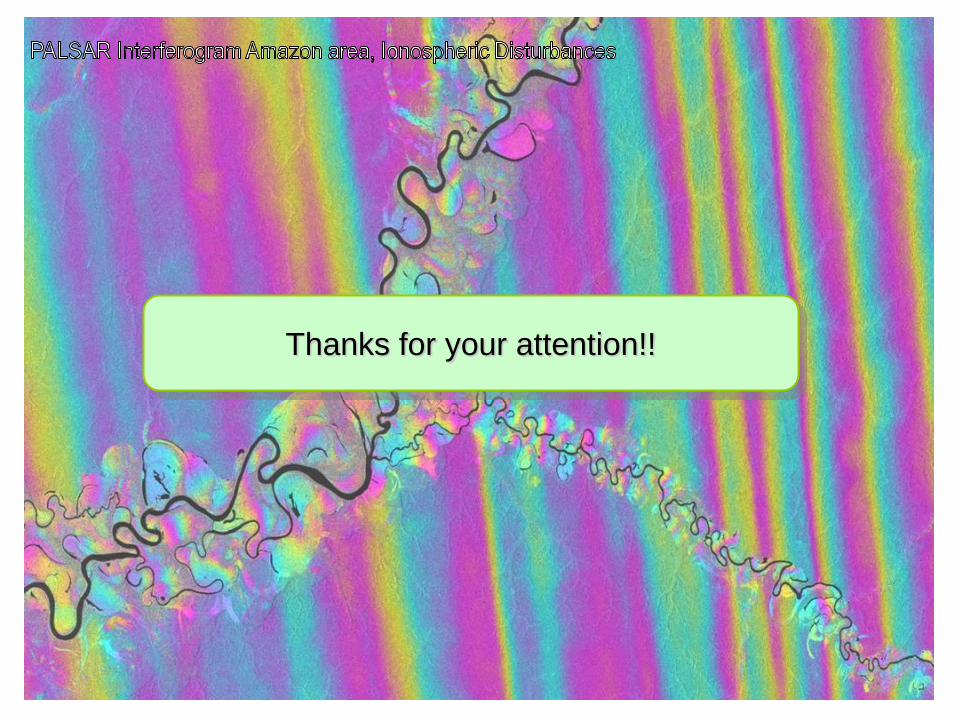
Thanks for your attention!!