a review of: global soft magnetic core shipments & nickel commodity prices spring-2009 tta...
TRANSCRIPT

A Review ofA Review of::
Global Soft Magnetic Core ShipmentsGlobal Soft Magnetic Core Shipments& Nickel Commodity Prices& Nickel Commodity Prices
A Review ofA Review of::
Global Soft Magnetic Core ShipmentsGlobal Soft Magnetic Core Shipments& Nickel Commodity Prices& Nickel Commodity Prices
Spring-2009 TTA MeetingsSpring-2009 TTA Meetings
May 14, 2009May 14, 2009
Spring-2009 TTA MeetingsSpring-2009 TTA Meetings
May 14, 2009May 14, 2009
Presented by theStaff of the
International Magnetics Association
TopicsTopics TopicsTopics
• Overview of Soft Magnetics IndustryOverview of Soft Magnetics Industry
• Ferrite PerformanceFerrite Performance
• Powder Core PerformancePowder Core Performance
• Nickel Commodity Price ImpactNickel Commodity Price Impact
• Challenges for 2009Challenges for 2009
• Overview of Soft Magnetics IndustryOverview of Soft Magnetics Industry
• Ferrite PerformanceFerrite Performance
• Powder Core PerformancePowder Core Performance
• Nickel Commodity Price ImpactNickel Commodity Price Impact
• Challenges for 2009Challenges for 2009

Soft Magnetic CoresSoft Magnetic CoresSoft Magnetic CoresSoft Magnetic Cores
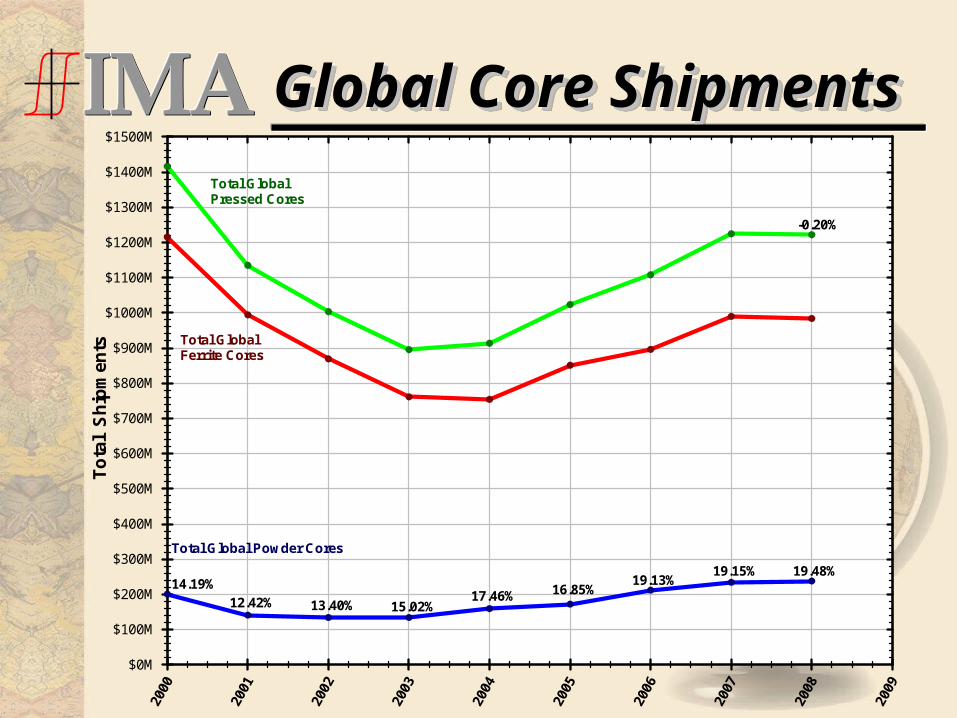
• Ferrites include MnZn and NiZn cores:Ferrites include MnZn and NiZn cores:– 2008 at -0.6% under 2007 (forecast was +5.5%).2008 at -0.6% under 2007 (forecast was +5.5%).
◦ 08Q1 & Q2 +15% to +30%; 08Q3 & Q4 -20% to -30%.08Q1 & Q2 +15% to +30%; 08Q3 & Q4 -20% to -30%.
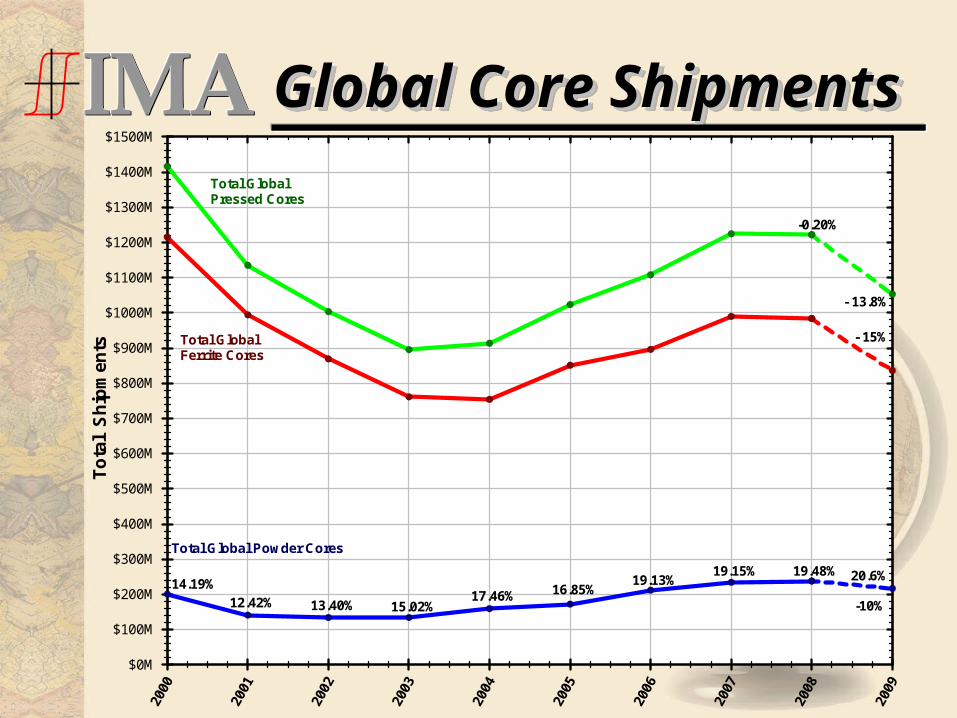
– 2009 forecast is for -15% to -30% (09Q1 -30 to -40%).2009 forecast is for -15% to -30% (09Q1 -30 to -40%).
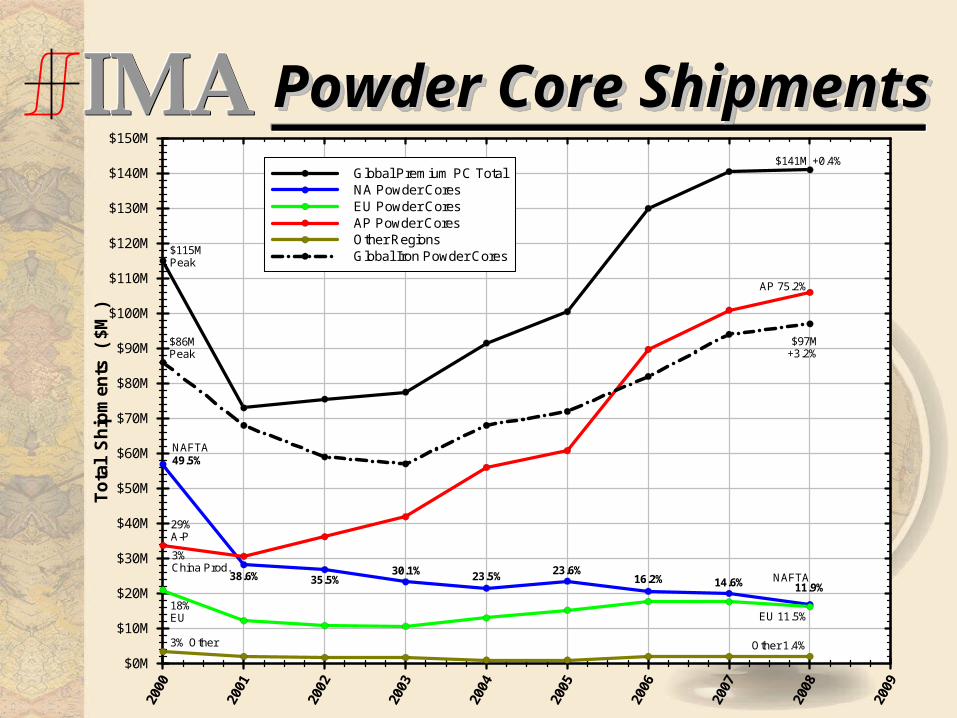
• Powder Cores have two segments:Powder Cores have two segments:– 2008 Premium Cores at +0.4% over 2007 (fcst. +8%).2008 Premium Cores at +0.4% over 2007 (fcst. +8%).
◦ 2009 forecasts are for a decline of -10%.2009 forecasts are for a decline of -10%.
– 2008 Iron Powder at +3.2% over 2007 (fcst. +7%).2008 Iron Powder at +3.2% over 2007 (fcst. +7%).◦ 2009 forecast not certain, typically not as volatile as Prem. 2009 forecast not certain, typically not as volatile as Prem.
PC.PC.
• Powder core industry still adding capacity.Powder core industry still adding capacity.– Will pose bottom line challenges in 2009.Will pose bottom line challenges in 2009.
• Ferrites include MnZn and NiZn cores:Ferrites include MnZn and NiZn cores:– 2008 at -0.6% under 2007 (forecast was +5.5%).2008 at -0.6% under 2007 (forecast was +5.5%).
◦ 08Q1 & Q2 +15% to +30%; 08Q3 & Q4 -20% to -30%.08Q1 & Q2 +15% to +30%; 08Q3 & Q4 -20% to -30%.
– 2009 forecast is for -15% to -30% (09Q1 -30 to -40%).2009 forecast is for -15% to -30% (09Q1 -30 to -40%).
• Powder Cores have two segments:Powder Cores have two segments:– 2008 Premium Cores at +0.4% over 2007 (fcst. +8%).2008 Premium Cores at +0.4% over 2007 (fcst. +8%).
◦ 2009 forecasts are for a decline of -10%.2009 forecasts are for a decline of -10%.
– 2008 Iron Powder at +3.2% over 2007 (fcst. +7%).2008 Iron Powder at +3.2% over 2007 (fcst. +7%).◦ 2009 forecast not certain, typically not as volatile as Prem. 2009 forecast not certain, typically not as volatile as Prem.
PC.PC.
• Powder core industry still adding capacity.Powder core industry still adding capacity.– Will pose bottom line challenges in 2009.Will pose bottom line challenges in 2009.
Global Core ShipmentsGlobal Core ShipmentsGlobal Core ShipmentsGlobal Core Shipments20
00
2001
2002
2003
2004
2005
2006
2007
2008
2009
To
tal
Sh
ipm
ents
$0M
$100M
$200M
$300M
$400M
$500M
$600M
$700M
$800M
$900M
$1000M
$1100M
$1200M
$1300M
$1400M
$1500M
14.19%12.42% 13.40% 15.02%
17.46% 16.85%19.13%
Total Global Powder Cores
Total GlobalFerrite Cores
Total GlobalPressed Cores
19.15%
-0.20%
19.48%
Global Core ShipmentsGlobal Core ShipmentsGlobal Core ShipmentsGlobal Core Shipments20
00
2001
2002
2003
2004
2005
2006
2007
2008
2009
To
tal
Sh
ipm
ents
$0M
$100M
$200M
$300M
$400M
$500M
$600M
$700M
$800M
$900M
$1000M
$1100M
$1200M
$1300M
$1400M
$1500M
14.19%12.42% 13.40% 15.02%
17.46% 16.85%19.13%
Total Global Powder Cores
Total GlobalFerrite Cores
Total GlobalPressed Cores
19.15%
-0.20%
20.6%
- 13.8%
- 15%
-10%
19.48%

Ferrite Core ShipmentsFerrite Core ShipmentsFerrite Core ShipmentsFerrite Core Shipments20
00
2001
2002
2003
2004
2005
2006
2007
2008
2009
To
tal
Sh
ipm
ents
(
$M )
$0M
$100M
$200M
$300M
$400M
$500M
$600M
$700M
$800M
$900M
$1000M
$1100M
$1200M
$1300M
Global Ferrite Total$1215M
Peak
$984M-0.6%

Ferrite Core ShipmentsFerrite Core ShipmentsFerrite Core ShipmentsFerrite Core Shipments20
00
2001
2002
2003
2004
2005
2006
2007
2008
2009
To
tal
Sh
ipm
ents
(
$M )
$0M
$100M
$200M
$300M
$400M
$500M
$600M
$700M
$800M
$900M
$1000M
$1100M
$1200M
$1300M
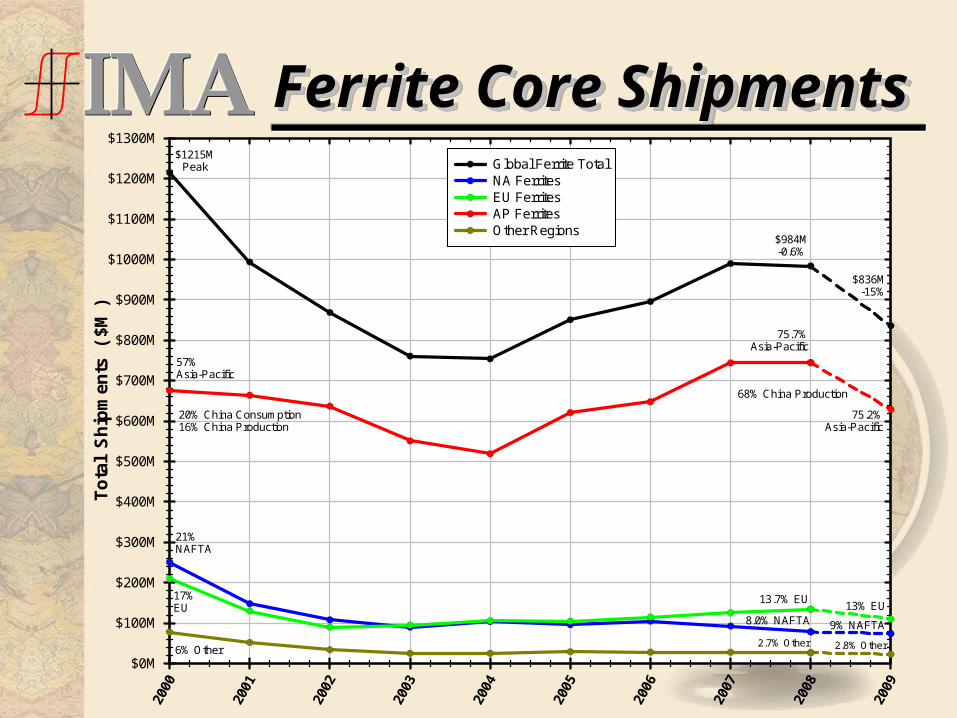
Global Ferrite TotalNA FerritesEU FerritesAP FerritesOther Regions
$1215MPeak
$984M-0.6%
57%Asia-Pacific
20% China Consumption16% China Production
75.7%Asia-Pacific
68% China Production
21%NAFTA
17%EU
6% Other2.7% Other
13.7% EU
8.0% NAFTA
Ferrite Core ShipmentsFerrite Core ShipmentsFerrite Core ShipmentsFerrite Core Shipments20
00
2001
2002
2003
2004
2005
2006
2007
2008
2009
To
tal
Sh
ipm
ents
(
$M )
$0M
$100M
$200M
$300M
$400M
$500M
$600M
$700M
$800M
$900M
$1000M
$1100M
$1200M
$1300M
Global Ferrite TotalNA FerritesEU FerritesAP FerritesOther Regions
$1215MPeak
$984M-0.6%
57%Asia-Pacific
20% China Consumption16% China Production
75.7%Asia-Pacific
68% China Production
21%NAFTA
17%EU
6% Other2.7% Other
13.7% EU
8.0% NAFTA
$836M-15%
75.2%Asia-Pacific
2.8% Other
13% EU
9% NAFTA

PowderPowder CoreCore ShipmentsShipmentsPowderPowder CoreCore ShipmentsShipments20
00
2001
2002
2003
2004
2005
2006
2007
2008
2009
To
tal
Sh
ipm
ents
(
$M )
$0M
$10M
$20M
$30M
$40M
$50M
$60M
$70M
$80M
$90M
$100M
$110M
$120M
$130M
$140M
$150M
Global Premium PC TotalGlobal Iron Powder Cores
$115MPeak
$86MPeak
$141M +0.4%
$97M+3.2%
PowderPowder CoreCore ShipmentsShipmentsPowderPowder CoreCore ShipmentsShipments20
00
2001
2002
2003
2004
2005
2006
2007
2008
2009
To
tal
Sh
ipm
ents
(
$M )
$0M
$10M
$20M
$30M
$40M
$50M
$60M
$70M
$80M
$90M
$100M
$110M
$120M
$130M
$140M
$150M
Global Premium PC TotalNA Powder CoresEU Powder CoresAP Powder CoresOther RegionsGlobal Iron Powder Cores
49.5%
38.6% 35.5%30.1% 23.5% 23.6%
16.2%11.9%
$115MPeak
$86MPeak
NAFTA
29%A-P
3%China Prod.
18%EU
3% Other
$141M +0.4%
$97M+3.2%
AP 75.2%
NAFTA
EU 11.5%
Other 1.4%
14.6%

PowderPowder CoreCore ShipmentsShipmentsPowderPowder CoreCore ShipmentsShipments20
00
2001
2002
2003
2004
2005
2006
2007
2008
2009
To
tal
Sh
ipm
ents
(
$M )
$0M
$10M
$20M
$30M
$40M
$50M
$60M
$70M
$80M
$90M
$100M
$110M
$120M
$130M
$140M
$150M
Global Premium PC TotalNA Powder CoresEU Powder CoresAP Powder CoresOther RegionsGlobal Iron Powder Cores
49.5%
38.6% 35.5%30.1% 23.5% 23.6%
16.2%11.9%
$115MPeak
$86MPeak
NAFTA
29%A-P
3%China Prod.
18%EU
3% Other
$141M +0.4%
$97M+3.2%
AP 75.2%
76% ChinaProduction
NAFTA
EU 11.5%
Other 1.4% Other 1.6%
EU 12.6%
NAFTA12.6%
73.2%AP
$90M-7%
$127M-10%
14.6%

Nickel Price ImpactNickel Price ImpactNickel Price ImpactNickel Price Impact20
03
2004
2005
2006
2007
2008
2009
Nic
kel
Co
mm
od
ity
($/
lb)
$0
$5
$10
$15
$20
$25
Nickel Daily AverageNickel Monthly HighNickel Monthly Low
Nickel Price Doubled02Q4 to 03Q4
Nickel Price Average of $6.75 per Pound,04Q1 through 06Q1
Nickel Triples in Value,05Q4 through 06Q4
Nickel Quadruples in Value,05Q4 through 07Q1
Continued Volatility,07Q1 through 08Q4
Stabilityin 2009 ?

Challenges for 2009Challenges for 2009Challenges for 2009Challenges for 2009
• The past 6-8 months have been difficult for The past 6-8 months have been difficult for most core manufacturers.most core manufacturers.– Bookings declines in 08Q4 and shipment declines for Bookings declines in 08Q4 and shipment declines for
current months of 2009 are off 30% to 40% YTY.current months of 2009 are off 30% to 40% YTY.
• Excess production capacity in ferrites and Excess production capacity in ferrites and powder cores (most located in China).powder cores (most located in China).– Chinese do not have a correct global view of the Chinese do not have a correct global view of the
markets and Western competitors sizes.markets and Western competitors sizes.
• What will happen in the raw material What will happen in the raw material markets: iron, nickel, manganese, etc.?markets: iron, nickel, manganese, etc.?

QuestionsQuestions QuestionsQuestions
????