a review of corporate bond indices: construction principles
TRANSCRIPT

A Review of Corporate Bond Indices: Construction Principles,
Return Heterogeneity, and Fluctuations in Risk Exposures
June 2011
An EDHEC-Risk Institute Publication
Institute

2
We are grateful to David Schröder for providing an initial analysis of corporate bond indices.
Printed in France, June2011. Copyright© EDHEC 2011.The opinions expressed in this study are those of the authors and do not necessarily reflect those of EDHEC Business School.The authors can be contacted at [email protected].

3An EDHEC-Risk Institute Publication
A Review of Corporate Bond Indices: Construction Principles, Return Heterogeneity, and Fluctuations in Risk Exposures — June 2011
Abstract ........................................................................................................................... 5
1. Introduction .............................................................................................................. 7
2. Overview of Corporate Bond Indices ................................................................... 11
3. Empirical Analysis—US Study ................................................................................. 21
4. Empirical Analysis—Eurozone Study ................................................................... 33
Conclusion ...................................................................................................................... 43
Appendix: Alternative Weighting Schemes ............................................................. 45
References ...................................................................................................................... 51
About EDHEC-Risk Institute ....................................................................................... 55
EDHEC-Risk Institute Publications and Position Papers (2008-2011) ................. 59
Table of Contents

4 An EDHEC-Risk Institute Publication
A Review of Corporate Bond Indices: Construction Principles, Return Heterogeneity, and Fluctuations in Risk Exposures — June 2011
About the Authors
Felix Goltz is head of applied research at EDHEC-Risk Institute. He does research in empirical finance and asset allocation, with a focus on alternative investments and indexing strategies. His work has appeared in various international academic and practitioner journals and handbooks. He obtained a PhD in finance from the University of Nice Sophia-Antipolis after studying economics and business administration at the University of Bayreuth and EDHEC Business School.
Carlos Heitor Campani has an engineering degree from the Military Institute of Engineering (IME-Brazil) and the Federal University of Rio de Janeiro and an MSc in finance from Coppead Business School at the Federal University of Rio de Janeiro. He is currently a research assistant at EDHEC-Risk Institute and a student in the PhD in finance programme at EDHEC Business School. His dissertation deals with asset allocation and asset pricing and his work at EDHEC-Risk Institute with bond and low-sovereign-risk indices. He has taught at Coppead Business School at the Federal University of Rio de Janeiro and acted as a financial consult to such Brazilian companies as TIM, Zayd Group, Light S. A., and SENAC.

5An EDHEC-Risk Institute Publication
Abstract

6 An EDHEC-Risk Institute Publication
A Review of Corporate Bond Indices: Construction Principles, Return Heterogeneity, and Fluctuations in Risk Exposures — June 2011
This paper analyses two sets of four corporate investment-grade bond indices each, one for the US market and the other for the euro-denominated bond market. First, we review the uses of bond indices as well as the challenges involved. We then analyse the risk-return properties and the heterogeneity of the indices in each set. Although the indices in each market resemble each other, there are still some differences. Moreover, an analysis of the stability of the indices’ risk exposures (interest rate and credit risks) reveals very unstable measures over time and, perhaps most importantly, this instability is accentuated in the two indices with the smallest number of bonds: the more investable the index is meant to be, the less reliable it is. Finally, we find great differences between US and euro-denominated indices: US corporate bond indices showed higher credit risk, with longer terms to maturity and hence longer durations. Therefore, choosing a bond index in US or in Europe seems to be more than just choosing a currency exposure. We ultimately conclude that investors must be aware not only of what bond indices represent but also of how such key features as risk exposures will evolve over time.
Abstract

7An EDHEC-Risk Institute Publication
2. xxxxxxxxxxxxxxxxxx1. Introduction
7An EDHEC-Risk Institute Publication
8 An EDHEC-Risk Institute Publication
A Review of Corporate Bond Indices: Construction Principles, Return Heterogeneity, and Fluctuations in Risk Exposures — June 2011
Investors have always considered bonds a safe haven in which to park a share of their wealth. And in recent years passive investment has become increasingly popular with investors looking for easy, straightforward options. But mixing bonds and passive investment turns out to be more complex than it first appears. Fixed-income indices are rather more difficult to pin down than their equity equivalents, for reasons we explore in this document. And although corporate bond indices have been around for some time, it is only recently that practitioners and academics have begun to discuss them.
In the last decade, debate has swirled around bond indices, and questions such as how a bond index should be built, what its objectives should be, for whom a particular bond index is suitable, and so on have been examined in the literature. Sangvinatsos (2010) discusses how corporate bond indices could be integrated with other asset classes such as stocks and Treasuries in constructing optimal portfolios; Korn and Koziol (2006) and Meindl and Primbs (2006) discuss bond portfolio optimisation; Cai and Jiang (2008) study corporate bond returns and volatility, and Arnott et al. (2010) apply valuation-indifferent indexing to fixed income.
Market practitioners also seem to have been drawn to bond indices in recent years: when launched in the United States in 2002, there were only a few fixed-income exchange-traded funds (ETFs), whereas there are now more than seventy based on corporate bonds, with inflows of $31.5 billion in 2009 alone. These numbers convey the importance of passive investing in this asset class and are the reason for our interest in corporate bond indices. Moreover, we
choose to work with investment-grade assets because information on such assets is more accessible than that on high-yield assets. But most of the conclusions we draw will also apply to to the junk universe (some will be even strengthened).
We distinguish between an index (which attempts to represent the market activity of a segment of an asset class) and a benchmark (the best investment given the desired risk exposure). As indices, those available are not bad at all, in view of the challenges of representing a particular asset class such as corporate bonds. But we examine the optimality of considering them benchmarks, and to do so we must begin by defining risk. Here, risk is best defined not as the variance of returns but as the likelihood of the investor’s meeting his objectives; in short, risk should be relative. What is risk-free to some investors can be risky to others: an investor seeking to hedge a fixed ten-year liability will find the short-term risk-free rate quite risky. So it is hard to believe that a single index will serve as an appropriate benchmark for all investors.
Despite the many recent papers on the corporate bond market, there are still questions to be answered. The goal of this paper, in brief, is to spark debate on corporate bond indices, especially on the practice of using indices as benchmarks. We not only review the theory but also provide an empirical comparative analysis of current indices. We review and analyse index-building schemes and the resulting risk and return properties. We also analyse interest rate risk and credit risk, the two major risks (along with liquidity risk) in the bond market.
1. Introduction
A Review of Corporate Bond Indices: Construction Principles, Return Heterogeneity, and Fluctuations in Risk Exposures — June 2011

9An EDHEC-Risk Institute Publication
A Review of Corporate Bond Indices: Construction Principles, Return Heterogeneity, and Fluctuations in Risk Exposures — June 2011
Although the US and eurozone indices obviously resemble each other, there remains some heterogeneity, so that investors, whose choices will ultimately depend on their objectives, which themselves differ from one investor to another, must determine which index best meets their needs.
The duration, yield, and time to maturity of these indices fluctuate persistently, and the fluctuations are even greater in the two indices with the smallest number of bonds, that is, the most investable ones. In short, the more investable the index is meant to be, the less reliable (the less stable) it is. For an investor, stable risk exposures are important so that allocation decisions are not compromised by uncontrolled fluctuations of risk exposures in the building blocks chosen to implement such decisions.
Finally, we find great differences between US and euro-denominated indices: US corporate bond indices showed higher credit risk, with longer terms to maturity and hence longer durations. So choosing a bond index in the United States or in Europe is more than just a matter of choosing a currency exposure. We ultimately conclude that investors must be aware of how such key features of an index as risk exposures change over time.
Our paper is organised as follows. Section two provides an overview of corporate bond indices, as well as the uses to which they are put and the challenges they pose to both providers and investors. Section three presents the study of the US and section four that of the euro-denominated bond indices. Section five concludes this research. We also include
an appendix on alternative weighting schemes.
1. Introduction

10 An EDHEC-Risk Institute Publication
A Review of Corporate Bond Indices: Construction Principles, Return Heterogeneity, and Fluctuations in Risk Exposures — June 2011
1. Introduction

11An EDHEC-Risk Institute Publication
2. Overview of Corporate Bond Indices

12 An EDHEC-Risk Institute Publication
A Review of Corporate Bond Indices: Construction Principles, Return Heterogeneity, and Fluctuations in Risk Exposures — June 2011
Corporate bond indices were originally built as indices (not benchmarks); their aim was to reflect a market, not to respond to investor objectives. The early bond indices, including corporate bonds, were pure price indices. That is, they measured the average yield of corporate bonds, but not the interest (coupons) paid on them. Examples of such indices are Standard & Poor’s high grade corporate index, available from 1926, the Ibbotson and Sinquefield (I&S) long-term corporate index since 1945 (Elton et al. 1993), or the Citigroup high-grade corporate index (1926).
Total rate-of-return bond indices were developed in the 1970s (Reilly et al. 1992). In 1973, Lehman was the first to create a total return corporate bond index, the Investment Corporate index, and make it generally available to the public. All of these indices, however, were monthly. Daily total return indices were created only in the late 1980s. Merrill Lynch started the first daily corporate bond index in late 1986; three years later, in 1989, Lehman Brothers followed it (Reilly et al. 1992).
The variety of indices now available reflects the many different purposes of these indices. In turn, and what is perhaps most important to the investor, the converse is also true: each purpose requires a particular index. Brown (2002, 3) illustrates this point by stating that “the key point to retain […] is that different horses perform better on different courses”.
So, to analyse the suitability of a corporate bond index, it is necessary to understand the uses to which it can be put. We follow Brown (2002) here and distinguish between two main purposes of corporate bond
indices: as indices in the true sense of the word (as trackers of market performance) and as investment performance benchmarks.
2.1. Uses of Corporate Bond Indices2.1.1. Market Performance IndicesTraditionally, indices of financial securities were created to measure the market performance of the respective asset class. If the purpose of a corporate bond index is to measure the performance of the corporate bond market, this measurement should be done as accurately as possible. First, to be representative of the entire market, such an index should include as many different corporate bonds as possible, as long as reliable prices are available. Second, indices whose purpose is to measure the entire corporate bond market, could justify weighting their components by capitalisation since this is a fair means of reflecting the total performance of the market. Most indices, such as the well-known Barclays (former Lehman Brothers), Citigroup, and BofA Merrill Lynch US bond indices, are in this category.
2.1.2. Investment Performance BenchmarksMore recently, indices have also been used as performance benchmarks. In this light, index returns are considered a neutral indicator of the returns an investor could have generated when investing in the respective asset class. So a good benchmark should reflect investment opportunities given the investor’s constraints and risk choices.
In some situations—if, for example, the investor merely wants his portfolio returns aligned with market movements—a broad
2. Overview of Corporate Bond Indices

13An EDHEC-Risk Institute Publication
A Review of Corporate Bond Indices: Construction Principles, Return Heterogeneity, and Fluctuations in Risk Exposures — June 2011
market-value-weighted corporate bond index might be a suitable benchmark by which to evaluate investment performance. In many cases, however, as Brown (2002, 6) states, “investor performance cannot or should not be equated to market performance”. The reason is that different investors in corporate bonds have very different objectives. Pension funds must provide enough cash when pension payments are due, insurance companies must match their savings with the likelihood of having to make payouts. A benchmark, in short, should reflect the corporate bond investor’s particular objectives.
There are some general rules that should be followed if an index is to be used as a benchmark, that is, to measure investment performance. Interested readers may refer to Martellini et al. (2003) or Brown (2002), who present the standardised rules for calculating bond indices as proposed by the European Federation of Financial Analyst Societies.1 Some generally accepted rules appear below:• There should be a clear set of objective rules that define which securities are included in the index, and how the different securities are weighted. All index changes should be governed by clear rules as well and investors should be able to forecast and agree on changes in composition.• The rules should be available to investors. Similarly, current and past index returns should be easily accessible.• The returns reported for an index should be replicable by investors, i.e., the index should consist of rather easily investable securities. Otherwise, it would be unfair to compare the performance of the investors’ portfolios with the index.
• The index composition should reflect the investors’ opportunity set and track markets or market segments that are of interest to investors.• An index should change composition infrequently to prevent undesirable continuous transactions. At the same time, indices must reflect changes in the markets. Hence, this often creates a tradeoff between stability and accuracy.
2.1.3. Indices as Investment MediaIn addition to being used as measures of market performance or as investment benchmarks, corporate bond indices serve as a basis for financial instruments that enable, in one way or another, an investment in these indices. The general problem with replicating corporate bond indices is the rather low liquidity of the underlying corporate bonds. Since investors in baskets of corporate bonds usually request high liquidity, product providers face a costly incongruity of liquidity with respect to their underlying securities. But as this study will show, good index replication is possible by investing in a small number of (liquid) corporate bonds.
The first products based on corporate bond indices were the traditional index funds. Index funds, which were kicked off in 1984 for institutional investors (Reilly et al. 1992) and in 1986 for retail investors (Ferri 2006), attempt to replicate the performance of bond indices. Both products tracked the Lehman Brothers aggregate bond index. As index funds became more popular, several asset management firms attempted to develop funds (the iShares US Investment Grade Corporate Bond Index Fund, for example) specifically designed to replicate corporate bond indices.
2. Overview of Corporate Bond Indices
1 - The book on construction of bond indices by Brown (2002) summarises and illustrates the guidelines for fixed-income index construction as proposed by the European Federation of Financial Analyst Societies (EFFAS) and its subsidiary, the European Bond Commission (EBC).

14 An EDHEC-Risk Institute Publication
A Review of Corporate Bond Indices: Construction Principles, Return Heterogeneity, and Fluctuations in Risk Exposures — June 2011
More recently, ETF (exchange-traded fund) providers have begun offering ETFs on corporate bond indices. There are now several pure broad corporate bond ETFs, such as those on iBoxx liquid indices or on the Goldman Sachs $InvesTop corporate index (designed to be easily replicated). In addition, there are some high-yield corporate bond index ETFs, such as those based on iBoxx indices or on Barclays Capital indices. There is likewise a variety of other bond ETFs based on broader aggregates, a sizeable share of which, such as credit index ETFs or broad aggregate index ETFs, captures corporate bonds.
Although there have long been bond futures for government bonds and government bond indices, there is no future on a pure corporate bond index. The only product similar to a corporate bond future is the CME Lehman Brothers US Aggregate Index Future. This index, however, does include all kinds of US bonds, including government debt.
We turn now to the challenges posed by bond indices to both providers and investors.
2.2. Challenges Posed by Corporate Bond Indices 2.2.1. Providers’ Perspective Designing, computing, and maintaining corporate bond indices is far more complex than doing the same for a stock market index. For instance, while a firm has usually one listed stock on an exchange, it often has many bonds outstanding, with different characteristics, such as maturity, coupon rate, and currency. In fact, there are many more corporate bonds on the markets than there are shares listed on stock markets.
Index ClassificationAs Reilly and Wright (1996) point out, the universe of corporate bonds is much more diversified than that of corporate stocks. As a result of this great diversity, it is harder to sort corporate bonds into clearly defined segments than it is to set up criteria for stock indices. So many corporate bond index providers offer—indeed, must offer—a huge variety of sub-indices that must be meaningfully aggregated to more general and broader indices.2
Bond UniverseThe available set of securities in the corporate bond market changes constantly. First, bonds have a fixed maturity such that after a certain time they exit the market and are presumably replaced by new (and sometimes totally different) issues. If an index includes callable bonds, the amount outstanding can also change drastically over time (even when no bond matures), complicating the calculation of capitalisation-weighted indices (Reilly et al. 1992).
A provider of corporate bond indices must also decide which issues to include in the index. This decision is formed by the following criteria:• Bond types: the corporate bond universe is highly heterogeneous, in such a way that an index provider must specify the types of bonds (convertible, callable, floating, irredeemable, strips, and so on.) to be included. For some types, it makes sense to provide a sub-index in addition to a general corporate bond aggregate. A good survey is included in Brown (2002).• Time-to-maturity: bonds of less than one year to maturity are, in general, excluded from corporate bond indices. Sub-indices by time-to-matutity are very common.
2. Overview of Corporate Bond Indices
2 - The Barclays bond index family contains more than 10,000 different sub-indices (including government bond indices).

15An EDHEC-Risk Institute Publication
A Review of Corporate Bond Indices: Construction Principles, Return Heterogeneity, and Fluctuations in Risk Exposures — June 2011
• Rating: in terms of credit rating, two distinct indices are usually created, one covering investment-grade bonds and another for junk bonds (often called high-yield bonds). This study focuses on investment-grade bond indices.• Market: the corporate bond market must be specified, i.e., whether the index includes corporate bonds from only one capital market (such as the United States), from several markets, or from several industry segments. • Minimum requirements: many index providers have minimum requirements that must be met. These requirements usually have to do with the size of the issue and its liquidity.• Total number of bonds: some indices set the total number of bonds to be included, similar to the EuroStoxx50 index for stocks, for example. Others do not.• Treatment of defaulted securities: some indices may exclude defaulted bonds, whereas others may not.3
Many index providers form sub-indices based on these characteristics. There are global indices, national indices, and industry indices, as well as indices for different bond ratings, maturities, and so on.
Bond PricingA third crucial issue is the price data used to calculate the index returns. Reilly et al. (1992), for instance, attribute substantial short-term deviations in bond index returns to the different pricing sources of corporate bonds.4 Corporate bonds, especially those with longer maturities, usually trade in a highly illiquid market, with no continuous observable transaction prices. Moreover, corporate bond index providers have to find a reliable price source to calculate
index returns. There are several ways of dealing with this problem; each of these ways, which we turn to now, has its pros and cons. • Transaction pricing: it is possible, in theory, to design corporate indices based on transaction prices. Although transaction prices in the corporate bond market are usually very opaque, the introduction of the TRACE system in the US (trade reporting and compliance engine) has increased the transparency of actual trades.5 The TRACE system makes it possible to obtain data about transaction prices ex post, so it is possible to construct bond indices based on these prices. Again, for rarely traded securities there will be significant periods during which no prices are available. The NASD-Bloomberg Active Investment Grade US Corporate Bond Index is based on these transaction prices. • Matrix pricing: in this approach bond pricing models are used to calculate the theoretical prices of corporate bonds. The parameters needed to estimate the prices are obtained from comparable bonds with similar features (such as time-to-maturity, industry sector, rating, etc.) for which prices are available from a different source. Although this top-down approach makes it possible to price virtually all bonds, it is inaccurate, as idiosyncratic risk components cannot be captured in the model prices. Moreover, there is no consensus on the best model (so there is a “model risk”) and this pricing method can be different for each index provider. Last, regardless of the model, it will always be a challenge to translate illiquidity into the price. • Dealer pricing: another approach is to obtain data from dealers that are continuously providing bid and ask prices for all kinds of bonds in the OTC market.
2. Overview of Corporate Bond Indices
3 - The WorldCom example in 2002 is insightful: indices that remove defaulted bonds (Merrill Lynch and Barclays, for example) have underperformed indices that do not (Credit Suisse and JP Morgan) just because WorldCom bonds somewhat recovered afterwards and the former indices captured only the losses, not the recovery.4 - They work with Lehman Brothers, Merrill Lynch, and Salomon Brothers corporate bond indices and find high correlation (0.992 or higher). Furthermore, in the long-run, they yielded very similar returns. However, over the short term, the indices deviated substantially from each other.5 - TRACE was introduced in July 2002 to increase price transparency in the US corporate bond market. Registered brokers and dealers are required to report all corporate bond transactions within fifteen minutes of execution. This information is then immediately made available to the public.
16 An EDHEC-Risk Institute Publication
A Review of Corporate Bond Indices: Construction Principles, Return Heterogeneity, and Fluctuations in Risk Exposures — June 2011
These prices can either be estimates provided by the dealers or reflect their last transaction price. Since not every dealer trades all types of corporate bonds, index providers usually collect price data from many different dealers or investment banks. To some degree, this procedure averages out possible data errors. For rarely traded bonds, however, the prices are likely to be unreliable, as different dealers can provide very different prices. Moreover, the more illiquid the bond is, the farther away from the price a real-time investor would get the quoted price will be (usually the midpoint in the bid-ask spread). Most corporate bond prices are based on dealer prices.
One flaw of current bond indices is that many of them were built by banks, making use of proprietary pricing methods (sometimes unavailable to investors), which means that the same index, if measured by another institution, would perhaps have a different valuation. So, from an investor’s perspective, it would be important to have, all else being equal, an independent index. Such an index would have a more robust pricing scheme, since it would not rely on only a few sources (sometimes even on a single source).
Index Weighting SchemeOne of the most important issues with corporate bond indices is the optimal weighting scheme of the individual bonds. Although it is essentially an index-design question, we deal with it separately, in section 2.3 and in the appendix, in view of its theoretical and practical importance.
Reinvestment AssumptionsAlso important is the reinvestment assumption (Reilly and Wright 1996).
Are interim cash flows reinvested? If so, how? Some indices assume that they are immediately reinvested in the bond that generated them; others that they are reinvested in short-term government bonds; finally, still others assume no reinvestment at all until the next rebalancing date.
2.2.2. Investors’ PerspectiveAs they create challenges for providers, corporate bond indices create challenges for investors. The four main ones are choosing a suitable index, the duration problem, changing index characteristics, and the so-called bums problem.
Choosing a Suitable IndexIn general, equity investments are, in one way or another, performance generators for the total portfolio. For this reason, general market exposure, as captured by a broad stock market index, is not an altogether poor allocation decision. Unlike investment in equities, investment in bonds is often deemed the least risky part of the portfolio. This is one of the reasons corporate bond investments are often used either to protect funds from declining in value or to hedge future liabilities. Because of these individual objectives, bond investors’ goals differ tremendously; the one-size-fits-all approach of equity indices is unsuitable for corporate bond indices. Take, for instance, an asset/liability manager seeking to fund a constant ten-year bullet liability: a bond index with five years of duration or even the short-term risk-free rate would be quite risky! Put differently, corporate bond performance benchmarks must be selected carefully. Here, risk should be defined not as portfolio variability but as the likelihood of the investor’s meeting his objective: one investor’s excessive risk is risk-free to
2. Overview of Corporate Bond Indices
17An EDHEC-Risk Institute Publication
A Review of Corporate Bond Indices: Construction Principles, Return Heterogeneity, and Fluctuations in Risk Exposures — June 2011
another. In short, a typical broad index is unlikely to be the optimal benchmark for any investor, and even if it were it “would be only by chance”, as Brown (2002, 7) puts it. Duration ProblemThe conflict of interest between issuers and investors on the duration of corporate bonds is known as the duration problem (Siegel 2003). The duration structure of outstanding bonds reflects the issuers’ preference for minimising their cost of capital. There is no reason, in principle, for this minimisation to align with the interests of investors, who are usually trying to maximise their returns. In brief, many corporate bond indices will not be adequate benchmarks for corporate bond investors.6
The duration mismatch, of great concern to investors because it measures interest risk exposure, is part of the suitability problem mentioned above, but, in view of its importance, it is looked at separately. The same arguments could be therefore made yet again: different investors will need different portfolios, hence different indices.
Changing Index CharacteristicsFor the index provider, frequent changes in the investment universe are, as mentioned above, a mere data problem, but for bond investors they pose deeper conceptual problems. Each change of bond in an index also affects the composition of the corporate index universe and its overall characteristics. Newly issued bonds, for example, are likely to differ from older outstanding debt, such that the characteristics of the index will change overnight.
In addition to changes in the index composition, it is important to keep in mind
that the maturity effect of bonds changes the characteristics of bond indices. Even if the bonds in an index and their relative weights remain unchanged, its average duration will decrease over time.
Taken together, it is not only the corporate bond universe that is changing but also the constituent bonds themselves: Brenning (2006) calls bond indices moving targets. So, even if a corporate bond index is a suitable benchmark at one specific point in time, it is unlikely to be at another.7
Bums ProblemThe so-called bums problem (Siegel 2003) is the result of the large share of the total debt market accounted for by issuers with large amounts of outstanding debt—issuers whose creditworthiness and total debt volume are usually negatively correlated. Value-weighted corporate bond indices (such as market performance indices) thus tend to overweight rather risky assets, which are more likely to be downgraded or even to default and may lead to worse performance.8 Most importantly, the investor must be aware of this exposure; there is no guarantee that it is in his best interest. The bums problem is not limited to individual issues; if a specific segment or market is adversely affected it can also occur segment- or even country-wide. In such cases, broad or international bond indices weighted by market capitalisation tend to be overinvested in low-grade bonds of the respective segment or country.
In the European telecom sector, for example, refinancing the extremely high costs of UMTS9 licenses with corporate bonds meant that, around the year 2000, telecom issues accounted for a much larger share
2. Overview of Corporate Bond Indices
6 - Siegel (2003) says the duration of an index is a “historical accident”. Duration is a measure of bonds’ risk exposure to interest rate changes, as beta is a stock’s risk exposure to market movements. Although the beta of the market is always 1, there is no “neutral” duration of the corporate bond market. Siegel (2003) concludes that the choice of duration is an active asset allocation decision that should not be left to the index.7 - Lloyd and Manium (2004, 777) call this phenomenon “duration drift”. 8 - Default risk is usually compensated for by higher expected returns. 9 - Universal mobile telecommunications system (UMTS) is one of the third-generation (3G) mobile telecommunications technologies.
18 An EDHEC-Risk Institute Publication
A Review of Corporate Bond Indices: Construction Principles, Return Heterogeneity, and Fluctuations in Risk Exposures — June 2011
of the entire corporate bond market than before, even though the creditworthiness of telecom companies was falling (Lloyd and Manium 2004).10 Alternative weighting schemes (as discussed below) can provide a solution to this problem.
2.3. The Standard Value-Weighting Scheme for Corporate Bond IndicesThe controversy focuses on whether corporate bond indices should be weighted (similar to many equity indices) by market debt or whether an alternative weighting scheme should be used. Most, but not all, indices are value-weighted: a prominent counter-example is the Dow Jones corporate bond index, in which all issues are weighted equally. Although most corporate bond indices are either one of these two types, some alternative schemes have been developed (see appendix for an overview of these alternatives). Most indices—including corporate bond indices—have historically been weighted by the market value of their outstanding securities. Why did value-weighted bond indices become so popular? One reason is that they do indeed represent the market, as no other weighting scheme will permit a uniform portfolio held jointly by all investors. Another good reason has to do with the passive investing strategy enabled by the scheme: once you have bought the securities at market-value proportions, the weights will evolve over time, automatically adjusting, so the investor will not need to update the portfolio weights (unless a bond is retired or a new one issued). There are also, however, numerous arguments against the value-weighting
scheme. If, for instance, the market fails to price the bonds correctly, the value-weighting scheme will always go against investors: a value-weighted strategy will be concentrated on the overpriced assets and these investors will fail to profit from these mistaken prices and be hit with losses when the prices are revised. If a security is underpriced, these investors will fail to perform as they should, because they are underweighted on it. Moreover, by definition, the market-value indices are a zero-sum game: if one investor beats the market, another will have to have been beaten.
In fact, there are nearly as many reasons for market-value-weighted indices as there are against them. We begin with some of the reasons for them.
2.3.1. Pros Market Performance MeasurementIf the purpose of an index is to reflect overall market movements, value weighting is the only possible weighting scheme, as Brown (2002) notes. No other weighting scheme, by definition, fully captures market performance.
Macro-consistencySiegel et al. (2003) stress that the value-weighted scheme is the only one that allows all investors to hold the same portfolio. So, if there were a single optimal corporate portfolio, it would have to be a value-weighted portfolio that left out not a single corporate bond. In other words, value weighting is consistent with the equilibrium approach; i.e., it allows a market equilibrium when all investors use this strategy. Other weighting schemes, to respect equilibrium, would have to take
2. Overview of Corporate Bond Indices
10 - The most prominent example of the bums problem was given by the emerging bond market in 2000. Just before the default, Argentine bonds accounted for more than 14.5% of the Merrill Lynch USD Emerging Market Sovereign and Credit Index composition. In 2005, after the debt swap, which led to severe losses for the creditors, Argentine bonds accounted for only 2.14% of the index (Bolognesi and Zuccheri 2008). On the other hand, overweighting some low-grade issuer can also be beneficial: In the early 1990s, Italy had large amounts of rather low-grade debt outstanding. Because of the convergence to the eurozone, these bonds subsequently offered high returns (decrease in interest rates) at rather low risk (Brown 2002). These two examples highlight the nature of the bums problem: it is a problem of somewhat unintentional high risk—not necessarily low returns.

19An EDHEC-Risk Institute Publication
A Review of Corporate Bond Indices: Construction Principles, Return Heterogeneity, and Fluctuations in Risk Exposures — June 2011
into consideration investor heterogeneity or assume the unlikely existence of investors foolish enough not to hold the efficient portfolio so those who do hold it can profit.
Buy-and-Hold StrategyClosely related to the previous point is that capitalisation weighting is the only scheme consistent with a buy-and-hold strategy. Unless the bond universe of the index changes (when there are new or retired bonds), there is no need to make portfolio adjustments over time: portfolio weights change accordingly.
BenchmarkSiegel (2003) stresses the benefits of value-weighted indices as benchmarks, since active management against such indices (if they are all-inclusive) is, by definition, a zero-sum game.
Economic FoundationFinally, there is a theoretical argument for value-weighted corporate bond indices. The capital asset pricing model (CAPM) of Sharpe (1964) and Lintner (1965) posits that the value-weighted portfolio of risky assets is mean-variance efficient in the sense of the Sharpe (1966) ratio. Put differently, the value-weighted portfolio is the one that maximises the expected return for a given degree of risk.
We now proceed to some disadvantages of value-weighted indices, disadvantages that are even greater for corporate bond indices than for equity indices.
2.3.2. Cons CalculationSince the amount of outstanding debt changes over time, and such changes are
not always made public, calculating the outstanding market value of debt can be difficult. Indices that contain callable bonds or issuers with sinking funds (funds set aside to reduce outstanding debt continuously) are particularly vulnerable to this problem.
Bums ProblemValue-weighted indices are prone to the so-called bums problem; that is, they are likely to weight low-quality bonds too heavily. As a consequence, their overall riskiness can change significantly over time—more than the investor initially expected. According to Siegel (2003), these changes might keep the index from being mean-variance efficient—and thus make it unlikely to provide a good risk-return tradeoff, let alone the best one.
Concentration InefficiencyValue-weighted bond indices are likely to suffer from the so-called concentration inefficiency known from equity indices. As reported by Amenc et al. (2010), concentration can push an index towards inefficiency, through unpriced risk factors.
Empirical Evidence against the CAPMThe CAPM was originally designed for equity markets, not for bonds. Nevertheless, transferring the CAPM to corporate bonds is straightforward (since the bonds are active components of the market and should have a place in the market portfolio). Following Roll’s critique (1977), empirical studies have shown that the CAPM does not hold. Especially for bonds, the evidence for the CAPM is extremely weak (Fama and French 1992). As a consequence, the market portfolio will provide an inefficient risk-return tradeoff. Moreover, as Siegel (2003) notes, there are some theoretical
2. Overview of Corporate Bond Indices
20 An EDHEC-Risk Institute Publication
A Review of Corporate Bond Indices: Construction Principles, Return Heterogeneity, and Fluctuations in Risk Exposures — June 2011
concerns: for corporate bonds to be real wealth, they must represent some sort of real wealth in the economy. Since some debt instruments (especially in structured debt), have offsetting claims, some of the wealth would be counted twice or three times, in which case corporate bonds would not be representative of real wealth.
2. Overview of Corporate Bond Indices

21An EDHEC-Risk Institute Publication
3. Empirical Analysis—US Study

22 An EDHEC-Risk Institute Publication
A Review of Corporate Bond Indices: Construction Principles, Return Heterogeneity, and Fluctuations in Risk Exposures — June 2011
Our analysis of current bond indices centres on risk-and-return profiles; we compare indices and look into the ways risk measures fluctuate over time. Comparing the indices will help investors understand the importance of the choice of index: if they all look the same, the choice of a specific index will be no big deal; if, by contrast, the indices have different profiles, investors will have to choose indices in keeping with their objectives. Examining the risk exposures of the indices over time is also important because, if the indices are unstable, investors will have to monitor them dynamically to keep their portfolios optimally invested.
3.1. The DataIn our look at the US corporate bond market, we choose to deal with investment-grade indices, that is, indices of bonds rated BBB or higher (S&P rating system). Government bonds and high-yield bonds, then, are not considered by the indices we work with. Our choice was based on rather known public indices with available and reliable data for a reasonable period of time. The analysis of the following indices is based on daily returns:11 • The Citigroup US Broad Investment Grade (USBIG) Corporate Bond Index• The Bank of America Merrill Lynch US Corporate Bond Index (Master)• The Barclays US Corporate & Investment Grade Index (formerly called The Lehman Brothers US Corporate & Investment Grade Index)• The Dow Jones Corporate Bond Index
All are designed to track the performance of US-dollar-denominated investment-grade corporate debt publicly issued in the
US domestic market. The data goes from 1 January 1997 to 31 December 2010 (adding up to 3,653 daily returns) and we obtain it from the Datastream database, except for the Dow Jones index, for which the data was obtained directly (and freely) from the website http://www.djindexes.com. For the risk-free rate of return, to calculate risk premia, we use the US Treasury Bill Second Market Three-Month Index (also obtained from Datastream).12
One important point is that a bond index usually has several returns (price returns, coupon returns, and others), but, for us, what really matters is the total return, i.e., the return an investor would really pocket should he sell the index at the end of that day. Indeed, the total return index is an accurate performance indicator since it accounts for both income (coupon payments) and capital growth. The components of daily total return are price changes, principal payments, coupon payments, and accrued interest.
For the sake of simplicity, we work with every weekday, with no correction for weekends (or bank holidays). Preliminary calculations show that the results are not affected at all by this simplification.
We now turn to the index construction methods. We begin with the sole equally weighted index of those we study, and by far the simplest one.
3.2. An Equal-Weighted Bond IndexThe objective of the Dow Jones Corporate Bond Index is to capture the return of very liquid investment-grade US corporate bonds. This index is equally weighted and
3. Empirical Analysis—US Study
11 - Other potential candidates would be the respective indices from J.P. Morgan and Credit Suisse families. We exclude these two indices here. The Credit Suisse Index is provided by Bloomberg (code LUCITOTR for the total return index) and has sub-indices by sector, by credit rating (AAA, AA, A, and BBB) and by maturity (1-4, 4-7, 7-10, and +10 years), with starting date on January 1999. The J.P. Morgan family of indices is provided on Bloomberg (code JGAGUSUS for the US broad aggregate index, for example) but requires a specific paid subscription.12 - All Datastream datatypes and codes are available upon request.

23An EDHEC-Risk Institute Publication
A Review of Corporate Bond Indices: Construction Principles, Return Heterogeneity, and Fluctuations in Risk Exposures — June 2011
it has a fixed number of ninety-six issues, including all maturities and sectors. Each sector (financial, utility, and industrial) must account for thirty-two of the ninety-six bonds. Moreover, each sector is divided into four distinct maturity-based classes (two, five, ten, and thirty years13), and each class must include eight different issues. A company may have up to four bonds in a given sector, as long as there is one in each maturity class. At the end of the previous month if a bond falls out of the specific cell maturity range, the bond is eligible to enter the lower maturity cell.
The Dow Jones index uses the dealer pricing method, obtaining prices from data vendors.14 The reinvestment police states that any interest income or principal repayments must be reinvested pro-rata over the entire bond portfolio when received. Therefore, the index has no idle or unused funds waiting until month end for reinvestment. There is no cash position over time.
To be eligible, a bond must be issued in US dollars and it must be registered with the SEC (144A15 and convertible bonds are not allowed). Moreover, a bond must retain its investment-grade rating to remain in the index. A minimum of 1.5 years to maturity is required, although the bond must have at least two years to maturity to enter the two-year maturity cell. Structured notes, bonds with embedded puts, and bonds with call provisions and sinking funds16 are excluded from the index universe. According to the Dow Jones rules, “make-whole17 bonds are included because they do not have scheduled call dates and the redemption feature is not interest rate driven”. Zero-coupon corporate bonds, on the other hand, are excluded.18
Furthermore, an issue of at least $300 million is required, a requirement meant to ward off common problems (illiquidity, difficulty of observation, and so on).
All corporate bonds that meet the requirements above are included in the selection universe. At the end of each month, then, eight bonds in each sector and maturity class enter the index. There is no modification of constituents over the month. New issues, credit rating updates, maturity class changes, and changes in outstanding amounts are taken into account on the rebalancing date.
One strength of Dow Jones index construction is that it makes use of only a few key large issues to build a portfolio meant to represent a market or a sector. The reasoning behind this fairly simple construction method is that institutional investors tend to concentrate on large-capitalisation issues; it is also impossible to buy the thousands of bonds normally included in a corporate bond index. Because there is no bond exchange, smaller issues often have pricing problems that could distort the risk/reward behaviour of an overall index. In practice, most money managers have small portfolios and concentrate on the highly liquid (larger and newer) issues. The Dow Jones index has the same strategy and its investability is one of its key features. However, we must highlight a drawback: the transaction costs to keep the portfolio equally weighted are expected to be higher than in value-weighted indices, and, practically speaking, managers do not rebalance their portfolios daily. So there is a tradeoff between following the (theoretical) index exactly and the rebalancing costs of this strategy.
3. Empirical Analysis—US Study
13 - To be considered a two-year bond, its term to maturity should be less than 3.5 years. To be in the five-year class, the bond should after no more than 7.5 years. For the ten-year class, the maximum accepted maturity is 17.5 years. To enter a maturity class, a bond’s remaining time to maturity must be at least six months longer than the minimum maturity horizon for that cell, that is, to enter the ten-year cell, the bond must have at least eight years to maturity.14 - These data vendors can also, for their part, use some proprietary pricing methods for illiquid bonds. However, the bonds on Dow Jones are supposed to be fairly liquid and hence do not need this alternative pricing scheme.15 - This SEC (Securities and Exchange Commission) rule basically allows companies to sell unregistered securities (which include bonds), provided they respect special conditions.16 - A special feature that allows the issuer to retire (part of) the debt making use of a fund created specifically for this purpose.17 - Make-whole bonds include a feature under which the issuer can pay the entire debt before the maturity date, provided the investors are compensated (“made-whole”).18 - According to the Guide to the Dow Jones Corporate Bond Index (June 2009), zero coupons “are excluded to avoid average statistics distortion”.

24 An EDHEC-Risk Institute Publication
A Review of Corporate Bond Indices: Construction Principles, Return Heterogeneity, and Fluctuations in Risk Exposures — June 2011
3.3. The Three Value-Weighted IndicesThe three value-weighted indices have in common more than just the criterion by which they are weighted. None limits the number of constituents, which makes this number variable: it hovers around 4,000 bonds for each of the three indices. To be eligible for each index, securities must have a term to final maturity of at least one remaining year, a stated coupon of fixed rate, and a minimum issue of $250 million. Securities issued under rule 144A with registration rights are included in the universe. More details on securities that are included or excluded from the universe selection of each index are provided in table 1. Minor differences in the index inclusion/exclusion rules ultimately make
the monthly number of constituents different.
Like the Dow Jones index, these indices are rebalanced at the end of the month but here all the issues meeting the required criteria enter the indices (there is no maximum number of constituents). If a bond no longer meets the criteria during the course of the month, it remains in the index until the next month-end and is then removed. Citigroup assumes that bond payments received during the month are fully reinvested in the money market until the next rebalancing date, whereas BofA Merrill Lynch and Barclays assume no reinvestment, that is, no interest earned until month-end. The indices from Citigroup, Barclays, and BofA
3. Empirical Analysis—US Study
19 - Information taken from: Dow Jones Corporate Bond Index Rulebook (June 2009), Citigroup Index Catalog (January 2010), BofA Merrill Lynch Global Bond Index Rules (February 2010) and Barclays US Corporate Index Factsheet (all available on the respective websites).
Table 1: Comparative table19 This table features the main characteristics of the four US indices we analyse in this paper. All the indices represent the investment-grade corporate US bond market.
Dow Jones Citigroup BofA Merrill Lynch Barclays
Inclusions Make-whole bonds 144A, bonds with redemption features like bullets, sinking funds*,
embedded puts, or calls, or even extendable
Original issue zero coupon bonds, "global" securities**, 144A and
pay-in-kind securities***, Callable perpetual
securities****
144A, fixed-rate bullet, puttable and callable
bonds****, sinking funds*, original issue
zero coupon, and fixed to floating rate
bonds****
Exclusions 144A, zero-coupon bonds, structured
notes***** and bonds with option features and
sinking funds*
Callable bonds with less than one year from issue
date
Defaulted securities Warrants (or any bond with equity
convertibility), private placements, floating-
rates issues and structured notes*****
Time-to-Maturity Minimum of 1.5 years Minimum of 1 year Minimum of 1 year Minimum of 1 year
Minimum Requirements
Minimum issue size of $300 million
Minimum issue size of $250 million
Minimum issue size of $250 million
Minimum issue size of $250 million
Number of Bonds Fixed(96 bonds)
Floating (4518 on Feb 2010)
Floating (4020 on 2009 end)
Floating (3387 on 2009 end)
Reinvestment Assumption
Full reinvestment in the index (no cash position)
Full reinvestment in the money market
No reinvestment (cash position until
month-end)
No reinvestment (cash position until
month-end)
Index Changes End of Month End of Month End of Month End of Month
* A special feature in the bond which allows the company to retire (part of) the debt making use of a specific fund ** Debt issued simultaneously in the eurobond (or another bond market) and US domestic bond markets. *** The interests are not paid in cash. Commonly, they are incorporated to the principal or paid as additional bonds. **** Provided they are at least one year from the first call/put date. ***** Hybrid security, normally a bond with embedded option features.

25An EDHEC-Risk Institute Publication
A Review of Corporate Bond Indices: Construction Principles, Return Heterogeneity, and Fluctuations in Risk Exposures — June 2011
Merrill Lynch use their own traders as their primary pricing source (dealer pricing), and proprietary pricing models (matrix pricing) for illiquid bonds.
3.4. Wrap up of the US indicesOf the four indices we have chosen, the Dow Jones is undoubtedly the most peculiar. Not only because it is equally weighted but also because it has a fixed and very limited number of issues: ninety-six. The other three indices are fairly similar to each other. Table 1 sums up the main features of the indices.
The next section, an empirical analysis, discusses the risk-return properties of the indices studied here.
3.5. Risk-Return Properties3.5.1. Summary Statistics We present here some descriptive statistics to examine the risk-return properties of
the indices introduced above. Table 2 shows the main statistical properties of the four indices. One can observe the outperformance of the equally weighted index (Dow Jones) and the similar results for the other three (value-weighted) indices. Reilly et al. (1992) have already pointed out that indices purporting to measure the same market sector resemble each other with respect to standard deviation and average annual return. This result remains true here if we compare the market-value indices (they did not use any equally weighted index in their study). Nevertheless, of the value-weighted indices, Barclays had the lowest return coupled with the highest risk (measured by the standard deviation). The Dow Jones index has a riskier pattern, as measured by its standard deviation, by its highest absolute minimum value, by its Values-at-Risk, and by its kurtosis. But it also has a superior Sharpe ratio.
We then looked again at the data, splitting the series into two parts. In the first part
3. Empirical Analysis—US Study
Table 2: Descriptive statistics for daily risk premiaStatistics for the daily risk premium series returns of each of the four US bond indices we analyse in this paper. The risk premium is the return in excess of the US three-month Treasury bill. Each series includes 3,653 returns from January 1997 to December 2010. All values are daily, except for the annualised mean, the annualised standard deviation, and the corresponding Sharpe ratio. The Value-at-Risk is the historical percentage above which 90/95% of the returns occurred.
Dow Jones Citigroup BofA Merrill Lynch Barclays
Mean 0.0161% 0.0139% 0.0134% 0.0132%
Standard Error 0.0060% 0.0056% 0.0054% 0.0055%
t Statistics 2.68 2.51 2.48 2.38
Median 0.0148% 0.0174% 0.0160% 0.0036%
StDev 0.3632% 0.3361% 0.3265% 0.3349%
Minimum -2.92% -2.45% -2.28% -2.07%
Maximum 2.18% 1.84% 1.99% 2.08%
Skewness -0.24 -0.28 -0.29 -0.18
Excess Kurtosis 3.62 3.20 2.33 2.53
Value-at-Risk (90%) -0.4045% -0.3832% -0.3692% -0.3734%
Value-at-Risk (95%) -0.5695% -0.5301% -0.5469% -0.5317%
Annualised Mean 4.2945% 3.7074% 3.5515% 3.5063%
Annualised StDev 5.8684% 5.4297% 5.2742% 5.4104%
Sharpe Ratio 0.73 0.68 0.67 0.65
26 An EDHEC-Risk Institute Publication
A Review of Corporate Bond Indices: Construction Principles, Return Heterogeneity, and Fluctuations in Risk Exposures — June 2011
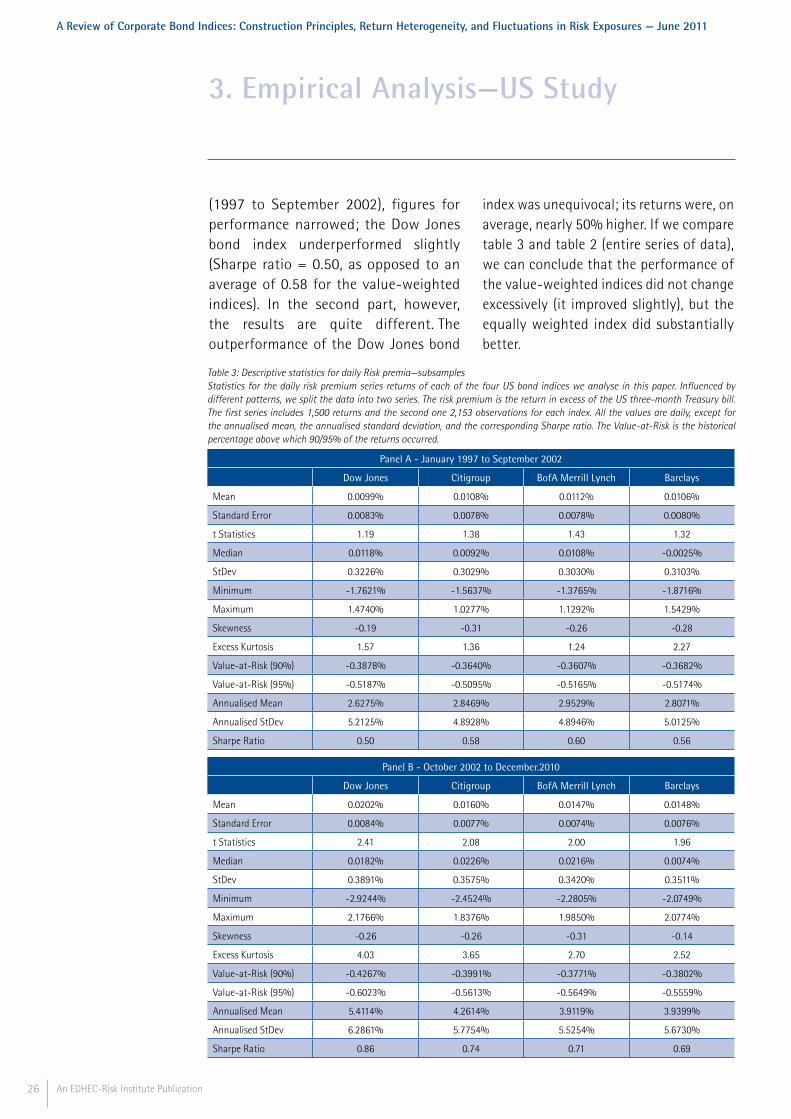
(1997 to September 2002), figures for performance narrowed; the Dow Jones bond index underperformed slightly (Sharpe ratio = 0.50, as opposed to an average of 0.58 for the value-weighted indices). In the second part, however, the results are quite different. The outperformance of the Dow Jones bond
index was unequivocal; its returns were, on average, nearly 50% higher. If we compare table 3 and table 2 (entire series of data), we can conclude that the performance of the value-weighted indices did not change excessively (it improved slightly), but the equally weighted index did substantially better.
3. Empirical Analysis—US Study
Table 3: Descriptive statistics for daily Risk premia—subsamplesStatistics for the daily risk premium series returns of each of the four US bond indices we analyse in this paper. Influenced by different patterns, we split the data into two series. The risk premium is the return in excess of the US three-month Treasury bill. The first series includes 1,500 returns and the second one 2,153 observations for each index. All the values are daily, except for the annualised mean, the annualised standard deviation, and the corresponding Sharpe ratio. The Value-at-Risk is the historical percentage above which 90/95% of the returns occurred.
Panel A - January 1997 to September 2002
Dow Jones Citigroup BofA Merrill Lynch Barclays
Mean 0.0099% 0.0108% 0.0112% 0.0106%
Standard Error 0.0083% 0.0078% 0.0078% 0.0080%
t Statistics 1.19 1.38 1.43 1.32
Median 0.0118% 0.0092% 0.0108% -0.0025%
StDev 0.3226% 0.3029% 0.3030% 0.3103%
Minimum -1.7621% -1.5637% -1.3765% -1.8716%
Maximum 1.4740% 1.0277% 1.1292% 1.5429%
Skewness -0.19 -0.31 -0.26 -0.28
Excess Kurtosis 1.57 1.36 1.24 2.27
Value-at-Risk (90%) -0.3878% -0.3640% -0.3607% -0.3682%
Value-at-Risk (95%) -0.5187% -0.5095% -0.5165% -0.5174%
Annualised Mean 2.6275% 2.8469% 2.9529% 2.8071%
Annualised StDev 5.2125% 4.8928% 4.8946% 5.0125%
Sharpe Ratio 0.50 0.58 0.60 0.56
Panel B - October 2002 to December.2010
Dow Jones Citigroup BofA Merrill Lynch Barclays
Mean 0.0202% 0.0160% 0.0147% 0.0148%
Standard Error 0.0084% 0.0077% 0.0074% 0.0076%
t Statistics 2.41 2.08 2.00 1.96
Median 0.0182% 0.0226% 0.0216% 0.0074%
StDev 0.3891% 0.3575% 0.3420% 0.3511%
Minimum -2.9244% -2.4524% -2.2805% -2.0749%
Maximum 2.1766% 1.8376% 1.9850% 2.0774%
Skewness -0.26 -0.26 -0.31 -0.14
Excess Kurtosis 4.03 3.65 2.70 2.52
Value-at-Risk (90%) -0.4267% -0.3991% -0.3771% -0.3802%
Value-at-Risk (95%) -0.6023% -0.5613% -0.5649% -0.5559%
Annualised Mean 5.4114% 4.2614% 3.9119% 3.9399%
Annualised StDev 6.2861% 5.7754% 5.5254% 5.6730%
Sharpe Ratio 0.86 0.74 0.71 0.69

27An EDHEC-Risk Institute Publication
A Review of Corporate Bond Indices: Construction Principles, Return Heterogeneity, and Fluctuations in Risk Exposures — June 2011
In general, our results confirm the assertion of Gatfaoui (2009), who argues that daily total returns of corporate (investment-grade) bond indices exhibit a non-normal probability distribution since they are asymmetric (negatively left-skewed historical distribution) and have fatter tails (positive excess kurtosis).
Figure 1 plots the way a passive investment would evolve over the time period analysed here; it also compares the performance of the indices and the risk-free rate of return.
3.5.2. Analysis of Heterogeneity The statistical measures shown in table 2 are not enough if an investor wants to fully analyse whether the indices have similar risk-return patterns. The figures shown above are long-term averages that provide no information on, for instance, potential daily heterogeneity among the indices and may thus hide some discrepancies. Our aim, in short, is to determine how likely it is that the four indices will post similar returns tomorrow.
To help answer this question, this sub-section provides measures that evaluate the similarity of the daily returns. We use the full sample and calculate the comparison measures, based on their daily returns, for all possible pairs of indices. The first measure is the standard correlation, also called the Pearson correlation. The second is annualised tracking error, i.e., the standard deviation of the difference in daily returns of any two given indices in annual terms. The third is based on what we call the maxdiff time-series: we construct a daily time-series of the greatest return difference we find and then calculate the annualised mean and standard deviation.
The larger the maxdiff mean and standard deviation, the more heterogeneous the set of indices considered. We compare these figures with the equivalent measures calculated for a parallel set of four US government indices: the Datastream, Barclays, BofA Merrill Lynch, and Citigroup indices (all data from Datastream). The
3. Empirical Analysis—US Study
Figure 1: Investment performanceInvestment path of $100 invested in January 1997 at the risk-free rate of return and in each of the four indices.

28 An EDHEC-Risk Institute Publication
A Review of Corporate Bond Indices: Construction Principles, Return Heterogeneity, and Fluctuations in Risk Exposures — June 2011
time period is the same as that for the US corporate bond indices.
As panel A of table 4 shows, all figures for correlation fall between 0.90 and 0.95, making for correlation lower than that of the US government bond indices (0.99 for all pairs).
The tracking error analysis20 measures how well each index tracks another. If the indices track each other closely, the problem of choosing the right index vanishes. If there are discrepancies, however, the selection of a particular index is an important decision. By daily returns, the figures for the corporate bond indices (approximately 2%) are far higher than those for their counterparts on the government bond market (roughly 0.7% on average). It is remarkable that the Dow Jones index, despite its limited sample of bonds and particular weighting scheme, and the value-weighted indices are still
highly correlated (more than 0.90); nor is its tracking error particularly high.
The results for the maxdiff analysis are shown in panel C of table 4. They show that there are substantial differences between the corporate bond and the government bond indices. On 31 August 1998, for instance, the Dow Jones bond index returned 0.34%, whereas Barclays posted a -1.83% loss. The index itself—and not just its weighting scheme—seems to be an important issue in the corporate bond asset class.
3.6. Analysis of the Stability of Risk ExposuresWe also look at such other index characteristics as yield to maturity, duration, and term to maturity, which are mathematically averaged values coming
3. Empirical Analysis—US Study
20 - We do the tracking error analysis for every possible pair of indices.
Table 4: Comparisons of the indicesIn panel A, we present the Pearson correlation coefficients for the indices for the whole series data. In panel B, we present the annualised tracking error between each pair of indices, which is the standard deviation of the difference between the index returns. In panel C, we show the results of the maxdiff analysis: the lower the figures are, the more similar the indices are. We also show, for comparison, the parallel results for the US government bond market, for which we chose Datastream, Barclays, BofA Merrill Lynch, and Citigroup indices. All computations use daily returns (3,653 observations).
Panel A - Correlation Coefficients of Daily Risk Premia
Dow Jones Citigroup BofA Merrill Lynch Barclays
Dow Jones 1.0000 0.9027 0.9440 0.9164
Citigroup - 1.0000 0.9258 0.9051
BofA Merrill Lynch - - 1.0000 0.9498
Barclays - - - 1.0000
Panel B - Annualised Tracking Error Based on Daily Returns
Benchmark Dow Jones Citigroup BofA Merrill Lynch Barclays
Dow Jones - 2.5285% 1.9541% 2.3490%
Citigroup - - 2.0667% 2.3617%
BofA Merrill Lynch - - - 1.6985%
Panel C - MaxDiff Analysis: US Corporate x US Government
Annualised Mean 42.31% x 12.92%
Annualised Std Dev 2.62% x 0.81%
Maximum MaxDiff 2.17% x 1.15%

29An EDHEC-Risk Institute Publication
A Review of Corporate Bond Indices: Construction Principles, Return Heterogeneity, and Fluctuations in Risk Exposures — June 2011
from the constituents.21 These are index measures closely related to the risk the indices are exposed to. Yield to maturity is the average index yield investors
can expect over the future; the more it fluctuates, the greater uncertainty is. Term to maturity serves as an average turnover measure: the shorter it is, the more changes
3. Empirical Analysis—US Study
21 - Another interesting idea left for future research would be an analysis of sector stability.
Table 5: Comparison of the indices' key characteristicsWe present means, standard deviations, minima, and maxima of duration (in years), yield to maturity (yearly rate), and terms to maturity (in years). The duration measure follows Macaulay’s definition. The sample period is from January 1997 to December 2010.
Duration Dow Jones Citigroup BofA Merrill Lynch Barclays
Mean 6.33 6.00 5.87 6.06
Std Dev 0.31 0.28 0.25 0.26
Minimum 5.69 5.40 5.40 5.50
Maximum 7.68 6.67 6.56 6.67
YTM Dow Jones Citigroup BofA Merrill Lynch Barclays
Mean 5.90 5.99 6.02 5.98
Std Dev 1.06 1.14 1.14 1.14
Minimum 3.31 3.33 3.65 3.59
Maximum 8.87 9.10 9.13 9.05
Term to Maturity Dow Jones Citigroup BofA Merrill Lynch Barclays
Mean 11.23 10.54 9.86 10.79
Std Dev 0.57 1.04 0.60 1.16
Minimum 10.49 9.17 9.05 9.46
Maximum 12.99 12.79 12.67 13.31
Figure 2: Time-series evolution of index characteristicsWe plot the average duration, yield to maturity, and terms to maturity for the indices. The sample period is from January 1997 to December 2010.

30 An EDHEC-Risk Institute Publication
A Review of Corporate Bond Indices: Construction Principles, Return Heterogeneity, and Fluctuations in Risk Exposures — June 2011
(because of bond retirement) we expect the index to undergo. Duration is the sensitivity to interest rate changes: the longer it is, the more volatile the index will be in the event of interest rate changes. Descriptive statistics are shown in table 5.
To conclude this section, we attempt to observe the exposure of the indices to credit risk. We limit our analysis to three indices: Citigroup, Barclays, and BofA Merrill Lynch.22 Our data comes from the period from August 2000 to December 2010. First, we observe how the weights of each credit category (AAA, AA, A, and BBB) evolve. We can also see that the indices have similar patterns. The A and BBB bonds dominate the indices with roughly 80% (on average) of the capitalisation. The best quality bonds (AAA) ended 2010 accounting for roughly 1% of total capitalisation in all indices.
This result is clearly a consequence of the scarcity of the highest quality bonds and an example of the bums problem mentioned above.
We then observe how the average credit risk of the indices fluctuates. In other words, we attempt to put the index as a whole into one of the classifications (AAA, AA, A, and BBB) of the constituent bonds. To do so, we must quantify each credit category. We take the approach taken by Ferreira and Gama (2007),23 who map the ratings into numerical measures with a linear transformation on a scale from zero (the lowest rating, D) to twenty (the highest rating, AAA). Table 6 shows this quantification for the investment-grade rating sub-classes.
3. Empirical Analysis—US Study
22 - In fact, the Dow Jones bond index is subdivided by maturity and by sector. The credit classification does not play a role in the construction of the index, which means no data is available.
Figure 3: Credit risk exposureWe separate the bonds that constitute each index into risk classes (Standard & Poor’s) and plot the time evolution of the weights of the risk classes (market cap). The indices are concentrated on classes A and BBB. Data comes from August 2000 to December 2010. We had no access to this data for the Dow Jones index.

31An EDHEC-Risk Institute Publication
A Review of Corporate Bond Indices: Construction Principles, Return Heterogeneity, and Fluctuations in Risk Exposures — June 2011
Table 6: Rating quantifiersWe follow Ferreira and Gama (2007).
AAA 20
AA1 19
AA2 18
AA3 17
A1 16
A2 15
A3 14
BBB1 13
BBB2 12
BBB3 11
We are now able to compute the average credit risk exposure, which is basically the cap-weighted average of the values for the class. Figure 4 presents the results.
The indices have an average classification between the classes A3 and A2. As the indices are concentrated on the A and BBB rating categories, these results are not surprising.
3. Empirical Analysis—US Study
Figure 4: Average credit risk exposureWe plot the time evolution of the average index rating for Citigroup, Barclays, and Merrill Lynch indices. We calculate the (market cap) average index rating using the linear quantifying approach stated in table 6, in the spirit of Ferreira and Gama (2007). The higher the average index credit rating, the lower the credit risk exposure. Data comes from August 2000 to December 2010. We had no access to this data for the Dow Jones index.

32 An EDHEC-Risk Institute Publication
A Review of Corporate Bond Indices: Construction Principles, Return Heterogeneity, and Fluctuations in Risk Exposures — June 2011
3. Empirical Analysis—US Study

33An EDHEC-Risk Institute Publication
4. Empirical Analysis—Eurozone Study
34 An EDHEC-Risk Institute Publication
A Review of Corporate Bond Indices: Construction Principles, Return Heterogeneity, and Fluctuations in Risk Exposures — June 2011
Like that of our analysis of the US market, the objective of our study of the euro-denominated bond indices is centred on risk-and-return profiles, indices comparison and risk measures analysis. Comparing the indices will help investors understand the importance of choosing the right index, and examining risk exposures over time will be important to analyse their instability: indices with unstable risk exposures will force investors to take into account this instability when deciding their optimal portfolios.
4.1. The DataIn the euro-denominated corporate bond market, to which we now turn our attention, the issuer’s domicile may or may not be relevant, depending on the particular index. As in our analysis of US bonds, we look exclusively at investment-grade indices.
We analyse daily returns: our data comes from the period from January 1999 to December 2010 and includes 3,130 daily observations. We obtain the data from the Datastream database and choose the following indices:• The iBoxx Euro Corporate Index (investment grade)• The iBoxx Liquid Euro Corporate Index (investment grade)• The Citigroup Euro Broad Investment Grade Corporate Bond Index• The Bank of America Merrill Lynch EMU Corporate Bond Index (investment grade)
In the rest of this analysis, we refer to these indices as the iBoxx index, the iBoxx Liquid index,24 the Citigroup index and the BofA Merrill Lynch index.
Because we analyse excess returns instead of the returns themselves, we use the euro interbank offered rate three-month (obtained from the Datastream database under the instrument code EIBOR3M)25 as a proxy for the risk-free rate of return. Again, for the same obvious reasons, what really matters to us is the total return, i.e., the return an investor would really pocket should he or she sell the index at the end of that day.
For the sake of simplicity, we go on working with no correction for weekends or holidays. Preliminary calculations show that the results are unaffected by this simplification.
4.2. The Indices All of the indices studied in this research are weighted by the amount outstanding of each constituent bond. The indices are also made up of investment-grade bonds: BBB- or above (for S&P and Fitch) and Baa3 or above in Moody’s rating system. All are designed to track the performance of euro-denominated investment-grade corporate debt.The domicile of the issuer may be relevant (the BofA Merrill Lynch index, for example, includes only bonds from EMU participating countries, whereas iBoxx indices do not have this kind of restriction). Only the iBoxx Liquid index caps the number of bonds (at forty, though it may be less). The other indices have no such cap (table 1 shows the number of bonds in each index as of December 2010). To be eligible for each index, securities must have a remaining term to final maturity of at least one year (with the exception of the iBoxx Liquid index, whose minimum term to maturity
4. Empirical Analysis—Eurozone Study
24 - When we use the expression iBoxx indices we are referring to both iBoxx indices analysed in the study.25 - All Datastream instrument codes used in this research are available upon request.

35An EDHEC-Risk Institute Publication
A Review of Corporate Bond Indices: Construction Principles, Return Heterogeneity, and Fluctuations in Risk Exposures — June 2011
is 1.5 years), a stated coupon of fixed rate (step-ups are allowed in most cases), and a minimum issue size. We provide more detail on special featured securities that are included or excluded from the selection universe of each index in table 7 (see below).
With the exception of the iBoxx Liquid index, which is rebalanced every quarter, the indices are rebalanced at the end of every month. If a bond no longer meets the criteria during the course of the month (if, for example, it has defaulted), it remains in the index until the next
rebalancing date and is then removed. The indices have different reinvestment policies: the Citigroup index assumes that bond payments received over the month are fully reinvested in the money market until the next rebalancing date, whereas iBoxx indices assume no reinvestments during the current month—that is, that cash positions are held until month-end (when the cash is then reinvested in the index, for the iBoxx index, or, for the Liquid index, in the money market until the next quarterly rebalancing date). The BofA Merrill Lynch index assumes full reinvestment in the index. Citigroup and
4. Empirical Analysis—Eurozone Study
iBoxx iBoxx Liquid Citigroup BofA Merrill Lynch
Inclusions Fixed-coupon bonds, step-ups, rating-driven bonds, and other bonds with known cash flows
Bullet fixed-coupon bonds, rating-driven
bonds, and bonds with known cash flows (e.g.,
step-ups)
Bonds with redemption features like bullets,
sinking funds, embedded puts or calls, or even
extendable. Unseasoned bonds are also included
Only bonds from corporations domiciled in EMU participating countries. Only fixed coupons (including
step-ups). Zero coupons, corporate pay-in-kind securities, and toggle
notes are eligible
Exclusions Sinking funds and amortising bonds.
Floating rate notes and other fixed-to-floater
bonds
Sinking funds and amortising bonds. Zero-coupon bonds, callable, and perpetual debt are
excluded
Defaulted securities Convertible securities. Bills, inflation-linked, and strips. Defaulted
securities
Time-to-Maturity Minimum of 1 year Minimum of 1,5 year
Minimum of 1 year Minimum of 1 year
Minimum Requirements
Minimum issue of €500 million
Minimum amount outstanding of €750 million
Minimum amount outstanding of €500 million
Minimum amount outstanding of €250 million
Number of Bonds Floating (1,276 on Dec 2010)
40 Maximum (40 on Dec 2010)
Floating (1,137 on Dec 2010)
Floating (1,790 on Dec 2010)
Reinvestment Assumption
Intra-month money is held as cash until the
next rebalancing
Intra-month money is held as cash until the end of month, when it
is invested in the money market until the next
rebalancing date
Full reinvestment in the money market
Full reinvestment in the index
Treatment of Defaults
Defaulted bonds are excluded
Defaulted bonds are excluded
Defaulted bonds are excluded
Defaulted bonds are excluded
Index Rebalancing
End of Month Quarterly (end of February, May, August,
and November)
End of Month End of Month
Table 7: Comparative tableThis table features the main characteristics of the indices we analyse in this paper. All indices represent the investment-grade corporate euro bond market.
36 An EDHEC-Risk Institute Publication
A Review of Corporate Bond Indices: Construction Principles, Return Heterogeneity, and Fluctuations in Risk Exposures — June 2011
BofA Merrill Lynch indices use their own traders (dealer pricing) as their primary pricing source, and proprietary pricing models for illiquid bonds. iBoxx indices gather prices from external sources, which, for their part, mainly use their own dealers’ prices or, in the absence of same, a matrix pricing model. The iBoxx Liquid index, supposed to deal with liquid bonds only, benefits from the transaction pricing method, using daily closing prices. All four indices remove defaulted bonds at the following rebalancing date.
Clearly, the iBoxx Liquid index is, by design, somewhat different from the others. The objective of the iBoxx Liquid index is not only to capture the return of very liquid investment-grade euro-denominated corporate bonds but also to be easily investable. Initially, all of its bond candidates are in the iBoxx index universe. The latter index, is somewhat difficult (or at least costly) to replicate. Moreover, many of the constituent bonds are illiquid and have large bid-ask spreads. The iBoxx Liquid index is designed to address those problems, not only by capping the number of bonds at forty but also by excluding special bond types. Unlike the other indices, rebalanced monthly, it is rebalanced every quarter. Everything is done to make this index fully investable and keep it representative of its market segment.
4.3. Risk-Return Properties4.3.1. Summary Statistics Table 8 presents the main statistical properties of the four indices. The Citigroup index outperforms the others: this outperformance, in terms of both
excess returns and Sharpe ratio can be explained, at least partly, by its unique reinvestment policy. Moreover, as figure 5 shows, it is the performance in 2007 and 2008 (the reasons for which are not entirely clear) that makes for its overall outperformance.
The iBoxx Liquid index also posts results similar to those of its counterpart iBoxx index, which is good news for investors, as it suggests that a broad market index of more than thousand bonds can be replicated, at little or no cost, with no more than forty extremely liquid bonds. This feature, already observed in the literature (Reilly et al. 1992), is especially important in the bond market, given its lower liquidity, larger number of assets, and so on.
Generally speaking, our results, as in our study of the US bond indices, confirm Gatfaoui’s (2009) assertion that daily total returns of corporate (investment-grade) bond indices exhibit non-normal probability distribution since they are asymmetric (negative skewness, i.e., historical distribution skewed left) and have fatter tails (positive excess kurtosis). Figure 5 plots the way a passive investment would evolve over the time period analysed here and compares the performance of the indices and the risk-free rate of return.
4.3.2. Analysis of Heterogeneity Our analysis of the heterogeneity of these indices is similar to our analysis of that of the US indices and the benchmark group is, again, the set of four US government bond indices. Moreover, we rely on the same measures of heterogeneity. Table
4. Empirical Analysis—Eurozone Study

37An EDHEC-Risk Institute Publication
A Review of Corporate Bond Indices: Construction Principles, Return Heterogeneity, and Fluctuations in Risk Exposures — June 2011
4. Empirical Analysis—Eurozone Study
9 shows that there is a wider range of correlation here: from 0.89 to 0.97. One of the reasons for the greater correlation of iBoxx (≈1,200 bonds) and iBoxx Liquid
(forty bonds) is that these indices have the same pricing source, a circumstance that would corroborate the hypothesis that different pricing sources (or models)
Table 8: Descriptive statistics for daily risk premiaStatistics for the daily risk premium series returns of each of the four bond indices we analyse in this paper. The risk premium is the return in excess of the euro interbank offered three-month rate. Each series encompasses 3,130 returns, from January 1999 to December 2010. All values are daily, except for the annualised mean, the annualised standard deviation, and the corresponding Sharpe ratio. The Value-at-Risk is the historical percentage above which 90/95% of the returns occurred.
iBoxx iBoxx Liquid Citigroup BofA Merrill Lynch
Mean 0.0049% 0.0055% 0.0067% 0.0053%
Standard Error 0.0034% 0.0038% 0.0035% 0.0030%
t Statistics 1.45 1.47 1.94 1.78
Median 0.0107% 0.0063% 0.0158% 0.0122%
StDev 0.1894% 0.2109% 0.1939% 0.1650%
Minimum -1.04% -1.31% -2.06% -0.85%
Maximum 0.75% 0.87% 1.07% 0.60%
Skewness -0.50 -0.39 -0.71 -0.52
Excess Kurtosis 1.83 1.67 6.73 1.73
Value-at-Risk (90%) -0.2140% -0.2489% -0.2112% -0.1889%
Value-at-Risk (95%) -0.3175% -0.3540% -0.3007% -0.2749%
Annualised Mean 1.2867% 1.4526% 1.7701% 1.3824%
Annualised StDev 3.0601% 3.4076% 3.1330% 2.6664%
Sharpe Ratio 0.42 0.43 0.56 0.52
Figure 5: Investment performanceInvestment path of 100 euros invested in January 1999 at the risk-free rate of return and in each of the four indices.

38 An EDHEC-Risk Institute Publication
A Review of Corporate Bond Indices: Construction Principles, Return Heterogeneity, and Fluctuations in Risk Exposures — June 2011
can lead to different prices. The lowest correlation was that of BofA Merrill Lynch and Citigroup indices, two broad value-weighted indices.
As mentioned before, tracking error analysis28 measures how well one index tracks another. The average tracking error of the eurozone bond indices is higher than that (approximately 0.7%) of the government bond indices. The maxdiff measures were also higher, and the daily return can be as different as on 30 September 2008, when iBoxx posted a total return of - 0.44% and Citigroup a return of - 2.05%.
4.4. Analysis of the Stability of Risk ExposuresAs in the US study, we look at other index characteristics to analyse how the ways the risks indices bear change over time.
Investors, after all, will have to deal with any fluctuations. Table 10 shows the statistics.
As figure 6 shows, yields to maturity may evolve similarly, but terms to maturity and duration, as in the US market, can be consistently different and unstable. The terms to maturity and duration of the iBoxx Liquid index are highly volatile, first nearly doubling, then falling by half. In an index with so few constituent bonds, after all, each constituent will have a relatively large impact.
These results seem to suggest a tradeoff between investability and stability: iBoxx Liquid, with its small number of liquid bonds, represents investability. The price paid (the comparison with iBoxx index is straightforward) is the greater instability of key index characteristics.
4. Empirical Analysis—Eurozone Study
28 - We do the tracking error analysis for every possible pair of indices.
Table 9: Comparisons of the indicesIn panel A, we present the Pearson correlation coefficients for the indices for the series data. In panel B, we present the annualised tracking error between each pair of indices, which is the standard deviation of the difference between the index returns. In panel C, we show the results of the maxdiff analysis; the lower the figures are, the more similar the indices are. We also show the parallel results for the US government bond market, for which we chose Datastream, Barclays, BofA Merrill Lynch, and Citigroup indices. All computations use daily returns from January 1999 to December 2010 (3,130 observations).
Panel A - Correlation Coefficients of Daily Risk Premium
iBoxx iBoxx Liquid Citigroup BofA Merrill Lynch
iBoxx 1.0000 0.9743 0.8942 0.9486
iBoxx Liquid - 1.0000 0.8875 0.9212
Citigroup - - 1.0000 0.8850
BofA Merrill Lynch - - - 1.0000
Panel B - Annualised Tracking Error Based on Daily Returns
Benchmark iBoxx iBoxx Liquid Citigroup BofA Merrill Lynch
iBoxx - 0.8108% 1.4261% 0.9973%
iBoxx Liquid - - 1.5739% 1.4075%
Citigroup - - - 1.4624%
Panel C - MaxDiff Analysis: Euro Corporate x US Government
Annualised Mean = 26.49% x 12.92%
Annualised Std Dev = 1.45% x 0.81%
Maximum MaxDiff = 1.61% x 1.15%

39An EDHEC-Risk Institute Publication
A Review of Corporate Bond Indices: Construction Principles, Return Heterogeneity, and Fluctuations in Risk Exposures — June 2011
It is clear that the terms to maturity of the euro-denominated indices are shorter than those of the US indices (≈5.5 versus ≈11 years), translating into shorter average durations (≈5 years versus ≈6). This
finding may be a consequence of the greater maturity of the US bond market, maturity that may make investors more willing to invest in bonds for longer terms.
4. Empirical Analysis—Eurozone Study
Table 10: Index characteristics—comparisonWe compare means, standard deviations, minima, and maxima of duration (in years), terms to maturity (in years), and yield to maturity (yearly rate). The duration measure follows Macaulay’s definition. Our available data is from January 1999 to December 2010.
Duration iBoxx iBoxx Liquid Citigroup BofA Merrill Lynch
Mean 4.85 5.27 4.38 4.34
Std Dev 0.52 0.98 0.28 0.26
Minimum 4.15 3.59 3.87 3.79
Maximum 6.46 7.49 5.09 4.99
YTM iBoxx iBoxx Liquid Citigroup BofA Merrill Lynch
Mean 5.03 4.79 4.53 4.69
Std Dev 1.00 0.95 0.94 1.05
Minimum 3.30 2.67 2.76 3.02
Maximum 8.09 7.35 6.73 7.60
Term to Maturity iBoxx iBoxx Liquid Citigroup BofA Merrill Lynch
Mean 5.69 5.89 5.55 5.44
Std Dev 0.39 0.98 0.41 0.36
Minimum 3.30 2.67 2.76 3.02
Maximum 6.23 7.58 6.46 6.27
Figure 6: Time-series evolution of index characteristics We plot the average duration, terms to maturity, and yield to maturity for all indices. For the iBoxx index, data for term to maturity is not available before September 2002.

40 An EDHEC-Risk Institute Publication
A Review of Corporate Bond Indices: Construction Principles, Return Heterogeneity, and Fluctuations in Risk Exposures — June 2011
Figure 7 shows that the AAA-class, as in the US bonds, makes a marginal contribution to the composition of the indices. Figure 8, for its part, shows the way the average credit risk of each index
evolves. We still use Ferreira and Gamma’s (2007) linear measure, as in the US analysis. We see then that the credit risk exposure is highly unstable. For instance, iBoxx presented an average index
4. Empirical Analysis—Eurozone Study
Figure 7: Credit risk exposureWe separate the bonds in each index into risk classes (Standard & Poor’s) and plot the evolution of the weights of these risk classes (market cap). The indices are concentrated on classes A and BBB. The iBoxx Liquid AAA, AA, A, and BBB sub-indices, although available, do not add up to the broad index: for this reason, we have not plotted the equivalent chart for the iBoxx Liquid index.
Figure 8 - Average credit risk exposureWe plot the time evolution of the average index rating for all four indices. We calculate the (market cap) average index rating using the linear quantifying approach stated in table 6, in the spirit of Ferreira and Gama (2007). The higher the average index credit rating, the lower the credit risk exposure.

41An EDHEC-Risk Institute Publication
A Review of Corporate Bond Indices: Construction Principles, Return Heterogeneity, and Fluctuations in Risk Exposures — June 2011
rating ranging from 14.5 to nearly 18. Although the variability of credit risk exposure turns out to be greater in the euro bond market than in the US bond market, its average was found to be historically lower (which means better ratings).
4. Empirical Analysis—Eurozone Study

42 An EDHEC-Risk Institute Publication
A Review of Corporate Bond Indices: Construction Principles, Return Heterogeneity, and Fluctuations in Risk Exposures — June 2011
4. Empirical Analysis—Eurozone Study

43An EDHEC-Risk Institute Publication
Conclusion

44 An EDHEC-Risk Institute Publication
A Review of Corporate Bond Indices: Construction Principles, Return Heterogeneity, and Fluctuations in Risk Exposures — June 2011
This paper assesses the performance of investment-grade corporate bond indices in both the US and eurozone markets (four indices in each market). Index returns, as well as such exposures as duration and credit risk, are used to analyse the properties of these indices and compare them.
Apart perhaps from the singular case of the eurozone Citigroup index, the indices in each market have many similar characteristics, although there are also many differences.
Credit and interest rate risk exposures for all eight indices turn out to be fairly unstable. This instability has major implications for investors: even if a particular index matches an investor’s desired risk exposures today, there is no guarantee that it will do so tomorrow. The fluctuations in risk exposures are incompatible with investors’ requirements that these exposures be relatively stable so that allocation decisions are not compromised by such fluctuations.
The investable indices based on a small number (less than 100) of liquid bonds (Dow Jones for the US and iBoxx Liquid for the eurozone) are in many ways different from the broader indices based on thousands of bonds. As a main result of the smaller number of bonds, instability is heightened.
In addition, the average index rating of the euro indices is slightly higher than that of the US indices—in other words, the euro indices are less exposed to credit risk. Likewise, the terms to maturity and the duration of euro-denominated bond indices are shorter. This result shows that switching from US bond indices
to euro-denominated bond indices (or vice-versa) is a matter not only of currency risk but also of credit and interest rate risks.
The difficulty of finding the desired index may be one of the reasons for the relative unpopularity of passive investing in the corporate bond market. Given its broad popularity in equity markets, passive investing will gain ground only if bond index providers begin to develop better methods of constructing indices.
Conclusion

45An EDHEC-Risk Institute Publication
Appendix: Alternative Weighting Schemes

46 An EDHEC-Risk Institute Publication
A Review of Corporate Bond Indices: Construction Principles, Return Heterogeneity, and Fluctuations in Risk Exposures — June 2011
Largely because of the abovementioned shortcomings of value-weighted indices, alternative weighting schemes have long been discussed by practitioners. Some of these alternatives have been applied to corporate bond indices, others merely proposed. In this appendix, we review the alternatives currently used for such similar asset classes as government bonds—the alternatives, after all, could be easily expanded to the corporate segment. Finally, we look at index families with special objectives to provide a comprehensive overview of alternative indices and weighting schemes. Table 11 summarises the alternative weighting schemes.
A - Ad hoc SchemesThe aim of these schemes is to solve the problem of greater concentration in more highly indebted companies (the so-called bums problem). These schemes weight constituent bonds by criteria other than the amount of a company’s debt. In general, these indices do not address the problem of unstable risk exposure, so fluctuating duration is still to be expected.
Equal WeightingThe most common alternative to value-weighted indices is the (simple and naive) equally weighted scheme. These indices weight all eligible issues equally. Equally weighted indices are much easier to calculate since there is no need to keep track of the outstanding amount of debt (unless, however, the bond falls below some minimum requirement and must be taken out of the index). Another advantage of equally weighted indices is that they mitigate the bums problem capitalisation-weighted indices are exposed to, since equal
weighting automatically limits the exposure to large debtors with low creditworthiness.However, if large debtors not only have larger issues than other borrowers but also issue more (and different) tranches of debt, the bums problem may still be relevant.
Equally weighted indices have one major shortcoming: since relative prices change constantly, the portfolio must be rebalanced at regular intervals even though the index universe does not change. From a pure index calculation perspective, this is of course not a problem. But if the index is used as basis for bond portfolio investments, ongoing reshuffling can lead to significant transaction costs, thereby dragging down overall performance.
The most well-known index family based on equally weighted bonds is the Dow Jones corporate index family (formerly known as Ryan Labs indices). These indices have been published since the early 1980s.
Fundamental IndexingRecent literature by Arnott et al. (2010) transfers the idea of fundamental indexation from equities (Arnott et al. 2005) to the fixed-income universe. Their weighting schemes are based on such fundamental company characteristics as total cash flows, dividend payments, book value of assets, and sales. In early 2010, Research Affiliates, LLC, and Ryan ALM announced the launch of the RAFI US Corporate Bond Index Series for Investment Grade and High Yield, the first corporate bond index family to use the fundamental indexing method. The claim is that so-called fundamental weighting is a more efficient means—leading to a better risk/reward tradeoff—of constructing a bond index (or portfolio).
Appendix: Alternative Weighting Schemes

47An EDHEC-Risk Institute Publication
A Review of Corporate Bond Indices: Construction Principles, Return Heterogeneity, and Fluctuations in Risk Exposures — June 2011
Weighting by Face Value of DebtArnott et al. (2010) also propose a weighting scheme based on the face value of debt instead of on its market value. This approach weights zero-coupon bonds more heavily than do value-weighted indices. The relative weight of each issue is left constant over time (in the case of non-callable bonds), so it does not reflect the fundamental idiosyncratic changes of individual issuers. As such, it can be regarded as a combination of equally and market-capitalisation-weighted indices.
Weighting by GDPThis recent weighting scheme for bond indices debuted in 2009.27 This scheme applies only for international (global) indices. As we have seen, value-weighted bond indices assign larger and larger weights to countries that borrow more and more money. This is somewhat counterintuitive, as increased debt may raise the likelihood of default. In addition, value-weighted bond indices usually underweight emerging markets, which have less developed bond markets. Weighting debt by a country’s gross domestic product is an attempt to correct these imbalances. Moreover, the claim is that “GDP figures tend to be more stable over time compared to equity markets’ performance-related peaks and troughs”.28 One index family in this category is the MSCI GDP weightedindices.
B – Risk-Based SchemesWeighting by Duration ReciprocalThe purpose of a duration-weighted bond index is to have an index that is yield-curve neutral. Weighting the bonds by the duration reciprocal makes each bond position along the risk-reward curve play no
role in the index return. So each constituent contributes equally to overall index risk. The (reciprocal) duration weighting scheme, such as the Dow Jones CBOT treasury index, attenuates the bums problem because the amount of outstanding debt has no influence on the weights in the index.
Ryan/Mergent US Treasury Ladder Index FamilyThese indices are provided by a partnership between Ryan ALM and Mergent. This family is based on thirty equally weighted29 US Treasury issues with fixed coupons, scheduled to mature in a proportional, annual laddered structure (one bond for each maturity from one to thirty years). The index does not contain Treasury bills, Treasury inflation-protected securities (TIPS), or zero-coupon bonds. The idea is to have one Treasury bond maturing in one year, another in two years, and so up to thirty years. The purpose is to measure an average potential return of the US Treasury yield curve. The providers assert that it is an equal-weighted constant-maturity index designed to represent the most diversified interest rate risk on the thirty-year yield curve. As a result of its construction rules, the average index duration, although not really constant, is meant to fluctuate less widely than that of standard broad indices. The bums problem is also alleviated, since the market value of outstanding debt has no influence on the weights in the index.
Ryan Strips30 Index FamilyThese indices are provided by Ryan ALM. Each index in the family is a single Treasury Strips security that best represents an annual maturity. There are currently thirty annual STRIPS indices, from one year to
Appendix: Alternative Weighting Schemes
27 - PIMCO (January 2009) and Barclays Capital (November 2009) were the first to launch a new family of gross-domestic-product-weighted bond indices.28 - Taken from the MSCI website at http://www.mscibarra.com/products/indices/thematic_and_strategy/gdp_weighted.29 - This rule is not set in stone, as some maturities can have two bonds (although their weights will still add up to 1/30 on the rebalancing date). In January 2011, for instance, the 1-30 index contained two bonds maturing in each of the following years: 2032, 2033, 2034, and 2035.30 - STRIPS stands for separately traded registered interest and principal securities.

48 An EDHEC-Risk Institute Publication
A Review of Corporate Bond Indices: Construction Principles, Return Heterogeneity, and Fluctuations in Risk Exposures — June 2011
thirty years. These “one-bond indices” will have constant duration and will represent the building blocks (indices) for the so-called custom liability indices, which are designed to be the proper benchmark for liability driven objectives. The standard available custom liability indices are 1-3, 3-5, 5-7, 7-10, and +10 years. By design, and at least in theory, each STRIPS index is of constant duration and the bums problem is alleviated.
There are still other special Ryan indices, the so-called Ryan US Treasury yield curve indices: they are based on the currently auctioned issue and attempt to minimise liquidity risk (credit risk is already eliminated since these indices deal only with Treasury bonds). They are separated into two groups: the Ryan cash index, an equally weighted portfolio of the bill auctions, and the Ryan index, another equally weighted portfolio of the note and bond auctions.
US iBoxx US Pension Liability Index FamilyLaunched in October 2006 by Markit, this family is made up of three indices: active, retired, and the aggregate.31 The underlying liability (cash flow) data for the iBoxx US pension liability indices comes from Hewitt Associates. The LIBOR discount curve is used as a proxy for the interest rates. The constant-maturity liability cash-flows are discounted using each year’s projected cash flows at the appropriate rate, on the assumption that the benefits are paid, on average, at midyear.
Liability-driven investment (LDI) is increasingly important for defined-benefit pension plans. Markit claims that there is a lack of plain-vanilla benchmarks against which plan sponsors can measure the returns of their asset managers. So the purpose of this index is to serve as a simple benchmark for these managers.
Appendix: Alternative Weighting Schemes
31 - The aggregate index mimics the overall performance of a typical traditional defined-benefit plan in the US, taking into consideration the passage of time and changes in the term structure of interest rates. The active member index mimics the liability profile for active members, whereas the retired member index mimics the liability profile for retired members. Table 11: Alternative weighting schemes and index building strategies
We summarise the alternative weighting schemes, along with some special available index families. We use an ampersand to show that the particular index is provided by a partnership, whereas the word and is used to mean different and independent providers.
Weighting SchemeIndex Family
ExistingIndex?
Exampleof Provider(s)
Applied toCorporate
Bonds?
Bums ProblemAdressed
Duration Problem
Addressed?
Credit InstabilityAddressed?
Ad-h
oc S
chem
es
Equal Weighting Yes Dow Jones Yes, US Market Yes No No
Fundamental Weighting YesResearch Affiliates, LLC & Ryan ALM
Yes, US Market Yes No No
Debt Face Value Weighting
No Not Available No Partially No No
GDP Weighting YesMSCI, PIMCO, and
BarclaysYes, Globally Yes No No
Risk
-bas
ed S
chem
es
Duration Weighting Yes Dow Jones & CBOTNo, only Treasury
bond on USYes No No
Ryan/Mergent USTreasury Ladder Family
YesRyan ALM &
MergentNo Yes Partially* No
Ryan Strips Index Family Yes Ryan ALM No Yes Yes** No
US iBoxx US PensionLiability Index Family
Yes Markit No No No No
Barclays US TreasuryTargeted Exposure Index
Yes Barclays No Yes Yes*** No
* Although not really constant, index duration is supposed to fluctuate less widely than ofstandrad broad indices** In theory, each index is a one-bond index with a single cash flow with constant term to maturity, which means constant duration*** By design, each index in this family targets a one-year duration
49An EDHEC-Risk Institute Publication
A Review of Corporate Bond Indices: Construction Principles, Return Heterogeneity, and Fluctuations in Risk Exposures — June 2011
In its construction rules, nothing is said about controlling duration. So there is no reason to believe that the duration will be stable.
Barclays US Treasury Targeted Exposure Index FamilyThe family includes six indices: 2Y US Treasury futures targeted exposure index, 5Y, 10Y, Long-bond, ultra-bond, and the US Treasury 2Y/10Y yield curve index. Its aim is to reflect the returns of futures positions in US Treasury bonds that are weighted to target a constant exposure to changes in yields. In Barclays’ own words, as taken from its website, “each index in the family targets a 1 index point change in index level per 1 basis point change in the yield of the underlying cheapest-to-deliver bond”. Therefore, the duration problem, which is the main focus of this index family, is addressed. Although there is not much information available, it seems that the bums problem is alleviated because the weights do not seem to depend on market values.
Appendix: Alternative Weighting Schemes

50 An EDHEC-Risk Institute Publication
A Review of Corporate Bond Indices: Construction Principles, Return Heterogeneity, and Fluctuations in Risk Exposures — June 2011
Appendix: Alternative Weighting Schemes

51An EDHEC-Risk Institute Publication
References

52 An EDHEC-Risk Institute Publication
A Review of Corporate Bond Indices: Construction Principles, Return Heterogeneity, and Fluctuations in Risk Exposures — June 2011
• Amenc, N., S. Chan, F. Goltz, and L. Martellini. 2010. Efficient equity indices: Towards a new paradigm. Working paper, EDHEC-Risk Institute.
• Arnott, R. D.; J. Hsu, F. Li, and S. D. Shepherd. 2010. Valuation-indifferent weighting for bonds. Journal of Portfolio Management 36 (3): 117–30.
• Arnott, R. D.; J. C. Hsu, and P. Moore. 2005. Fundamental indexation. Financial Analysts Journal 61 (2): 83–99.
• Benning, J. F. 2006. Benchmarking fixed-income returns. Working paper, Chicago Board of Trade.
• Bolognesi, E., and A. Zuccheri. 2008. On the efficiency of benchmarks composition: A behavioural perspective. University of Bologna, working paper.
• Brown, P. J. 2002. Constructing and calculating bond indices. Cambridge: Gilmour Drummond Publishing.
• Cai, N., and X. Jiang. 2008. Corporate bond returns and volatility. Financial Review 43:1–26.
• Elton, E. J.; M. J. Gruber, S. Das, and M. Hlavka. 1993. Efficiency with costly information: a reinterpretation of evidence from managed portfolios. Review of Financial Studies 6 (1): 1–22.
• Fama, E. F., and K. R. French. 1992. The cross-section of expected stock returns. Journal of Finance 47 (2): 427–65.
• Ferreira, M. A., and P. M. Gama. 2007. Does sovereign debt rating news spill over to international stock markets? Journal of Banking and Finance 31 (10): 3162–82.
• Ferri, R. A. 2006: All about index funds. New York: McGraw-Hill.
• Gatfaoui, H. 2009. Is corporate bond market performance connected with stock market performance? Bankers, Markets and Investors 102:45–58.
• Korn, O., and C. Koziol. 2006. Bond portfolio optimization: A risk-return approach. Journal of Fixed Income 15 (4): 48–60.
• Lintner, J. 1965. The valuation of risky assets and the selection of risky investments in stock portfolios and capital budgets. Review of Economics and Statistics 47: 13–37.
• Lloyd, W. T., and B. K. Manium. 2004. Portfolio strategies for outperforming a benchmark. In Handbook of European fixed income securities, ed. F. Fabozzi. Hoboken, N. J.: John Wiley & Sons.
• Martellini, L., P. Priaulet, and S. Priaulet. 2003. Fixed-income securities. Chichester: John Wiley & Sons.
• Meindl, P. J., and J. Primbs. 2006. Corporate bond portfolio optimization with transaction costs. Working paper, Stanford University.
References

53An EDHEC-Risk Institute Publication
A Review of Corporate Bond Indices: Construction Principles, Return Heterogeneity, and Fluctuations in Risk Exposures — June 2011
• Reilly, F., G. W. Kao, and D. J. Wright. 1992. Alternative bond market indices. Financial Analysts Journal 48 (3): 44–58.
• Reilly, F., and D. J. Wright. 1996. Bond market indices. In Handbook of fixed income securities, ed. F. Fabozzi. New York: McGraw-Hill.• Roll, R. 1977. A critique of the asset pricing theory's tests part I: On past and potential testability of the theory, Journal of Financial Economics 4 (2): 129–76.
• Sangvinatsos, A. 2010. Strategic allocation: The role of corporate bond indices? Working paper, University of Southern California.
• Sharpe, W. F. 1964. Capital asset prices: A theory of market equilibrium under conditions of risk. Journal of Finance 19:425–42.
• Sharpe, W. F. 1966. Mutual fund performance. Journal of Business 39 (1): 119–38.
• Siegel, L. B. (2003): Benchmarks and investment management. The Research Foundation of the Association for Investment Management and Research, Charlottesville, Virginia.
• Siegel, L. B., F. J. Enderle, and B. Pope. (2003): Broad-capitalization indexes of the U.S. equity market. Journal of Investing 12 (1): 11–22.
References

54 An EDHEC-Risk Institute Publication
A Review of Corporate Bond Indices: Construction Principles, Return Heterogeneity, and Fluctuations in Risk Exposures — June 2011
References

55An EDHEC-Risk Institute Publication
About EDHEC-Risk Institute

56 An EDHEC-Risk Institute Publication
A Review of Corporate Bond Indices: Construction Principles, Return Heterogeneity, and Fluctuations in Risk Exposures — June 2011
About EDHEC-Risk Institute
A Review of Corporate Bond Indices: Construction Principles, Return Heterogeneity, and Fluctuations in Risk Exposures — June 2011
The Choice of Asset Allocation and Risk ManagementEDHEC-Risk structures all of its research work around asset allocation and risk management. This issue corresponds to a genuine expectation from the market.
On the one hand, the prevailing stock market situation in recent years has shown the limitations of diversification alone as a risk management technique and the usefulness of approaches based on dynamic portfolio allocation.
On the other, the appearance of new asset classes (hedge funds, private equity, real assets), with risk profiles that are very different from those of the traditional investment universe, constitutes a new opportunity and challenge for the implementation of allocation in an asset management or asset-liability management context.
This strategic choice is applied to all of the Institute's research programmes, whether they involve proposing new methods of strategic allocation, which integrate the alternative class; taking extreme risks into account in portfolio construction; studying the usefulness of derivatives in implementing asset-liability management approaches; or orienting the concept of dynamic “core-satellite” investment management in the framework of absolute return or target-date funds.
An Applied Research ApproachIn an attempt to ensure that the research it carries out is truly applicable, EDHEC has implemented a dual validation system for the work of EDHEC-Risk. All research work must be part of a research
programme, the relevance and goals of which have been validated from both an academic and a business viewpoint by the Institute's advisory board. This board is made up of internationally recognised researchers, the Institute's business partners, and representatives of major international institutional investors. Management of the research programmes respects a rigorous validation process, which guarantees the scientific quality and the operational usefulness of the programmes.
Six research programmes have been conducted by the centre to date: • Asset allocation and alternative diversification• Style and performance analysis • Indices and benchmarking• Operational risks and performance• Asset allocation and derivative instruments• ALM and asset management
These programmes receive the support of a large number of financial companies. The results of the research programmes are disseminated through the EDHEC-Risk locations in London, Nice, and Singapore.
In addition, EDHEC-Risk has developed a close partnership with a small number of sponsors within the framework of research chairs or major research projects:• Regulation and Institutional Investment,in partnership with AXA Investment Managers• Asset-Liability Management and Institutional Investment Management, in partnership with BNP Paribas Investment Partners• Risk and Regulation in the European Fund Management Industry, in partnership with CACEIS
Founded in 1906, EDHEC is one of the foremost French
business schools. Accredited by the three main international
academic organisations, EQUIS, AACSB, and Association
of MBAs, EDHEC has for a number of years been pursuing
a strategy for international excellence that led it to set up
EDHEC-Risk in 2001. With sixty-six professors,
research engineers, and research associates, EDHEC-Risk has
the largest asset management research team in Europe.

57An EDHEC-Risk Institute Publication
A Review of Corporate Bond Indices: Construction Principles, Return Heterogeneity, and Fluctuations in Risk Exposures — June 2011
About EDHEC-Risk Institute
• Structured Products and Derivative Instruments, sponsored by the French Banking Federation (FBF)• Dynamic Allocation Models and New Forms of Target-Date Funds,in partnership with UFG-LFP• Advanced Modelling for Alternative Investments, in partnership with Newedge Prime Brokerage• Asset-Liability Management Techniques for Sovereign Wealth Fund Management, in partnership with Deutsche Bank• Core-Satellite and ETF Investment, in partnership with Amundi ETF• The Case for Inflation-Linked Corporate Bonds: Issuers’ and Investors’ Perspectives, in partnership with Rothschild & Cie• Advanced Investment Solutions for Liability Hedging for Inflation Risk, in partnership with Ontario Teachers’Pension Plan• Exploring the Commodity Futures Risk Premium: Implications for Asset Allocation and Regulation, in partnership with CME Group• Structured Equity Investment Strategies for Long-Term Asian Investors, in partnership with Société Générale Corporate & Investment Banking• The Benefits of Volatility Derivatives in Equity Portfolio Management, in partnership with Eurex • Solvency II Benchmarks,in partnership with Russell Investments
The philosophy of the Institute is to validate its work by publication in international journals, as well as to make it available to the sector through its position papers, published studies, and conferences.
Each year, EDHEC-Risk organises a major international conference for institutional investors and investment management professionals with a view to presenting the results of its research: EDHEC-Risk Institutional Days.
EDHEC also provides professionals with access to its website, www.edhec-risk.com, which is entirely devoted to international asset management research. The website, which has more than 42,000 regular visitors, is aimed at professionals who wish to benefit from EDHEC’s analysis and expertise in the area of applied portfolio management research. Its monthly newsletter is distributed to more than 700,000 readers.
EDHEC-Risk Institute: Key Figures, 2009-2010
Nbr of permanent staff 66
Nbr of research associates 18
Nbr of affiliate professors 6
Overall budget €9,600,000
External financing €6,345,000
Nbr of conference delegates 2,300
Nbr of participants at EDHEC-Risk Indices & Benchmarks seminars 582
Nbr of participants at EDHEC-Risk Institute Risk Management seminars 512
Nbr of participants at EDHEC-Risk Institute Executive Education seminars 247

58 An EDHEC-Risk Institute Publication
A Review of Corporate Bond Indices: Construction Principles, Return Heterogeneity, and Fluctuations in Risk Exposures — June 2011
About EDHEC-Risk Institute
Research for BusinessThe Institute’s activities have also given rise to executive education and research service offshoots. EDHEC-Risk's executive education programmes help investment professionals to upgrade their skills with advanced risk and asset management training across traditional and alternative classes.
The EDHEC-Risk Institute PhD in Financewww.edhec-risk.com/AIeducation/PhD_Finance
The EDHEC-Risk Institute PhD in Finance is designed for professionals who aspire to higher intellectual levels and aim to redefine the investment banking and asset management industries. It is offered in two tracks: a residential track for high-potential graduate students, who hold part-time positions at EDHEC, and an executive track for practitioners who keep their full-time jobs. Drawing its faculty from the world’s best universities and enjoying the support of the research centre with the greatest impact on the financial industry, the EDHEC-Risk Institute PhD in Finance creates an extraordinary platform for professional development and industry innovation.
FTSE EDHEC-Risk Efficient Indiceswww.edhec-risk.com/indexes/efficient
FTSE Group, the award winning global index provider, and EDHEC-Risk Institute launched the first set of FTSE EDHEC-Risk Efficient Indices at the beginning of 2010. Offered for a full global range, including All World, All World ex US, All World ex UK, Developed, Emerging, USA, UK, Eurobloc, Developed Europe, Developed Europe ex UK, Japan, Developed Asia Pacific ex Japan, Asia Pacific, Asia Pacific ex Japan, and Japan, the index series aims to capture equity market returns with an
improved risk/reward efficiency compared to cap-weighted indices. The weighting of the portfolio of constituents achieves the highest possible return-to-risk efficiency by maximising the Sharpe ratio (the reward of an investment per unit of risk). These indices provide investors with an enhanced risk-adjusted strategy in comparison to cap-weighted indices, which have been the subject of numerous critiques, both theoretical and practical, over the last few years. The index series is based on all constituent securities in the FTSE All-World Index Series. Constituents are weighted in accordance with EDHEC-Risk’s portfolio optimisation, reflecting their ability to maximise the reward-to-risk ratio for a broad market index. The index series is rebalanced quarterly at the same time as the review of the underlying FTSE All-World Index Series. The performances of the EDHEC-Risk Efficient Indices are published monthly on www.edhec-risk.com.
EDHEC-Risk Alternative Indexeswww.edhec-risk.com/indexes/pure_style
The different hedge fund indexes available on the market are computed from different data, according to diverse fund selection criteria and index construction methods; they unsurprisingly tell very different stories. Challenged by this heterogeneity, investors cannot rely on competing hedge fund indexes to obtain a “true and fair” view of performance and are at a loss when selecting benchmarks. To address this issue, EDHEC Risk was the first to launch composite hedge fund strategy indexes as early as 2003. The thirteen EDHEC-Risk Alternative Indexes are published monthly on www.edhec-risk.com and are freely available to managers and investors.

59An EDHEC-Risk Institute Publication
EDHEC-Risk Institute Publications and Position Papers (2008-2011)

A Review of Corporate Bond Indices: Construction Principles, Return Heterogeneity, and Fluctuations in Risk Exposures — June 2011
60 An EDHEC-Risk Institute Publication
A Review of Corporate Bond Indices: Construction Principles, Return Heterogeneity, and Fluctuations in Risk Exposures — June 2011
2011• Martellini, L., and V. Milhau. Capital structure choices, pension fund allocation decisions, and the rational pricing of liability streams (June).
• Amenc, N., F. Goltz, and S. Stoyanov. A post-crisis perspective on diversification for risk management (May).
• Amenc, N., F. Goltz, Martellini, L., and L. Tang. Improved beta? A comparison of index-weighting schemes (April).
• Amenc, N., F. Goltz, Martellini, L., and D. Sahoo. Is there a risk/return tradeoff across stocks? An answer from a long-horizon perspective (April).
• Sender, S. The elephant in the room: Accounting and sponsor risks in corporate pension plans (March).
• Martellini, L., and V. Milhau. Optimal design of corporate market debt programmes in the presence of interest-rate and inflation risks (February).
2010• Amenc, N., and S. Sender. The European fund management industry needs a better grasp of non-financial risks (December).
• Amenc, N., S, Focardi, F. Goltz, D. Schröder, and L. Tang. EDHEC-Risk European private wealth management survey (November).
• Amenc, N., F. Goltz, and L. Tang. Adoption of green investing by institutional investors: A European survey (November).
• Martellini, L., and V. Milhau. An integrated approach to asset-liability management: Capital structure choices, pension fund allocation decisions and the rational pricing of liability streams (November).
• Amenc, N., F. Goltz, Martellini, L., and V. Milhau. New frontiers in benchmarking and liability-driven investing (September).
• Martellini, L., and V. Milhau. From deterministic to stochastic life-cycle investing: Implications for the design of improved forms of target date funds (September).
• Martellini, L., and V. Milhau. Capital structure choices, pension fund allocation decisions and the rational pricing of liability streams (July).
• Sender, S. EDHEC survey of the asset and liability management practices of European pension funds (June).
• Goltz, F., A. Grigoriu, and L. Tang. The EDHEC European ETF survey 2010 (May).
• Martellini, L., and V. Milhau. Asset-liability management decisions for sovereign wealth funds (May).
• Amenc, N., and S. Sender. Are hedge-fund UCITS the cure-all? (March).
EDHEC-Risk Institute Publications (2008-2011)
61An EDHEC-Risk Institute Publication
A Review of Corporate Bond Indices: Construction Principles, Return Heterogeneity, and Fluctuations in Risk Exposures — June 2011
• Amenc, N., F. Goltz, and A. Grigoriu. Risk control through dynamic core-satellite portfolios of ETFs: Applications to absolute return funds and tactical asset allocation (January).
• Amenc, N., F. Goltz, and P. Retkowsky. Efficient indexation: An alternative to cap-weighted indices (January).
• Goltz, F., and V. Le Sourd. Does finance theory make the case for capitalisation-weighted indexing? (January).
2009• Sender, S. Reactions to an EDHEC study on the impact of regulatory constraints on the ALM of pension funds (October).
• Amenc, N., L. Martellini, V. Milhau, and V. Ziemann. Asset-liability management in private wealth management (September).
• Amenc, N., F. Goltz, A. Grigoriu, and D. Schroeder. The EDHEC European ETF survey (May).
• Sender, S. The European pension fund industry again beset by deficits (May).
• Martellini, L., and V. Milhau. Measuring the benefits of dynamic asset allocation strategies in the presence of liability constraints (March).
• Le Sourd, V. Hedge fund performance in 2008 (February).
• La gestion indicielle dans l'immobilier et l'indice EDHEC IEIF Immobilier d'Entreprise France (February).
• Real estate indexing and the EDHEC IEIF Commercial Property (France) Index (February).
• Amenc, N., L. Martellini, and S. Sender. Impact of regulations on the ALM of European pension funds (January).
• Goltz, F. A long road ahead for portfolio construction: Practitioners' views of an EDHEC survey. (January).
2008• Amenc, N., L. Martellini, and V. Ziemann. Alternative investments for institutional investors: Risk budgeting techniques in asset management and asset-liability management (December).
• Goltz, F., and D. Schroeder. Hedge fund reporting survey (November).
• D’Hondt, C., and J.-R. Giraud. Transaction cost analysis A-Z: A step towards best execution in the post-MiFID landscape (November).
• Amenc, N., and D. Schroeder. The pros and cons of passive hedge fund replication (October). • Amenc, N., F. Goltz, and D. Schroeder. Reactions to an EDHEC study on asset-liability management decisions in wealth management (September).
EDHEC-Risk Institute Publications (2008-2011)

62 An EDHEC-Risk Institute Publication
A Review of Corporate Bond Indices: Construction Principles, Return Heterogeneity, and Fluctuations in Risk Exposures — June 2011
• Amenc, N., F. Goltz, A. Grigoriu, V. Le Sourd, and L. Martellini. The EDHEC European ETF survey 2008 (June).
• Amenc, N., F. Goltz, and V. Le Sourd. Fundamental differences? Comparing alternative index weighting mechanisms (April).
• Le Sourd, V. Hedge fund performance in 2007 (February).
• Amenc, N., F. Goltz, V. Le Sourd, and L. Martellini. The EDHEC European investment practices survey 2008 (January).
EDHEC-Risk Institute Publications (2008-2011)

63An EDHEC-Risk Institute Publication
A Review of Corporate Bond Indices: Construction Principles, Return Heterogeneity, and Fluctuations in Risk Exposures — June 2011
2010• Amenc, N., and V. Le Sourd. The performance of socially responsible investment and sustainable development in France: An update after the financial crisis (September).
• Amenc, N., A. Chéron, S. Gregoir, and L. Martellini. Il faut préserver le Fonds de Réserve pour les Retraites (July).
• Amenc, N., P. Schoefler, and P. Lasserre. Organisation optimale de la liquidité des fonds d’investissement (March).
• Lioui, A. Spillover effects of counter-cyclical market regulation: Evidence from the 2008 ban on short sales (March).
2009• Till, H. Has there been excessive speculation in the US oil futures markets? (November).
• Amenc, N., and S. Sender. A welcome European Commission consultation on the UCITS depositary function, a hastily considered proposal (September).
• Sender, S. IAS 19: Penalising changes ahead (September).
• Amenc, N. Quelques réflexions sur la régulation de la gestion d'actifs (June).
• Giraud, J.-R. MiFID: One year on (May).
• Lioui, A. The undesirable effects of banning short sales (April).
• Gregoriou, G., and F.-S. Lhabitant. Madoff: A riot of red flags (January).
2008 • Amenc, N., and S. Sender. Assessing the European banking sector bailout plans (December).
• Amenc, N., and S. Sender. Les mesures de recapitalisation et de soutien à la liquidité du secteur bancaire européen (December).
• Amenc, N., F. Ducoulombier, and P. Foulquier. Reactions to an EDHEC study on the fair value controversy (December). With the EDHEC Financial Analysis and Accounting Research Centre.
• Amenc, N., F. Ducoulombier, and P. Foulquier. Réactions après l’étude. Juste valeur ou non : un débat mal posé (December). With the EDHEC Financial Analysis and Accounting Research Centre.
• Amenc, N., and V. Le Sourd. Les performances de l’investissement socialement responsable en France (December).
• Amenc, N., and V. Le Sourd. Socially responsible investment performance in France (December).
• Amenc, N., B. Maffei, and H. Till. Les causes structurelles du troisième choc pétrolier (November).
• Amenc, N., B. Maffei, and H. Till. Oil prices: The true role of speculation (November).
EDHEC-Risk Institute Position Papers (2008-2011)
64 An EDHEC-Risk Institute Publication
A Review of Corporate Bond Indices: Construction Principles, Return Heterogeneity, and Fluctuations in Risk Exposures — June 2011
• Sender, S. Banking: Why does regulation alone not suffice? Why must governments intervene? (November).
• Till, H. The oil markets: Let the data speak for itself (October).
• Amenc, N., F. Goltz, and V. Le Sourd. A comparison of fundamentally weighted indices: Overview and performance analysis (March).
• Sender, S. QIS4: Significant improvements, but the main risk for life insurance is not taken into account in the standard formula (February). With the EDHEC Financial Analysis and Accounting Research Centre.
EDHEC-Risk Institute Position Papers (2008-2011)
A Review of Corporate Bond Indices: Construction Principles, Return Heterogeneity, and Fluctuations in Risk Exposures — June 2011

65An EDHEC-Risk Institute Publication
A Review of Corporate Bond Indices: Construction Principles, Return Heterogeneity, and Fluctuations in Risk Exposures — June 2011
……………………………………………………………………………………………………………………………………………………………………………………………………………
……………………………………………………………………………………………………………………………………………………………………………………………………………
……………………………………………………………………………………………………………………………………………………………………………………………………………
……………………………………………………………………………………………………………………………………………………………………………………………………………
……………………………………………………………………………………………………………………………………………………………………………………………………………
……………………………………………………………………………………………………………………………………………………………………………………………………………
……………………………………………………………………………………………………………………………………………………………………………………………………………
……………………………………………………………………………………………………………………………………………………………………………………………………………
……………………………………………………………………………………………………………………………………………………………………………………………………………
……………………………………………………………………………………………………………………………………………………………………………………………………………
……………………………………………………………………………………………………………………………………………………………………………………………………………
……………………………………………………………………………………………………………………………………………………………………………………………………………
……………………………………………………………………………………………………………………………………………………………………………………………………………
……………………………………………………………………………………………………………………………………………………………………………………………………………
……………………………………………………………………………………………………………………………………………………………………………………………………………
……………………………………………………………………………………………………………………………………………………………………………………………………………
……………………………………………………………………………………………………………………………………………………………………………………………………………
……………………………………………………………………………………………………………………………………………………………………………………………………………
Notes

66 An EDHEC-Risk Institute Publication
A Review of Corporate Bond Indices: Construction Principles, Return Heterogeneity, and Fluctuations in Risk Exposures - June 2011
……………………………………………………………………………………………………………………………………………………………………………………………………………
……………………………………………………………………………………………………………………………………………………………………………………………………………
……………………………………………………………………………………………………………………………………………………………………………………………………………
……………………………………………………………………………………………………………………………………………………………………………………………………………
……………………………………………………………………………………………………………………………………………………………………………………………………………
……………………………………………………………………………………………………………………………………………………………………………………………………………
……………………………………………………………………………………………………………………………………………………………………………………………………………
……………………………………………………………………………………………………………………………………………………………………………………………………………
……………………………………………………………………………………………………………………………………………………………………………………………………………
……………………………………………………………………………………………………………………………………………………………………………………………………………
……………………………………………………………………………………………………………………………………………………………………………………………………………
……………………………………………………………………………………………………………………………………………………………………………………………………………
……………………………………………………………………………………………………………………………………………………………………………………………………………
……………………………………………………………………………………………………………………………………………………………………………………………………………
……………………………………………………………………………………………………………………………………………………………………………………………………………
……………………………………………………………………………………………………………………………………………………………………………………………………………
……………………………………………………………………………………………………………………………………………………………………………………………………………
……………………………………………………………………………………………………………………………………………………………………………………………………………
Notes


For more information, please contact: Carolyn Essid on +33 493 187 824 or by e-mail to: [email protected]
EDHEC-Risk Institute393 promenade des AnglaisBP 311606202 Nice Cedex 3 — France
EDHEC Risk Institute—Europe10 Fleet Place - LudgateLondon EC4M 7RB - United Kingdom
EDHEC Risk Institute—Asia1 George Street - #07-02Singapore 049145
www.edhec-risk.com