a review of biodiversity conservation performance measures
TRANSCRIPT
A Review of Biodiversity Conservation Performance Measures
March 2006

ACKNOWLEDGEMENTSThis report was prepared under contract by Graham Tucker (Ecological Solutions), commissioned by EarthwatchInstitute (Europe) and supported by Rio Tinto through its global biodiversity partnership programme. The project wasmanaged by Jo Zaremba and Roger Mitchell and the analysis of current corporate reporting was carried out by HelenFerguson and Joanna Watkins – all of Earthwatch Institute (Europe).
The report author (Graham Tucker) and the Earthwatch Institute (Europe) wish to acknowledge the input to thepreparation of this report by a number of people who attended workshops or provided information and commentsduring the drafting stages:-
Stuart Anstee, Sarah Basden, Tom Burke, Dominique Cagnetta, John Hall, Pete Ladman, Mick Lovelly, Dave Richardsand Tatiana Faroukhians (Rio Tinto)
Rob Brett and Annelisa Grigg (FFI)
Leon Bennun, Jonathan Ekstrom, Jonathan Stacey and Alison Stattersfield (Bird Life International)
Ken Norris (Centre for Agri-environment Research, Reading University)
Marielle Canter and Bambi Semroc (Conservation International)
Jonathan Bailey (Institute of Zoology, UK)
Sharon Laws and Neil Brummitt (Royal Botanic Gardens, Kew UK)
Ian Dutton (The Nature Conservancy)
Val Kapos (UNEP-WCMC and Cambridge Conservation Forum)
Mike King, Steve Hill and Liz Hawkin (The Environment Council, UK)
Chris Sheldon (Green Inck)
Paul Jepson (Environmental Change Institute, Oxford University).
Report prepared byDr Graham Tucker BSc MSc PhD MIEEM
Ecological Solutions, 5 Rosenthal Terrace, Hemingford Grey, Huntingdon PE28 9BL United Kingdom
www.ecological-solutions.co.uk
Photograph: c Guy Stockton
FORWARDConservation of biodiversity is a critical issue for today’ssociety. Traditionally the role of biodiversity conservationsat with government and non-governmental organisations.There is now increasing realisation that all sectors ofsociety, including the private sector, need to engagecollaboratively in order to manage biodiversity sustainably.
Biodiversity and its management are of strategicimportance to both Rio Tinto and Earthwatch Institute.Both organisations work in regions of the world that arerecognised and valued locally and globally for theirbiodiversity resources. The significance of theseresources continues to increase as human and naturalpressures escalate extinction rates and modify habitats.
Rio Tinto and Earthwatch Institute have worked togetherfor more than a decade, both organisations committed toimproving environmental stewardship. As the partnershipdeveloped, both organisations discovered that corporationsand non-governmental organisations can find substantialcommon goals and work together to provide leadership inbiodiversity management.
Building on that learning, Rio Tinto has a globalbiodiversity partnership programme with some of themost respected environmental organisations and a widerange of joint research around the world. A primaryoutcome has been the development of the Rio Tintocorporate biodiversity strategy. This was developed inconsultation with experts from conservation andcommunity development organisations, including RioTinto’s biodiversity partners. The strategy provides thepolicy and guidance framework that enables Rio Tintooperations to maximise the opportunities associated withbiodiversity management at their sites.
The strategy commits Rio Tinto to have a net positiveimpact on biodiversity wherever the company works. Todeliver against these commitments it will be necessary forRio Tinto to demonstrate that its management actionshave positive effects on biodiversity conservation.Measurement of conservation success is also animportant driver for Earthwatch Institute, which recognisesa growing need for conservation organisations toquantitatively measure the effectiveness of theirconservation actions.
In response to the issue of performance measurementRio Tinto and Earthwatch Institute initiated a project toidentify and develop performance measures to evaluatethe outcomes and impacts of conservation efforts for thesustainable management of biodiversity - particularlywithin the context of both organisations’ site relatedactivities.
This report represents the first phase of the biodiversityperformance measures project, and provides animportant resource for future work. It also acknowledgesthe growing awareness that conservation organisationsneed to become more accountable for their conservationoutcomes to funding bodies, other stakeholders andsociety in general. The report summarises and reviewsthe key considerations in biodiversity conservationperformance measurement, describes the principalsystems that have been proposed, the advantages anddisadvantages of these and identifies further actions thatcould be taken by businesses and conservation
organisations to develop biodiversity conservationperformance monitoring systems.
We welcome comment and feedback on our progress so far.
Dr Elaine Dorward King, Head of Health, Safety andEnvironment, Rio Tinto Plc
Dr Roger Mitchell, Chief Scientist, Earthwatch Institute,Oxford, UK
Rio Tinto Plc
Rio Tinto is a world leader in finding, mining andprocessing the earth's mineral resources. The group'sworldwide operations supply essential minerals andmetals that help to meet global needs and contribute toimprovements in living standards.
Major product includes aluminium, copper, diamonds,energy products (coal and uranium), gold, industrialminerals (borax, titanium dioxide, salt, talc and zircon),and iron. Rio Tinto is mainly represented in Australia andNorth America, with significant businesses in SouthAmerica, Asia, Europe and southern Africa.
For more information: www.riotinto.com
Earthwatch Institute
Earthwatch Institute, founded in 1971, is an internationalnon-governmental organisation. Earthwatch has offices inthe USA, UK, Australia and Tokyo and has 150 scientificfield research projects in 50 countries. Through theseprojects, Earthwatch engages people worldwide inresearch and education to promote the understandingand action necessary to conserve the diversity andintegrity of life on earth to meet the needs of current andfuture generations. To achieve this, Earthwatch works witha wide range of partners, including individuals,corporations, the education sector, and communityorganisations.
For more information: www.earthwatch.org
1
Photograph: c Steve Gray

Contents
Executive summary 31 Introduction 41.1 Aims and objectives of the study 41.1.1 Overall goal of the project and objectives 41.1.2 Structure of this report 41.2 Background 41.2.1 The need for biodiversity conservation across all sectors 41.2.2 The need for biodiversity accounting and conservation performance
measurements 122 Key considerations in biodiversity conservation performance
measurement 152.1 Introduction 152.2 Why do we need to measure biodiversity conservation performance? 152.3 What is to be measured? 152.3.1 Biodiversity objectives 152.3.2 Indirect and direct biodiversity measures 172.3.3 Indicators 182.4 Where are measurements to take place? 202.5 When are measurements to take place? 202.6 How are measurements to be made and by whom? 203 Approaches, guidelines and proposed indicators 223.1 Introduction 223.2 Generic indicators 273.2.1 The Global Reporting Initiative guidelines 273.2.2 International Council for Mining and Metals good practice guidance 283.2.3 Criteria and indicators for the conservation and sustainable
management of temperate and boreal forests 283.2.4 Conservation International’s Outcome Indicators 293.2.5 Foundations of Success Strategic Indicators Selection System (StratISS) 293.3 Conservation process (response) performance indicators 313.3.1 The Environment Index of Corporate Environmental Engagement 313.3.2 The Australian Benchmarking Biodiversity Conservation Framework 313.3.3 The Nature Conservancy scorecards 323.3.4 World Bank/WWF scorecard for protected areas 323.3.5 Conservation Measures Partnership audits 323.4 Objective specific measures of performance 323.4.1 Logical Frameworks 333.4.2 Energy and Biodiversity Initiative 343.4.3 The World Commission on Protected Areas framework for
assessing management effectiveness of protected areas 353.4.4 World Bank guidelines for monitoring and evaluation for biodiversity
projects 383.4.5 The Nature Conservancy’s Conservation Action Planning system 383.4.6 Conservation Measures Partnership (CMP) Open Standards (CMP 2004) 423.4.7 UK Statutory Common Standards Monitoring 433.4.8 Threat Reduction Assessments 433.4.9 ISO 14301 Environmental Performance Evaluation 444 Conclusions 444.1 Summary of the advantages and disadvantages of the key
approaches for biodiversity conservation performance measurement 444.2 Recommendations for further investigation 454.2.1 Generic issues and requirements 454.2.2 Corporate reporting on net biodiversity impacts 454.2.3 NGO reporting on conservation project performance 465 References 476 Glossary and acronyms 49
Appendices 51Appendix 1. Indicators and potential measures for assessing progresstowards the 2010 biodiversity target 51Appendix 2. Companies that report on biodiversity amongst EarthwatchCERG members and the top 100 of the companies that count 2005 DTI list 52
2

EXECUTIVE SUMMARYBiodiversity is of immense cultural and socio-economicvalue, but is being widely lost and degraded at recordrates as a result of human activities. Various conservationinitiatives have been established to reduce these impacts,but with limited success to date. Consequently it is beingrealised that the conservation of biodiversity is theresponsibility of all sectors of society, and not justenvironmental groups. At the same time, there is anincreasing recognition that there are business benefitswhen corporations take into account business risksassociated with impacts on biodiversity, minimise theseimpacts and provide reliable and transparent reports onthese impacts. For example, the mining company RioTinto has stated that “it recognises the importance of theconservation and management of biological diversity as abusiness and societal issue and aims to have a netpositive impact on biodiversity”.
There is also growing awareness that conservationorganisations need to become more accountable tofunders, other stakeholders and society in general, andstrive to increase the efficiency of their conservation actions.
In response to these developments Earthwatch and RioTinto established a project to identify and developperformance measures to evaluate the outcomes andimpacts of conservation efforts on biodiversity - particularlywithin the context of Earthwatch’s and Rio Tinto’s siterelated activities. This, the resulting report, summarisesand reviews the key considerations in biodiversityconservation performance measurement, describes theprincipal systems that have been proposed, theadvantages and disadvantages of these and identifiesfurther actions that could be taken by businesses andconservation organisations to develop biodiversityconservation performance monitoring systems.
The key considerations in developing a biodiversityconservation performance measurements system arewhat to measure and why, where, when, to and by whom.
Knowing what to measure is of particular importance andis not always straightforward as biodiversity comprisesthe variability among living organisms which makes itimpossible to measure directly. Thus, knowing whatbiodiversity components to measure is very difficultunless performance can be linked to pre-selected andSMART (Specific, Measurable, Achievable, Realistic andTime-specific) objectives.
Ideally measures of conservation should assess theimpacts of actions in relation to the state of certainbiodiversity features. A feature could, for example, includethe population size of a threatened species. Only bymeasuring these can the true impact of actions beassessed. However, performance evaluations should alsoinclude an integrated assessment of responses tobiodiversity conservation needs (i.e. the quantity andquality of actions and processes) and their impacts onpressures on biodiversity (i.e. threats). This enables anassessment of the efficiency of the conservation projector programme and facilitates adaptive management.
State, pressure and response indicators are often used inperformance measurements in an attempt to simplify,quantify and communicate information. However, care
needs to be taken in their application, especially wherebiodiversity performance measures are based onindicators that are selected from generic lists.
Measurements of impacts need to take into account thewhole zone of project impact. Where feasible, measuresof conservation project performance should also assessimpacts on control sites (i.e. representative areas outsidethe influence of the conservation activities) to assessadditionality and displacement effects. Measurementsshould at the very least start at the beginning of a projectand extend over its entire lifetime. However, ideallymeasurements should include a pre-project period toestablish baseline trends in biodiversity and pressures,and extend to long-term monitoring of the entire periodthat the project may influence.
Finally, it is important to consider who should set theconservation objectives to be monitored, who willundertake the measurements and how these will beindependently verified. Where possible all stakeholdersshould be involved in these processes to encourage trustand widespread ownership of results.
The study has found that corporate performancemeasurement systems developed so far are of limiteddirect relevance to corporate needs. This is primarilybecause of the difficulties associated with measuringbiodiversity. Most systems that have been developed orrecommended for biodiversity conservation performancemeasurements have focused on indirect indicators thatmeasure inputs, activities, processes or outputs, rather thanimpacts. Those that do suggest direct indicators of the stateof biodiversity are very broad and ill-defined, and need tobe refined and focused on relevant project-specific issues.
Similarly, most conservation performance measurementsystems either tend to focus on processes or indirectmeasures of performance. Some approaches focus onthe monitoring of project-specific objectives and canprovide clear SMART objectives against which projectscan be assessed. However, in practice, these tend to beexpressed in terms of outputs rather than impacts.
Another important limitation of current performancemeasurements systems is that most tend to be internalself-assessments. Additional independent verification andaudit systems may therefore be needed to ensurecredibility with all stakeholders.
With regard to the conservation performance systemsreviewed and evaluated here it should be possible toadapt and develop some appropriate existing systems forcorporate and conservation NGO reporting by followingsome of the best practice principles of project design andmonitoring identified in the study.
For example, businesses could quantify significantbiodiversity impacts by developing a system based on anexpanded and best practice Environmental ImpactAssessment approach linked to EnvironmentalManagement Systems.
For NGO projects, a conservation performancemeasurement system can be developed, integrated andstandardised with its existing reporting systems. Here theprincipal step would be to ensure that SMART objectivesare set for each project according to the pressure, state,response framework.
3

1 INTRODUCTION 1.1 AIMS AND OBJECTIVES OF THE STUDY
1.1.1 Overall goal of the project and objectives
The Earthwatch Institute and Rio Tinto have established aproject to identify and develop performance measures forevaluating the outcomes and impacts1 of conservationefforts (both successes and failures) on biodiversity in thecontext of, specifically, Earthwatch field research projectsand management interventions on Rio Tinto sites.
This, the resulting report:-
• Summarises the key considerations in biodiversityconservation performance measurements, including thescope of performance measurements (e.g. impacts tobe addressed, on-site and off-site, and downstream andupstream), objective setting (and selection of baselinesand SMART targets), the use of direct and indirectindicators, indicator properties, indicator frameworks, andthe measurement of additionality and displacement effects.
• Describes the principal systems that have been proposedfor the measurement of corporate biodiversity performanceand conservation project performance, including theirmonitoring principles, proposed indicators, monitoringmethods and geographical scope.
• Examines, by desk research and interviews, a numberof case studies where biodiversity conservationperformance measurements systems have beenimplemented. Reports on the extent to which they wereable to objectively measure performance andsummarises their strengths and weaknesses.
• Concludes with a summary of the advantages anddisadvantages of the performance measures that havebeen proposed and used.
• Identifies further actions that could be taken to developbiodiversity conservation performance monitoringsystems for businesses and conservation organisationsas generic example approaches.
The report does not attempt to describe the detailedtechnical issues associated with establishing a biodiversitymonitoring programme, such as selection of measurementsmethods, sampling strategies and data analysis. This isbeyond the scope of this study and is well documented inseveral recent manuals (Elzinga et al. 2001; Goldsmith1991; Hill et al. 2005; Sutherland 1996; Tucker et al. 2005).Nor does the report attempt to provide detailed practicalrecommendations for biodiversity conservation performancemeasurement systems for different types of organisations.This will be the subject of the next part of the study andwill be informed by this report.
The report focuses on direct and indirect measures ofbiodiversity status, and therefore does not review theextensive literature on the wider aspects of sustainabilityand environmental performance reporting etc. It also focuseson project related actions and therefore does not attemptto thoroughly review broader scale regional, national andinternational initiatives for monitoring biodiversity status,although some (e.g. CBD 2010 target indicators) arebriefly discussed where relevant to specific issues.
1.1.2 Structure of this report
This report is for a broad audience, including businessand conservation professionals. Therefore, to provide acommon understanding of the key issues that underpinthe need for this study, this report firstly provides abackground summary of the importance of biodiversityand its current status, business risks associated withbiodiversity, approaches for minimising these risks andimpacts on biodiversity, and finally the need for objectivemeasurements of the impacts of biodiversity conservationmeasures.
Chapter 2 then reviews the key issues that need to beconsidered in developing a biodiversity conservationperformance evaluation system. Key questions includewhat to measure and why, where and when.
Existing guidelines and proposed approaches formeasuring biodiversity conservation performance arereviewed in chapter 3 in relation to relevant key issuesidentified in the previous chapter. Some approaches thathave been put into practice are illustrated with selectedcase studies.
Chapter 4 presents the key conclusions from theforegoing analysis, including a summary of the strengthsand weaknesses of the performance measures that havebeen proposed and used. It also provides some broadgeneric recommendations for developing biodiversityperformance systems, and suggests specific performancemeasures and reporting frameworks.
1.2 BACKGROUND
1.2.1 The need for biodiversity conservation across allsectors
What is biodiversity and why is it valuable?
Biological diversity (or biodiversity for short) has beendefined as “the variability among living organisms from allsources including, inter alia, terrestrial, marine and otheraquatic ecosystems and the ecological complexes ofwhich they are part; this includes diversity within species,between species, and of ecosystems.” (Convention onBiological Diversity, Rio, 1992). Thus biodiversity is adiverse and complex resource, which can lead to confusionregarding its measurement and value (see Box 1.1).
Although often overlooked and underestimated, biodiversityis of immense value to society, and therefore companies,as it forms the basis of a wide range of ecosystemservices that are essential to humankind (see Box 1.2).The total global value of such services has beenestimated to be $33 trillion per annum, which equates to1.3 times the global GDP (Costanza et al. 1997). However,it is important to recognise that biodiversity benefitspeople through more than just its contribution to materialwelfare and livelihoods; it also contributes to security,resiliency, social relations, health, and freedom of choicesand actions.
1In this context outcomes and impacts are synonymous and refer tothe net effects of activities on the state (or condition) of specifictarget biodiversity components.
4
A REVIEW OF BIODIVERSITY CONSERVATION PERFORMANCE MEASURES
The global biodiversity crisis
Despite the moral, cultural and economic reasons forconserving biodiversity and its ecosystem services,biodiversity is being lost and degraded at an unprecedentedrate as a result of human activities. The state of theworld’s ecosystems have recently been assessed in detailby an international team of experts under the MillenniumEcosystem Assessment – MEA (2005), who concludedthat “Human actions are fundamentally, and to asignificant extent irreversibly, changing the diversity of lifeon Earth, and most of these changes represent a loss ofbiodiversity. Changes in important components ofbiological diversity were more rapid in the past 50 yearsthan at any time in human history”. For example, theassessment found that:
• Virtually all of Earth’s ecosystems have now beendramatically transformed through human actions.Although globally, the net rate of conversion of someecosystems has begun to slow, in some instances thisis because little habitat remains for further conversion.
• Across a range of taxonomic groups, the populationsize or range (or both) of the majority of species isdeclining.
• Over the past few hundred years, humans haveincreased species extinction rates by as much as 1,000times background rates that were typical over Earth’shistory.
• The distribution of species on Earth is becoming morehomogenous (through regional losses of taxa and alienintroductions).
• Between 10% and 50% of well-studied highertaxonomic groups (mammals, birds, amphibians,conifers, and cycads) are currently threatened withextinction, based on IUCN – World Conservation Unioncriteria for threats of extinction.
• Genetic diversity has declined globally, particularlyamong domesticated species.
Box 1.1 Biodiversity and its loss - avoiding conceptual pitfalls
Source: Adapted from MEA (2005)
Different interpretations of several important attributes of the concept of biodiversity can lead to confusion inunderstanding both scientific findings and their policy implications. Specifically, the value of the diversity of genes,species, or ecosystems per se is often confused with the value of a particular component of that diversity. Speciesdiversity in and of itself, for example, is valuable because the presence of a variety of species helps to increase theresilience of an ecosystem in the face of a changing environment. At the same time, an individual component of thatdiversity, such as a particular food plant species, may be valuable as a biological resource. The consequences ofchanges in biodiversity for people can stem both from a change in the diversity per se and a change in a particularcomponent of biodiversity. Each of these aspects of biodiversity deserves its own attention from decision-makers, andeach often requires its own management goals and policies.
Second, because biodiversity refers to diversity at multiple scales of biological organisation (genes, populations,species and ecosystems) and can be considered at any geographic scale (local, regional or global), it is generallyimportant to specify the specific level of organisation and scale of concern. For example, the introduction ofwidespread weedy species to a continent such as Africa will increase the species diversity of Africa (more speciespresent) while decreasing ecosystem diversity globally (since the ecosystems in Africa then become more similar inspecies composition to ecosystems elsewhere due to the presence of the cosmopolitan species). Because of themultiple levels of organisation and multiple geographic scales involved, any single indicator, such as species diversity,is generally a poor indicator for many aspects of biodiversity that may be of concern for policy-makers.
5
Photograph: c Luke Dollar

Box 1.2 Biodiversity values for humankind
Source: Adapted from MEA (2005)
*Indicates services that are degraded
Provisioning Services
• Food
a. Crops
b. Livestock
c. Capture fisheries*
d. Aquaculture
e. Wild plant and animal products*
• Genetic resources*
• Biochemical, natural medicines, and pharmaceuticals*
• Fresh water*
Regulating services
• Air quality regulation*
• Climate regulation
• Water regulation
• Erosion regulation*
• Water purification*
• Disease regulation
• Pest regulation*
• Pollination*
• Natural hazard regulation*
Cultural services
• Cultural diversity
• Spiritual and religious values*
• Knowledge systems
• Educational values
• Inspiration
• Aesthetic values*
• Social relations
• Sense of place
• Cultural heritage values
• Recreation and tourism
Supporting Services
• Soil formation
• Primary production
• Nutrient cycling
• Water cycling
Although biodiversity and ecosystem changes occur as aresult of natural causes, current global changes aredominated by five key indirect anthropogenic drivers:demographic, economic, socio-political, cultural andreligious, and scientific and technological. In particular,growing consumption of ecosystem services (as well asthe growing use of fossil fuels), which results fromgrowing populations and growing per capitaconsumption, leads to increased pressure on ecosystemsand biodiversity. Global economic activity increasednearly sevenfold between 1950 and 2000. These drivershave in turn led to direct pressures on biodiversity, themost important of which have been habitat change (suchas land use changes, physical modification of rivers orwater withdrawal from rivers, loss of coral reefs, anddamage to sea floors due to trawling), climate change,invasive alien species, overexploitation and pollution.
The biodiversity impacts have substantial social andeconomic consequences because they result in thedegradation of ecological services. The MEA found thatof the 24 ecosystem services assessed, 15 (or 60%), arebeing degraded (see Box 1.2). These changes will alsobe exacerbated by the loss of genetic diversity, which willaffect the ability of ecological communities to resist orrecover from disturbances and environmental change,including long-term climatic change. Furthermore, theMEA projections and scenarios indicate that these driversand pressures on biodiversity are likely to continue andas a result rates of biodiversity loss are likely to continue,or accelerate, in the future.
As a result, “The M[E]A finds that it is likely that thedegradation of ecosystems and their services could growsignificantly worse during the next 50 years and present asignificant barrier to the achievement of the MillenniumDevelopment Goals, particularly Goal 1 which focuses onpoverty and hunger. Most of the driving forces causing thedegradation of ecosystems are either staying constant orgrowing in intensity, and two - climate change andexcessive nutrient loading - will become major drivers ofchange in the next 50 years” (Walter Reid, Director of theMillennium Ecosystem Assessment, May 18, 2005, UnitedNations, New York, USA).
Responses to the global biodiversity crisis
A number of conservation initiatives have arisen as aresult of longstanding concerns over environmentaldegradation and observed losses in biodiversity,including the Ramsar Convention in 1971, World HeritageConvention in 1972, Convention on Migratory Species(Bonn Convention) in 1979, the Convention on BiologicalDiversity (CBD) in 1992, and a wide range of regionalinstruments and national legislation. However, theseactions appear to have had a limited impact, andtherefore in 2002 the world’s leaders at the World Summiton Sustainable Development in Johannesburg agreed tofurther stimulate efforts on biodiversity conservation bysetting a target for “a significant reduction in the currentrate of loss of biodiversity” by the year 2010. Thisendorsed a previous decision by the Sixth Conference ofParties of the CBD (Strategic Plan, decision VI/26), restatedin the Hague Ministerial Declaration of April 14th 2002.
For the purposes of assessing progress towards the 2010target the 7th CBD Conference of Parties (COP 7) defined
6
biodiversity loss as “the long-term or permanentqualitative or quantitative reduction in components ofbiodiversity and their potential to provide goods andservices, to be measured at global, regional and nationallevels” (CBD Decision VII/30). COP 7 also agreed aframework for evaluating progress towards the target anda list of indicators (see Section 2.3.3 for background onindicators) for immediate testing and possible indicatorsfor development by the Subsidiary Body on Scientific,Technical and Technological Advice (SBSTTA) or WorkingGroups (see Appendix 1). Subsequently, further work hasgone into refining these indicators, most recently at the10th CBD SBSTTA meeting in February 2005 (seeAppendix 1). The indicators recommended immediatetesting and use will be presented and interpreted in thesecond Global Biodiversity Outlook, currently scheduledfor publication in 2006.
The role of business
As the MEA (2005) notes, such biodiversity targets andthe UN Millennium Development Goals will only beachieved if the conservation and sustainable use ofbiodiversity becomes an integral component of sectoraleconomic development (e.g., agriculture, forestry, coastal
zone management). Consequently it is now becomingmore widely recognised that the conservation ofbiodiversity is the responsibility of all sectors of society,and action is required and expected from businesses aswell as governments, conservation organisations andwider society.
There are now some legal requirements for businesses totake biodiversity into account in their operations. Forexample, under the EU Environmental Liability Directive,companies may be liable for biodiversity loss as a resultof pollution or other environmental damage. In the UK,public bodies such as water companies, are now legallyrequired to take positive measures to conserve biodiversityon their land holdings under the Crow Act 2004.
Companies are also increasingly engaging in widerCorporate Responsibility (CR) issues and biodiversityimpacts and other environmental considerations areimportant components of this. It is also being recognisedthat biodiversity issues can pose substantive risks tobusiness (Box 1.3). Consequently, a good environmentalrecord provides a number of significant competitivebenefits, which contribute to business sustainability,profitability and shareholder value, albeit unquantified.
Box 1.3 Seven key biodiversity risks
Source: (ISIS Asset Management 2004b)
• Access to land
Example: Access to new sites is affected by a company’s track record on protecting/restoring biodiversity and water resources.
• Reputation
Example: A biodiversity-related campaign over an issue such as Genetically Modified Organisms or dolphin-friendly tuna, reduces consumer confidence in a brand or company, resulting in lower sales.
• Access to capital
Example: Environmental credit risk is assessed as high due to a company’s poor biodiversity track record or management plans, and cost of capital increases.
• Access to markets
Example: Inability to meet specifications from substantial buyers - such as government departments and agencies for sustainably-sourced raw materials like timber, restricts access to a major market2 .
• Security of supply
Example: Reduction in the quality and availability of essential materials such as fish.
• Relations with regulators
Example: Concerns about a company’s track record on biodiversity management, or lack of confidence in the quality of its biodiversity survey and management plans, leads to permit delays or fines.
• Liabilities
Example: Unforeseen impacts of activities on biodiversity lead to financial liability, even though a company’s regulatory licenses have not been exceeded.
2There is increasing interest in this from the finance sector, e.g. HSBC mining sector investment guidance, IFCperformance standards, equator principle banks.
7
ISIS Assessment Management (ISIS Asset Management2004b) carried out a simple assessment of the exposureof various business sectors to biodiversity risks. The levelof risk facing a sector was considered to be the result ofthe interaction between two dimensions of risk:
1. The proportion of companies in the sector likely to beexposed to biodiversity risks; and
2. The significance of the risks likely to be faced byindividual companies in a sector.
Using a panel of 29 relevant professionals, they assignedeach FTSE Sector to one of three groups:
• Red-zone sectors, where:
• most companies are likely to be exposed tobiodiversity risks; and
• the risks are likely to be significant.
• Amber-zone sectors, where:
• some companies are likely to be exposed tobiodiversity risks; and
• the risks may be significant.
• Green-zone sectors, where:
• fewer companies are likely to be exposed tobiodiversity risk; and
• it is harder to identify how, if at all, biodiversity risksmay significantly affect the companies in these sectors.
Sectors considered to be in the red zone (i.e. at highestrisk) were construction and building materials, electricity,food and drug retailers, food producers and processors,forestry and paper, leisure and hotels, mining, oil andgas, and utilities. However, some extractive industrycompanies, including AngloAmerican, BG Group, BP, RioTinto, Shell and Statoil, are doing well in terms of theirpolicy, management and reporting on biodiversity, andare amongst the best in any sector in doing so (ISISAsset Management 2004a).
Amber zone sectors were beverages, chemicals, financialservices, general retailers, household goods and textiles,personal care and household products, pharmaceuticalsand biotech, support services, tobacco and transport.
The ISIS Investment Management study (ISIS AssetManagement 2004b) also noted a number of importantissues concerning the relationship between companiesand biodiversity, namely:
• Companies have a two-way relationship with biodiversity,encompassing both the impact of companies onbiodiversity, and the impact of biodiversity on companies.
• Companies can have both direct and indirect impactson biodiversity.
• Some companies are dependent on biodiversity, in theform of natural products or ecosystem services. Thismakes them potentially vulnerable to themismanagement of biodiversity by others.
• Each of these factors can lead to risks to business.
• Entire sectors may be categorised as high risk due tothe nature of their business, but individual companiescan mitigate this risk.
As with all business impacts, company exposure tobiodiversity risks can be mitigated: firstly, by the extent towhich the risks are recognised, and secondly, by theextent to which they are properly managed.
Thus companies can play a particularly important role inbiodiversity conservation by adopting appropriate policy,management and reporting measures. For example, ISIS(ISIS Asset Management 2004a) recommendations forextractive companies are:
• Policy: companies should have a specific publicstatement on biodiversity; this statement shouldexplicitly state the company’s position on protectedareas.
• Management: companies should integrate biodiversitywithin their environmental management systems, but atthe same time should publish specific informationabout how biodiversity risks are relevant to theirbusiness and how these are being managed.
• Reporting: companies should identify their progresson biodiversity within their public reporting, andsupport this through reporting progress through targets.
• Long-term risks: companies should work with industry-wide initiatives on biodiversity to identify and mitigatelong-term risks for the sector; in particular, companiesshould assess and report on their exposure to protectedareas including IUCN categories I-IV (IUCN 1994).
Business project impacts
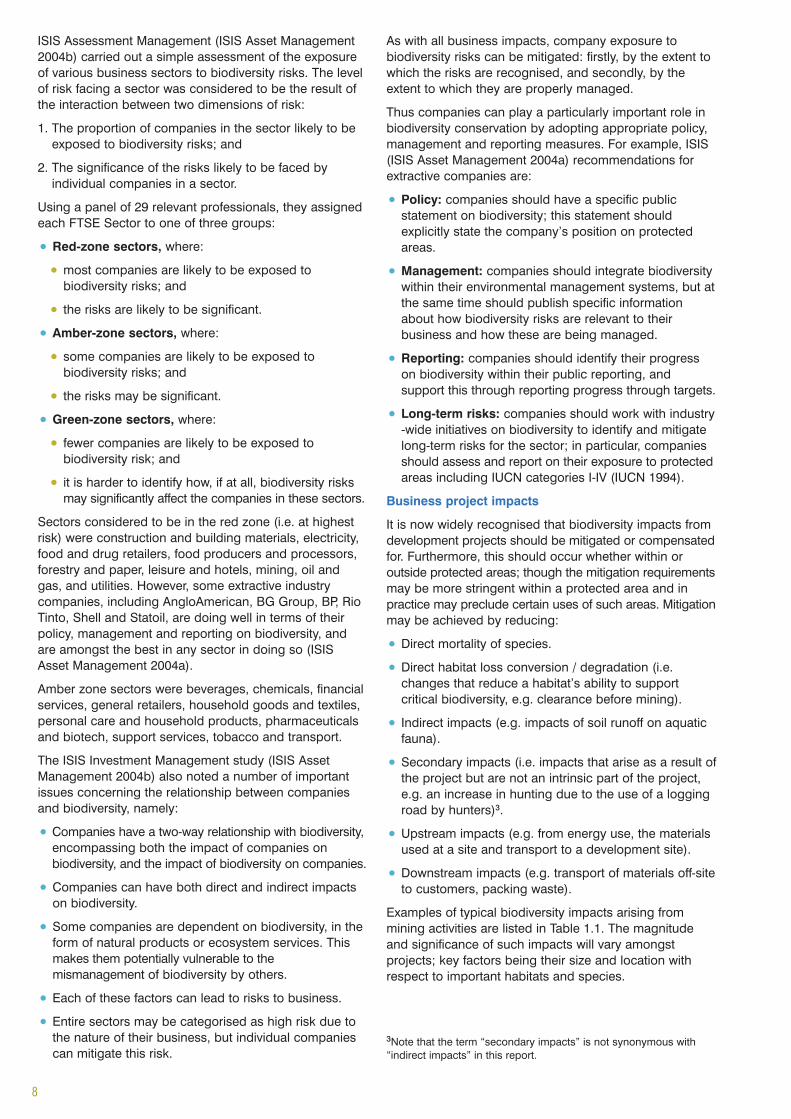
It is now widely recognised that biodiversity impacts fromdevelopment projects should be mitigated or compensatedfor. Furthermore, this should occur whether within oroutside protected areas; though the mitigation requirementsmay be more stringent within a protected area and inpractice may preclude certain uses of such areas. Mitigationmay be achieved by reducing:
• Direct mortality of species.
• Direct habitat loss conversion / degradation (i.e.changes that reduce a habitat’s ability to supportcritical biodiversity, e.g. clearance before mining).
• Indirect impacts (e.g. impacts of soil runoff on aquaticfauna).
• Secondary impacts (i.e. impacts that arise as a result ofthe project but are not an intrinsic part of the project,e.g. an increase in hunting due to the use of a loggingroad by hunters)3.
• Upstream impacts (e.g. from energy use, the materialsused at a site and transport to a development site).
• Downstream impacts (e.g. transport of materials off-siteto customers, packing waste).
Examples of typical biodiversity impacts arising frommining activities are listed in Table 1.1. The magnitudeand significance of such impacts will vary amongstprojects; key factors being their size and location withrespect to important habitats and species.
3Note that the term “secondary impacts” is not synonymous with“indirect impacts” in this report.
8

Table 1.1. Examples of potential biodiversity impacts from mining operations
Source: Partly based on Table 3.1 ICMM (2005)
Impact category/source Location Impact period Reversibility
Direct (i.e. directly attributable to project actions)
Habitat loss from extraction operations and On-site and access Long-term Not usuallysupporting infrastructure (e.g. access roads, land feasiblebuildings, power supplies)
Hydrological degradation of habitats (e.g. from site On-site and off-site Long-term Partlydrainage or impoundments)
Plant mortality from dust deposition On-site and off-site Operation period Usually occurs naturally
Mortality of animals from operations On-site Operation period Population recoverymay occur
Emigration as a result of disturbance (e.g. by noise, On-site and off-site Operation period Population recoveryvibrations and lights) may occur
Mortality of river fauna from toxic effluents in site Usually off-site Variable - Sometimesrun-off depending on
persistence of toxins
Loss of river macrophytes due to increased turbidity Usually off-site Operation and Normally difficultcaused by silty site run-off recovery period if it doesn’t occur
naturally
Indirect (i.e. resulting from other impacts that aredirectly attributable to project actions)
Loss of river fauna resulting from die-off of Usually off-site Operation and Normally difficultmacrophytes (resulting from turbidity) recovery period if it doesn’t occur
naturally
Loss of predators as a result of reduced prey Usually off-site Operation and Feasibleresources (e.g. due to habitat degradation or recovery perioddisturbance)
Increased vegetation browsing due to increases in On-site and off-site Operation and Feasibleherbivores resulting from reduction in predation recovery periodrates (e.g. due to emigration of sensitive predators)
Loss of large animals species as a result of habitat Off-site Operation and Sometimesfragmentation recovery period
Reduced viability of small populations of species Off-site and on-site Operation and Sometimesdue to reduced emigration resulting from habitat recovery periodfragmentation
Secondary impacts (i.e. resulting from actionsthat are not an intrinsic part of the project)
Increased hunting of animals by mining company Off-site Operation period Sometimesstaff and families
Increased logging and forest loss as a result of Off-site Long-term Not usually feasibleimproved access via new roads and humanmigration for job prospecting
Cumulative impacts (i.e. impacts that arise incombination with other projects)
Loss of species requiring large territories Off-site Long-term Feasible, but difficult(e.g. top-level predators) as a result of combinedeffects of habitat loss and fragmentation
9

10
It is generally considered that biodiversity impactmitigation4 should be a hierarchical processincorporating a range of measures at appropriatetimes in the project cycle (ICMM 2005). Projectsshould firstly be planned to avoid impacts (e.g.through sensitive project location), thenminimisation (or reduction) measures should beincorporated to manage risks (e.g. measures toreduce site runoff). Impacted areas and ecologicalprocesses that are significantly impacted may berestored (or rehabilitated) to avoid long-termimpacts. However, many activities (such asmining) inevitably result in some unavoidableresidual impacts. These may be offset 5 (orcompensated for) by, for example, the protection,creation, restoration or enhancement of otherareas of habitat outside the impacted area. Ingeneral, offsets are conservation activities thattake place outside the geographic boundaries ofa development site in order to compensate forunavoidable harm, in addition to any mitigation orrehabilitation that may take place on that site (tenKate et al. 2004). However, some developers ownlarge plots of land and in some circumstances,biodiversity offsets are undertaken on land thatwould not otherwise be managed for conservation,as a way of offsetting development activity onanother part of the plot.
In some cases translocations of species or plantcommunities may be undertaken, which could beconsidered to be measures for avoiding orminimising impacts, but these should be regardedas a form of offset.
Cost-effectiveness does, however, need to betaken into account as impact mitigation measurestypically follow a law of diminishing returns. Thusdecisions need to be made on the levels ofresidual impact that are acceptable on the basisof legislative requirements, cost, business risk andstakeholder views etc. In some cases it may bemore cost-effective, in terms of biodiversitybenefits, to implement offset measures instead ofall feasible mitigation measures.
Some examples of approaches for avoiding,minimising and offsetting mining project impactsare outlined in Table 1.2.
4 In this report mitigation means measures which are anintegral part of a project that are taken to avoid or minimisethe risks or severity of harmful impacts. It does not includeoffsets or compensation.
5 The term offset is defined here as “conservation actionsintended to compensate for the residual, unavoidable harmto biodiversity caused by development projects, so as toensure no net loss of biodiversity” (ten Kate et al. 2004),and is broadly equivalent to compensation, although thelatter may include financial compensation rather than directactions.
Photograph: c Laura Morrison/Earthwatch Institute
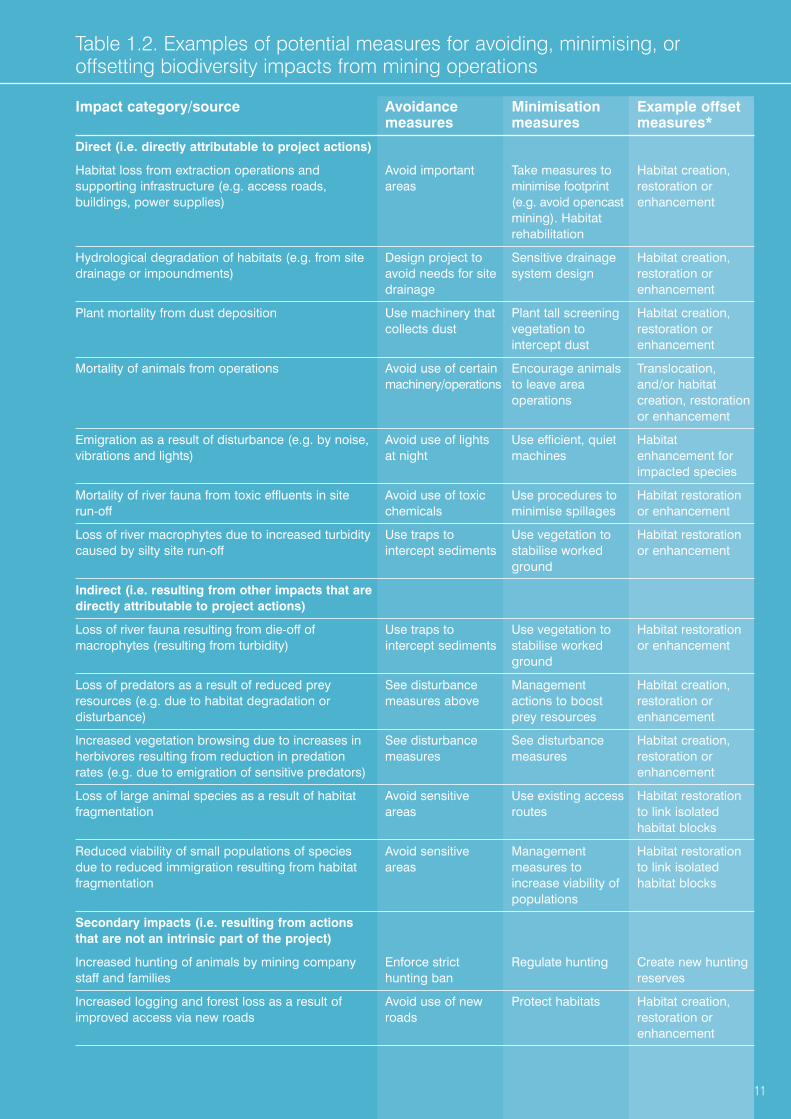
Table 1.2. Examples of potential measures for avoiding, minimising, oroffsetting biodiversity impacts from mining operations
Impact category/source Avoidance Minimisation Example offsetmeasures measures measures*
Direct (i.e. directly attributable to project actions)
Habitat loss from extraction operations and Avoid important Take measures to Habitat creation, supporting infrastructure (e.g. access roads, areas minimise footprint restoration orbuildings, power supplies) (e.g. avoid opencast enhancement
mining). Habitatrehabilitation
Hydrological degradation of habitats (e.g. from site Design project to Sensitive drainage Habitat creation, drainage or impoundments) avoid needs for site system design restoration or
drainage enhancement
Plant mortality from dust deposition Use machinery that Plant tall screening Habitat creation,collects dust vegetation to restoration or
intercept dust enhancement
Mortality of animals from operations Avoid use of certain Encourage animals Translocation,machinery/operations to leave area and/or habitat
operations creation, restoration or enhancement
Emigration as a result of disturbance (e.g. by noise, Avoid use of lights Use efficient, quiet Habitatvibrations and lights) at night machines enhancement for
impacted species
Mortality of river fauna from toxic effluents in site Avoid use of toxic Use procedures to Habitat restorationrun-off chemicals minimise spillages or enhancement
Loss of river macrophytes due to increased turbidity Use traps to Use vegetation to Habitat restorationcaused by silty site run-off intercept sediments stabilise worked or enhancement
ground
Indirect (i.e. resulting from other impacts that aredirectly attributable to project actions)
Loss of river fauna resulting from die-off of Use traps to Use vegetation to Habitat restorationmacrophytes (resulting from turbidity) intercept sediments stabilise worked or enhancement
ground
Loss of predators as a result of reduced prey See disturbance Management Habitat creation, resources (e.g. due to habitat degradation or measures above actions to boost restoration or disturbance) prey resources enhancement
Increased vegetation browsing due to increases in See disturbance See disturbance Habitat creation, herbivores resulting from reduction in predation measures measures restoration or rates (e.g. due to emigration of sensitive predators) enhancement
Loss of large animal species as a result of habitat Avoid sensitive Use existing access Habitat restoration fragmentation areas routes to link isolated
habitat blocks
Reduced viability of small populations of species Avoid sensitive Management Habitat restorationdue to reduced immigration resulting from habitat areas measures to to link isolatedfragmentation increase viability of habitat blocks
populations
Secondary impacts (i.e. resulting from actionsthat are not an intrinsic part of the project)
Increased hunting of animals by mining company Enforce strict Regulate hunting Create new hunting staff and families hunting ban reserves
Increased logging and forest loss as a result of Avoid use of new Protect habitats Habitat creation, improved access via new roads roads restoration or
enhancement
11

Conservation projects
Many businesses also undertake or fund positive biodiversityconservation or restoration measures that are not directlyassociated with specific project impacts as describedabove. Some businesses have the opportunity to manageparts of their holdings in ways that benefit biodiversity(e.g. buffer zones to mining sites or catchments ownedby water companies) or undertake or fund research thatcan help manage biodiversity more effectively. For example,Northumbrian Water and the UK Highways Agency haveproduced Biodiversity Action Plans (BAPs) for all theirlandholdings. Such actions are often undertaken inpartnership with conservation organisations.
Conservation organisations (including governmentalagencies, academic institutions and NGOs) provide animportant role in encouraging and guiding conservationactions (e.g. by businesses, government departments,other landowners and the public) by:
• Monitoring biodiversity and setting protection and actionpriorities for species, e.g. IUCN Red Data lists (IUCN2001) and regional threatened species lists (BirdLifeInternational 2004; Tucker & Heath 1994), habitats (e.g.Tucker & Evans 1997) and sites, e.g. BirdLife’sImportant Bird Areas (Evans 1994; Fishpool & Evans2001; Heath & Evans 2000).
• Conducting ecological research on species and habitats,to identify the causes of species declines and necessarycorrective measures, such as habitat managementneeds or regulation of species exploitation.
• Planning for conservation e.g. BAPs and site biodiversityconservation management plans (CCW 1996; Hirons et al.1995; Ramsar Bureau 2002; Thomas & Middleton 2003).
• Raising capacity for conservation actions throughfundraising, staff training and equipment purchase.
• Awareness raising amongst governments and otherdecision-makers, businesses, landowners and thegeneral public etc.
• Representing public opinion and holding governmentsand companies to account.
1.2.2 The need for biodiversity accounting andconservation performance measurements
Benefits for business
For businesses the transparent and objective measurementof biodiversity impacts and the performance of mitigation
measures, offsets and biodiversity conservation projectsis an essential requirement for establishing success inbiodiversity management and it provides a number ofsignificant benefits, including:
• An incentive for implementation of actions forbiodiversity (a well-known business adage is that “if itdoesn’t get measured it doesn’t get done”).
• Demonstrating compliance with legal requirements(e.g. actions required as part of planning permissionfor a development), or as part of wider corporateresponsibility (e.g. for public bodies in the UK, whichhave a responsibility for encouraging conservation andmanagement of biodiversity on their holdings).
• Demonstrating success with respect to CR reporting(e.g. with respect to GRI) and compliance with publicstatements on biodiversity, e.g. Rio Tinto’s intention tohave a net biodiversity benefit. Thereby proving that anorganisation does what it says – leading to enhancedpublic relations and the benefits listed in Box 1.3.
• Establishing if actions (e.g. a biodiversity offset) lead todesired outcomes, thereby allowing for learning andadaptive management (Holling 1978; Salafsky et al. 2001).
An examination of corporate environmental reportingamongst the Earthwatch Corporate EnvironmentalResponsibility Group members and those listed in the top100 of the Companies that Count 2005 DTI list, shows that20 report on biodiversity performance to some extent(Appendix 2). However, few appear to report quantitativemeasures that can be used to demonstrate a net biodiversityimpact. Similarly, biodiversity impacts did not appear tobe specifically mentioned in KPMG’s “International Surveyof Environmental Reporting” (KPMG 1999). Of particularrelevance to this study, ISIS Assessment Managementfound that 65% of 20 surveyed global extractive companiesdid not have reportable targets for biodiversity.
There is therefore an obvious requirement for a standardsystem that can report a net biodiversity impact objectively,transparently, understandably and cost-effectively. Inother words, the ultimate goal is to develop a system thatcan provide the biodiversity equivalent of audited accounts.Although ambitious, this kind of reporting on ecosystemhealth will become more natural and second nature associety comes to cost environmental externalities (e.g.carbon, water and health benefits) that have traditionallynot been included in accounting sheets.
Table 1.2. Examples of potential measures for avoiding, minimising, oroffsetting biodiversity impacts from mining operations - continued.
Impact category/source Avoidance Minimisation Example offsetmeasures measures measures*
Cumulative impacts (i.e. impacts that arise incombination with other projects)
Loss of species requiring large territories See habitat loss and See habitat loss Habitat creation, (e.g. top-level predators) as a result of combined fragmentation and fragmentation restoration or effects of habitat loss and fragmentation measures measures enhancement
Notes: *In addition to protection of equivalent habitats elsewhere. Usually off-site.
12

Benefits for environmental organisations
Many environmental organisations carry out monitoring ofthe state of various biodiversity components (e.g. speciespopulations at site, national and global levels) and it iswidely recognised that good conservation managementinvolves the monitoring and assessment of activities andimpacts (Hockings 2000; Margoluis & Salafsky 1998; Stemet al. 2005; Woodhill 2000). Despite this, as The NatureConservancy (TNC) notes, conservation organisations aregenerally not as well prepared as the business toarticulate, credibly, their successes and failures(http://www.nature.org/tncscience/strategies/mat.html,accessed 2005). They are often reluctant to objectivelyassess their progress towards their mission andobjectives or to publicly report on these, and what theyhave learned. There are likely to be two principal reasonsfor this. Firstly, conservation progress is difficult tomeasure because of the lag between management actionand the slow response of biological systems. Secondly,organisational cultures often stigmatise mistakes, so thelessons learned from risk taking are not properly valuedand shared (which can discourage decision-makers fromexploring innovative conservation solutions).
However, biodiversity conservation managementperformance is becoming an increasingly important issuefor conservation organisations. This is in part to implementbest practice management systems (e.g. see Figure 1.1)and the increasing recognition of the importance of adaptivemanagement (Holling 1978; Salafsky et al. 2001). Adaptivemanagement extends the well-known plan-do-check-act(e.g. under ISO14001) management system by recognisingthat our knowledge of ecological relationships is incompleteand, therefore, the management of natural resources isalways experimental. It therefore aims to improve ourmanagement effectiveness by studying the impacts ofimplemented activities and learning from these. Thusconservation programmes and projects need to include astepwise process with multiple milestones and manyopportunities for incorporating feedback (Margoluis &Salafsky 1998).
However, another driver of increased performancemeasurement is the increasing attention being given toNGO governance and accountability. Jepson (in press)considers that NGOs look and act increasingly like a morphbetween trans-national corporations and governmentdevelopment agencies, and as a result accountability is
becoming as important an issue to them as other primarysectors in society. Furthermore, according to Jepson,concern has arisen over accountability and governance inthe NGO sector as a result of a number of issues. Ofparticular relevance to biodiversity management performancemeasurement is the growing recognition that, despitenumerous conservation initiatives and massive investmentsin conservation actions over the last 20 years, progress inconservation on the ground has been slow and erratic(Salafsky et al. 2002). As a result some major donors arepressuring NGOs for evidence on how they spend theirmoney, how they learn and how well they have beenachieving their aims (Christensen 2003; Randerson 2003).In the statutory sector there is also an increasing demandfor evidence that good value for money has been achievedwhen public funds have been used for projects.
Jepson concludes that ideally each sector of society shouldbe characterised by a distinct accountability regime, butfaced with calls for greater accountability, there is a riskthat NGOs might apply accountability regimes uncriticallyfrom the business or private sector. Instead NGOs, andthe NGO sector in general, need to develop and debate adistinct and credible accountability regime that strengthensand defines their role in society.
Such issues have resulted in a number of studies ofmeasures of conservation success initiated by conservationorganisations. For example, the Conservation MeasuresPartnership (CMP www.conservationmeasures.org) is apartnership of conservation organisations that arecollaborating to develop and promote common standardsand tools for designing, implementing, and measuring theimpact of conservation actions. Core members includethe African Wildlife Foundation, Conservation International,The Nature Conservancy, Wildlife Conservation Society,and World Wide Fund for Nature/World Wildlife Fund.Foundations of Success (FOS www.fosonline.org)currently serves as the coordinator for this partnership.Further details of CMP outputs are provided in Sections3.2.5 and 3.3.5.
In addition, a related project is being undertaken in theUK by the Cambridge Conservation Forum (CCFwww.cambridgeconservationforum.org), which is aninformal affiliation of conservation organisations in theCambridge area. The project, funded by the MacArthurFoundation, deals with harmonising measures ofconservation success. The ultimate goal of the project is
Plan actions
Implem
ent actionsM
onitoractivitiesandimpac
tsEv
alua
tean
dre
vie
w
Figure 1.1. A simplified management and monitoringcycle
13
Photograph: c Rio Tinto 2006

Table 1.3. Examples of different needs for conservation performance measurements
Assessment purpose Organisation Key audiences
Net global impacts of global conservation measures and CBD, IUCN Governments, global other initiatives in relation to pressures from human public, NGOsactivities and natural changes
Actions, outcomes and impacts of a national Biodiversity Biodiversity Action Plan NationalAction Plan (BAP) Partnership Governments, NGOs and
other BAP Partners
The net impacts of a protected area programme Statutory conservation National governments,(e.g. legislation and management measures) agency conservation agencies
managers and site staff, NGOs
Overall corporate (or business unit) performance in relation Corporations Directors, managers, other to CR commitments and national legislation staff, shareholders,
customers and potential customers
Site-specific assessment of compliance with mitigation Corporations Project managers,requirements according to planning control conditions conservation agencies,
local authorities, NGOs
Assessment of the outcomes and impacts of a specific NGO Project manager, funders,conservation activity (e.g. a campaign) stakeholders
Assessment of the impacts of a conservation programme NGO Directors, managers, staff, funders, media and public
14
to improve conservation practice by identifying successfulapproaches and factors that contribute to their success. Ithas the following specific objectives:
• Develop CCF's own harmonised approaches to measuringconservation success.
• Interact with the CMP in the USA to test and further developtheir measures and compare them with those of CCF.
• Develop a longer term research plan to use theseharmonised tools to assess what factors best predictthe relative success or failure of conservation projects.
It is being carried out in partnership with the members ofCCF through a series of iterative steps, including:
• Compilation of a catalogue of CCF members' existingapproaches to monitoring and evaluation ofconservation projects.
• Analysis of similarities, differences and gaps amongapproaches used for particular types of activities.
• Development of draft harmonised measures for eachactivity type.
• Evaluation of measures using information on specificprojects from CCF members, and revision in the light ofexperience.
• Comparison of measures with those developed byCMP and comparative testing of both sets on new setsof projects from both CCF and CMP members.
• Refinement of proposed measures.
• Development of research questions and a plan ofanalysis based on the harmonised tools developed.
To date a number of workshops and working groupmeetings have been held, which have defined the issuesto be tackled, developed a typology of conservationprojects and activities and started examining possible
common approaches for performance assessment foreach conservation activity type.
The project is therefore of considerable relevance to thisstudy, and although it is not due to report until 2006,informal briefings on findings so far have been providedby the CCF Project Coordinator (Val Kapos). The authorof this report is also a member of the project workinggroup on protected areas.
Information needs
There will be many similarities between biodiversityconservation performance measurement requirementsbetween corporations and conservation organisations.Nevertheless, it is important to realise that performancemeasurement needs will also vary according to theactions being assessed, and the scale of measurementand reporting. The needs will also vary considerablydepending on the audience which may include:
• Directors and senior management
• Project managers
• Project staff (including volunteers)
• Shareholders (private and institutional)
• Conservation project funders/donors
• Government departments/agencies (national and local)
• Customers
• Local communities / NGOs
• The wider general public
Thus an organisation may need to employ a variety ofperformance measures and systems at a range of scales.Some examples of performance measurement requirementsaccording to organisation, scale and audience are givenin Table 1.3. Specific information needs will vary amongst:
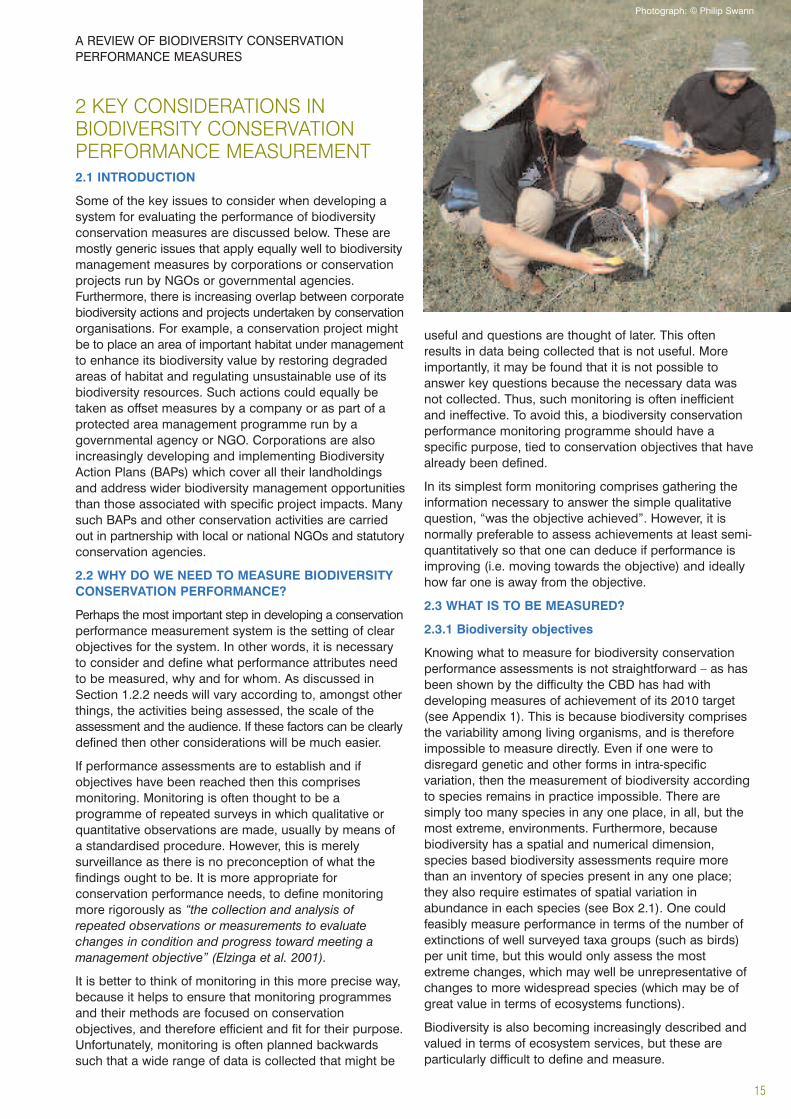
2 KEY CONSIDERATIONS INBIODIVERSITY CONSERVATIONPERFORMANCE MEASUREMENT2.1 INTRODUCTION
Some of the key issues to consider when developing asystem for evaluating the performance of biodiversityconservation measures are discussed below. These aremostly generic issues that apply equally well to biodiversitymanagement measures by corporations or conservationprojects run by NGOs or governmental agencies.Furthermore, there is increasing overlap between corporatebiodiversity actions and projects undertaken by conservationorganisations. For example, a conservation project mightbe to place an area of important habitat under managementto enhance its biodiversity value by restoring degradedareas of habitat and regulating unsustainable use of itsbiodiversity resources. Such actions could equally betaken as offset measures by a company or as part of aprotected area management programme run by agovernmental agency or NGO. Corporations are alsoincreasingly developing and implementing BiodiversityAction Plans (BAPs) which cover all their landholdingsand address wider biodiversity management opportunitiesthan those associated with specific project impacts. Manysuch BAPs and other conservation activities are carriedout in partnership with local or national NGOs and statutoryconservation agencies.
2.2 WHY DO WE NEED TO MEASURE BIODIVERSITYCONSERVATION PERFORMANCE?
Perhaps the most important step in developing a conservationperformance measurement system is the setting of clearobjectives for the system. In other words, it is necessaryto consider and define what performance attributes needto be measured, why and for whom. As discussed inSection 1.2.2 needs will vary according to, amongst otherthings, the activities being assessed, the scale of theassessment and the audience. If these factors can be clearlydefined then other considerations will be much easier.
If performance assessments are to establish and ifobjectives have been reached then this comprisesmonitoring. Monitoring is often thought to be aprogramme of repeated surveys in which qualitative orquantitative observations are made, usually by means ofa standardised procedure. However, this is merelysurveillance as there is no preconception of what thefindings ought to be. It is more appropriate forconservation performance needs, to define monitoringmore rigorously as “the collection and analysis ofrepeated observations or measurements to evaluatechanges in condition and progress toward meeting amanagement objective” (Elzinga et al. 2001).
It is better to think of monitoring in this more precise way,because it helps to ensure that monitoring programmesand their methods are focused on conservationobjectives, and therefore efficient and fit for their purpose.Unfortunately, monitoring is often planned backwardssuch that a wide range of data is collected that might be
useful and questions are thought of later. This oftenresults in data being collected that is not useful. Moreimportantly, it may be found that it is not possible toanswer key questions because the necessary data wasnot collected. Thus, such monitoring is often inefficientand ineffective. To avoid this, a biodiversity conservationperformance monitoring programme should have aspecific purpose, tied to conservation objectives that havealready been defined.
In its simplest form monitoring comprises gathering theinformation necessary to answer the simple qualitativequestion, “was the objective achieved”. However, it isnormally preferable to assess achievements at least semi-quantitatively so that one can deduce if performance isimproving (i.e. moving towards the objective) and ideallyhow far one is away from the objective.
2.3 WHAT IS TO BE MEASURED?
2.3.1 Biodiversity objectives
Knowing what to measure for biodiversity conservationperformance assessments is not straightforward – as hasbeen shown by the difficulty the CBD has had withdeveloping measures of achievement of its 2010 target(see Appendix 1). This is because biodiversity comprisesthe variability among living organisms, and is thereforeimpossible to measure directly. Even if one were todisregard genetic and other forms in intra-specificvariation, then the measurement of biodiversity accordingto species remains in practice impossible. There aresimply too many species in any one place, in all, but themost extreme, environments. Furthermore, becausebiodiversity has a spatial and numerical dimension,species based biodiversity assessments require morethan an inventory of species present in any one place;they also require estimates of spatial variation inabundance in each species (see Box 2.1). One couldfeasibly measure performance in terms of the number ofextinctions of well surveyed taxa groups (such as birds)per unit time, but this would only assess the mostextreme changes, which may well be unrepresentative ofchanges to more widespread species (which may be ofgreat value in terms of ecosystems functions).
Biodiversity is also becoming increasingly described andvalued in terms of ecosystem services, but these areparticularly difficult to define and measure.
15
A REVIEW OF BIODIVERSITY CONSERVATIONPERFORMANCE MEASURES
Photograph: c Philip Swann

Box 2.1 Measuring and estimatingbiodiversity: more than speciesrichness
Source: (Millennium Ecosystem Assessment 2005)
Measurements of biodiversity seldom capture all itsdimensions, and the most common measure - speciesrichness, is no exception. While this can serve as avaluable surrogate measure for other dimensions thatare difficult to quantify, there are several limitationsassociated with an emphasis on species. First, whatconstitutes a species is not often well defined. Second,although native species richness and ecosystemfunctioning correlate well, there is considerablevariability surrounding this relationship. Third, speciesmay be taxonomically similar (in the same genus) butecologically quite distinct. Fourth, species varyextraordinarily in abundance; for most biologicalcommunities, only a few are dominant, while many arerare. Simply counting the number of species in anecosystem does not take into consideration how variableeach species might be or its contribution to ecosystemproperties. For every species, several properties otherthan its taxonomy are more valuable for assessment andmonitoring. These properties include measures ofgenetic and ecological variability, distribution and its rolein ecosystem processes, dynamics, trophic position, andfunctional traits. In practice, however, variability,dynamics, trophic position, and functional attributes ofmany species are poorly known. Thus it is bothnecessary and useful to use surrogate, proxy, orindicator measures based on the taxonomy or geneticinformation. Important attributes missed by species ortaxon-based measures of diversity include:
• Abundance - how much there is of any one type. Formany provisioning services abundance matters morethan the presence of a range of genetic varieties,species, or ecosystem types.
• Variation - the number of different types over spaceand time. For understanding population persistence,the number of different varieties, or races in aspecies, or variation in genetic composition, amongindividuals in a population provide more insight thanspecies richness.
• Distribution - where quantity or variation inbiodiversity occurs. For many purposes, distributionand quantity are closely related and are thereforegenerally treated together under the heading ofquantity. However, quantity may not always besufficient for services: the location, and in particularits availability to the people that need it will frequentlybe more critical than the absolute volume or biomassof a component of biodiversity. Finally, the importanceof variability and quantity varies, depending on thelevel of biodiversity measured, if genetic, populationsor species.
Thus knowing what biodiversity components to measureis very difficult unless performance can be linked tobiodiversity conservation objectives. The definition of suchbiodiversity conservation objectives firstly requires theidentification of the key features to be conserved andmonitored (Box 2.2). Features can consist of e.g. keycomponents, features of exceptional value (Thomas &Middleton 2003), focal conservation targets (TNC 2003,2005) or Valued Ecosystem Components (Treweek 1999).For a company the selected features will need to includethose associated with business risks (e.g. biodiversitycomponents that may influence the granting of licenses tooperate). For conservation organisations, key features arelikely to include threatened, endemic or other ecologicallyimportant habitats and species. However, features shouldbe identified in consultation with all stakeholders (e.g. localcommunities), and take into account the social-economicvalues of biodiversity, and not just scientific issues andnotions of intrinsic value. Such features should thereforeinclude biodiversity components that fulfil importantecosystem functions (Box 1.2) as well as threatenedhabitats and species etc. (see Box 2.2 for examples).
The attributes of each key feature that define their condition(e.g. area, numbers, structure and reproductive success)then need to be identified and measurable targets set foreach of them, again in consultation with stakeholders.Such targets should, where possible, be SMART - i.e.:
• Specific: Objectives must be clear and precise so thatall stakeholders have a consistent understanding ofwhat is planned. For example, an objective such as “toconserve threatened wildlife” would mean manydifferent things to different people. Thus objectivesmust be difficult to misinterpret. It is easier to identifyand plan required actions and assess theirachievement if objectives are specific.
• Measurable: It is vital to be able to clearly determinewhether or not an objective has been reached. This canbe done if measurable units are used to define theobjective. It may be relatively straightforward to setmeasurable objectives for habitat quantity or individualspecies (e.g. by stipulating population size), but it isdifficult to measure some objectives, such as thoserelating to habitat quality. Biodiversity indicators maytherefore be selected to enable measurable targets tobe set (see below).
• Achievable: It must be possible to achieve theobjectives. For example, it would not normally bepossible within the scope of a project to ensure themaintenance of a declining migratory bird population(as it might be declining due to impacts outside thescope of influence). But it would be appropriate to setan objective for its conservation within the areascovered by the project (e.g. in relation to improvementof breeding success).
• Realistic: Objectives should not be aspirational, suchas to reverse all previous forest loss within a region.This might be a suitable long-term vision, but a moresuitable objective for a project might be to reverse 20%of previous loss over the 10 year period in a number ofselected protected areas.
• Time-specific: It is important to set a time period forreaching the objective, to help prioritise and plan actions.
16

Box 2.2 Examples of key biodiversityfeatures that may be the focus ofconservation activities• Globally threatened species (i.e. on IUCN Red Lists).
• Significant populations of rare or otherwise nationallyor regionally threatened species.
• Endemic species or other species that have very highproportions of their biogeographic or globalpopulations within an area.
• Rare or threatened habitats (globally, regionally ornationally).
• Particularly good examples (e.g. large and highlynatural) of characteristic habitats.
• Features with important ecological functions (e.g. keyprey species).
• Features of high socio-economic importance (e.g.forest products, grazing lands or species and habitatsthat attract tourists).
• Features of high cultural importance (e.g. sacredareas or species) or intrinsic appeal.
If further data is required to reliably set appropriatequantitative targets, then preliminary relative targets canbe set (e.g. maintain populations of species X within 10%of current levels) until the necessary baseline data hasbeen collected. It may not, however, always beappropriate to set targets with respect to baseline levels.Levels may instead need to be set in relation to historiclevels or requirements for particular ecosystem services,which are best deduced by consultation with stakeholders.
Target setting needs to be done carefully as poorly settargets may deflect actions from broader priorities or leadto perverse and unintended actions to meet targets. Forexample, some performance measurement systems (seeSection 3.2) use the number of BAPs as an indirectmeasure of achievement. This is a fairly simple and low-cost measure of conservation planning effort. However,the setting of an objective based on this (such as theestablishment of BAPs for all land holdings), might deflectconservation performance away from more practicalpriority actions which may in turn lead to detrimentalbiodiversity impacts. Targets also need to be flexible andreviewed at appropriate intervals to ensure that they arealways appropriate to existing needs.
2.3.2 Indirect and direct biodiversity measures
Ideally measures of conservation performance shouldrelate to direct measures of the State of biodiversity (e.g.habitat area, tree species diversity, species populationsize or index, breeding productivity, survival rate, carbonsequestration rate). Such measures enable directquantitative biodiversity audits to be carried out, of forexample, the impacts of a project, programme or entireorganisation’s activities.
However, monitoring the state of biodiversity is oftendifficult, costly and time consuming, and not surprisingly,many conservation performance systems therefore focuson indirect measures of achievement (see Chapter 3
below). Furthermore, it is also useful to assessperformance in a broader conceptual framework thattakes into account the factors that influence the state ofbiodiversity. A widely used conceptual framework which isparticularly useful for conservation performanceevaluations is the Pressure-State-Response (PSR)framework (Figure 2.1). This was developed by theOrganisation for Economic Cooperation and Development(OECD 1993) to aid analysis of the causes of change inthe natural environment and the response measures ofhuman society to these changes. Subsequently a varietyof variations of this framework have been developedincluding the now widely used Driving Force - Pressure -State - Impact - Response (DPSIR) framework (Rigby etal. 2000).
Figure 2.1. The Pressure – State – Response framework
The Pressure component is an assessment of whatfactors may potentially impact on the biodiversity featurethat influences its state. Examples of such pressures onthe state of important forest habitats could be deforestationfor firewood and timber, pollution, or hunting.
The identification of pressures that may threaten biodiversityis particularly important, and should aim to comprehensivelyidentify, and where possible quantify all pressures on thekey features of biodiversity importance. This shouldincorporate risk assessments for key features, which takeinto account both the probability of impacts and the likelymagnitude of those impacts. Pressures may then beidentified by developing a simple model of theinterrelations between important biodiversity features andtheir influencing factors. This sort of situation analysishelps us to understand what management actions needto be taken, and therefore monitored. For example, Figure2.2 summarises the key pressures influencing a tigerpopulation within an area subject to conservation actions.Further examples and guidance on situation analysis(also known as context analysis) can be found athttp://www.iucn.org/themes/eval/methods.htm
The Response component is an assessment of thepolicies, laws and activities that have been implementedto manage and conserve the biodiversity feature andalleviate or regulate the pressures on it. Designation as aprotected area is one such response, whilst others could
Impacts
Planandimplement
Red
uce/
man
age
Monitor
Pressure
Response State
17

be tree planting programmes, awareness activities andhunting regulations.
Detailed examination of responses enables an evaluationof performance to be carried out, which assessessuccess in terms of goal achievement in relation to pastdecisions and quality of performance, and thendisseminates findings and recommendations to managersand other stakeholders. Thus evaluations should gobeyond the monitoring of substantive criteria for successand should consider the processes used, to assess theefficiency of the conservation project or programme(Kleiman et al. 2000; Stem et al. 2005). As Kleiman et al.point out, a project may meet its scientific goals, but doso inefficiently or with negative secondary effects, such asloss of local support, inter-organisational conflict, ornegative effects on non-target biodiversity components.
In some environmental monitoring frameworks (e.g.DPSIR) Driving Forces are also identified as factors thataffect the magnitude and direction of pressures. They areusually broad socio-economic factors that are beyond theinfluence of conservation management actions, such aspopulation level or demand for specific resources. Thusthey do not normally fall within the scope of conservationperformance measurements systems, but the collation ofdata on such factors can help place assessments incontext of wider environmental and societal changes. Inother words, although it may not be possible to influencesuch broad changes, it is useful to understand them.
A similar conservation model has been proposed by(Margoluis & Salafsky 1998) (1998) in which actors(individuals, organisations, and alliances and networks)take actions (protection and management, laws andpolicy, education and awareness, and incentive changes)that influence threats (indirect, external direct and internaldirect) that impact on biodiversity conservation targets.Using these terms they define conservation success not
only in terms of a biological target, but also the absenceof current and future threats and the presence of actorsthat can take actions (i.e. have the capacity) to effectivelycounter potential threats.
In practice, even measurement of pressures/threats onkey biodiversity features is difficult and costly. Furthermore,it is often impossible to attribute the impact of conservationactions on pressures as the actions will be one of a numberof interacting influences that may lead to cumulative orsynergistic impacts. For this reason, many schemes formeasuring conservation performance have focused, oftenexclusively, on monitoring conservation responses, i.e.processes and actions (i.e. implementation performanceindicators) rather than biodiversity outcomes (i.e.performance impact indicators).
Such response measures can be subdivided into:
• Inputs (principally money and time)
• Activities (e.g. number of biodiversity conservationawareness workshops held)
• Processes (e.g. the quality of the awareness workshop)
• Outputs (e.g. number of senior governmental staff nowaware of the importance of biodiversity conservation asa result of the workshops)
• Impacts or outcomes (e.g. the improvement in thestatus of biodiversity as a result of the influence ofworkshop-trained government staff – which is normallyimpossible to measure).
2.3.3 Indicators
As previously discussed, the monitoring of biodiversity isextremely difficult as there is no simple and acceptedcurrency for measuring biodiversity. Biodiversityindicators are therefore often used in biodiversityobjective setting and performance measurements.
Tiger population
Figure 2.2. A hypothetical example of a Pressure-State model for a tigerpopulation
Illegal logging Habitat condition
Hunting Prey numbers
Disturbance
Retaliatory killing due tolivestock predation
Poaching
Livestock predation by tiger
Tourist numbers
18
Livestock numbers

Biodiversity indicators are quantified information on bioticor abiotic features that reflect to some degree the state ofan ecosystem, habitat or other components of biodiversity.Such indicators aim to fulfil three basic functions:
• Simplification;
• Quantification; and
• Communication.
The objective is to use a limited number of indicators, sothat key conclusions are apparent. The challenge is tostrike a balance - the number of indicators should be assmall as possible to minimise data collection requirementsand costs and so that the main messages are clear, but atthe same time the issues must not be oversimplified orunreliable. Using the terminology of Rowell (1994), theymay act as:
• Ecological indicators, where the presence of one ormore species provides information about theenvironment. The basic logic is that the environmentdetermines the distribution and abundance oforganisms, so that the patterns and size of populationscan provide information about the environment. Forexample, macro-invertebrates are widely used tomonitor water quality, e.g. by the Environment Agencyin the UK (Hellawell 1986).
• Evaluative indicators, e.g. where indicators are usedto estimate the conservation value of a site, or habitatquality, because they are considered to be correlatedwith factors perceived to be of value.
• Performance indicators are used as a means ofdescribing and where possible quantifying in measurableterms the objectives of strategies, action plans andprojects. It is intended that they provide the means tojudge performance in achieving the aims of a strategyor plan (e.g. CBD 2010 target – see Appendix 1).
Some important properties of effective indicators arelisted in Box 2.3.
However, there are a number of limitations that oftenresult in their inappropriate application. This is especiallythe case where biodiversity performance measures arebased on indicators that are selected from lists that maynot be appropriate. In a review of nature indicators (i.e.biotic and abiotic factors that measure the state ofbiodiversity and the quality of ecosystems) NERI (1995)identified a number of limitations on their use (Box 2.4).
One of the most important considerations with the use ofindicators is that they should follow from conservationobjectives, and should not take over or drive objectives.For example, a conservation objective might be to
Box 2.3 Criteria for effective indicatorsSource: (Millennium Ecosystem Assessment 2005)
An effective ecological indicator should:
• Provide information about changes in importantprocesses.
• Be sensitive enough to detect important changes butnot so sensitive that signals are masked by naturalvariability.
• Be able to detect changes at the appropriate temporaland spatial scale without being overwhelmed byvariability.
• Be based on well-understood and generally acceptedconceptual models of the system to which it is applied.
• Be based on reliable data that is available to assesstrends and is collected in a relatively straightforwardprocess.
• Be based on data for which monitoring systems are inplace.
• Be easily understood by policy-makers.
Box 2.4 Limitations in the use ofnature indicatorsSource (NERI 1995)
1. Quality of the data: the data relating to the natureindicators has to be of high quality, e.g. data must becollected using standard methods. These methodshave to be independent of the observer and factorssuch as seasonal variation, weather etc. whensampled under conditions specified in the methodology.
2. Selection and evaluation: the relationship betweenthe condition of the ecosystem and their effects uponselected nature indicators have only rarely beendemonstrated or tested in the past (Furness et al. 1993;Rowell 1994). As a result the selection, prioritization,and evaluation process must incorporate an objectivequality test to prove that the selected nature indicatorunambiguously reflects the specific changes in theecosystem for which it was chosen as an indicator.Many nature indicators already in use may prove tohave limitations, when evaluated by further research.
3. Optimal condition: nature indicators should theoreticallybe related to a pre-defined ‘natural’ or a subjectivestate which the ecosystem should be managed towards.Such is the extent to which Man has modified manynatural systems that the assessment of the pristinecondition of ecosystems depends on, for example,interpretations of pollen diagrams and subfossils and isusually poorly known. Optimal conditions of ecosystemsdependent on human activities or interference may beeasier to assess. However, as nature is dynamic thequestion of assessing the ‘natural’ condition is highlycomplicated, as the changes in pristine ecosystemcondition in time and space has to be taken intoconsideration as well as the likeliness of attaining the‘optimal state' in a Man-managed environment. Theseconsiderations have also been taken into account inthe Dutch AMOEBA-approach (ten Brink et al. 1991).
4. Scale: like any monitoring activity, monitoring of natureindicators needs to be long-term. If the period ofmonitoring time is short, the observed trends may notbe statistically significant. Similarly, some natureindicator data needs to be collected over a widegeographical range and on a very large scale to givereliable information. The question of scale is verymuch dependent on the indicator in consideration.Some indicators may have limited value, if large-scalefieldwork is needed to obtain reliable data and, thus,is not cost-effective.
19

maintain habitat quality in an area of forest. But the definitionand measurement of quality is difficult. Therefore, it mightbe agreed that an appropriate ecological indicator of habitatquality is macro-moth diversity. However, one should notthen focus conservation actions on measures that conservemoths. Instead one should aim to take actions that maintainall valued attributes of the forest (e.g. dominance by nativespecies, tree diversity, structural diversity, presence of deadwood, intact soils, nutrient cycling) and only measure theoverall impacts of conservation activities via the mothindicator.
2.4 WHERE ARE MEASUREMENTS TO TAKE PLACE?
Measurements will normally need to take place within theareas (or population of people) that are affected by theconservation activities in question. This typically involvessome form of survey (whether by census or sampling).However, where conservation performance measurementsare being carried out with respect to impacts of mining ordevelopment project etc, then measurements need totake into account the whole zone of project impact (whichmay be many miles from the site itself) in accordancewith best practice Environmental Impact Assessments(EIAs). This is to enable benefits from biodiversityconservation actions to be compared with detrimentalimpacts from the mining or development operations.
Control sites (i.e. representative areas outside the influenceof the conservation activities) should also ideally bemonitored to assess additionality and displacement effects.Additionality is the extent to which the conservation activityprovides a benefit beyond what would have occurred inthe absence of the project (i.e. a counter-factualassessment). For example, the designation of protectedareas often has low additionality because many of them arepurposefully placed in areas that are remote, inaccessible(e.g. steep mountain sides) or of low economic value. Suchareas are at a relatively low risk of development andtherefore protection provides relatively little benefit.
Conservation actions may sometimes merely displaceharmful activities to other areas. For example, it has oftenbeen claimed that fishing and hunting reserves do not resultin decreases in fishing or hunting pressure because thefishers and hunters simply move to other areas and exploitthese more intensively, thus resulting in no net benefit.However, the issue is complex because the spatial variationin exploitation can be a significant factor influencing biodiversityimpacts. In some cases the establishment of fishing reserveshas been shown to be successful despite no overall declinein fishing effort, because the reserves have provided safehavens where fish populations can recover and spawn moresuccessfully, leading to higher recruitment levels andemigration that help to restock the fished areas. On the otherhand, there are scenarios where displacement of huntersand fishers may increase exploitation to unsustainable levels.
Despite the importance of measuring conservationadditionality and possible displacement impacts, monitoringof control sites / populations is rarely carried out in practice.This is primarily due to the practical difficulties and extratime and cost of measuring control sites. It is also oftenvery difficult to find appropriate control populations. Forexample, many conservation actions focus on the lastremaining areas of high quality habitat. Thus it is notpossible to find analogous areas of high quality habitat
that are not subject to conservation actions. Nevertheless,in many cases controls could be set up to assessconservation performance, and their absence may bebecause there is little incentive for organisations tomonitor this aspect of their performance.
2.5 WHEN ARE MEASUREMENTS TO TAKE PLACE?
At the very least performance measurements should startat the beginning of the project (i.e. before project activitieshave any significant influence on the state of biodiversityor pressure affecting it) and continue over the projectlifetime (irrespective of land ownership and managementresponsibilities etc). This enables the establishment of abiodiversity baseline against which performance may bejudged. However, as ICMM (2005) recommends, it isadvantageous to have earlier assessments of pressuresand the state of biodiversity within impacted areas (bothconservation project impacted and development projectimpacted). Such Before-After Control-Impact (BACI)designs enable assessments of performance against ano-project scenario to be made. For example, a project toconserve fish populations may find that after 5 years ofconservation actions populations have declined by 10%compared to baseline levels. This might imply a projectfailure if the objective was to maintain population levels.However, prior baseline monitoring might have revealedtrends that indicated that over fishing was likely to havedriven the fish to extinction within 5 years. Compared tothis the project has been a partial success. For furtherinformation on BACI and related monitoring designs seeUnderwood (1993) and Smith (2000).
Another important consideration is the length of time thatmonitoring should extend beyond the end of projectactivities. Ideally this should include the time span overwhich the project may be expected to have an influenceon biodiversity. In most cases projects would at least beaiming for long-term impacts and ideally indefiniteimpacts (through capacity building and establishment ofsustainability). Unfortunately though, most projects ceasemonitoring outcomes and biodiversity impacts at the endof the project or, at best, a few years later.
2.6 HOW ARE MEASUREMENTS TO BE MADE AND BYWHOM?
In most situations conservation performance assessmentsare made or paid for by those responsible for theconservation actions. This reinforces the need to involveproject staff and managers in the design of performancemonitoring and evaluation systems, including the settingof objectives, selection of indicators and measurementmethods etc. However, this can lead to potential conflictsof interest, and hence problems of accountability,especially when conservation outcomes have significantfinancial or credibility impacts on the organisationinvolved. For example, further NGO donor funding maydepend on achieving clear conservation benefits fromconservation projects, governments are expected toachieve high levels of cost-effectiveness and companiesmay be at risk of project delays or fines if mitigation oroffset measures fail to deliver agreed objectives.
To avoid such conflicts of interest, many governmentalconservation programmes are monitored and assessedby independent consultants. For example, in the UK Agri-environment schemes have been monitored by teams
20

Box 2.5. An outline of the important steps in an environmental impact assessment
Source: (based on Glasson et al. 1999).
NB. Although this implies a linear process, EIA in practice is iterative, with feedback and interaction amongst the variousstages. EIA is also more effective if it includes frequent public consultations and participation with key stakeholdersthroughout (not just at the end).
Stage Function
1. Project screening Identifies projects that may have significant environmental impacts and therefore require an EIA. Usually guided by EIA regulations identifying categories of project requiring EIAs.
2. Scoping Identifies likely significant issues based on proposal’s possible impacts and characteristics of the affected environment. Sets out proposed methodology and timeframe.
3. Consideration of alternatives Ensures that the proponent has considered other feasible approaches, including alternative project locations, scales, processes, layouts, operating conditions and the ‘no project’ option.
4. Description of the project Clarification of the purpose and rationale of the project, and an understanding of its various characteristics - including stages of development, location and processes.
5. Description of the environmental baseline Establishes the present state of the environment and predicts the future state in the absence of the project taking into account likely changes from natural events and human activities.
6. Identification of main impacts Identifies (based on the previous steps) all potentially significant beneficial and detrimental environmental impacts.
7. Prediction of impacts Predicts the environmental changes resulting from the project: specifies their type, magnitude, duration and extent with respect to the baseline environment without the project.
8. Evaluation and assessment of impact Assesses the relative significance of predicted impacts to allow significance focus on main adverse impacts. Carried out iteratively taking into
account mitigation measures in Stage 9 to identify residual impacts.
9. Recommendations for mitigation Introduces measures to avoid, reduce, remedy or compensate for any significant adverse impacts identified in Stage 8.
10. Public consultation and participation Aims to ensure the quality, comprehensiveness and effectiveness of the EIA, and that the public’s views are adequately taken into consideration in the decision-making process.
11. Environmental Impact Statement (EIS) Presents the results of the EIA.
12. Review of the EIS A systematic appraisal of the quality of the EIS, as a contribution to the decision-making process.
13. Decision making Consideration of the EIS (including consultation responses) and other material considerations by the relevant authorities.
14. Post-decision monitoring Monitoring of aspects of the environment after a decision to proceed: contributes to effective project management.
15. Auditing and follow-up Comparison of actual outcomes with predicted outcomes. Used to assess the quality of predictions and the effectiveness of mitigation. A vital step in the EIA learning process.
headed by the Centre for Ecology and Hydrology (CEH)and the Agricultural Development Advisory Service (ADAS).Environmental and nature conservation projects under theEU LIFE Programme, worth over 70 billion Euros since 1992,have been evaluated by a team of independent consultantswho advise the European Commission staff on each project’sperformance with respect to their stated objectives. To addressthe increasing NGO accountability issues raised by Jepson(in press) discussed previously, it is likely that NGOs willincreasingly need to ensure that performance assessmentsare carried out or audited by independent bodies.
Under the EU’s EMAS participating companies have tohave their environmental statements verified every threeyears by external verifiers.
EIAs of development projects are now routinely carriedout by consultants according to national EIA legislation(now in most countries) and international guidelines, suchas the CBD guidelines (seehttp://www.biodiv.org/doc/meetings/sbstta/sbstta-09/information/sbstta-09-inf-18-en.pdf). Project EIAtypically involves the steps as outlined in Box 2.5. These
21

22
fairly standard procedures, which should involvestakeholder consultations and public scrutiny, help toensure that impacts are now adequately identified andquantified. The success of mitigation measures andoffsets is then often assessed by the appropriateauthorities (often via consultants), though in manysituations the developer’s consultants are given theresponsibility of assessing performance. Some mitigationrequirements may also be directly monitored by thedeveloper (e.g. discharges) as a part of their EnvironmentalManagement System (EMS).
For such reasons conservation performance managementsystems should involve some form of fully independentaudit, whether they are carried out by NGOs, governmentsor corporations’ departments. Some conservation projectand programme audit criteria and systems have recentlybeen developed for such purposes, e.g. by the ConservationMeasures Partnership (CMP), although the results ofthese have not been publicised.
A further important issue is who should monitorsecondary impacts? Secondary development impacts(e.g. increases in hunting pressure following improvedaccess) may not be monitored by developers or others(and become ‘orphans’) if not identified in advance andincluded in monitoring programmes and EMS.
3 APPROACHES, GUIDELINES AND PROPOSEDINDICATORS
3.1 INTRODUCTION
A range of approaches have been proposed for biodiversityconservation performance measurement, and some
guidelines and indicators have been developed byvarious organisations that attempt to standardise CRreporting on biodiversity and performance measurement.A selection of those that are most relevant to this studyare summarised in Table 3.1 and some are furtherdescribed below, grouped according to whether they areprimarily based on generic pressure, state, responseindicators, conservation process (response) indicators orobjective-specific monitoring. In some cases, where theguidelines and systems have been put into operation,examples of their application are provided in the appendices.
A more comprehensive list of publications relating to themonitoring and evaluation of conservation programmesand projects can be obtained from the Foundations ofSuccess M&E database athttp://fosonline.org/Site_Page.cfm?PageID=19. Thedatabase includes an assessment of each publication’sutility for conservation practitioners, quality of conceptsand quality of tools with respect to monitoring andevaluation (M&E) purposes. Stem et al. (2005) alsoprovide a review of many of the M&E related publicationsheld in the database.
Further information on sustainability indicators can befound in the International Institute for SustainableDevelopment (IIED) Compendium of SustainableDevelopment Indicator Initiatives available athttp://www.iisd.org/measure/compendium/. However,most of the publications and environmental indicatorsdiscussed there relate to broad and high-level issues thatare not directly relevant to this review.
Photograph: c Robert Thomson

Tabl
e 3.
1. S
umm
ary
of a
ppro
ache
s fo
r bio
dive
rsity
con
serv
atio
n pe
rform
ance
mea
sure
men
t
Key
:P
SR
: Pre
ssur
e, S
tate
, Res
pons
e m
easu
rem
ents
add
ress
ed b
y sy
stem
.
Ap
pro
ach
es m
arke
d in
bo
ld a
re d
escr
ibed
fur
ther
bel
ow
.
Typ
e /
title
PS
RD
escr
iptio
nA
dva
ntag
esD
isad
vant
ages
The
Sus
tain
abili
tyP
SR
Cor
pora
te s
usta
inab
ility
rep
ortin
g fra
mew
ork,
with
prin
cipl
es fo
rS
tand
ardi
sed
glob
al s
yste
m, a
llow
sIn
dica
tors
are
poo
rly d
efin
ed a
nd
Rep
ort
ing
Gui
del
ines
repo
rtin
g an
d lis
t of r
ecom
men
ded
gene
ric in
dica
tors
(in
clud
ing
som
e co
mpa
rison
bet
wee
n m
ostly
indi
rect
mea
sure
s of
impa
ct.
(GR
I 20
02)
biod
iver
sity
).co
mpa
nies
.M
any
likel
y to
be
of li
ttle
prac
tical
va
lue.
ICM
M G
oo
d P
ract
ice
PS
RIn
clud
es g
uide
lines
on
repo
rtin
g, u
se o
f ind
icat
ors
and
need
to s
et s
ite
Min
ing
spec
ific
advi
ce, i
nclu
ding
Ove
rall
guid
ance
is r
athe
r va
gue
and
Gui
dan
ce f
or
Min
ing
spec
ific
obje
ctiv
es, b
ut li
nkag
e be
twee
n in
dica
tors
and
obj
ectiv
es is
usef
ul a
dvic
eon
impo
rtan
ce o
fm
ight
enc
oura
ge th
e se
lect
ion
of a
an
d B
iod
iver
sity
clea
r. In
clud
es a
list
of p
oten
tial i
ndic
ator
s.se
tting
site
spe
cific
obj
ectiv
es.
broa
d ra
nge
of in
appr
opria
te
(ICM
M 2
005)
indi
cato
rs.
Mo
ntre
al P
roce
ssP
SA
n in
tern
atio
nal c
ompr
ehen
sive
fram
ewor
k of
crit
eria
and
indi
cato
rsS
tand
ardi
sed
inte
rnat
iona
l crit
eria
.M
ost i
ndic
ator
s ar
e po
orly
def
ined
in
dica
tors
for
tem
pera
tefo
r us
e by
gov
ernm
enta
l pol
icy-
mak
ers.
Incl
udes
a s
tand
ard
and
wou
ld b
e di
fficu
lt to
sta
ndar
dise
and
bo
real
fo
rest
sse
t of b
iodi
vers
ity in
dica
tors
.an
d us
e in
pra
ctic
e.
Co
nser
vatio
nS
Six
qua
ntita
tive
indi
cato
rs fo
cuss
ing
on e
xtin
ctio
ns a
void
ed, a
reas
S
impl
e sy
stem
focu
sed
on k
ey
Sim
plis
tic a
nd o
verlo
oks
man
y In
tern
atio
nal’s
out
com
epr
otec
ted
and
ecol
ogic
al c
orrid
ors
crea
ted
/ m
aint
aine
d.
biod
iver
sity
con
serv
atio
n is
sues
.im
port
ant a
spec
ts o
f bio
dive
rsity
in
dic
ato
rsan
d ha
bita
t qua
lity.
Mea
sure
men
ts
may
be
diffi
cult.
Str
ateg
ic I
ndic
ato
rsP
SR
A c
ompu
ter-
base
d to
ol, b
eing
dev
elop
ed b
y FO
S, t
o he
lp c
onse
rvat
ion
Unc
erta
in a
s un
der
deve
lopm
ent
Unc
erta
in a
s un
der
deve
lopm
ent
Sel
ectio
n S
yste
mm
anag
ers
sele
ct th
e m
ost a
ppro
pria
te in
dica
tors
to m
easu
re th
e (S
trat
ISS
)im
pact
of c
onse
rvat
ion
inte
rven
tions
.
The
Env
iro
nmen
t In
dex
RC
heck
lists
are
use
d in
a s
impl
e fo
ur s
tage
fram
ewor
k fo
r pe
rform
ance
Sim
ple
self-
asse
ssm
ent t
hat
Doe
s no
t mea
sure
act
ual o
utco
mes
/o
f C
orp
ora
tem
easu
rem
ent a
nd r
epor
ting
rela
ting
to th
e ty
pica
l sta
ges
of c
ompa
ny
enco
urag
es g
ood
prac
tice
impa
cts
Env
iro
nmen
tal
busi
ness
man
agem
ent,
cove
ring
stra
tegi
c re
view
, pla
nnin
g, c
ontr
ol
Eng
agem
ent
and
mea
sure
men
t of c
ore
proc
esse
s, a
nd p
ublic
rep
ortin
g of
bu
sine
ss p
erfo
rman
ce.
The
Insi
ght I
nves
tmen
tR
Pro
vide
s a
fram
ewor
k fo
r th
e an
alys
is o
f com
pani
es’ p
erfo
rman
ceS
impl
e se
lf-as
sess
men
t tha
t D
oes
not m
easu
re a
ctua
l out
com
es /
Bio
dive
rsity
Ben
chm
ark
agai
nst a
set
of c
riter
ia th
at a
im to
det
erm
ine
stan
dard
s of
pra
ctic
e en
cour
ages
goo
d pr
actic
eim
pact
sac
ross
the
four
ele
men
ts o
f gov
erna
nce
stru
ctur
es, p
olic
y an
d st
rate
gy,
man
agem
ent a
nd im
plem
enta
tion
and
assu
ranc
e.
23

Typ
e /
title
PS
RD
escr
iptio
nA
dva
ntag
esD
isad
vant
ages
The
Bio
dive
rsity
RTh
e B
ench
mar
k is
a c
ertif
icat
ion
proc
ess
that
ass
esse
s pe
rform
ance
Sim
ple
self-
asse
ssm
ent t
hat
Doe
s no
t mea
sure
act
ual o
utco
mes
/
Ben
chm
ark
(The
Wild
life
acco
rdin
g to
a tw
o-st
age
proc
ess:
a s
elf-a
sses
smen
t aga
inst
enco
urag
es g
ood
prac
tice,
follo
wed
im
pact
sTr
usts
) pe
rform
ance
10
sets
of c
riter
ia, a
nd a
n in
depe
nden
t ass
essm
ent.
up b
y in
depe
nden
t ass
essm
ent.
The
Aus
tral
ian
RM
easu
res
the
perfo
rman
ce o
f cou
ncils
, in
rela
tion
to 5
ben
chm
arks
. S
impl
e se
lf-as
sess
men
t tha
t D
oes
not m
easu
re a
ctua
l out
com
es /
B
ench
mar
king
Req
uire
s th
e de
velo
pmen
t of a
Bio
dive
rsity
Con
serv
atio
n S
trat
egy
enco
urag
es g
ood
prac
tice
and
has
impa
cts
Bio
div
ersi
tyor
Loc
al B
AP,
the
iden
tific
atio
n of
per
form
ance
indi
cato
rs, f
or e
ight
a
requ
irem
ent f
or e
stab
lishi
ng
Co
nser
vatio
nst
anda
rd b
iodi
vers
ity m
anag
emen
t out
com
es (
i.e. r
espo
nse
– pr
oces
s pe
rform
ance
mea
sure
men
ts.
Fram
ewo
rkin
dica
tors
).
The
Nat
ure
RS
ubje
ctiv
e as
sess
men
ts o
f the
impl
emen
tatio
n an
d qu
ality
of
Sim
ple
stan
dard
ised
sys
tem
.S
ubje
ctiv
e as
sess
men
ts, l
ack
of
Co
nser
vanc
yco
nser
vatio
n ac
tiviti
es, c
an b
e us
ed to
ass
ess
perfo
rman
ce a
t a
linka
ge b
etw
een
actio
ns a
nd
sco
reca
rds
mom
ent i
n tim
e, o
r ov
er ti
me.
Sta
ff ca
tego
rical
ly r
ank
diffe
rent
ele
men
tsim
pact
s, lo
ss o
f inf
orm
atio
n on
as
soci
ated
with
sys
tem
s, s
tres
ses,
sou
rces
, str
ateg
ies
and
succ
ess.
com
posi
te o
r av
erag
ed s
core
s.
Wo
rld
Ban
k /
WW
FR
A s
impl
e si
te-le
vel t
rack
ing
tool
to fa
cilit
ate
repo
rtin
g on
man
agem
ent
The
sim
ple
self-
asse
ssm
ent t
ools
Sub
ject
ive
asse
ssm
ents
, lac
k of
sc
ore
card
fo
ref
fect
iven
ess
in M
arin
e P
rote
cted
Are
as.
help
man
ager
s id
entif
y w
here
lin
kage
bet
wee
n ac
tions
and
as
sess
ing
man
agem
ent
they
are
suc
ceed
ing
and
whe
reim
pact
s, lo
ss o
f inf
orm
atio
n on
ef
fect
iven
ess
of
they
nee
d to
add
ress
gap
s.co
mpo
site
or
aver
aged
sco
res,
p
rote
cted
are
aspr
oble
ms
with
com
parin
g ac
tions
of
diffe
ring
impo
rtan
ce.
Ele
phan
t con
serv
atio
nR
Sco
reca
rd a
sses
smen
t of c
onse
rvat
ion
syst
ems
for
natio
nal A
sian
Fo
cuse
s on
qua
lity
of fu
ndam
enta
l D
oes
not m
easu
re im
pact
s. N
ot
scor
ecar
d sy
stem
Ele
phan
t con
serv
atio
n pr
ogra
mm
es (
will
, leg
al fr
amew
orks
, res
ourc
es
proc
esse
s an
d al
low
s co
mpa
rison
of
clea
r if
syst
em is
a g
ood
pred
icto
r Je
pson
ele
phan
t sco
rean
d im
plem
enta
tion
bodi
es)
and
spec
ific
proj
ects
(vi
sion
and
str
ateg
y,pr
ojec
ts, i
ndep
ende
nt o
f typ
e, s
ize,
of
pro
gram
me
/ pr
ojec
t suc
cess
.ca
rd (
Jeps
on &
Can
ney
orga
nisa
tiona
l sys
tem
s, te
am a
nd s
kill,
trac
k-re
cord
and
wid
er im
pact
).bu
dget
and
age
.20
03)
Con
serv
atio
n M
easu
res
RA
n in
depe
nden
t rev
iew
of t
he p
roce
ss o
f con
serv
atio
n ba
sed
on a
set
P
rovi
des
a us
eful
mec
hani
sm fo
r N
ot d
esig
ned
to m
easu
re a
ctua
lP
artn
ersh
ip a
udits
of p
rede
term
ined
sta
ndar
ds b
ased
on
the
CM
P O
pen
Sta
ndar
ds
impr
ovin
g co
nser
vatio
n ac
tions
impa
cts;
aud
it re
sults
are
not
(s
ee 3
.3.5
).an
d le
arni
ng.
publ
icis
ed.
Log
ical
Fra
mew
ork
PS
RA
n an
alyt
ical
, pre
sent
atio
nal a
nd m
anag
emen
t too
l for
pro
ject
pla
nner
sIts
key
adv
anta
ges
are
that
it h
elps
C
an b
e tim
e co
nsum
ing,
mec
hani
stic
A
pp
roac
han
d m
anag
ers,
whi
ch in
volv
es p
robl
em a
naly
sis,
sta
keho
lder
ana
lysi
s,to
pro
vide
a s
tand
ardi
sed
sum
mar
y an
d rig
id (
lead
ing
to m
akin
g de
velo
ping
a h
iera
rchy
of o
bjec
tives
and
sel
ectin
g an
impl
emen
tatio
nof
the
proj
ect a
nd it
s lo
gic,
and
, si
mpl
istic
and
ove
rly r
igid
st
rate
gy. L
ogfra
me
sum
mar
ises
wha
t the
pro
ject
inte
nds
to d
o an
d ho
w,
if ca
rrie
d ou
t cor
rect
ly d
efin
es c
lear
obje
ctiv
es),
may
dow
ngra
de
wha
t the
key
ass
umpt
ions
are
, and
how
out
puts
and
out
com
es w
ill b
eob
ject
ives
and
per
form
ance
qual
itativ
e ob
ject
ives
, ign
ore
mon
itore
d an
d ev
alua
ted.
indi
cato
rs a
gain
st w
hich
pro
ject
unin
tend
ed e
ffect
s an
d
succ
ess
can
be o
bjec
tivel
y as
sess
ed.
disa
gree
men
ts a
nd te
nds
to b
e a
top-
dow
n ap
proa
ch.
24
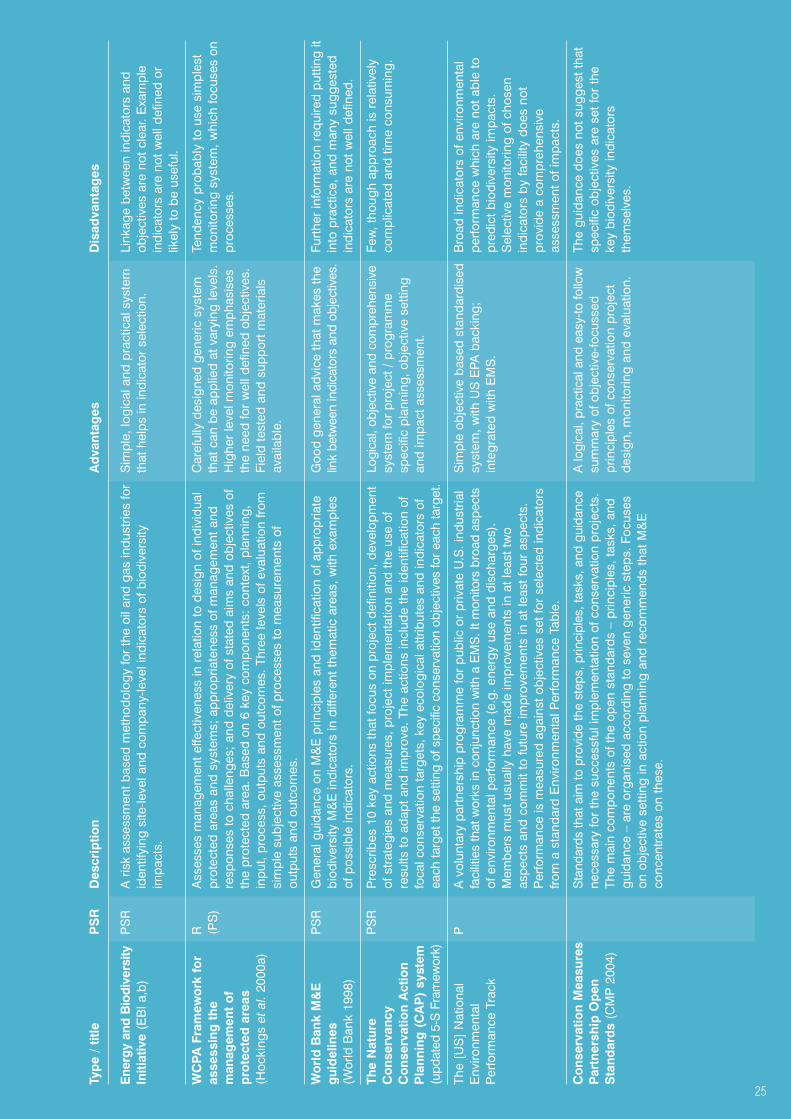
Typ
e /
title
PS
RD
escr
iptio
nA
dva
ntag
esD
isad
vant
ages
Ene
rgy
and
Bio
dive
rsity
PS
RA
ris
k as
sess
men
t bas
ed m
etho
dolo
gy fo
r th
e oi
l and
gas
indu
strie
s fo
r S
impl
e, lo
gica
l and
pra
ctic
al s
yste
m
Link
age
betw
een
indi
cato
rs a
ndIn
itiat
ive
(EB
I a,b
)id
entif
ying
site
-leve
l and
com
pany
-leve
l ind
icat
ors
of b
iodi
vers
ityth
at h
elps
in in
dica
tor
sele
ctio
n.ob
ject
ives
are
not
cle
ar. E
xam
ple
impa
cts.
indi
cato
rs a
re n
ot w
ell d
efin
ed o
r lik
ely
to b
e us
eful
.
WC
PA
Fra
mew
ork
fo
rR
Ass
esse
s m
anag
emen
t effe
ctiv
enes
s in
rel
atio
n to
des
ign
of in
divi
dual
C
aref
ully
des
igne
d ge
neric
sys
tem
Te
nden
cy p
roba
bly
to u
se s
impl
est
asse
ssin
g t
he
(PS
)pr
otec
ted
area
s an
d sy
stem
s; a
ppro
pria
tene
ss o
f man
agem
ent a
nd
that
can
be
appl
ied
at v
aryi
ng le
vels
.m
onito
ring
syst
em, w
hich
focu
ses
on
man
agem
ent
of
resp
onse
s to
cha
lleng
es; a
nd d
eliv
ery
of s
tate
d ai
ms
and
obje
ctiv
es o
fH
ighe
r le
vel m
onito
ring
emph
asis
es
proc
esse
s.p
rote
cted
are
asth
e pr
otec
ted
area
. Bas
ed o
n 6
key
com
pone
nts:
con
text
, pla
nnin
g,
the
need
for
wel
l def
ined
obj
ectiv
es.
(Hoc
king
s et
al.
2000
a)in
put,
proc
ess,
out
puts
and
out
com
es. T
hree
leve
ls o
f eva
luat
ion
from
Fi
eld
test
ed a
nd s
uppo
rt m
ater
ials
si
mpl
e su
bjec
tive
asse
ssm
ent o
f pro
cess
es to
mea
sure
men
ts o
fav
aila
ble.
outp
uts
and
outc
omes
.
Wo
rld
Ban
k M
&E
PS
RG
ener
al g
uida
nce
on M
&E
prin
cipl
es a
nd id
entif
icat
ion
of a
ppro
pria
te
Goo
d ge
nera
l adv
ice
that
mak
es th
eFu
rthe
r in
form
atio
n re
quire
d pu
tting
it
gui
del
ines
biod
iver
sity
M&
E in
dica
tors
in d
iffer
ent t
hem
atic
are
as, w
ith e
xam
ples
link
betw
een
indi
cato
rs a
nd o
bjec
tives
.in
to p
ract
ice,
and
man
y su
gges
ted
(Wor
ld B
ank
1998
)of
pos
sibl
e in
dica
tors
.in
dica
tors
are
not
wel
l def
ined
.
The
Nat
ure
PS
RP
resc
ribes
10
key
actio
ns th
at fo
cus
on p
roje
ct d
efin
ition
, dev
elop
men
t Lo
gica
l, ob
ject
ive
and
com
preh
ensi
veFe
w, t
houg
h ap
proa
ch is
rel
ativ
ely
Co
nser
vanc
yof
str
ateg
ies
and
mea
sure
s, p
roje
ct im
plem
enta
tion
and
the
use
ofsy
stem
for
proj
ect /
pro
gram
me
com
plic
ated
and
tim
e co
nsum
ing.
Co
nser
vatio
n A
ctio
nre
sults
to a
dapt
and
impr
ove.
The
act
ions
incl
ude
the
iden
tific
atio
n of
spec
ific
plan
ning
, obj
ectiv
e se
tting
P
lann
ing
(C
AP
) sy
stem
foca
l con
serv
atio
n ta
rget
s, k
ey e
colo
gica
l attr
ibut
es a
nd in
dica
tors
of
and
impa
ct a
sses
smen
t. (u
pdat
ed 5
-S F
ram
ewor
k)ea
ch ta
rget
the
setti
ng o
f spe
cific
con
serv
atio
n ob
ject
ives
for
each
targ
et.
The
[US
] N
atio
nal
PA
vol
unta
ry p
artn
ersh
ip p
rogr
amm
e fo
r pu
blic
or
priv
ate
U.S
. ind
ustr
ial
Sim
ple
obje
ctiv
e ba
sed
stan
dard
ised
B
road
indi
cato
rs o
f env
ironm
enta
lE
nviro
nmen
tal
faci
litie
s th
at w
orks
in c
onju
nctio
n w
ith a
EM
S. I
t mon
itors
bro
ad a
spec
tssy
stem
, with
US
EPA
bac
king
; pe
rform
ance
whi
ch a
re n
ot a
ble
toP
erfo
rman
ce T
rack
of
env
ironm
enta
l per
form
ance
(e.
g. e
nerg
y us
e an
d di
scha
rges
).in
tegr
ated
with
EM
S.
pred
ict b
iodi
vers
ity im
pact
s.M
embe
rs m
ust u
sual
ly h
ave
mad
e im
prov
emen
ts in
at l
east
two
Sel
ectiv
e m
onito
ring
of c
hose
nas
pect
s an
d co
mm
it to
futu
re im
prov
emen
ts in
at l
east
four
asp
ects
.in
dica
tors
by
faci
lity
does
not
Per
form
ance
is m
easu
red
agai
nst o
bjec
tives
set
for
sele
cted
indi
cato
rspr
ovid
e a
com
preh
ensi
vefro
m a
sta
ndar
d E
nviro
nmen
tal P
erfo
rman
ce T
able
.as
sess
men
t of i
mpa
cts.
Co
nser
vatio
n M
easu
res
Sta
ndar
ds th
at a
im to
pro
vide
the
step
s, p
rinci
ples
, tas
ks, a
nd g
uida
nce
A lo
gica
l, pr
actic
al a
nd e
asy-
to fo
llow
The
guid
ance
doe
s no
t sug
gest
that
Par
tner
ship
Op
enne
cess
ary
for
the
succ
essf
ul im
plem
enta
tion
of c
onse
rvat
ion
proj
ects
. su
mm
ary
of o
bjec
tive-
focu
ssed
sp
ecifi
c ob
ject
ives
are
set
for
the
Sta
ndar
ds
(CM
P 2
004)
The
mai
n co
mpo
nent
s of
the
open
sta
ndar
ds –
prin
cipl
es, t
asks
, and
pr
inci
ples
of c
onse
rvat
ion
proj
ect
key
biod
iver
sity
indi
cato
rs
guid
ance
– a
re o
rgan
ised
acc
ordi
ng to
sev
en g
ener
ic s
teps
. Foc
uses
desi
gn, m
onito
ring
and
eval
uatio
n.th
emse
lves
.on
obj
ectiv
e se
tting
in a
ctio
n pl
anni
ng a
nd r
ecom
men
ds th
at M
&E
conc
entr
ates
on
thes
e.
25

Typ
e /
title
PS
RD
escr
iptio
nA
dva
ntag
esD
isad
vant
ages
UK
Sta
tuto
ry C
om
mo
nA
det
aile
d st
anda
rdis
ed fr
amew
ork
for
mon
itorin
g th
e co
nditi
on o
f A
car
eful
ly s
tand
ardi
sed
and
rela
tivel
yS
elec
tion
of F
eatu
res
and
setti
ng o
fS
tand
ard
s M
oni
tori
ngha
bita
ts a
nd s
peci
es a
t site
s. C
ondi
tion
is a
sses
sed
with
res
pect
to
sim
ple
syst
em th
at is
in u
se a
cros
sob
ject
ives
ent
ails
inev
itabl
e (J
NC
C 2
003)
site
-spe
cific
Con
serv
atio
n O
bjec
tives
for
the
Inte
rest
Fea
ture
(s).
th
e U
K, a
nd c
ould
be
adap
ted
for
sim
plifi
catio
n of
the
cons
erva
tion
Obj
ectiv
es d
efin
e Fa
vour
able
Con
ditio
n by
set
ting
stan
dard
s (t
akin
gel
sew
here
. Allo
ws
perfo
rman
ce to
be
goal
s.in
to a
ccou
nt g
ener
ic g
uida
nce)
that
are
to b
e m
et fo
r th
e Fe
atur
e.co
mpa
red
over
tim
e an
d be
twee
nar
eas,
org
anis
atio
ns, l
ando
wne
rs e
tc.
Thre
at R
educ
tion
PIt
focu
ses
on m
onito
ring
thre
ats
to th
e ac
hiev
emen
t of t
he d
esire
d st
ate
Sen
sitiv
e to
and
qui
ck to
det
ect
Unr
ealis
tic a
ssum
ptio
ns. U
nles
s A
sses
smen
ts (
Sal
afsk
yof
bio
dive
rsity
com
pone
nts
as a
pro
xy m
easu
re o
f con
serv
atio
n po
tent
ially
har
mfu
l env
ironm
enta
l th
e bi
odiv
ersi
ty c
ompo
nent
has
an
d M
argo
luis
199
9)su
cces
s. T
he a
ssum
ptio
n be
ing
that
if th
reat
s (i.
e. b
iodi
vers
ity p
ress
ures
) ch
ange
s, c
an a
llow
com
paris
ons
been
the
subj
ect o
f int
ensi
veca
n be
iden
tifie
d th
en m
onito
ring
can
asse
ss p
rogr
ess
by m
onito
ring
betw
een
diffe
rent
pro
ject
s an
d is
long
-term
stu
dies
it c
an o
nly
the
degr
ee to
whi
ch th
ese
thre
ats
are
redu
ced.
fairl
y si
mpl
e, p
ract
ical
and
cos
tse
rve
as a
gui
de to
like
ly im
pact
s.ef
fect
ive.
Add
ition
of t
hrea
t red
uctio
n sc
ores
m
ay n
ot b
e va
lid.
ISO
140
31P
SR
An
inte
rnat
iona
l sta
ndar
d th
at d
escr
ibes
a p
roce
ss fo
r m
easu
ring
Use
ful s
tand
ardi
sed
EM
S r
elat
ed
Focu
ses
on g
ener
al e
nviro
nmen
tal
Env
iro
nmen
tal
envi
ronm
enta
l per
form
ance
, bas
ed o
n th
e ty
pica
l EM
S m
odel
of
syst
em th
at fo
cuse
s on
obj
ectiv
es.
issu
es a
nd im
pact
s.P
erfo
rman
ce E
valu
atio
nbu
sine
ss m
anag
emen
t. It
prov
ides
gui
danc
e on
def
inin
g th
ree
basi
cty
pes
of in
dica
tor:
env
ironm
enta
l con
ditio
n in
dica
tors
, man
agem
ent
perfo
rman
ce in
dica
tors
and
ope
ratio
nal p
erfo
rman
ce in
dica
tors
.
Initi
al B
iodi
vers
ityP
SR
CI’s
Cen
tre
for
Env
ironm
enta
l Lea
ders
hip
is d
evel
opin
g IB
AP,
whi
ch
Intr
oduc
es b
iodi
vers
ity a
t an
early
N
ot c
lear
if S
MA
RT
Obj
ectiv
es a
re to
Ass
essm
ent a
ndai
ms
to h
elp
com
pani
es in
corp
orat
e bi
odiv
ersi
ty in
to th
eir
risk
anal
ysis
, st
age
in p
roje
ct p
lann
ing.
Iden
tifie
s be
set
with
in B
AP
s an
d if
indi
cato
rsP
lann
ing
deci
sion
mak
ing
and
plan
ning
pro
cess
es fr
om th
e co
ncep
tual
pha
seim
port
ant i
ssue
s an
d ac
tions
and
re
late
dire
ctly
to th
em. I
ssue
s be
stth
roug
h E
IA to
the
deve
lopm
ent o
f an
EM
S. T
he p
roce
ss in
volv
es r
apid
incl
udes
mon
itorin
g.tr
eate
d w
ithin
the
lega
l fra
mew
ork
biol
ogic
al s
urve
ys, p
rodu
ctio
n of
a B
AP
and
rec
omm
enda
tions
for
of a
form
al S
trat
egic
Env
ironm
enta
l in
dica
tors
and
mon
itorin
g pr
otoc
ols.
Ass
essm
ent a
nd E
IA.
Bird
Life
Inte
rnat
iona
lP
SR
The
fram
ewor
k pr
ovid
es a
sta
ndar
dise
d w
ay to
ass
ign
scor
es fo
r th
e C
olle
cts
PS
and
R d
ata
in a
sim
ple,
S
corin
g sy
stem
rat
her
sim
plis
tic a
ndIm
port
ant B
ird A
rea
stat
us o
f IB
A b
iodi
vers
ity, t
hrea
ts a
nd c
onse
rvat
ion
actio
ns. M
onito
ring
stan
dard
ised
and
rel
ativ
ely
effic
ient
pa
rtly
sub
ject
ive,
and
not
dire
ctly
Mon
itorin
g (in
pre
p.)
fo
cuse
s on
impo
rtan
t bird
pop
ulat
ions
and
use
s th
e IU
CN
sys
tem
tosy
stem
that
sho
uld
enab
le c
onsi
sten
t lin
ked
to s
ite-s
peci
fic o
bjec
tives
.ca
tego
rise
thre
ats.
The
sim
ple
scor
ing
is n
ot d
irect
ly r
elat
ed to
repo
rtin
g at
nat
iona
l, re
gion
al a
nd
Mor
e de
taile
d si
te m
onito
ring
is
site
-spe
cific
SM
AR
T ob
ject
ives
. How
ever
, mor
e in
-dep
th m
onito
ring
isgl
obal
leve
ls.
rela
ted
to IB
A o
bjec
tives
, but
this
ca
rrie
d ou
t, w
here
res
ourc
es a
llow
, at a
sub
-set
of p
riorit
y si
tes.
The
will
cov
er fe
w s
ites
and
guid
ance
site
s an
d va
riabl
es to
be
mon
itore
d ar
e se
lect
ed a
ccor
ding
to IB
Aon
this
is u
ncle
ar.
cons
erva
tion
obje
ctiv
es. T
he s
yste
m is
bei
ng d
evel
oped
and
has
bee
nTh
e m
onito
ring
syst
em is
not
tr
iale
d in
som
e co
untr
ies
(e.g
. Ken
ya).
inte
grat
ed w
ith a
com
preh
ensi
ve
cons
erva
tion
plan
ning
sys
tem
.
26

3.2 GENERIC INDICATORS
These are primary guidelines that develop a frameworkfor measuring conservation performance using a varietyof pressure, state and response indicators. These indicatorsare either selected from recommended lists, or by followingan indicator identification guideline. Systems that focuson conservation programme / projects and overallcorporate level performance by using process indicatorsare described later.
Related proposed indicators are listed in Table 3.2 at theend of this section.
3.2.1 The Global Reporting Initiative guidelines
The Global Reporting Initiative (GRI) is a multi-stakeholderprocess and independent institution (a Collaborating Centreof the United Nations Environment Programme) whosemission is to develop and disseminate globally applicableSustainability Reporting Guidelines6. The SustainabilityReporting Guidelines – SRG (GRI 2002) form the foundationupon which all other GRI reporting documents are based,and provide generic guidance that is broadly relevant toall organisations regardless of size, sector, or location.The aim of the SRG is to assist reporting organisationsand their stakeholders in articulating and understandingcontributions of the reporting organisations to sustainabledevelopment. In particular they aim to:
• Present reporting principles and specific content to guidethe preparation of organisation-level sustainability reports;
• Assist organisations in presenting a balanced andreasonable picture of their economic, environmental,and social performance;
• Promote comparability of sustainability reports, whiletaking into account the practical considerations related
to disclosing information across a diverse range oforganisations, many with extensive and geographicallydispersed operations;
• Support benchmarking and assessment of sustainabilityperformance with respect to codes, performancestandards, and voluntary initiatives; and
• Serve as an instrument to facilitate stakeholderengagement.
The SRG identifies 11 reporting principles essential toproducing a balanced and reasonable report on anorganisation’s economic, environmental, and socialperformance (Box 3.1). These also aim to facilitatecomparisons over time and across organisations, andcredibly address issues of concern to stakeholders.
The 2002 Guidelines7 propose performance indicatorswhich fall into two categories: core and additional. Coreindicators are relevant to most reporting organisationsand of interest to most stakeholders. Additional indicatorsare defined as those that have one or more of thefollowing characteristics:
• Represent a leading practice in economic,environmental, or social measurement, thoughcurrently used by few reporting organisations;
• Provide information of interest to stakeholders who areparticularly important to the reporting entity; and
• Are deemed worthy of further testing for possibleconsideration as future core indicators.
6This includes corporate, governmental, and non-governmentalorganisations. All are included within GRI’s mission. In its first phase,GRI has emphasised use of the SRG by corporations with theexpectation that governmental and non-governmental organisationswill follow in due course.7These are currently being revised.
25
Source GRI (2002)
1) Transparency: Full disclosure of the processes,procedures, and assumptions in report preparationare essential to its credibility.
2) Inclusiveness: The reporting organisation shouldsystematically engage its stakeholders to help focusand continually enhance the quality of its reports.
3) Auditability: Reported data and information shouldbe recorded, compiled, analysed, and disclosed in away that would enable internal auditors or externalassurance providers to attest to its reliability.
4) Completeness: All information that is material to usersfor assessing the reporting organisation’s economic,environmental, and social performance should appearin the report in a manner consistent with the declaredboundaries, scope, and time period.
5) Relevance: Relevance is the degree of importanceassigned to a particular aspect, indicator, or piece ofinformation, and represents the threshold at whichinformation becomes significant enough to be reported.
6) Sustainability Context: The reporting organisationshould seek to place its performance in the largercontext of ecological, social, or other limits or
constraints, where such context adds significantmeaning to the reported information.
7) Accuracy: The accuracy principle refers to achievingthe degree of exactness and low margin of error inreported information necessary for users to makedecisions with a high degree of confidence.
8) Neutrality: Reports should avoid bias in selection andpresentation of information and should strive toprovide a balanced account of the reportingorganisation’s performance.
9) Comparability: The reporting organisation shouldmaintain consistency in the boundary and scope ofits reports, disclose any changes, and re-statepreviously reported information.
10) Clarity: The reporting organisation should remaincognizant of the diverse needs and backgrounds ofits stakeholder groups and should make informationavailable in a manner that is responsive to themaximum number of users while still maintaining asuitable level of detail.
11) Timeliness: Reports should provide information on aregular schedule that meets user needs and comportswith the nature of the information itself.
Box 3.1 The 11 reporting principles of the GRI Sustainability Reporting Guidelines
27
28
In accordance with the conventional model of sustainabledevelopment, the performance indicators are groupedunder three sections covering the economic,environmental, and social dimensions of sustainability.The environmental indicators relating to biodiversity arelisted in Table 3.2 and form a variety of high-level mostlyindirect indicators of biodiversity state. They are poorlydefined in the SRG and many actually include multiplemeasures of more than one potential indicator. The SRGare currently being reviewed through wide consultationprocess and a revised publication is due in 2006.
In addition the GRI have produced a number of sectorsupplements to be used in conjunction with the SRG,including a pilot Mining and Metals Sector Supplement inpartnership with ICMM (GRI 2005). This includes furtherguidance for the sector on sustainability reporting butretains the same biodiversity indicators as the SRG (GRI2002).
3.2.2 International Council for Mining and Metals goodpractice guidance
The International Council for Mining and Metals (ICMM)has recently produced a consultation draft of Goodpractice guidance for mining and biodiversity ICMM(2005). This recognises the importance of monitoring,evaluation and auditing of impacts and mitigationmeasures, and provides general guidance on theseissues. It recommends that “monitoring should begin priorto the start of an exploration programme, last throughoutthe construction and operation of the mine, and continuefor years after closure and rehabilitation. Monitoring isessential to understanding the effects of a proposedproject on biodiversity. Monitoring is also important forverifying the predicted effects of an ESIA, and ultimately,should be part of a company’s overall environmentalmanagement system”…... “Monitoring evaluates thedegree of implementation of mitigation measures andassesses the degree of success obtained in managingbiodiversity”.
The guidance suggests that mining companies should, inconjunction with their government regulators andstakeholders, determine what set of indicators will berequired to measure and manage impacts on biodiversity.It lists a number of potential indicators (see Table 3.2) andrecommends that specific site indicators should bedetermined based on the biodiversity context and valuesalready identified for the site from baseline assessmentsand EIAs. This guidance is rather vague and mightencourage the selection of a broad range of inappropriateindicators based on expediency, rather than indicatorslinked to clear objectives.
Later guidance in the document (section 3.3.1) explicitlyrecommends that “clear goals for the outcomes of thebiodiversity management projects need to be set andcommunicated to all involved. Those goals and objectivesshould be set in consultation with the various parties whowill judge the success of the work”… “The objectives willdepend on the biodiversity aspects identified and therequirements and opportunities to mitigate impacts.” Thesection on biodiversity performance management thenconcludes that “The aim of reporting monitoring results isto indicate whether the performance of a company is inline with the objectives, or whether activities need to be
modified to ensure biodiversity is managed to the levelprescribed in the EMS”. Thus overall, although theguidance is clear on the importance of setting objectives,there is confusion over the use and linkage of indicatorsto the objectives. There is an opportunity, which ismissed, to explicitly link the selection of indicators to themonitoring of conservation performance with respect tothe achievement of the stated objectives, particularly ifthey are set using SMART principles (which are discussedin the ICMM guidance with respect to indicators). Thisissue is further discussed in the Conclusions (Chapter 4)of this report.
Further guidance is given in the ICMM document onimportant issues such as the need for properly designedand scientifically rigorous surveys, transparency in datacollection methods, credibility with stakeholders andreporting. Reference is also made to the GRI Indicators(see above) but no clear recommendation is made ontheir use.
3.2.3 Criteria and indicators for the conservation andsustainable management of temperate and borealforests
The Working Group on Criteria and Indicators for theConservation and Sustainable Management of Temperateand Boreal Forests ("Montreal Process") was formed inGeneva in June 1994 to advance the development ofinternationally agreed criteria and indicators for theconservation and sustainable management of temperateand boreal forests at the national level. Participants in theWorking Group included Australia, Canada, Chile, China,Japan, the Republic of Korea, Mexico, New Zealand, theRussian Federation and the United States of America,which together represent 90 percent of the world'stemperate and boreal forests. Several internationalorganisations, non-governmental organisations and othercountries also participated in meetings of the WorkingGroup.
In February 1995 in Santiago, Chile, the above countriesproduced the "Santiago Declaration" which endorsed acomprehensive framework of criteria and indicators forforest conservation and sustainable management for useby their respective policy-makers.
The framework identified the following seven criteria thatare further defined by 67 associated indicators:
• Conservation of biological diversity.
• Maintenance of productive capacity of forest ecosystem.
• Maintenance of forest ecosystem health.
• Conservation and maintenance of soil and waterresources.
• Maintenance of forest contribution to global carboncycles.
• Maintenance and enhancement of long-term multiplesocio-economic benefits to meet the needs of society.
• Legal, institutional and economic framework for forestconservation and sustainable management.
The biological diversity conservation indicators are listedin Table 3.2.
The aim of the criteria and indicators is to characterise the
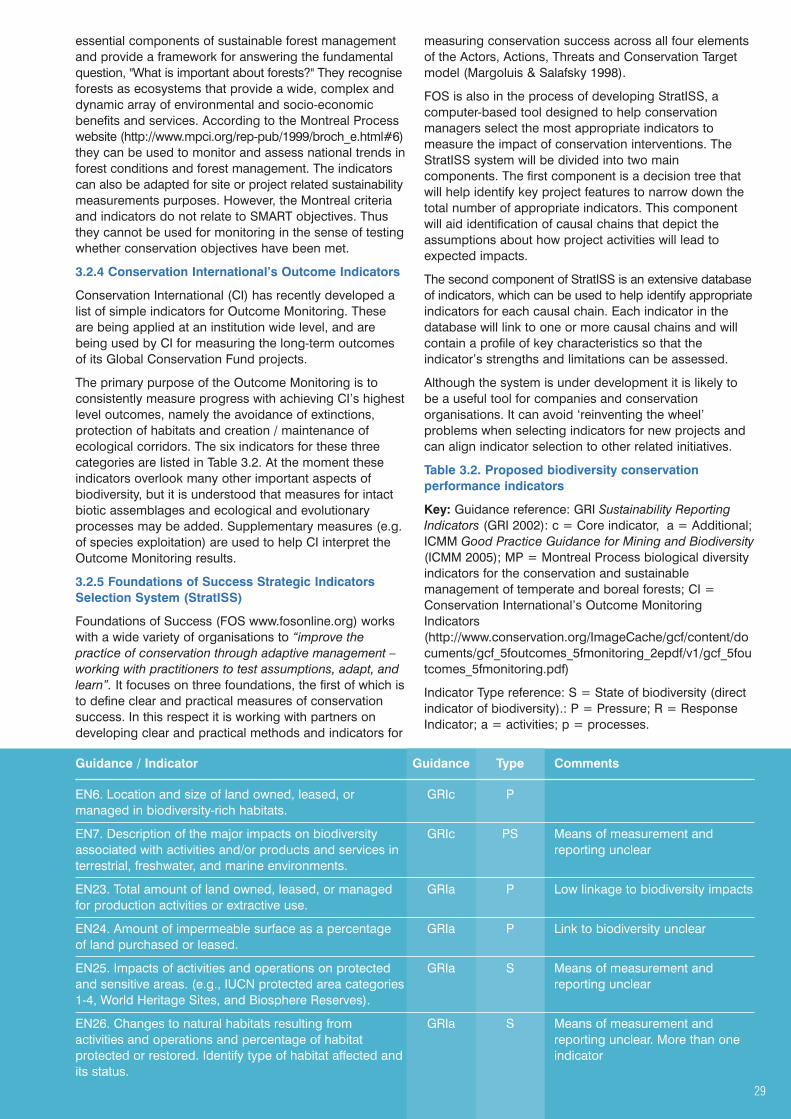
essential components of sustainable forest managementand provide a framework for answering the fundamentalquestion, "What is important about forests?" They recogniseforests as ecosystems that provide a wide, complex anddynamic array of environmental and socio-economicbenefits and services. According to the Montreal Processwebsite (http://www.mpci.org/rep-pub/1999/broch_e.html#6)they can be used to monitor and assess national trends inforest conditions and forest management. The indicatorscan also be adapted for site or project related sustainabilitymeasurements purposes. However, the Montreal criteriaand indicators do not relate to SMART objectives. Thusthey cannot be used for monitoring in the sense of testingwhether conservation objectives have been met.
3.2.4 Conservation International’s Outcome Indicators
Conservation International (CI) has recently developed alist of simple indicators for Outcome Monitoring. Theseare being applied at an institution wide level, and arebeing used by CI for measuring the long-term outcomesof its Global Conservation Fund projects.
The primary purpose of the Outcome Monitoring is toconsistently measure progress with achieving CI’s highestlevel outcomes, namely the avoidance of extinctions,protection of habitats and creation / maintenance ofecological corridors. The six indicators for these threecategories are listed in Table 3.2. At the moment theseindicators overlook many other important aspects ofbiodiversity, but it is understood that measures for intactbiotic assemblages and ecological and evolutionaryprocesses may be added. Supplementary measures (e.g.of species exploitation) are used to help CI interpret theOutcome Monitoring results.
3.2.5 Foundations of Success Strategic IndicatorsSelection System (StratISS)
Foundations of Success (FOS www.fosonline.org) workswith a wide variety of organisations to “improve thepractice of conservation through adaptive management –working with practitioners to test assumptions, adapt, andlearn”. It focuses on three foundations, the first of which isto define clear and practical measures of conservationsuccess. In this respect it is working with partners ondeveloping clear and practical methods and indicators for
measuring conservation success across all four elementsof the Actors, Actions, Threats and Conservation Targetmodel (Margoluis & Salafsky 1998).
FOS is also in the process of developing StratISS, acomputer-based tool designed to help conservationmanagers select the most appropriate indicators tomeasure the impact of conservation interventions. TheStratISS system will be divided into two maincomponents. The first component is a decision tree thatwill help identify key project features to narrow down thetotal number of appropriate indicators. This componentwill aid identification of causal chains that depict theassumptions about how project activities will lead toexpected impacts.
The second component of StratISS is an extensive databaseof indicators, which can be used to help identify appropriateindicators for each causal chain. Each indicator in thedatabase will link to one or more causal chains and willcontain a profile of key characteristics so that theindicator’s strengths and limitations can be assessed.
Although the system is under development it is likely tobe a useful tool for companies and conservationorganisations. It can avoid ‘reinventing the wheel’problems when selecting indicators for new projects andcan align indicator selection to other related initiatives.
Table 3.2. Proposed biodiversity conservationperformance indicators
Key: Guidance reference: GRI Sustainability ReportingIndicators (GRI 2002): c = Core indicator, a = Additional;ICMM Good Practice Guidance for Mining and Biodiversity(ICMM 2005); MP = Montreal Process biological diversityindicators for the conservation and sustainablemanagement of temperate and boreal forests; CI =Conservation International’s Outcome MonitoringIndicators(http://www.conservation.org/ImageCache/gcf/content/documents/gcf_5foutcomes_5fmonitoring_2epdf/v1/gcf_5foutcomes_5fmonitoring.pdf)
Indicator Type reference: S = State of biodiversity (directindicator of biodiversity).: P = Pressure; R = ResponseIndicator; a = activities; p = processes.
Guidance / Indicator Guidance Type Comments
EN6. Location and size of land owned, leased, or GRIc Pmanaged in biodiversity-rich habitats.
EN7. Description of the major impacts on biodiversity GRIc PS Means of measurement andassociated with activities and/or products and services in reporting unclearterrestrial, freshwater, and marine environments.
EN23. Total amount of land owned, leased, or managed GRIa P Low linkage to biodiversity impactsfor production activities or extractive use.
EN24. Amount of impermeable surface as a percentage GRIa P Link to biodiversity unclearof land purchased or leased.
EN25. Impacts of activities and operations on protected GRIa S Means of measurement andand sensitive areas. (e.g., IUCN protected area categories reporting unclear1-4, World Heritage Sites, and Biosphere Reserves).
EN26. Changes to natural habitats resulting from GRIa S Means of measurement andactivities and operations and percentage of habitat reporting unclear. More than one protected or restored. Identify type of habitat affected and indicatorits status.
29
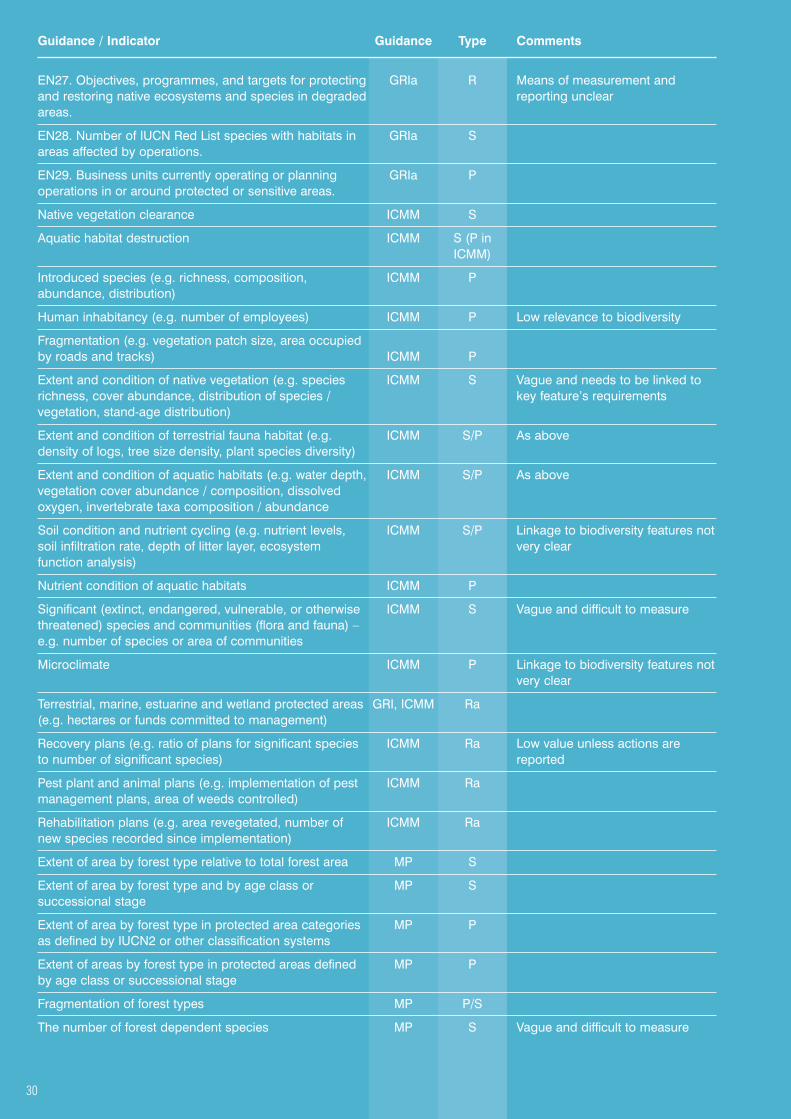
Guidance / Indicator Guidance Type Comments
EN27. Objectives, programmes, and targets for protecting GRIa R Means of measurement andand restoring native ecosystems and species in degraded reporting unclearareas.
EN28. Number of IUCN Red List species with habitats in GRIa Sareas affected by operations.
EN29. Business units currently operating or planning GRIa Poperations in or around protected or sensitive areas.
Native vegetation clearance ICMM S
Aquatic habitat destruction ICMM S (P inICMM)
Introduced species (e.g. richness, composition, ICMM Pabundance, distribution)
Human inhabitancy (e.g. number of employees) ICMM P Low relevance to biodiversity
Fragmentation (e.g. vegetation patch size, area occupiedby roads and tracks) ICMM P
Extent and condition of native vegetation (e.g. species ICMM S Vague and needs to be linked to richness, cover abundance, distribution of species / key feature’s requirementsvegetation, stand-age distribution)
Extent and condition of terrestrial fauna habitat (e.g. ICMM S/P As abovedensity of logs, tree size density, plant species diversity)
Extent and condition of aquatic habitats (e.g. water depth, ICMM S/P As abovevegetation cover abundance / composition, dissolvedoxygen, invertebrate taxa composition / abundance
Soil condition and nutrient cycling (e.g. nutrient levels, ICMM S/P Linkage to biodiversity features not soil infiltration rate, depth of litter layer, ecosystem very clearfunction analysis)
Nutrient condition of aquatic habitats ICMM P
Significant (extinct, endangered, vulnerable, or otherwise ICMM S Vague and difficult to measurethreatened) species and communities (flora and fauna) –e.g. number of species or area of communities
Microclimate ICMM P Linkage to biodiversity features notvery clear
Terrestrial, marine, estuarine and wetland protected areas GRI, ICMM Ra(e.g. hectares or funds committed to management)
Recovery plans (e.g. ratio of plans for significant species ICMM Ra Low value unless actions areto number of significant species) reported
Pest plant and animal plans (e.g. implementation of pest ICMM Ramanagement plans, area of weeds controlled)
Rehabilitation plans (e.g. area revegetated, number of ICMM Ranew species recorded since implementation)
Extent of area by forest type relative to total forest area MP S
Extent of area by forest type and by age class or MP Ssuccessional stage
Extent of area by forest type in protected area categories MP Pas defined by IUCN2 or other classification systems
Extent of areas by forest type in protected areas defined MP Pby age class or successional stage
Fragmentation of forest types MP P/S
The number of forest dependent species MP S Vague and difficult to measure
30

Guidance / Indicator Guidance Type Comments
The status (threatened, rare, vulnerable, endangered, or MP S As aboveextinct) of forest dependent species at risk of notmaintaining viable breeding populations, as determinedby legislation or scientific assessment
Number of forest dependent species that occupy a small MP S As aboveportion of their former range
Population levels of representative species from diverse MP S Need to be linked to objectiveshabitats monitored across their range
Percent change in number of threatened species in each CI S Dependent on many factors andIUCN Red List category, number of species downlisted, other organisationsand number of species that have gone extinct
Percentage improvement towards achieving downlisting CI S Difficult to measure, andof each threatened species, concentrating on rates of dependent on many factors decline, starting with Critically Endangered Species and organisations
Percentage and total number of all Key Biodiversity Areas CI S Dependent on many factors andthat are protected with (a) legal recognition and (b) other organisationsbiodiversity conservation as an official goal
Percentage change in habitat cover at Key Biodiversity CI S Does not take into account habitatAreas quality
Change in fragmentation statistics CI S
Percentage change in suitable habitat cover for CI Scorridor-level species
3.3 CONSERVATION PROCESS (RESPONSE)PERFORMANCE INDICATORS
These are systems that have been developed to assesscorporate or conservation project / programme performancein relation to processes (i.e. responses in the PSRframework). Corporate evaluation systems (e.g. benchmarks)tend to focus on the integration of biodiversity into companypolicies, systems and activities. Conservation project /programme evaluation systems tend to focus on activitiesand the quality of processes. All are indirect indicators ofimpacts, and are based on the assumption that appropriateprocesses will result in greater and better biodiversityconservation achievements. However, these impacts arenot measured and therefore ultimately these measurescannot be used to establish if a positive biodiversity impacthas been achieved, and are not therefore described indetail here.
3.3.1 The Environment Index of Corporate EnvironmentalEngagement
The Environment Index (formerly known as the BiE Index)is widely recognised as the UK’s leading benchmark ofcorporate environmental engagement and the only self-assessed survey of its kind.
The objectives of the Environment Index are:
• To drive continuous improvement in environmentalmanagement and performance through benchmarking;
• To determine the progress that major corporate bodiesand, specifically, FTSE 350 companies have made;
• To raise awareness of the environment as a strategic,competitive issue at boardroom level;
• To provide credible, independent, comparableinformation for stakeholders.
Companies invited to participate on the basis of theirworldwide operations are FTSE 100 and FTSE 250(excluding Investment Trusts); Non-FTSE listed Businessin the Community members; Sector leaders from the DowJones Sustainability Index.
A simple four stage framework is used for performancemeasurement and reporting in the wider businesscontext. The framework can be broadly aligned to thetypical stages of company business management,covering strategic review, planning, control andmeasurement of core processes, and public reporting ofbusiness performance.
Checklists and tools are included to help companiesestablish the current state of environmental performancemeasurement processes and to help identify andprioritise actions for improvement. The index is almostentirely focused on processes, in particular the integrationof biodiversity into management systems, and is thus anindirect indicator of actual impacts.
3.3.2 The Australian Benchmarking BiodiversityConservation Framework
The Australian Government’s Department of Environmentand Heritage has developed a Benchmarking BiodiversityConservation framework that is designed to guide councilsthrough a series of steps or benchmarks to ensurebiodiversity conservation is a key council priority (seehttp://www.deh.gov.au/biodiversity/toolbox/benchmarking/index.html). The system measures the performance ofcouncils, and also permits the comparison of progressacross local governments throughout Australia. Each ofthe 5 benchmarks listed below is broadly defined toprovide some direction while encouraging localinnovation:
31

• Benchmark One - Commit to change
• Benchmark Two - Establish baseline position
• Benchmark Three - Develop strategic approach
• Benchmark Four - Implement and monitor
• Benchmark Five - Review and evaluate
Of particular importance is Benchmark Three, whichfocuses on the development of a BiodiversityConservation Strategy or Local BAP. The purpose of thisbenchmark is to outline immediate actions to becommenced, and to plan for the longer term changes tocouncil activities and responsibilities. It includes theidentification of performance indicators, for eight standardlocal government biodiversity management outcomes (i.e.response – process indicators). Thus the benchmark hasa requirement for performance measurements, but thesystem does not appear to relate indicators to SMARTbiodiversity objectives.
3.3.3 The Nature Conservancy scorecards
In the mid-1990s various, mainly US, conservationorganisations developed score cards to structure site-level conservation assessments (Stem et al. 2005). Thesescoring systems are generally subjective assessments ofthe implementation and quality of conservation activities,thus (like the benchmark systems – see above) they areindirect response/process-based measures of conservationperformance, though some include subjective assessmentsof the state of biodiversity components. According to Stemet al. (2005) scorecards can be a status assessment toolthat reflects process performance at a site (or project) ata moment in time, or (if the scoring system remainsunchanged) can be used to measure performance overtime (e.g. TNC 1999). One of the leading proponents ofscorecards has been the Nature Conservancy (TNC), whoused this approach to develop (with the US Agency forInternational Development) the Site ConsolidatedScorecard (TNC 1999). TNC have also used a scorecardranking tool for its 5-S framework for site conservation(TNC 2001). The 5-S approach and its successor, theenhanced 5-S project Management Process (TNC/FOS2003) is a more comprehensive approach, where staffcategorically rank different elements associated withsystems, stresses, sources, strategies and success.
3.3.4 World Bank / WWF scorecard for protected areas
The World Bank - WWF Alliance for terrestrial ProtectedAreas has used the World Commission on ProtectedAreas (WCPA) framework for assessing managementeffectiveness of protected areas (see Section 3.3.2) as thebasis for a Score Card to Assess Progress in AchievingManagement Effectiveness Goals (Stolton et al. 2003).This has recently been revised and re-released by theWorld Bank (Staub & Hatziolos 2004). The Score Cardwas developed for use by marine protected area (MPA)managers to assess and report on their progress in astandardised way consistent with the World Summit onSustainable Development (WSSD) target of a representativenetwork of MPAs by 2012. It also allows reporting andevaluation by the World Bank to its shareholders andother partners on the performance of its investments inMPAs. It is a simple (WCPA Level 1) site-level tracking toolto facilitate reporting on management effectiveness in
MPAs. The purpose of the Score Card is to help marineprotected area managers and local stakeholdersdetermine their progress along the managementcontinuum. It is a short, straightforward self-assessmenttool to help managers identify where they are succeedingand where they need to address gaps.
As the guidelines state the “approach is useful forprioritization of issues and improving the managementprocess, but tells you little about the achievement ofmanagement objectives”. Evaluation of actualachievements and impacts requires a more in-depthassessment tool (such as the WCPA-Marine/WWFManagement Effectiveness Guidelines available athttp://effectivempa.noaa.gov).
As discussed by Stem et al. (2005), scorecards have anumber of significant limitations, including the lack oflinkage between actions and impacts, the loss ofinformation on composite or averaged scores, problemswith comparing actions of differing importance (thoughsome systems use weightings to address this) and thesubjective nature of most assessments. The latter issuecan be minimised to some extent by the provision ofdetailed guidance and criteria for assessments (as usedby TNC), but the other limitations are more fundamental,and thus scorecards cannot be readily used for theconservation performance measurement requirementsthat are the focus of this study.
3.3.5 Conservation Measures Partnership audits
The CMP has used its Open Standards (see 3.3.5 below)as a basis for conservation audits being undertaken byThe Nature Conservancy (TNC) and WWF (Dutton et al.2005). The CMP defines a conservation audit as “Anindependent review of the process of conservation basedon a set of predetermined standards”. Conservation auditsaim to determine the extent to which projects follow apredefined “gold standard” that clearly defines “quality”from a process point of view - the process being thenecessary steps and requirements for designing,managing, and monitoring effective conservation projects.The overall aim of undertaking audits is to raise thequality of the conservation process and to increase thelikelihood of success of conservation efforts.
As CMP points out, audits differ from more traditionalforms of evaluation in which the progress or impacts of aproject are assessed relative to their own goals andobjectives, independent of the process that wasemployed.
TNC and WWF have undertaken a number of cross-organisation and within organisation conservation auditson a voluntary basis, and completed an audit processreview workshop in which some 45 audit team members,clients and external partners reviewed the three phases ofthe audit approach. The workshop proposed a set of‘best practices’ for future audits, which are currently beingreviewed and will form the basis of a ‘standard auditprotocol’ that will guide future audits.
3.4 OBJECTIVE SPECIFIC MEASURES OFPERFORMANCE
Most conservation project related evaluations tend to bespecific to the project and its reporting requirements, anddo not follow specific standard guidelines, systems or
32

formats. Consequently, conservation performanceassessments vary considerably, which is one of thereasons for the CMP Open Standards initiative (describedabove). Good projects though should at least have clearlydefined objectives that can be reported against.
3.4.1 Logical Frameworks
One of the most widely used systems for defining projectobjectives is the Logical Framework Approach (LFA). Thishas its origins in private sector management theory, suchas the 'management by objectives' approach whichinitially became popular in the 1960s. It was then takenup as a planning tool for overseas development activitiesby USAID in the early 1970s. Subsequently it has beenadopted, and adapted as a planning and managementtool by a large number of agencies involved in providingdevelopment assistance (e.g. the UK DFID, Canada'sCIDA, the OECD Expert Group on Aid Evaluation, theInternational Service for National Agricultural Research,Australia's AusAID and Germany's GTZ) and variousconservation organisations (e.g. it is now used as the basisfor project application forms for the EU LIFE Programme).
According to AusAid guidance (http://www.ausaid.gov.au/ausguide/ausguidelines/index.cfm) LFA is an analytical,presentational and management tool which can helpplanners and managers:
• Analyse the existing situation during projectpreparation;
• Establish a logical hierarchy of means by which
objectives will be reached;
• Identify the potential risks to achieving the objectives,and to sustainable outcomes;
• Establish how outputs and outcomes might best bemonitored and evaluated;
• Present a summary of the project in a standard format;
• Monitor and review projects during implementation.
The LFA approach involves problem analysis, stakeholderanalysis, developing a hierarchy of objectives andselecting a preferred implementation strategy. Theproduct of this analytical approach is the LogicalFramework Matrix (or Logframe), which summarises whatthe project intends to do and how, what the keyassumptions are, and how outputs and outcomes will bemonitored and evaluated (see Table 3.3).
Its key advantages are that it helps to provide astandardised summary of the project and its logic, and, ifcarried out correctly defines clear objectives andperformance indicators against which project successcan be objectively assessed. But the process can be timeconsuming and complex, and has been criticised, e.g. byGasper (2000) for being too mechanistic and rigid,making simplistic and overly rigid objectives, downgradingqualitative objectives, ignoring unintended effects anddisagreements and for being top-down which can lead tostaff alienation. But despite such problems, the systemhas stood the test of time and is being taken up morewidely.
33
Table 3.3. The Logical Framework Matrix
Project Description Performance Indicators Means of Verification Assumptions
Goal: The broader Measures of the extent to Sources of information and development impact to which a sustainable methods used to collect andwhich the project contributes contribution to the goal has report it.- at a national and sectoral been made. Used during level. evaluation.
Purpose: The development Conditions at the end of the Sources of information and Assumptions concerningoutcome expected at the end project indicating that the methods used to collect the purpose/goal linkage.of the project. All components purpose has been achieved and report it.will contribute to this. and that benefits are
sustainable. Used for project completion andevaluation.
Component Objectives: Measures of the extent to Sources of information and Assumptions concerningThe expected outcome of which component objectives methods used to collect the component objective / producing each component's have been achieved and and report it. purpose linkage.outputs. lead to sustainable benefits.
Used during review andevaluation.
Outputs: The direct Measures of the quantity Sources of information and Assumptions concerningmeasurable results (goods and quality of outputs and methods used to collect the output / componentand services) of the project the timing of their delivery. and report it. objective linkage.which are largely under project Used during monitoringmanagement's control. and review.
Activities: The tasks carried Implementation / work Sources of information and Assumptions concerningout to implement the project programme targets. Used methods used to collect the activity/output linkage.and deliver the identified during monitoring. and report it.outputs.
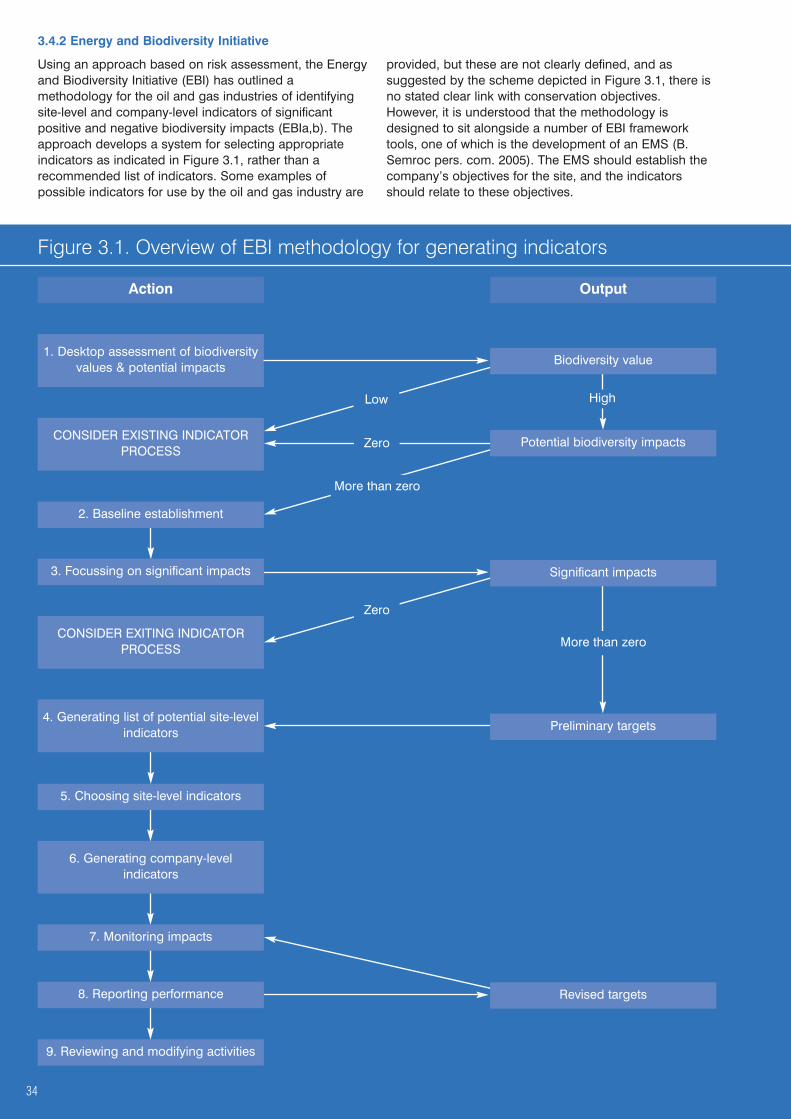
3.4.2 Energy and Biodiversity Initiative
Using an approach based on risk assessment, the Energyand Biodiversity Initiative (EBI) has outlined amethodology for the oil and gas industries of identifyingsite-level and company-level indicators of significantpositive and negative biodiversity impacts (EBIa,b). Theapproach develops a system for selecting appropriateindicators as indicated in Figure 3.1, rather than arecommended list of indicators. Some examples ofpossible indicators for use by the oil and gas industry are
provided, but these are not clearly defined, and assuggested by the scheme depicted in Figure 3.1, there isno stated clear link with conservation objectives.However, it is understood that the methodology isdesigned to sit alongside a number of EBI frameworktools, one of which is the development of an EMS (B.Semroc pers. com. 2005). The EMS should establish thecompany’s objectives for the site, and the indicatorsshould relate to these objectives.
Action
CONSIDER EXISTING INDICATORPROCESS
Output
1. Desktop assessment of biodiversityvalues & potential impacts
CONSIDER EXITING INDICATORPROCESS
9. Reviewing and modifying activities
Figure 3.1. Overview of EBI methodology for generating indicators
Revised targets
Preliminary targets
Potential biodiversity impacts
Biodiversity value
Significant impacts
2. Baseline establishment
3. Focussing on significant impacts
4. Generating list of potential site-levelindicators
5. Choosing site-level indicators
6. Generating company-levelindicators
7. Monitoring impacts
8. Reporting performance
Low High
Zero
More than zero
Zero
More than zero
34

3.4.3 The World Commission on Protected Areasframework for assessing management effectiveness ofprotected areas
In 1997, the WCPA set up a Management EffectivenessTask Force to focus attention on the issue of managementeffectiveness and to look at options for assessment (seehttp://www.enhancingheritage.net/about.htm). The WCPATask Force concentrated on developing a 'framework',both to provide some overall guidance in thedevelopment of assessment systems and to encouragebasic standards for assessment and reporting. In 2000 areview of management effectiveness evaluation systemswas published by Hockings (Hockings 2000) and theWCPA produced A framework for assessing themanagement of protected areas (Hockings et al. 2000a).The framework was proposed as a ‘toolkit’ whichprovides a structure and an approach to developingsystems for assessing, or evaluating8, managementeffectiveness of protected areas.
The framework sets out a simple system for assessingmanagement effectiveness in relation to three key issues:
• Design of individual protected areas and systems.
• Appropriateness of management and responses tochallenges.
• Delivery of stated aims and objectives of the protectedarea.
It is also based on the belief that effective management isbased on 6 key components as summarised in Table 3.4.
They recognise three levels of evaluation each requiringdifferent levels of data collation and effort. Thus theproposed framework includes methods that can be usedto create a variety of levels of assessment, from broadand relatively quick assessments, which might be appliedat a national level, to detailed, on-going monitoringprogrammes that will provide a more in-depthassessment of management effectiveness at the site level.
Level 3 evaluations place most emphasis on monitoringthe achievement of management objectives by focussingon outputs and outcomes. Guidance is given on selectionof the appropriate level of evaluation.
Hockings et al. (2000a) state that “outcome indicators areimportant because they measure the real impacts ofmanagement action: they assess the extent to which themanagement objectives are being achieved”. As such,they need to be based upon a clear understanding ofwhat it is that management is aiming to accomplish.However, they also note that it is often difficult to identifydesired outcomes because sometimes objectives areframed in terms of activities to be undertaken rather thanresults to be achieved, and sometimes no explicitmanagement objectives are set. Thus they go on to state“The importance of establishing clear, measurable,outcome-based objectives as a basis for managementcannot be stressed too much. It is fundamental, not onlyto the assessment of management effectiveness but to thewhole process of management itself (MacKinnon et al.1986)”.
The WCPA framework includes a suggested process fordesigning monitoring programmes for outcomeevaluation (Figure 3.2). This should be linked to theobjectives for the specific protected area, and thereforeperformance indicators should be specific for each(though some may relate to common issues, such as thepresence of threatened species). A similar system wasproposed for biodiversity monitoring in protected areasby Tucker et al. (Tucker et al. 2005) in which furtherdetails are given on objective setting and the practicalissues concerned with devising a monitoring programme.
8Assessment and evaluation are used interchangeably in the reportand refer to the judgement or assessment of achievement againstsome predetermined criteria (usually a set of standards orobjectives); in this case including the objectives for which theprotected areas were established.
Photograph: c Robert Thomson
35

Tabl
e 3.
4. W
CPA
fram
ewor
k fo
r ass
essi
ng m
anag
emen
t effe
ctiv
enes
s of
pro
tect
ed a
reas
and
pro
tect
ed a
rea
syst
ems
(Hoc
king
s et
al.
2000
)
Abb
revi
atio
ns: P
A =
pro
tect
ed a
rea
Ele
men
ts o
f ev
alua
tion
Co
ntex
tP
lann
ing
Inp
utP
roce
ssO
utp
utO
utco
me
Exp
lana
tion
Whe
re a
re w
e no
w?
Whe
re d
o w
e w
ant t
o be
?W
hat d
o w
e ne
ed to
do?
How
do
we
go a
bout
it?
Wha
t wer
e th
e re
sults
?W
hat d
id w
e ac
hiev
e?
Ass
essm
ent o
fA
sses
smen
t of P
A
Ass
essm
ent o
f res
ourc
esA
sses
smen
t of t
he w
ayA
sses
smen
t of t
heA
sses
smen
t of t
he
impo
rtan
ce, t
hrea
ts a
ndde
sign
and
pla
nnin
gne
eded
to c
arry
out
in w
hich
man
agem
ent
impl
emen
tatio
n of
outc
omes
and
the
exte
nt
polic
y en
viro
nmen
tm
anag
emen
tis
con
duct
edm
anag
emen
tto
whi
ch th
ey a
chie
ved
prog
ram
mes
and
obje
ctiv
esac
tions
; del
iver
y of
prod
ucts
and
ser
vice
s
Cri
teri
a th
at a
rePA
legi
slat
ion
and
polic
yR
esou
rces
of a
genc
yS
uita
bilit
y of
R
esul
ts o
f man
agem
ent
asse
ssed
man
agem
ent p
roce
sses
actio
ns
PA s
yste
m d
esig
nR
esou
rcin
g of
site
Ser
vice
s an
d pr
oduc
ts
Res
erve
des
ign
Par
tner
s
Man
agem
ent p
lann
ing
Focu
s o
f ev
alua
tion
Sta
tus
App
ropr
iate
ness
Res
ourc
esE
ffici
ency
Effe
ctiv
enes
sE
ffect
iven
ess
App
ropr
iate
ness
App
ropr
iate
ness
36
Impa
cts:
effe
cts
ofm
anag
emen
t in
rela
tion
to o
bjec
tives
Sig
nific
ance
Thre
ats
Vuln
erab
ility
Nat
iona
l con
text

Figure 3.2. WCPA Process for developing an outcome-monitoring programme
Outcome evaluation
Objectives are reviewed to establishappropriate indicators of achievement
Report on findings and reviewmanagement in light of the results
Objectives (outcomes) establishedfor management of area
Objectives provide basis fordeveloping outcome evaluation
Data requirements for specifiedindicators are determined
Data needs across full monitoringprogramme reviewed to determineefficiencies possible through use of
common data to assess achievementin multiple areas
Periodically assess results
Priority monitoring programmesselected and implemented inconsultation with managers
Monitoring projects designed tocollect required data
Ind
icat
ors
Dat
a ne
eds
Mo
nito
ring
pro
ject
des
ign
and
imp
lem
enta
tion
Ana
lysi
s an
d
rep
ort
ing
37
As noted previously, clear objectives are unfortunately notalways defined for protected areas. Where these arelacking, they should be defined, e.g. by the developmentof a Protected Area Management Plan (Thomas &Middleton 2003). Hockings et al. (2000) though suggestthat as an alternative, broad conservation objectivescould be set according to IUCN Guidelines for ProtectedArea Management Categories (IUCN 1994).
Subsequently, a four-year UNESCO/IUCN Enhancing ourHeritage (EoH) project, funded by the United NationsFoundation, has been set up to develop and test theWCPA assessment framework and to improve monitoringand evaluation in natural World Heritage sites. The projectteam is working with staff at ten pilot World Heritage sitesin Africa, Asia and Latin America to develop and testassessment methods looking at management systemsand processes along with social and ecological impacts.
Rather than impose a prescriptive system on the wholeHeritage Site network, the project is developing andtesting a toolkit of methodologies, which will helpmanagers and stakeholders assess current activities,identify gaps and discuss how problems might beaddressed. The Toolkit for Assessing ManagementEffectiveness (Hockings et al. 2000b, c) consists of amanual, workbook and CD (containing both publicationsand explanatory PowerPoint presentations) and can beviewed at the EoH websitehttp://www.enhancingheritage.net/docs_public.asp.
Following an initial assessment of managementeffectiveness, team members and managers are using theresults to improve management and develop monitoringand assessment systems. According to Stolton (2003) thefollowing four clear lessons on developing monitoring andevaluation systems can be drawn from the experiences ofimplementing the project so far:
• Relevance and applicability: assessments have toprovide insights that are easily translated into realisticand achievable management actions.
• Adaptability: sites need assessment systemsdeveloped from a range of methodologies (‘toolkits’) tosuit realities and needs.
• Partnerships: self-assessment needs to bestrengthened by stakeholder involvement - achievedthrough open and transparent processes.
• Reporting: assessments have to produce resultssuitable for various reporting purposes – from local andnational to international requirements.
3.4.4 World Bank guidelines for monitoring andevaluation for biodiversity projects
The World Bank has produced guidelines for the designand implementation of M&E plans for biodiversityconservation projects or projects with biodiversitycomponents (World Bank 1998). They are intendedprimarily to assist World Bank task teams andconsultants, but it is also hoped that they may serve asuseful reference materials for others involved in thedesign, implementation and evaluation of biodiversityprojects.
M&E plans are mandatory for all Bank projects and mustbe developed as integral elements of projects to provide
information on whether project interventions aresuccessful in achieving project objectives and on howsocial, economic, political and institutional factors areaffecting project performance. According to the WorldBank terminology, monitoring and evaluation forbiodiversity projects involves two kinds of indicators:implementation performance indicators (termed projectinputs and outputs in this report) and project impactindicators, which the guidelines focus primarily on. Theguidelines recommend that a biodiversity M&E planshould:
• Answer a clearly stated set of questions (i.e. have clearobjectives);
• State clearly what indicators will be chosen;
• Specify how often monitoring and evaluation will bedone, and by whom;
• Outline any necessary training or financial inputs thatare required;
• State the intended audience for the evaluations;
• Specify how information will feed back intomanagement decisions; and
• State clearly the decision points at which action mustbe taken to address negative trends.
The guidelines also note that scoping of M&E plansshould be done during project preparation and shoulddefine the spatial and temporal scales of monitoringactivities. Furthermore, because biodiversity managementdeals with ecological processes which are generally long-term (e.g. changes in numbers of a population of a keyspecies) there is a need to establish a monitoringframework that will extend beyond the project term. Theappropriate spatial scale for project monitoring will bedetermined by the specific goals and objectives of theproject, and depend on whether it focuses at thelandscape, ecosystem or species level.
According to the guidance, the most important aspect ofany M&E project is the choice of suitable and meaningfulindicators. In particular indicators must be consistent withthe main objectives of the project, practical and realistic,and whenever possible, meaningful at both the nationaland site level. Thus, the specific indicators chosen for anyindividual project will depend on the particular objectivesand goals of that project and the activities that areproposed to meet those goals. Preparation of M&E plansand identification of relevant indicators should, as muchas possible, involve those communities and institutionslikely to be affected by project interventions.
General guidance is provided on identifying appropriatebiodiversity M&E indicators in different thematic areas andexamples of possible indicators are outlined in annexes.
3.4.5 The Nature Conservancy’s Conservation ActionPlanning system
The Nature Conservancy (TNC) in the USA has beendeveloping an integrated process for planning,implementing and measuring conservation success. Thisprocess is now called “Conservation Action Planning”(CAP) and builds on previous project-level planningpractices in TNC, including Site Conservation Planning,Conservation Area Planning, and the 5-S Framework.
38

Until recently the 5-S framework (which focused onsystems, stresses, sources, strategies, and success) wasused by TNC as the principal tool for designing conservationstrategies, planning conservation actions and developingmeasures of conservation effectiveness (TNC 2003).However, despite being widely adopted by TNC and havingmany strengths, it is recognised that it had a number ofweaknesses, particularly in its ability to measure projecteffectiveness. For example, it did not have explicit toolsfor rigorously measuring viability, conducting a situationanalysis, setting explicit goals and objectives, monitoringindicators related to key assumptions, or using theinformation to then adapt and learn. TNC thereforedeveloped an enhanced version of the 5-S Frameworkthat incorporates and emphasises all the elements of anadaptive management approach (TNC/FOS 2003).
Subsequently the process has been further developed inaccordance with planning and adaptive managementprinciples into the CAP system. It aims to provide objective,consistent and transparent accounting of conservationactions and the intended and actual outcomes ofconservation projects. The CAP process is supported bya network of trained CAP professionals that make up theEfroymson Coaches Network. An overview of the CAPprocess is provided in TNC (2005), which is availableonline at www.conserveonline.org/workspaces/cap/together with CAP and Efroymson Coaches Network news,tools, training opportunities, examples and guidancedocuments. Further information on the monitoringcomponents are provided in the original 5-S framework(TNC 2003) and Measures of Success (Margoluis &Salafsky 1998). TNC state that a CAP handbook will soonbe forthcoming.
It is beyond the scope of this report to describe the CAPsystem in detail, but its key concepts and some examplesof its potential application are given below.
According to TNC (2005) the process includes the following4 key steps and 10 actions (which although listed in alinear fashion is a circular process, though it may inpractice involve some simultaneous or iterative actions).
CAP (2005) provides a number of hypothetical examplesof some stages of the CAP process, including a viabilityassessment and establishment of measures, which areadapted (over page) in Boxes 3.2 and 3.3.
A. Define your project
1. Identify people involved in your project
Develop your core project team
Identify a good process leader
2. Define project scope and focal conservation targets
Describe project area(s) and your overall project vision
Select a minimum set of focal conservation targets
B. Developing strategies and measures
3. Assess viability of focal conservation targets
Select key ecological attributes (KEAs) and associatedindicators for each focal conservation target
Determine acceptable variation for each attribute
Determine current and desired status of each attribute
Document the sources of your information
4. Identify critical threats
Identify and rate the stresses affecting each target
Identify and rate the sources of stress affecting eachtarget
Combine the stress and source ratings to determinecritical threats
5. Conduct situation analysis
Assess the situation
Identify key stakeholders
6. Develop strategies: objectives and actions
Set objectives that describe “success”
Identify strategic actions you and/or your partners willundertake
7. Establish measures
Select a limited set of indicators to measure
Develop methods to track each indicator
C. Implementing your conservation strategies andmeasures
8. Develop work plans
Identify action steps and monitoring tasks
Access project resources and address critical needs
9. Implement
Put your plans into action
D. Using results to adapt and improve
10. Analyse, learn, adapt and share
Analyse actions and data from monitoring efforts
Use results to adapt actions and monitoring plans
Update project documents
Share your results with key audiences
Photograph: c Gilian Cleve
39
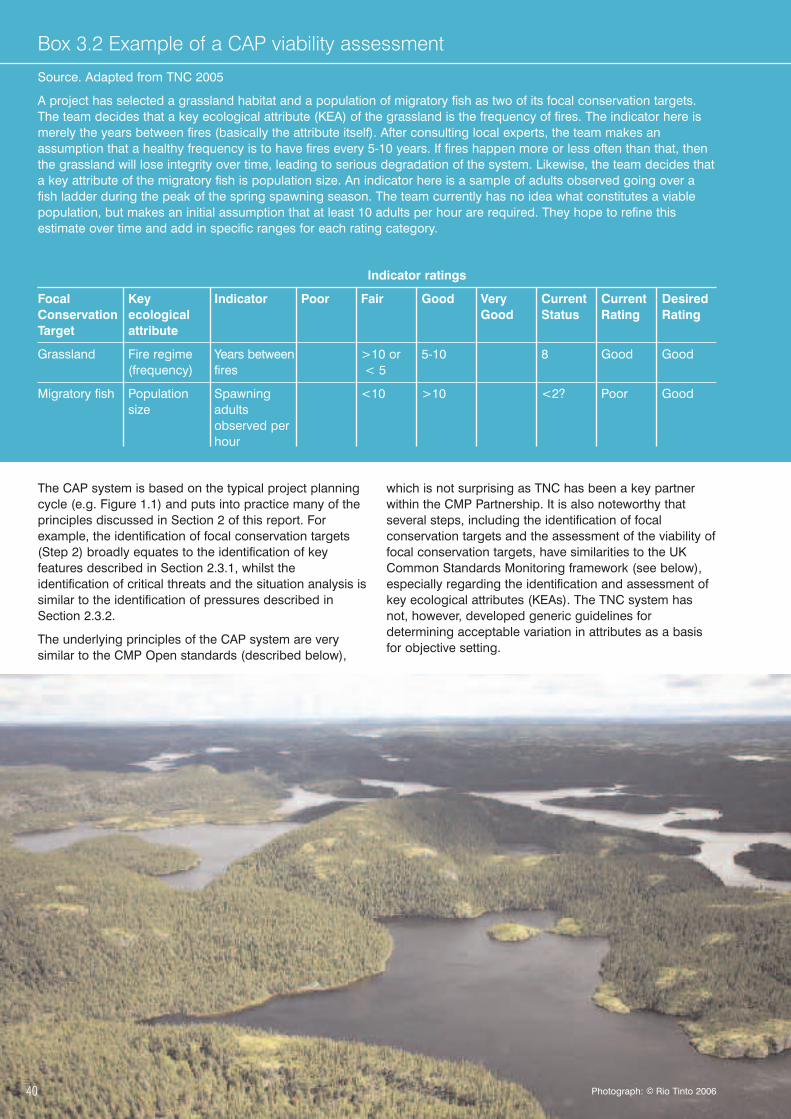
The CAP system is based on the typical project planningcycle (e.g. Figure 1.1) and puts into practice many of theprinciples discussed in Section 2 of this report. Forexample, the identification of focal conservation targets(Step 2) broadly equates to the identification of keyfeatures described in Section 2.3.1, whilst theidentification of critical threats and the situation analysis issimilar to the identification of pressures described inSection 2.3.2.
The underlying principles of the CAP system are verysimilar to the CMP Open standards (described below),
which is not surprising as TNC has been a key partnerwithin the CMP Partnership. It is also noteworthy thatseveral steps, including the identification of focalconservation targets and the assessment of the viability offocal conservation targets, have similarities to the UKCommon Standards Monitoring framework (see below),especially regarding the identification and assessment ofkey ecological attributes (KEAs). The TNC system hasnot, however, developed generic guidelines fordetermining acceptable variation in attributes as a basisfor objective setting.
Box 3.2 Example of a CAP viability assessment
Source. Adapted from TNC 2005
A project has selected a grassland habitat and a population of migratory fish as two of its focal conservation targets.The team decides that a key ecological attribute (KEA) of the grassland is the frequency of fires. The indicator here ismerely the years between fires (basically the attribute itself). After consulting local experts, the team makes anassumption that a healthy frequency is to have fires every 5-10 years. If fires happen more or less often than that, thenthe grassland will lose integrity over time, leading to serious degradation of the system. Likewise, the team decides thata key attribute of the migratory fish is population size. An indicator here is a sample of adults observed going over afish ladder during the peak of the spring spawning season. The team currently has no idea what constitutes a viablepopulation, but makes an initial assumption that at least 10 adults per hour are required. They hope to refine thisestimate over time and add in specific ranges for each rating category.
Indicator ratings
Focal Key Indicator Poor Fair Good Very Current Current Desired Conservation ecological Good Status Rating RatingTarget attribute
Grassland Fire regime Years between >10 or 5-10 8 Good Good(frequency) fires < 5
Migratory fish Population Spawning <10 >10 <2? Poor Goodsize adults
observed perhour
40 Photograph: c Rio Tinto 2006

Box 3.3 Example of the establishment of measures under the CAP system
Source. Adapted from TNC 2005
In developing its measures, the project team first considers how to track progress towards meeting stated objectivesfrom Step 5 – which were:
Objective 1. By 2009, commercial fishing take has been reduced to 50% of 2004 levels.
Objective 2. Remove the downstream dam by 2007.
Measures will often include indicators informing critical threats as well as indicators for key attributes developed duringStep 3. Next, they consider the need for status indicators not directly tied to ongoing actions. For example, themigratory fish target requires adequate water quality for successful recruitment. The team does not currently believewater quality is compromised but they periodically want to confirm this assumption. They also identify the need to trackthe introduction of invasive fish species as an early warning of a possible new threat that may warrant action in thefuture. As the team develops each indicator, it also decides on the specific method they will use to track it. Most ofthese methods are very simple and where possible, make use of data already being collected by other people.
Information need and type
Objectives
O1. Reduce commercial Threat Commercial fishing take Download government fishing records
Threat Boats in watershed Download government records
KEA Spawning adults observed / Direct observations byhr* (*Also informs next volunteers each springobjective)
O2. Remove dam Threat Presence of dam Direct observation
Other status (early warning measures)
Water quality KEA & threat Concentration of specific State water quality toxic chemicals records
Exotic fish species Threat Presence of invasive species Interview fish & wildlife in watershed reps and track news
stories41
Photograph: c Steve Gray

3.4.6 Conservation Measures Partnership (CMP) OpenStandards (CMP 2004)
The CMP has used the experience gained byconservation organisations (such as TNC – see above)while designing, implementing and appraising theirconservation projects, to develop a set of project cycle oradaptive management open standards that they believe,are fundamental to effective conservation. Thesestandards are not designed to be prescriptive, but form aframework and guidance for conservation action. Theirgoal is “to bring together common concepts, approaches,and terminology in conservation project design,management, and monitoring in order to help practitionersimprove the practice of conservation. In particular, thesestandards are meant to provide the steps, principles,tasks, and guidance necessary for the successfulimplementation of conservation projects.” In addition, thestandards are also intended to form the foundation of a
conservation audit process, which has also beendeveloped by CMP (see below).
The main components of the open standards – principles,tasks, and guidance – are organised according to sevengeneric steps (Table 3.5). These, or similar steps arewidely followed in conservation and other fields thatimplement projects to achieve clearly defined goals. Inaddition they recognise the following general principlesthat apply to all the steps, namely that a project should:
• Involve stakeholders.
• Clearly define a timeline.
• Budget sufficient financial resources and humancapacity.
• Document decisions.
Table 3.5 Principles of good practice listed in the CMP Open Standards for thePractice of Conservation
Step Principle
1 Conceptualise what you will achieve in the context of where you are working
1a. Be clear and specific about the issue or problem you intend to address
1b. Understand the context in which your project takes place
1c. Create a model of the situation in which your project takes place
2 Plan both your actions and monitoring and evaluation (M&E)
2.1a Develop your goal and objectives
2.1b Strategically select activities that will accomplish your goal and objectives
2.1c Develop a formal action plan
2.2a Focus your M&E on what you need to know
2.2b Develop a formal M&E plan
3 Implement both your actions and monitoring and evaluation
4 Analyse your data to evaluate the effectiveness of your activities
4a Analyse your M&E information
4b Analyse why an intervention succeeded or failed
4c Communicate results within project team
5 Use your results to adapt your project to maximise impact
5a. Adapt your action plan and M&E plan based on your results
6 Communicate your results to key external and internal audiences
6a Develop a clear dissemination strategy aimed at your audiences
7 Iterate – Go through the project cycle continuously to constantly improve
7a Revisit steps in the overall process on a regular basis
7b Create a learning environment
42
Several of the steps and principles relate to issuesdiscussed in Section 2.3.1 above. In particular Principle2.1a (associated with Step 2 - planning) stresses the needto develop clear goals and objectives in the formulation ofan action plan. It suggests that a goal9 is firstly set, whichdescribes the future status of the biodiversity features thatone is aiming to conserve. Objectives are then set for keyfactors (i.e. key pressures cf. Figure 2.2) that will beaddressed by the project. Principle 2.2a then recommendsthat M&E efforts are almost exclusively focused on thegoals, objectives and activities that have been set. Thishelps to ensure that sufficient data is collected to evaluateprogress objectively, whilst avoiding unnecessary datacollection.
However, the CMP guidance does not suggest that specificobjectives are set for the key biodiversity features themselves,which is a weakness, as it will not be possible to establishif management of key factors actually clearly delivers desiredbiodiversity impacts. Unless the goals are very clearlydefined (using SMART criteria) and are directly monitored,it will not be possible to assess performance directly.
3.4.7 UK Statutory Common Standards Monitoring
The UK statutory conservation agencies have developeda detailed standardised Common Standards Monitoring(CSM) framework for monitoring the condition of habitatsand species on Sites of Special Scientific Interest (JNCC2003). The key element of CSM is that the condition ofeach site is assessed with respect to site-specificConservation Objectives for the Interest Feature(s) forwhich the site was notified. A common terminology isused to describe the condition of each feature (JNCC1998) and the principal aim is to achieve FavourableCondition in the feature. The UK Government also has aPublic Service Agreement to achieve 95% FavourableCondition (by area) of SSSIs by 2010.
CSM Conservation Objectives define Favourable Conditionby setting standards that are to be met for the feature tobe considered to be in Favourable Condition. Each featureon a site will have one or more attributes that are used todefine FC. Attributes are characteristics of a feature thatdescribe its condition, either directly or indirectly. They canbe regarded as indicators which allow judgements to bemade about the condition of the feature. The selection ofattributes must take into account two important principles:
• All attributes must be measurable, so that targets canbe set as part of the Conservation Objective for thefeature.
• Attributes should describe the condition of the featureand not the factors which influence it – in general,management activities are not suitable attributes. Thusin determining if grassland is in Favourable Conditionor not, one of the attributes to be assessed may besward height – this is what is being aimed at, not themechanism by which it is achieved, which might be viagrazing or by mowing.
There is a wide range of suitable possible biodiversityattributes. For example, habitat attributes may includeextent, floristic composition, vegetation structure, andphysical characteristics; species attributes may includepopulation size, distribution, food availability, and habitatfactors.
For habitat interest features, floristic or vegetativeattributes have generally been used as indicators of thecondition of the habitat. However, the definitions ofFavourable Condition for habitats are not based solely onmaintaining suitable conditions for plant species. In somecases, the requirements of animal species have also beentaken into account, and attributes have, where possible,been selected which convey information about the typicalfauna associated with each habitat (e.g. structuralfeatures and fine-scale patterning of vegetation).
Conservation objectives are set out for each attribute ofeach feature in Favourable Condition Tables which takeninto account generic guidance on acceptable variationand limits of attributes. Generic guidance is produced forall the main habitat types in the UK. For example, genericguidance for the condition of blanket bogs includesminimum standards for vegetation composition. Thesestate that:
• At least 6 indicator species should be present (from alist of agreed indicator species).
• At least 50% of the vegetation cover should consist ofat least 3 indicator species.
• No more than 1% of the vegetation should consist ofnon-native species.
• Less than 10% of vegetation cover should be made upof a scattered canopy of trees and shrubs.
Full details of the system and the generic guidance forassessing Favourable Condition is available from theJNCC website http://www.jncc.gov.uk/page-2217.
The system is now in use across the UK and a report onthe condition of all statutory protected sites is expectedsoon. The widespread use of this standardised systemhas enabled the UK government to set a SMARTobjective of achieving Favourable Condition on 95% ofSSSIs by 2010. This has very successfully stimulatedconsiderable conservation efforts focused on improvingthe conservation management of many SSSIs.
Another important property of the system is that, becauseit uses standard definitions of Favourable Condition forspecific habitats and species, performance can becompared over time, and amongst habitats, species,regions and landowners etc. Thus corporations can setSMART objectives for and report on the percentage ofFeatures that are on SSSIs on their landholdings that arein Favourable Condition. In fact the Kelda Group hasstated its intention to return at least 15% of SSSIs tofavourable status (see Appendix 2).
Although developed for the monitoring of habitats andspecies on SSSIs in the UK, the system can be adaptedfor use on other protected areas, non-protected areasand other countries.
3.4.8 Threat Reduction Assessments
Salafsky and Margoluis (1999) have proposed anapproach to evaluating conservation and developmentprojects that is based on a Threat Reduction Assessmentachievement of the desired state of biodiversity
9A goal is a general summary of the desired state that a project isworking to achieve.
43

components as a proxy measure of conservationsuccess. The core principle being that if threats (i.e.biodiversity pressures) can be identified then monitoringcan assess progress by monitoring the degree to whichthese threats are reduced (Margoluis & Salafsky 1998).
The system involves the following 7 steps:
1. Define the project area spatially and temporally.
2. Develop a list of all direct threats to the biodiversity atthe project site (NB. this is problematical unlessbiodiversity objectives are set, but this is notmentioned by the authors).
3. Rank each threat according to three criteria: area,intensity and urgency.
4. Add up the rank scores across the three criteria.
5. Determine the degree to which each threat is reduced(expressed as percentage change), either byquantitative survey or subjective means. (NB.Although not explicitly stated by the authors, thespecific objectives being monitored are the alleviationof each threat. However, with the setting of SMARTobjectives for each threat it may be difficult toconsistently assess alleviation of threats).
6. Calculate the raw score for each threat (by multiplyingthe total ranking score by percentage reduction).
7. Calculate the final threat reduction index (i.e. the sumof all raw threat scores divided by the sum of allrankings, multiplied by 100). (NB. This addition ofthreat scores may be scientifically invalid if one ormore threats are of critical importance).
The advantages of the approach, compared toassessments of biodiversity state indicators, is that it isquicker to detect changes, allows comparisons betweendifferent projects (if common threat indicators are used)and is simple, practical and cost effective. However, theapproach has three assumptions which limit its reliabilityas an indirect performance impact measure. Firstly, allbiodiversity threats are human induced; secondly, theycan be identified, distinguished and ranked in terms ofimpact and intensity; and thirdly, they can be measuredor estimated. In reality, these assumptions are unlikely tobe sufficiently met for the system to provide reliable andaccurate assessments of actual biodiversity impacts.Thus, unless the biodiversity component and itsecosystem has been the subject of intensive long-termstudies TRA can only serve as a guide to likely impacts.In such circumstances assessments should also addressstate and response indicators – i.e. follow the fullPressure, State, Response framework.
3.4.9 ISO 14301 Environmental PerformanceEvaluation
ISO 14031 is an international standard that describes aprocess for measuring environmental performance. It isnot a standard for certification, such as ISO 14001, but itfits into the ISO 14000 series of standards, and isintended to assist organisations in obtaining ISO 14001certification. The evaluation process aims to providemanagement with reliable and verifiable information on anongoing basis to determine whether or not itsorganisation’s environmental performance is meeting
criteria it has set for itself.
Companies that use an EMS should evaluate theirperformance against policies, objectives and targets setwithin their EMS. However, organisations without an EMSmay still use the process to determine environmentalaspects of importance and to set performance criteria forthese. Indeed, Putnam (2002) found that ISO 14031 isbeing used by organisations of all sizes, types, locationsand complexity, and provides benefits to organisationswith and without EMS.
The process is based on the typical EMS Plan-Do-Check-Act model of business management. Rather than listingpotential indicators ISO 14031 provides guidance ondefining three basic types of indicator: environmentalcondition indicators (e.g. number of fish deaths in a watercourse per year), management performance indicators(e.g. number of management levels with specificenvironmental responsibilities) and operationalperformance indicators (e.g. waste water discharged perunit of product).
4 CONCLUSIONS
4.1 SUMMARY OF THE ADVANTAGES ANDDISADVANTAGES OF THE KEY APPROACHES FORBIODIVERSITY CONSERVATION PERFORMANCEMEASUREMENT
This project aims to identify performance measures thatcan be used to evaluate the outcomes of conservationefforts both within the corporate sector and theconservation community.
With respect to performance measures the study hasfound that corporate biodiversity conservationperformance measurement systems developed so far areof limited direct relevance. This is primarily because (asdescribed in Section 2.3), the direct measurement ofbiodiversity conservation performance impacts is normallyvery difficult. Biodiversity cannot be directly measured asone parameter. Thus performance measurementrequirements vary considerably between sectors,individual organisations and audiences. Consequently‘off-the-shelf’ solutions such as lists of generic indicatorsare unlikely to be satisfactory.
Furthermore, biodiversity often responds slowly and incomplex ways to environmental changes andconservation actions. Direct measures of biodiversityperformance thus tend to be costly, and time consuming,and often provide inconclusive assessments ofperformance. Therefore, most systems that have beendeveloped or recommended for biodiversity conservationperformance measurements have focused on indirectindicators that measure inputs, activities, processes oroutputs, rather than impacts (or outcomes). Those that dosuggest direct indicators of the state of biodiversity (suchas some GRI indicators) are very broad and ill-defined,and need to be refined and focused on relevant project-specific issues for them to be applicable to specificcompany needs.
Some useful guidance has been produced, including theEBI and ICMM guidance for identifying such projectspecific indicators. The EBI system, however, does notappear to clearly link indicators to predefined objectives,which may lead to potential confusion. As pointed out in
44
much of the guidance (e.g. Hockings et al. 2000),performance monitoring needs first and foremost to belinked to clearly defined objectives. In this respectcorporate performance systems can learn much from thepractical systems developed by conservationorganisations, such as TNC, CMP and the UK StatutoryAgencies (as described above).
Many of the same problems discussed above also relateto guidance on the assessment of conservation projects.So far conservation performance measurement systemseither tend to focus on processes (e.g. the CMP OpenStandards and audits), indirect measures (e.g. the ThreatReduction Assessment system) or are related to projectspecific objectives identified through processes such asLogical Framework Approach. The latter approach ifcarried out thoroughly should provide clear SMARTobjectives against which projects can be assessed. Inpractice, these often tend to be expressed in terms ofoutputs rather than impacts (for the reasons discussedabove). However, some conservation organisations (suchas the TNC and UK Statutory Agencies) have furtherdeveloped results focused approaches so that they nowinclude direct measures of actual impacts in an objectiveyet practical way (see Section 3.4).
Another important issue regarding the performancemeasurements systems so far developed is that mosttend to be internal self-assessments. As conflicts ofinterest could arise through such systems, thenadditional independent verification / audit systems areneeded to ensure credibility with all stakeholders(Kleiman et al. 2000). The CMP audit system mightprovide a means of meeting such requirements, butfurther details of the process and outputs are needed toevaluate its suitability for these purposes.
4.2 RECOMMENDATIONS FOR FURTHERINVESTIGATION
4.2.1 Generic issues and requirements
This study has found that it should be possible todevelop appropriate systems for corporate andconservation NGO reporting by adapting some of theexisting systems in accordance with the specificrequirements of each organisation and the best practiceprinciples of project design and monitoring identified inthis study.
As a guideline, all conservation performance measurementssystems should have the following properties:
1. Comprehensive coverage of all likely significantdetrimental and beneficial biodiversity impacts withinthe sphere of influence of the organisation in question.
2. Provision of sufficiently accurate and precise quantitativedata on achievement of SMART biodiversityconservation objectives.
3. Standard operating protocols for monitoring, analysisand reporting so that results can be compared acrossbusiness units / projects / programmes, and betweenyears.
4. Ownership and support amongst staff (i.e. they realisethe benefits of measuring their performance), perhapswith impact linked incentives (e.g. performance relatedbonuses).
5. Cost-effectiveness (i.e. they use the lowest costmethods to provide the required data of the requiredstandard).
6. Credibility, such that the data and reported results aretrusted by all stakeholders (e.g. as a result ofindependent data collection and audits).
Approaches for developing these systems and some keyconsiderations are outlined below.
4.2.2 Corporate reporting on net biodiversity impacts
Many businesses should be able to quantify significantbiodiversity impacts by developing a system based on anexpanded and best practice EIA approach linked toestablished EMS procedures as summarised in Figure4.1 (assuming that these procedures are alreadyimplemented).
This would entail the following key stages for eachproject undertaken (which could then be collated andconsolidated for corporate level reporting).
• Identify all significant ecosystems services (e.g.provision of food, water resources, support forthreatened species, medicinal plants, cultural uses),identify key attributes and indicators of these and setobjectives (e.g. maintenance of minimum river flowsand water quality to maintain populations ofthreatened species, fish stocks and drinking water).This should follow the CBD guidelines for EIA (CBDDecision VI/710). It should also take into account theecosystem approach as agreed by the CBD (CBDDecision V611), which requires that the managementof natural resources gives priority to the maintenanceof local ecological processes. Those processesinclude activities such as nutrient cycling, populationchanges and water balance.
• Establish baselines for these, and likely no-projectfuture scenarios (e.g. threatened species may bedestined for certain extinction anyway).
• Set SMART objectives for services and attributes.
• Determine residual project impacts on each andacceptable means of offsetting residual impacts (ifthese cannot be agreed then the project should bemodified, until impacts and offsets are acceptable, orabandoned).
• Monitor impacts on services via pressure, responseand state indicators, and modify project and offsetmeasures etc according to adaptive managementprinciples where necessary.
• Assess and report on project monitoring resultsagainst agreed objectives, amalgamate results ofprojects and report at corporate level.
• If necessary, consult with relevant stakeholders andagree options with authorities for further measures /offsets to make up for non-critical shortfalls in objectiveachievements and to obtain a net biodiversity benefit.
10Available at http://www.biodiv.org/decisions/default.aspx?m=COP-06&id=7181&lg=0
11Available at http://www.biodiv.org/decisions/default.aspx?m=COP-05&id=7148&lg=0
45

The process should be a bottom-up approach, so thatdecisions on net biodiversity gain are made at a locallevel with stakeholders. However, the system should bedesigned to enable amalgamation of performancemeasures for reporting at higher levels (e.g. businessunits and corporate level).
To develop such a system companies need to ensureclearly defined requirements for reporting (includingaudiences) and the scope of impacts must be taken intoaccount in the assessment of net biodiversity impact (inparticular the issues of the starting point, longitudinalscope and breadth of impacts discussed in Section 1.2.3).
4.2.3 NGO reporting on conservation projectperformance
A conservation performance measurement system forconservation NGOs can be developed, integrated andstandardised with existing reporting systems given thatthese exist. The principal step would be to ensure thatSMART objectives are set for each project according tothe pressure, state, response framework. Thus, feasibleand appropriate objectives would be set for biodiversityconservation inputs, activities, outputs, and wherepossible impacts on the state of the target biodiversityfeatures. For example, a research project that aims to
Figure 4.1. A potential system for monitoring business project relatedbiodiversity impacts.
Key features (ecosystem services)
Independent verification
Independent audit of monitoringsystem and performance results
Baselines and scenarios
Impacts identified (a, b, c…)
Residual impacts identified
SMART Offset objectives agreed
Environmental managementprogramme agreed with authorities
Project and offsets undertaken
Adaptive responses, inc additionaloffsets / measures to address
shortfalls
Surveys
Stakeholders
Stakeholders
Mitigation options
SMART mitigation objectives agreedwith authorities
Monitoring programme developed
Monitoring implemented
Report to stakeholders
Performance assessment againstobjectives
Scoping survey
46
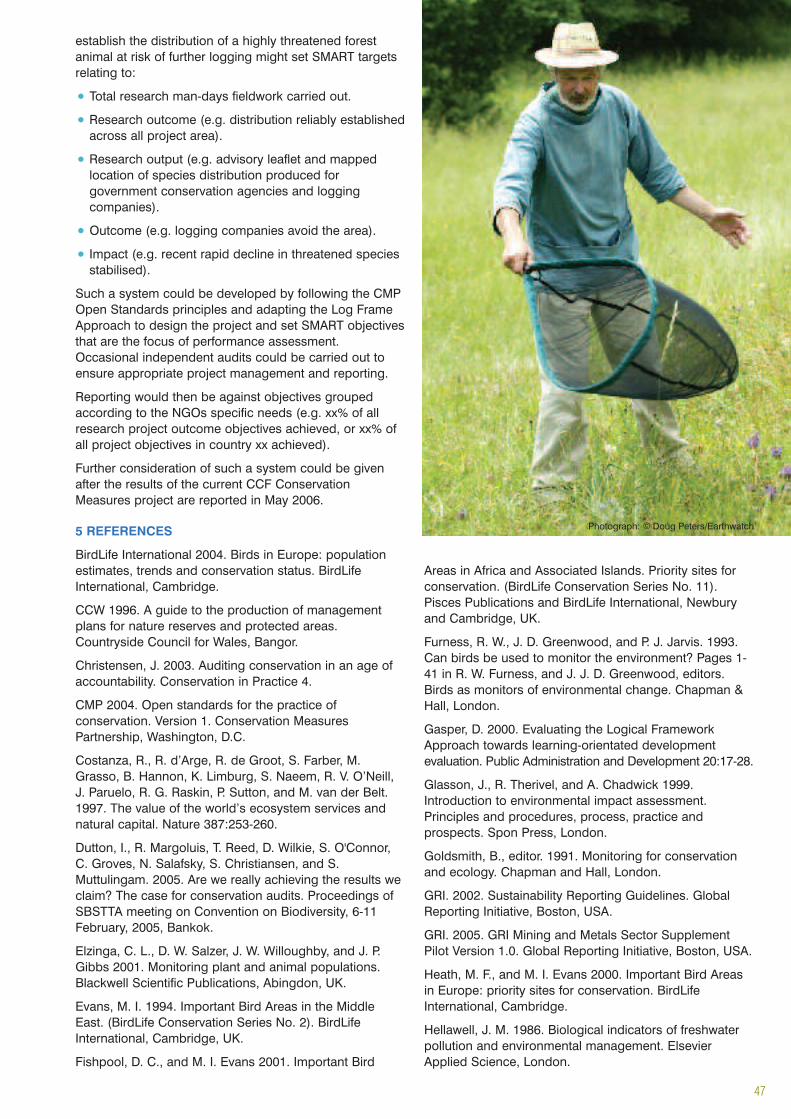
establish the distribution of a highly threatened forestanimal at risk of further logging might set SMART targetsrelating to:
• Total research man-days fieldwork carried out.
• Research outcome (e.g. distribution reliably establishedacross all project area).
• Research output (e.g. advisory leaflet and mappedlocation of species distribution produced forgovernment conservation agencies and loggingcompanies).
• Outcome (e.g. logging companies avoid the area).
• Impact (e.g. recent rapid decline in threatened speciesstabilised).
Such a system could be developed by following the CMPOpen Standards principles and adapting the Log FrameApproach to design the project and set SMART objectivesthat are the focus of performance assessment.Occasional independent audits could be carried out toensure appropriate project management and reporting.
Reporting would then be against objectives groupedaccording to the NGOs specific needs (e.g. xx% of allresearch project outcome objectives achieved, or xx% ofall project objectives in country xx achieved).
Further consideration of such a system could be givenafter the results of the current CCF ConservationMeasures project are reported in May 2006.
5 REFERENCES
BirdLife International 2004. Birds in Europe: populationestimates, trends and conservation status. BirdLifeInternational, Cambridge.
CCW 1996. A guide to the production of managementplans for nature reserves and protected areas.Countryside Council for Wales, Bangor.
Christensen, J. 2003. Auditing conservation in an age ofaccountability. Conservation in Practice 4.
CMP 2004. Open standards for the practice ofconservation. Version 1. Conservation MeasuresPartnership, Washington, D.C.
Costanza, R., R. d’Arge, R. de Groot, S. Farber, M.Grasso, B. Hannon, K. Limburg, S. Naeem, R. V. O’Neill,J. Paruelo, R. G. Raskin, P. Sutton, and M. van der Belt.1997. The value of the world’s ecosystem services andnatural capital. Nature 387:253-260.
Dutton, I., R. Margoluis, T. Reed, D. Wilkie, S. O'Connor,C. Groves, N. Salafsky, S. Christiansen, and S.Muttulingam. 2005. Are we really achieving the results weclaim? The case for conservation audits. Proceedings ofSBSTTA meeting on Convention on Biodiversity, 6-11February, 2005, Bankok.
Elzinga, C. L., D. W. Salzer, J. W. Willoughby, and J. P.Gibbs 2001. Monitoring plant and animal populations.Blackwell Scientific Publications, Abingdon, UK.
Evans, M. I. 1994. Important Bird Areas in the MiddleEast. (BirdLife Conservation Series No. 2). BirdLifeInternational, Cambridge, UK.
Fishpool, D. C., and M. I. Evans 2001. Important Bird
Areas in Africa and Associated Islands. Priority sites forconservation. (BirdLife Conservation Series No. 11).Pisces Publications and BirdLife International, Newburyand Cambridge, UK.
Furness, R. W., J. D. Greenwood, and P. J. Jarvis. 1993.Can birds be used to monitor the environment? Pages 1-41 in R. W. Furness, and J. J. D. Greenwood, editors.Birds as monitors of environmental change. Chapman &Hall, London.
Gasper, D. 2000. Evaluating the Logical FrameworkApproach towards learning-orientated developmentevaluation. Public Administration and Development 20:17-28.
Glasson, J., R. Therivel, and A. Chadwick 1999.Introduction to environmental impact assessment.Principles and procedures, process, practice andprospects. Spon Press, London.
Goldsmith, B., editor. 1991. Monitoring for conservationand ecology. Chapman and Hall, London.
GRI. 2002. Sustainability Reporting Guidelines. GlobalReporting Initiative, Boston, USA.
GRI. 2005. GRI Mining and Metals Sector SupplementPilot Version 1.0. Global Reporting Initiative, Boston, USA.
Heath, M. F., and M. I. Evans 2000. Important Bird Areasin Europe: priority sites for conservation. BirdLifeInternational, Cambridge.
Hellawell, J. M. 1986. Biological indicators of freshwaterpollution and environmental management. ElsevierApplied Science, London.
Photograph: c Doug Peters/Earthwatch
47

Hill, D., M. Fasham, G. Tucker, M. Shewry, and P. Shaw2005. Handbook of biodiversity methods: survey, evaluationand monitoring. Cambridge University Press, Cambridge.
Hirons, G., B. Goldsmith, and G. Thomas. 1995. Sitemanagement planning in W. J. Sutherland, and D. A. Hill,editors. Managing habitats for conservation. CambridgeUniversity Press, Cambridge.
Hockings, M. 2000. Evaluating protected area management.A review of systems for assessing management effectivenessof protected areas. School of Natural and Rural Systems.
Hockings, M., S. Stolton, and N. Dudley 2000a. Evaluatingeffectiveness: a framework for assessing the managementof protected areas. IUCN, Gland, Switzerland andCambridge, UK.
Hockings, M., S. Stolton, N. Dudley, and J. Parrish 2000b.The enhancing our heritage toolkit - Book 1. A trainingmanual on how to build assessment, monitoring andreporting systems on the management effectiveness ofWorld Heritage Sites. UNESCO / IUCN.
Hockings, M., S. Stolton, N. Dudley, and J. Parrish 2000c.The enhancing our heritage toolkit - Book 2. Theworkbook on how to build assessment, monitoring andreporting systems on the management effectiveness ofWorld Heritage Sites. UNESCO / IUCN.
Holling, C. S. 1978. Adaptive environmental assessmentand management. John Wiley & Sons, New York.
ICMM. 2005. Good practice guidance for mining andmetals. International Council for Mines and Mining.
ISIS Asset Management 2004a. Are extractive companiescompatible with biodiversity? Extractive industries andbiodiversity: a survey. ISIS Asset Management, London.
ISIS Asset Management 2004b. Is biodiversity a materialrisk for companies? An assessment of the exposure ofFTSE sectors to biodiversity risk. ISIS Asset Management,Edinburgh.
IUCN. 1994. Guidelines for protected area managementcategories. IUCN, Gland, Switzerland and Cambridge, UK.
IUCN 2001. IUCN Red List categories and criteria: Version3.1. IUCN Species Survival Commission, Gland,Switzerland and Cambridge, UK.
Jepson, P., and S. Canney. 2003. The state of wild AsianElephant conservation in 2003. Conservation Direct andElephant Family, London.
JNCC 1998. A statement on common standards monitoring.Joint Nature Conservation Committee, Peterborough.
JNCC. 2003. Guidance for Common StandardsMonitoring introduction text. JNCC, Peterborough.
Kleiman, D. G., R. P. Reading, B. J. Miller, T. W. Clark, M.Scott, J. Robinson, R. L. Wallace, R. J. Cabin, and F.Felleman. 2000. Improving the evaluation of conservationprograms. Conservation Biology 14:356-365.
KMPG. 1999. KPMG International Survey ofEnvironmental Reporting 1999. KMPG EnvironmentalConsulting, Amsterdam, The Netherlands.
MacKinnon, J., K. MacKinnon, G. Child, and J. Thorsell1986. Managing protected areas in the tropics. IUCN,Gland, Switzerland and Cambridge, UK.
Margoluis, R., and N. Salafsky 1998. Measures ofsuccess: designing, managing and monitoringconservation and development projects. Island Press,Washington, D.C.
Millennium Ecosystem Assessment 2005. Ecosystemsand human well-being: Biodiversity synthesis. WorldResources Institute, Washington, D.C.
NERI. 1995. Nature indicators survey. Ministry of theEnvironment and Energy & National EnvironmentalResearch Institute, Copenhagen, Denmark.
OECD 1993. OECD core set of indicators forenvironmental performance reviews. Organisation forEconomic Cooperation and Development, Paris.
Putnam, D. 2002. ISO 14031: Environmental performanceevaluation. Confederation of Indian Industry.
Ramsar Bureau 2002. New Guidelines for managementplanning for Ramsar sites and other wetlands. RamsarBureau, Gland, Switzerland.
Randerson, J., 2003. Nature's best buys. New Scientist, 1March 2003, 32-35.
Rigby, D., D. Howlett, and H. L. Woodhouse. 2000.Sustainability indicators for natural resource managementand policy: a review of indicators of agricultural and rurallivelihood sustainability. University of Manchester,Manchester, UK.
Rio Tinto. 2004. Sustaining a natural balance. A practicalguide to integrating biodiversity into Rio Tinto's operationactivities. Rio Tinto, London.
Rowell, T. A. 1994. Ecological indicators for natureconservation monitoring. Joint Nature ConservationCommittee, Peterborough.
Salafsky, N., and R. Margoluis. 1999. Threat reductionassessment: a practical and cost-effective approach toevaluating conservation and development projects.Conservation Biology 13:830-841.
Salafsky, N., R. Margoluis, and K. H. Redford 2001.Adaptive management: a tool for conservation practioneers.Biodiversity Support Program, Washington, D.C.
Salafsky, N., R. Margoluis, K. H. Redford, and R. J.G.2002. Improving the practice of conservation: aconceptual framework and research agenda forconservation science. Conservation Biology:1469-1479.
Smith, E. P. 2002. BACI design in A. H. El-Shaarawi, andW. W. Piegorsch, editors. Encyclopedia of environmetrics.John Wiley & Sons, Chichester.
Staub, F., and M. E. Hatziolos 2004. Score card to assessprogress in achieving management effectivenss goals formarine protected areas, revised. World Bank,Washington, D.C.
Stem, C., R. Margoluis, N. Salafsky, and N. Brown. 2005.Monitoring and evaluation in conservation: a review oftrends and approaches. Conservation Biology 19:295-309.
Stolton, S. 2003. Enhancing our heritage. Monitoring andmanaging for success in natural World Heritage sites.World Parks Congress, Durban.
Stolton, S., M. Hockings, N. Dudley, K. MacKinnon, and T.Whitten 2003. Reporting progress in protected areas: A
48

site-level management effectiveness tracking tool. WorldBank and WWF.
Sutherland, W. J., editor. 1996. Ecological censustechniques. Cambridge University Press, Cambridge.
ten Brink, B. J. E., S. H. Hosper, and F. Colijn. 1991. Aquantitative method for description and assessment ofecosystems: the AMOEBA-approach. Marine PollutionBulletin 23:265-270.
ten Kate, K., J. Bishop, and R. Bayon 2004. Biodiversityoffsets: views, experience, and the business case. IUCNand Insight Investment, Gland, Switzerland andCambridge, UK.
Thomas, L., and J. Middleton 2003. Guidelines formanagement of protected areas. IUCN, Gland,Switzerland and Cambridge, UK.
TNC 1999. Site consolidated scorecard manual. TheNature Conservancy, Arlington, USA.
TNC 2003. The five-S framework for site conservation. Apractitioner’s handbook for site conservation planningand measuring conservation success. The NatureConservancy, Washington, D.C. Available fromwww.conserveonline.org
TNC/FOS 2003. The enhanced 5-S project managementprocess: an overview of proposed standards for developingstrategies. The Nature Conservancy, Arlington, USA.
TNC 2005. Conservation Action Planning. Developing
strategies, taking action and measuring success at anyscale. The Nature Conservancy, Washington, D.C.Available from www.conserveonline.org
Treweek, J. 1999. Ecological impact assessment.Blackwell Scientific Publications, Oxford.
Tucker, G. M., P. Bubb, d. H. M., L. Miles, A. Lawrence, J.van Rijsoort, S. B. Bajracharya, R. C. Nepal, and R. C.Sherchan, N. 2005. Guidelines for biodiversityassessment and monitoring for protected areas. KingMahendra Trust for Nature Conservation / UNEP-WCMC,Kathmandu, Nepal / Cambridge, UK.
Tucker, G. M., and M. Evans 1997. Habitats for birds inEurope: a conservation strategy for the widerenvironment. BirdLife International, Cambridge.
Tucker, G. M., and M. F. Heath 1994. Birds in Europe: theirconservation status. BirdLife International, Cambridge.
Underwood, A. J. 1992. Beyond BACI: experimentaldesigns for detecting human environmental impacts ontemporal variations in natural populations. AustralianJournal of Marine and Freshwater Research 42:569-587.
Woodhill, J. 2000. Planning, monitoring and evaluatingprogrammes and projects: introduction to key concepts,approaches and terms. IUCN, Gland, Switzerland.
World Bank 1998. Guidelines for monitoring andevaluation for biodiversity projects. World Bank,Washington, D.C.
6 GLOSSARY AND ACRONYMS
Attributes Characteristics, qualities or properties of a feature that are inherent to, and inseparable from, the feature. For species these may include population size, structure, habitat requirements, distribution and other parameters. Attributes of habitats may include key species, composition, structure, supporting processes and other parameters
BAP Biodiversity Action Plan
Biodiversity “the variability among living organisms from all sources including, inter alia, terrestrial, marine and other aquatic ecosystems and the ecological complexes of which they are part; this includesdiversity within species, between species, and of ecosystems.” (Convention on Biological Diversity, Rio, 1992)
Biodiversity The variability among living organisms from all sources including, inter alia, terrestrial, marine(Biological Diversity) and other aquatic ecosystems and the ecological complexes of which they are part; this includes
diversity within species, between species, and of ecosystems (U.N. Convention on Biological Diversity, Article 2 ).
CBD Convention on Biological Diversity
CMP Conservation Measures Partnership
Compensation Actions taken to compensate for residual environmental impacts of a project; broadly analogous to offsets
COP Conference of Parties
CR Corporate Responsibility
CSR Corporate Social Responsibility
Cumulative impacts Impacts that accumulate over space and time from multiple projects
Ecosystem Communities of organisms interacting with abiotic factors and with each other as a distinct unit
EIA Environmental Impact Assessment
49

EMS Environmental Management System. The system of organisational capacity, plans, procedures, resources, policies and standards used by companies to manage their environmental programmes
NGO Environmental non-governmental organisation
ESIA Environmental and Social Impact Assessment
Feature A habitat, habitat matrix, species or a species assemblage occurring on a site
GRI Global Reporting Initiative
IBA Important Bird Area (as defined by BirdLife International)
ICMM International Council for Mining and Metals
Indicator An indicator is a measurable entity used to assess the status and trend of a specific factor
M&E Monitoring and Evaluation
MEA Millennium Ecosystem Assessment
Mitigation The process of preventing, avoiding or minimising adverse environmental impacts
Monitoring “The collection and analysis of repeated observations or measurements to evaluate changes in condition and progress toward meeting a management objective” (Elzinga et al. 2001).
NGO Non-governmental organisation
Offset Biodiversity offsets as conservation actions intended to compensate for the residual, unavoidableharm to biodiversity caused by development projects, so as to ensure no net loss of biodiversity (ten Kate et al. 2004).
Protected Area IUCN (1994) defines a protected area as: An area of land and/or sea especially dedicated to the protection and maintenance of biological diversity, and of natural and associated cultural resources, and managed through legal or other effective means.
Restoration Reclamation that is guided by ecological principles and promotes the recovery of ecological integrity; reinstatement of the original (pre-mining) ecosystem in all its structural and functional aspects
SBSTTA Subsidiary Body on Scientific, Technical and Technological Advice, a subsidiary body of the CBDCOP
Secondary impacts Environmental impacts that occur as a result of actions taken by a project, but which are not an integral part of the project
SMART Refers to objectives that are Specific, Measurable, Achievable, Realistic and Time-specific
SSSI Sites of Special Scientific Importance, as designated under the UK Wildlife and Countryside Act
Stakeholders People that will be affected by, or will influence a programme, project or action
Surveillance An extended programme of surveys systematically undertaken to provide a series of observations to ascertain the variability that might be encountered over time (but without preconceptions of what these might be)
TNC The Nature Conservancy
Target population The population that we are interested in (e.g. the population of a species, or an area of habitat, that we are managing and have set a conservation objective for)
50

APPENDICES
APPENDIX 1. INDICATORS AND POTENTIALMEASURES FOR ASSESSING PROGRESS TOWARDSTHE 2010 BIODIVERSITY TARGET
(Source: Adapted from the report of the Subsidiary Bodyon Scientific, Technical and Technological Advice on thework of its tenth meeting http://www.biodiv.org/doc/meetings/cop/cop-08/official/cop-08-02-en.pdf)
Indicators in bold typescript are recommended forimmediate testing and use. Indicators in italics requirefurther testing. Potential measures are listed as bullets
1. Trends in extent of selected biomes, ecosystemsand habitats
• Forests and forest types (including mangroves).
• Peatlands (probably for certain geographic areasonly by 2010).
• Coral reefs.
• Croplands.
• Grasslands/savannahs.
• Polar/ice.
• Inland wetlands.
• Tidal flats/estuaries.
• Seagrasses.
• Dry and sub-humid lands.
• Urban.
2. Trends in abundance and distribution of selectedspecies
• Living Planet Index.
• Various species-assemblage trend indices.
3. Coverage of protected areas
• Coverage according to World List of Protected Areas.
• Overlays with areas of key importance tobiodiversity.
• Inclusion on community and private Pas.
• Management effectiveness.
4. Change in status of threatened species
• Red List Index
5. Trends in genetic diversity of domesticatedanimals, cultivated plants and fish species ofmajor socio-economic importance
• Ex-situ crop collections.
• Livestock genetic resources.
• Fish genetic resources.
• Varieties of landraces on farms.
6. Area of forest, agricultural and agricultureecosystems under sustainable management
• Certification and other measures.
7. Proportion of products derived from sustainablesources
8. Ecological footprint and related concepts*
• Ecological footprint.
• Other measures of the area of land and sea neededto support production of goods and services.
9. Nitrogen deposition
10. Trends in invasive alien species
• Number and cost of alien invasive species.
• Other measures to be developed.
11. Marine trophic index
12. Water quality freshwater systems
• Indicator of biological oxygen demand (BO),nitrates and sediments/turbidity.
13. Trophic integrity of other ecosystems
14. Connectivity/fragmentation of ecosystems
• Patch size distribution of terrestrial habitats (forestsand possibly other habitat types).
• Fragmentation of river systems.
15. Incidence of human-induced ecosystem failure
16. Health and well-being of communities who dependdirectly on local ecosystem goods and services
17. Biodiversity for food and medicine
18. Status and trends of linguistic diversity andnumbers of speakers of indigenous languages
19. Other indicators of the status of indigenous andtraditional knowledge
20. Indicator of access and benefit-sharing
21. Official development assistance provided insupport of the Convention
22. Indicator of technology transfer
* New indicator recommended by SBSTTA at its tenth meeting.
51
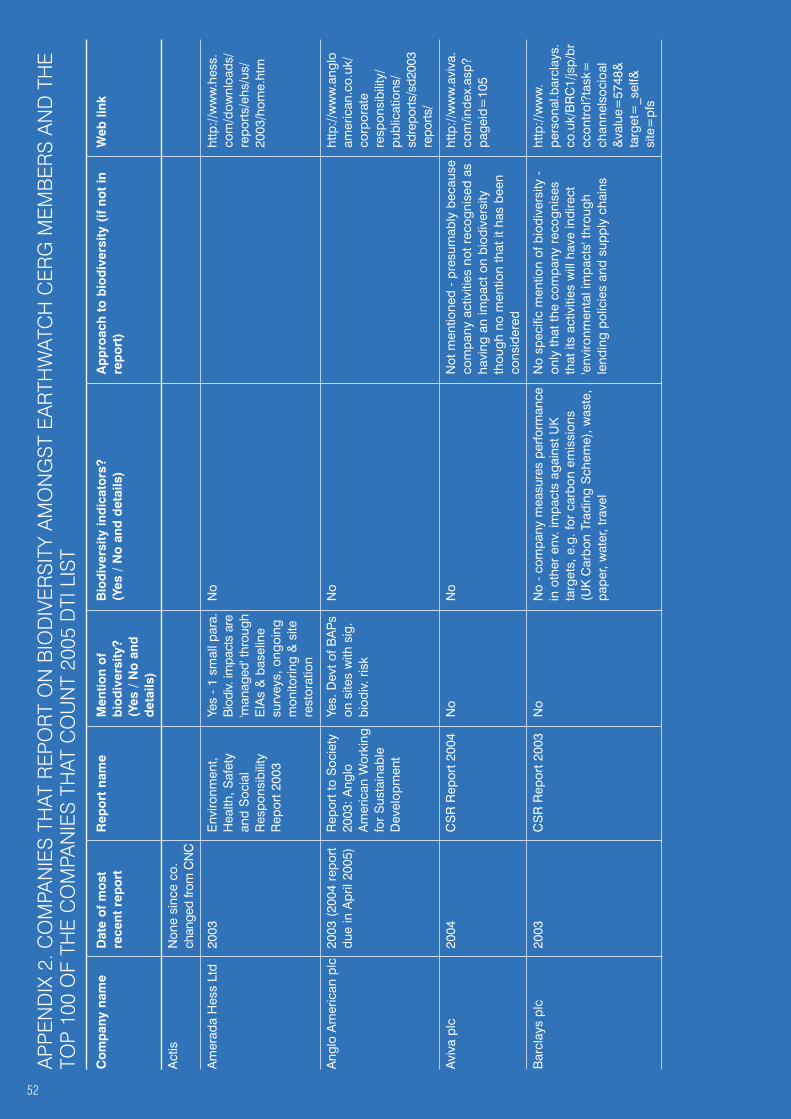
AP
PE
ND
IX 2
. CO
MPA
NIE
S T
HAT
RE
PO
RT
ON
BIO
DIV
ER
SIT
Y A
MO
NG
ST
EA
RTH
WAT
CH
CE
RG
ME
MB
ER
S A
ND
TH
ETO
P 1
00 O
F TH
E C
OM
PAN
IES
TH
AT C
OU
NT
2005
DTI
LIS
T
Co
mp
any
nam
eD
ate
of
mo
stR
epo
rt n
ame
Men
tion
of
Bio
div
ersi
ty in
dic
ato
rs?
Ap
pro
ach
to
bio
div
ersi
ty (
if no
t in
Web
link
rece
nt r
epo
rt
bio
div
ersi
ty?
(Yes
/ N
o a
nd d
etai
ls)
rep
ort
)(Y
es /
No
and
det
ails
)
Act
isN
one
sinc
e co
.ch
ange
d fro
m C
NC
Am
erad
a H
ess
Ltd
2003
Env
ironm
ent,
Yes
- 1
smal
l par
a.
No
http
://w
ww
.hes
s.H
ealth
, Saf
ety
Bio
div.
impa
cts
are
com
/dow
nloa
ds/
and
Soc
ial
'man
aged
' thr
ough
repo
rts/
ehs/
us/
Res
pons
ibili
tyE
IAs
& b
asel
ine
2003
/hom
e.ht
mR
epor
t 200
3su
rvey
s, o
ngoi
ngm
onito
ring
& s
itere
stor
atio
n
Ang
lo A
mer
ican
plc
20
03 (
2004
rep
ort
Rep
ort t
o S
ocie
tyYe
s. D
evt o
f BA
Ps
No
http
://w
ww
.ang
lodu
e in
Apr
il 20
05)
2003
: Ang
lo
on s
ites
with
sig
.am
eric
an.c
o.uk
/A
mer
ican
Wor
king
biod
iv. r
isk
corp
orat
efo
r S
usta
inab
le
resp
onsi
bilit
y/D
evel
opm
ent
publ
icat
ions
/sd
repo
rts/s
d200
3re
ports
/
Avi
va p
lc20
04C
SR
Rep
ort 2
004
No
No
Not
men
tione
d -
pres
umab
ly b
ecau
seht
tp://
ww
w.a
viva
.co
mpa
ny a
ctiv
ities
not
rec
ogni
sed
asco
m/in
dex.
asp?
havi
ng a
n im
pact
on
biod
iver
sity
page
id=
105
thou
gh n
o m
entio
n th
at it
has
bee
nco
nsid
ered
Bar
clay
s pl
c20
03C
SR
Rep
ort 2
003
No
No
- co
mpa
ny m
easu
res
perfo
rman
ceN
o sp
ecifi
c m
entio
n of
bio
dive
rsity
-
http
://w
ww
.in
oth
er e
nv. i
mpa
cts
agai
nst U
Kon
ly th
at th
e co
mpa
ny r
ecog
nise
spe
rson
al.b
arcl
ays.
targ
ets,
e.g
. for
car
bon
emis
sion
sth
at it
s ac
tiviti
es w
ill h
ave
indi
rect
co.u
k/B
RC
1/js
p/br
(U
KC
arbo
n Tr
adin
g S
chem
e), w
aste
,'e
nviro
nmen
tal i
mpa
cts'
thro
ugh
ccon
trol
?tas
k=pa
per,
wat
er, t
rave
lle
ndin
g po
licie
s an
d su
pply
cha
ins
chan
nels
ocio
al
&va
lue=
5748
&ta
rget
=_s
elf&
site
=pf
s
52

Co
mp
any
nam
eD
ate
of
mo
stR
epo
rt n
ame
Men
tion
of
Bio
div
ersi
ty in
dic
ato
rs?
Ap
pro
ach
to
bio
div
ersi
ty (
if no
t in
Web
link
rece
nt r
epo
rt
bio
div
ersi
ty?
(Yes
/ N
o a
nd d
etai
ls)
rep
ort
)(Y
es /
No
and
det
ails
)
Bea
con
Pre
ss20
03B
eaut
iful P
rint f
orN
o, b
ut h
ave
Use
indu
stry
initi
ativ
es -
Fut
ure
Bio
dive
rsity
Pol
icy
Sta
tem
ent
http
://w
ww
.B
eaut
iful W
orld
sepa
rate
Fore
st's
Car
bon
Neu
tral
sta
tus,
FS
Cbe
acon
.org
/B
iodi
vers
ity P
olic
yen
dors
emen
tab
out.h
tml
Sta
tem
ent (
not
men
tione
d in
E
nv. R
epor
t). S
iteba
sed
initi
ativ
esan
d su
ppor
t for
rang
e of
NG
Os
BP
plc
2004
Mak
ing
the
right
Yes
- se
ctio
n 1.
3 ht
tp://
ww
w.b
p.ch
oice
s: B
Pan
d pg
30
ofco
m/d
ownl
oad
Sus
tain
abili
tyre
port
listin
g.do
?cat
egor
yR
epor
tId
=66
6&co
nten
tId=
2004
066
Brit
ish
Am
eric
an20
03/0
4S
ocia
l Rep
ort
Yes
- pg
111
Yes
- fo
llow
GR
I gui
delin
esht
tp://
ww
w.b
at.
Toba
cco
plc
Unc
lear
how
BA
TBP
is h
elpi
ng to
mon
itor
biod
iver
sity
per
form
ance
com
/One
Web
/si
tes/
uk__
3m
nfen
.nsf
/vw
Pag
esW
ebLi
ve/
0979
C26
9F4E
E8
C42
8025
6BF4
000
331D
6?op
endo
cum
ent&
SID
=FA
A44
5573
7194
6B
F054
C1D
69C
6D
0E3A
0&D
TC=
* R
isk
asse
ssm
ent (
EH
S)
driv
espr
iorit
ies
* H
igh
risk
= S
uppl
y C
hain
(LE
AF;
Pul
p); h
abita
t im
pact
; soc
ieta
lex
pect
atio
n; s
ocia
l iss
ues;
* S
ite le
vel r
elat
ions
hip
build
ing
&im
prov
ing
biod
iver
sity
per
form
ance
* S
eeki
ng in
dica
tors
See
link
* U
se im
pact
on
biod
iver
sity
as
am
easu
re o
f com
pany
env
ironm
enta
lpe
rform
ance
- b
ut n
o de
tail
on h
owth
is im
pact
is m
easu
red
* O
nlin
e en
viro
nmen
tal m
appi
ng to
olpl
ottin
g m
ajor
site
s al
ongs
ide
ES
As
and
biod
iver
sity
man
agem
ent
initi
ativ
es in
eac
h lo
catio
n (s
ee li
nkon
rig
ht)
53

Co
mp
any
nam
eD
ate
of
mo
stR
epo
rt n
ame
Men
tion
of
Bio
div
ersi
ty in
dic
ato
rs?
Ap
pro
ach
to
bio
div
ersi
ty (
if no
t in
Web
link
rece
nt r
epo
rt
bio
div
ersi
ty?
(Yes
/ N
o a
nd d
etai
ls)
rep
ort
)(Y
es /
No
and
det
ails
)
Cad
bury
20
04C
SR
Rep
ort
Yes
- sec
tion
11.1
4N
oht
tp://
ww
w.
Sch
wep
pes
plc
cadb
ury
schw
eppe
s.co
m/
EN
/Env
ironm
ent
Soc
iety
/Ove
rvie
w/
repo
rts2
.htm
Dia
geo
Foun
datio
n20
04C
orpo
rate
Yes
No
http
://w
ww
.dia
geo.
Citi
zens
hip
Rep
ort
com
/en-
row
/Va
lues
And
Pol
icie
s/C
orpo
rate
Citi
zens
hipR
epor
ts/2
005
GE
Hea
lthca
reN
one
foun
d
Gla
xoS
mith
Klin
e pl
c20
04C
orpo
rate
No,
but
EH
S
Yes
- G
RI b
ased
http
://w
ww
.gsk
.R
espo
nsib
ility
Sta
ndar
d an
d co
m/c
orpo
rate
Rep
ort
Gui
delin
e on
_r
espo
nsib
ility
/B
iodi
vers
itycr
_rep
ort_
2004
/(u
nder
rev
iew
)
Goo
d E
nerg
y 20
04E
nviro
nmen
tal
No
No
http
://w
ww
.goo
d-R
epor
ten
ergy
.co.
uk/
clim
ate/
22_r
epor
t.ht
ml
54
* S
take
hold
er C
onsu
ltatio
n >
esta
blis
h pr
iorit
ies
for
biod
iver
sity
* U
nder
stan
d ro
le o
f CS
> D
evel
opac
tions
> R
epor
t pro
gres
s
* A
ppro
ach
has
been
frag
men
ted
with
no
clea
r co
mpa
ny s
trat
egy,
but
seve
ral s
ite-b
ased
initi
ativ
es
* V
isio
n ->
Pla
n ->
Sys
tem
s ->
Rev
iew
pro
cess
* D
riven
by
'risk
ass
essm
ent'
prio
ritie
s
* G
uide
lines
dev
elop
ed
* In
tern
al d
isse
min
atio
n /
impl
emen
tatio
n un
know
n
* N
o ex
tern
al in
form
atio
n on
pro
cess
/ E
MS
/ g
uide
lines
etc
.
* C
omm
unity
invo
lvem
ent a
ppro
ach
(roa
d si
de s
urve
ys; U
lver
ston
Site
BA
P; n
atur
e re
serv
es)

Co
mp
any
nam
eD
ate
of
mo
stR
epo
rt n
ame
Men
tion
of
Bio
div
ersi
ty in
dic
ato
rs?
Ap
pro
ach
to
bio
div
ersi
ty (
if no
t in
Web
link
rece
nt r
epo
rt
bio
div
ersi
ty?
(Yes
/ N
o a
nd d
etai
ls)
rep
ort
)(Y
es /
No
and
det
ails
)
HS
BC
Hol
ding
s pl
c20
03H
SB
C in
Soc
iety
No
http
://w
ww
.-
CS
R R
epor
ths
bc.c
om/h
sbc/
new
s_ro
om/n
ews/
new
s-ar
chiv
e-20
04/c
orpo
rate
-soc
ial-
resp
onsi
bilit
y?is
Pc=
fals
e
ICI p
lc20
03S
usta
inab
ility
Ye
s - a
im to
sur
vey
No
http
://w
ww
.ici.
Rep
ort
each
com
pany
site
com
/ICIP
LC/
and
deve
lop
ici-s
he/2
003/
biod
iver
sity
pd
f/IC
I_m
anag
emen
t pla
nssu
stai
n_re
p.pd
f
KP
MG
2003
CS
R R
epor
tN
oN
oht
tp://
ww
w.
kpm
g.co
.uk/
abou
t/cs
r/en
viro
nmen
t/in
dex.
cfm
J S
ains
bury
2004
CS
R 2
004
Yes
Yes
(see
pag
e 63
)ht
tp://
ww
w.j-
sain
sbur
y.co
.uk/
inde
x.as
p?pa
geid
=20
&su
bsec
tion
=20
04
Pric
e W
ater
hous
e20
05C
orpo
rate
No
No
http
://w
ww
.pw
c.C
oope
rsR
espo
nsib
ility
com
/ext
web
/R
epor
tpw
cpub
licat
ions
.ns
f/4bd
5f76
b48e
2827
3852
5662
b007
39e2
2/b5
7daf
4fa3
b308
f385
256
fa20
0602
5dc/
$FIL
E/C
RR
_Vol
II_W
inte
r_20
05_f
inal
55
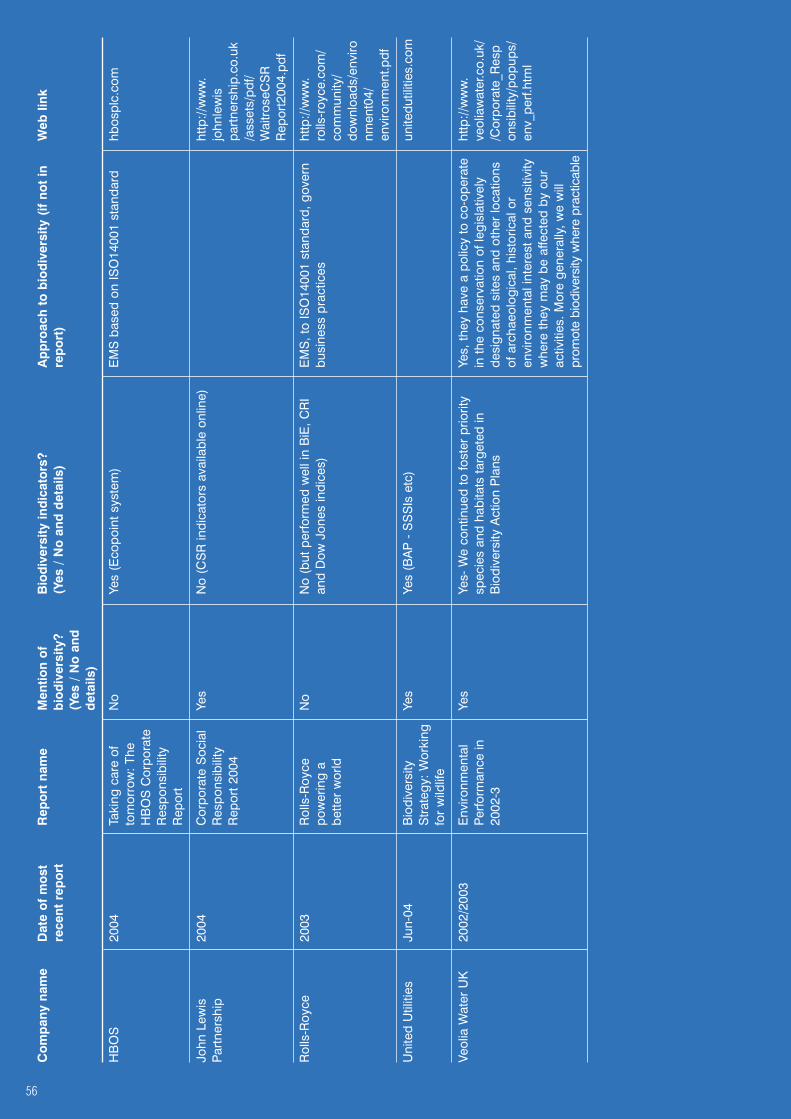
Co
mp
any
nam
eD
ate
of
mo
stR
epo
rt n
ame
Men
tion
of
Bio
div
ersi
ty in
dic
ato
rs?
Ap
pro
ach
to
bio
div
ersi
ty (
if no
t in
Web
link
rece
nt r
epo
rt
bio
div
ersi
ty?
(Yes
/ N
o a
nd d
etai
ls)
rep
ort
)(Y
es /
No
and
det
ails
)
HB
OS
2004
Taki
ng c
are
ofN
oYe
s (E
copo
int s
yste
m)
EM
S b
ased
on
ISO
1400
1 st
anda
rdhb
ospl
c.co
mto
mor
row
: The
HB
OS
Cor
pora
teR
espo
nsib
ility
Rep
ort
John
Lew
is20
04C
orpo
rate
Soc
ial
Yes
No
(CS
R in
dica
tors
ava
ilabl
e on
line)
http
://w
ww
.P
artn
ersh
ipR
espo
nsib
ility
john
lew
isR
epor
t 200
4pa
rtne
rshi
p.co
.uk
/ass
ets/
pdf/
Wai
tros
eCS
RR
epor
t200
4.pd
f
Rol
ls-R
oyce
2003
Rol
ls-R
oyce
No
No
(but
per
form
ed w
ell i
n B
iE, C
RI
EM
S, t
o IS
O14
001
stan
dard
, gov
ern
http
://w
ww
.po
wer
ing
aan
d D
ow J
ones
indi
ces)
busi
ness
pra
ctic
esro
lls-r
oyce
.com
/be
tter
wor
ldco
mm
unity
/do
wnl
oads
/env
ironm
ent0
4/en
viro
nmen
t.pdf
Uni
ted
Util
ities
Jun-
04B
iodi
vers
ityYe
sYe
s (B
AP
- S
SS
Is e
tc)
unite
dutil
ities
.com
Str
ateg
y: W
orki
ngfo
r w
ildlif
e
Veol
ia W
ater
UK
2002
/200
3E
nviro
nmen
tal
Yes
Yes-
We
cont
inue
d to
fost
er p
riorit
y Ye
s, th
ey h
ave
a po
licy
to c
o-op
erat
e ht
tp://
ww
w.
Per
form
ance
insp
ecie
s an
d ha
bita
ts ta
rget
ed in
in
the
cons
erva
tion
of le
gisl
ativ
ely
veol
iaw
ater
.co.
uk/
2002
-3B
iodi
vers
ity A
ctio
n P
lans
de
sign
ated
site
s an
d ot
her
loca
tions
/Cor
pora
te_R
esp
of a
rcha
eolo
gica
l, hi
stor
ical
or
onsi
bilit
y/po
pups
/en
viro
nmen
tal i
nter
est a
nd s
ensi
tivity
env_
perf.
htm
lw
here
they
may
be
affe
cted
by
our
activ
ities
. Mor
e ge
nera
lly, w
e w
illpr
omot
e bi
odiv
ersi
ty w
here
pra
ctic
able
56

Co
mp
any
nam
eD
ate
of
mo
stR
epo
rt n
ame
Men
tion
of
Bio
div
ersi
ty in
dic
ato
rs?
Ap
pro
ach
to
bio
div
ersi
ty (
if no
t in
Web
link
rece
nt r
epo
rt
bio
div
ersi
ty?
(Yes
/ N
o a
nd d
etai
ls)
rep
ort
)(Y
es /
No
and
det
ails
)
BH
P B
illito
n20
04W
orki
ng fo
r a
Yes
Yes
(GR
I)ht
tp://
ww
w.
sust
aina
ble
futu
re.
bhpb
illito
n.co
m/
BH
P B
illito
nbb
Con
tent
Hea
lth, S
afet
y,R
epos
itory
/E
nviro
men
t &R
epor
ts/b
hpb_
Com
mun
ity R
epor
t.fu
ll_hs
ec_r
epor
t_Fu
ll R
epor
t 200
404
Lloy
ds T
SB
2003
Taki
ng a
ccou
nt:
No
No
Env
ironm
enta
l im
pact
s ar
e m
anag
ed
lloyd
stsb
.com
The
com
mun
ityby
EM
S fo
llow
ing
ISO
1400
1 st
anda
rdan
d ou
r bu
sine
ss
Sco
ttish
and
2004
Env
ironm
ent
Yes
Yes
(env
ironm
enta
l per
form
ance
indi
cato
rs)
http
://w
ww
.S
outh
ern
Ene
rgy
Ann
ual R
epor
tsc
ottis
h-so
uthe
rn.
2004
co.u
k/S
hare
hold
er/R
epor
tsA
ndP
rese
ntat
ions
/P
DFs
/AR
2004
/E
nviro
nmen
tR
epor
t.pdf
Sco
ttish
Pow
er20
01/2
002
Env
ironm
enta
lYe
sYe
s (G
RI a
nd K
PIs
link
ed to
hea
dlin
e in
dica
tors
of U
K s
usta
inab
lesc
ottis
hpow
er.
Sus
tain
abili
tyde
velo
pmen
t str
ateg
y)pl
c.uk
Rep
ort
Sev
ern
Tren
t20
04S
ever
n Tr
ent P
LCYe
sYe
s (B
AP,
man
agem
ent p
lans
and
site
spe
cific
bio
dive
rsity
initi
ativ
es)
seve
rntr
ent.c
omC
orpo
rate
Res
pons
ibili
ty:
Ste
war
dshi
pR
epor
t 200
4
CE
Ele
ctric
UK
ceel
ectic
uk.c
om
Co-
oper
ativ
e20
03C
o-op
erat
ive
Yes
Yes
(CFS
rep
ortin
g its
land
foot
prin
t)ci
s.co
.uk
Insu
ranc
e S
ocie
tyFi
nanc
ial S
ervi
ces
Sus
tain
abili
tyR
epor
t
Frie
nds
Pro
vide
nt20
04C
orpo
rate
Yes
Yes
frien
dspr
ovid
ent.
Res
pons
ibili
tyco
mR
epor
t
57
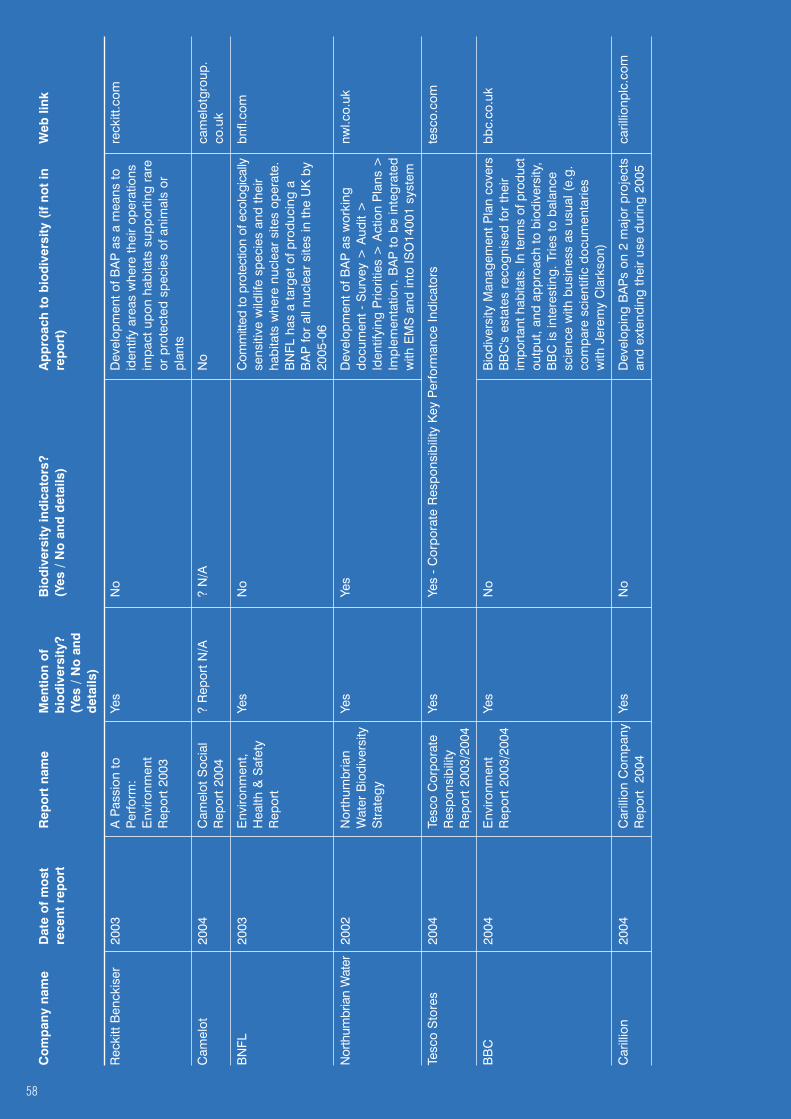
Co
mp
any
nam
eD
ate
of
mo
stR
epo
rt n
ame
Men
tion
of
Bio
div
ersi
ty in
dic
ato
rs?
Ap
pro
ach
to
bio
div
ersi
ty (
if no
t in
Web
link
rece
nt r
epo
rt
bio
div
ersi
ty?
(Yes
/ N
o a
nd d
etai
ls)
rep
ort
)(Y
es /
No
and
det
ails
)
Rec
kitt
Ben
ckis
er20
03A
Pas
sion
toYe
sN
oD
evel
opm
ent o
f BA
P a
s a
mea
ns to
reck
itt.c
omP
erfo
rm:
iden
tify
area
s w
here
thei
r op
erat
ions
Env
ironm
ent
impa
ct u
pon
habi
tats
sup
port
ing
rare
Rep
ort 2
003
or
pro
tect
ed s
peci
es o
f ani
mal
s or
plan
ts
Cam
elot
2004
Cam
elot
Soc
ial
? R
epor
t N/A
? N
/AN
oca
mel
otgr
oup.
Rep
ort 2
004
co.u
k
BN
FL20
03E
nviro
nmen
t,Ye
sN
oC
omm
itted
to p
rote
ctio
n of
eco
logi
cally
bnfl.
com
Hea
lth &
Saf
ety
sens
itive
wild
life
spec
ies
and
thei
r R
epor
tha
bita
ts w
here
nuc
lear
site
s op
erat
e.B
NFL
has
a ta
rget
of p
rodu
cing
aB
AP
for
all n
ucle
ar s
ites
in th
e U
K b
y20
05-0
6
Nor
thum
bria
n W
ater
2002
Nor
thum
bria
nYe
sYe
sD
evel
opm
ent o
f BA
P a
s w
orki
ng
nwl.c
o.uk
Wat
er B
iodi
vers
itydo
cum
ent -
Sur
vey
> A
udit
>
Str
ateg
yId
entif
ying
Prio
ritie
s >
Act
ion
Pla
ns >
Impl
emen
tatio
n. B
AP
to b
e in
tegr
ated
with
EM
S a
nd in
to IS
O14
001
syst
em
Tesc
o S
tore
s20
04Te
sco
Cor
pora
teYe
sYe
s -
Cor
pora
te R
espo
nsib
ility
Key
Per
form
ance
Indi
cato
rste
sco.
com
Res
pons
ibili
tyR
epor
t 200
3/20
04
BB
C20
04E
nviro
nmen
tYe
s N
oB
iodi
vers
ity M
anag
emen
t Pla
n co
vers
bbc.
co.u
k R
epor
t 200
3/20
04B
BC
's e
stat
es r
ecog
nise
d fo
r th
eir
impo
rtant
hab
itats
. In
term
s of
pro
duct
outp
ut, a
nd a
ppro
ach
to b
iodi
vers
ity,
BB
C is
inte
rest
ing.
Trie
s to
bal
ance
scie
nce
with
bus
ines
s as
usu
al (
e.g.
com
pare
sci
entif
ic d
ocum
enta
ries
with
Jer
emy
Cla
rkso
n)
Car
illio
n20
04C
arill
ion
Com
pany
Yes
No
Dev
elop
ing
BA
Ps
on 2
maj
or p
roje
cts
caril
lionp
lc.c
om
Rep
ort
2004
and
exte
ndin
g th
eir
use
durin
g 20
05
58

Co
mp
any
nam
eD
ate
of
mo
stR
epo
rt n
ame
Men
tion
of
Bio
div
ersi
ty in
dic
ato
rs?
Ap
pro
ach
to
bio
div
ersi
ty (
if no
t in
Web
link
rece
nt r
epo
rt
bio
div
ersi
ty?
(Yes
/ N
o a
nd d
etai
ls)
rep
ort
)(Y
es /
No
and
det
ails
)
Ree
d E
lsev
ier
2004
Env
ironm
enta
lN
oN
ore
edel
sevi
er.c
omM
anag
emen
tS
yste
m 2
004
Uni
leve
r20
03E
nviro
nmen
tYe
s- th
eYe
s (t
arge
t, pe
rform
ance
and
com
men
ts)
pg. 1
9ht
tp://
unile
ver.
Rep
ort
sust
aina
ble
use
ofco
m/Im
ages
/ag
ricul
ture
, fis
hE
nviro
nmen
tal_
and
wat
er a
llR
epor
t_20
03_
cont
ribut
es to
the
tcm
3-10
357_
cons
erva
tion
oftc
m13
-551
2.pd
fbi
odiv
ersi
ty
Alli
ed D
omec
q20
04C
SR
Rep
ort
Yes
- su
stai
nabl
eU
se th
e G
loba
l Rep
ortin
g In
itiat
ive
On
the
web
und
er L
AN
D U
SE
: ht
tp://
allie
dus
e of
pla
nts/
(GR
I) bi
odiv
ersi
ty in
dica
tors
in th
eir
"Bio
dive
rsity
pro
gram
mes
are
on
the
dom
ecq.
com
/co
nser
vatio
nre
port
(la
nd o
wne
d in
bio
-ric
h ha
bita
tsag
enda
in S
cotla
nd a
t our
whi
sky
NR
/rdo
nlyr
es/
activ
ities
in N
ewan
d m
ajor
impa
cts
on b
iodi
vers
ity)
war
ehou
ses,
whi
le a
t the
Lap
hroa
ig5F
E13
714-
D0D
9-Ze
alan
d/an
d th
ey u
se c
ase
stud
ies
mal
t whi
sky
dist
iller
y th
e pe
at-
4EA
C-9
F9F-
524
Bio
dive
rsity
harv
estin
g te
chni
ques
now
use
d he
lpF5
5E85
1C9/
0/co
nser
vatio
n in
to r
esto
re th
e su
rface
of t
he p
eat b
eds,
Soc
ialR
espo
nsib
iliP
ortu
gal
upho
ldin
g th
eir
land
scap
e va
lue
and
tyR
epor
tpdf
incr
easi
ng th
eir
rege
nera
tion
pote
ntia
l.O
ur k
ilns
are
also
car
eful
ly m
anag
edto
mak
e su
re th
at p
eat i
s us
ed in
asu
stai
nabl
e w
ay. I
n S
pain
, whe
re o
neof
our
dis
tille
ries
is lo
cate
d cl
ose
to a
natio
nal p
ark,
we
have
put
str
ict r
ules
in p
lace
to m
ake
sure
we
don’
t ups
etth
e pa
rk’s
del
icat
e ec
osys
tem
s."
Has
four
cas
e st
udie
s
AW
G20
04S
usta
inab
leYe
s- m
easu
ring
Yes
- 2
mea
sure
men
t ind
icat
ors
1. P
erce
nt o
f ope
ratio
ns w
ith a
sys
tem
for
http
://w
ww
.aw
g.D
evel
opm
ent
thei
r im
pact
s on
re
cord
ing
use
and
man
agem
ent p
lan
cove
ring
ener
gy c
onsu
mpt
ion
and
com
/ass
ets/
Per
form
ance
biod
iver
sity
, als
o2.
Per
cent
of o
ther
sig
nific
ant r
esou
rce
use/
impa
cts
subj
ect t
o m
anag
emen
tsu
stai
nabl
e_
Ang
lian
Wat
erpl
an. T
hey
list a
chie
vem
ents
in 2
004
agai
nst a
targ
et in
200
5de
velo
pmen
t/ha
s a
10-y
ear
2004
/B
iodi
vers
ity A
ctio
nP
lan,
cur
rent
ly in
its fi
fth y
ear
59

Co
mp
any
nam
eD
ate
of
mo
stR
epo
rt n
ame
Men
tion
of
Bio
div
ersi
ty in
dic
ato
rs?
Ap
pro
ach
to
bio
div
ersi
ty (
if no
t in
Web
link
rece
nt r
epo
rt
bio
div
ersi
ty?
(Yes
/ N
o a
nd d
etai
ls)
rep
ort
)(Y
es /
No
and
det
ails
)
BO
C G
roup
2004
Soc
ial,
No
No
No
http
://bo
c.co
m/
Env
ironm
enta
lin
vest
ors/
annu
al_
and
Eth
ical
and_
quar
terly
_P
erfo
rman
ce
repo
rts/
2004
/re
port
/soc
ial_
envi
ronm
enta
l.pdf
Kel
da G
roup
2004
CS
R R
epor
tYe
s- r
ecog
nitio
nYe
s- r
etur
n at
leas
t 15%
of S
SS
Is to
favo
urab
le s
tatu
sC
SR
Rep
ort (
2004
)of
the
need
for
biod
iver
sity
cons
erva
tion
Lafa
rge
Cem
ent U
K20
03S
usta
inab
ility
No
No
Und
er S
usta
inab
le C
onst
ruct
ion
the
Rep
ort
only
thin
g on
thei
r w
ebsi
te th
atm
entio
ns b
iodi
vers
ity is
Par
tner
ship
with
the
Nic
olas
Hul
ot F
ound
atio
n fo
ra
HQ
E c
onst
ruct
ion.
Lafa
rge
has
cont
ribut
ed to
the
cons
truc
tion
of th
e N
icol
as H
ulot
Sch
ool,
loca
ted
in th
e M
orbi
han
area
(Fra
nce)
. Its
arc
hite
ctur
e ha
s be
ende
sign
ed a
ccor
ding
to a
n ec
olog
ical
proc
edur
e an
d ai
ms
at H
igh
Env
ironm
enta
l Qua
lity
(HQ
E)
targ
ets.
Lafa
rge
Cim
ents
, Laf
arge
Bét
ons
and
Lafa
rge
Gra
nula
ts d
onat
ed b
uild
ing
mat
eria
ls. T
he s
choo
l will
ser
ve a
s an
envi
ronm
enta
l aw
aren
ess
cent
re fo
red
ucat
ion
and
trai
ning
on
biod
iver
sity
for
ever
yone
60
http
://w
ww
.lafa
rge.
com
/cgi
bin/
lafc
om/js
p/co
nten
t.do?
func
tion=
pres
spu
blic
atio
n&B
V_
Ses
sion
ID=
@@
@@
2068
2842
45.1
1135
6222
1@@
@@
&B
V_E
ngin
e@@
@&
BV
_Eng
ineI
D=
cccc
addd
ljijjj
hcfn
gcf
kmdh
gfdg
gf.0

Co
mp
any
nam
eD
ate
of
mo
stR
epo
rt n
ame
Men
tion
of
Bio
div
ersi
ty in
dic
ato
rs?
Ap
pro
ach
to
bio
div
ersi
ty (
if no
t in
Web
link
rece
nt r
epo
rt
bio
div
ersi
ty?
(Yes
/ N
o a
nd d
etai
ls)
rep
ort
)(Y
es /
No
and
det
ails
)
MM
0220
04C
orpo
rate
Yes
Yes,
GR
I Ind
ex: 1
. Loc
atio
n an
d si
ze
http
://w
ww
.o2.
com
/R
espo
nsib
ility
of la
nd o
wne
d, le
ased
, or
man
aged
in
dow
nloa
ds/O
2_R
epor
tbi
odiv
ersi
ty-r
ich
habi
tats
.
CR
_ful
l_re
port
2. D
escr
iptio
n of
the
maj
or im
pact
son
bio
dive
rsity
ass
ocia
ted
with
activ
ities
and
/or
prod
ucts
and
ser
vice
sin
terr
estr
ial,
fresh
wat
er, a
nd m
arin
een
viro
nmen
ts. -
Env
ironm
ent a
ndsu
stai
nabi
lity
3. Im
pact
s of
act
iviti
es a
nd o
pera
tions
on p
rote
cted
and
sen
sitiv
e ar
eas.
In a
dditi
on, t
here
are
cas
e st
udie
s on
Bio
dive
rsity
Pro
tect
ion
activ
ities
unde
rtak
en
ED
F E
nerg
y20
03C
ore
Res
pons
ibili
tyN
oN
oN
oed
fene
rgy.
com
Rep
ort 2
003
Ford
Mot
or20
03/2
004
Ford
200
3-20
04
Yes
Yes
(pla
nt lo
catio
ns in
bio
dive
rsity
hot
spot
s. If
so,
then
wor
k to
min
imis
efo
rd.c
om
Com
pany
Cor
pora
tepo
tent
ial i
mpa
ct o
n bi
odiv
ersi
ty)
Citi
zens
hip
Rep
ort
Inte
rnat
iona
l Pow
er20
03In
tern
atio
nal P
ower
No
No
No
http
://in
tern
atio
nal
Ann
ual R
epor
tpo
wer
plc.
com
/ippl
c20
03/in
vest
ors/
finda
ta/
repo
rts/
ar03
/ar0
3.pd
f
Am
ec20
04A
nnua
l Rep
ort
No
No
Ear
th a
nd E
nviro
nmen
t web
site
-ht
tp://
ww
w.a
mec
.E
nviro
nmen
tal I
mpa
ct a
nd P
erm
ittin
gco
m/a
nnua
lrepo
rt-
men
tion
of b
iodi
vers
ity in
dire
ctly
20
04/in
dex.
htm
l
Ast
ra Z
enec
a20
04A
nnua
l Rep
ort
No
No
Yes
- A
stra
Zene
ca is
dev
elop
ing
aht
tp://
ww
w.a
stra
biod
iver
sity
str
ateg
y ai
med
at
zene
ca.c
om/
cons
ervi
ng, a
nd if
pos
sibl
e in
crea
sing
,A
rtic
le/1
1142
.asp
xlo
cal b
iodi
vers
ity o
n an
d ar
ound
the
com
pany
’s p
rope
rtie
s w
orld
wid
e.W
ork
is a
lread
y be
ing
done
at o
ne s
ite
61

Co
mp
any
nam
eD
ate
of
mo
stR
epo
rt n
ame
Men
tion
of
Bio
div
ersi
ty in
dic
ato
rs?
Ap
pro
ach
to
bio
div
ersi
ty (
if no
t in
Web
link
rece
nt r
epo
rt
bio
div
ersi
ty?
(Yes
/ N
o a
nd d
etai
ls)
rep
ort
)(Y
es /
No
and
det
ails
)
Cen
tric
a20
03C
orpo
rate
No
No
Yes-
impa
cts
on b
iodi
vers
ity (
high
, ht
tp://
cent
rica.
Res
pons
ibili
tym
ediu
m, l
ow)
co.u
k/in
dex.
asp?
Sum
mar
y R
epor
tpa
geid
=65
720
03
Agg
rega
te20
03S
usta
inab
ility
Yes
Yes
-200
2 C
ompa
ny B
AP
5 c
ompa
ny o
bjec
tives
with
targ
ets
and
prog
ress
http
://w
ww
.In
dust
ries
Rep
ort
(pg.
30/
31)
aggr
egat
e.co
m/
plc/
flash
_tem
plat
e/p
dffil
es/S
R03
z.pd
f
62

Earthwatch Institute (Europe)267 Banbury RoadOxford OX2 7HTUnited KingdomTelephone +44 (0)1865 318838
www.earthwatch.org
Rio Tinto plc6 St. James’s SquareLondon SW1Y 4LDUnited KingdomTelephone +44 (0)20 7930 2399
Rio Tinto Limited55 Collins StreetMelbourne 3001AustraliaTelephone +61 (0)3 9283 3333
www.riotinto.com
For convenience only, the expression ‘Rio Tinto’is used to describe Rio Tinto plc, Rio Tinto Limitedand their subsidiary and affiliated companieseven though these companies are independentlymanaged, separate, and distinct entities.
Earthwatch Institute (Europe) is the Europeanaffiliate of Earthwatch Institute, which is basedin the USA and was founded in Boston in 1971.Other affiliate offices in the Earthwatch Institutenetwork are based in Australia and Japan.Earthwatch Institute (Europe) is the workingname for Conservation Education & ResearchTrust (CERT), a company limited by guaranteeregistered in England and Wales (number:4373313) and a registered charity (number:1094467). Registered office: 267 Banbury Road,Oxford OX2 7HT, UK. Tel: +44 (0)1865 318838.
Front and back cover photo: c Colleen Zielinski.
Designed by Impact Advertising and Designand printed in England by Beacon Press onrecycled uncoated Revive paper.
370-03-06