a retrospective evaluation of pediatric major trauma ... 2015_ped... · a retrospective evaluation...
TRANSCRIPT

A retrospective evaluation of pediatric major trauma
related to sport and recreational activities
in Nova Scotia
Mete Erdogan, PhD, MHI
Research Associate
Trauma Nova Scotia
Halifax, Nova Scotia, Canada
Robert S. Green, Michael B. Butler, Nelofar Kureshi, Mete Erdogan
ACIP 2015 Injury Prevention Conference

Background
• At least one third of all pediatric injuries in Canada are
related to sports.
• Hockey injuries account for 10% of all pediatric injuries.
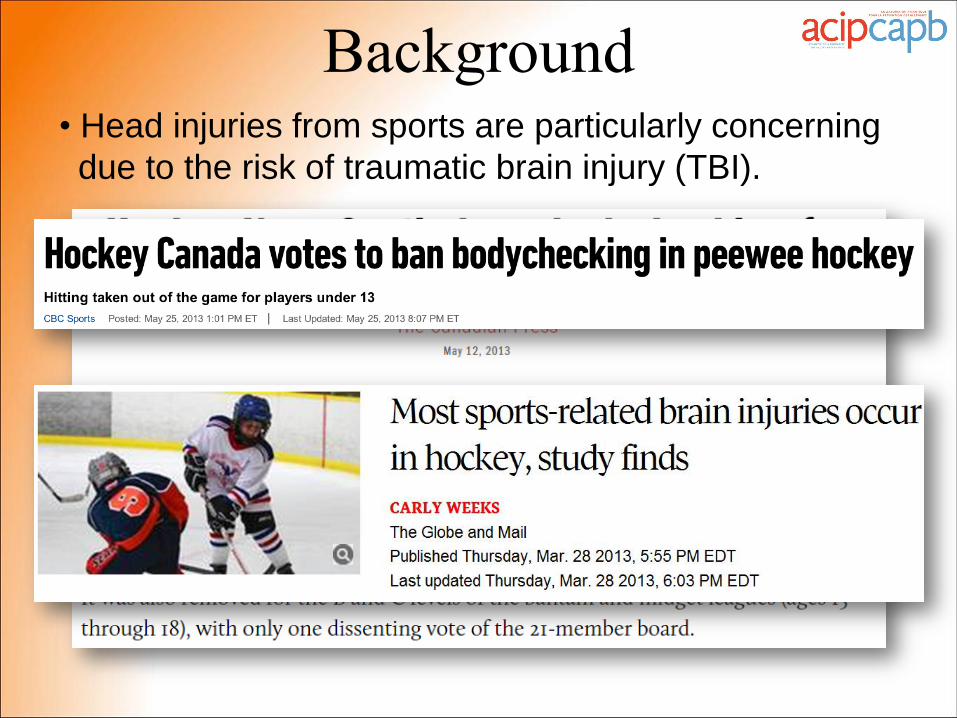
• Head injuries from sports are particularly concerning
due to the risk of traumatic brain injury (TBI).
Background
Background
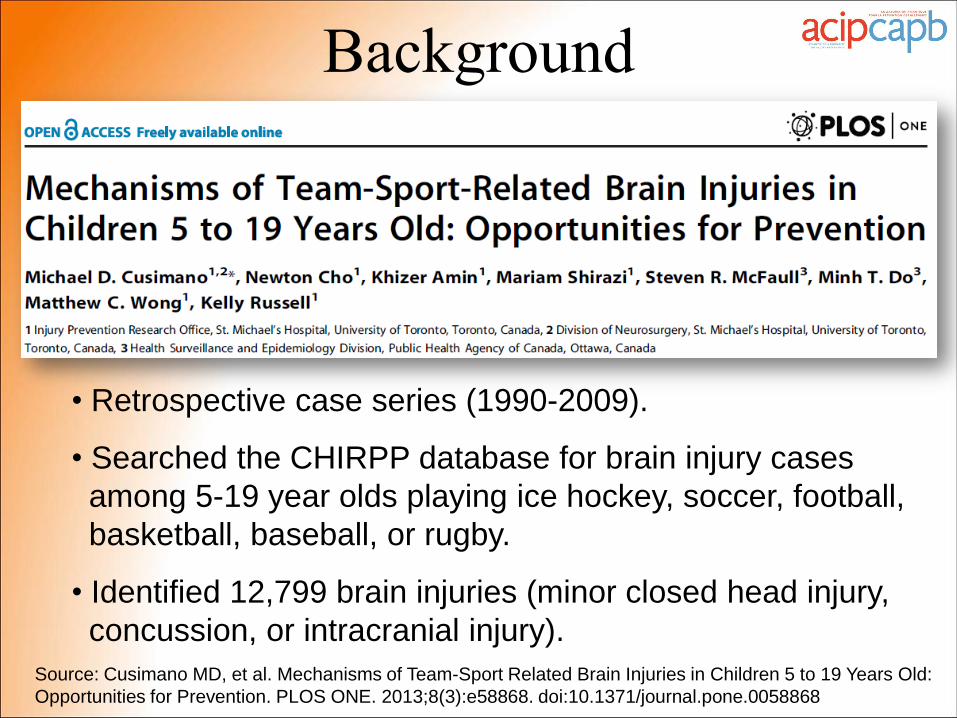
• Retrospective case series (1990-2009). • Searched the CHIRPP database for brain injury cases
among 5-19 year olds playing ice hockey, soccer, football,
basketball, baseball, or rugby. • Identified 12,799 brain injuries (minor closed head injury,
concussion, or intracranial injury).
Source: Cusimano MD, et al. Mechanisms of Team-Sport Related Brain Injuries in Children 5 to 19 Years Old:
Opportunities for Prevention. PLOS ONE. 2013;8(3):e58868. doi:10.1371/journal.pone.0058868

Source: Cusimano MD, et al. Mechanisms of Team-Sport Related Brain Injuries in Children 5 to 19 Years Old:
Opportunities for Prevention. PLOS ONE. 2013;8(3):e58868. doi:10.1371/journal.pone.0058868
Background
• 81.4% were male, mean age was 13.2 years. • Hockey accounted for 44.3% of all brain injuries,
most among 10-14 year olds.
Background
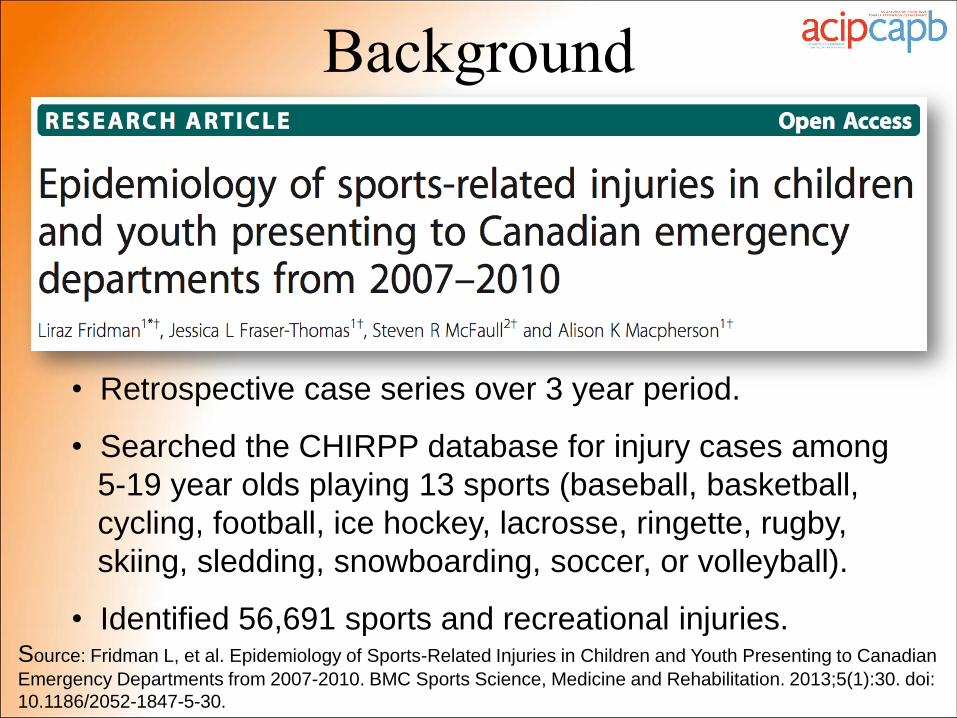
• Retrospective case series over 3 year period. • Searched the CHIRPP database for injury cases among
5-19 year olds playing 13 sports (baseball, basketball,
cycling, football, ice hockey, lacrosse, ringette, rugby,
skiing, sledding, snowboarding, soccer, or volleyball). • Identified 56,691 sports and recreational injuries.
Source: Fridman L, et al. Epidemiology of Sports-Related Injuries in Children and Youth Presenting to Canadian
Emergency Departments from 2007-2010. BMC Sports Science, Medicine and Rehabilitation. 2013;5(1):30. doi:
10.1186/2052-1847-5-30.
Background
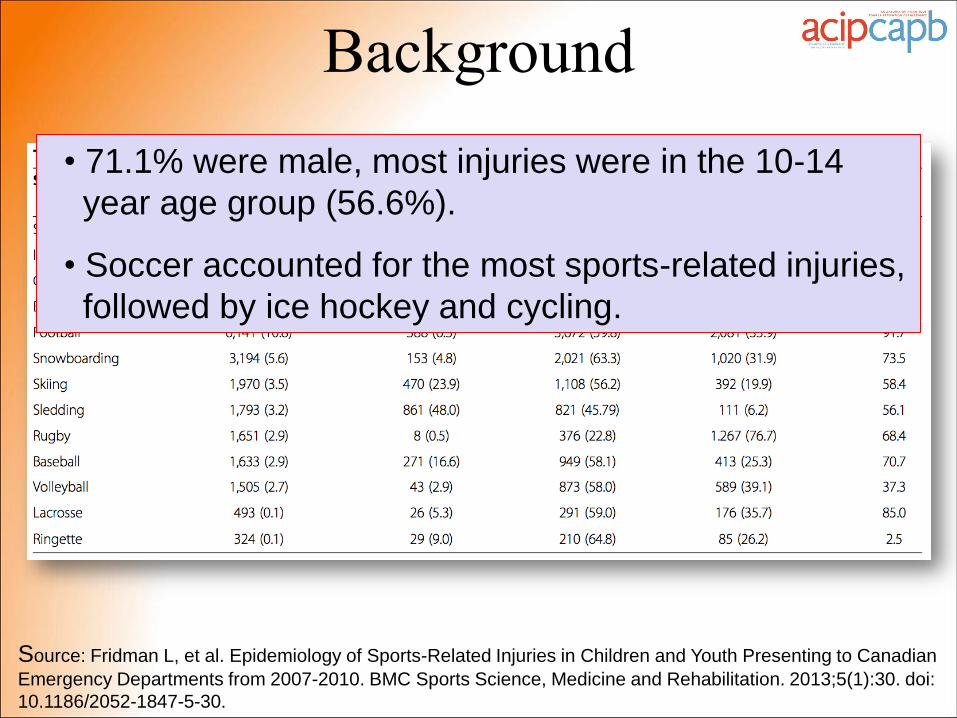
• 71.1% were male, most injuries were in the 10-14
year age group (56.6%). • Soccer accounted for the most sports-related injuries,
followed by ice hockey and cycling.
Source: Fridman L, et al. Epidemiology of Sports-Related Injuries in Children and Youth Presenting to Canadian
Emergency Departments from 2007-2010. BMC Sports Science, Medicine and Rehabilitation. 2013;5(1):30. doi:
10.1186/2052-1847-5-30.

Background
• It is unknown which sports in Nova Scotia lead to the
most major traumas, including traumatic brain injury.
A better understanding of sport-specific injury risk is
needed in NS.
• Analyzing past trends in sport-related injuries can
identify high-risk groups and be used to inform future
research priorities and injury prevention strategies for
the province.
Study Rationale

Objective
To describe overall patterns of pediatric sport-related
major traumas seen in NS between 2000 and 2013.
Hypothesis
Hockey is the most common cause of sport-related
major trauma for pediatric patients in Nova Scotia.
Background

• This study was a retrospective case series.
• Data on sport-related major trauma in patients
(age < 19 years) was extracted from the NSTP
Registry between 2000-2013 using CIHI Sport &
Recreation Incident Codes.
Methodology
• We assessed the following:
• frequency and severity of injuries
• admission to a special care unit (SCU)
• severe TBI (AIS-90 Head score ≥ 3)
• length of stay in-hospital
• mortality
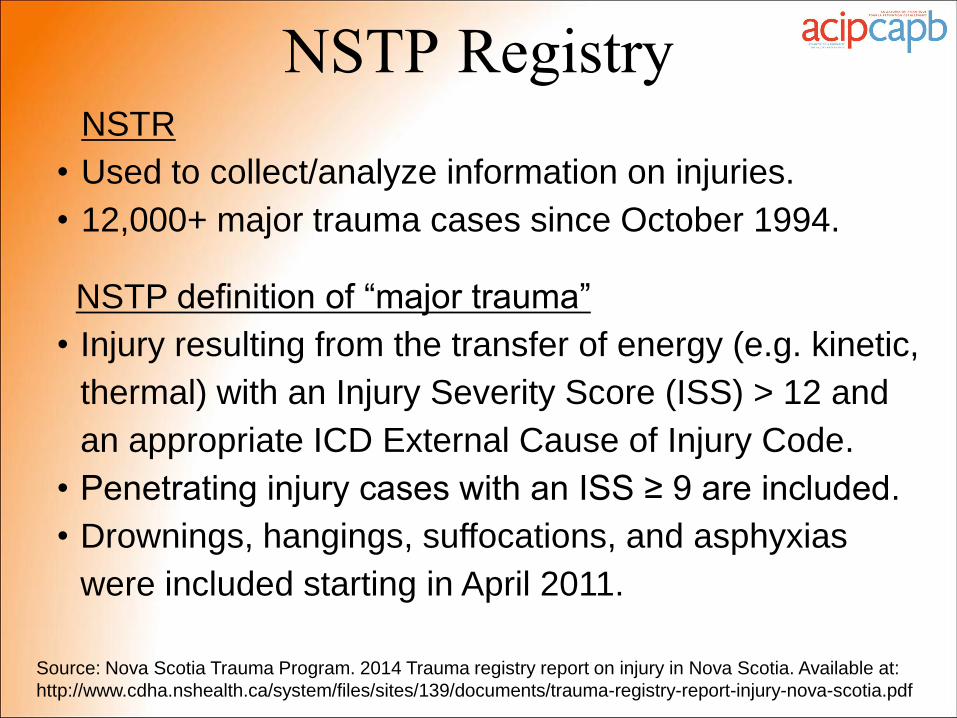
NSTP definition of “major trauma”
• Injury resulting from the transfer of energy (e.g. kinetic,
thermal) with an Injury Severity Score (ISS) > 12 and
an appropriate ICD External Cause of Injury Code.
• Penetrating injury cases with an ISS ≥ 9 are included.
• Drownings, hangings, suffocations, and asphyxias
were included starting in April 2011.
NSTR
• Used to collect/analyze information on injuries.
• 12,000+ major trauma cases since October 1994.
NSTP Registry
Source: Nova Scotia Trauma Program. 2014 Trauma registry report on injury in Nova Scotia. Available at:
http://www.cdha.nshealth.ca/system/files/sites/139/documents/trauma-registry-report-injury-nova-scotia.pdf

• 9471 records were accessed between 2000-2013.
• During the 13-year study period, there were 1177
pediatric major traumas.
- 107 (9%) were sport-related
- Patients were aged 3-18 years
- 84% of patients were male
Results

Season Summer
(21 Jun - 20 Sep)
Spring (21 Mar - 20 Jun)
Winter (21 Dec - 20 Mar)
Autumn (21 Sep - 20 Dec)
Traumas (%) 38 32 21 9
Distribution of pediatric sport-related major trauma
by month and season
Results
0
5
10
15
20
Jan Feb Mar Apr May Jun Jul Aug Sep Oct Nov Dec
# Major Traumas
Month
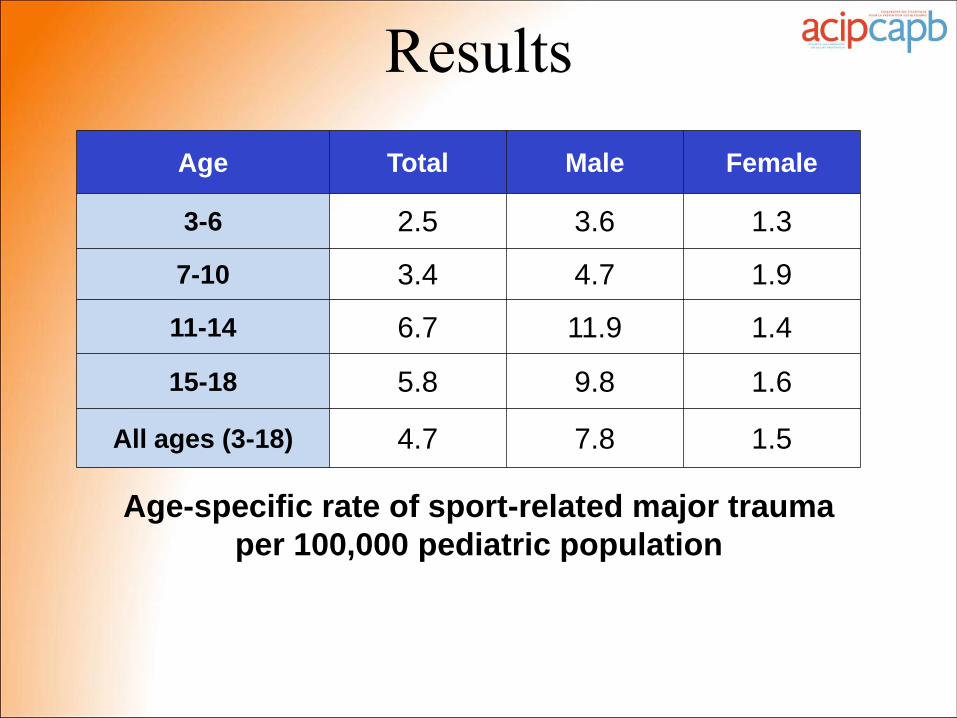
Age Total Male Female
3-6 2.5 3.6 1.3
7-10 3.4 4.7 1.9
11-14 6.7 11.9 1.4
15-18 5.8 9.8 1.6
All ages (3-18) 4.7 7.8 1.5
Age-specific rate of sport-related major trauma
per 100,000 pediatric population
Results

Sport
(N = 107)
Total,
n
Males,
% of n
Mean
age
(SD)
Mean
GCS
(SD)
Mean
ISS
(SD)
Helmet
worn,
% of n
Cycling 63 81 11.7 (3.6) 12.9 (3.5) 16.2 (10.1) 36
Hockey 9 100 14.4 (2.7) 10.0 (7.1) 18.3 (6.9) 100
Skateboarding 8 100 13.0 (4.2) 9.5 (5.5) 26.0 (14.1) 43
Skiing 7 86 14.9 (3.2) 12.3 (3.7) 15.6 (6.7) 57
Swimming 5 40 11.4 (5.9) 8.7 (6.7) 19.3 (4.9) n/a
Characteristics and severity of pediatric major trauma by type of activity
Results

Pediatric major trauma from cycling versus other activities
Results
0
2
4
6
8
10
3 4 5 6 7 8 9 10 11 12 13 14 15 16 17 18
# Major traumas
Age
Cycling Non-cycling

Sport Total,
n
SCU
admissions,
% of n
Mean days
in-hospital
(SD)
TBI,
% of n
Mortality
(%)
Cycling 63 41 4.3 (4.3) 54 < 5
Hockey 9 67 4.0 (2.2) 33 0
Skateboarding 8 43 10.7 (13.6) 43 < 5
Skiing 7 71 7.7 (8.1) 43 0
Swimming 5 80 4.0 (1.6) 40 < 5
Outcomes of pediatric sport-related major traumas
In keeping with NS Department of Health & Wellness privacy policy,
counts between 1-4 are reported as “n < 5”.
Results
• Pediatric major trauma related to sport and
recreational activity is relatively infrequent in
Nova Scotia with 107 cases recorded over a 13-
year period, accounting for 9% of all pediatric
major traumas during this time.
• Contrary to our hypothesis, hockey was not the
most common sport resulting in major trauma.
– cycling (59%)
– hockey (8%)
– skateboarding (7%)
Discussion
TBI and pediatric sports
• Overall, TBI occurred in over half of all
pediatric major trauma patients.
– 30% of hockey-related major traumas
• despite 100% reported helmet use
• Cycling was responsible for the most
cases of severe traumatic brain injury.
– 36% helmet use
Discussion

Study Limitations
Discussion
• Observational study, causality cannot be inferred. • The total number of youth participating in each sport
was unavailable. • Individuals treated in an ED for injury and discharged
without being admitted are not included in the NSTR
unless a Trauma Team was activated. • Data was not available for position played, experience
level, or presence of coaches/referees.
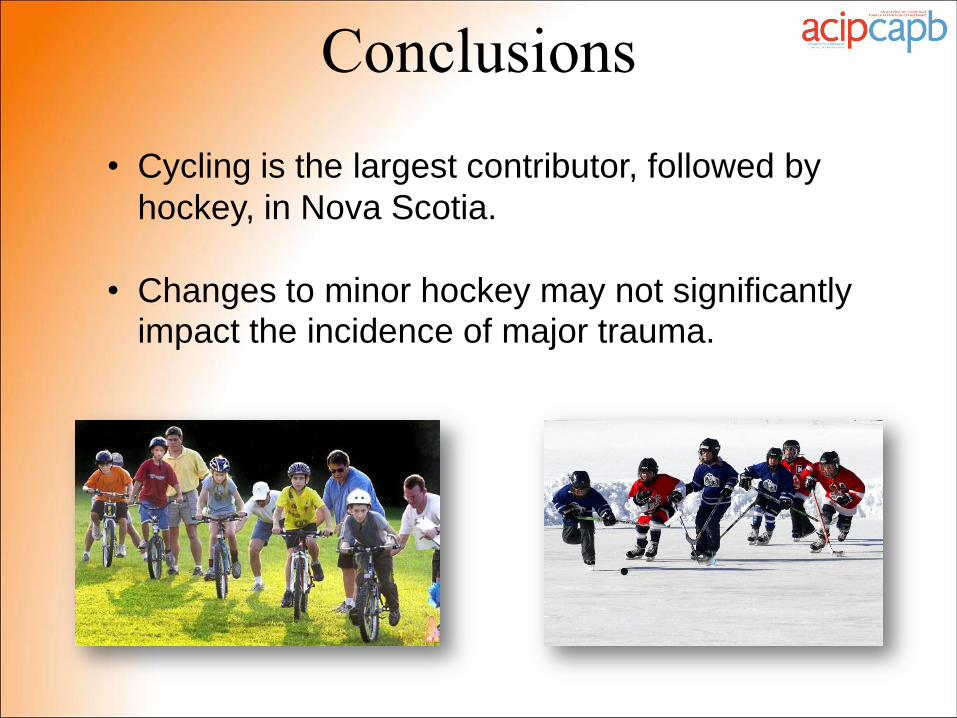
• Cycling is the largest contributor, followed by
hockey, in Nova Scotia.
• Changes to minor hockey may not significantly impact the incidence of major trauma.
Conclusions

Conclusions
• Though injury can be an unintended consequence
of playing sports, participating in sports has many
positive effects on the health of youth.
• Supporting efforts for the prevention of sport-related
injuries has the potential to greatly reduce the number
of injuries in children and adolescents.
Thank You
NSTP Staff

Golf
Skiing (Downhill)
Badminton
Volleyball
Baseball
Baskeball
Ice Hockey
Swimming
Soccer
Cycling
0% 5% 10% 15% 20% 25%
Active Participation Rate
Source: Canadian Heritage Sport Participation 2010. June 2013. Available at:
http://www.sirc.ca/online_resources/documents/SportParticipation%20Report%202013_EN_VF.pdf
Canadian participation rates (ages 15+)
in the top ten sports
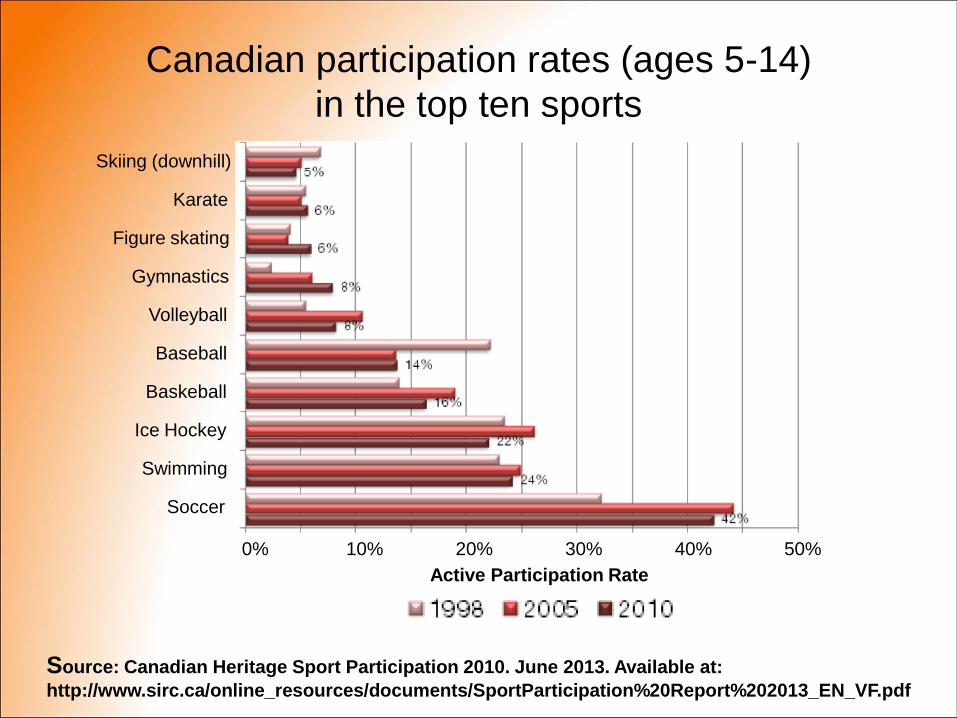
Skiing (downhill)
Karate
Figure skating
Gymnastics
Volleyball
Baseball
Baskeball
Ice Hockey
Swimming
Soccer
0% 10% 20% 30% 40% 50%
Active Participation Rate
Source: Canadian Heritage Sport Participation 2010. June 2013. Available at:
http://www.sirc.ca/online_resources/documents/SportParticipation%20Report%202013_EN_VF.pdf
Canadian participation rates (ages 5-14)
in the top ten sports

Methodology
Sport
CIHI
Sports/Rec
Incident Code
Sport
CIHI
Sports/Rec
Incident Code Badminton 7 Raquetball 61
Baseball 8 Ringette 62
Basketball 9 Rugby 63
Boxing (organized) 20 Skate Boarding 67
Curling 24 Skiing - Downhill (Recreational) 71
Cycling (Driver) 25 Skiing - Downhill (Racing) 72
Cycling (Passenger) 26 Skiiing - Cross Country 73
Diving 31 Skijumping 74
Football 37 Snowboarding 76
Golf 39 Soccer 80
Gymnastics (Organized) 40 Squash 81
Handball 41 Swimming (Pool) 82
Hockey (Ice) 45 Tennis 85
Hockey (Street/ball) 46 Track & Field (Organized) 87
Hockey (Field/floor) 47 Volleyball 89
Hockey (Inline) 48 Waterpolo 91
Lacrosse 54 Wrestling (Organized) 94