a research synthesis using an online findings archive
TRANSCRIPT

1
Does the internet make us happier?
A research synthesis using an online findings archive1
Ruut Veenhoven2 & Rijn Vogelaar3
EHERO working paper 2019-2
Erasmus Happiness Economics Research Organization: EHERO
Erasmus University Rotterdam, POB 1738, 300DR Rotterdam, Netherlands
Homepage: https://www.eur.nl/en/ehero/ E-mail: [email protected]
The Issue: The internet already has a strong influence on our professional and
private lives and the importance of the internet and information technology in general
will grow further in the years to come. Though welcomed by some, this development
is deplored by others and a discourse on the treads in internet has developed. Which
view is the most realistic?
Research questions: The internet involves positive and negative effects, the
balance of which will reflect in happiness. Hence the issue can be clarified by
considering the relationship between the internet and happiness. Is it a positive
relationship, a negative one or do these effects balance? Under what circumstances
does the internet add to happiness and when should we avoid staring at a screen?
For what purposes is the use of internet most beneficial? Are certain people more
vulnerable for the negative effects of using the internet?
1 We thank Yorizon, the IT happiness company (www.yorizongroup.com) for making this research possible and
Piet Ouweneel for entering the findings reported in this paper in the World Database of Happiness
2 Ruut Veenhoven, Emeritus Professor at Erasmus University Rotterdam, Netherlands, Erasmus Happiness
Economics Research Organization EHERO and North-West University South Africa, Optentia Research
Program E-mail: [email protected]
3 Rijn Vogelaar, PhD candidate, Leiden University. www.rijnvogelaar.com, E-mail: [email protected]

2
Method: We considered the results published in 34 research reports on the relation
between internet and happiness, which together yielded 117 findings. We reviewed
these findings, using a new technique. The findings were entered in an online
‘findings archive’, the World Database of Happiness, and each described in a
standardized format on a separate ‘findings page’ with a unique internet address. In
this paper, we use links to these finding pages and this allows us to summarize the
main trends in the findings in a few tabular schemes.
Results: The relationship between internet and happiness differs across aspects of
internet usage and different age groups. Access to internet relates positively to
happiness, but time spend on internet often relates negatively. Young people,
(adolescents and young adults) tend to be less happy the more they use the internet,
while seniors (65+) profit from having internet access.
Keywords: happiness, internet, information technology, research synthesis
1. Introduction
The internet is becoming increasingly dominant in people’s lives. People are
connected at work and in their leisure time. Checking the internet is often the first
thing people do when they get out of bed in the morning and the last thing they do
before going to sleep.
Blessing or curse?
The internet is in many cases making our lives more convenient. We can easily find
information, navigate and communicate within our social networks. But the internet
can also cause addiction and social isolation. These pros and cons are the subject of
an ongoing public debate, in which negative views dominate in spite of increasing
use of the technology.
Research on relation between internet and happiness
The balance of these positive and negative effects of internet will reflect in the
happiness of its users. For that reason, researchers have started to investigate the
3
relationship between the use of internet and happiness. In this paper we review the
results of this research.
Stakeholders
This research will serve the information demands of the internet industries,
organizations in general, policy makers and individual citizens.
Internet industries: Responsible business operation involves a realistic view on
the effect of products and services on individual consumers and society as a
whole. Happiness is a key effect to be considered. In this case of the internet
industries, a first question is how much truth is there in the claims of a negative
effect of internet use on human happiness. Is this mere conservatism or does
internet really harm? If internet lowers happiness, a second question is: How this
can be prevented? which raises further questions on causal mechanisms and
contextual variations.
Organizations in general: Companies and governmental organizations want their
employees to be happy. Happy employees are more productive, more
collaborative and healthier. The influence of IT and the internet in the working
environment has grown significantly and it will only grow further. Almost all
employee work with internet or will do so in the near future, and because of this
the relationship between the internet and happiness is becoming more important
for organizations in general.
Policy makers: Answers to the above question will also play a role in several
choices governments must make, such as pushing or restraining ongoing
digitalization and whether or not to invest in prevention of harmful internet
behaviour.
Individual citizens: Knowing to what extent the internet affects our happiness is
important. We are concerned about our own happiness and the happiness of our
children, parents and friends. Finding ways of increasing happiness for ourselves
and for our loved ones is probably one of the key goals in life. Some
determinants of happiness are beyond our control, but if and how we use the
internet is largely in our own hands.

4
Research problems
There are quite a few complications when it comes to empirical assessment of the
effects of the internet on happiness. The effects may differ across people and
situations. The internet is a relatively new technology and is developing at an
incredibly fast rate, such that the ongoing development may change its relationship
with happiness, e.g. because of improvements in the technology and greater ability
to handle it. Then there is the question of causality; a negative correlation may mean
that use of the internet lowers happiness or that unhappy people use the internet
more. In this paper we try to untangle these relationships.
1.1 Research questions
1. Does use of the internet go with greater happiness, less happiness or is there no
correlation?
2. What aspects of internet use are the most and least related to happiness?
3. Do the correlations between internet use and happiness differ across kinds of
people? If so, are there any groups in which negative relations stand out?
4. Under what circumstances is the relationship between internet usage and
happiness positive and when is the effect negative.
5. What is the direction of causality behind observed statistical relationships
between use of the internet and happiness?
6. Are there clues about causal mechanisms that drive these effects?
1.2 Approach
We explored answers to these questions in the available research literature and took
stock of the findings obtained in quantitative studies on the relation between internet
usage and happiness. We applied a new technique for research reviewing, that
takes advantage of an on-line findings archive, the World Database of Happiness,
which allowed us to present a lot of findings in a few easy to oversee tabular
schemes.
1.3 Structure of the paper
The remainder of this paper is organized as follows. We define our key concepts in
section 2; internet usage and happiness and give a short account of happiness
research. Next, we describe the new review technique in more detail: how we

5
gathered the available research findings and how we presented these in an easy to
overview way in section 3. Then we discuss what answers the available findings
have provided for our research questions in section 4. We discuss these findings in
section 5 and draw conclusions in section 6.
2. CONCEPTS and MEASURES
There are different views on what constitutes the ‘internet’ and ‘happiness’; for this
reason, a delineation of these notions is required.
2.1 Internet
The internet is a part of modern electronic information technology. Wikipedia
describes it as “the global system of interconnected computer networks that use
the Internet protocol suite (TCP/IP) to link devices worldwide. It is a network of
networks that consists of private, public, academic, business, and government
networks of local to global scope, linked by a broad array of electronic, wireless, and
optical networking technologies. The Internet carries a vast range of information
resources and services, such as the inter-linked hypertext documents
and applications of the World Wide Web (WWW), electronic mail, telephony and file
sharing”. The internet is used for professional and for private purposes and forms the
backbone of social media, such Facebook.
2.2. Happiness
Throughout history, the word ‘happiness’ has been used to denote different concepts
that can be loosely connected. Philosophers typically used that word to denote living
a good life and often emphasize moral behaviour. ‘Happiness’ has also been used to
denote good living conditions and associated with material affluence and physical
safety. Today, many social scientists use the word to denote subjective satisfaction
with life, which is also referred to as subjective well-being (SWB).
2.2.1 Definition of happiness
In that latter line, Veenhoven (1984:22) defines happiness as the degree to which an
individual judges the overall quality of his/her life-as-a-whole favourably and in a
later paper distinguished this definition of happiness from other notions of the good
life (Veenhoven 2000). In this paper, we follow the above conceptualization as it is

6
also the focus of the World Database of Happiness (Veenhoven 2018) from which
the data reported in this paper are drawn.
2.2.1.1 Components of happiness
Our overall evaluation of life draws on two sources of information: (1) how well one
feels most of the time and (2) to what extent one perceives one is getting from life
what one wants from it. We refer to these sub-assessments as ‘components’ of
happiness, called respectively ‘hedonic level of affect' and 'contentment' (Veenhoven
1984: 25-27). The affective component tends to dominate in the overall evaluation of
life (Kainulainen et al. 2018).
2.2.1.2 Difference with wider notions of wellbeing
Happiness in the sense of the ‘subjective enjoyment of one’s life-as-a-whole’, should
not be equated with satisfaction with domains of life, such as satisfaction with one’s
life-style. Likewise, happiness in the sense of the ‘subjective enjoyment of one’s life’
should not be equated with ‘objective’ notions of what is a good life, which are
sometimes denoted using the same term. Though strongly related to happiness,
mental health is not the same; one can be pathologically happy or be happy in spite
of a psychological condition. Differences in wider notions of well-being are discussed
in more detail in Veenhoven (2018a chapter 2).
2.2.2 Measurement of happiness
Since happiness is defined as something that is on our mind, it can be measured
using questioning. Various ways of questioning have been used, direct questions as
well as indirect questions, open questions and closed questions and one-time
retrospective questions and repeated questions on happiness in the moment.
Not all questions used fit the above definition of happiness adequately, e.g. not the
question whether one thinks one is happier than most people of one’s age, which is
an item in the Subjective Happiness Scale (SHS) of Lyubomirski & Lepper (1999).
Findings obtained using such invalid measures are not included in the World
Database of Happiness and hence were not considered in this research synthesis.
Further detail on the validity assessment of questions on happiness is available in
the introductory text to the collection Measures of Happiness of the World Database
7
of Happiness (Veenhoven 2018b, chapter 4). Some illustrative questions deemed
valid for archiving in the WDH are presented below.
Question on overall happiness:
Taking all together, how happy would you say you are these days?
Questions on hedonic level of affect:
Would you say that you are usually cheerful or dejected? How is your mood
today? (Repeated several days)
Questions on contentment:
1) How important are each of these goals for you?
2) How successful have you been in the pursuit of these goals?
2.2.3 Happiness research
As the readers of this paper may not be familiar with the scientific study of
happiness, as defined above in section 2.1, the following information will be useful.
2.2.3.1 Rise of empirical research
Over the ages happiness has been a subject of philosophical speculation and in the
second half of the 20th century it also became the subject of empirical research. In
the 1960’s, happiness appeared as a side-subject in research on successful aging
(e.g. Neugarten et al. 1961) and mental health (e.g. Gurin et al. 1960). In the 1970’s
happiness became a topic in social indicators research (Veenhoven 2017) and in the
1980s in medical quality of life research (e.g. Calman, 1984). Since the 2000’s,
happiness has become a main subject in the fields of ‘Positive Psychology’ (e.g.
Lyubomirsky 2008) and ‘Happiness Economics’ (e.g. Bruni & Porta, 2000).
All this has resulted in a spectacular rise in the number of scholarly
publications on happiness and in the past year (2018) some 800 new research
reports were published. To date (June 2019), the Bibliography of Happiness list 7201
reports of empirical studies in which a valid measure of happiness has been used
(Veenhoven 2019a).
2.2.3.2 Findings archive: The World Database of Happiness.
This flow of research findings on happiness has grown too big to oversee, even for
8
specialists. For this reason, a findings archive has been established, in which
quantitative outcomes are presented in a uniform format and are sorted by subject.
This ‘World Database of Happiness’ is freely available on the internet (Veenhoven
2019). Its structure is shown on Figure 1 and a recent description of this novel
technique for the accumulation of research findings can be found with Veenhoven
(2019g). One of the subject categories in the collection of correlational findings is
‘Happiness and Internet’ (Veenhoven 2019d) and we draw on this source for this
paper.
Go to Figure 1
3. METHODS
A first step in this review was to gather the available quantitative research findings
on the relationship between internet usage and happiness. The second step was to
present these findings in an uncomplicated form.
3.1 Gathering of research findings
In order to identify relevant papers for this synthesis, we inspected which
publications on the subject of internet were already included of the Bibliography of
World Database of Happiness, in the subject sections Internet penetration in nations,
personal internet access, personal internet proficiency and internet training, personal
internet use and personal internet addiction. Then to complete the collection of
studies further, we searched Google Scholar.
All reviewed studies had to meet the following criteria.
1. A report on the study should be available in English, French, German or Spanish.
2. The study should concern happiness in the sense of life-satisfaction (cf. section
2.1). We excluded studies on related matters, such as on mental health or wider
notions of ‘flourishing’.
3. The study should involve a valid measure of happiness (cf. section 2.2). We
excluded scales that involved questions on different matters, such as the much-
used Satisfaction with Life Scale (Diener et al 1985).
4. The study results had to be expressed using some type of quantitative analysis.
9
3.2 Studies found
We found 34 reports of an empirical investigation that had examined the relationship
between aspects of internet use and happiness, of which two were working papers
and one a master thesis. None of these publications reported more than one study.
The studies yielded 117 findings. All the papers were fairly recent, having been
published between 1999 and 2019.
Together, the studies covered 1.055.826 respondents and over 100 different
countries. The publics investigated in these studies, included the general population
in countries and particular groups such as adolescents and the elderly. Six studies
focused on internet users and two out of this six specifically focussed on social
media users.
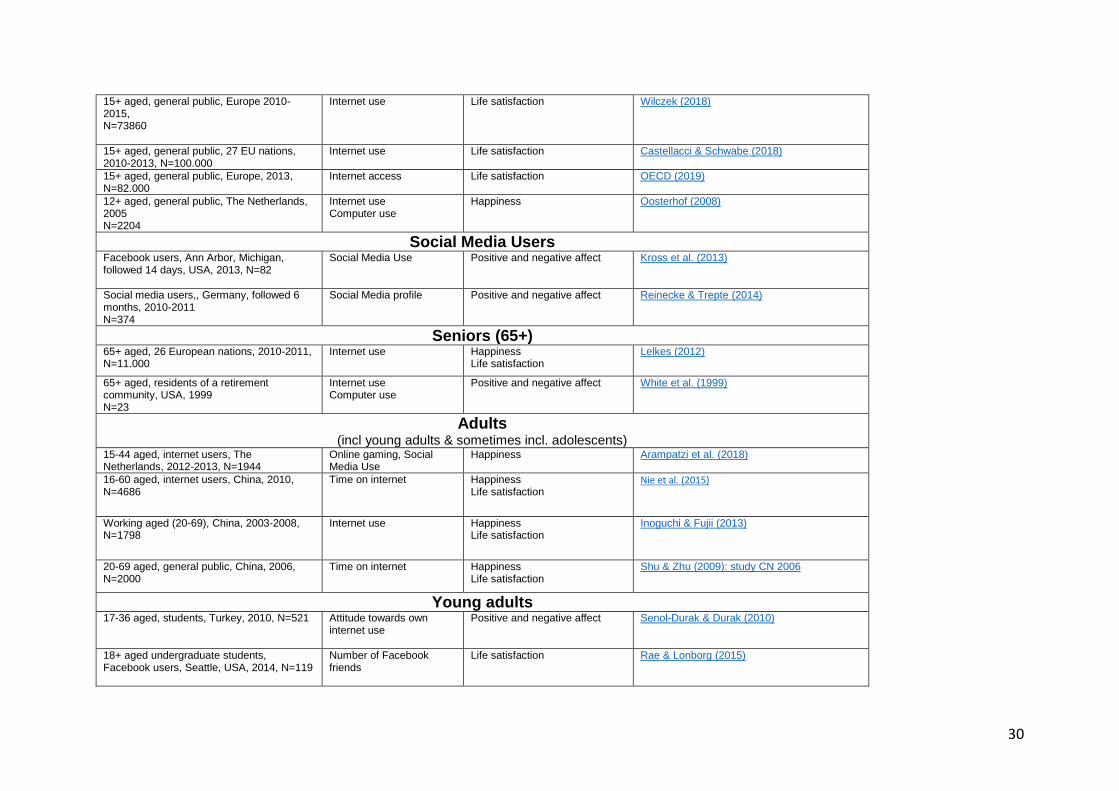
We present an overview of all the included studies, including information about
population, measures and publication in table 1.
Go to Table 1
3.3 Format of this research synthesis
As announced, we applied a new technique of research reviewing, taking advantage
of two technical innovations: a) The availability of an on-line findings-archive (the
World Database of Happiness) that holds descriptions of research findings in a
standard format and terminology, presented on separate finding pages with a unique
internet address. b) The change in academic publishing from print on paper to
electronic text read on screen, into which links to that online information can be
inserted.
3.3.1 Links to online detail
In this review, we summarize the observed statistical relationships as +, – or 0
signs4. These signs link to finding pages in the World Database of Happiness, which
serves as an online appendix in this article. If you click on a sign, one such a finding
page will open, on which you can see full details of the observed relationship; of the
people investigated, sampling, the measurement of both variables and the statistical
4 The technique also allows summarization in a number, which can be presented in a stem-leaf diagram, or in
short verbal. statements, such as ‘U shaped relationship’

10
analysis. An example of such an electronic finding page is presented in Figure 2.
This technique allows us to present the main trends in the findings without burdening
the reader with all the details while keeping the paper to a controllable size, at the
same time allowing the reader to check in depth any detail they wish.
3.3.2 Organization of the findings
We first sorted the findings by the research method used and these are presented in
three separate columns of tables 2 and 3. We distinguished a) cross-sectional
studies, assessing same-time relationships between use of the internet and
happiness, b) longitudinal studies, assessing change in happiness following changes
in internet use, and c) experimental studies, assessing the effect of induced changes
in internet behaviour on happiness.
In the tables, we distinguish between studies at the micro level, in which the relation
between internet behaviour and happiness of individuals was assessed and studies
at the macro level, in which average internet access and internet behaviour in
nations are linked to the average happiness of citizens.
We present internet variables vertically and horizontally two kinds of
happiness: overall happiness (life-satisfaction) and hedonic level of affect.
3.3.3 Presentation of the findings
The observed quantitative relationships between aspects of internet and happiness
are summarized using 3 possible signs: + for a positive relationship, ̶ for a
negative relationship and 0 for a non-relationship. Statistical significance is indicated
by printing the sign in bold. See tables 2 and 3. Each sign contains a link to a
particular ‘finding page’ in the World Database of Happiness, where you can find
more detail on the checked finding. An example of such a findings page is presented
in Figure 2.
Some of the findings appear in more than one cell of a table. This is the case
for pages on which a ‘raw’ (zero-order) correlation is reported next to a ‘partial’
correlation in which the effect of control variables is removed. Several cells in the
tables remain empty and these denote blanks in our knowledge.
Go to Figure 2

11
3.3.4 Advantages and disadvantages of this review technique
There are pros and cons to the use of a findings-archive such as the World
Database of Happiness and plusses and minuses to the use of links to an on-line
source in a text like this one.
Use of a findings-archive: Advantages are: a) efficient gathering of research on a
particular topic, happiness in this case, b) sharp conceptual focus and selection of
studies on that basis, c) uniform description of research findings on electronic finding
pages, using a standard format and a technical terminology, d) storage of these
finding pages in a well searchable database, e) which is available on-line and f) to
which links can be made from texts. The technique is particular useful for ongoing
harvesting of research findings on a particular subject.
Disadvantages are: a) the sharp conceptual focus cannot easily be changed,
b) considerable investment is required to develop explicit criteria for inclusion in the
findings archive, definition of technical terms and software5, c) which pays only when
a lot of research is processed on a continuous basis.
Use of links in a review paper: The use of links to an on-line source allows us to
provide extremely short summaries of research findings, in this text by using +, – and
0 signs, in bold or not, while allowing the reader access to the full details of the
research. This technique was used in an earlier research synthesis on wealth and
happiness (Jantsch & Veenhoven 2019) and is described in more detail in
Veenhoven (2019). Advantages of such representation are: a) an easy overview of
the main trend in the findings, in this case a mixed pattern of + and – signs, b)
access to the full details behind the links, c) an easy overview of the white spots in
the empty cells in the tables, and d) easy updates, by entering new sign in the
tables, possibly marked with a colour.
The disadvantages are: a) much of the detailed information is not directly
visible in the + and – signs, b) in particular not the effect size and control variables
used, and c) the links work only for electronic texts.
5 The archive can be easily adjusted for other subjects. The software is Open Source

12
3.3.5 Differences with traditional reviewing
Usual review articles cannot report much detail about the studies considered and
rely heavily on references to the research reports read by the reviewer, which
typically figure in a long list at the end of the review paper that the reader can hardly
check. As such, these reviews are vulnerable to interpretations made by the reviewer
and methodological variation can escape the eye.
Another difference is that the conceptual focus of many traditional reviews in
this field is often loose, covering fuzzy notions of ‘well-being’ rather than a well-
defined concept of ‘happiness’ as used here. This blurs the view on what the data tell
and involves a risk of ‘cherry picking’ by reviewers. A related difference is that
traditional reviews of happiness research often assume that the name of a
questionnaire corresponds with its conceptual contents. Yet, several ‘happiness
scales’ measure things other than happiness as defined in section 2.2.2, e.g. much
used Life Satisfaction Scale (Neugarten et al 1961), which measures social
functioning.
Still another difference is that traditional narrative reviews focus on
interpretations advanced by authors of research reports, while in this quantitative
research synthesis we focus on the data as presented.
3.3.6 Difference with traditional meta-analysis
Though this research synthesis is a kind of meta-analysis, it differs from common
meta-analytic studies in several ways. One difference is the above- mentioned
conceptual rigor; like narrative reviews, many meta-analyses look to the names
given to variables for their content, thus adding apples and oranges and comparing
chalk and cheese. Another difference is the availability of direct online access to full
details of the research findings considered, presented in a standard format and
terminology, while traditional meta-analytic studies just provide a reference to
research reports from which the data were taken. A last difference is that most
traditional meta-analytic studies aim at summarizing the research findings in
numbers, such as an average effect size. Such quantification is almost not possible
for the data at hand here and is not required for answering our research questions.
Our presentation of the separate findings in tabular schemes provides more
information, both of the general tendency and of the details, in a simple ‘overview’
manner.

13
4 RESULTS
An overview of the findings is presented in table 2. At a glance two patterns appear.
With respect to the methods used, the reader can see that most of the findings are
based on cross-sectional data, that is, comparisons of happiness and internet at the
same time. Only four findings are based on a follow-up study and only one on an
experiment. With respect to the outcomes a mixed picture appears, with plusses and
minuses varying across and within rows and columns. On that basis we can now
answer our research questions.
Go to Table 2
4.1 Is there a correlation between internet usage and happiness?
In total we collected 117 findings from 34 different research reports. Of these
findings 110 showed a correlation between happiness and internet usage, 7 findings
showed no relationship at all. Of the 117 findings 47 were statistically significant.
4.1.1 Real correlation
When looking for a relationship between two variables one should always be aware
of the possibility of a third variable influencing both variables. For example; when we
find a relationship between internet use and happiness, it could be the case that
level of education actually influences both variables. People who have a higher level
of education more often have internet access and are also happier. Most findings
(86/117) however were ‘partial’ correlations, in which the statistical effect of control
variables (e.g. education, income, gender, marital status, employment status) has
been removed. The control variables used differed across studies, so the interested
reader should check case by case, clicking the signs in table 2.
Removing the effect of possible spurious correlation involves the risk of over-
control. When too many variables are controlled all possible correlation may
disappear, including an existing relationship between internet use and happiness.
For example, we found that adolescents and young adults were more vulnerable to
excessive internet usage (see 4.4.2), which is related to spending time on the
internet and social media usage. When studies control for age and income this
relationship will disappear, with the risk of ignoring a relevant finding.

14
With these limitations in mind, it is notable that the partial correlations did not
differ very much from the zero-order correlations shown in table 2. Exceptions are
the cases of time on internet and use of social media where significant negative
zero-order correlations appear next to significant positive partial correlations. This is
probably a reflection of the dissimilar relationships we for different groups. Younger
people and people who are socially isolated often show a negative relation between
time on the internet and happiness, while elderly and people with a rich social life
seem to profit from time spend on the internet and social media. So when a partial
correlation controls for age or social connections the direction of the relationship may
flip.
4.1.2 Direction of the correlation
Of the 117 findings 46 showed a positive relationship of happiness and internet
usage and 64 showed a negative relationship, 7 findings showed no relationship.
When we only consider the 47 statistically significant results 27 (57%) of these
showed a positive relationship to happiness and 20 (43%) findings showed a
negative effect. Of the 63 non-significant findings 19 (30%) showed a positive
relationship and 44 (70%) a negative one. So, when all results are considered we
found more negative relationships, but when only the significant results are
considered the positive relationships are more frequent.
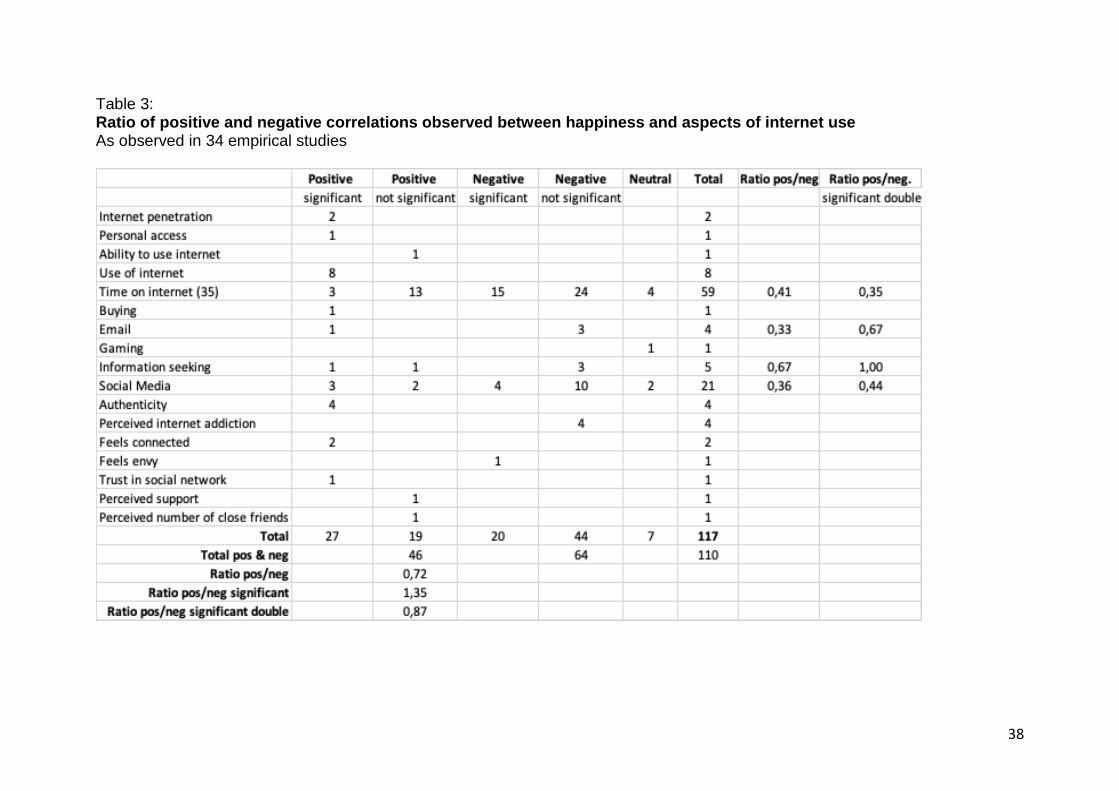
Positive versus negative ratio
One could argue that the significant results are more important than non-significant
findings. Calculating a ratio where significant results count double is a way to bring
this into the equation. When we calculated this, we found a positive versus negative
ratio of 0,87, see table 3. According to this ratio one could argue that internet use
has a slightly negative effect on happiness, but as the ratio is close to 1, it is
probably more justified to say that the positive and negative effects are more or less
in balance.
Go to Table 3
When we looked at the ‘raw’ (zero-order) findings the positive/ negative ratio was
0,59 (10/17). In the findings reporting partial correlations the ratio was 0,80 (37/46).
When we looked only at findings with partial correlations that were significant, the

15
ratio was 1,58 (19/12). Of the zero-order findings only 6 correlations were significant
and they were all negative. When we combined significant and non-significant in a
ratio where significant results were counted double, as we did before, the positive
versus negative ratio was 0,43 (10/23) for zero-order correlations and 0,93 (54/58)
for partial correlations. So, when only the significant results were considered that
control for spuriousness, an almost equal amount of negative and positive
relationships between happiness and internet usage were found.
4.1.3 Size of the correlations
When we looked at the size of the zero order correlations, they were generally small.
Very few correlations were larger than .20. The positive correlation found by Böhnke
et al. (2008) is one of the exceptions (b=+.58). They found that people in Turkey that
are connected to the Internet are considerably more satisfied with their lives,
although much of this effect is based on the socio-economic status of the typical
Internet user. Oh et al. (2004) found a positive relationship of considerable size for
people who feel connected to their social network and life satisfaction (r=+.48) and
also for people who have trust in their social network and happiness (r=+.37). This
might be related to social media usage, but it could also mean that these people
have better social connections in general, which we know is one of the best
predictors of happiness. In which case the relationship that Oh et al. (2004) found is
just a reflection of the social connections of the respondents’ offline life. The negative
correlations we found between internet usage and happiness were all quite small,
most of them smaller than r= -.10. The relationship with perceived internet addiction
(Yoo et al. 2014) and happiness was the largest negative effect (r=-.20).
4.2 What aspects of internet use are the most and least related to happiness?
The different aspects of the internet evaluated in the various studies have a
dissimilar effect on happiness. We will discuss the different aspects separately.
4.2.1 General internet usage
If we only look at general internet usage, we find a positive relationship with
happiness. Access to internet (3 findings, all significant) and the ability to use the
internet (1 finding, not significant) are positive related to happiness. Usage of the

16
internet (versus non-usage) generally show a positive relationship too (9 significant
positive findings versus 2 nonsignificant negative finding). The negative relationships
were part of the study of Pierewan et al. (2014a) who found a nonsignificant negative
relationship before the financial crises (2 findings; 2004, 2006) and a significant
positive one during the crisis (2 findings; 2008, 2010).
4.2.2 Time om internet
Spending time on internet (58 findings) is negatively correlated with happiness in
most findings (38 findings are negative, 16 findings are positive and 4 are neutral).
Often the negative findings are related to excessive use (f.e. Brkliacic et al., 2018) or
problematic internet use (Lachmann et al., 2016). Problematic Internet use (PIU)
or Internet Addiction Disorder (IAD) is characterized by excessive or poorly
controlled preoccupations, urges, or behaviours regarding computer use and Internet
access that lead to impairment or distress (Weinstein et. Al., 2014). Adolescents
especially (f.e. Yoo et al., 2014), young adults and people who feel disconnected and
lonely (Arampatzi et al., 2012) show a negative relationship with spending (too
much) time on internet and happiness.
4.2.3 What internet is used for
Shopping online is positively related to satisfaction with life (Lissitsa et al., 2016, 1
finding), while online gaming does not seem to influence life satisfaction either a
positive or a negative way (Lissitsa et al., 2016, 1 finding). Reading e-mail many
times a day goes with unhappiness (4 findings, 3 negative). Information seeking is
sometimes found positive (2 findings) in relation to happiness and sometimes
negative (2 findings).
Social Media:
Most studies that examined the relationship between social media use and
happiness report negative findings (21 findings, 14 negative, 5 positive, 2 neutral).
When people use social media in an authentic (showing the ‘real self’) way it can add
to happiness (Reinecke et al., 2014, 4 findings, all positive, two longitudinal).
Reinecke illustrates that only people with high levels of well-being profit from this
beneficial effect of authentic communication on social network sites. They explain
this as a ‘positivity bias in social network communication’; positive forms of
authenticity are favoured over negative ones, so for people with low levels of well-

17
being it is harder to be authentic and report on their lives in a way that is expected in
social networks. The Reinecke study suggests that social media makes happy
people happier and unhappy people unhappier.
4.3 Does internet use influence the happiness of different groups differently?
Reviewing the different findings, it becomes clear that the relationship between use
of the internet and happiness is not the same for the different groups in the studies,
age-differences especially strike the eye. We provide an overview of these age
differences in table 2a, which is a copy of table 2 in which we used colours to mark
signs that pertain to particular age groups.
Adolescents especially and young adults seem vulnerable to Problematic
Internet use (PIU). All the findings that specifically look into these younger groups
show a negative (14 findings) or neutral (5 findings) relationship between internet
usage and happiness. Furthermore, a study by Arampatzi et al. (2012) shows that
spending time on social media networks correlates negatively to happiness for
people who feel socially disconnected and lonely. Another study (Nie et al., 2015)
point to a possible cultural factor that puts Chinese Internet users at psychological
risk.
In contrast to youngsters, senior citizens (65+) seem to thrive on internet use.
All five findings concerning this group are positive. Other groups that show a positive
relationship between internet usage and happiness are people from weaker social
groups: people from low economic strata, those suffering from health problems
(Lissitsa et al., 2016), people with fewer educational qualifications or women,
especially from developing countries (BCS, 2010).
Go to Table 2a

18
4.4 Under what circumstances is the relationship between internet usage and
happiness positive and when is the effect negative?
Theoretically one can think of many contextual moderators, which can figure at the
macro level of society, the meso level of social institutions and at the micro level of
individuals. Empirically, the available research shows only a few variations.
4.4.1 Macro level moderators
One study (Pierewan et al., 2014a) examines this association before and during the
financial crisis in Europe in the period 2004-2010 (the crisis started in 2007). They
found that internet use is not associated with well-being before the crisis, whilst they
find a positive relationship during the crisis. Beyond this they found that using the
internet to respond to a situation of unemployment may help individuals to improved
well-being.
4.4.2 Micro level moderators
A great deal of the correlation appears to depend on the attitudes people have
towards the internet. A negative relation between internet usage and life satisfaction
is found when people consider themselves to be addicted to the internet (Yoo et al.,
2014, 4 findings, all negative) or when they catch themselves envying other people
on Facebook (Krasnova et al., 2013, one finding). Positive relations are found when
people feel connection, trust, closeness and support in relation to their social
network online (Oh et al., 2014).
4.5 Causality
Assessing how internet use relates to happiness is one thing, but the stakeholders,
mentioned in the introduction to this paper, would also like to know why these
statistical relations exist and in particular what causes what through which
mechanisms.
4.5.1 Direction of causality
When we find a positive relationship between internet usage and happiness this
does not mean that the internet use causes happiness. It may simply be the case
that happy people use the internet more. The findings from cross-sectional studies in
table 2 do not inform us about the direction of causality, but the few longitudinal

19
findings and the one experimental finding in the right hand columns do.
Two longitudinal studies (Kross et al., 2013, 4 findings, Orben et al., 2019, 2
findings) show a negative effect of internet use on happiness and one longitudinal
study finds a positive effect (Reinecke & Trepte, 2014, 2 findings).
One experimental study also found a positive relationship (White et al., 1999,
one finding). Social media usage can apparently have a negative effect on the
subjective well-being (Kross et al. 2013, & Orben et al., 2019) but internet use can
also have a positive effect on happiness (Reinecke et al., 2014) for people with high
levels of well-being who show authentic behaviour online.
A positive causal effect of internet use on happiness is also found in a
longitudinal study examining the effect of a computer training amongst elderly. These
studies show that causal relationships between internet usage and happiness exist
but that the direction depends on the age group and the way in which the internet is
used.
4.5.2 Causal mechanisms
Positive and negative effects of internet use on happiness can be driven by various
underlying causes. One such causal mechanism, commonly mentioned in the public
debate, is that the use of internet will create envy, the use of social media in
particular. Another common lay-theory is that frequent on-line contacts go at the cost
of real-life social contacts and as such impedes meeting our innate need for
intimacy.
These two explanations can be linked to the two ‘components’ of happiness,
discussed in section 2.2.1.1, in particular when seen in the context of Veenhoven’s
(2000) theory of happiness. This theory holds that the affective component of
happiness (how well one feels most of the time) reflects the extent to which innate
needs are being gratified, while the cognitive component (seeing to get what you
want) reflects the degree to which culturally variable wants are met.
If deprivation of an innate need for face-to-face contact is the case, we would
expect more pronounced correlations with the affective component, contact-deprived
internet users feeling miserable, typically without knowing why. If ‘envy’ was a main
causal effect, that should reflect in stronger correlations with the cognitive
component of happiness than with the affective component, because the effect of
internet use on happiness is in cognitive comparison with the overly positive self-
20
presentations of internet friends.
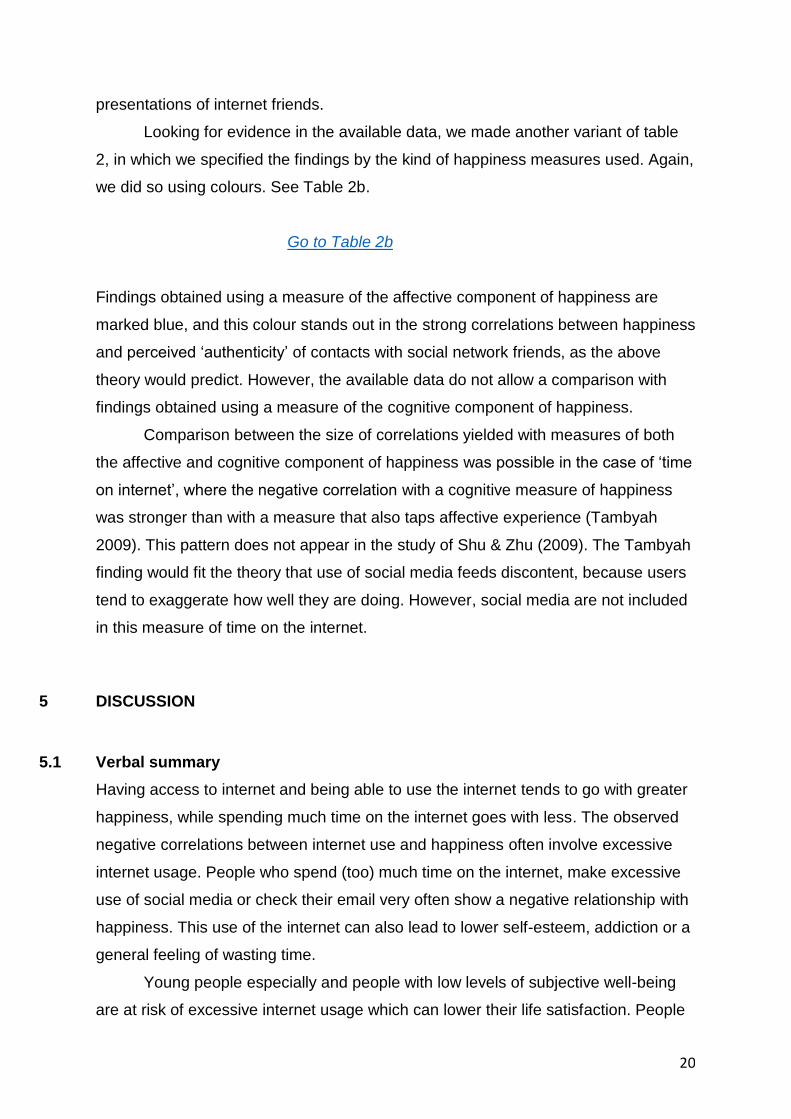
Looking for evidence in the available data, we made another variant of table
2, in which we specified the findings by the kind of happiness measures used. Again,
we did so using colours. See Table 2b.
Go to Table 2b
Findings obtained using a measure of the affective component of happiness are
marked blue, and this colour stands out in the strong correlations between happiness
and perceived ‘authenticity’ of contacts with social network friends, as the above
theory would predict. However, the available data do not allow a comparison with
findings obtained using a measure of the cognitive component of happiness.
Comparison between the size of correlations yielded with measures of both
the affective and cognitive component of happiness was possible in the case of ‘time
on internet’, where the negative correlation with a cognitive measure of happiness
was stronger than with a measure that also taps affective experience (Tambyah
2009). This pattern does not appear in the study of Shu & Zhu (2009). The Tambyah
finding would fit the theory that use of social media feeds discontent, because users
tend to exaggerate how well they are doing. However, social media are not included
in this measure of time on the internet.
5 DISCUSSION
5.1 Verbal summary
Having access to internet and being able to use the internet tends to go with greater
happiness, while spending much time on the internet goes with less. The observed
negative correlations between internet use and happiness often involve excessive
internet usage. People who spend (too) much time on the internet, make excessive
use of social media or check their email very often show a negative relationship with
happiness. This use of the internet can also lead to lower self-esteem, addiction or a
general feeling of wasting time.
Young people especially and people with low levels of subjective well-being
are at risk of excessive internet usage which can lower their life satisfaction. People

21
who are socially disconnected and lonely also show a negative relationship. This
could turn into a negative vicious circle and turn into problematic internet use (PIU)
or Internet Addiction Disorder (IAD). Social media can reinforce this effect because it
encourages people to share positive stories. Using Social media is beneficial to
people with high levels of well-being, who can exhibit their happy lives, but it can be
harmful to people with low levels of well-being because they might feel envious when
they are confronted with this exposure of happiness and they might experience
pressure to exhibit inauthentic behaviour, by pretending to be happy while they are
not.
In general, one could say that the internet has a positive influence on
happiness for people who use it wisely and moderately. It can help to build and
sustain social connections and it can improve job opportunities. The elderly (65+)
especially profit from internet usage. When they have internet access they can stay
connected to the rest of the world, even if they lose their mobility.
5.2 Limitations
This research synthesis limits to happiness defined as the subjective enjoyment of
one’s life as a whole and measure that matter adequately. This conceptual focus has
a price, we came to know more about less. The available research findings do not
allow a traditional meta-analysis, both because of the limited numbers and their
heterogeneity. Hence, we cannot yet compute effect sizes or test statistical
significance of differences.
5.3 Tracking of future research
The available research findings allowed only preliminary answers to the research
questions we raised in section 1.1. Research interest is growing and we expect that
the evidence base will triple in a few years. The new findings should then be entered
in the World Database of Happiness, in addition to these we entered for the purpose
of this first research synthesis. Progress reports on this can use the format
presented here. Such periodical updates following well-defined concepts and using a
standard format will allow more accumulation of knowledge than the current practice
of incidental review studies. The stakeholders mentioned in the introductory section
need to invest in this systematic collection of research findings on the impact of the
internet on human happiness.

22
6 CONCLUSIONS
One can conclude that the internet can be a blessing or a curse depending on how it
is used and who is using it. Most elements of the internet are positively related to
happiness, but spending too much time on the internet is often negatively related to
happiness. Youngster, lonely people and people with low levels of self-esteem are at
risk of problematic internet use (PIU). Social media, used most intensely by young
people, adds to this risk because it makes happy people happier and unhappy
people unhappier.
When the internet is used moderately and wisely it is positively related to
happiness. The elderly especially (65+) seem to profit from using the internet. It is
too early to draw firm conclusions, because in most of the studies the correlations
were weak and only a few studies examined the chain of causality. Given the
growing importance of the internet in our work and our daily lives we think that it
would be advisable, to investigate further the relationship between use of the internet
and happiness.

23
REFERENCES Studies included in this research synthesis are mentioned in table 1.
Arampatzi et al. (2018): study NL 2012. Social Network Sites, Individual Social Capital and Happiness. Journal of Happiness Studies, 2018, Vol. 19, 99 - 122 BCS (2010), The Information Dividend: Can IT Make you ''Happier''. Research Report by Trajectory Partnership i.o.o. BCS the Chartered Institute for IT, 2010, London, UK Böhnke & Kohler (2008), Well-Being and Inequality. WZB Discussion Paper no. SP I 2008-201, 2008, Berlin, Germany Brkljacic et al. (2018), I’m Always Online: Well-Being and Main Sources of Life Dis/Satisfaction of Heavy Internet Users. Bahadir Bozoglan, "Psychological, Social and Cultural Aspects of Internet Addiction", 2018, IGI Global, Hershey PA, USA, 72 – 88. Bruni, L. & Porta, P.L (2005). Economics and Happiness. Oxford University Press, UK. Castellacci & Schwabe (2018), Internet Use and the U-shaped Relationship Between Age and Well-being. Working Paper, 2018, Nr. 0215, TIK Centre, University of Oslo, Norway Diener, E., Emmons, R.A., Griffin, S. & Larsen, R.J. (1985). The Satisfaction with Life Scale. Journal of Personality Assessment, 49: 71 – 75 Duimel (2017). Tieners en Geluk: Liever een Leven Online dan een Gezinsleven? (Teenage Happiness: Link with Familylife and Life On-Line.) In Schnabel, P.; Ed.: "Veel Geluk in 2007", Social Cultural Planning Office, 2007, The Hague, Netherlands, 130 - 135 Gurin, G., Feld, S. & Veroff, J (1960). Americans View their Mental Health. A Nationwide Interview
Survey. Basic Books, New York, USA (Reprint in 1980, Arno Press, New York, USA) Inoguchi & Fujii (2013), The Quality of Life in Asia. A Comparison of Quality of Life in Asia, Springer, 2013, Dordrecht, Netherlands. Kainulainen, S, Saari, J. & Veenhoven, R (2018). Life-satisfaction is more a matter of how well you feel, than of having what you want International Journal of Happiness and Development, 4 (3) 209-235 Krasnova et al. (2013), Envy on Facebook: A Hidden Threat to Users’ Life Satisfaction?, Paper for 11th International Conference on Wirtschaftsinformatik, 27th February - 01st March 2013, 1 - 17 Leipzig, Germany. Kross et al. (2013). Facebook Use Predicts Declines in Subjective Well-Being in Young Adults. Open Access, 2013, Plos One, Vol. 8, 1 – 7

24
Lachmann et al (2016). Life Satisfaction and Problematic Internet Use: Evidence for Gender Specific Effects. Psychiatry Research, 2016, Vol. 238, 363 – 367 Lannotti et al. (2009). Interrelationships of Adolescent Physical Activity, Screen-based Sedentarry Behavior and Social and Psychological Health. International Journal of Public Health, 2009, Vol. 54, 191 - 198 Lee et al. (2011b). Use of Social-Networking Sites and Subjective Well-Being: A Study in South Korea. Cyberpsychology, Behavior and Social Networking, 2011, Vol.14, 151 - 159 Lelkes (2012), Happier and Less Isolated: Internet Use in Old Age. MPRA Paper no. 42546, 2012, Germany. Lissitsa & Chachashvili-Bolotin (2016). Life Satisfaction in the Internet Age - Changes in the Past Decade. Computers in Human Behavior, 2016, Vol. 54, 197 - 206 Lohmann (2013). Information Technologies and Subjective Well-Being: Does the Internet Raise Material Aspirations? Discussion Papers, Center for European Governance and Economic Development Research, 2013, No. 169, Goettingen, Germany Lyubomirski, S. & Lepper, H.S. (1999). A Measure of Subjective Happiness: Preliminary Reliability and Construct Validation. Social Indicators Research, 46, 137 – 155 Lyubomirsky, S., Diener, E. & King, L.A. (2005). The Benefits of Frequent Positive Affect: Does Happiness Lead to Success? Psychological Bulletin, 131: 803 – 855. Neugarten, B.L., Havighurst, R.J. & Tobin, S. S (1961). The Measurement of Life Satisfaction. Journal of Gerontology, 16: 134 -143. Nie et al. (2015): study CN 2010. Internet Use and Subjective Well-Being in China. Hohenheim Discussion Papers, 2015, 07-2015, 1 – 48. OECD (2019). How’s Life in the Digital Age? Opportunities and Risks of the Digital Transformation for People's Well-being. OECD Publishing, Paris, France Oh et al. (2004), How Does Online Social Networking Enhance Life Satisfaction? The Relationships among Online Supportive Interaction, Affect, Perceived Social Support, Sense of Community, and Life Satisfaction, Computers in Human Behavior, 2014, Vol. 30, 69 – 78 Oosterhof (2008). Maakt Vrije Tijd Gelukkig? De Invloed van Vrije Tijd op Geluksbeleving van Nederlanders. (Does Leisure Time make You Happy? The Influence of Leisure Time on the Happiness Experience of the Dutch). Master Thesis, Faculty Social Sciences, Erasmus University Rotterdam, 2008, Netherlands Orben et al. (2019). Social Media's Enduring Effect on Adolescent Life Satisfaction. PNAS, 2019, Vol. 116, 10226-10228

25
Pénard et al. (2011): study LU 2008. Does the Internet make People Happier? Journal of Economics, 2013, Vol. 46, 105 – 116. Pierewan & Tampubolon (2014a). Internet Use and Well-Being Before and During the Crisis in Europe. Social Indicators Research, 2014, Vol. 119, 647 – 66. Rae & Longborg (2015). Do Motivations for Using Facebook Moderate the Association between Facebook Use and Psychologica Well-Being. Frontiers in Psychology, 2015, online, 1 - 9 Reinecke, & Trepte (2014). Authenticity and Well-being on Social Network Sites: A Two-Wave Longitudinal Study on the Effects of Online Authenticity and the Positivity Bias in SNS Communication. Computers in Human Behavior, 2014, Vol. 30, 95 - 102 Robinson & Martin (2008), What Do Happy People Do? Social Indicators Research, 2008, Vol. 89, 565 – 571. Rotondi (2016). Connecting Alone: Smartphone Use, Quality of Social Interactions and Well-Being. Working Paper: Politecno di Milano and University of Milan Bicocca, Department of Management, Economics and Industrial Engineering (DIG), 2016, Italy Sabatini (2008). Can a Click buy a Little Happiness? The Impact of Business-to-Consumer E-Commerce on Subjective Well-Being. MPRA Paper no. 32393, 2011, München, Germany Senol-Durak & Durak (2010). The Mediator Roles of Life Satisfaction and Self-Esteem between the Affective Components of Psychological Well-Being and the Cognitive Symptoms of Problematic Internet Use. Social Indicators Research, 2011, Vol. 103, 23 - 32 Shu & Zhu (2006. The Quality of Life in China. Social Indicators Research, 2009, Vol. 92, 191 - 225 Steyaert (2009). De Invloed van Online en Ofline Sociale Relaties op ons Leefritme en Geluk. ( The Impact of Online and Offline Social Relations on Liferhythm and Happiness.). Leefritme Kennis Centrum, 2009, Netherlands Tambyay et al. (2009). The Quality of Life in Singapore. Social Indicators Research, 2009, Vol. 92, 337 – 376 Veenhoven, R. (1984). Conditions of happiness. Reidel (now Springer), Dordrecht, Netherlands. Veenhoven, R. (2000). The four qualities of life. Ordering concepts and measures of the good life. Journal of Happiness Studies, 1: 1-39 Veenhoven, R. (2008). Healthy happiness: Effects of happiness on physical health and the consequences for preventive health care. Journal of Happiness Studies, 9: 449-464

26
Veenhoven, R. (2017). Co-development of Happiness Research: Addition to “Fifty Years After the Social Indicator Movement. Social Indicators Research, 135: 1001-1007 Veenhoven, R. (2019a) World Database of Happiness: Archive of research findings on subjective enjoyment of life. Erasmus University Rotterdam, The Netherlands Veenhoven, R. (2019b). Measures of Happiness. World Database of Happiness, Erasmus University Rotterdam Veenhoven, R. (2019c). Bibliography of Happiness. World Database of Happiness, Erasmus University Rotterdam Veenhoven, R. (2019d). Correlates of Happiness. World Database of Happiness, Erasmus University Rotterdam Veenhoven, R. (2019e). Findings on Happiness and Nutrition. World Database of Happiness, Erasmus University Rotterdam Veenhoven, R. (2019f). World Database of Happiness: A ‘findings archive’ . Chapter in Handbook of Wellbeing, Happiness and the Environment. Editors: Heinz Welsch, David Maddison and Katrin Rehdanz, Edward Elgar Publishing (forthcoming) Weinstein et al (2014). Behavioral addictions; criteria, evidence and treatment. Chapter 5, Internet Addiction Disorder. Academic press. White et al. (1999). Surfing the Net in Later Life: A Review of the Literature and Pilot Study of Computer Use and Quality of Life. The Journal of Applied Gerontology, 1999, Vol. 18, 358 - 378 Wilczek (2018): study ZZ Europe 2010. Media use and life satisfaction: the moderating role of social events. International Review of Economics, 2018, Vol. 65, 157 – 184 Yoo et al. (2014). Associations between Overuse of the Internet and Mental Health in Adolescents. Nursing and Health Sciences, 2014, Vol. 16, 193 - 200

27
Figure 1
Start page of the World Database of Happiness, showing the structure of this findings
archive

28
Figure 2 Example of an online findings page
Correlational finding on Happiness and Time on Internet. Subject code: I04ab03a
Study Iannotti et al. (2009): study ZZ Developed nations 2008
Title Interrelationships of Adolescent Physical Activity, Screen-based Sedentarry Behaviour and Social and Psychological Health.
Source International Journal of Public Health, 2009, Vol. 54, 191 - 198
DOI DOI:10.1007/s00038-009-5410-z
Public 11, 13 and 15 aged, 41 nations, 2008-2009
Sample Probability cluster sample
Non-Response
Respondents N = 204534
Correlate
Author's label Screen-based media use
Page in Source 191,192,195
Our classification Time on internet, code I04ab03a
Operationalization Self report of hours spend per day on: A: Using a computer during free time (excluding time spent doing homework) B: Watching television (including videos) Computation: average hours per day on A and B
Observed Relation with Happiness
Happiness Measure
Statistics Elaboration/Remarks
C-BW-c-sq-l-10-b r=-.09 p < .0001 North America
C-BW-c-sq-l-10-b r=-.03 p < .01 Western Europe
C-BW-c-sq-l-10-b r= ns Eastern Europe
C-BW-c-sq-l-10-b r=-.09 p < .0001 Northern Europe
C-BW-c-sq-l-10-b r=-.06 p < .0001 Southern Europe
C-BW-c-sq-l-10-b r= p < .0001 North America < Western Europe < Eastern Europe

29
Table 1: Studies in which the relationship between internet use and happiness was examined.
People, Place, Time, N Measure of Internet
Use Measure of Happiness Source6
General public General public, Italy, 2008, N=4130 Online shopping Life satisfaction
Sabatini (2011)
Internet users, Michigan, USA, 2014 N=339 Social Media Use Life satisfaction
Oh et al. (2014)
Visitors of a 'digital society' exhibition, Germany and Austria, 2016, N=4852
Internet addiction Life satisfaction
Lachmann et al. (2016)
20+ aged general pubic, Israel, 2003-2012, N=73523
Internet use Computer use
Life satisfaction
Lissitsa & Chachashvili-Bolotin (2016)
20+ aged, general public, Singapore, 2006, N=1038
Time spend on internet
Happiness
Tambyah et al. (2009)
18+ aged, general public, Italy, 2016, N=144809
Internet use Life satisfaction
Rotondi et al. (2016)
18+ aged, general public, USA, 1972-2006, N=5005
Time spend on internet
Happiness Robinson & Martin (2008)
18+ aged, general public, Luxemburg, 2008, N=1332
Internet use Life satisfaction
Pénard et al. (2011)
18+ aged, general public, 57 nations, 2004-2009 N=53325
Internet use Life satisfaction
Lohmann (2013): study ZZ 2005
18+ aged, general public, EU 27 and Turkey, 2003, N=18600
Internet use Life satisfaction
Böhnke & Kohler (2008)
18+ aged, general public, World, 2005, N=35000
Internet access
Life satisfaction
BCS (2010)
15+ aged general public, EU nations, 2004- 2010, N=150.000
Internet access Internet use
Happiness
Pierewan & Tampubolon (2014a)
General public, aged 15+, The Netherlands, N=1286
Time on internet
Happiness
Steyaert (2009)
6 Links in this column lead to full bibliographical. detail in the list of references, from where another link leads to an online excerpt of this study
30
15+ aged, general public, Europe 2010-2015, N=73860
Internet use Life satisfaction
Wilczek (2018)
15+ aged, general public, 27 EU nations, 2010-2013, N=100.000
Internet use Life satisfaction
Castellacci & Schwabe (2018)
15+ aged, general public, Europe, 2013, N=82.000
Internet access
Life satisfaction
OECD (2019)
12+ aged, general public, The Netherlands, 2005 N=2204
Internet use Computer use
Happiness
Oosterhof (2008)
Social Media Users Facebook users, Ann Arbor, Michigan, followed 14 days, USA, 2013, N=82
Social Media Use Positive and negative affect
Kross et al. (2013)
Social media users,, Germany, followed 6 months, 2010-2011 N=374
Social Media profile Positive and negative affect
Reinecke & Trepte (2014)
Seniors (65+) 65+ aged, 26 European nations, 2010-2011, N=11.000
Internet use
Happiness Life satisfaction
Lelkes (2012)
65+ aged, residents of a retirement community, USA, 1999 N=23
Internet use Computer use
Positive and negative affect
White et al. (1999)
Adults (incl young adults & sometimes incl. adolescents)
15-44 aged, internet users, The Netherlands, 2012-2013, N=1944
Online gaming, Social Media Use
Happiness Arampatzi et al. (2018)
16-60 aged, internet users, China, 2010, N=4686
Time on internet Happiness Life satisfaction
Nie et al. (2015)
Working aged (20-69), China, 2003-2008, N=1798
Internet use Happiness Life satisfaction
Inoguchi & Fujii (2013)
20-69 aged, general public, China, 2006, N=2000
Time on internet
Happiness Life satisfaction
Shu & Zhu (2009): study CN 2006
Young adults
17-36 aged, students, Turkey, 2010, N=521 Attitude towards own internet use
Positive and negative affect
Senol-Durak & Durak (2010)
18+ aged undergraduate students, Facebook users, Seattle, USA, 2014, N=119
Number of Facebook friends
Life satisfaction
Rae & Lonborg (2015)

31
18+ aged, students, Berlin, Germany, N=227 Social Media Use Happiness Life satisfaction
Krasnova et al. (2013)
18-32 aged, students, Zagreb, Croatia, N=500
Frequency of internet use
Happiness Life satisfaction
Brkljacic et al. (2018)
University students, South Korea, 2011, N=217
Social Media Use Positive and negative affect
Lee et al. (2011b)
Adolescents 12-19 aged, middle and high-school students, South Korea, 2011, N=73238
Internet addiction Happiness
Yoo et al. (2014)
11, 13 and 15 aged, 41 nations, 2008-2009, N=204534
Internet use Life satisfaction
Iannotti et al. (2009)
12-15 aged, UK, folowed 7 years 2009-2016 N=1699
Social Media Use Life satisfaction
Orben et al. (2019)
Teenagers, Netherlands, 200?, N=1561 Time on internet
Satisfaction with quality of life Duimel (2007)

32
Table 2
Overview of observed correlation between aspects of internet and happiness
ASPECTS
RESEARCH METHODS
Cross−sectional Longitudinal Experimental
Zero−order
Partial
Zero−order Partial Zero−order Partial
Access to internet
Internet penetration in environment
+ +
Personal access +
Ability to use internet +
Use of internet (vs not) + + + + + + −y−y+y+ +
Time on internet − − − − − − − 0 − −h− − 0 0
− -s+ + + +y+y−y− − −h+/-p+ −h− − −c− −c− +
−h−h+ −p−p+/- −h−h0h+ +h+ +p+
−s+ − −p−
− − −
Usages of internet
Buying +
E-mail +s− −p−
Gaming 0
Information seeking − + −h+/−
Social media − − 0 − − −s+ +
+s− + −c− 0 − − −p+ − − −
Behaviour on internet

33
- Authenticity + + + +
Attitudes to internet
Attitudes to internet as such
Attitudes to own internet behaviour
- Perceived internet addiction
−p− −p−
Attitude to own social network
- Feels connected + +
- Feels envy −
- Trust in social network +
- Perceived support +
Perceived number of close network friends
+
Signs explained on appendix A. Signs link to finding page in World Database of Happiness. Use control+click to view the page.

34
Table 2a
Overview of observed correlation between aspects of internet and happiness per age group
Age group indicated using colors
ASPECTS
RESEARCH METHODS
Cross−sectional Longitudinal Experimental
Zero−order
Partial
Zero−order Partial Zero−order Partial
Access to internet
Internet penetration in environment
+ +
Personal access +
Ability to use internet +
Use of internet (vs not) + + + + + + −y−y+y+ +
Time on internet − − − − − − − 0 − −h− − 0 0
− -s+ + + +y+y−y− − −h+/-p+ −h− − −c− −c− +
−h−h+ −p−p+ −h−h0h+ +h+ +p+ −s+ − −p−
− − −
Usages of internet
Buying +
E-mail +s− −p−
Gaming 0
Information seeking − + −h+
Social media − − 0 − − −s+ +
+s− + −c− 0 − − −p+ − − −
Behaviour on internet
- Authenticity + + + +
Attitudes to internet
Attitudes to internet as such

35
Attitudes to own internet behaviour
- Perceived internet addiction
−p− −p−
Attitude to own social network
- Feels connected + +
- Feels envy −
- Trust in social network +
- Perceived support +
Perceived number of close network friends
+
Colors of signs denote age group measured - General public - Seniors (65+) - Adults - Young adults - Adolescent

36
Table 2b
Overview of observed correlation between aspects of internet and happiness
Happiness variant indicated using colors
ASPECTS
RESEARCH METHODS
Cross−sectional Longitudinal Experimental
Zero−order
Partial
Zero−order Partial Zero−order Partial
Access to internet
Internet penetration in environment
+ +
Personal access +
Ability to use internet +
Use of internet (vs not) + + + + + + −y−y+y+ +
Time on internet − − − − − − − 0 − −h− − 0 0
− -s+ + + +y+y−y− − −h+/-p+ −h− − −c− −c− +
−h−h+ −p−p+/- −h−h0h+ +h+ +p+
−s+ − −p−
− − −
Usages of internet
Buying +
E-mail +s− −p−
Gaming 0
Information seeking − + −h+/−
Social media − − 0 − − −s+ +
+s− + −c− 0 − − −p+ − − −
Behaviour on internet
- Authenticity + + + +

37
Attitudes to internet
Attitudes to internet as such
Attitudes to own internet behaviour
- Perceived internet addiction
−p− −p−
Attitude to own social network
- Feels connected + +
- Feels envy −
- Trust in social network +
- Perceived support +
Perceived number of close network friends
+
Signs explained on appendix A. Signs link to finding page in World Database of Happiness. Use control+click to view the page. Colors of signs denote kind of happiness measured - Overall happiness: life satisfaction - Affective component: hedonic level of affect - Cognitive component: contentment - Mixed measure -
38
Table 3: Ratio of positive and negative correlations observed between happiness and aspects of internet use As observed in 34 empirical studies

39
Appendix
Meaning of signs used in tables
________________________________________________________________________
+ = positive correlation, significant
+ = positive correlation, not significant
0 = direction of correlation not reported and not significant
− = negative correlation, significant
− = negative correlation, not significant
++ = positive correlations with two different measures of happiness
−c+ = positive and negative correlations obtained with different sets of control variables
−s+ = positive and negative correlations obtained with different statistics
−y+ = positive and negative correlations obtained in different years
−p+ = positive and negative correlations obtained in different populations
−h+ = positive and negative correlations obtained in different happiness measures
_____________________________________________________________________