a research report prepared for - the newsmarketdriving instead of flying to your destination shorter...
TRANSCRIPT

May Consumer Spending and SavingA research report prepared for:
May 4, 2011

Research Method� This research was completed online among a random sample of
consumers aged 18+. A total of 2,025 interviews were completed.
� In addition to a general population sample, two sub-groups – Affluents, and Young Professionals were targeted and balanced by the general population.
o n= 517: Affluents – defined as having a minimum annual household income of $100,000
o n= 513: Young Professionals – defined as less than 30 years of
2© echo
o n= 513: Young Professionals – defined as less than 30 years of age, having a college degree, and a minimum annual household income of $50,000
� Interviewing was conducted by Echo Research between April 18- April 21, 2011.
� Overall the results have a margin of error of +/- 2.2 (or 4.3 among Affluents and Young Professionals) percentage points at the 95% level of confidence.

3
SUMMER VACATION PLANS
© echo

Week-Long Travel versus Weekend Getaways
Consumers with summer vacation plans will take an average of 2 or more week-long trips and 3 weekend getaways this year.
Most consumers have plans to go away for one week or longer, but even more have weekend getaway plans (63% vs. 68%). More than one third traveling this summer will be away over a holiday weekend (36%).
• More Young Professionals than Affluents with summer vacation plans are planning to go away for at least one week (78% vs. 69%), and even more have weekend getaway plans (84% vs. 71%).
• The majority of Young Professionals with summer vacation plans will be away over a holiday weekend (56%).
68%
63%
TotalAverage number of trips will take with the family…
4© echo
Q.V5a How many WEEK-LONG TRIPS do you plan on taking, overall, this summer? 1 or more week-long trips
Q.V7a-d And, how many summer WEEKEND-GETAWAYS are you planning for between May and September? Any weekend getaways
BASE: Total with summer vacation plans
Significantly higher than (Affluent/Young Professional) segment at the 95% confidence level
56%
39%
36%
84%
71%
68%
78%
69%
Young Professionals
Affluents
Total
One-week trip
Weekend getaways
Holiday weekends
with the family…• Average of 2 week long and 3
weekend-getaways

Will Consumers Be Taking More, Less, or the Same Number of Summer Trips Versus Last Year?
More than three in four (77%) consumers with summer vacation plans say they are planning more or the same (29% and 47%, respectively) number of trips as last year.
• Many Young Professionals with summer vacation plans will be taking more trips than they did last year (44%).
29%
77%
Total
5© echo
Q.V6 Are you taking more, less, or the same number of trips as you did last summer?Significantly higher than (Affluent/Young Professional) segment at the 95% confidence level
15%
22%
23%
42%
56%
47%
44%
22%
85%
78%
Young Professionals
Affluents
Total
More/Same (Net)
More
Same
Less

Summer Weekend Getaway Plans
About one half of consumers planning summer weekend getaways typically book their trips two to four weekends out (49%).
• More Young Professionals than Affluents say they book their weekend getaway two to four weeks out from the time they would like to go away (62% vs. 50%).
49%
6© echo
Not shown: 2%, overall, not sureQ.V27 How far out do you typically book your summer WEEKEND-GETAWAYS?BASE: Total with summer weekend-getaway plans
Significantly higher than (Affluent/Young Professional) segment at the 95% confidence level
6%
10%
9%
30%
35%
33%
62%
50%
Young Professionals
Affluents
Total
Two to four weeks out
More than one month out
Very last minute: the week of

Summer Vacation Budget
Vacationing consumers plan to spend an average of $1,200 per person, and $300 on their next weekend getaway.
Average spend in 2010, per person
$1,000 $1,200 Per person plan to
7© echo
Note: average spend is rounded to the nearest $100Q.V14 How much per person do you plan to spend on your summer vacation(s), overall, in 2011?Q.V15 And, how much do you expect to spend on your next WEEKEND-GETAWAY, on average?
BASE: Total with summer weekend-getaway plans
$1,000
$1,600
$1,200
$300
$350
$300
$1,900
$1,800
$1,200
Young Professionals
Affluents
TotalPer person plan to spend on summer vacations overall, on average
Expect to spend on on next weekend getaway, on average

Family trip (your immediate family)
Group vacation with friends, i.e., Girlfriend Getaway or "Mancation"
Group vacation with multiple families/extended family
Will be travelling alone
Who will Consumers be Traveling with on their Summer Vacations?
Most consumers with summer vacation plans will be traveling with their family and has increased from 2010 (69% vs. 45%), especially among Affluents (80% vs. 57%).
Group vacations with multiple families/ extended family are down from last year (10% vs. 16%).
• Girlfriend getaways and ‘mancations’ are on the rise compared to 2010 (15% vs. 10%). These types of vacations are most on the rise among Young Professionals (36% vs. 18%).
8
69%
80%
67%
15% 14%
36%
10% 10%18%
12%6%
10%7% 4% 5%
Will be travelling alone
Other
© echo
Not shown: 1%, overall, not applicableQ.V4a Who do you plan on traveling with for your summer vacation(s)?Base = Total with summer vacation plans
45%
TOTAL AFFLUENTSYOUNG
PROFESSIONALS
2010 10% 16% - - 57% 5% 14% - - 44% 18% 16% - -
Significantly higher than (Affluent/Young Professional) segment at the 95% confidence level

Beach/River/Lake
Shopping
Family or school reunions
Learning activities (visits to museums, historical buildings, monuments, etc.)
Top Activities Planned for Summer Vacations
Visiting a beach or lake is the top activity planned for summer weekend getaways (42%), followed by shopping (33%).
More than four in ten (43%) consumers said that getting a good deal on hotels, rental cars, flights, etc. is the most important factor in planning weekend getaways, especially among Young Professionals (54%).
Most Important Factor in Planning a Weekend Getaway
TOTAL AFFLUENTYOUNG
PROFESSIONAL
1 Good deal on hotel, rental car, flight, etc. 43% 43% 54%
2Go where my friends/family/significant
other have decided32% 30% 42%
3 Diversity of activities 31% 38% 45%
9
42%51%
57%
33%37%
42%
23%18% 21%22%
28% 27%22%
16%
31%
22%15%
32%
historical buildings, monuments, etc.)
Water parks
Camping
© echo
Q.V23 What activities do you have planned for your WEEKEND-GETAWAYS this year? Top 6 activities planned are shown aboveQ.V21 You mentioned you are planning (a) WEEKEND-GETAWAY(S) - when evaluating summer weekend getaways, what are the most important factors in choosing your destination(s)? Top 3 factors shown aboveBase = Total with summer weekend getaway plans
TOTAL AFFLUENTSYOUNG
PROFESSIONALS
3 Diversity of activities 31% 38% 45%
Significantly higher than (Affluent/Young Professional) segment at the 95% confidence level

Summer Vacation This Year Versus Last Year
Most consumers among the general population have summer vacation plans and has increased from 2010 (59% vs. 51%), with the majority intending to travel within the U.S. (55% vs. 47%).
Nearly nine in ten Young Professionals have vacation plans this summer (87%, up from 83% last year), versus more than three in four Affuents (76%, up from 73% last summer).
• More than one in four Young Professionals plan to travel outside of the U.S. (26%, up from 22% last year); one in five will travel both within and outside of the U.S. this summer (19%, up from 11% last year).
Two thirds (66%) of couples, overall, have summer vacation plans.
Summer
TOTAL AFFLUENTSYOUNG
PROFESSIONALS
10
55%
9% 5%
70%
18%11%
79%
26%19%
Within the U.S.
Outside of the U.S.
Both Within the U.S.
Outside of the U.S.
Both Within the U.S.
Outside of the U.S.
Both
© echo
Q.V1 Which of the following describes where you plan to travel for your summer vacation? Base: total respondents
Couples: Married or single living with a partnerSignificantly higher than (Affluent/Young Professional) segment at the 95% confidence level
59% vs. 51% in 2010 76% vs. 73% in 2010 87% vs. 83% in 2010
Summer travel plans
2010 47% 69% 75%8% 4% 14% 10% 22% 14%
All couples (66%)

More than one third of consumers are planning to visit a U.S. southern destination (37%), followed by more than one in five who will visit a city/ town in town in the west (23%).
Florida is the leading area, across all U.S. States, where consumers expect to vacation this summer, followed by California.
U.S. Summer Vacation Destinations
TOP U.S. SUMMER
DESTINATIONS IN 2011TOTAL AFFLUENT
YOUNG
PROFESSIONAL
1 Florida, 14% 15% 17%
•South (37%)•West (23%)•Midwest (20%)•Northwest (19%)•U.S. Territory (5%)
TOTAL
11© echo
Q.V2 Which of these destination(s) will you visit on your vacation(s) this summer? (U.S. Destinations only shown above. Base = Total with summer vacation plans
Q.V2a Coded Verbatim response -- U.S. State (Total Mentions)BASE: Total with summer vacation plans to U.S. city/town
2 California 8% 11% 15%
3 New York 6% 7% 6%
4 North Carolina 5% 4% 4%
5 Texas 4% 4% 4%
6 Nevada 4% 7% 5%
7 South Carolina 4% 5% 3%
8 Wisconsin 3% 2% 3%
9 Illinois 3% 4% 3%
10 Massachusetts 3% 4% 3%
•South (37%)•West (27%)•Midwest (19%)•Northwest (24%)•U.S. Territory (6%)
AFFLUENTS
•South (39%)•West (28%)•Midwest (22%)•Northwest (23%)•U.S. Territory (11%)
YOUNG PROFESSIONALS
U.S. Territory: Puerto Rico, USVI, Hawaii, Guam
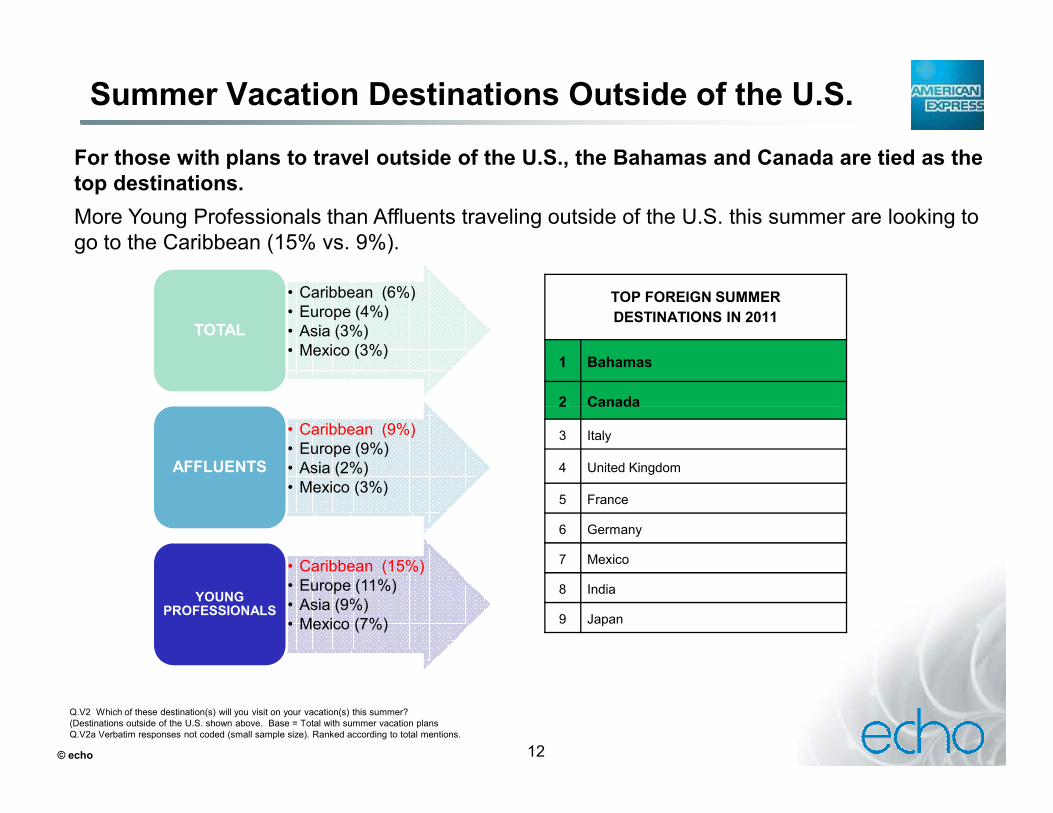
For those with plans to travel outside of the U.S., the Bahamas and Canada are tied as the top destinations.
More Young Professionals than Affluents traveling outside of the U.S. this summer are looking to go to the Caribbean (15% vs. 9%).
Summer Vacation Destinations Outside of the U.S.
TOP FOREIGN SUMMER
DESTINATIONS IN 2011
1 Bahamas
2 Canada
• Caribbean (6%)• Europe (4%)• Asia (3%)• Mexico (3%)
TOTAL
12© echo
Q.V2 Which of these destination(s) will you visit on your vacation(s) this summer? (Destinations outside of the U.S. shown above. Base = Total with summer vacation plansQ.V2a Verbatim responses not coded (small sample size). Ranked according to total mentions.
2 Canada
3 Italy
4 United Kingdom
5 France
6 Germany
7 Mexico
8 India
9 Japan
• Caribbean (9%)• Europe (9%)• Asia (2%)• Mexico (3%)
AFFLUENTS
• Caribbean (15%)• Europe (11%)• Asia (9%)• Mexico (7%)
YOUNG PROFESSIONALS

Driving instead of flying to your destination
Shorter trip/vacation
Staying at a property with a kitchen to enable cooking-in
Dedicating more time to bargain-hunting*
Plan to spend less on activities or excursions
Choosing a cheaper destination**
Strategy to Reduce Summer Vacation Costs
Most consumers with summer vacation plans will strategize to reduce summer vacation costs (88% - up from 80% in 2010).
More than one third will drive instead of fly (38%) or take a shorter trip (34%) in an effort to reduce summer vacation costs – both up from last year (33% and 30%, respectively).
TOTAL AFFLUENTS YOUNG PROFESSIONALS
Impact of the cost of flights and/ or gas in decision to make summer plans…
• Noticed the increase, but save accordingly so that I can travel (38%)
• I will make up for higher costs by saving on other parts of my vacation (25%)
13
38%34%
38%34%
24%
39%
27%31%
28%26% 28%
40%
26% 24%29%
24%19%
34%
© echo
Q.V11 Which of the following describes your strategy to reduce the cost of your summer vacation?Q.V20 How much does the cost of flights and/or gas specifically drive your decisions when making summer plans Base = Total with summer vacation plans
33%2010 30% 18% 24% 27%
Significantly higher than (Affluent/Young Professional) segment at the 95% confidence level
22% 28% 24% 24% 31% 25% 20% 33% 31% 22% 42% 31% 33%
88% vs. 80% in 2010 85% vs. 76% in 2010 93% vs.90% in 2010Any strategy
Top 6 strategies shown above* For deals on air, hotel, etc. in "research" phase**i.e., closer to home: domestic versus international: where the dollar is strongest: etc.)
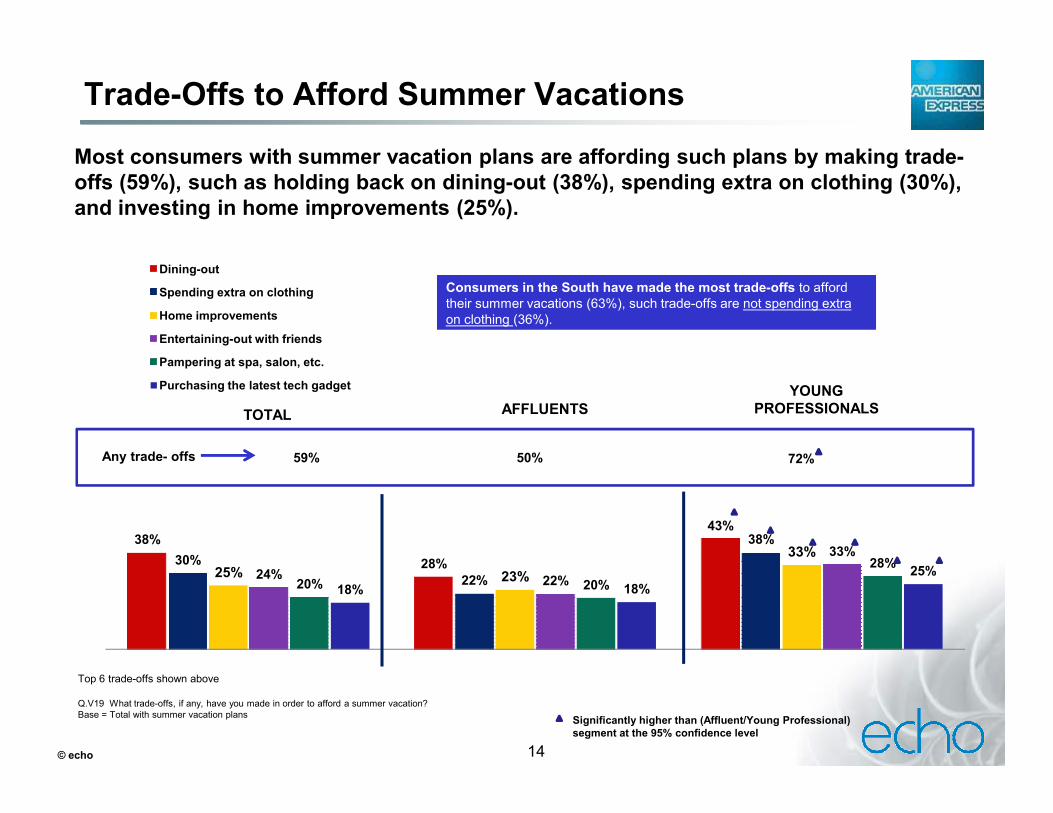
Dining-out
Spending extra on clothing
Home improvements
Entertaining-out with friends
Pampering at spa, salon, etc.
Purchasing the latest tech gadget
Trade-Offs to Afford Summer Vacations
Most consumers with summer vacation plans are affording such plans by making trade-offs (59%), such as holding back on dining-out (38%), spending extra on clothing (30%), and investing in home improvements (25%).
TOTAL AFFLUENTSYOUNG
PROFESSIONALS
Consumers in the South have made the most trade-offs to afford their summer vacations (63%), such trade-offs are not spending extra on clothing (36%).
14
38%
28%
43%
30%
22%
38%
25% 23%
33%
24% 22%
33%
20% 20%
28%
18% 18%
25%
© echo
Top 6 trade-offs shown above
Q.V19 What trade-offs, if any, have you made in order to afford a summer vacation?Base = Total with summer vacation plans
TOTAL AFFLUENTS PROFESSIONALS
Significantly higher than (Affluent/Young Professional) segment at the 95% confidence level
59% 50% 72%Any trade- offs

Transportation Consumers to Get to Summer Vacation Destinations
The majority of consumers with summer vacation plans this year will travel by car (69%), while significantly fewer will travel by air (39%).
And, among consumers with summer vacation plans…
• Most Affluents will travel by car (70% vs. 50% by air),
• But, Young Professionals will similarly travel by car as they will a plane (63% and 60%, respectively).
69%
15© echo
Not shown: 3% not applicable, overallQ.V3 How will you be traveling to your summer vacation destinations?Base = Total with summer vacation plans
Significantly higher than (Affluent/Young Professional) segment at the 95% confidence level
10%
4%
4%
6%
3%
4%
16%
11%
8%
60%
50%
39%
63%
70%
69%
Young Professionals
Affluents
Total
Car
Air
Cruise/Boat
Bus
Train

Online tools, such as travel websites
Recommendations from friends/family
Direct airline, hotel or auto rental hub
Method of Booking Summer Vacation Destinations
Most summer vacation travelers will be utilizing online resources when booking their summer vacation (52%).
• More Young Professionals than Affluents with these plans will seek recommendations from friends/ family in booking summer vacations (46% vs. 27%).
16
52%
65% 70%
31% 27%
46%
22%
39% 36%
8% 9% 13%
Travel agent
© echo
Not shown: 21%, overall, not sure
Q.V10 Which of the following resources will you be using when booking your summer vacations?Base = Total with summer vacation plans
52%
TOTAL AFFLUENTS
YOUNG PROFESSIONALS
2010
Significantly higher than (Affluent/Young Professional) segment at the 95% confidence level
33% 28% 12% 66% 32% 37% 6% 77% 40% 30% 12%

Desired vacation destination
The restaurant/dining-out
Activities/tours/excursions
Souvenirs or other items
A room or flight upgrade
Spa/health & wellness
Most Willing to Spend Money on Summer Vacation
Among the general population with summer vacation plans, most are willing to spend money on their desired destination (49%, up from 36% in 2010), followed by the restaurant/dining-out experience (48%, up from 43% in 2010).
• More Young Professionals than Affluents with summer vacation plans are most willing to spend on activities/ tours/ excursions (51% vs. 35%).
17
49%56% 53%
48%53% 56%
37% 35%
51%
17% 13%18%14% 18% 20%
10% 9%18%
Spa/health & wellness
15%
© echo
Q.V12 Thinking about your summer vacation - which of the following are you MOST willing to spend money on?Base = Total with summer vacation plans
36%
TOTAL AFFLUENTSYOUNG
PROFESSIONALS
2010
Significantly higher than (Affluent/Young Professional) segment at the 95% confidence level
43% 28% 15% 41% 51% 37% 11% 35% 42% 49% 14%14% 18% 15%11% 12%

Friends/family/Spouse
News
Work
Other
Staying Connected on Next Vacation
Most of the general population expects to be completely or sometimes connected on their next vacation (79%), and about nine out of ten of these consumers cite their primary reason is to reach out to friends or family (89%).
• Significantly more Young Professionals than Affluents want to be connected (91% vs. 85%) on their next vacation.
TOTAL AFFLUENTS
YOUNG PROFESSIONALS
“Connected”
18
89% 86% 91%
30%
47%39%
13%27% 31%
4% 7%1%
© echo
* Completely connected or sometimes connected.Q.V37 Thinking about your next vacation and how connected you want to be with everyday life and work - which
of the following describes your expectations? Base: Total respondentsQ.V38 You mentioned you want to be connected (ie, access to the internet, social media, phone service, etc.) -Who do you plan on connecting with on your next vacation?BASE: Total who want to be connected on their next vacation
Significantly higher than (Affluent/Young Professional) segment at the 95% confidence level
89%2010 31% 14% 92% 41% 28% 93% 38% 28%6% 5% 1%
“Connected” on Next Vacation
79% vs. 77% in 2010 85% vs. 83% in 2010 91% vs.90% in 2010

$5 to $10 per day
$10 to $20 per day
More than $30 per day
Not willing to spend an amount/expect it to be free
Willing to Spend to Meet their own Connectivity Expectations on Next VacationAmong the general population who want to be connected on their next vacation, most are not willing to spend an extra fee because they expect the service to be free (72%, up from 65% in 2010).
More than one in ten are willing to spend between $5 and $10 (13%, down from 16% in 2010).
More than one in four (28%) are willing to spend an extra fee to meet their expectations (down from 35% in 2010).
TOTAL AFFLUENTSYOUNG
PROFESSIONALS
19
13% 13%21%
9% 9% 14%6% 4% 6%
72% 74%
58%
© echo
Q.V39 How much extra are you willing to spend to meet your expectations for connectivity on your next vacation?
BASE: Total who want to be connected on their next vacation
TOTAL AFFLUENTS PROFESSIONALS
Significantly higher than (Affluent/Young Professional) segment at the 95% confidence level
16%2010 12% 7% 24% 10% 5% 25% 13% 5%65% 61% 57%
Willing to spend extra 28% vs. 35% in 2010 26% vs. 39% in 2010 42% vs. 43% in 2010

Check personal email
Check work email
Use Internet sites to find trip-related information*
Online banking
Check/Update social media profiles
Online Activities Likely Planned on Next Vacation
Top online activities while on vacation include – reading personal email (72%), utilize internet sites to find trip-related information (49%), and online banking (41%).
Among those wanting to be connected on vacation – fewer consumers desire to read personal email on their next vacation (72% vs. 77% in 2010), but more want to be connecting to find trip-related info (49% vs. 38% in 2010) and partake in online banking (41% vs. 37% in 2010).
Among those wanting to check their personal and/or work email on their next vacation…
• 67% will check personal email daily or more often (on par with 2010)• 68% will check work email daily or more (up from 58% in 2010)
20
72%82% 76%
17%
33% 33%
49%61% 65%
41% 45%55%
27% 31%
53%
25%36% 30%
Check/Update social media profiles
Stay abreast of news/pop culture**
© echo
Not shown: 1%, overall, otherQ.V40 Which of the following online activities will you likely plan for on your vacation?BASE: Total who want to be connected on their next vacationQ.V41a How often do expect to check your email while on vacation?BASE: Total who want to be connected on their next vacation and will check their Work emailQ.V41b How often do expect to check your email while on vacation? BASE: Total who want to be connected on their next vacation and will check their Personal email
TOTAL AFFLUENTSYOUNG
PROFESSIONALS
Significantly higher than (Affluent/Young Professional) segment at the 95% confidence level
77%2010 18% 38% 37% 20% 25% 82% 33% 53% 45% 31% 41% 80% 35% 60% 57% 48% 31%
* Use Internet sites to find trip-related information, recommendations/deals for restaurants/activities, directions, etc.** Stay abreast of news/pop culture (via news websites/blogs, etc.)