a report on housing choice voucher program participants in
TRANSCRIPT

A Report on Housing Choice Voucher Program Participants in Nassau County, NY: Findings from the Communities and Health Survey*
By: Johanna Shih, PhD Marc Silver, PhD
Charisse Wheby, MA Department of Sociology
Hofstra University
For ERASE RACISM, Long Island, NY
Elaine Gross, President
*This survey was conducted in cooperation with the Nassau County Office of Housing & Homeless Services. We would like to thank Director Connie Lassandro for her invaluable help. *We would also like to thank Eric Lopez for his assistance in preparing the data and in translating the Spanish version of the survey.

Executive Summary
In November 2009, ERASE Racism and its partners at Hofstra University, and in
cooperation with the Nassau County Office of Housing & Homeless Services, initiated an
effort to study various aspects of the quality of life of participants in the Housing Choice
Voucher Program (Section 8) in Nassau County, New York. The exploratory
investigation sought to ascertain participants’ self-reported basic demographic
information about the respondent and their family, including respondents’ health statuses,
medical care, and their perceptions about the characteristics of their neighborhoods.1 The
study also sought to identify whether disparities existed among respondents on these
factors on the basis of either racial/ethnic differences or with respect to the fact that they
may live in different communities. A self-administered questionnaire comprised of 41
primarily close-ended items was mailed to all Section 8 program participants in Nassau
County (3,017). The questionnaire was completed by the head of households. Only a
single wave of mailed surveys was attempted. The resulting response rate, 13% (n=393)
was in line with expectations for this target population and with a single outreach
attempt, but less than ideal for a research effort of this type. In general, response rates of
at least 70% are considered ‘excellent’ and rates around 50% ‘good’. In the present case,
based on a comparison with the program population in Nassau County, it was deemed
adequate for an exploratory analysis. As noted in more detail in the body of the report,
1 When possible, these questions mirrored that of the 2006 Nassau County Behavioral Risk Factor Survey (administered by the Nassau County Department of Health), the Long Island Health Care Survey (administered by Adelphi University), and the survey instruments from the Project on Human Development in Chicago Neighborhoods (Principal Investigator Robert Sampson).

there is a basis for viewing the sample of respondents as generally representative of the
population of Section 8 recipients. However, any conclusions drawn from the study that
generalize to the total population of Nassau County Section 8 participants must be
viewed with caution. The Housing Choice Voucher program (Section 8) is one of the
primary initiatives sponsored by the U.S. Department of Housing and Urban
Development to enable low-income individuals and families to have a greater choice of
safe, affordable rental housing. Every state has a Section 8 program which is locally
administered (see hud.gov for more program information). Families who meet the income
criteria2 are either given a voucher (“housing choice voucher”) that subsidizes rent in
privately owned rental housing of their choice, or are given “project based vouchers” that
are linked to specific housing approved by HUD (although this option cannot exceed
20% of voucher assistance). Currently, Nassau County distributes over $25 million in
annual rent subsidies under this program. While the purpose of the voucher program is to
move families in poverty to safer housing and neighborhoods, participants are often faced
with resistance from residents or discriminatory landlords, and may also be reluctant to
move out of familiar neighborhoods where their social networks already exist (Goering
and Feins, 2003).
This study investigates where Nassau County Section 8 program participants live,
what participants’ perceptions of their communities are, and what the potential effects of
these communities to individuals’ and families’ outcomes are. These are questions of
significant import because a large body of research has emerged in the past two decades
2 Household income cannot exceed 50% of the area’s median income, although 75% of participants must not exceed 30% of the area’s median income. Participants are given a voucher that helps offset rent; in general, the participant pays 30% of their income to rent, the amount that exceeds this is paid for by the voucher. The contract rent cannot exceed what HUD determines as the “fair market” rent for the area.

documenting how neighborhoods affect the life trajectories of their residents. The
primary focus of this body of research has been on the disadvantageous effects of living
in poor and racially segregated3 neighborhoods; neighborhoods which face what has
been described as an ecological concentration of disadvantage (high poverty and
unemployment rates, high rates of crime, a lack of neighborhood resources, high
percentages of single parent households, high residential turnover etc). Thus, it is not
simply that racial and class residential segregation persist, but that these segregated
neighborhoods are associated with a host of social problems. While this research has
focused almost exclusively on urban areas, our study investigates the suburban context of
Nassau County and thus represents an important contribution to this literature. It is of
particular interest given the history of discriminatory housing practices and subsequent
racial residential segregation in Long Island.
The primary highlights of our study include:
1. The majority of our sample were generally in good health, as were their children,
and had health insurance coverage and access to a family doctor. However, the
average body mass index of respondents was quite overweight, and 39% of the
sample were obese (in comparison to about one third of adults in the United States
overall (see cdc.gov for more national statistics)). These results are commensurate
with the findings of national studies that documented that poorer adults are more
likely to be obese (Chou et al. 2004).
3 By definition, the term segregation implies that members of both majority and minority groups live in relatively homogenous settings. However, in keeping with standard usage, in this report we employ the term to signify the imposed constraints placed on members of certain minority groups that isolate them from the communities and places readily accessible by members of the majority group.

2. Most respondents were satisfied in general with their housing and their
neighborhood. However, among our respondents, program participants were
clustered in a relatively small proportion of towns/villages in Nassau County.
3. White respondents tend to live in different communities than Latino or African
American respondents, suggesting social processes of ethnic and racial residential
segregation. In general, Black and Latino respondents tend to live in communities
with a majority of minority residents, while White respondents tend to live
communities with a majority of White residents.
4. To assess differences in the quality of life in these neighborhoods, we created an
additive scale based on both global and specific indicators (presence of litter,
graffiti, public drinking, abandoned structures, availability of recreational spaces,
park maintenance, loitering, lack of policing, drugs, and violence). Our analysis
indicates that Black, non-Latino respondents rated their communities as
significantly less positive than either White or Latino respondents.
5. We calculated the percent poverty of respondents’ neighborhoods, and found that
African Americans, and to a lesser extent, Latinos, are significantly more likely to
live in areas that have higher concentrations of poverty.
6. Reflecting the intersection between race, community, and cumulative
disadvantage, we similarly found community differences in quality of life scores
and percent poverty that followed the pattern of racial and ethnic segregation.
7. Among the survey respondents, whites were far more likely to be older and in
poorer health/disabled; suggesting that the pathways to Section 8 differed by race,

and that African American, Latino and white respondents were not comparable
populations.
8. A regression predicting reported health identified two individual level
characteristics (age and BMI) and one community level characteristic (percent
poverty) as significant predictors of poorer health. (Note: African Americans and
Latinos, and those living in poorer neighborhoods were significantly more likely
to have higher BMIs, although they were not more likely to report having no
access to supermarkets or greater access to fast food)
9. Finally, we supplement this report with qualitative data that suggest how
community quality of life issues can be linked to overall heath.

Background Literature:
Neighborhoods Matter:
There is a sizable sociological body of research that documents the ecological
concentration of disadvantage. This research was spurred in large part by William J.
Wilson’s (1987) landmark study The Truly Disadvantaged, which focused on social
dislocations in urban centers that arose from the historical and structural legacies of
racism. Wilson’s work, coupled with Massey and Denton’s (1993) study, American
Apartheid, pinpointed the singular disadvantages faced by residents of very poor and
segregated neighborhoods. A subsequent proliferation of quantitative studies have
confirmed that living in very poor and segregated neighborhoods is correlated with a
range of negative outcomes such as high unemployment, poor working conditions, high
rates of crime, high residential turnover, and lower educational attainment. Perhaps more
surprisingly, neighborhoods also affect mental and physical health issues such as
depression, low infant birth weight, high infant mortality, cognitive development in
children, rates of diabetes, high blood pressure, heart disease, asthma, cancer and
HIV/AIDS and mortality rates (Brooks-Gunn, Duncan and Aber, 1997; Horowitz 2003;
Krieger et al. 2005, 2006; Picket and Pearl, 2001; Subramanian et al 2005; Williams and
Jackson 2005; Williams 2003; Institute of Medicine, 2002, Lee, 2002, LeClere, 1997,
Diez Roux et al 1997, Balfour and Kaplan, 2002; Sampson et al 2002; Robert 1999). It is
important to note that these negative outcomes remain, even after compositional effects
(individual characteristics such as age, weight, and economic status) are taken into

account, which clearly point to the independent effect of neighborhoods. Furthermore,
two important experimental studies, the Gautreaux study in Chicago and HUD’s Moving
to Opportunity studies (in Boston, Baltimore, New York City, Chicago and Los Angeles),
showed that moving families to areas of less concentrated poverty and greater racial
integration was associated with a range of positive educational, behavioral and
employment outcomes (Goering and Feins, 2003).
But Why do They Matter? Possible Mechanisms of Neighborhood Disadvantage
Of course knowing that a relationship exists does not explain why it exists. Two
possible types of explanations have been pursued. One model focuses on the quality,
quantity and variety of institutional/community resources available to its residents. This
model views communities as “built environments” with different characteristics. For
example, studies have showed that African American, Latino, and/or low income
neighborhoods have the greatest density of tobacco retail outlets (Schneider et al, 2005),
alcohol (Ashe, 2003), and fast food restaurants (Austin, 2005; Block, 2004) and a lack of
healthy food options (Lewis, 2005; Kolodinsky and Cranwell 2000, Horowitz et al 2004,
Fisher and Strogatz 1999, Morland et al 2002), including items as simple as low fat milk
(Santora, 2006). Availability has an effect on consumption. For example, African
Americans’ consumption of fruit and vegetables increases by 32% for each additional
supermarket in the census tract (Morland, Wing and Diez Roux 2002), and cost has been
shown as a major factor in residents’ dietary selections (Hunt, 1998, Glanz et al, 1998,
Horowitz et al 2003) Minority or low income communities also have less opportunities
for physical activity and face greater threats to safety (Morenoff et al , 2006).

One can also analyze community characteristics by documenting the social and
physical signs of neighborhood disorder in neighborhoods. Differences in neighborhood
“disorder”, such as the presence of graffiti, litter, public drinking, abandoned buildings,
people selling or using drugs, contribute to an environment that is more conducive to
more serious crimes. Perceptions of disorder contribute to residents’ fear of crime
(Perkins and Taylor, 1996), a key environmental stressor which has been linked to greater
incidences of mental and physical distress in adults as well as high-risk adolescent
behaviors (Sampson et al 2002).
A second line of research has focused on the types and efficacy of social networks
in a community. One version of this argument, sometimes called the “contagion effect”
emphasizes how emergent neighborhood specific values and norms are disseminated and
enforced through peer groups, role models, and social networks (Brooks-Gunn et al.,
2002). Others have moved away from a focus on the norms or values embedded within
networks, highlighting instead the collective efficacy of networks in working towards an
understood good. For example, immigration scholars have analyzed the benefits of social
networks in immigrant enclaves that enable even poor or less educated immigrants to get
a job, or to borrow enough capital for entrepreneurial endeavors. Similarly, scholars have
shown how social ties can exert social control via intergenerational closure and reciprocal
exchange to lessen crime and malfeasance in neighborhoods (Sampson et al 2002). The
opposite scenario, the absence of efficacious ties, is elucidated by the “broken windows”
theory which suggests that small public incivilities reflect the absence of strong
neighborhood social networks that would work to discourage these signs of physical and
social disorder, signs which make the neighborhood more vulnerable to predators.

What is known about Long Islanders’ Health?
As previously noted, given the urban focus of contemporary research, few studies
in this field have focused on the suburban context. Given that one of this report’s areas of
interest is in racial and ethnic differences in health, we describe here three surveys that
have generated quantitative data that presents an overall picture of the health of Long
Island adults, and their access to quality health care. The most comprehensive data come
from the 2006 Nassau County Behavior Risk Factor Surveillance System Survey
(BRFSS, commissioned by the Nassau Department of Health and sponsored by the CDC)
of 4,623 adults in Nassau County. These data found racial, ethnic and class differences in
health and access to healthcare. For example, they found that the poor were more likely
to be uninsured, that whites were more likely to have had a cancer screening than other
groups, that whites were less likely than African Americans to be obese and more likely
to eat 5 or more fruits and vegetables a day, that Hispanics were more likely to have
diabetes than other groups and that African Americans were more likely to have asthma.
A second source of important quantitative data about the health of Long Islanders
is the 2007 Vital Signs: Long Island survey. This was a telephone survey (random
sample, n=1,561) completed in 2007 by Adelphi University of adults in Nassau and
Suffolk counties. Overall, 13% reported poor or fair health; importantly, reported rates of
poor or fair health were higher among Hispanics and blacks, among low income
respondents, and among less educated respondents. In contrast, whites were more likely
to report excellent or very good health. This mirrors the broad consensus of health
disparities between races and socioeconomic classes. In terms of access to good quality

medical care, whites were also more likely than the other groups to have a regular
medical provider, to have insurance, and to use a doctor’s office as the usual source of
care. Finally, a supplementary source of data come from the Long Island Health Access
Monitoring Project which targeted poorer areas in Long Island and found that half of the
adults in their study sample (non-random) did not have health insurance in comparison to
one sixth of adults nationwide (2002).
Thus, both nationwide and within Long Island, quantitative studies have
documented a robust association between race, class, and health inequalities. While
geographically specific data are sparse in Long Island, the 2006 Nassau County Behavior
Risk Factor Surveillance System Survey referred to above was able to offer some
geographically based analysis by dividing Nassau County into 9 study regions and towns:
three of these regions, Freeport and Roosevelt, Hempstead Village and Uniondale, and
Westbury/New Cassel, are “minority majority” regions and are of particular interest here.
This geographic analysis indicated that while Nassau County residents in general
were less likely to report poor or fair health, or report being uninsured in comparison to
residents of New York State, those living in Freeport/Uniondale, and Hempstead
Village/Roosevelt were more likely to report poor or fair health those living in
Freeport/Uniondale, and Hempstead Village/Roosevelt and Westbury/New Cassel were
more likely to report being uninsured in comparison to Nassau County overall. Similarly,
while Hempstead Village/Uniondale had the second highest rates of diabetes, it scored
very low on measures of quality of care of diabetes, and lower levels of screening for
high cholesterol. Geographic differences were found in terms of behavioral risk
characteristics as well. For example, those in Hempstead Village/Uniondale were found

to be less likely to consume 5 or more servings of fruits and vegetables per day than those
in North Hempstead, Nassau County, and NY State.
Data and Methods:
We developed a survey instrument to determine the quality of health, housing,
neighborhoods and medical care/ access of Section 8 recipients in Nassau County. The
instrument consisted of questions that created variables pertaining to the quality of
overall health, the quality of the health of the respondent’s children (if applicable), access
to health care, access to safe recreational spaces, access to transportation and healthy
food grocers. The health variable was self- reported and measured on a five- point scale
from 1= very poor to 5= excellent. In addition, respondents specified whether they suffer
from several specific conditions (e.g., diabetes, asthma, high blood pressure). The
condition-specific and global self-report items were combined into a single measure of
respondent health. Health was also determined by Body Mass Index (BMI); respondents
were asked to provide height and weight which was subsequently calculated using the
Department of Health and Human Services, National Institutes of Health Body Mass
Index Calculator.4 A copy of the survey instrument appears in Appendix A.
Surveys were sent to all section 8 recipients in Nassau County (N= 3,017).
Completed surveys were received from 392 respondents (a 13% response rate). In
addition, 215 surveys were undeliverable (7.1%). No significant pattern in the origins
of the undeliverable surveys was detected. It was thus concluded that there was little if
any influence of this on the analysis of the data.
4 Department of Health and Human Services, National Institutes of Health. http://www.nhlbisupport.com/bmi/

The resultant sample of respondents is generally representative of the total
section 8 population in Nassau with respect to age, race, and gender based on the Nassau
County Tenant Statistical Report (July 2009). However, it was determined that there also
existed evidence of a lack of representativeness with respect to residential location. For
example, there was a significant underrepresentation from Hempstead; according to the
2008 Nassau County OHIA5 Tenant Distribution by Location report, slightly over 29% of
section 8 recipients reside in Hempstead whereas the present sample only provided about
1%. There were overrepresentations of respondents in Westbury and Inwood. Section 8
recipients in Westbury consist of 3% of the population whereas respondents made up 7%
of the sample. Section 8 recipients in Inwood consist of approximately 6% of the
population but make up over 13% of the sample. The remaining hamlets/ villages/towns
in the sample are generally similar to the percentages in the population of Nassau County
section 8 participants.
The sample of returned surveys makes an exploratory study of this type possible.
However, it should be noted that the sample may not be truly representative of the total
population. Thus, conclusions that are couched in terms of the general population of
Nassau County section 8 participants should be viewed with a measure of caution.
Results:
The mean age of the respondents was 52.6 years (median = 49). Ages ranged
from 21 years of age for the youngest respondent to 96 years of age for the oldest
respondent. About 26% of the sample are 65 years or older. About 12% are 35 years or
younger. Thus, the majority (about 62%) fall within the 36 – 64 age range. 5 Office of Housing and Intergovernmental Affairs

The vast majority (86%) of the sample were female. The Racial/Ethnic
breakdown is reported in Table 1.1. As a result of the relatively small number of
respondents identifying themselves as Asian/Pacific Islander, Native American, or Multi-
racial, the race variable was collapsed into four categories: Latino, Black (non-Latino),
and White (non- Latino), and Other.
Table 1.1 Racial/Ethnic Demographics
RACE
Black White Latino Other
Sample 54% 24% 17% 5%
With respect to household composition, the majority of those reporting this information
are single-adult households (58%). Two-adult households comprise about 26% of the
sample. The remainder are multi-adult households. 44% of households have no children.
56% of respondents report there being at least one child in the household. 34% of
households have more than one child.
Health
The overall health of the sample was fairly good. Almost half, 49%, of the sample report
themselves to be in either “good” (39%) or “excellent” health (10%). At the other end of
the spectrum, 6% report being in ‘very poor’ health and 13% report being in “poor”
health.

Table 2.1 Health Perception
OVERALL HEALTH
Rating Very Poor Poor Fair Good Excellent
Sample
Percentage
6% 12.9% 31.8% 39.4% 9.7%
The overall health of the first child in the household fared better than the head of the
household. Overall, about 83% of respondents with children report their eldest child’s
health to be either (“good” 48%) or “excellent (35%). Less than 3% were in either “poor
“ (1.4%) or “very poor” health (1%).
Table 2.2 Child Health Perception6
OVERALL CHILD HEALTH
Rating Very Poor Poor Fair Good Excellent
Sample
Percentage
0.9% 1.4% 15% 48.1% 34.6%
With respect to healthcare insurance, the vast majority (92%) of respondents report
having some form of coverage. In line with that finding, 79% report seeing either a
designated family physician or receive medical treatment at a clinic. 39% of the sample
reported having a disability.
6 Reported health status for one child, not overall status of all children if household has more than child
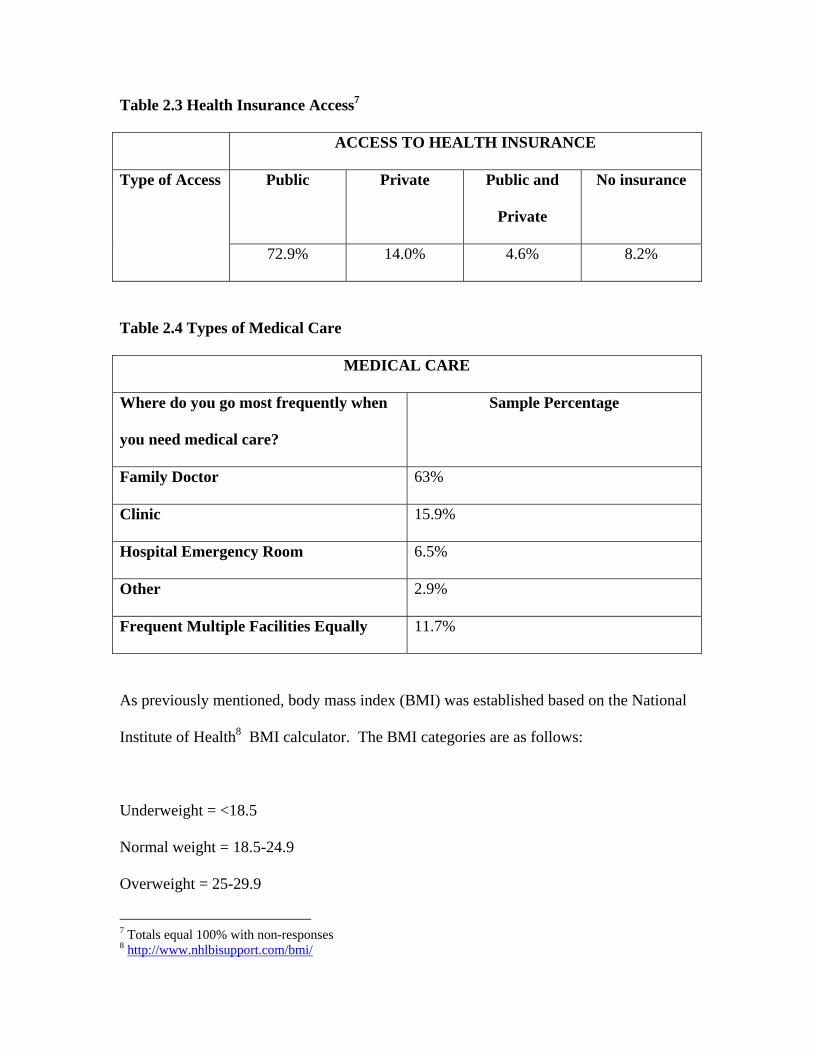
Table 2.3 Health Insurance Access7
ACCESS TO HEALTH INSURANCE
Public Private Public and
Private
No insurance Type of Access
72.9% 14.0% 4.6% 8.2%
Table 2.4 Types of Medical Care
MEDICAL CARE
Where do you go most frequently when
you need medical care?
Sample Percentage
Family Doctor 63%
Clinic 15.9%
Hospital Emergency Room 6.5%
Other 2.9%
Frequent Multiple Facilities Equally 11.7%
As previously mentioned, body mass index (BMI) was established based on the National
Institute of Health8 BMI calculator. The BMI categories are as follows:
Underweight = <18.5
Normal weight = 18.5-24.9
Overweight = 25-29.9
7 Totals equal 100% with non-responses 8 http://www.nhlbisupport.com/bmi/

Obese = BMI of 30 or greater
The average BMI of this group was 29.34 and the median BMI is 28.25. These measures
suggest that, on average, respondents are overweight and many are obese. In fact, 39%
of the sample have BMIs in the ‘Obese’ category. The maximum BMI of the group is
64.4 and the minimum is 16.3. Nationwide, the average BMI of U.S. adults is slightly
less than 28 for men, and slightly over 28 for women, and approximately one third of
U.S. adults are obese (see cdc.gov). Thus, our sample is heavier than the national
population, which is commensurate with other studies’ findings on the negative
relationship between class and weight (Chou et al, 2004).
Table 2.5 Body Mass Index
BODY MAS INDEX
Minimum Maximum Mean/Median
16.3 64.4 29.34/28.25
Housing and Neighborhoods
The respondents were generally satisfied with the quality of their housing and
neighborhoods. As indicated in Tables 3.1 and 3.2, less than 13% experienced any
dissatisfaction with their neighborhoods and only 15% of participants experienced
dissatisfaction with their housing.

Table 3.1 Housing Satisfaction
HOUSING QUALITY Level of
Satisfaction Very
Dissatisfied Dissatisfied Neutral Satisfied Very Satisfied
Sample Percentage
6.7% 7.3% 14.8% 38.2% 33.1%
Table 3.2 Neighborhood Satisfaction NEIGHBORHOOD QUALITY
Level of Satisfaction
Very Dissatisfied
Dissatisfied Neutral Satisfied Very Satisfied
Sample Percentage
5.6% 7.0% 19.3% 36.7% 31.4%
Exploring Racial/Ethnic Differences Among Section 8 Recipients
The above analysis offers a perspective on the overall circumstances faced by the
Section 8 recipients in our sample, and of their subjective responses to those conditions.
However, it is also necessary to explore the extent to which respondents are generally
similar or different in their respective situations. As noted in the introduction, prior
research has identified the important impact of community or neighborhood
characteristics on the health and well-being of residents. In addition, previous research
on Long Island has noted health differences across racial and ethnic groups. Finally, the
historical pattern of racial and economic segregation on Long Island suggests that there
may be an intersection of the impacts of these two sets of factors. Given the historical
significance of segregation in the establishment and growth of Long Island communities,
as well as the continuing impact of structural and institutional racism, it is likely that the
residential experiences of Section 8 recipients differ across racial and ethnic lines.

It is evident that Section 8 tenants are not equally divided among all Nassau
County communities. According to the Housing and Homeless Services report in 2008,
Nassau Section 8 tenants were located in a total of 74 communities. However, more than
90% of tenants resided in only 14 communities.
Table 4.1: Distribution of Section 8 tenants across Nassau County towns/cities
Town/City
#
Residents % Residents Cumul. %
Hempstead 1137 29 29
Freeport 404 12 41
Roosevelt 284 7 49
Rockville Center 276 7 56
Lynbrook 247 6 62
Inwood 239 6 68
Uniondale 154 5 73
Westbury 129 3 76
Long Beach 118 3 79
Elmont 95 2 82
Valley Stream-11580 94 2 84
Baldwin 81 2 86
Glen Cove 63 2 88
West Hempstead 64 2 90

Similarly, for the sample of tenants used in our study, only 13 communities housed 86%
of respondents.
Table 4.2: Distribution of sample Section 8 tenants across Nassau County
towns/cities
Town/City # Residents Cumul. %
Inwood 51 13%
Freeport 45 25%
Rockville Centre 45 37%
Lynbrook 43 48%
Roosevelt 31 56%
Westbury 27 63%
Long Beach 18 68%
Glen Cove 14 72%
Valley Stream 14 75%
Baldwin 11 78%
Farmingdale 11 81%
Mineola 10 84%
Port Washington 10 86%
Other 53 100%
This pattern suggests that a range of factors contribute to a tenant/community selection
process where some communities are more likely than others to house Section 8 tenants.
While it is beyond the scope of this report to examine the specific mechanisms by which

this result occurs, this process, as reflected in our survey results, leads to distinctive
patterns across the racial/ethnic divide.
Specifically, our results suggest that White Section 8 tenants tend to reside in
different communities than Black and Latino tenants. This is indicated in the following
table. As can be seen in the table, while there is some overlap with respect to the place of
residence across the groupings, by and large, the pattern shows a degree of segregation.
Latinos are predominatly to be found in Freeport, Rockville Centre, and Lynbrook
(43.1% of all Latino respondents). Black tenants are most likely to be found in Inwood,
Rockville Centre, Freeport, Roosevelt, and Westbury (73% of all Black tenants). In
contrast, 52.7% of White tenants are mostly to be found either in in Lynbrook (32.3%), or
in towns with very few other respondents (20.4%). Further consideration of the above
tables suggest that the survey results may actually under-estimate the extent of residential
segregation among Section 8 tenants given that the Office of Housing and Homeless
Services’ report indicates that about 56% of tenants resided in only four communities in
2008 (Hempstead (29%), Freeport (12%), and Roosevelt (7%), and Rockville Centre
(7%)), three of which have large Black and Latino populations.
This pattern clearly suggests the presence of social processes that lead to racial
and ethnic segregation among Section 8 tenants. Furthermore, the data suggest that this
pattern of segregation yields differential quality of life experiences for Section 8 tenants.
Several items in the survey queried respondents about conditions in their neighborhood
bearing on quality of life. Respondents were asked two global items assessing their
degree of satisfaction with their housing and with their neighborhood. In addition, eleven
other items asked the extent to which they found specific aspects of the conditions in the

Table 4.1: Racial and ethnic distribution of sample over Nassau County towns/cities
Latino Black (Not
Latino)
White (Not
Latino)
Other
Inwood 3% 22% 2% 6%
Freeport 22% 13% 5% 0%
Rockville
Centre
11% 15% 8% 6%
Lynbrook 11% 1% 32% 17%
Roosevelt 5% 13% 0% 6%
Westbury 5% 10% 2% 6%
Long Beach 6% 5% 4% 0%
Glen Cove 5% 3% 5% 6%
Valley Stream 9% 2% 5% 0%
Baldwin 2% 3% 3% 11%
Farmingdale 6% 0% 8% 0%
Mineola 5% 2% 3% 0%
Port
Washington
0% 4% 1% 6%
community are a problem (litter, graffiti, public drinking, abandoned structures,
recreational spaces, park maintenance, loitering, lack of policing, drugs, and violence).
In order to assess the perceptions of community quality of life, these 13 items
were combined into a single additive scale in which low values reflect a more positive

perception, and higher values reflected a more negative or problematic perception of
neighborhood conditions. The additive scale has a minimum value of 13 if a respondent
was completely satisfied with housing and neighborhood and saw no problems at all with
any of the specific factors. The maximum value for the scale is 65 if a respondent was
completely dissatisfied with her housing and neighborhood and saw maximal problems
with all 11 specific factors.
The results of our investigation strongly suggest differences in the quality of life
scale across the race line. As the following table shows, Black respondents rated the
circumstances in their communities as less positive than White and Latino respondents.
Table 5.1: Racial and ethnic differences in Community Quality Issues
Race/Ethnicity Mean N
Std.
Deviation
Latino 19.25* 55 8.86
Black (non-
Latino) 23.47 167 9.62
White (non-
Latino) 18.5* 76 7.55
Other 21.25 16 8.38
Total 21.41 314 9.21
*Difference from Black (non-Latino) significant p < ,05

As might be expected, this analysis is commensurate with a comparison across
communities. As the following table indicates, Lynbrook (the sole single community
with a strong presence of white respondents), has a mean score on the Community Issues
scale significantly lower than the mean scores for those communities with high
concentrations of Black and Latino Section 8 Tenants. Given that the scale’s starting
point is 13, the Lynbrook mean score of 15.37 suggests a strongly positive evaluation on
the part of respondents. In contrast, the other communities in the table, while still on the
positive end of the scale, are all significantly less favorable on factors touching upon the
quality of life in the community.
Table 5.2: Community Quality Issues By Selected Towns/Cities
Town Mean N
Std.
Deviation
Lynbrook 15.37 35 2.78
Freeport 22.18* 40 9.88
Rockville
Centre 21.67** 39 8.49
Inwood 24.95* 37 9.13
Roosevelt 29.56* 25 12.86
Westbury 24.53* 19 12.03
*Difference from Lynbrook significant p < .05
**Difference from Lynbrook significant p < .10

Overall, these data suggest a residential pattern among Section 8 tenants in which Blacks
are much less satisfied with conditions in their communities, and the community with a
predominance of White tenants is rated significantly more positive than those with a
predominance of Black and Latino tenants.
A measure that also reflects community quality of life is its overall poverty rate.
As previously noted, greater concentrations of poverty within a community may be
reflective of poorer general quality of life within the community for a variety of reasons.
Communities with greater concentrations of poor households may receive less attention
from major actors in both the private and public sectors. In addition, as Wilson (1987)
has observed, there is an accumulation of disadvantage as the relative number of the poor
within a community increase. In that regard, the following tables suggest a differential
circumstance running across the racial/ethnicity line.
Table 5.3: Racial and Ethnic Differences in Percent Poverty in Community
Race/Ethnicity Mean N Std.
DeviationLatino 7.09*+ 65 3.72Black (non-Latino) 9.13* 202 4.55
White (non-Latino) 5.36+ 93 2.50
Other 6.45+ 18 4.22Total 7.7238 378 4.27
*Difference from White(non-Latino) significant p < .05 + Difference from Black (non-Latino) significant p < .05 As can be seen in the table Whites tend to live in communities with a much lower
average poverty rate (5.36%) than either Latino (7.09%) or Black (9.13%) Section 8

tenants. In addition, Black tenants live in communities more heavily impacted by the
presence of other poor residents than all the other groups (Latino, White, Other).
Table 5.4: Percent Poverty in Communities
Town Mean N
Lynbrook 4.20 43
Inwood 14.4* 51
Freeport 10.49* 45
Rockville Centre 4.95 45
Roosevelt 14.72* 31
Westbury 3.50 27
Long Beach 9.12* 18
Glen Cove 7.91* 14
Valley Stream 4.67 14
Baldwin 5.40 11
Farmingdale 5.49 11
Mineola 4.14 10
Port Washington 4.64 10
Other 5.05 53
Total 7.77 383
*Difference from Lynbrook and Other significant p < .05
In a similar vein, a comparison across communities shows again that the community
which houses a predominance of White Section 8 tenants, Lynbrook, has a significantly

lower rate of poverty (4.20%) than those communities that provide housing for Black
and Latino tenants. In fact, the communities with higher rates of Black and Latino
residency (Inwood, Freeport, Roosevelt) have an average poverty rate about 3 times that
for Lynbrook. Thus, the social processes that contribute to a pattern of racial and ethnic
segregation also tend to lead to unequal outcomes. Black and Latino tenants are much
more likely to live in communities that house other poor people. White tenants, in
contract, are more likely to reside in communities with much lower poverty rates.
The combination of the differences in quality of community issues and in poverty
rates as noted above is troubling in and of itself. However, it is also possible that such
differential living conditions may be associated with other outcomes, as well. In
particular, as previously mentioned, it is possible that there are health-related correlates
of unequal and segregated residential patterns. Thus, it is also worth exploring the
relations among race, community, and health.
We have already noted that respondents’ self-reported health overall is fairly
good. Only 19% of respondents report themselves to be in “very poor” (6%) or “poor”
(13%) health. Similarly, only .9% of respondents with children report their eldest child’s
health to be “very poor” and 1.4% report their child’s health to be “poor”. In this section
we examine whether there are significant differences among respondents with respect to
their health.
To do that we utilized several items from the survey instrument that queried
respondents about their health. The first, was the global self-assessment noted above. In
addition, respondents were asked if they suffered from any of the following important
health issues: asthma, diabetes, disability, high blood pressure, heart disease, and

depression. For each condition respondents indicated a simple yes or no. We combined
these responses into a single additive scale that ranges from 1 (healthiest) to 11 (least
healthy). The mean response to this scale was 4.33 and the median was 4.00, reflecting a
relatively healthy self-assessment overall.
To determine the factors that associate with respondents’ health, we performed a
regression analysis of the health scale on several predictors with presumed relationship
to health: race, age, BMI, community quality issues, and community poverty rate. Race
was entered as three dummy variables (Latino, Black, Other), with White being the
comparison group. Age was included in the analysis on the presumption that older
people generally have more health issues than younger people. The body-mass index
(BMI), was included on the established link between obesity and other health issues. The
two community level variables were included as a test of the proposition that the quality
of one’s community may have an impact on health. The regression analyses were
performed in a series of steps in order to clarify the relationships among the variables.
The first equation only included the race dummy variables. The second equation added
respondents’ age, the third included BMI, and the fourth stage included community
quality issues and poverty rate in a step-wise procedure. The results of the analysis
appear in the following table.
It can be seen in column 1 that there appears to be little statistical difference
among racial/ethnic groups with respect to health. However, Black tenants are somewhat
more healthy that Whites (p < .05). That Whites report being less healthy than the other
groups is attributable to the fact that they tend to be significantly older, as a group, than
other respondents. The mean age for Whites is 62.61 years, while all other groups were

substantially younger (Latino = 46.7; Black = 50.48; Other = 54.94). This can be seen in
column 2, in which the significant Black-White difference disappears, and Age is the
only variable showing a significant relationship to Health ( B =.25; p < ..001).
Regression Equations: Predicting Reported Health
Column 1
Column 2
Column 3
Column 4
PREDICTORS BETA BETA BETA BETA RACE+ Latino -0.08 0.01 0.01 0Black -.12* -0.03 -0.05 -0.09Other -0.01 0.01 0.02 0.01 AGE ----- .25*** .26*** .26*** BMI ---- ---- .11** .11** POVERTY RATE ---- ---- ---- .10* R SQUARE 0.003 0.06 0.07 0.07 * p < .10 ** p < .01 *** p < .001
The addition of BMI in Column 3 shows the anticipated results. Both Age (B =
.26; p < .001) and BMI (B = .11; p < .05) have significant impact on health and in the
expected directions. Those who are older and those with higher BMIs report worse health
than younger and lighter respondents. These two variables maintain their relative
importance in the last equation, as well.
Column 4 shows the addition of community-level poverty as a significant
predictor of poorer health (B = .10; p < .10). Community Quality Issues did not meet the

statistical criteria for entering the equation as a significant predictor of respondent health.
Thus, the final model includes two individual-level factors as contributing to poor health:
age and BMI. . In addition, however, community povery rate also impacts on individual
health. While the relationship is marginally significant from a statistical perspective, it is
certainly suggestive of an important link between the quality of one’s living environment
and the state of one’s health. These results for Nassau County Section 8 participants are
generally in line with well established research on the individual and community
correlates of individual health (Brooks-Gunn, Duncan and Aber, 1997; Horowitz 2003;
Krieger et al. 2005, 2006; Picket and Pearl, 2001; Subramanian et al 2005; Williams and
Jackson 2005; Williams 2003; Institute of Medicine, 2002; Lee, 2002, LeClere, 1997,
Diez Roux et al 1997, Balfour and Kaplan, 2002; Sampson et al 2002; Robert 1999).
Interviews with Hempstead Residents
We supplement this report with interview data from Hempstead residents in order
to better tease out the relationship between community characteristics and individuals’
health. This relationship is difficult to discern using survey data, which can only give us a
“snap shot” view of what is likely to be a long term process. As others have noted,
quantitative data have so far given us answers to the “what” questions of racial/ethnic and
community differences in health, rather than answers to the “why” questions (Roberts
1999). This impedes policy making because it is difficult to develop and implement
effective strategies without knowing the specific mechanisms that connect community
characteristics with health outcomes. Thus qualitative data represents one important
effort to help open the “black box (Brooks Gunn et al, 2003)” of neighborhood effects,

and allows people who live in disadvantaged communities to elucidate how their
everyday life experiences may shape their individual and family outcomes.
To this end, we include in this report some analysis of interview data from
another on-going study (led by Shih, one of the report authors) of parents in Hempstead
Village, a racially and class segregated are. Hempstead Village is approximately 75% non
white and almost 18% of individuals are under the poverty line (in comparison to 5.2% in
Nassau County overall). Parents were chosen as interview subjects, because they can
speak to their experiences with health and healthy living for both themselves and their
children/families. While these interviews were not with Section 8 residents, we note that
Hempstead is by far the largest receiver of Section 8 vouchers, housing 29% of all
program participants. Given that our interest here is to understand the relationship
between community characteristics and individual outcomes, these interviews are
analytically appropriate.
Of particular relevance were the following three findings:
1) Interviewees define health for themselves and their families in a global or
holistic sense—health or healthy living for them included not just physical
well being, but being happy, safe, secure and economically stable.
2) This definition of health was juxtaposed with interviewees’ reports of a nexus
of social problems facing their families, which include violence, drug and
alcohol abuse. These problems were not solely individual or family problems.
Instead, they were clearly embedded within and reinforced by neighborhood
social networks and characteristics.

3) Parents’ everyday life experiences in this class and racially segregated
neighborhood support a chronic stress model of neighborhood effects, where
the wear and tear of everyday life takes a cumulative toll. Chronic stress is
very clearly linked to adverse health outcomes in quantitative studies.
What is health and health living?
Parents who lived in Hempstead specifically talked about health as connected to broader
quality of life issues, saying that it is “taking care of everything”, it is “to be happy”, to
“be self sufficient”, and to
“being in a two parent household. Being able to interact with other children in the
same age group. Just being able to enjoy the safety and security- you live on your
street, you go to your schools, you know the people that you go to school with,
you know the parents. To me that’s healthy.”
This definition of being healthy stemmed from what interviewees viewed as missing from
or problematic about their current lives and the lives of their children. For everyone we
talked with, these lives included multiple proximate risks which included histories of
community or domestic violence and family experiences with alcohol and drug abuse.
Family problems are community problems:
Importantly, these experiences could not be understood as solely individual or
family problems, instead, they were intertwined with the neighborhood and the social
networks within this neighborhood. As one respondent puts it, it is because “my neighbor

is doing it, and my neighbor’s neighbor is doing it, so I too will do it.” For example, one
father explains that he got into drug dealing as a teenager simply because he saw several
older teenagers in the parks selling drugs, and it became a way to quickly earn money,
while another parent explains that one of the reasons they moved out of the last house
was because “I could walk two houses down and buy crack.” Parents reported
reservations as well about the school environment as well, saying that they could not trust
that their child was safe at school, and that their children were exposed to fighting, to gun
play and to illicit drug use. One parent, for example, said that “My child does not want to
be involved, but now he has to watch his back because he does not want to be involved”.
When asked about after school or weekend activities for kids, respondents also describe a
paucity of services, saying that the “average kid today doesn’t do too many things, in the
community, Hempstead there are no youth centers, and the parks…there are no parks for
kids to go and play.”
Those who lived in the community all their lives compared their perceptions of
the current conditions to what they believed was a safer past. A couple respondents
elaborately detailed the community as they remembered it thirty years ago; noting that
there was a much more vibrant retail center, and perhaps more importantly, recalling
stronger social ties where neighbors collectively monitored each others’ children. As one
person explained, “I knew that if I went around the corner, and I said something wrong, I
knew that the lady around the corner would call my mother and tell her that I had been
disrespectful and said something, and not only would I get a beating around the corner,
I’d get a beating when I got home (laughing).” In contrast, parents said that there was
currently a lack of “respect” in the neighborhood, a collective agreement about moral

codes and values. This lack of agreement seems to contribute to an absence of security,
which is heightened by perceptions of the increasing availability of guns.
Chaotic communities: the collective tolls on individuals
The descriptions of the social problems facing parents in Hempstead fit into
chronic stress model of neighborhoods that links race, class, place and health. This is
evident, for example, in the accounts of one mother who became quite upset during the
interview when she explained that her stepson, who was facing several mental health
issues, said to her that he wanted “peace”, and she felt that it might be “hopeless” because
Hempstead is a “community of chaos”. Echoing this sentiment, another respondent, who
describes himself as a community activist, also expresses a sense of helplessness when he
talks about a Community Empowerment Day he helped to organize, which was a day of
free activities (including free medical care) to Hempstead residents. He said hundreds of
people attended and it was going very well, when suddenly, “We noticed the color
change in the park, from predominantly a white day to a color day, most kids were
wearing red.” When I expressed some confusion about the significance of this, he
explained that it reflected gang related colors, and that despite his efforts, later in the day,
a young man was stabbed 5 times. He says that when he saw the yellow (police) tape go
up, he wondered, “How did this happen, this was an empowerment day, how did it end up
violent? …They had planned it, I found out later. Why? So sometimes it doesn’t appear
that we are making a dent.”
This sense of hopelessness in dealing with multiple issues and a life that is often
chaotic and unpredictable appears to be a theme in respondents’ accounts. It also

resonates with research that has proposed that chronic or everyday stressors are an
integral mechanism that connects individuals’ social status (ie class or race) with negative
health outcomes. This link between everyday stressors and health is perhaps best
expressed by this barbershop owner. Towards the end of the interview, he suddenly
started talking at great length, reiterating his earlier comments that he wants to move. He
says,
“I’m just ready to just, to just live a more quiet laid back life. Hempstead, it’s fast,
the day could go by like (snap) because there is so much going on, and the so
much going on is negative…A lot of people out here are really lost within their
own ways of life…I want to sell our house, pay some bills, and just move and I
could cut hair, and (my wife) could work one job and we could live a nice
peaceful life with our daughter and just, you know relax”.
He explains that his wife just had a stroke, and that she is working 2 jobs now, and that
he is increasingly worried that he might be the accidental victim of violence. He details
another act of violence in his barbershop and how he had difficulty getting his “head”
together afterwards, concluding that while everything turned out ok in the end,
“it’s just, so how many times is this going to happen where someone’s (pause), I
don’t see how much further, at some point there will be someone who won’t
respect that… I’m in the midst of it…yes, how much more can I take?...People are
not happy, schools have closed down, you talk about everything is jammed in and
everyone is fighting to get out and nobody is going nowhere, no one’s going
nowhere. It’s chaos, it’s like do you still want to stay…you think… how long can
I stand here?”
At this juncture of the interview, this parent’s worry and fatigue was clear in not simply
his words but his hunched body language, expressing his feelings of being physically and
mentally worn down by what was happening around him in the neighborhood.
CONCLUSION
Overall, our analyses indicate a disparate set of circumstances among Section 8
tenants in Nassau County based on racial, ethnic, and community differences. They show
that tenants tend to reside in different communities based on race and ethnicity. This
reflects the broader trend of racial/ethnic segregation in Long Island, despite the fact that,
as Section 8 program participants, all respondents regardless of their race or ethnicity,
were poor. Moreover, this pattern of residential segregation seems to be associated with
differences in community-level quality of life issues that adversely affect Black and
Latino tenants relative to Whites. In particular, Black tenants appear to live in
communities with less favorable conditions bearing on quality of life (e.g., safety, police
presence, cleanliness) as compared to White and Latino tenants. In contrast, the
community in which the largest single segment of White tenants reside in our study
(Lynbrook) was rated as significantly more favorable on the quality of life scale than
those communities housing more Black and Latino tenants. In addition, there appears to
be an economic segregation effect, as well. Blacks and Latinos are more likely to reside
in communities more heavily impacted by economic poverty than are Whites.

Finally, we have reported an indication that such residential segregation may have
an adverse impact on respondents’ reported health. Our statistical analysis points to the
impact that age and obesity have on individual health. As expected, older and those who
are heavier relative to their body type (i.e., higher BMIs) report being in worse health
than younger and less weighty respondents. However, we also found that, other factors
being equal, those residing in communities with higher rates of poverty tend to report
being in worse health than those living in less impacted communities. This finding is
supported by supplemental interview data, which indicate that the daily experiences of
living in a class and racially segregated neighborhood takes a cumulative stress toll on
Hempstead Village parents. This important ecological impact on respondents’ health
points to the need to further investigate the processes through which tenants find housing
in different communities, as well as the need for greater efforts to promote inclusionary
policies with respect to rental housing.
The finding that African Americans, and to a lesser extent Latinos are more likely
to live in poor and racially segregated neighborhoods and experience a poorer quality of
life within these neighborhoods than white Section 8 recipients has a clear policy
implication. While we cannot speak to the social mechanisms that led to this outcome, the
evident solution is to develop processes that increase the likelihood that participants will
find housing in neighborhoods with less poverty and greater racial/ethnic integration. One
of the limitations of the voucher approach to Section 8 housing is that it is most likely to
locate Section 8 tenants in the least desirable communities. However, the experience of
white tenants in our study suggest that it is not impossible to improve the community
level circumstances of Section 8 participants. This would include proactive attempts to

develop more contracts with landlords in communities with less poverty, monitoring
rental practices of landlords, and by counseling Section 8 participants on housing and
community choices.
What is less clear, of course, is what to do about class and racially segregated
neighborhoods, such as Hempstead Village, that clearly provide a stressful and poor
quality of life for its residents. This is because our interviewees describe to us a nest of
social problems that range from abandoned buildings, lack of safe public areas, drugs in
parks and residential blocks, the threat of gun violence, lack of safety in schools etc. It is
evident that addressing those issues extends beyond the purview of the Section 8
program, per se. To some extent, by relying upon the rental market to provide housing
options for economically poor tenants, the program may actually skew those housing
opportunities toward such communities.
Overall, our findings provide something of a mixed picture. On the one hand,
respondents report that they are reasonably satisfied with their housing and community
circumstances. On the other, we have identified significantly different experiences across
racial and ethnic groups. Given the historical and contemporary patterns of economic
and racial segregation on Long Island, such a finding is not surprising. Finally, it is
important to bear the limitations of this exploratory study in mind when looking at the
policy implications of the results. As already noted, our results are suggestive of the need
to address imbalances and inequalities in the experiences of Section 8 tenants. At the
same time, to the extent that our pool of respondents may not be representative of the
population of Nassau County Section 8 participants, any generalizations from our sample
to that population should be made with a degree of caution. Our analysis does suggest

that, at minimum, consideration of the possible implications of our analysis as well as
further investigation along the policy avenues that we have indicated would be in order.

Literature Cited:
Ashe, Maurice. 2003. “Land Use Planning and the Control of Alcohol, Tobacco, Firearms, and Fast Food Restaurants.” American Journal of Public Health. 93:9:1404-1408.
Austin, S. Bryn, Steven J. Melly, Brisa N. Sanchez, Aarti Patel, Stephen Buka, and Steven L. Gortmaker. 2005. “Clustering of Fast-Food Restaurants Around Schools: A Novel Application of Spatial Statistics to the Study of Food Environments.” American Journal of Public Health. 95:9:1575-81.
Balfour, Jennifer and George Kaplan. 2002. Neighborhood Environment and Loss of Physical Function in Older Adults: Evidence from the Alameda County Study. American Journal of Epidemiology. 155:6:507-515.
Bingenheimer, Jeffrey B., and Stephen W. Raudenbush. 2004. “Statistical and Substantive Inferences in Public Health: Issues in the Application of Multilevel Models” Annual Review of Public Health. 25: 53-77.
Block, J. P., RA Scribner, and KB DeSalvo. 2004. “Fast Food, Race/Ethnicity, and Income: A Geographic Analysis.” American Journal of Preventive Medicine. 27:3:211- 217.
Brooks-Gunn, Jeanne, and Duncan, Greg. 1997. “The Effects of Poverty on Children.” Children and Poverty 7:2:55-71. Brooks-Gunn, Jeanne, Duncan, Greg and J. Lawrence Aber. 1997. (Eds). Neighborhood Poverty. Volume 1. New York: Russell Sage Foundation. Cheadle, Allen, Bruce Psaty, Paula Diehr, Thomas Koepsell, Edward Wagner, Susan Curry, and Alan Kristal. 1995. “Evaluating Community-Based Nutrition Programs: Comparing Grocery Store and Individual Level Survey Measures of Program Impact” Preventive Medicine. 24:71-79.
Chou, Shin-Yi., Michael Grossman., and Henry Saffer. 2002. “An Economic Analysis of Adult Obesity: Results from the Behavioral Risk Factor Surveillance System” National Bureau of Economic Research. Working Paper 9247:1-55
Diez-Roux, A.V. 1998. “Bringing Context Back into Epidemiology: Variables and Fallacies in Multilevel Analysis” American Journal of Public Health. 88:2: 216-223.

Diez-Roux, A.V., F. Javier Nieto, Carles Muntaner, Herman A. Tyroler, George W. Comstock, Eyal Shahar, Lawton S. Cooper, Robert L. Watson, and Moyses Szklo. 1997. “Neighborhood Environments and Coronary Heart Disease: A Multilevel Analysis.” American Journal of Epidemiology. 146:1: 48-63.
Diez-Roux, Ana V. 2002. “Invited Commentary: Places, People, and Health” American Journal of Epidemiology. 155:6: 516-519. 15.
Fisher, Brian D., David S. Strogatz. 1999. “Community Measures of Low-Fat Milk Consumption: Comparing Store Shelves with Households” American Journal of Public Health. 89:2: 235-237
Goering, John and Judith Feins. 2003. Evaluating the Moving to Opportunity Social Experiment. The Urban Institute. Horowitz, Carol, Agueda Arneilla, Sherline James, and Nina Beckell. 2004. “Using Community-Based Participatory Research to Reduce Health Disparities in East and Central Harlem” Mt. Sinai Journal of Medicine. 71:6:368-374.
Horowitz, Carol R., Kathryn A. Colson, Paul L. Hebert, and Kristie Lancaster. 2004. “Barriers to Buying Healthy Foods for People With Diabetes: Evidence of Environmental Disparities.” American Journal of Public Health 94:9:1549-54.
Horowitz, Carol R., Linda Williams, Nina A. Bickell. “A Community-centered Approach to Diabetes in East Harlem” Journal of General Internal Medicine. 18. (2003): 542- 548
Hunt, Linda M., Jacqueline Pugh, Miguel Valenzuela. 1998. “How Patients Adapt Diabetes Self-Care Recommendations in Everyday Life.” Journal of Family Practice. 46:3: 207-215.
Johnson, Rucker C., and Robert F. Schoeni. 2003. “The Effects of Neighborhood Quality During Childhood On Health & Behavior in Early and Mid Life” Paper Prepared for the RAND Health Economics Conference.
Kolodinsky, Jane and Michele Cranwell. 2000. “The Poor Pay More? Now they don’t even have a store to choose from: bringing a supermarket back to the city.” Consumer Interests Annual. 46.
Krieger, Nancy., Jarvis T. Chen, Pamela D. Waterman, David H. Rehkopf, and S.V. Subramanian. 2005. “Painting a Truer Picture of US Socioeconomic and Racial/Ethnic Health Inequalities: The Public Health Disparities Geocoding Project.” American Journal of Public Health 95:2: 312-323
Krieger, Nancy., Jarvis T. Chen, Pamela D. Waterman, David H. Rehkopf, and S. V. Subramanian. 2003. “Race/Ethnicity, Gender, and Monitoring Socioeconomic Gradients

in Health: A Comparision of Area-Based Socioeconomic Measures- The Public Health Disparities Geocoding Project” American Journal of Public Health. 93:10:1655-1671.
Krieger, Nancy. 2006. “If ‘race’ is the answer, what is the question?-on ‘race,’ racism, and health: a social epidemiologist’s perspective” 17 Apr. Race and Genomics, Social Science Research Council.
LeClere, Felicia B., Richard G. Rogers., Kimberley D. Peters. 1997. “Ethnicity and Mortality in the United States: Individual and Community Correlates.” Social Forces 76:1:169-198.
Lee, Rebecca E., and Catherine Cubbin. 2002.“Neighborhood Context and Youth Cardiovascular Health Behaviors.” American Journal of Public Health. 92:3: 428-437
Lee, Sandra S., Joanna Mountain, and Barbara A. Koenig. 2001. “The Meanings of ‘Race’ in the New Genomics: Implications for Health Disparities Research.” Yale Journal of Health Policy, Law and Ethics. 1: 33-75
Lewis, LaVonna Blair, David C. Sloane, Lori Miller Nascimento, Allison L. Diamant, Joyce Jones Guinyard, Antronette K. Yancey, Gwendolyn Flynn. 2005. “African Americans’ Access to Healthy Food Options in South Los Angeles Restaurants.” American Journal of Public Health 95:4:668-73.
Link, Bruce and Jo Phelan. 1995. “Social Conditions as Fundamental Causes of Disease” Journal of Health and Social Behavior (Extra Issue):80-94.
Long Island Health Access Monitoring Project. 2002. Neglected and Invisible:Understanding the Unmet Healthcare Needs of People in Long Island. Hicksville: The Long Island Coalition for a National Health Plan.
Lutfey, Karen and Jeremy Freese. 2005. “Toward some fundamentals of fundamental causality: socioeconomic status and health in the routine clinic visit for diabetes” American Journal of Sociology. 110:5:1326-72.
Massey, Douglas and Nancy Denton. 1993. American Apartheid. Cambridge MA: Harvard University Press. Michael, S. and Eichberg, S. 2008. The Long Island Health Care Survey. Garden City, NY: Adelphi University. Morenoff, Jeffrey, Diez Roux, Ana, Osypuk, Theresa, Hansen, Ben. 2006. “Residential Environment and Obesity: What can we learn about policy interventions from observational studies?” Paper prepared for the National Poverty Center’s “Health Effects of Non-Health Policy” Conference, Bethesda, MD Feb 9-10

Morland, Kimberly., Steve Wing, Ana Diez Roux, and Charles Poole. 2005. “Neighborhood characteristics associated with the location of food stores and food service places” American Journal of Preventive Medicine. 22.1 (2002): 23-29. 26. Feb. 2005
Morland, Kimberly., Steve Wing., Ana Diez-Roux. 2002. “The Contextual Effect of the Local Food Environment on Residents’ Diets: The Atherosclerosis Risk in Communities Study” American Journal of Public Health. 92:11:1761-1768.
Nassau County Department of Health. 2007. Report on the Findings of the 2006 Nassau County Behavioral Risk Factor Survey.
Perkins, Douglas and Ralph Taylor. 2005. “Ecological assessments of community disorder: Their relationship to fear of crime and theoretical implications”. American Journal of Community Psychology 24:1:63-107. Pickett, KE and Pearl, M. 2001. “Multilevel analyses of neighbourhood socioeconomic context and health outcomes: a critical review.” Journal of Epidemiology and Community Health. 55:111-122.
Robert, Stephanie A. 1999. “Socioeconomic Position and Health: The Independent Contribution of Community Socioeconomic Context.” Annual Review of Sociology. 25: 489-516.
Sampson, Robert, and Stephen Raudenbush. 1999. “Systematic Social Observation of Public Spaces: A New Look at Disorder in Urban Neighborhoods”. American Journal of Sociology 105:3:603-51. Sampson, Robert, Morenoff, Jeffrey, Gannon-Rowley, Thomas 2002 “Assessing ‘Neighborhood Effects’: Social Processes and New Directions in Research.” Annual Review of Sociology 28:443-478. Sankar, Pamela, Mildred Cho, Celeste Condit, Lina Hunt, Barbara Koenig, Patricia Marshall, Sandra Soo-Jin Lee, Paul Spicer. 2004. “Genetic Research and Health Disparities” JAMA 291:24, pgs 2985-2989.
Santora, Marc. 2006. “Bodegas Are Asked by Health Officials to Help Push a Better Diet in Poorer Neighborhoods.” The New York Times 20 Jan. 2006: B3
Schneider, John, Reid, Robert, Peterson, Andrew, Lowe, John and Joseph Hughey. 2005. “Tobacco Outlet Density and Demographics at the Tract Level of Analysis in Iowa: Implications for Environmentally Based Prevention Initiatives”. 1-6. Prevention Science.
Smedley, Brian, Stith, Adrinne, and Alan Nelson (Eds.) 2003. Unequal Treatment: confronting racial and ethnic disparities in health care. Washington DC: The National Academies Press.

South, Scott J., Kyle D. Crowder. 1997. “Escaping Distressed Neighborhoods: Individual, Community, and Metropolitan Influences.” American Journal of Sociology. 102:4:1040-84.
Subramanian, S. V., Jarvis T. Chen, David H. Rehkopf, Pamela D. Waterman, and Nancy Krieger. 2005. “Racial Disparities in Context: A Multilevel Analysis of Neighborhood Variations in Poverty and Excess Mortality Among Black Populations in Massachusetts” American Journal of Public Health. 95:2:260-265.
Williams, David R., Chiquita Collins. 1995. “US Socioeconomic and Racial Differences in Health: Patterns and Explanations.” Annual Review of Sociology 21: 349-86.
Williams, David R., Harold W. Neighbors, James S. Jackson. 2003. “Racial/Ethnic Discrimination and Health: Findings From Community Studies.” American Journal of Public Health 93:2: 200-8.
Williams, David R. 2002. “Racial/Ethnic Variations in Women’s Health: The Social Embeddedness of Health.” American Journal of Public Health 92:4:: 588-97
Williams, David R., Pamela Braboy Jackson. 2005. “Social Sources Of Racial Disparities In Health.” Health Affairs 24:2:325-334
Williams, David R. “The Health of Men: Structured Inequalities and Opportunities.” 2003. American Journal of Public Health. 93:5:724-31.
Wilson, William J. 1987. The Truly Disadvantaged. Chicago: University of Chicago Press.
Winkleby, M. A., C. Cubbin. 2003. “Influence of Individual and Neighborhood Socioeconomic Status on Mortality Among Black, Mexican-American and White Women and Men in the United States.” Community Health 57: 444-452.
