a report on energy efficiency and energy mix in the … present report incorporates inputs from...
TRANSCRIPT

N I T I A a y o g | A p r i l 2 0 1 5
A Report on Energy
Efficiency and Energy Mix in
the Indian Energy System
(2030)
Using India Energy Security
Scenarios, 2047
08 Fall
A Report On Energy Efficiency And Energy Mix In The Indian Energy System (2030),
Using India Energy Security Scenarios, 2047
Table of Contents
Foreword................................................................................................................................................ 3
List of Tables .......................................................................................................................................... 4
List of Abbreviations .............................................................................................................................. 5
1. Introduction .................................................................................................................................. 1
2. Brief Introduction To IESS, 2047 ............................................................................................... 2
3. Assumptions .................................................................................................................................. 5
GDP ................................................................................................................................................ 7
Structure of the economy ................................................................................................................ 7
Urbanization ................................................................................................................................... 8
Household Occupancy .................................................................................................................... 8
Activity demand in the economy .................................................................................................... 8
4. Findings ......................................................................................................................................... 9
4.1. Share of Electricity in Demand ............................................................................................... 9
4.2. Electricity demand in different Demand sectors – An overview .......................................... 10
4.3. Electricity Demand Sectors ................................................................................................... 10
4.3.1. Residential Sector .......................................................................................................... 10
4.3.2. Commercial Buildings sector ......................................................................................... 11
4.3.3. Industry sector ................................................................................................................ 11
4.3.4. Agriculture Sector .......................................................................................................... 12
4.3.5. The ‘Others’ Sector ........................................................................................................ 13
4.4. T&D losses ............................................................................................................................ 13
4.5. Electricity and Energy Mix ................................................................................................... 14
4.6. Other Implications: ................................................................................................................. 17
4.6.1. Emissions ........................................................................................................................... 17
4.6.2. Import Dependence ............................................................................................................ 18
5. Conclusion ................................................................................................................................... 19

A Report On Energy Efficiency And Energy Mix In The Indian Energy System (2030),
Using India Energy Security Scenarios, 2047
Foreword
India is at an evolving stage in its growth story. A viable energy strategy is critical for sustaining this
growth. In this era of global cooperation, as India works towards initiating and intensifying
preparations of its Intended Nationally Determined Contributions (INDCs) for the COP21 in Paris,
inputs of an energy model, which captures an integrated picture of its energy scenario, can give the
best estimate of the Government’s assessment of energy use. The India Energy Security Scenarios
(IESS), 2047, developed by NITI Aayog (erstwhile Planning Commission) is one such tool.
The IESS, 2047 is an open source, energy scenario building tool which generates energy demand and
supply scenarios for India leading up to the year 2047. The end demand and supply numbers are
generated in light of adoption of different combinations of energy efficiency measures and
technology interventions on the demand side, and an increase in indigenous resource production of
the country on the supply side. Hence, this tool combines technology and energy security in equal
measure. The present Report incorporates inputs from Ministry of Power, Bureau of Energy
Efficiency and Central Electricity Authority, and aggregates the results to generate macro and micro
projections which are presented in this Report.
This submission responds to the request of the Ministry of Power for the aforementioned projections
which have been developed by an analysis of the energy sector of India as a whole. It is understood
that the same are to be posed to MoEFF&CC for their analysis. The results herein aim to serve as a
common input base to facilitate the projections of India’s INDCs.
I would like to thank the members of the sub-committee consisting of officials from NITI Aayog,
Ministry of Power, Bureau of Energy Efficiency and Central Electricity Authority for their support in
developing and vetting these projections. I would also like to thank the Ministry of Power for giving
NITI Aayog an opportunity to contribute to India’s stance in the global agenda.
A special mention to Mr. Himanshu Gupta, Young Professional, NITI Aayog, without whose
modeling efforts, these estimations would not have been possible. I would also like to note the
contributions to this by the IESS, 2047 team at NITI Aayog comprising Mr. Rajnath Ram (Joint
Adviser), Ms. Astha Ummat (Young Professional) and Ms. Yeshika Malik (Consultant).
Anil K. Jain
Adviser (Energy and Overseas Engagements)
NITI Aayog
17.04.2015

A Report On Energy Efficiency And Energy Mix In The Indian Energy System (2030),
Using India Energy Security Scenarios, 2047
List of Tables
Table 3.1: Activity demand in the economy
Table 3.2 Improvement in Energy efficiency
Table 4.1: Share of Electricity in Demand
Table 4.2 : Electricity demand in Different Demand Sectors
Table 4.3.1: Electricity Demand in Household Buildings Sector (TWh)
Table 4.3.2: Electricity Demand in Commercial Buildings sector (TWh)
Table 4.3.3: Electricity Demand in Industry Sector (TWh)
Table 4.3.4: Electricity Demand in Agriculture Sector (TWh)
Table 4.3.5: Electricity Demand in ‘Others’ Sector
Table 4.4: Reduction in T&D losses
Table 4.5 (a): Energy Mix in the Current Policy (Level 2) Scenario
Table 4.5(b) : Share of Different Sources in Primary Energy Mix
Table 4.5 (c): Electricity Mix (GW)
Table 4.5 (d): Electricity Mix in Generation (TWh)
List of Figures
Fig 4.6.1: GHG Emission Projections
Fig 4.6.2: India’s Import Dependence for Energy

A Report On Energy Efficiency And Energy Mix In The Indian Energy System (2030),
Using India Energy Security Scenarios, 2047
List of Abbreviations
MoEF Ministry of Environment and Forests
MoP Ministry of Power
INDC Intended Nationally Determined Contributions
BEE Bureau of Energy Efficiency
PAT Perform, Achieve and Trade
CEA Central Electricity Authority
IESS India Energy Security Scenarios
RE Renewable Energy
DFC Dedicated Freight Corridors
SEC Specific Energy Consumption
IGCC Integrated Gas Combined Cycle
T&D Transmission and Distribution
LNG Liquefied Natural Gas
GDP Gross Domestic Product
CAGR Compounded Annual Growth Rate
Twh Terra Watt Hour
GW Giga Watt
BF-BOF Blast Furnace- Basic Oxygen Furnace
GHG Green House Gas
MT Million Tonne
Kgoe Kilograms of oil equivalent

A Report On Energy Efficiency And Energy Mix In The Indian Energy System (2030),
Using India Energy Security Scenarios, 2047 1
1. Introduction
1.1. Ministry of Environment and Forests (MoEF), Government of India vide their letter DO
302/AS(SK)/2015 dated 10th
February 2015 requested the Ministry of Power (MoP) to provide
inputs for determining India’s Intended Nationally Determined Contributions (INDCs) for
submission to COP-21 (Paris). To firm up the views of the Ministry with respect to the above
communication, a meeting chaired by Special Secretary, MoP was held on 16.02.2015 with
participation from NITI Aayog, wherein NITI Aayog was requested to provide inputs on
determining the INDCs via energy projections till the year 2030. MoEF has commissioned three
energy modelling agencies to provide inputs relating to India’s emissions in the year 2030, these
agencies have in-turn requested MoEF to provide Government’s assessment of energy use,
which could be factored into the task assigned to them. It is appreciated that the above three
agencies need to work on common input factors, so that the outcomes do not get impacted by
different assessments of macro energy parameters, which may be subject to Government policy
framework. The present Report responds to the above request of MoP to NITI to provide the
projections sought by MoEF using the IESS, 2047.
1.2. While the MoEF has asked MoP to provide inputs on ‘energy mix’ and ‘energy efficiency’, it
was considered in the above referred meeting chaired by the Special Secretary, MoP whether the
exercise ought to restrict itself to the domain of ‘electricity’ or all energy sources. It was
decided that as MoP has domain expertise in the electricity sector, the information to be
provided should be limited to electricity. However, it was appreciated that in any modelling
exercise for demand for a particular source of energy, economy-wide usage of all sources of
energy would need to be estimated. It is only after assessing the overall picture, can the share of
or penetration by electricity be determined. Similarly, energy efficiency would pertain to
multiple consumption sectors where solid/liquid fuels are used along with electricity. Energy
efficiency reduces overall energy consumption, as is the pattern on which BEE’s scheme (PAT)
operates. Therefore, it is not possible to segregate the penetration of efficiency only in electricity
use. It was, therefore, concluded that while MoP’s analysis would be by and large restricted to
electricity domain, however, if macro numbers have to be assumed, then the same may be
projected and the share of electricity (and energy efficiency) within the overall number be
estimated by NITI.
1.3. MoP sought the advice of NITI Aayog as it was felt that the IESS, 2047 was a handy Tool,
which allows accommodation of inputs from multiple agencies and aggregation thereof to
generate macro and micro projections. It was also appreciated that while several agencies
including CEA and BEE are in the business of projecting demand/supply/efficiency, however,
IESS, 2047 was the only tool which projected numbers in the medium term for all sectors on five
yearly basis until 2047. It may be noted that climate change negotiations are largely focussed on
2050, for which projections for 2047 estimated under IESS can be helpful. The tool allows dis-
aggregation of demand and supply sectors, thereby, offering detailed subsector analysis.
Accordingly, in order to factor in the advice of MoP’s expert institutions, a sub-committee was
constituted by MoP chaired by Adviser (Energy), NITI Aayog, as was directed by Special

A Report On Energy Efficiency And Energy Mix In The Indian Energy System (2030),
Using India Energy Security Scenarios, 2047 2
Secretary, MoP in the meeting held on 16.02.2015, with the participation of MoP, CEA and BEE
officials. This sub-committee was tasked with providing agreed numbers after internal
consultations, which could then be submitted to the MoP for consideration. The former tasked
NITI Aayog/CEA/BEE officials to hold consultations on various issues, which were further
resolved in the meeting of the sub-committee. The latter met twice on 20.02.2015 and
24.03.2015, and during the second meeting on 24.03.2015, the submissions were approved,
which now form part of the present Report. The structure of this Report is as follows. The Part 2
offers a brief introduction on the IESS, 2047 which is the model that generated the projections
for this Report; Part 3 discusses the choices made from the options and assumptions in the IESS
for the benefit of the user of these projections; Part 4 gives the actual numbers generated in this
exercise, while Part 5 is the Conclusion.
2. Brief Introduction To IESS, 2047
2.1. The erstwhile Planning Commission in its normal course had remitted energy planning reports
from time to time like the India Hydrocarbon Vision, 1997 and the Integrated Energy Policy
Report. Reports and vision documents for other supply sectors also exist, but in silos. Limited
effort has been made so far to see the entire energy sector in an integrated space, by putting
together all the energy demand sectors of the economy together, and see them in light of the
domestic supply that exists in our country, and extrapolate this exercise in the medium to long
term. Also, as energy sector decisions have huge cost implications, hence, investments also
ought to have the perspective of different time frames. Keeping these in mind, the erstwhile
Planning Commission, now NITI Aayog, decided to undertake an energy scenario building
exercise early in the year 2013, called the India Energy Security Scenarios (IESS), 2047. This
Tool is aimed at addressing the above needs, and provide ‘all energy demand’ and ‘all energy
domestic supply’ perspective under different scenarios/assumptions, on a 5 yearly basis up to
2047 (100th
year of India’s independence) with 2012 as the base year. The IESS, 2047 has been
built as a knowledge portal, combining IT applications, behavioural aspects, local resource
endowments, all sources of energy and demand, technologies of global scale as and when they
are inducted in the Indian system and cost-time parameters. It aims at educating the country on
its energy status, and allowing them to develop pathways which India may adopt for enhancing
our domestic energy dependence. The unique feature of this Tool is that it has been developed
by sector specific expert agencies, and all the data/basis of projections has been placed on the
Planning Commission’s website (www.indiaenergy.gov.in) for users to understand and use.
2.2. The India Energy security Scenarios, 2047 has been developed on an Excel Format with a Web
Tool front end, which allows user-friendly, dynamic, graphic representations of the chosen
outputs of the energy demand and supply levels leading up to the selected terminal year. Energy
security has been adopted as the major output of the exercise. The tool is amenable to adoption
of other outputs as well, which can be further developed over the years. Two versions of the
tool have been worked upon. The first version of the tool integrated energy security, land and
carbon dioxide emissions as its outputs, the second version incorporates cost as an implication as
well and the future versions could incorporate other implications like water, labour etc. as

A Report On Energy Efficiency And Energy Mix In The Indian Energy System (2030),
Using India Energy Security Scenarios, 2047 3
outputs. The IESS, 2047 is expressly an energy scenario building tool. The guiding ambition of
this is to develop energy pathways leading up to the year 2047, comprising of likely energy
demand and supply scenarios. The end demand and supply numbers will be generated in light of
the adoption of different combinations of energy efficiency measures and technology
interventions on the demand side, and an increase in indigenous resource production of the
country on the supply side. The tool has been so developed, that it can create hundreds of
scenarios with different combinations of levels/efficiencies of energy demand and supply
sectors.
2.3. For each sector, four levels have been developed, these are:
Level 1-the 'Least Effort' scenario: This assumes that little or no effort is being made in terms
of interventions on the demand and the supply side, and represents a pessimistic outlook.
Level 2- the 'Determined Effort' scenario: This describes the level of effort, which is deemed
most achievable by the implementation of current policies and programmes of the
government. It may be seen as the ‘current policy’ with autonomous improvements.
Level 3- the 'Aggressive Effort' scenario: This describes the level of effort needing significant
change, which is hard but deliverable.
Level 4- the 'Heroic Effort' scenario: This considers extremely aggressive and ambitious
changes that push towards the physical and technical limits of what can be achieved.
2.4. The tool has been built with the help of a wide pool of knowledge partners from the
Government, Industry, Think Tanks, Non-Governmental organizations, International research
agencies and the academia. Extensive stakeholder consultations were held with the Industry,
Academia, the Government, the general public and other experts (Organizations or
Individuals) in different fields of energy to vet the validity of sector specific trajectories and
assumptions taken. Several inter-ministerial consultations within the Government were also
conducted to authenticate the data for specific sectors. Nation-wide outreach workshops have
been conducted to promote the usage of this tool and involve more people in the exercise for
consensus building and creating awareness about energy policies.
2.5. The IESS, 2047 can be summarized as follows:
I1: Comprehensive database of all energy sources- The IESS, 2047 brings together all the
demand and supply sources of energy in the economy and creates an integrated, open-source,
database which did not exist till now. The data for the base year 2012-13, independently
provides a comprehensive energy data base for the first time, which can be used for current
research. The tool is also backed with hundreds of pages of elaborate documentation detailing
the background statistics and scenario, assumptions and methodology followed in each sector
I2: Inclusion of all energy demand sectors- Earlier, the major focus was on analysing the
supply side of the Indian energy sector. The IESS brings in all the energy demand sectors of the
economy and focuses on demand side management and energy efficiency along with the supply
sectors. It is also an Efficiency Calculator, providing the levels of energy efficiency for the
different levels of inputs that the user picks.

A Report On Energy Efficiency And Energy Mix In The Indian Energy System (2030),
Using India Energy Security Scenarios, 2047 4
I3: Medium term- The IESS, 2047, realizing the importance of medium term energy planning,
provides scenarios with the terminal year 2047, the 100th year of India’s independence.
I4: Technology- The IESS captures and incorporates all prevailing and anticipated technologies
both in the energy demand and the supply sectors. (Electric Vehicles, Supercritical Power Plants,
Shale gas, Advanced bio fuels, Green Buildings, Solarisation of telecom towers etc.)
I5: Social media integration- The IESS, 2047 is being promoted vigorously though social
media so as to reach out to more and more common people and involve them in the energy
policy debates.
I6: Interactive web tool- The IESS, 2047, for the first time, has brought about an interactive
and dynamic web-tool which reflects the implications of the user’s choices on energy security,
land, cost and emissions, in a turnaround time of less than 2 seconds.
2.6. Components of the IESS, 2047:
The end to end online services provided by the IESS, 2047 can be summarized as under:
1. The tool is backed up by detailed Excel sheets for all sectors. The data for the four Levels
has been loaded on the Excel Sheet on five yearly intervals basis up to 2047. This data has
been obtained from a variety of public sources. Historical data has been sourced from
published documents, while the projections up to 2047, have been made by different expert
agencies, keeping in mind likely scenarios.
The open-source 2047 excel calculator allows experts to understand the full impact of their
choices, take a look at the scenarios generated and to change the data and assumptions, if
they so desire.
2. The concise one pager documents allow the user to get a glimpse of the trajectories of each
sector in one quick view.
3. The detailed documentation for each sector present the sectoral background, the
assumptions behind each sector, the methodology followed to construct the same and
additional sector related information.
4. The tool also comprises of a web tool which is the main interface between the users and the
detailed excel model. One can choose pathways on the web interface and the same draws
from the excel spreadsheet at the backend to generate the results and implications of the
chosen pathway.
2.7. The objectives of the IESS, 2047 exercise may be summarized as follows:
It will offer a platform to facilitate academic and policy discourse about the possible future
pathways for the Indian energy sector and enable prioritizing some potential policy
interventions for deeper analysis.
It will help users understand the wide realm of possible energy pathways available to the
country from highly pessimistic to highly optimistic scenarios.
For each scenario in this range of possibilities, it will provide indicative numbers for demand
and supply, and potential implications on issues such as import dependence, cost and land
requirement.
A Report On Energy Efficiency And Energy Mix In The Indian Energy System (2030),
Using India Energy Security Scenarios, 2047 5
It should be noted that the IESS, 2047 platform does not ‘recommend’ or ‘prefer’ any one
scenario or pathway over the others. It merely provides the user a way to understand the
realm of possible scenarios and their implications
2.8. What the IESS, 2047 is, and is not:
The IESS, 2047 does not generate forecasts/estimates. There is no NITI Aayog’s projection
of the likely scenario in 2047. It at best a scenario building exercise, with no claim on the
projections being ‘highly probable’ in the future years.
The data relating to implications - energy security, costs, land and CO2 emissions are merely
indicative and not firm estimates. Therefore, this is a scenario building exercise and not an
energy model.
The IESS, 2047 is definitely an aggregation of all the energy demand and supply numbers
under different scenarios, and thus, mimics the future.
It does take into account the known/estimated energy resources (potential) of the country, and
factors in pessimistic/optimistic outlooks on policy, costs, economic growth and other
assumptions. Therefore, this is a useful tool to see the big picture - of worst and the best-case
scenarios.
It could help the interested user to advocate such approaches, which would propel the
economy towards optimistic scenarios, and avoid the pessimistic ones. It could, however, be
used to estimate likely energy demand and domestic supply, by loading ‘agreed numbers’ on
the tool.
3. Assumptions
3.1. Having appreciated the essential strategy of IESS, the sub-committee deliberated on choice-
making from the options offered by the tool. It was agreed at the outset, that the projections
would be made using the above tool, but there would be flexibility in adopting/substituting the
numbers adopted in the IESS, 2047. Therefore, the sub-committee could benefit from the advice
of BEE and CEA in adopting the numbers as per the expert opinion of these institutions. In this
section, we discuss the rationale behind the choices adopted for this Report. The numbers
generated for submission to the MoP have been detailed in the next Part (Part 4), while the logic
and assumptions made in this exercise have been enumerated in this Part. The sub-committee
agreed that on the energy demand side, out of the four Levels, it would be reasonable to adopt
the Level 2 numbers (present policy with autonomous improvements). While India endeavours
to improve the way it consumes energy and thereby enhance energy efficiency, this would come
at a cost to the economy. The Level 2 assumes present policies and reasonable degree of
improvement in the same, and is preferable as it would not be appropriate to consider
‘Aggressive’ and ‘Heroic’ Levels of energy efficiency as they would demand exorbitant
investments. On the supply side, as explained earlier in para 2, the user has to opt for choices as
per the desired objective. The higher levels in Supply envisage higher domestic production,
which may or may not be the desired objective for all sources of energy, depending upon
climate, cost, technology or any other consideration. For example, we may desire

A Report On Energy Efficiency And Energy Mix In The Indian Energy System (2030),
Using India Energy Security Scenarios, 2047 6
higher/aggressive domestic coal supply (Level 3), and meet the balance demand for power by
choosing Level 4 for RE (Heroic levels). The user of the Tool could choose a mix of energy as
per his or her policy objectives, which may be carbon reduction, high energy security (reduced
import dependence), lesser footprints on land (lower renewable) or lesser cost of energy. The
energy mix, would be a function of the choice of the user from either or a combination of the
above objectives.
3.2 The sub-committee decided that the supply projections ought to be made on the ambition of
energy security. Hence, present policy scenario (Level 2) has been chosen which envisages
raising both fossil fuel production/consumption as well as RE – a healthy mix. It may be noted
that for the period up to the end of 13th
Plan (2022), a large coal based generation capacity has
already been planned, and in turn supported by a major coal production programme in the
country. Similarly, the emphasis on solar was also factored in as per Government’s policy.
Therefore, it was decided to adopt the Level 2 numbers on the Supply side as well, to the extent
possible. But, the numbers in the Level 2 are not synonymous with the announced Government
targets (Level 4 adopt the targets). For example, the sub-committee was cognisant of MNRE’s
announcement of an aggressive renewable energy programme (particularly solar). However, the
sub-committee was conscious in not adopting the Government’s projections in toto (175 GW in
2022), and its projections were tempered by historical capacity growth rates, pragmatism and
entire energy system considerations. The RE is poised to take-off post 2022. On the basis of the
choices so made, the energy equivalent in terawatt hour (TWh) term for various demand sectors
and supply of energy in the year 2030 has been calculated.
3.3 The issue of energy efficiency has been addressed on the Demand side of the IESS. It is
interesting to note that the energy demand projections in the above tool have in any case been
generated, almost entirely on the basis of energy efficiency, providing a ready basis for adopting
numbers for the present exercise. Hence, the sub-committee approved the process used in the
IESS to derive energy demand. As can be seen on the dedicated website
www.indiaenergy.gov.in, the energy consuming sectors have been de-constructed by sector-
specific drivers of energy efficiency. As an illustration, in the case of energy demand for
passenger transport, the Tool adopts parameters such as the number of kilometres travelled, share
of public transport, fuel efficiency etc. The former would be impacted by measures such as
transit oriented development, while the share of public transport would be a behavioural decision.
Other factors such as fuel efficiency of vehicles, adoption of electrical vehicles, etc. have also
been factored in. On freight component, the Tool works on the principle of efficient logistic
planning by adoption of dedicated freight corridors (DFCs), and distribution of load carried
between rail and road. The assumptions on efficiency parameters are available on the above
website. The treatment of other energy demand sectors such as industry, agriculture, buildings,
telecom and cooking has been done in the IESS, 2047 on similar lines as has been explained
above for the Transport sector. For the Industry segment, a detailed exercise has been done in for
reducing specific energy consumption (SEC) for major industries as well as ‘Others’ component.
It may be seen in the Tables in Part 4 below, that as desired by MoP, the Sub-Committee has
approved numbers for consumption of electricity in the above demand sectors. The energy
A Report On Energy Efficiency And Energy Mix In The Indian Energy System (2030),
Using India Energy Security Scenarios, 2047 7
efficiency levels in the major energy demand sector can also be seen in detail in the relevant
tables below, which have been excerpted from IESS, 2047.
3.4 On the issue of energy mix, as stated in the earlier paras, the sub-committee exercised cautious
discretion to choose the policy drivers. The sub-committee was cognizant of the fact that the
investments made in the electricity system in recent times, and planned for the future, would
have a minimum payback period before which the same could not be retired or phased out.
Therefore, even theoretically, India’s energy pathways for the next few decades would get
locked-in by the present energy strategy. The sub-committee also noted the energy efficiency
measures in power generation by plans of adopting super critical, ultra-super critical technologies
and IGCC. It also recognized efforts for reduction in T & D losses in electricity transmission and
distribution. The increased efficiency of power generation and reduction in losses, have been
taken on board in projecting additional generation capacity. The sub-committee also noted the
recent plans afoot in the Government to raise capacity utilisation of gas based plants by
importing LNG. While no projections can be made on the continuance of low prices of oil and
gas in the global economy, however, it was felt that the rationalization of power tariff, and
transition of the power generation system to higher share of imported coal and LNG, would be
trend setters. Both the above fuels would be higher priced than coal based power, but once
adopted in moderate measures in the electricity grid the strategy would be irreversible and would
find acceptance in the market. It may also be pointed out that the sub-committee noted that in
order to meet the balancing demand for the higher renewable energy share as envisaged by the
MNRE, gas based generation would be preferred to hydro power, especially looking to the large
displacement problems encountered with the latter. On the basis of the above considerations, the
sub-committee worked out the energy mix in the economy, and the share of fuel in power
generation and overall energy mix by fuel.
3.5 The IESS, 2047 projections are based on certain assumptions relating to likely GDP growth,
population, level of economic activity etc which would impact the demand for energy. While
short term projections can be made using historical growth rates, however, medium term ones
will need a deeper analysis. The IESS was finalised after consulting multiple agencies, and those
assumptions were adopted which appeared to be most reasonable. The following discussion
elaborates the same so that the users of this Report may note the assumptions, and the basis of
their adoption. The base year of the IESS exercise is the end of the 11th
Five Year Plan period
(2012).
GDP
GDP is assumed to grow at a CAGR of 7.4% from the base year until 2047. The growth rate
gradually picks up and after plateauing in the short term, then it descends. The growth rate in
the 12th
Five year Plan has been assumed at 6.8%, increasing to 8.1% in the 13th
Plan,
peaking at 8.4% in the 14th
and 15th
Plans, and comes down to 5.8% during the terminal block
of 5 years of the study, 2042-47.
Structure of the economy

A Report On Energy Efficiency And Energy Mix In The Indian Energy System (2030),
Using India Energy Security Scenarios, 2047 8
In line with the PM’s vision of creating 30 million jobs in the manufacturing sector, the share
of manufacturing in the GDP will have to rise in consonance: it increases to 34% in the year
2047, from the present level of 16%.
Urbanization
In line with projections and the rising per capita incomes of Indians, urbanization will
increase to 51% in 2047 from the present level of 31%.
Household Occupancy
Occupancy of households is a function of urbanization, and, in turn of income levels.
Urbanization patterns for Indian states have been determined using census data. Tamil Nadu
is the most urbanized state in India with 49% urbanization in 2011 and 4.1 people per
household. The same has been regressed with urbanization data to arrive at the household
occupancy of 3.8 for India in the year 2047.
Activity demand in the economy
Indian economy is assumed to grow at 7.4% CAGR between 2012-47. The economic activity
so generated will lead to demand for energy as well. The amount of economic activity
generated in the 35 years is shown in Table 3.1 below.
Table 3.1: Activity demand in the economy
Indicator 2012 2047
Per Capita Transport Demand (km) 5,970 18,700
Per Capita Steel Use(kg) 66 372
Per Capita Residential Building Space (m2) 1.8 35
Per Capita Commercial Building Space (m2) 0.7 5.9
Per Household Modern Energy Use for Cooking in Rural Areas (kgoe) 61 183
Source: IESS,2047
The above level of economic activity will generate a large demand for energy and stress resources.
We have used Level 2 of the demand sector and Level 2 of the supply sector.
Level 2, as defined in Part 2 assumes ‘current policy’ energy efficiency improvements in all the
sectors. For, e.g. specific energy consumption (SEC) of the freight transport sector improves at a
CAGR of 1.05% from 2012-30, partly due to increase in the efficiency of trucks and other modes of
freight transport, and partly due to reduced congestion facilitated by dedicated freight corridors
(DFCs). The SEC improvements in all the demand sectors are shown below in Table 3.2. The

A Report On Energy Efficiency And Energy Mix In The Indian Energy System (2030),
Using India Energy Security Scenarios, 2047 9
following assumptions have been adopted, leading to implications on energy demand as projected in
Part 4.
Table 3.2 Improvement in Energy efficiency
SEC of Energy
Demand
Units 2012 2022 2030 2047 CAGR of
SEC(2012-
2030)
Passenger Transport Kwh/pkm 0.07 0.07 0.08 0.08 0.4%
Freight Transport Kwh/tkm 0.21 0.19 0.18 0.15 -1.0%
Industry-Steel Kwh/Kg 7.40 7.07 6.84 6.41 -0.4%
Industry-cement Kwh/kg 1.01 0.95 0.92 0.87 -0.5%
Residential Buildings Kwh/m2 14.20 23.79 27.66 33.09 3.8%
Commercial Buildings Kwh/m2 107 98 88 74 -1.1%
Agriculture-Tractors Kwh/tractor/year 13163 12557 11926 11700 -0.5%
Implicit SEC of Demand Sectors*
*SEC numbers cannot be derived for telecom, cooking as well as for agricultural pumping demand,
as the methodology followed in those cases is top down modelling approach. However, it may be
noted that energy efficiency improvements are witnessed in those sectors as well.
4. Findings
4.1. Share of Electricity in Demand
After modelling economic demands from various demand sectors, and using the SEC numbers
as mentioned above, energy demand has been derived. Due to increased penetration of electrical
technologies and appliances in sectors such as cooking, transport, industry in the Level 2 case,
share of electricity in the energy demand increases from 15.6% in the base year 2011-12 to
20.6% in the year 2030 as shown in Table 4.1.
Table 4.1: Share of Electricity in Demand
2012 2022 2030 2047
Share of Electricity in Demand 15.6% 18.8% 20.6% 24.8%

A Report On Energy Efficiency And Energy Mix In The Indian Energy System (2030),
Using India Energy Security Scenarios, 2047 10
4.2. Electricity demand in different Demand sectors – An overview
The rise in share of electricity can be attributed to the humongous growth in the buildings’
energy demand, which is predominantly met by electricity as shown in Table 4.2. Presently 35%
of the rural Indians don’t have access to pucca houses. With rapid urbanization and with all
Indians getting access to ‘pucca’ houses under the “Housing for All” initiative of the Prime
Minister, this sharp increase in household segment is inevitable. Further, urban areas will see an
increased penetration of air conditioners from the base year of 1 AC per 100 persons to 15 ACs
per 100 persons in the year 2047. Multiplier effect of these two will result in an almost 5 fold
increase in electricity demand in this sector by 2030.
Table 4.2 Electricity demand in Different Demand Sectors
TWh 2012 2022 2030 2047
Industry 336 494 703 1366
Residential 175 480 842 1840
Commercial 86 142 238 771
Agriculture 136 245 336 501
Others 29 71 121 233
Total 762 1433 2,239 4712
4.3. Electricity Demand Sectors
The next section talks about electricity demand from all the demand sectors in the Current
Policy scenario (Level 2).
4.3.1. Residential Sector
Residential sector comprised of 22% of the overall electricity demand in the base year 2011-
12. Increasing urbanization, pattern of urbanization and rising income levels in both urban
and rural areas are factors responsible, for big push to demand for electrical appliances
resulting in manifold increase in the electricity demand from the residential sector. In
projecting demand till 2030, following policy announcements and assumptions have been
incorporated into the model:
o Housing for all achieved by the year 2022.
o 24 x 7 power supply objective of the government is achieved by the year 2022
o Residential building space/capita increases from 10 m2/capita to 32 m
2/capita in 2047.
o 45% of the residential floor space is under high-rise buildings category in urban areas.
o 50% of the new high rise buildings and 40% of the horizontal buildings in 2047 are
smart energy buildings.

A Report On Energy Efficiency And Energy Mix In The Indian Energy System (2030),
Using India Energy Security Scenarios, 2047 11
o 18% of the household appliances in residential sector by 2047 are high efficiency
ones.
As a result, the electricity demand from household buildings will rise 5 fold to 842 TWh
from the base level of 175 TWh as shown in Table 4.3.1
Table 4.3.1: Electricity Demand in Household Buildings Sector (TWh)
Fuel Source 2012 2022 2030 2047
Electricity
Demand
175 480 842 1840
4.3.2. Commercial Buildings sector
Commercial buildings sector contributed 15% of the electricity demand in the year 2011-12.
The drivers for electricity demand in buildings is the rising share of services sector in the
GDP, levels of urbanization and penetration of high efficiency appliances in this sector. In
this context, electricity demand from the commercial sector has been modelled around the
following assumptions:
Commercial building space/capita increases from 0.7 m2/capita to 5.9 m
2/capita in 2047.
24 x 7 power supply objective of the government is achieved by the year 2022.
30% of the appliances (HVAC, Lighting, Others) in Buildings sector by 2047 are of high
efficiency type.
As a consequence, the electricity demand from the commercial buildings sector increase
almost 3 fold to 238 billion units of electricity in 2030, from the base level of 86 billion units
as shown in Table 4.3.2
Table 4.3.2: Electricity Demand in Commercial Buildings sector (TWh)
Fuel Source 2012 2022 2030 2047
Electricity Demand 86 142 238 771
4.3.3. Industry sector
Industry sector comprised of 43% share of the overall electricity demand in India in the
year 2011-12. Eight sectors, under the ambit of Perform Achieve and Trade (PAT) scheme

A Report On Energy Efficiency And Energy Mix In The Indian Energy System (2030),
Using India Energy Security Scenarios, 2047 12
of Ministry of Power contribute to approximately 60% of the industrial electricity demand.
Steel sector alone contributes to 25% of the industrial electricity demand, followed by
cement and aluminium sector. Drivers for industrial electricity demand are the increased
demand for materials in buildings, transportation, capital goods and infrastructure. These
levers also form the basis of the modelling of economic demand of metals and materials in
consonance with rising per capita income levels. The material demand thus obtained could
be met by various technologies, fuel choices leading to different levels of energy demand
for the same levels of economic demand. For the purpose of this study, technology and fuel
shares in Industry are kept in line with the past trends, with marginal improvements in the
specific energy consumption (SEC). The assumptions that have gone into projecting
demand from Industry sector are as follows:
Demand for Steel in 2047 grows to 654 MT and for Cement 1042 MT in 2047 as
compared to 80 MT and 246 MT in 2012, respectively.
Penetration of energy efficient plants in the Steel sector remain at 60% in 2047 as
compared to 56% in 2012.
Penetration of energy efficient plants in the Cement sector remains constant at 72% in
2047.
BF-BOP remains a dominant route in Steel Industry, and Cement Industry also remains at
the present policy path in context of fuel mixes.
As a consequence, the electricity demand from the Industry sector increases almost 2 fold to
703 TWh in 2030 from the base level of 336 TWh as shown in Table 4.3.3.
Table 4.3.3: Electricity Demand in Industry Sector (TWh)
Fuel Source 2012 2022 2030 2047
Electricity Demand 336 494 703 1366
4.3.4. Agriculture Sector
Agriculture sector contributed to 17% of the overall electricity demand in the country in
2011-12. Increased mechanization and shift to ground water irrigation across the country is
driving the pumping and tractor demand in this sector, and hence the large diesel and
electricity demand in the agricultural sector. Sustainability and subsidy concerns have made
replacement of diesel pumps in agriculture with electricity and solar based pumps imminent,
which is likely to be the policy driver. The current policy scenario in agriculture projects the
efficiency improvements of tractors and penetration of solar and electricity based pumps, as
highlighted in the assumptions below:
1. Pumping demand grows at a CAGR of 4% between 2012-47.
A Report On Energy Efficiency And Energy Mix In The Indian Energy System (2030),
Using India Energy Security Scenarios, 2047 13
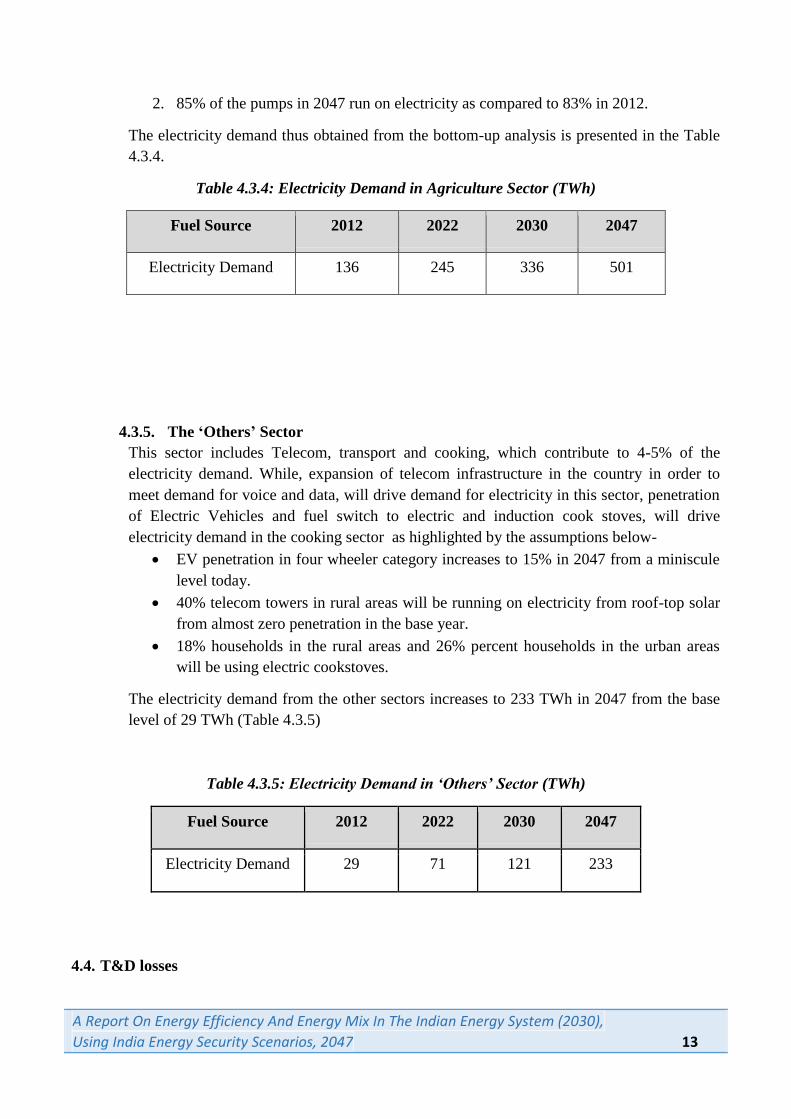
2. 85% of the pumps in 2047 run on electricity as compared to 83% in 2012.
The electricity demand thus obtained from the bottom-up analysis is presented in the Table
4.3.4.
Table 4.3.4: Electricity Demand in Agriculture Sector (TWh)
Fuel Source 2012 2022 2030 2047
Electricity Demand 136 245 336 501
4.3.5. The ‘Others’ Sector
This sector includes Telecom, transport and cooking, which contribute to 4-5% of the
electricity demand. While, expansion of telecom infrastructure in the country in order to
meet demand for voice and data, will drive demand for electricity in this sector, penetration
of Electric Vehicles and fuel switch to electric and induction cook stoves, will drive
electricity demand in the cooking sector as highlighted by the assumptions below-
EV penetration in four wheeler category increases to 15% in 2047 from a miniscule
level today.
40% telecom towers in rural areas will be running on electricity from roof-top solar
from almost zero penetration in the base year.
18% households in the rural areas and 26% percent households in the urban areas
will be using electric cookstoves.
The electricity demand from the other sectors increases to 233 TWh in 2047 from the base
level of 29 TWh (Table 4.3.5)
Table 4.3.5: Electricity Demand in ‘Others’ Sector (TWh)
Fuel Source 2012 2022 2030 2047
Electricity Demand 29 71 121 233
4.4. T&D losses
A Report On Energy Efficiency And Energy Mix In The Indian Energy System (2030),
Using India Energy Security Scenarios, 2047 14
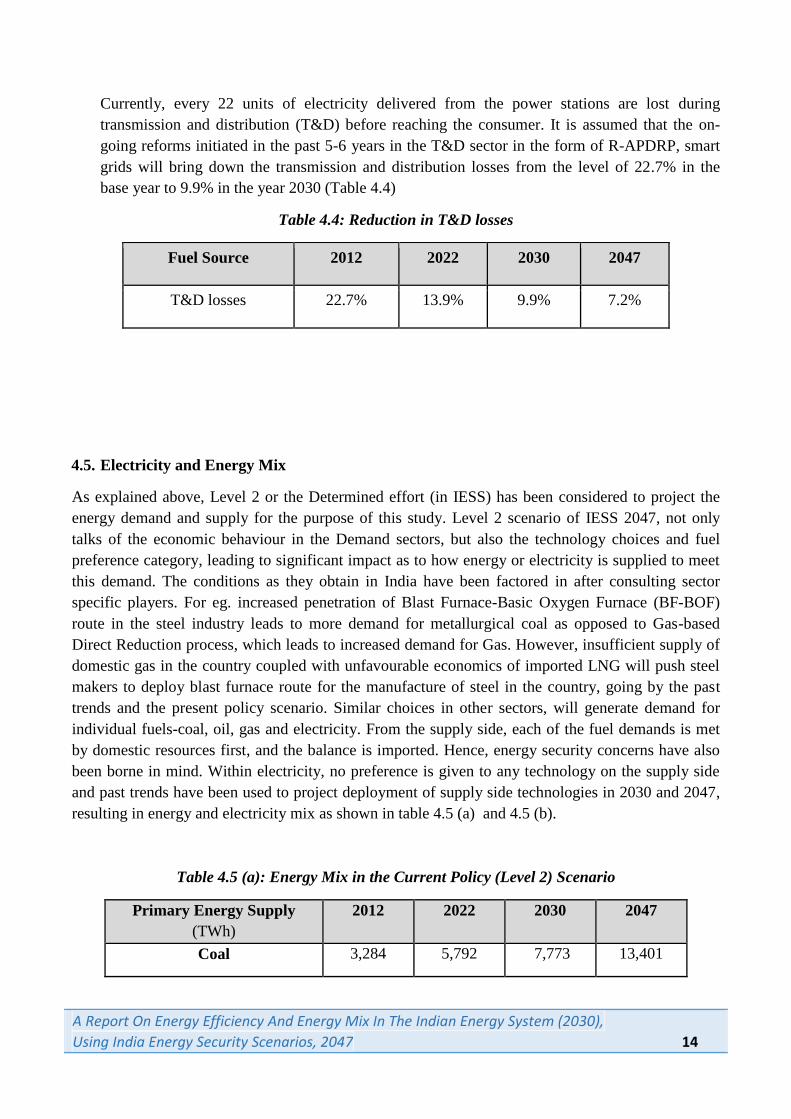
Currently, every 22 units of electricity delivered from the power stations are lost during
transmission and distribution (T&D) before reaching the consumer. It is assumed that the on-
going reforms initiated in the past 5-6 years in the T&D sector in the form of R-APDRP, smart
grids will bring down the transmission and distribution losses from the level of 22.7% in the
base year to 9.9% in the year 2030 (Table 4.4)
Table 4.4: Reduction in T&D losses
Fuel Source 2012 2022 2030 2047
T&D losses 22.7% 13.9% 9.9% 7.2%
4.5. Electricity and Energy Mix
As explained above, Level 2 or the Determined effort (in IESS) has been considered to project the
energy demand and supply for the purpose of this study. Level 2 scenario of IESS 2047, not only
talks of the economic behaviour in the Demand sectors, but also the technology choices and fuel
preference category, leading to significant impact as to how energy or electricity is supplied to meet
this demand. The conditions as they obtain in India have been factored in after consulting sector
specific players. For eg. increased penetration of Blast Furnace-Basic Oxygen Furnace (BF-BOF)
route in the steel industry leads to more demand for metallurgical coal as opposed to Gas-based
Direct Reduction process, which leads to increased demand for Gas. However, insufficient supply of
domestic gas in the country coupled with unfavourable economics of imported LNG will push steel
makers to deploy blast furnace route for the manufacture of steel in the country, going by the past
trends and the present policy scenario. Similar choices in other sectors, will generate demand for
individual fuels-coal, oil, gas and electricity. From the supply side, each of the fuel demands is met
by domestic resources first, and the balance is imported. Hence, energy security concerns have also
been borne in mind. Within electricity, no preference is given to any technology on the supply side
and past trends have been used to project deployment of supply side technologies in 2030 and 2047,
resulting in energy and electricity mix as shown in table 4.5 (a) and 4.5 (b).
Table 4.5 (a): Energy Mix in the Current Policy (Level 2) Scenario
Primary Energy Supply
(TWh)
2012 2022 2030 2047
Coal 3,284 5,792 7,773 13,401

A Report On Energy Efficiency And Energy Mix In The Indian Energy System (2030),
Using India Energy Security Scenarios, 2047 15
Oil 1,929 3,093 4,429 7,137
Gas 574 1,017 1,325 2,068
Nuclear, Hydro and
Renewables
245 629 935 1,968
Others 985 658 826 1,316
Total 7,017 11,189 15,286 25,890
Table 4.5(b) : Share of Different Sources in Primary Energy Mix
Share in Primary
Energy Supply
2012 2022 2030 2047
Coal 47% 52% 51% 52%
Oil 27% 28% 29% 28%
Gas 8% 9% 9% 8%
Nuclear, Renewables
and Hydro
3% 6% 6% 8%
Others 14% 6% 5% 5%
As evident, Coal will remain a dominant fuel and its share will rise to 51% in 2030 from the present
level of 47%, being driven by the industry sector, owing to burgeoning demand for steel and cement,
while oil share will decrease only marginally to 29% in the year 2030. It is to be noted that, the coal
supply shown in the tables above will feed into the coal demand of the power sector and that of the
industry sector (also as solid fuel). Share of electricity in the demand sector will be a combination of
that from coal based power, gas based power and clean sources. IESS 2047- Level 2 (Determined
scenario) reveals that the share of electricity in the demand sector will rise to 20.6% in 2030 from the
present levels of 15.6 % (Table 4.1 above). The electricity mix is indicated in Table 4.5 (c) and the
electricity mix in generation is indicated in Table 4.5 (d).

A Report On Energy Efficiency And Energy Mix In The Indian Energy System (2030),
Using India Energy Security Scenarios, 2047 16
Table 4.5 (c): Electricity Mix (GW)
GW installed capacity 2012 2022 2030 2047
Gas Power Stations 24 34 40.1 50
Coal power stations
(Including CCS)
106 205 264 482
Nuclear power 5 12 16 26
Hydro Power Generation 41 61 65 75
Solar PV 1 18 45 150
Solar CSP - 4 11 46
Onshore Wind 10 47 90 195
Offshore Wind - 1 4 20
Small Hydro 1 7 11 13
Distributed Solar PV 0 4 11 47
Biomass 5 6 6 8

A Report On Energy Efficiency And Energy Mix In The Indian Energy System (2030),
Using India Energy Security Scenarios, 2047 17
Total 193 398 562 1,112
The overall power installed capacity rises from 193 GW in the year 2011-12 to 562 GW in the year
2030. Share of renewable capacity in the year 2030 would be 170 GW, 32% of the overall power
capacity.
Table 4.5 (d): Electricity Mix (Generation)
TWh Generation 2012 2022 2030 2047
Coal 708.3 1,444.7 1848 3,153.6
Gas 115.4 127.7 155 198.1
Nuclear 26.7 82.5 109 183.1
Hydro 143.8 213.9 227 263.0
Renewables 58.6 213.1 424 1,187.5
Imports 4.6 15.3 40 92.0
Total 1,057 2,097 2,803 5,077
Share of RE 5.5% 10.2% 15.0% 23.4%
4.6. Other Implications:
4.6.1. Emissions
A Report On Energy Efficiency And Energy Mix In The Indian Energy System (2030),
Using India Energy Security Scenarios, 2047 18
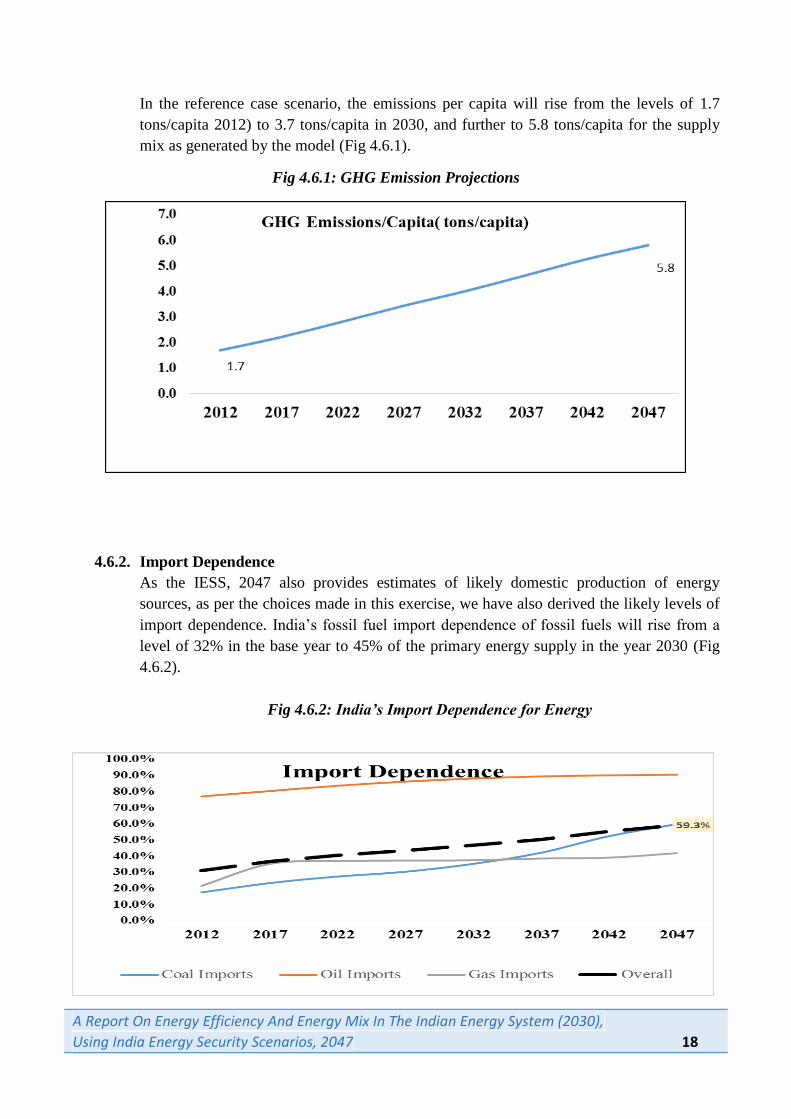
In the reference case scenario, the emissions per capita will rise from the levels of 1.7
tons/capita 2012) to 3.7 tons/capita in 2030, and further to 5.8 tons/capita for the supply
mix as generated by the model (Fig 4.6.1).
Fig 4.6.1: GHG Emission Projections
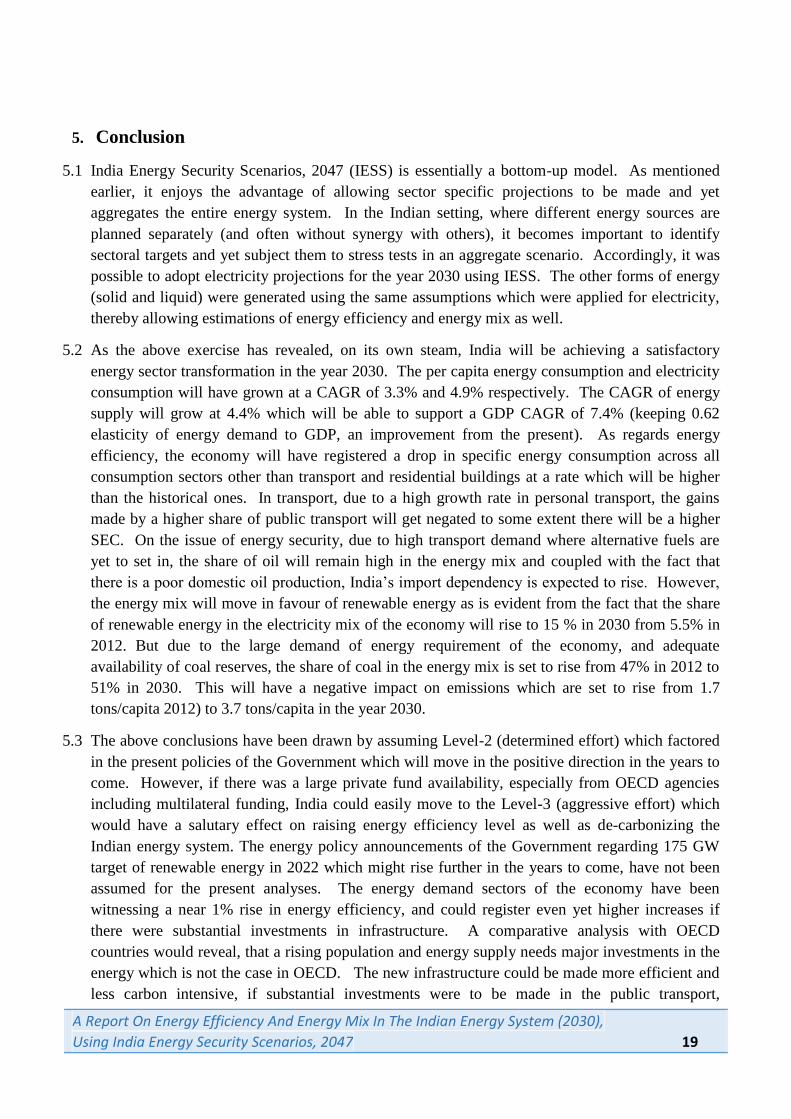
4.6.2. Import Dependence
As the IESS, 2047 also provides estimates of likely domestic production of energy
sources, as per the choices made in this exercise, we have also derived the likely levels of
import dependence. India’s fossil fuel import dependence of fossil fuels will rise from a
level of 32% in the base year to 45% of the primary energy supply in the year 2030 (Fig
4.6.2).
Fig 4.6.2: India’s Import Dependence for Energy
A Report On Energy Efficiency And Energy Mix In The Indian Energy System (2030),
Using India Energy Security Scenarios, 2047 19
5. Conclusion
5.1 India Energy Security Scenarios, 2047 (IESS) is essentially a bottom-up model. As mentioned
earlier, it enjoys the advantage of allowing sector specific projections to be made and yet
aggregates the entire energy system. In the Indian setting, where different energy sources are
planned separately (and often without synergy with others), it becomes important to identify
sectoral targets and yet subject them to stress tests in an aggregate scenario. Accordingly, it was
possible to adopt electricity projections for the year 2030 using IESS. The other forms of energy
(solid and liquid) were generated using the same assumptions which were applied for electricity,
thereby allowing estimations of energy efficiency and energy mix as well.
5.2 As the above exercise has revealed, on its own steam, India will be achieving a satisfactory
energy sector transformation in the year 2030. The per capita energy consumption and electricity
consumption will have grown at a CAGR of 3.3% and 4.9% respectively. The CAGR of energy
supply will grow at 4.4% which will be able to support a GDP CAGR of 7.4% (keeping 0.62
elasticity of energy demand to GDP, an improvement from the present). As regards energy
efficiency, the economy will have registered a drop in specific energy consumption across all
consumption sectors other than transport and residential buildings at a rate which will be higher
than the historical ones. In transport, due to a high growth rate in personal transport, the gains
made by a higher share of public transport will get negated to some extent there will be a higher
SEC. On the issue of energy security, due to high transport demand where alternative fuels are
yet to set in, the share of oil will remain high in the energy mix and coupled with the fact that
there is a poor domestic oil production, India’s import dependency is expected to rise. However,
the energy mix will move in favour of renewable energy as is evident from the fact that the share
of renewable energy in the electricity mix of the economy will rise to 15 % in 2030 from 5.5% in
2012. But due to the large demand of energy requirement of the economy, and adequate
availability of coal reserves, the share of coal in the energy mix is set to rise from 47% in 2012 to
51% in 2030. This will have a negative impact on emissions which are set to rise from 1.7
tons/capita 2012) to 3.7 tons/capita in the year 2030.
5.3 The above conclusions have been drawn by assuming Level-2 (determined effort) which factored
in the present policies of the Government which will move in the positive direction in the years to
come. However, if there was a large private fund availability, especially from OECD agencies
including multilateral funding, India could easily move to the Level-3 (aggressive effort) which
would have a salutary effect on raising energy efficiency level as well as de-carbonizing the
Indian energy system. The energy policy announcements of the Government regarding 175 GW
target of renewable energy in 2022 which might rise further in the years to come, have not been
assumed for the present analyses. The energy demand sectors of the economy have been
witnessing a near 1% rise in energy efficiency, and could register even yet higher increases if
there were substantial investments in infrastructure. A comparative analysis with OECD
countries would reveal, that a rising population and energy supply needs major investments in the
energy which is not the case in OECD. The new infrastructure could be made more efficient and
less carbon intensive, if substantial investments were to be made in the public transport,
A Report On Energy Efficiency And Energy Mix In The Indian Energy System (2030),
Using India Energy Security Scenarios, 2047 20
renewable energy and other forms of low carbon energy supply, namely, bio-fuels and nuclear.
These investments are massive and difficult to source in the present domestic and international
policy framework, but are cost effective. Therefore, the constraints are not of economics, but of
capital requirement. Technology is also expected to play a major role not only in the demand
sectors wherein it could reduce SEC, but also hasten the share of sustainable sources of energy.
At present, such technologies which have been developed in the West, are high priced and have
not been factored in for high levels of penetration. In summation, the above exercise leads us to
believe that India could ramp up to much needed high doses of energy in a more efficient and
cleaner manner, if there was an international effort to help in transformation of the Indian energy
system.