a report from the field - energy
TRANSCRIPT

A Report from the Field:
Implementing Cyber Security Metrics that Work
Rick Grandy & Gregg SereneCyber SecurityMSA/Lockheed Martin

DOE Hanford Site
“To make our customers extraordinarily successful in our unified mission of cleaning up the Hanfordcleaning up the Hanford Site…”
Hanford Site Scope– 586 square miles– 9 000+ PCs9,000+ PCs– 500+ servers– 400+ applications– 1 000+ miles fiber to 300 bldgs1,000+ miles fiber to 300 bldgs– 12,500+ phones
2

Why Metrics?
• How do you know if you’reHow do you know if you re doing well in school?
• How do you know if an athlete is performing well?p g
• How do you know if you’re o do you o you ehealthy?– Weight, Blood Pressure
3

Why Metrics?
• Does a FISMA Score of “A” mean…– The cyber program is more effective?– The cyber program is more efficient?
Th t k i ?– The network is more secure?– The network can withstand APT attacks?
• Cyber tends to be a black hole….– Management & users don’t understand how it
kworks– Visible when cyber puts up road blocks “No”– “No news is good news”No news is good news
4

Our Motivation
• Rick’s the new guyg y– Wanted to get a handle on what was going on– Was used to IT and business process metrics
Wanted data to enable improvement– Wanted data to enable improvement– Wanted to be more transparent with management and
customerC ber is comple let’s not make decisions in a ac m• Cyber is complex, let’s not make decisions in a vacuum
• Let them get more engaged with the program• Helps build relationships
• Not a DOE Order or contract requirement– Proposed to DOE as contract Performance Incentive (PIs)
5

Our Approach
• Keep the metrics meaningful– Tie to cyber program processes– Avoid incentivizing the wrong behavior
• Keep the metrics reproducible– Develop rigorous, objective definitions
Build useful desk procedures/checklists– Build useful desk procedures/checklists
• Keep the metrics manageable– Leverage existing automated sources of data– Make practical decisions to narrow scope as needed
• Provide an increased level of transparency6
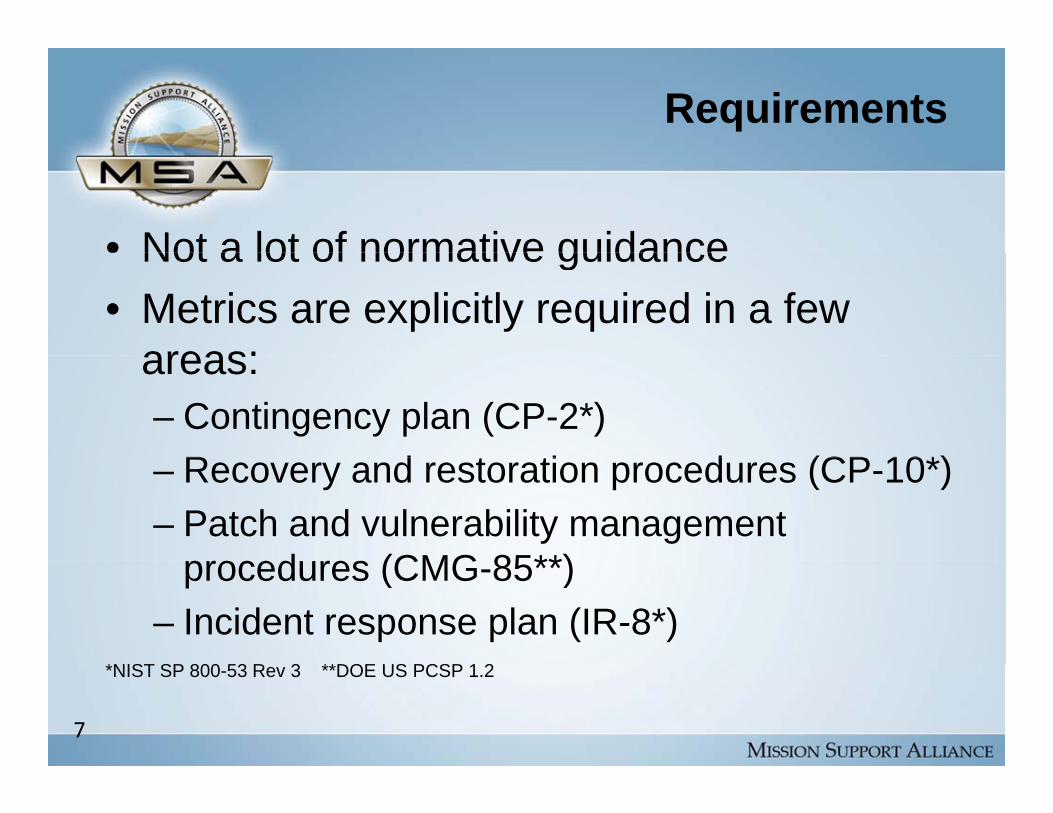
Requirements
• Not a lot of normative guidanceNot a lot of normative guidance• Metrics are explicitly required in a few
areas:areas:– Contingency plan (CP-2*)
R d t ti d (CP 10*)– Recovery and restoration procedures (CP-10*)– Patch and vulnerability management
d (CMG 85**)procedures (CMG-85**)– Incident response plan (IR-8*)
*NIST SP 800-53 Rev 3 **DOE US PCSP 1.2
7

How to Do a Metrics Program
• S Payne “A Guide to Security Metrics”S. Payne, A Guide to Security Metrics• NIST 800-55 Rev 1, Sections 5.0-6.0
NIST 800 100 S ti 7 0 ( i• NIST 800-100, Section 7.0 (summarizes 800-55)
8

Payne: Seven Steps
1. Define the metrics program goal(s) and1. Define the metrics program goal(s) and objectives
2. Decide which metrics to generateg3. Develop strategies for generating the metrics4 Establish benchmarks and targets4. Establish benchmarks and targets5. Determine how the metrics will be reported6 Create an action plan and act on it and6. Create an action plan and act on it, and7. Establish a formal program review/refinement
cyclecycle
9

NIST: Integrated Program
Source: NIST SP 800‐100, Figure 7‐1
10

Collecting and Analyzing Data
Source: NIST SP 800‐100 Figure 7‐2Source: NIST SP 800 100, Figure 7 2
11

The Chicken and the Egg
• Metrics must be focused on specific thingsMetrics must be focused on specific things you want to measure
• You need metrics to know what you need• You need metrics to know what you need to focus on
Problem: You don’t know what you don’t know!
12

Our Situation
• Few specific requirementsFew specific requirements– So it’s mostly up to us
No experience with security metrics• No experience with security metrics– Not sure what the pitfalls will be
• Not much time or money– A “5-year plan” is not an option
13

Our Approach
• Start smallStart small• Use exploratory, iterative approach
L k f ti t l• Look for expertise to rely on
14

CIS Security Metrics
• Well-defined andWell defined and documented
• Reasonably broad in• Reasonably broad in scope (incident, vulnerability patchvulnerability, patch, application, CM, financial)financial)
15

CIS Security Metrics
• Actionable for theActionable, for the most part
• Not too big (20• Not too big (20 metrics)
16

CIS Security Metrics
Function Management Perspective Defined Metrics Incident Management How well do we detect, accurately
identify, handle, and recover from security incidents?
Mean Time to Incident Discovery Number of Incidents Mean Time Between Security Incidents Mean Time to Incident Recovery
Vulnerability Management How well do we manage the exposure of Vulnerability Scanning Coverage the organization to vulnerabilities by identifying and mitigating known vulnerabilities?
Percent of Systems with No Known Severe Vulnerabilities
Mean Time to Mitigate Vulnerabilities Number of Known Vulnerabilities
Patch Management How well are we able to maintain the Patch Policy Compliance gpatch state of our systems?
y p Patch Management Coverage Mean Time to Patch
Application Security Can we rely on the security model of business applications to operate as intended?
Number of Applications Percent of Critical Applications Risk Assessment Coverage g Security Testing Coverage
Configuration Management How do changes to system configurations affect the security of the organization?
Mean Time to Complete Changes Percent of Changes with Security Reviews Percent of Changes with Security Exceptions
Fi i l M t i Wh t i th l l d f di IT S it S di % f IT B d tFinancial Metrics What is the level and purpose of spending on information security?
IT Security Spending as % of IT Budget IT Security Budget Allocation
Source: CIS CMD v1.0.0, p. 2.17

Example CIS Definition
18

Example CIS Definition
19
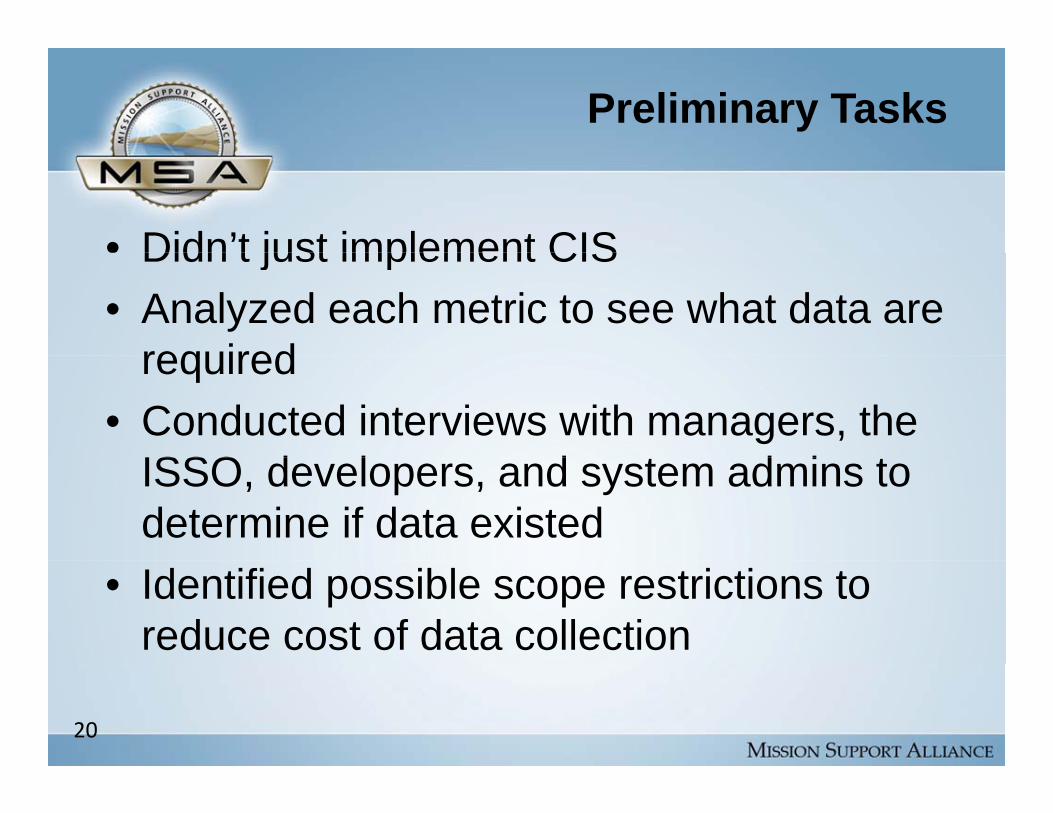
Preliminary Tasks
• Didn’t just implement CISDidn t just implement CIS• Analyzed each metric to see what data are
requiredrequired• Conducted interviews with managers, the
ISSO d l d t d i tISSO, developers, and system admins to determine if data existed
• Identified possible scope restrictions to reduce cost of data collection
20

Preliminary Tasks
• Brainstorming session with security staffBrainstorming session with security staff helped to identify:
What kinds of metrics were perceived as most– What kinds of metrics were perceived as most important
– Existing sources of data we weren’t aware ofExisting sources of data we weren t aware of
21

And Then…
Ultimately someoneUltimately, someone had to decide which metrics we were goingmetrics we were going to use (that would be Rick)Rick).And then we implemented themimplemented them…
22

Implementation
• Used CIS Security Metrics document as aUsed CIS Security Metrics document as a template for creating our own metrics definitionsdefinitions
• Worked with management to identify who would be the point of contact (POC) forwould be the point of contact (POC) for each metricT ht d i i t ti t ff h t ll t• Taught administrative staff how to collect data and create monthly report
23

Implementation
• Met with each metric POC (some multipleMet with each metric POC (some multiple times) and determined how each metric would be calculatedwould be calculated
• Allowed several months of dry runs before delivering reports to customerdelivering reports to customer
• Worked with POCs to develop short desk d f h t iprocedures for each metric
24

CM-1, Number of Devices
• The number of devices that wereThe number of devices that were connected to the HLAN during the reporting period broken down into clientsreporting period, broken down into clients, servers, network devices, and other
• Used as the denominator for VM 1• Used as the denominator for VM-1, Vulnerability Scanning CoverageC t ll i l diffi lt i ti• Conceptually simple, difficult in practice
25

Possible Sources for CM-1
Source LimitationSource Limitation
Network management tools Only track systems being actively managedactively managed
Patch tools Only cover Windows clients and servers
dd l l d d ( ddAddress Resolution Protocol (ARP) tables
Limited data (IP address, hostname, MAC address)
26
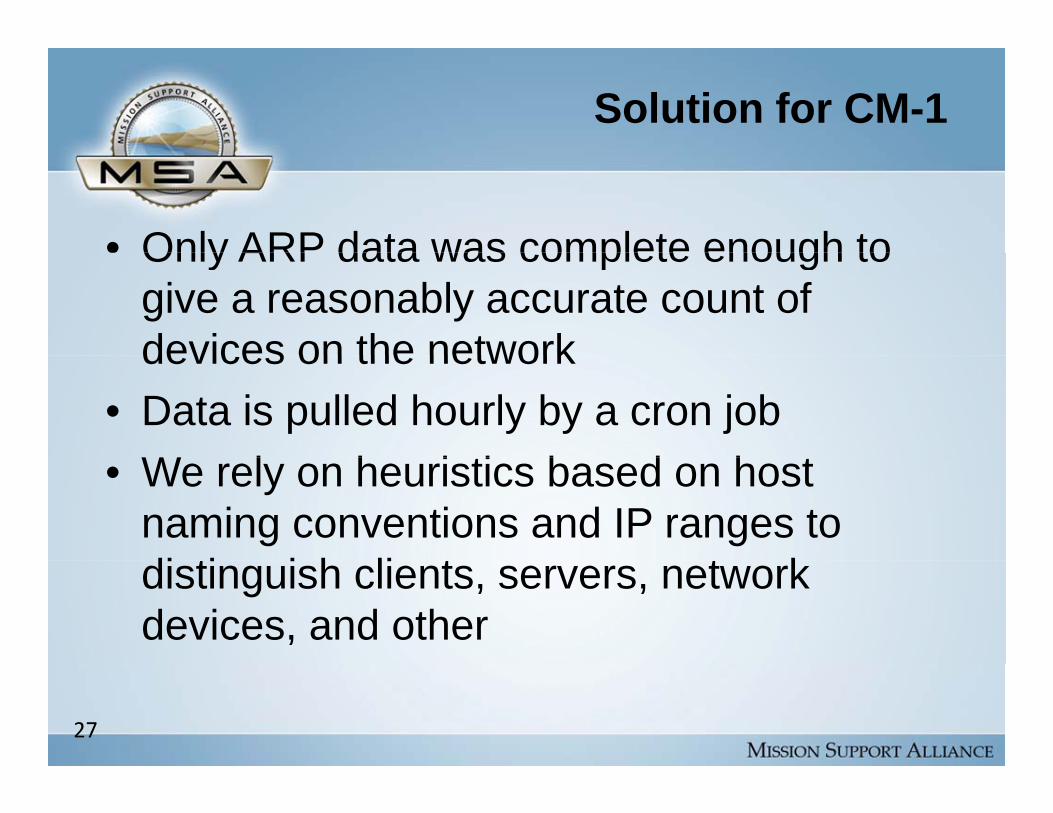
Solution for CM-1
• Only ARP data was complete enough toOnly ARP data was complete enough to give a reasonably accurate count of devices on the networkdevices on the network
• Data is pulled hourly by a cron jobW l h i ti b d h t• We rely on heuristics based on host naming conventions and IP ranges to di ti i h li t t kdistinguish clients, servers, network devices, and other
27

Hanford Cyber Security Metrics
Process Area Defined Metrics
Vulnerability Management VM-1: Vulnerability Scan CoverageVM-2: Percent of Systems Without Known High VulnerabilitiesVM-3: Number of Known Vulnerability Instances (High, Med, Low)
Patch Management PM-1: Mean Time to Patch Covered Systems (Clients, Servers)PM-2: Number of Patches Deployedp y
Configuration Management CM-1: Number of Devices (Clients, Servers, Network, Other)CM-2: Number of Internet Emails (Sent, Received)CM-3: Number of Blocked Internet EmailsCM-4: Number of Blocked Internet Access AttemptsIM-1: Number of Investigative Support Requests
Incident Management
IM-1: Number of Investigative Support RequestsIM-2: Number of IncidentsIM-3: Number of Discovered Malware TypesIM-4: Number of Malware Agents RemediatedIM-5: Number of Compromised ClientsRM 1: Number of Risk Assessments
Risk Management
RM-1: Number of Risk AssessmentsRM-2: List of Risk Assessments Completed (during quarter)RM-3: Number of CIRC AWAREsRM-4: Number of CIRC Bulletins
Awareness and Training AT-1: Number of Awareness Briefings/Communications
Program Management PG-1: Number of POA&Ms (Open, Closed, In Progress)PG-2: List of Audits (YTD with # of Findings, …)PG-3: List of Interconnection Security Agreements
28

Scan Coverage
VM‐1: Vulnerability Scan CoverageVM-1
98
Percent• Measures the % of systems covered by vulnerability scans (Nessus)
80
98
8891• Dependant on CM-1: Number
of Devices
• Never expect to reach 100%• Refresh PCs, laptops on travel, classroom PCs, …)
J F b M A
• Cyber Goal:• Understand the gap between VM-1 & 100%
L k f i t t % Jan Feb Mar Apr• Look for a consistent %

Systems w/out High Vulnerabilities
VM-2 VM‐2: Percent of Systems without• Measures the % of systems without known high vulnerabilities
VM 2: Percent of Systems without Known High Vulnerabilities
Percent
• Ideal would be 100%
•Cyber Goal:
98 98 98 98
• Understand the 2%• Look for a consistent %
Jan Feb Mar Apr

Time to Patch Systems
PM-1 PM‐1: Mean Time to Patch Covered• Measures the time, in hours, to patch covered systems
•Only clients shown here184
PM 1: Mean Time to Patch Covered Systems (Clients)
Hours
• Definition of metric is key to understanding what this really means! 134
173184
169
•Cyber Goal:• Team with IT to reduce the numbernumber• Look for a consistent number
Jan Feb Mar Apr

Number of Devices (Clients)
CM-1 CM‐1: Number of Devices (Clients) • Measures the number of devices on the network
•Only clients shown here8756
8784
Number
• CM-1 is the denominator for VM-1 (scan coverage)
•Cyber Goal:• Understand what’s being counted & and not being counted
82518206
counted• Look for a consistent count
Jan Feb Mar AprJan Feb Mar Apr

Internet Emails
CM-2,3 CM‐2, 3: Number of Internet Emails• Measures the number of Internet emails sent, received and blocked (inbound) 1200
1400
CM 2, 3: Number of Internet Emails
•Cyber Goal: 800
1000
ands
Sent• Look into broad data swings• Understand the security context 400
600Th
ousa
Received
Blocked
context
0
200
Jan Feb Mar Apr

Malware Types
IM-3 IM‐3: Number of Discovered Malware• Measures the number of unique malware types discovered
IM 3: Number of Discovered Malware Types
Number
•Cyber Goal:
43
• Understand the security context
26 26 25
Jan Feb Mar AprJan Feb Mar Apr

Malware Types
IM-4 IM‐4: Number of Malware Agents• Measures the number of unique malware instances remediated
IM 4: Number of Malware Agents Remediated
Number
•Cyber Goal:
814
•Look into broad data swings •Understand the security context
492462
context181
Jan Feb Mar AprJan Feb Mar Apr

Results
• Some I expectedp– Extensive effort for initial implementation, moderate effort to
maintain– Rigorous metric definitions very helpfulRigorous metric definitions very helpful
• Some I didn’t expect– People care about what gets inspected– Increased insight into how the IT and cyber processes work
• “I didn’t know it worked like that”
– Exceeded customer expectations• But created “metrics envy”
36

What’s next?
• Refine the process for regular analysisp g y– Ensure we get value from the data– Requires both Cyber and IT staff
“Remember: Cyber security is a team sport”“Remember: Cyber security is a team sport”
• Tweak the metrics for next yearTweak the metrics for next year
• Looking hard at – Consensus Audit Guidelines (CAG)– Recent OMB Draft/Guidance– Note the shift in orientation from artifact-based compliance toNote the shift in orientation from artifact based compliance to
measurement-based performance37

Contact Info
Rick GrandyRick [email protected] Martin
Gregg [email protected] MartinLockheed Martin
38

References
NIST Special Publications: http://csrc.nist.gov/publications/PubsSPs.html
DOE Office of the Under Secretary of Energy, Program Cyber Security Plan, Ver. 1.2: You probably already have a copy
S P “A G id t S it M t i ” htt // / di / hit /S. Payne, “A Guide to Security Metrics”: http://www.sans.org/reading_room/whitepapers/ auditing/guide-security-metrics_55
Center for Internet Security, “CIS Security Metrics”: http://cisecurity.org/en-us/?route=downloads. browse category metricsbrowse.category.metrics
A. Jaquith, Security Metrics: Replacing Fear, Uncertainty, and Doubt. ISBN 9780321349989.
S B i t “A F G d I f S M t i ” htt // li / ti l /220462/S. Berinato, “A Few Good Info Sec Metrics”: http://www.csoonline.com/article/220462/ A_Few_Good_Information_Security_Metrics
39