a report from katestone environmental - …€¦ · · 2017-01-20the project reports to be...
TRANSCRIPT
Katestone Environmental ABN. 92 097 270 276
REPORT FROM KATESTONE ENVIRONMENTAL TO ALCOA WORLD ALUMINA AUSTRALIA
DESKTOP REVIEW OF THE CSIRO PHASE 1, 2 AND 3A FOR
ASSESSMENT OF THE ALCOA WAGERUP REFINERY EXPANSION
January 2005
Level 10, Toowong Tower, 9 Sherwood Road, PO Box 2184, Toowong, 4066 PHONE (07) 3720 8755 FAX: (07) 3720 8766 website: www.katestone.com.au
E-Mail [email protected]

KATESTONE ENVIRONMENTAL PTY. LTD.
DOCUMENT DETAILS
Job Number: KE0501316 Date: 15/02/05 Title: Desktop Review Of The CSIRO Phase 1,2 And 3a For Assessment Of The Alcoa Wagerup Refinery expansion Client: Alcoa World Alumina Australia
Document reference: Desktop review of CSIRO Phase 1-3 reports.doc Revision No. Prepared by: Reviewed by: Approved by: Date
Draft Christine Killip Peter Best Peter Best 25th Jan 2005
Final Christine Killip David Hannam Christine Killip 15th Feb 2005
Disclaimer This document is intended only for its named addressee and may not be relied upon by any other person. Katestone Environmental Pty Ltd disclaims any and all liability for damages of whatsoever nature to any other party and accepts no responsibility for any damages of whatsoever nature, however caused arising from misapplication or misinterpretation by third parties of the contents of this document. This document has been prepared with all due care and attention by professional scientists and engineers according to accepted practices and techniques. This document is issued in confidence and is relevant only to the issues pertinent to the subject matter contained herein. Katestone Environmental accepts no responsibility for any misuse or application of the material set out in this document for any purpose other than the purpose for which it is provided. Where site inspections, testing or fieldwork have taken place, the report is based on the information made available by the client, their employees, agents or nominees during the visit, visual observations and any subsequent discussions with regulatory authorities. The validity and comprehensiveness of supplied information has not been independently verified except where expressly stated and, for the purposes of this report, it is assumed that the information provided to Katestone Environmental Pty. Ltd. is both complete and accurate. Copyright This document, electronic files or software are the copyright property of Katestone Environmental Pty. Ltd. and the information contained therein is solely for the use of the authorised recipient and may not be used, copied or reproduced in whole or part for any purpose without the prior written authority of Katestone Environmental Pty. Ltd. Katestone Environmental Pty. Ltd. makes no representation, undertakes no duty and accepts no responsibility to any third party who may use or rely upon this document, electronic files or software or the information contained therein. Copyright Katestone Environmental Pty. Ltd.
CONTENTS: 1. Scope of Expert Review.................................................................................................1
2. Background....................................................................................................................2
2.1 Refinery operations and air quality studies........................................................2
3. Key issues in overall assessment ...................................................................................3
4. Model validation ............................................................................................................4
5. Review of reports...........................................................................................................5
5.1 General comments on all reports .......................................................................5
5.2 Phase 1 report – Meteorology ............................................................................7
5.3 Phase 2 report – Dispersion ...............................................................................9
5.4 Phase 3a report – Concentration Modelling for HRA .....................................17
5.5 Summary of review..........................................................................................22
6. Specific expertise of the review team ..........................................................................22
7. References:...................................................................................................................23
15 February 2005 DRAFT Review of CSIRO Phase1-3 reports.doc Katestone Environmental Page i

TABLES: Table 1: Characteristics of key Refinery sources....................................................................18
FIGURES: Figure 1: Source identification using non-parametric regression for Boundary Road and
Upper Dam NOx data ...............................................................................................11
Figure 2: (a) 6 minute NOx recorded at Boundary Road for Refinery sector versus NOx recorded at Upper Dam (b) 6 minute NOx recorded at Upper Dam for Refinery sector versus NOx recorded at Boundary Road........................................................12
Figure 3: NO2/NOx ratio versus NOx concentrations for winds from refinery sector for (a) Boundary Road and (b) Upper Dam.........................................................................13
Figure 4: Comparison of wind roses for concurrent data recorded at (a) RDA and (b) Bancell Road 30m.....................................................................................................15
Figure 5: Analysis of Upper Dam for peak 6 minute verses 1 hour average NOx data for winds from Refinery sector (195-227°) ....................................................................20
Figure 6: Cumulative frequency distribution of measurements of NOx at Upper Dam for winds from the Refinery for hourly and 6 minute averages and for estimated 6 minute averages using exponents of 0.12 and 0.23. .................................................21
15 February 2005 DRAFT Review of CSIRO Phase1-3 reports.doc Katestone Environmental Page ii
Report from Katestone Environmental to Alcoa World Alumina Australia Desktop Review of the CSIRO Phase 1,2 and 3a for Assessment of the Alcoa Wagerup Refinery Expansion 1. Scope of Expert Review
Katestone Environmental has been commissioned by Alcoa to supply independent expert advice, in the form of a desktop review of project studies related to Alcoa’s Wagerup 3 refinery expansion, in order to assist the Emissions and Health Working Group. In addition the desktop review may be used by Alcoa to provide additional information to regulatory agencies and the public. The terms of reference for the desktop review are as follows:
• Comment on the completeness of the information presented; • Comment on the suitability of the measurements performed for assessing the project
impacts; • Comment on the correctness of the analysis performed on the data presented; • Comment on the suitability of methodology used to make predictions. • Comments in relation to conclusions reached in the report being reviewed.
Generally this means that the work presented in the reports will be reviewed to determine if the information is adequate, whether the methodologies used are adequate in determining the impacts on air quality due to the refinery and whether the conclusions drawn from the work are appropriate. This review is not intended as an audit of the provided input information (eg. the completeness of the emissions inventory), an evaluation of the process or technology, or an assessment of the air quality impacts of the project; these tasks are for the governing environmental authorities. This review focuses on the modelling methodology and the conclusions drawn from it. The project reports to be reviewed in this report are: “Meteorological and dispersion Modelling Using TAPM for Wagerup Phase 1: Meteorology” Prepared for Alcoa World Alumina Australia by CSIRO Atmospheric Research, November 2004. – Final report “Meteorological and dispersion Modelling Using TAPM for Wagerup Phase 2: Dispersion” Prepared for Alcoa World Alumina Australia by CSIRO Atmospheric Research, November 2004. – Draft report “Meteorological and dispersion Modelling Using TAPM for Wagerup Phase 3a: HRA (Health Risk Assessment) Concentration Modelling – Current Emissions Scenario” Prepared for Alcoa World Alumina Australia by CSIRO Atmospheric Research, 10 December 2004. – Draft final report Other reports and information have been supplied by Alcoa to help clarify the information in the above reports and plant operations. Monitoring and meteorological data from the Wagerup sites were also supplied. A list of reports used in this assessment is included in the references.
15 February 2005 DRAFT Review of CSIRO Phase1-3 reports.doc Katestone Environmental Page 1

Report from Katestone Environmental to Alcoa World Alumina Australia Desktop Review of the CSIRO Phase 1,2 and 3a for Assessment of the Alcoa Wagerup Refinery Expansion 2. Background
2.1 Refinery operations and air quality studies
Alcoa operates three alumina refineries in Western Australia at Wagerup, Kwinana and Pinjarra. As has happened at other major alumina refineries elsewhere in Australia (e.g. the QAL refinery in Gladstone, the Nabalco refinery in the Northern Territory), the processes involved in producing alumina can readily give rise to significant emissions of dust, odour and gaseous products such as combustion gases in sufficient quantities to generate amenity impacts at local communities and, in some cases, short-term health impacts. The proposed addition of a third unit at Wagerup Refinery and an almost doubling of refinery capacity to 4.7 Mtpa has resulted in a very extensive consideration of the various emission sources within the refinery and their potential impacts on people in the nearby community and for on-site personnel. These investigation programmes have included a number of short-term studies of emission concentrations for the main sources, multiple studies of odour emission characteristics, the conduct of meteorological and air quality monitoring at various locations in the region and short-term studies of upper-level meteorology and tracer gas dispersion (mainly during winter conditions thought to be the most adverse for odour complaints). The current agreed monitoring programme includes the use of a very innovative gas chromatograph to identify continuously the short-term concentrations of key gaseous components and an Opsis monitor to conduct multi-parameter monitoring over long distances (200-400 m) rather than at isolated locations (Environ, 2004). As a result of these studies, Alcoa has embarked upon various programmes to reduce the odour emissions from key sources and to minimise the emissions of nitrogen oxides from power station borders. These programmes constitute a major commitment of resources by Alcoa and have been reviewed for scope and technical approach by various government agencies, including a parliamentary committee. The CSIRO involvement follows previous dispersion and meteorological investigations by SKM Consultants. In addition to synthesizing the information from the various monitoring studies, SKM undertook dispersion modelling using a variety of readily available dispersion models to determine which was likely to give the better description of the processes taking place at the Wagerup Refinery. It was found that the CSIRO TAPM model gave a seemingly better description of extreme events due to stack emissions at 2-3 monitoring locations compared to Calpuff, Ausplume and Dispmod. This report was used by Environ Consultants to define a three stage programme using the TAPM model to produce a “validated” method of predicting the air pollution meteorology at the Wagerup site, checking as much as possible the predictions of the preferred modelling approach against continuous monitoring at two locations and the tracer gas dispersion study. The “validated” model was then to be used to predict the air quality statistics for all key pollutants for the current and expanded plant. The results of these latter Phase 3 components are then to be used in a health risk assessment by others in order to determine whether there is any likelihood of conventional health impacts and to determine whether there are any significant increases due to the expanded plant.
15 February 2005 DRAFT Review of CSIRO Phase1-3 reports.doc Katestone Environmental Page 2
Report from Katestone Environmental to Alcoa World Alumina Australia Desktop Review of the CSIRO Phase 1,2 and 3a for Assessment of the Alcoa Wagerup Refinery Expansion The odour reduction programme undertaken by Alcoa focused on the dramatic reduction of volatile organic emissions from the digestion system and other non-stack sources and a better quantification of the nature of the emitted odour. This ongoing programme and the difficulties in undertaking standardised and repeatable odour measurements in a dynamic environment has resulted in some uncertainty in the odour emission rates and different distributions of the odour emissions between various sources. These odour aspects are important, as the major community concerns have been about odours and their association with temporary health ailments. The work undertaken by CSIRO for the current expansion project used the odour complaints database as a means of verification of the model, but the scope of work for the current TAPM modelling does not include predictions of odour. This is being addressed in other reports. However, it is important to note that due to the limitations of ambient monitoring, a significant number of emissions (mainly VOCs) emitted from the refinery cannot be measured (due to low levels), but are still above odour detection limits. The only long-term ambient monitoring conducted that is useful to model validation is the NOx monitoring at two sites. Nitrogen oxides are not emitted from all sources on the site; in order to adequately assess the skill of a model for predicting impacts for all the pollutants included in the HRA, a full assessment of the odour complaints information is essential. 3. Key issues in overall assessment
For a doubling of capacity of a major industrial facility such as the Wagerup Alumina Refinery, we would expect that the key issues involved in undertaking an assessment of the air quality impact would cover the following questions:
• What are the major sources for ground-level impact of various key compounds at nearby receptors?
• What are the dispersion characteristics and stacktop methodology for these sources? • In the assessment of plume dispersion, are there likely to be any deviations from
straightline trajectories for the important adverse dispersion conditions? • What are the influences of buildings, source structure and plume buoyancy on
dispersion (especially in this case when there are multiflue stacks, multiple stacks and the likelihood of variability on such effects with wind direction)?
• How accurate are the predictions of on-site lower-level meteorology and is there likely to be a sensible extrapolation to stack-top meteorology and boundary layer parameters important for evaluating air quality impacts?
• Can it be verified that the chosen dispersion models, meteorological simulation and chemical transformations have the correct physical and transformal mechanisms to describe the key features of the observed impact?
• Can the uncertainties and potential biases of the simulation schemes be estimated? • Does the performance evaluation undertaken go past simple statistical measures to
ensure good performance for the key concerns in the important adverse dispersion conditions?
• Has there been a consistent use of validated (“models”) noting that in reality there is no such thing as a properly validated model, even if ground-level pollution monitoring had been very extensive as in some very extensive past American and European monitoring exercises?
15 February 2005 DRAFT Review of CSIRO Phase1-3 reports.doc Katestone Environmental Page 3

Report from Katestone Environmental to Alcoa World Alumina Australia Desktop Review of the CSIRO Phase 1,2 and 3a for Assessment of the Alcoa Wagerup Refinery Expansion With the above preliminary evaluation and the characteristics of each source, some questions can be formulated as to what aspects should be well treated by a meteorological and air quality simulator. The plume heights range between 26 m for the Tank Vent and 240 m for the Calciner Multiflue for 10 m winds of 3 m/s. Due to the significant volume of air from the larger cooling towers they have relatively high plume heights. The plumes from the calciner and power station multiflues and from the gas turbine and some cooling towers are likely to have a significant plume rise for full load operation under most stacktop exit conditions. In light winds, the multiflue plumes will rise to 200 m or more above ground-level. To result in significant ground-level impacts, it is likely that the significant vertical downwind movement that occurs in moderate to strong convection will be required (at least for repeated groundings over a multi-hour period). This plume grounding can occur in a variety of conditions and be relatively independent of the height of the boundary layer. In contrast, it would be expected that in the early to mid morning, brief but relatively intense groundings of the plume can occur as the solar-induced heating of the ground gives rise to convective turbulence that begins to reach the height of the various elevated plumes. Unfortunately, the accurate prediction of morning fumigation requires a full and relatively precise determination of the boundary layer height and characteristics and the resulting plume rise. It is quite easy to predict incorrectly the height and duration of morning fumigation (as is seen in several of the CSIRO figures). In these and the more unusual cases of wind-shear dominated convective dispersion, the power of a good meteorological simulator (such as TAPM) should be such as to improve descriptions from conventional simpler dispersion schemes. For impact at nearby communities, it is important to determine the degree of plume overlap, to forecast adequately the direction of plume travel and to also ensure that there are few predictions of significant impact for atmospheric conditions known not to give rise to concentrations at the representative monitoring stations. We believe it is of key importance to determine the conditions for significant exposure at communities (e.g. peak short-term concentrations for odour, daily and annual averages for the health risk assessment). Armed with such knowledge the evaluation of the expansion can then proceed by looking at how much the emission rates and characteristics are likely to be changed in an expansion and how best to treat any new stacks or sources. A few preliminary remarks on the possible ‘validation’ of a model may assist in suggesting the level of critical review that is currently practical for meteorological and dispersion simulation. 4. Model validation
Models such as TAPM take the measured surface and upper-level meteorology at the regional airport sites as inputs to the simulation techniques. The general philosophy is that a suitable set of governing equations of motion together with an adequate description of topography and land-use should facilitate the simulation of near-surface flows and dispersion at points remote from the measurement sites. The model should give an appreciable level of additional skill in the prediction of conditions at these sites, presumably much more than any more heuristic approaches (such as diagnostic approaches) using the available measurements. The model should be expected to produce the main regional and local flow circulations, at least at locations that are well outside any disturbed zones caused by terrain-induced turbulence or away from locations for which the roughness lengths are quite different than assumed in the land-use classification adopted in the modelling.
15 February 2005 DRAFT Review of CSIRO Phase1-3 reports.doc Katestone Environmental Page 4
Report from Katestone Environmental to Alcoa World Alumina Australia Desktop Review of the CSIRO Phase 1,2 and 3a for Assessment of the Alcoa Wagerup Refinery Expansion TAPM like other models cannot hope to deal with the full range of conditions and locations experienced in the real world. The model has to find a compromise in use and parameterisation of the important processes at various scales. It is very difficult to simulate well at the neighbourhood scale (e.g. at a resolution of 1 km or less) without returning to a very much more detailed description of the energy and exchange processes and a fuller understanding of internal boundary layer dynamics. Recent work on neighbourhood scale models (e.g. Models-3 developments, the latest versions of MM5) have suggested that a better parameterisation is required to get a good simulation of near-surface flows, even at rural sites. Much of this work is based on Australian studies of the influences of vegetation and urban canopies. Model performance indices are useful to evaluate the sensitivities of a given model for a stated location/region to changes in model inputs and parameters. They are also (and probably more useful) in comparing the performance of totally different models at a given location. They are rarely useful for comparing performance in different regions or for different purposes. Any quantitative measures should be used as a supplement to detailed graphical representations, as measures can be similar for quite different model performance, in many situations. Model “validation” exercises can rarely do more than demonstrate that the preferred model is fit for the task, to a given level of satisfaction or application. The exercise should be as much about determining where the model fails as much as where it succeeds. It is important to know what model artefacts there are and whether in some situations the model biases may be important. It is laudable that CSIRO has tested out the TAPM scheme against many data sets and that many other researchers and consultants throughout Australia and many other countries have used the model. The results are quite mixed although TAPM appears to be more useful than many comparable models. It has been recognised by the developers that there are circumstances in which the model over-predicts surface wind speeds and may have problems with dispersion in complex terrain. Indeed, such comparisons tend to return the spotlight to the use of surface measurements to characterise what is happening at the neighbourhood scale. We note that these subjects are the focus of much recent research. We point out that any model or measurement process has associated errors for which it is important to estimate the likely influence on the conclusion of a given study. 5. Review of reports
5.1 General comments on all reports
One issue that has made this review quite difficult is the lack of knowledge of the impact of some of the model uncertainties on the overall outcomes of the study. The results presented in the Phase 3a report are simply a list of concentrations predicted at a range of receptor locations for a large set of pollutants. The results are not compared to any ambient air quality guidelines (we believe this is being done in a subsequent report) and the results of the HRA have not been finalised when this review was undertaken. We have tried to concentrate the review on what is important for a HRA; without knowing if the risk levels predicted are well below acceptable levels or close to the recommended acceptable level, our task has been
15 February 2005 DRAFT Review of CSIRO Phase1-3 reports.doc Katestone Environmental Page 5
Report from Katestone Environmental to Alcoa World Alumina Australia Desktop Review of the CSIRO Phase 1,2 and 3a for Assessment of the Alcoa Wagerup Refinery Expansion made more difficult. For this reason we have tended to be conservative and have identified any issues that we believe would be important if the predicted levels resulted in a risk close to the recommended level. Work continuity The process of splitting up the work into three distinctly separate reports is generally a good idea as it means that one aspect can be agreed upon before the next stage of work is undertaken. However, it is important that the key findings or issues identified in each report are considered when the next stage of work is undertaken. Each of the CSIRO reports was kept very separate and key issues were not transferred into the next stage of work. Specifically:
• The issue of over-predicted wind speed by TAPM needed to be shown not to adversely impact on the dispersion of plumes in the validation of air quality impacts.
• Differences in the wind direction distribution predicted by TAPM needed to be shown not to adversely impact on ground level concentrations (particularly annual averages) in the validation of air quality impacts.
• The input requirements for the HRA (i.e. short-term maximum and annual average concentrations) should be addressed in the dispersion validation report.
• The final “verified” version/setup of TAPM identified in the dispersion validation report should then be used for the HRA concentration modelling.
• These issues will be addressed in more detail in the following sections. Selection of modelled year and inter-annual variability The modelling was conducted for the period April 2003 – March 2004. This period was selected for the validation process to allow comparison with the best available information on ambient air quality and meteorology. The CSIRO Air Quality Review (CSIRO, May 2004) noted “the variability in the meteorology could be a factor in year-to-year changes in (increases or decreases) in the frequency of odour complaints from a particular site”. The selection of the period for modelling as input into the HRA was not determined based on the “worst year” or “best year” of meteorological conditions conducive to pollution events. If inter-annual variability is an important factor in the region, this needs to be taken into account in the HRA. Recent modelling undertaken by Katestone for a Nickel refinery in New Caledonia indicated significant variability in modelling results depending on the chosen year (six years were modelled). Some locations received a two-fold increase in annual concentrations, while other areas went from no exceedances of a concentration threshold to over 20 events. Recommendation: Assessment of the impact of inter-annual variability in meteorological conditions on ground-level concentrations (and HRA outcomes) should be considered.
15 February 2005 DRAFT Review of CSIRO Phase1-3 reports.doc Katestone Environmental Page 6

Report from Katestone Environmental to Alcoa World Alumina Australia Desktop Review of the CSIRO Phase 1,2 and 3a for Assessment of the Alcoa Wagerup Refinery Expansion 5.2 Phase 1 report – Meteorology
The objective of the Phase 1 report was: “To evaluate the capability of TAPM (version 2.6) with a detailed Wagerup specific land-use specification to acceptably produce hourly-averaged meteorological predictions matching available field observations in the Wagerup region, especially under a range of conditions that include both light and moderate wind speeds”. The Phase 1 report has been reviewed in light of the above objective and keeping in mind that it is to be used to predict the dispersion of pollutants from the refinery for use in a Health Risk Assessment. For dispersion modelling the key meteorological parameters that are important to predict well are the wind speed and boundary layer structure. Wind speed governs the rate of dispersion and boundary layer structure (which can in its simplest form can be thought of as the temperature of the air at various heights above the ground) governs the height over which the plumes can mix. These parameters can be combined together into classes known as atmospheric stability. A plume will disperse differently for each stability class. Predictions of surface winds The model’s performance at Bancell Road station for wind speed is poor. From inspection of the scatter plots (CSIRO 2004b, Figure 10) it can be seen that for some events with measured wind speeds below 5 m/s, TAPM is predicting 10-20 m/s (ten times higher in some instances). The stronger winds are predicted from the east (which is the dominant wind direction for measured strong winds) mainly during the nighttime. The scatter plots show a paired comparison; that is, the predictions are compared with the measurements for the same hour. An unpaired comparison is presented as a frequency distribution (e.g. CSIRO 2004b Figure 12). On inspection of the frequency of wind speed, the model under-predicts the frequency of light to moderate winds by 30% (65% of observed winds are less then 5 m/s, TAPM predicts only 44%) and winds less than 2 m/s (light winds) by 50%. TAPM underestimates the frequency of the northerly winds by 50%. Although the index of agreement (IOA) for the nighttime wind speed at Bancell Road at 30 m is above 0.64 (within acceptable range), the predicted mean wind speed is over 160% of the observed measurements. The winter period is important for transport of emissions from the refinery to the closest town of Yarloop during stable to neutral conditions and light to moderate northerly winds (SKM, 2002). The model significantly under-predicts the frequency of light to moderate winds (<5 m/s) with observations below this value for approximately 60% of the time and TAPM predictions only 40% for the winter period. The frequency of predicted winds from the northerly sector is less than half the observed. The frequency of light to moderate winds from the northerly sector has not been reported.
15 February 2005 DRAFT Review of CSIRO Phase1-3 reports.doc Katestone Environmental Page 7
Report from Katestone Environmental to Alcoa World Alumina Australia Desktop Review of the CSIRO Phase 1,2 and 3a for Assessment of the Alcoa Wagerup Refinery Expansion Based on the frequency of odour complaints, the most critical time for odour impacts in Yarloop is daytime and particularly the morning period from 8 am to 11 am. The model performs considerably better during the daytime with good agreement between the observed and predicted frequency distributions but still a low agreement for paired comparison of observations with predictions (r = 0.52). The significance of the models under-prediction of northerly winds or wind speeds during winter has not been reflected in the dispersion modelling outcomes. The lack of winds predicted in the critical range (e.g. light to moderate from the north) for Yarloop could result in an under-prediction in the frequency of short-term events and a lower annual average. This would result in a lower risk rating in the HRA. Although this may not be a significant issue, say if the HRA showed very low risk (note that this review has been completed before the results of the HRA were available), the significance has not been investigated. The model predictions are worse for the 10 m winds at Bancell Road compared to the 30 m measurements, with the IOA below 0.5; most of the error is in the east-west component of the winds. The model’s performance at the RDA monitoring station is much better than that at Bancell Road. The sensitivities of the model’s performance to the detailed Wagerup-specific land-use database (and surface roughness), refinery generated surface heat flux or deep-soil volumetric moisture content does not account for the large differences between the modelled meteorology and observations. This would indicate that an outcome from one of the objectives of the study (to evaluate the capability of TAPM under light and moderate winds) is the inability of the TAPM model to adequately predict light to moderate winds at Bancell Road. CSIRO speculate that this discrepancy between the observed and predicted wind speed and direction could be a result of terrain resolution or errors in the synoptic analyses (the input meteorological information initialising the model). It would be helpful if these avenues were fully investigated to determine if they are indeed the cause of the model discrepancy. The model error is also thought to be due to the model probably not predicting effects due to the Darling escarpment as TAPM cannot resolve such processes as leeward and windward eddies which may be associated with flows over the escarpment. This could justify the difference in predicted and observed easterly winds, but, as there are no major communities to the west of the Refinery, it may not be a significant issue. However, the model errors for conditions suitable for transport to the populated areas should be explained and quantified. Recommendation: The model under-predictions of the frequency of light to moderate wind speeds and the frequency of winds in the northerly sector during the time of maximum odour complaints (8 – 11 am) should be investigated and their significance on predicted HRA concentrations presented.
15 February 2005 DRAFT Review of CSIRO Phase1-3 reports.doc Katestone Environmental Page 8
Report from Katestone Environmental to Alcoa World Alumina Australia Desktop Review of the CSIRO Phase 1,2 and 3a for Assessment of the Alcoa Wagerup Refinery Expansion Boundary-layer profiles A comparison of the modelled profiles with measured radiosonde data was undertaken for the results from a short field study conducted during July 2003. Some of the radiosonde measurements show very light winds well above stack top height, and elevated temperature inversions at heights that would impact on the dispersion of plumes from the Refinery. TAPM does not resolve many of these characteristics. No conclusions have been made by CSIRO as to the impact on dispersion modelling results due to the model discrepancies and if they are significant. Conclusions and acceptability of model predictions Section 10 of the CSIRO 2004b report presents a summary of one performance measure (the index of agreement) from other modelling studies undertaken using either TAPM or other similar prognostic models. It is not particularly relevant to compare the model’s performance at Wagerup with studies undertaken in far more complex meteorological situations, such as Hong Kong, where the coastal environment and mountainous terrain would prove a challenge to most models or for 3-day field studies rather than annual statistics. The conclusions presented in the CSIRO report do not indicate if the key component of the project objective was met, i.e. did TAPM acceptably simulate meteorological conditions in the Wagerup region, particularly for light to moderate winds. It is inferred that, because it is comparable (if not slightly worse for wind speed) to the model’s performance elsewhere, it is acceptable. Whilst it is understood that a model can only be a representation of the true physics of the atmosphere and that errors and uncertainties are common features of modelling, it needs to be proven that the model is adequate for the purpose of this study, i.e. the prediction of the impacts due to stack sources at the Refinery at a range of locations, for a range of meteorological conditions causing complaints and the estimation of short-term and long-term average exposure statistics (for current and future emission scenarios) as input into a Health Risk Assessment. Recommendation: To increase peer acceptance of the project modelling, further investigations are necessary to identify the significance of the predicted errors in the meteorology, particularly in light to moderate winds, for the dispersion of the refinery plumes. 5.3 Phase 2 report – Dispersion
The objective of the Phase 2 report was: “Based on acceptable performance of the model compared to observed meteorology (in Phase 1), to then use TAPM (version 2.6) and a database of emissions from the Wagerup Refinery to model hourly-averaged ambient air concentrations of pollutants for appropriate periods and compare them with observations. Identify dominant pathways for the transport of the refinery emissions to the ground level in the surrounding district.”
15 February 2005 DRAFT Review of CSIRO Phase1-3 reports.doc Katestone Environmental Page 9
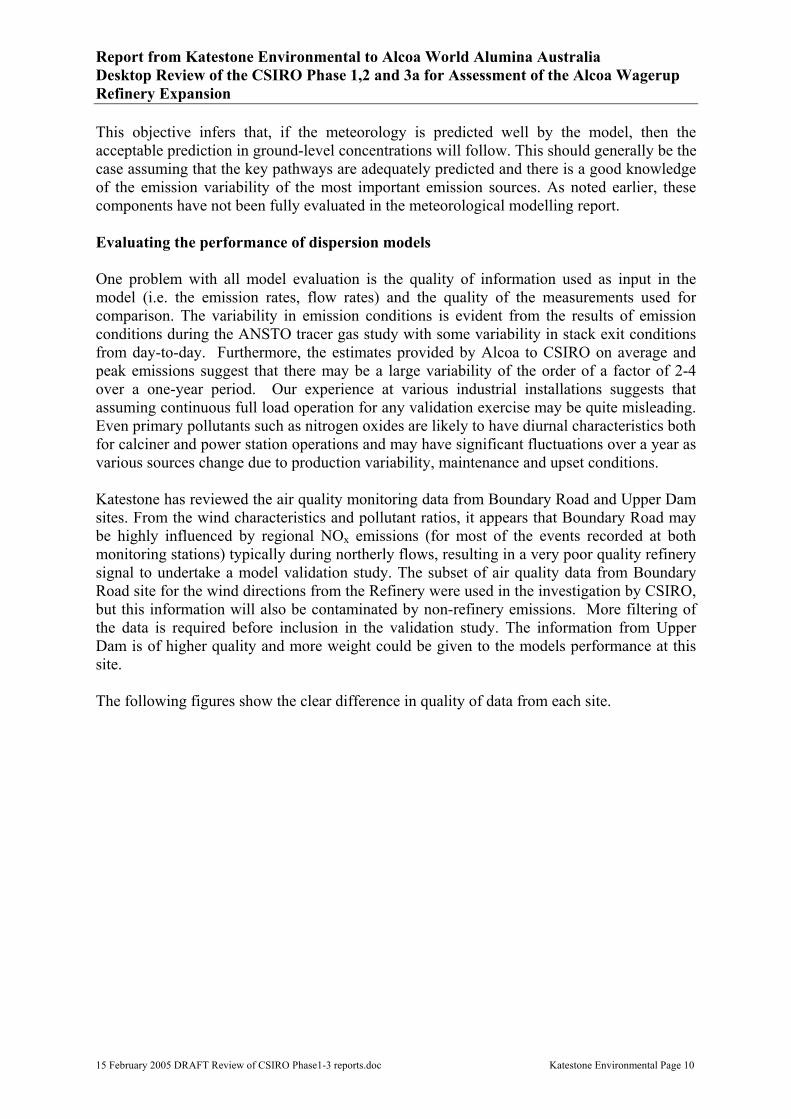
Report from Katestone Environmental to Alcoa World Alumina Australia Desktop Review of the CSIRO Phase 1,2 and 3a for Assessment of the Alcoa Wagerup Refinery Expansion This objective infers that, if the meteorology is predicted well by the model, then the acceptable prediction in ground-level concentrations will follow. This should generally be the case assuming that the key pathways are adequately predicted and there is a good knowledge of the emission variability of the most important emission sources. As noted earlier, these components have not been fully evaluated in the meteorological modelling report. Evaluating the performance of dispersion models One problem with all model evaluation is the quality of information used as input in the model (i.e. the emission rates, flow rates) and the quality of the measurements used for comparison. The variability in emission conditions is evident from the results of emission conditions during the ANSTO tracer gas study with some variability in stack exit conditions from day-to-day. Furthermore, the estimates provided by Alcoa to CSIRO on average and peak emissions suggest that there may be a large variability of the order of a factor of 2-4 over a one-year period. Our experience at various industrial installations suggests that assuming continuous full load operation for any validation exercise may be quite misleading. Even primary pollutants such as nitrogen oxides are likely to have diurnal characteristics both for calciner and power station operations and may have significant fluctuations over a year as various sources change due to production variability, maintenance and upset conditions. Katestone has reviewed the air quality monitoring data from Boundary Road and Upper Dam sites. From the wind characteristics and pollutant ratios, it appears that Boundary Road may be highly influenced by regional NOx emissions (for most of the events recorded at both monitoring stations) typically during northerly flows, resulting in a very poor quality refinery signal to undertake a model validation study. The subset of air quality data from Boundary Road site for the wind directions from the Refinery were used in the investigation by CSIRO, but this information will also be contaminated by non-refinery emissions. More filtering of the data is required before inclusion in the validation study. The information from Upper Dam is of higher quality and more weight could be given to the models performance at this site. The following figures show the clear difference in quality of data from each site.
15 February 2005 DRAFT Review of CSIRO Phase1-3 reports.doc Katestone Environmental Page 10
Report from Katestone Environmental to Alcoa World Alumina Australia Desktop Review of the CSIRO Phase 1,2 and 3a for Assessment of the Alcoa Wagerup Refinery Expansion Figure 1: Source identification using non-parametric regression for Boundary Road
and Upper Dam NOx data
Boundary Road
0
0.2
0.4
0.6
0.8
1
1.2
0 45 90 135 180 225 270 315 360
Wind direction
Nor
mal
ised
NO
x co
ncen
trat
ion
rela
tive
to p
eak
30m winds Bancell Road 10m winds Bancell Road
Less clear Refinery peak from 352 - 27 degrees
Upper Dam
0
0.2
0.4
0.6
0.8
1
1.2
0 45 90 135 180 225 270 315 360
Wind direction
Nor
mal
ised
NO
x co
ncen
trat
ion
rela
tive
to p
eak
30 m winds Bancell Road 10m winds Bancell Road
Clear Refinery peak from 195 - 227 degrees
15 February 2005 DRAFT Review of CSIRO Phase1-3 reports.doc Katestone Environmental Page 11

Report from Katestone Environmental to Alcoa World Alumina Australia Desktop Review of the CSIRO Phase 1,2 and 3a for Assessment of the Alcoa Wagerup Refinery Expansion
Figure 2: (a) 6 minute NOx recorded at Boundary Road for Refinery sector versus NOx recorded at Upper Dam (b) 6 minute NOx recorded at Upper Dam for Refinery sector versus NOx recorded at Boundary Road
(a) Boundary Road
(b) Upper Dam
15 February 2005 DRAFT Review of CSIRO Phase1-3 reports.doc Katestone Environmental Page 12
Report from Katestone Environmental to Alcoa World Alumina Australia Desktop Review of the CSIRO Phase 1,2 and 3a for Assessment of the Alcoa Wagerup Refinery Expansion
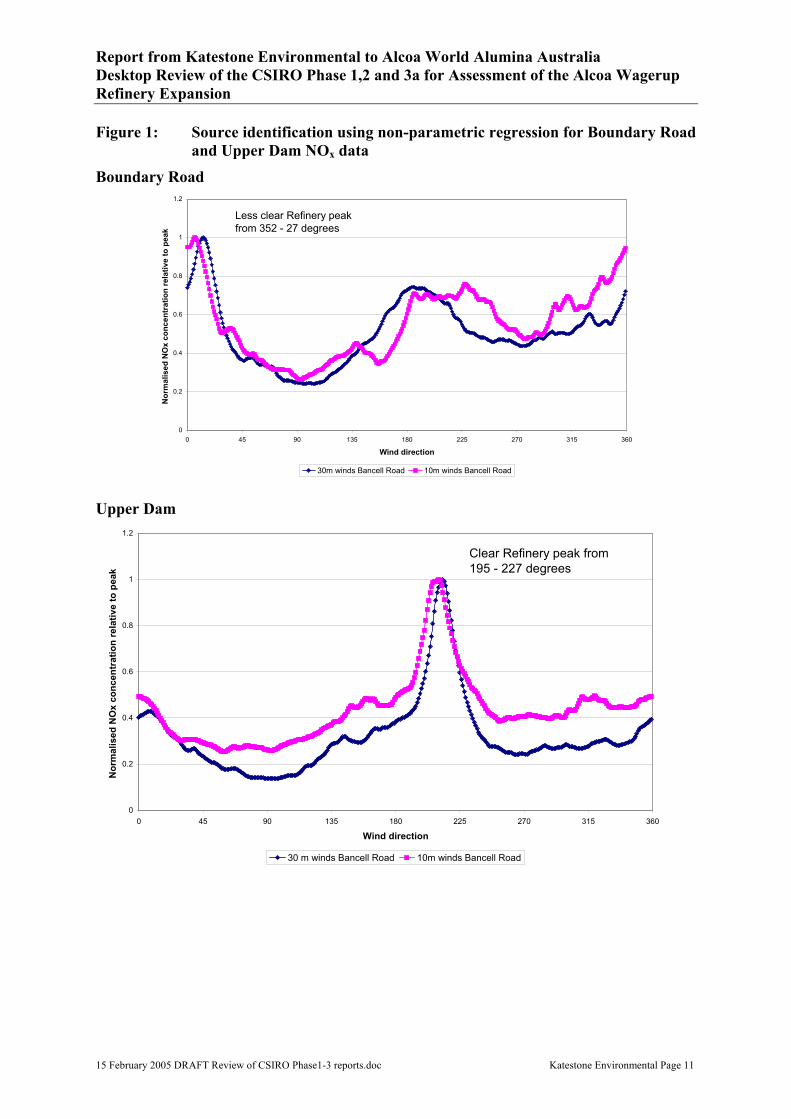
Figure 3: NO2/NOx ratio versus NOx concentrations for winds from refinery sector for (a) Boundary Road and (b) Upper Dam
(a)
(b)
15 February 2005 DRAFT Review of CSIRO Phase1-3 reports.doc Katestone Environmental Page 13

Report from Katestone Environmental to Alcoa World Alumina Australia Desktop Review of the CSIRO Phase 1,2 and 3a for Assessment of the Alcoa Wagerup Refinery Expansion Figure 1 shows that there is a clear refinery signal in the Upper Dam site data but a variety of possible sources for the other site. Figure 2 suggests that there are many instances of concurrent events at both sites, suggesting a regional, rather than refinery source. The ratios of nitrogen dixoide to total nitrogen oxides for the refinery sources are expected to be around 0.1 at stack exit and 0.2 - 0.3 within the first 3 kilometres or so from the relevant sources. Figure 3 then shows that there is an obvious refinery source for the Upper Dam data but other sources are important for some of the moderate-size events. These results suggest that a very careful culling of events is required in any model validation study for the area. The Upper Dam site is obviously the preferred choice for the use of nitrogen oxide information. Having chosen the reliable subset for a refinery signal in the concentration records, it is necessary to select appropriate performance measures. Q-Q plots, as used in the CSIRO reports, are one of the standard methods for evaluating model performance, but in recent years (e.g. Cooper 1999) several authors have recommended that models should be tested on more than just the overall frequency distribution. Olesen (2001) notes that a model evaluation is not complete without diagnostic studies, attempting to ensure that the model gives the right result for the right reason. Willmott (1981) in introducing the index of agreement to compare the overall performance of different models in physical geography noted that a full use of graphical techniques should complement the use of a range of single measures. A framework for testing dispersion model performance has been documented in the Standard Guide for Evaluation of Atmospheric Dispersion Model Performance (ASTM, 2000). This uses various techniques, including Q-Q plots, but on various sub-sets of data for each comparison to ensure that the same meteorological conditions are grouped together and the model tested for each group or regime. In this fashion, the biases of any model can be determined so that the relative degree of confidence of model predictions in different circumstances can be delineated. The modelling results presented in the CSIRO report also show the importance of grouping data. Figure 12, which shows the Q-Q plots for Upper Dam site for winter, summer and nighttime and daytime, can be compared with Figure 8 (the Q-Q plot for all hours). The seemingly very good agreement of the predicted frequency distribution with the observations on an all hours basis is much less impressive when broken down into an under-prediction during winter, over-prediction during summer, over-prediction during the daytime and under-prediction during nighttime. Recommendation: Using techniques described in ASTM (2000), test the model’s performance for key meteorological regimes, particularly those important to the transport of emissions to sensitive residential areas. A key feature that was not predicted by the TAPM meteorological simulations was the frequency of northerly winds. With the addition of data assimilation this is overcome and events are more frequently predicted at Boundary Road. The model run with data assimilation also proves to be the better choice for the Upper Dam site. The CSIRO authors conclude that data assimilation improves the model’s performance at both of the monitoring stations. The subsequent decision to leave out assimilation in the final concentration predictions in the
15 February 2005 DRAFT Review of CSIRO Phase1-3 reports.doc Katestone Environmental Page 14

Report from Katestone Environmental to Alcoa World Alumina Australia Desktop Review of the CSIRO Phase 1,2 and 3a for Assessment of the Alcoa Wagerup Refinery Expansion Phase 3a modelling needs more justification than currently presented. If it is not appropriate to use data assimilation with a radius of influence that covers areas of different meteorological conditions, why was it tested in the Phase 2 report? From inspection of the wind roses in Figure 4 for the RDA and Bancell Road sites the overall distribution of winds is comparable at both sites. Again we recommend that the final configuration used in the modelling for the HRA needs to be the configuration of the model tested and shown to be the most appropriate in the Phase 2 report and the use of data assimilation using the 30 m wind data from Bancell Road is recommended. The CSIRO report also evaluates the performance against information from the RDA site to the west of the refinery. The meteorological monitoring data recorded at RDA site may be invalid or contains errors as there are few winds from the north-north west or northerly sectors. The figures below show the wind roses for RDA and 30 m winds at Bancell road site for the period of concurrent data (December 2003 to April 2004).
Figure 4: Comparison of wind roses for concurrent data recorded at (a) RDA and (b) Bancell Road 30m
(a)
(b)
15 February 2005 DRAFT Review of CSIRO Phase1-3 reports.doc Katestone Environmental Page 15

Report from Katestone Environmental to Alcoa World Alumina Australia Desktop Review of the CSIRO Phase 1,2 and 3a for Assessment of the Alcoa Wagerup Refinery Expansion Buoyancy enhancement The model comparisons presented in the majority of the Phase 2 report are without the use of combined plumes and the effects of buoyancy enhancement. As shown in the Phase 3a report (Section 4.4), the effect of buoyancy enhancement on ground-level concentrations is significant (almost a factor of 2 in some locations). In the multi-flue configuration the flues have a radius in the range 0.95 - 1.2 m and are separated by only a few metres. Available experience suggests that, for full capacity operations, these plumes are likely to merge quickly and the final plume rise is likely to be very similar to the case where all the evaluations were emitted from a single stack. Various studies using computational fluid dynamics approaches e.g. the work of Brown and Fletcher (2003) have suggested that the multiflue stacks can on occasions have some aerodynamic impact on the behaviour of the plumes. We suspect that the observations by Pitts, cited in the CSIRO report, that plume separation does indeed occur may be a result of an uneven distribution of volume flows during less than full capacity operation. We would expect that the plumes from the flues of the multiflue stacks will merge quickly for most conditions and that modelling the flues as one stack would result in a reasonably realistic representation of the plume buoyancy. The practice of combining closely located flues into a single “effective stack” is common practice. However, as buoyancy enhancement is to be used in the Phase 3a modelling, it should have been tested in the model verification study. Recommendation: Test the model’s performance at Upper Dam using buoyancy enhancement for the multiflue stacks, as used in the Phase 3a modelling. Advice from Alcoa while completing this review is that this issue is currently being addressed. Tracer gas study The tracer gas study comparisons do include modelling with a buoyancy enhancement (but with different combinations to those used in the Phase 3a report), making difficult any comparison of the model performance for both situations. This is also compounded by the lack of consistent meteorological data for assimilation (30 m tower was not yet installed). It is interesting to note that, for the tracer gas study, the contributions from the various individual plumes to ground-level concentrations have been assessed. This type of information would be useful when analysing the models performance at Upper Dam, as it is likely to show that the model performance varies depending on the source. From Figure 19 it can be seen that the model under-predicts the impacts due to the calciner multiflue with buoyancy enhancement but the boiler multiflue is slightly over-predicted. The Calciner 4 is a much lower plume and stack than the other two sources and its impact is also over-predicted for the most part, except for the top two concentrations.
15 February 2005 DRAFT Review of CSIRO Phase1-3 reports.doc Katestone Environmental Page 16
Report from Katestone Environmental to Alcoa World Alumina Australia Desktop Review of the CSIRO Phase 1,2 and 3a for Assessment of the Alcoa Wagerup Refinery Expansion Key pathways Extensive experience by many researchers in Australia and elsewhere for the near-coastal location (including in a Mediterranean climate with high solar insulation in summer such as at Wagerup) would suggest that high ground-level concentrations from moderate sized industrial stacks with reasonable buoyancy can be expected in the following conditions:
• Morning fumigation. • Convection in a relatively shallow boundary layer prior to the arrival of any
seabreeze. • Convection within the seabreeze. • Transition events with wind shear effects can be important. • Unusual nighttime events (either due to high windspeeds, the presence of building
wakes or with low production capacities in a shallow nocturnal boundary layer). The seabreeze was not identified by CSIRO as an important factor governing the dispersion of plumes within the Wagerup area, presumably because attention was focused on impacts in the township of Yarloop, which is not upwind of the Refinery during seabreeze conditions (typically south-westerly winds). Section 6 in the CSIRO report is well presented and possibly the most important section in all of the reports. The following comments may add to the conclusions drawn from this section of work:
• Is it possible to compare the actual number of odour complaints with predicted number of impacts from the model?
• How does the frequency of occurrence of model events look if a higher threshold value was chosen?
• From an inspection of the measured meteorological data during the time of the events for the evening peak (6-9pm), what is the cause of these events and why does the model not predict them?
• The wind speed range identified by the TAPM modelling as resulting in the most frequent cause of odour events is 2-6 m/s. This was also found in other studies (SKM 2002) as the most important wind speed range. How will the model’s significant under-prediction of winds in this range impact on the results?
5.4 Phase 3a report – Concentration Modelling for HRA
The Phase 3 report had the objective to: “to run TAPM with Wagerup specified input for four scenarios of emissions(current-average, current-Peak, expanded – average, expanded-peak) for agreed sources to produce selected concentration statistics at receptor points for input in to the HRA and the Public Environmental Review Document. Investigate the temporal variation of concentrations around, and mechanism causing the modelled short-term peak concentrations.”
15 February 2005 DRAFT Review of CSIRO Phase1-3 reports.doc Katestone Environmental Page 17

Report from Katestone Environmental to Alcoa World Alumina Australia Desktop Review of the CSIRO Phase 1,2 and 3a for Assessment of the Alcoa Wagerup Refinery Expansion Issues identified earlier in this review about the suitability of the actual configuration used in this final modelling stage will not be reiterated here, but they are very important and should be addressed before the reports are finalised. Additional sources that have not been modelled as yet are included in this stage of work, such as the cooling towers and various vent sources. Most of these sources are low-level sources with low buoyancy and minimal plume rise. The performance of TAPM in modelling these types of sources has not been stated. To help identify the key pollutants for a HRA for a refinery sources, the HRA undertaken for the Pinjarra upgrade was reviewed (Toxikos, 2003). For the acute hazard (i.e. short-term impacts) nitrogen dioxide was identified as the most dominant species, followed by mercury, arsenic, PM2.5 and formaldehyde. For the chronic hazard (long-term impacts) nitrogen dioxide was the dominant species followed by manganese and compounds, PM2.5, acetaldehyde and nickel and compounds. From an inspection of the emission rates presented in Table 2 in the CSIRO Phase 3a report the dominant sources can be identified as:
• Nitrogen dioxide (acute and chronic) – Boilers and gas turbine. • Mercury (acute) – Boiler 2/3 (Non-con), cooling lake, liquor burner and 25A vent. • Arsenic (acute) – Liquor burner. • PM2.5 (acute and chronic) – Calciners (note: only dust emissions reported in CSIRO
report). • Formaldehyde (acute) – Calciners and cooling towers. • Manganese and compounds (chronic) – Boilers and 25A vent. • Acetaldehyde (chronic) – Calciners and cooling towers. • Nickel and compounds (chronic) – Boiler 2/3 (Non-con) and 25A vent.
This implies that it is very important to model the plumes from the two multi-flue stack correctly and the difference of a factor of almost two modelling with and without plume buoyancy enhancement may be critical to the HRA outcomes.
Table 1: Characteristics of key Refinery sources
Stack Height
(m)
Internal diameter
(m)
Exit Velocity (m/sec)
Exit Temp degrees C
Buoyancy m3/s4
Plume rise (3 m/s winds)
Plume height
(m a.g.l) Liquor Burner 100 0.94 27.9 65 7 24 124 Calciner 1 100 1.9 21.6 159 59 70 170 Calciner 2 100 1.9 20.8 160 57 68 168 Calciner 3 100 2.16 19.6 196 82 82 182 Calciner Multiflue 100 3.44 20.6 177 202 142 242 Calciner 4 48.8 2.36 20.1 157 84 116 165 Boiler 1 65 2.4 14.5 101 42 66 131 Boiler 2 65 2 16.2 124 40 73 130 Boiler 3 65 2 13.7 131 35 67 124 Boilers Multiflue 65 3.71 14.6 117 116 120 185 Gas turbine 48.8 3.04 22.4 98 100 135 184
15 February 2005 DRAFT Review of CSIRO Phase1-3 reports.doc Katestone Environmental Page 18
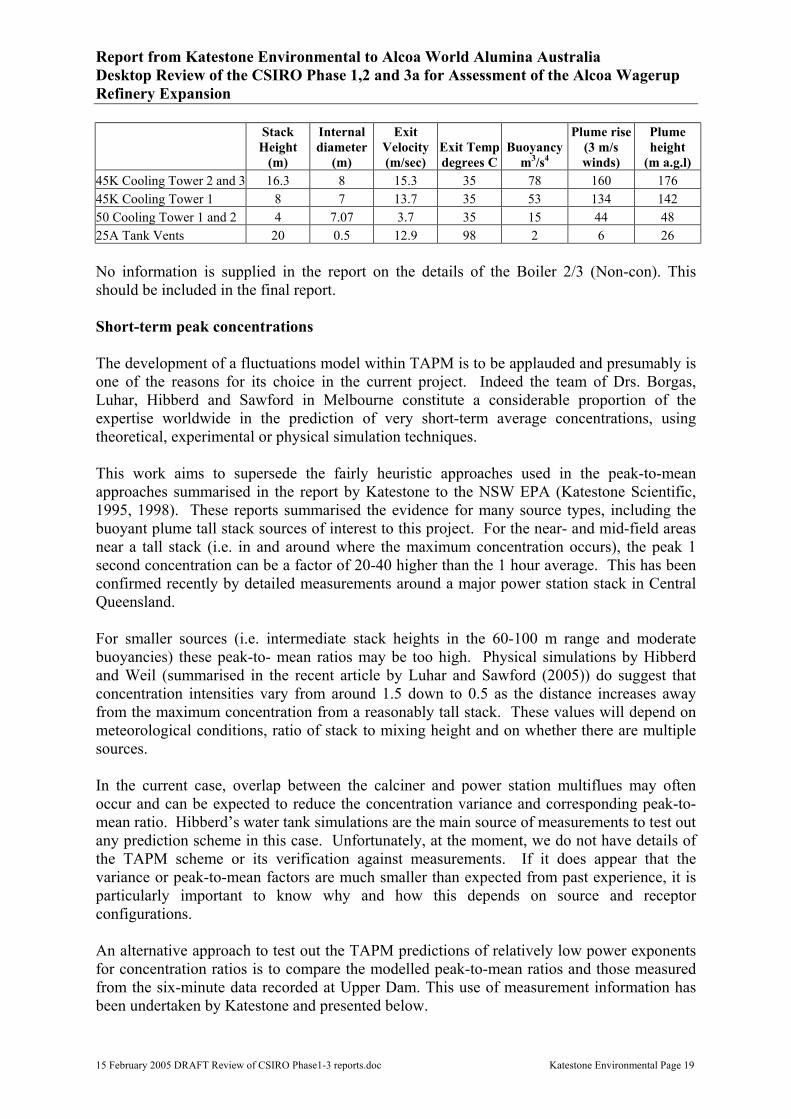
Report from Katestone Environmental to Alcoa World Alumina Australia Desktop Review of the CSIRO Phase 1,2 and 3a for Assessment of the Alcoa Wagerup Refinery Expansion
Stack Height
(m)
Internal diameter
(m)
Exit Velocity (m/sec)
Exit Temp degrees C
Buoyancy m3/s4
Plume rise (3 m/s winds)
Plume height
(m a.g.l) 45K Cooling Tower 2 and 3 16.3 8 15.3 35 78 160 176 45K Cooling Tower 1 8 7 13.7 35 53 134 142 50 Cooling Tower 1 and 2 4 7.07 3.7 35 15 44 48 25A Tank Vents 20 0.5 12.9 98 2 6 26 No information is supplied in the report on the details of the Boiler 2/3 (Non-con). This should be included in the final report. Short-term peak concentrations The development of a fluctuations model within TAPM is to be applauded and presumably is one of the reasons for its choice in the current project. Indeed the team of Drs. Borgas, Luhar, Hibberd and Sawford in Melbourne constitute a considerable proportion of the expertise worldwide in the prediction of very short-term average concentrations, using theoretical, experimental or physical simulation techniques. This work aims to supersede the fairly heuristic approaches used in the peak-to-mean approaches summarised in the report by Katestone to the NSW EPA (Katestone Scientific, 1995, 1998). These reports summarised the evidence for many source types, including the buoyant plume tall stack sources of interest to this project. For the near- and mid-field areas near a tall stack (i.e. in and around where the maximum concentration occurs), the peak 1 second concentration can be a factor of 20-40 higher than the 1 hour average. This has been confirmed recently by detailed measurements around a major power station stack in Central Queensland. For smaller sources (i.e. intermediate stack heights in the 60-100 m range and moderate buoyancies) these peak-to- mean ratios may be too high. Physical simulations by Hibberd and Weil (summarised in the recent article by Luhar and Sawford (2005)) do suggest that concentration intensities vary from around 1.5 down to 0.5 as the distance increases away from the maximum concentration from a reasonably tall stack. These values will depend on meteorological conditions, ratio of stack to mixing height and on whether there are multiple sources. In the current case, overlap between the calciner and power station multiflues may often occur and can be expected to reduce the concentration variance and corresponding peak-to-mean ratio. Hibberd’s water tank simulations are the main source of measurements to test out any prediction scheme in this case. Unfortunately, at the moment, we do not have details of the TAPM scheme or its verification against measurements. If it does appear that the variance or peak-to-mean factors are much smaller than expected from past experience, it is particularly important to know why and how this depends on source and receptor configurations. An alternative approach to test out the TAPM predictions of relatively low power exponents for concentration ratios is to compare the modelled peak-to-mean ratios and those measured from the six-minute data recorded at Upper Dam. This use of measurement information has been undertaken by Katestone and presented below.
15 February 2005 DRAFT Review of CSIRO Phase1-3 reports.doc Katestone Environmental Page 19
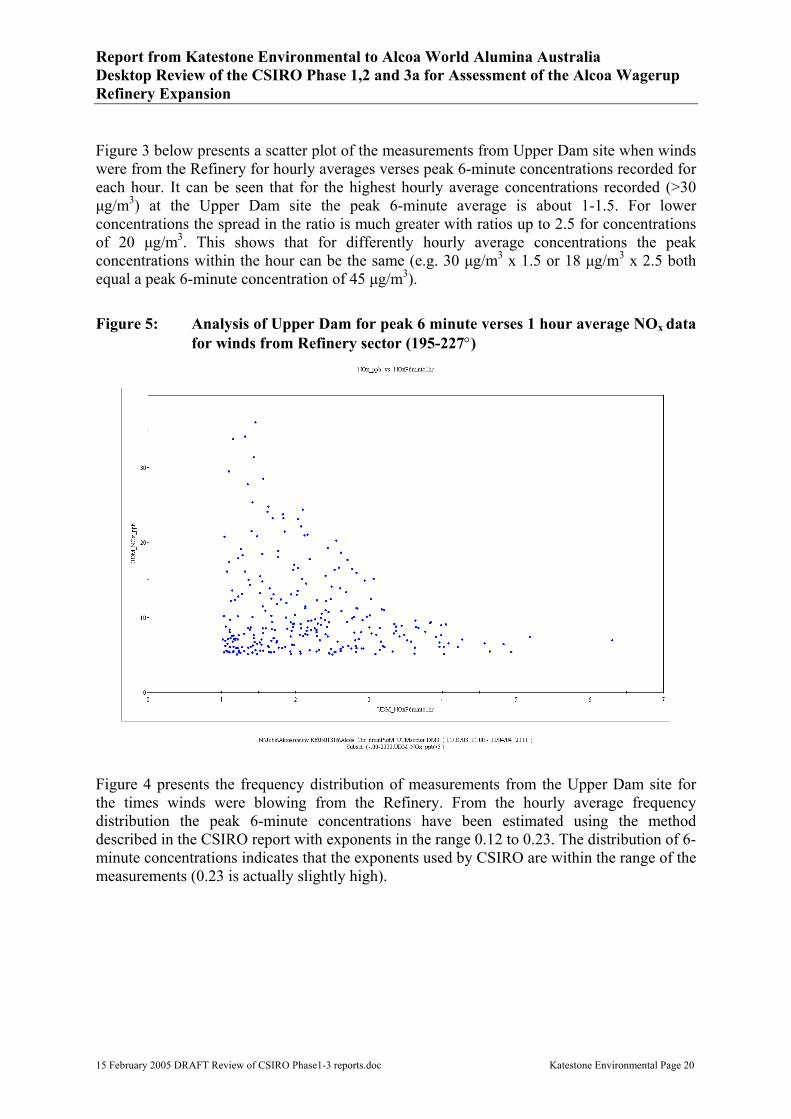
Report from Katestone Environmental to Alcoa World Alumina Australia Desktop Review of the CSIRO Phase 1,2 and 3a for Assessment of the Alcoa Wagerup Refinery Expansion Figure 3 below presents a scatter plot of the measurements from Upper Dam site when winds were from the Refinery for hourly averages verses peak 6-minute concentrations recorded for each hour. It can be seen that for the highest hourly average concentrations recorded (>30 µg/m3) at the Upper Dam site the peak 6-minute average is about 1-1.5. For lower concentrations the spread in the ratio is much greater with ratios up to 2.5 for concentrations of 20 µg/m3. This shows that for differently hourly average concentrations the peak concentrations within the hour can be the same (e.g. 30 µg/m3 x 1.5 or 18 µg/m3 x 2.5 both equal a peak 6-minute concentration of 45 µg/m3).
Figure 5: Analysis of Upper Dam for peak 6 minute verses 1 hour average NOx data for winds from Refinery sector (195-227°)
Figure 4 presents the frequency distribution of measurements from the Upper Dam site for the times winds were blowing from the Refinery. From the hourly average frequency distribution the peak 6-minute concentrations have been estimated using the method described in the CSIRO report with exponents in the range 0.12 to 0.23. The distribution of 6-minute concentrations indicates that the exponents used by CSIRO are within the range of the measurements (0.23 is actually slightly high).
15 February 2005 DRAFT Review of CSIRO Phase1-3 reports.doc Katestone Environmental Page 20
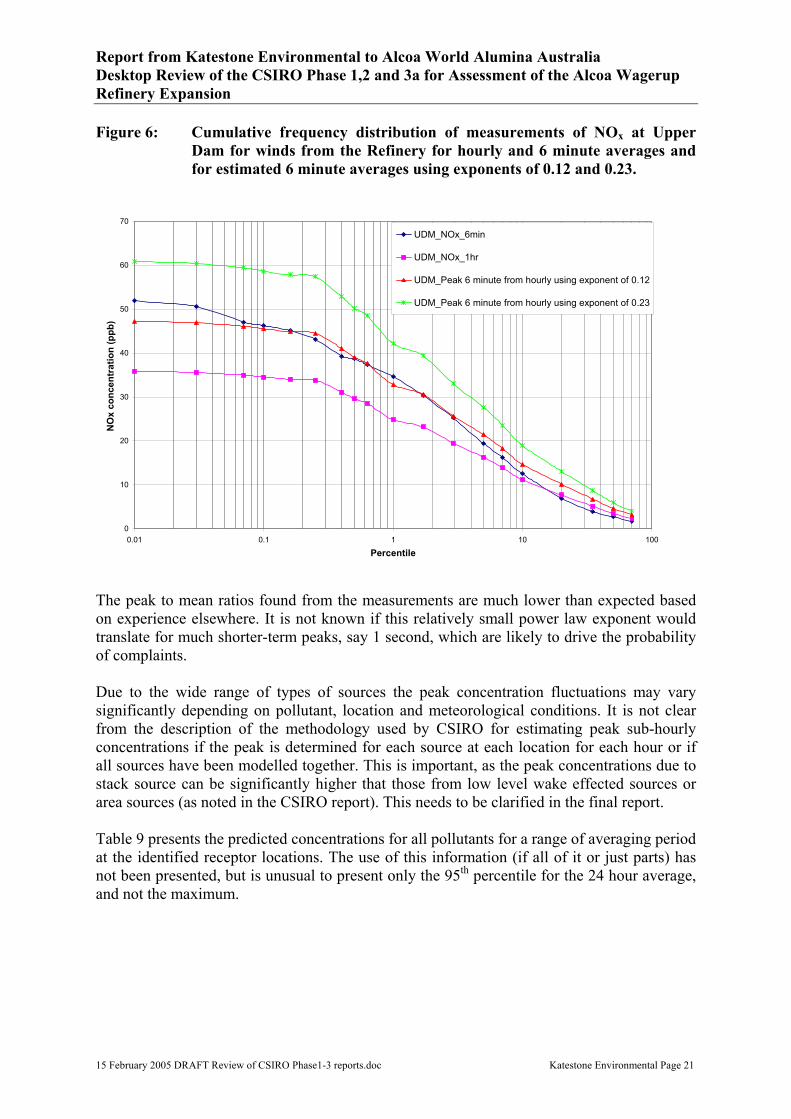
Report from Katestone Environmental to Alcoa World Alumina Australia Desktop Review of the CSIRO Phase 1,2 and 3a for Assessment of the Alcoa Wagerup Refinery Expansion Figure 6: Cumulative frequency distribution of measurements of NOx at Upper
Dam for winds from the Refinery for hourly and 6 minute averages and for estimated 6 minute averages using exponents of 0.12 and 0.23.
0
10
20
30
40
50
60
70
0.01 0.1 1 10 100
Percentile
NO
x co
ncen
trat
ion
(ppb
)
UDM_NOx_6min
UDM_NOx_1hr
UDM_Peak 6 minute from hourly using exponent of 0.12
UDM_Peak 6 minute from hourly using exponent of 0.23
The peak to mean ratios found from the measurements are much lower than expected based on experience elsewhere. It is not known if this relatively small power law exponent would translate for much shorter-term peaks, say 1 second, which are likely to drive the probability of complaints. Due to the wide range of types of sources the peak concentration fluctuations may vary significantly depending on pollutant, location and meteorological conditions. It is not clear from the description of the methodology used by CSIRO for estimating peak sub-hourly concentrations if the peak is determined for each source at each location for each hour or if all sources have been modelled together. This is important, as the peak concentrations due to stack source can be significantly higher that those from low level wake effected sources or area sources (as noted in the CSIRO report). This needs to be clarified in the final report. Table 9 presents the predicted concentrations for all pollutants for a range of averaging period at the identified receptor locations. The use of this information (if all of it or just parts) has not been presented, but is unusual to present only the 95th percentile for the 24 hour average, and not the maximum.
15 February 2005 DRAFT Review of CSIRO Phase1-3 reports.doc Katestone Environmental Page 21
Report from Katestone Environmental to Alcoa World Alumina Australia Desktop Review of the CSIRO Phase 1,2 and 3a for Assessment of the Alcoa Wagerup Refinery Expansion Section 4.2 in the CSIRO Phase 3a report presents information on the uncertainty in the modelled concentrations, but only for the robust highest concentration (RHC). Table 5 in the CSIRO report presents a list of ratios of modelled to observed RHC for other studies undertaken by CSIRO. Some of the studies included in the list would not appear to be relevant to the Wagerup study (such as the Melbourne studies for ozone) and presenting an average of the ratios is not suitable as the errors cancel out. A summary of the uncertainty found in the Wagerup study only for all averaging periods would be more useful. This should include information on the estimated inter-annual and emission variability, which could have significant impacts on the annual average concentrations. For a HRA the annual averages are just as important as the peak concentrations and should therefore be addressed accordingly. 5.5 Summary of review
This review has been conducted over a relatively short time with the information coming to hand only recently. As for other investigators, we note that the refinery presents a very complex emission situation that requires considerable testing and evaluation and the use of supplementary and perhaps non-standard techniques to resolve many of the issues. It appears that CSIRO staff have also had to work with short deadlines and with tools that are still under beta testing (and not yet released for general evaluation and comment). The choice of TAPM for the analysis by comparison with other simpler models appears reasonable and a significant amount of work has been undertaken by CSIRO including numerous sensitivity studies. The present analysis of data shows that the NOx signal at Boundary Road is not strong and that it may not be a good signal to verify the modelling and furthermore may not represent what is causing the complaints in Yarloop. The immediate tasks for the finalisation of the CSIRO report should be to ensure a logical and self-consistent set of model results and statements of outcomes as required in the project specification. Whilst some model performance may be disappointing, it’s importance must be clearly stated and the team undertaking the HRA made fully aware of the various sensitivities. The utility of TAPM for representing short-term concentrations from the various sources needs to be clearly indicated as it was one of the attractions for choosing this approach. It may be worthwhile providing a more explicit set of assumptions and limitations for the performed work, as well as possible suggestions for the improvement of validation procedures (e.g. better continuous emissions information, the use of ambient monitoring possible alternative pollutants at the two long-term sites to firm up the likely sources of peak concentrations). 6. Specific expertise of the review team
Christine Killip and Dr Peter Best of Katestone Environmental have compiled this report. Katestone Environmental has particular experience and technical expertise in the following areas of relevance to the current review:
• Coastal dispersion and meteorology. • Performance of advanced air quality dispersion models for near-coastal sites. • Performance of TAPM-type models in simulating meteorology in a wide range of
conditions and countries.
15 February 2005 DRAFT Review of CSIRO Phase1-3 reports.doc Katestone Environmental Page 22
Report from Katestone Environmental to Alcoa World Alumina Australia Desktop Review of the CSIRO Phase 1,2 and 3a for Assessment of the Alcoa Wagerup Refinery Expansion
• The air quality impact assessments of refineries and power stations. • The odour assessment of industries, with particular emphasis on community impacts. • Assessment of industrial projects in Western Australia such as at Kwinana,
Kalgoorlie, Collie and Hill River. • Community impact assessments of roadway projects and odour impacts from
intensive agricultural and major industries. 7. References:
ASTM (2000), “Standard Guide for Statistical Evaluation of Atmospheric Dispersion Model Performance” D6589 American Society of Testing and Materials Brown GJ and Fletcher DF (2003), “CFD prediction of odour dispersion and plume visibility for alumina refinery calciner stacks”, Third International Conference on CFD in the Minerals and Process Industries CSIRO, Melbourne, Australia. Cooper and Caulcott Ltd (1999), “A review of the ‘Model Validation Kit’ (BOOT) and the draft ASTM Validation Procedures”, www.cplusc.co.uk CSIRO (2004)a “Meteorological and dispersion Modelling Using TAPM for Wagerup Phase 1: Meteorology” Prepared for Alcoa World Alumina Australia by CSIRO Atmospheric Research, November 2004. – Final report CSIRO (2004)b “Meteorological and dispersion Modelling Using TAPM for Wagerup Phase 2: Dispersion” Prepared for Alcoa World Alumina Australia by CSIRO Atmospheric Research, November 2004. – Draft report CSIRO (2004)c “Meteorological and dispersion Modelling Using TAPM for Wagerup Phase 3a: HRA (Health Risk Assessment) Concentration Modelling – Current Emissions Scenario” Prepared for Alcoa World Alumina Australia by CSIRO Atmospheric Research, 10 December 2004. – Draft final report CSIRO (2004)d “Wagerup Air Quality Review” Prepared for Alcoa World Alumina Australia by CSIRO Atmospheric Research, May 2004. Environ Australia Pty. Ltd. (2004), “Environmental scoping document, Wagerup Refinery Unit 3, EPA Assessment No. 1527”. Report to Alcoa World Alumina Australia. Katestone Scientific (1998), “Peak-to-mean ratios for odour assessments”, Report from Katestone Scientific to Environmental Protection Agency New South Wales (EPANSW). Katestone Scientific (1995), “The evaluation of peak-to-mean ratios for odour assessment”, Report to the New South Wales Environmental Protection Agency. Luhar AK and Sawford BL (2005), “Micromixing modelling of concentration fluctuations in inhomogeneous turbulence in the convective boundary layer”, Boundary Layer Meteorology 114: 1-30.
15 February 2005 DRAFT Review of CSIRO Phase1-3 reports.doc Katestone Environmental Page 23

Report from Katestone Environmental to Alcoa World Alumina Australia Desktop Review of the CSIRO Phase 1,2 and 3a for Assessment of the Alcoa Wagerup Refinery Expansion
15 February 2005 DRAFT Review of CSIRO Phase1-3 reports.doc Katestone Environmental Page 24
Olesen HR (2001), “A platform for model evaluation”, 7th International Conference on Harmonisation within Atmospheric Dispersion Modelling for Regulatory Purposes, Belgirate. SKM (2002) “Wagerup Refinery Odour Assessment” Prepared for Alcoa World Alumina Australia by Sinclair Knight Merz. Toxikos (2003) “Health Risk and Toxicology Assessment of Emissions from the Upgraded Alcoa Pinjar Alumina Refinery (Volume 1 of 2)” Prepared for Environ by Roger Drew, Toxikos 14th November 2003. Willmott CJ (1981), “On the validation of models”, Physical Geography 2:2:184-194.