a relocation diffusion model of selected retail businesses
TRANSCRIPT

Wilfrid Laurier UniversityScholars Commons @ Laurier
Theses and Dissertations (Comprehensive)
1975
A Relocation Diffusion Model of Selected RetailBusinesses in Hamilton, OntarioRichard Blake HullWilfrid Laurier University
Follow this and additional works at: http://scholars.wlu.ca/etd
Part of the Urban Studies and Planning Commons
This Thesis is brought to you for free and open access by Scholars Commons @ Laurier. It has been accepted for inclusion in Theses and Dissertations(Comprehensive) by an authorized administrator of Scholars Commons @ Laurier. For more information, please contact [email protected].
Recommended CitationHull, Richard Blake, "A Relocation Diffusion Model of Selected Retail Businesses in Hamilton, Ontario" (1975). Theses andDissertations (Comprehensive). 1514.http://scholars.wlu.ca/etd/1514

A RELOCATION DIFFUSION MODEL 6F
SELECTED RETAIL BUSINESSES IN HAMILTON, ONTARIO
by
Richard Blake Hull
Submitted in partial fulfillment of the
requirements for the Master of Arts Degree
in Geography
Department of Geography
Wilfrid Laurier University
Waterloo, Ontario
1975
* U 8 2 3 ;j
Property of the Library
Wilfrid Laurier University

UMI Number: EC56450
All rights reserved
INFORMATION TO ALL USERS The quality of this reproduction is dependent on the quality of the copy submitted.
In the unlikely event that the author did not send a complete manuscript and there are missing pages, these will be noted. Also, if material had to be removed,
a note will indicate the deletion.
JJMT Dissertation Publishing
UMI EC56450
Copyright 2012 by ProQuest LLC.
All rights reserved. This edition of the work is protected against unauthorized copying under Title 17, United States Code.
ProQuest LLC. 789 East Eisenhower Parkway
P.O. Box 1346 Ann Arbor, Ml 48106-1346

ABSTRACT
In Hamilton, Ontario from I969 to 1973 the Civic Square Urban Renewal Project was carried out in part of the Central Business District. As a result most of the businesses in the project area were forced to move. This thesis examines the relocation decision which was made by the entrepreneurs who operated retail businesses in the Civic Square Area. The factors which were considered important as input in their decision were incorporated into a model which projects a relocation diffusion pattern similar to the actual pattern created when these businesses spread to other sections of the C.B.D.
The likelihood of the retailer choosing to relocate on a particular block within the C.B.D. is related to a number of factors which are combined in the model. These include the number of store sites in a block, the frequency of vacant stores that occur in the area and the distance of the new site from the original location in the C.B.D. However, not all businesses were prepared to compete for the most desirable locations. Those firms which had not been paying a low rent or were less successful were not likely to outbid a firm which was very successful and had previously been able to afford high rent for a prime location. Thus the probability that a block in the C.B.D. would receive a business which is relocating is modified to allow for these differences.
Considering the factors outlined above each block of the C.B.D. is assigned a probability that reflects the likelihood of that block receiving a business which is moving from the Civic Square Area. The probabilities are then converted to addresses, and each business is assigned a new location according to a random number. This stochastic technique is introduced because it is possible all pertinent factors have not been included or that all ramifications of factors included have not been considered.
The number of businesses which are projected for each block is compared to the actual number of businesses which relocated in that block. In this study Pearsonian Product Moment Correlation results varied from .624 to .654. The model is simple to use and is useful in projecting relorr cation diffusion patterns of retail businesses resembling the actual relocation diffusion pattern.

TABLE OF CONTENTS
Page
LIST OF TABLES iii
TABLE OF FIGURES iv
APPENDICES v
CHAPTER 1: THE INTRODUCTION OF THE STUDY 1
A. Purpose of the Study 1 B. The Study Area 2 C. The Relocation Diffusion Model ... 8 D. Data for the Study 12
CHAPTER 2: REVIEW OF THE LITERATURE 20
A. Diffusion Studies: An Explanation 20 B. Diffusion Studies: Review of the
Literature 23 C. Urban Renewal: Review of the
Legislation 26 i) Urban Renewal in Canada ....... 26
ii) Urban Renewal in Hamilton ..... 27
CHAPTER 3: A DESCRIPTION OF THE HAMILTON CIVIC SQUARE URBAN RENEWAL AREA AND THE BUSINESSES ORIGINALLY LOCATED THERE .. 34
A. Physical Characteristics • 34 i) Location and Character ........ 34 ii) Development Controls ........... 34 iii) Existing Land Use ............. 35
CHAPTER 4: A DESCRIPTION OF THE VARIATIONS WITHIN THE HAMILTON CENTRAL BUSINESS DISTRICT 46
A. Variations in the Hamilton Central
Business District 46
CHAPTER 5: THE MODEL 60
A. The Mean Information Field 60 B. The Basic Components of the Model 62 C. The Basic Model 66 D. The Method for Using the Basic
Model • 67 E. The Modified Model 68 F. The Expected Relocation Diffusion
Pattern 81 i

TABLE OF CONTENTS Page
CHAPTER 6: CONCLUSIONS 85
A. Summary 85 B. Evaluation of the Model 87 C. Areas for Further Research 88
APPENDICES 90
BIBLIOGRAPHY 93
ii

LIST OF TABLES
TABLE Page
1 Businesses in Civic Square Area 6
2 Retail Businesses in the Hamilton Civic Square Study Area 38
3 Summary of Retail Businesses in the Civic Square Study Area 39
4 Rents Paid and Economic Viability Ratings of the Retail Businesses Included in Study ..... 41
5 Service Industrie® in the Hamilton Civic Square Study Area 42
6 Wholesale Businesses in Hamilton Civic Square Study Area 43
7 Manufacturing Industries in Hamilton Civic Square Study Area 44
8 Data for Basic Formula of the Model ......... 69
9 Probabilities of Relocation Related to Economic Viability and Rent Paid 72
10 Probabilities and Addresses Derived from the Modified Formulae of the Model 77
11 Actual and Projected Results Using the Relocation Diffusion Model 83
12 Actual and Projected Results Shown in Groups Used for Correlation Tests 84
iii

TABLE OF FIGURES FIGURE Page
1 Hamilton, Ontario: Urban Renewal Areas 4
2 Hamilton Civic Square Urban Area 5
3 Original Location of the Retail Businesses Included in the Study 7
4 Study Area: Hamilton Central Business District 15
5 Hamilton C.B.D.: Actual Number of Store Sites in each Block 50
6 Hamilton C.B.D.: Rent Structure and Mean Number of Vacancies 52
7 Hamilton C.B.D.: A Sample of Pedestrian
Traffic 54
8 Hamilton C.B.D.: Accessibility Factor 55
9 Hamilton C.B.D.: Distance Decay Factor 57
10 Hamilton C.B.D.: The Mean Information Field . 61 11 Mean Information Field: Addresses Assigned
Blocks used in Conjunction with Businesses in Category A 78
12 Mean Information Field: Addresses Assigned Blocks Used in Conjunction with Businesses in Category B 79
13 Mean Information Field: Addresses Assigned Blocks Used in Conjunction with Businesses in Category C 80
iv

APPENDICES
Page
1. Commercial Relocation Inventory Forms 90
2. Sample Work Sheets Used in Calculations 91
v

C H A P T E R O N E
THE INTRODUCTION OF THE STUDY

A. PURPOSE OF THE STUDY
Urban renewal programmes have been prominent in
North America for some time. During the Great Depression
attempts were made to solve several social ills while at
the same time provide employment for thousands of people.
Following World War II our society had moved into an era
of unprecedented wealth and expansion. At this time
governments and local businessmen initiated programmes
to construct beautiful or at least profitable core areas
in our cities by rejuvenating buildings or in some cases 1
whole blocks of a Central Business District.
During the 1969*70 an urban renewal project was
initiated in the Central Business District of Hamilton,
Ontario. As a result many businesses were forced to look
for a new location for their enterprise. In selecting the
new location the entrepreneur had to assess the advantages
and disadvantages of the various sites which were available
This study examined several factors which helped determine
what decision was made. These factors were incorporated into
a model which simulated the relocation diffusion pattern
which was established when the businesses relocated.
Models which assume that all the pertinent factors
have been included and that perfect knowledge of the effects
of these factors is available are deterministic. However,
the model in this paper has a chance factor (stochastic
technique) built into it. Factors that are known to be im-
1

2
portant in relocation decisions are included, however, it
is conceivable that some factor unknown to the researcher or
considered unimportant has been omitted. Likewise it was
entirely possible that all the ramifications of any one
factor had not been accounted for. For these reasons a
stochastic technique was introduced to the model.
Each block in the C.B.D. was assigned a probability
based on the factors in the model. The probability reflected
the likelihood that the block would receive a relocating
business. The new addresses, however, which were assigned
each business were selected randomly. Thus, this paper
deals with a relocation diffusion model which used stochastic
techniques.
Such models have been used by geographers with great
success. Hagerstrand in tracing the spread of various agri
cultural innovations, and Morrill in developing a model
tracing the spread of the Negro ghetto in Seattle have been 2
leading exponents of models with a random factor built in.
B. THB STUDY AREA
In 1958 a detailed urban renewal study was conducted
for the city of Hamilton.J The results of the study designated
areas of the city for proposed redevelopment. To date the
city has acted on four of these areas. These areas are
referred to as the Burlington Beach and Van Wagner*s, the
North End, York Street, and the Civic Square, Urban Renewal
Area (see Figure 1). Hamilton Civic Square was chosen as

3
the location for the research included in this study.
Hamilton was undergoing a large urban renewal pro
gramme which resulted in the demolition of several blocks
of the Central Business District and the relocation of 112
retail businesses. The extent of the programme and the size
of the city of Hamilton meant that more businesses were dis
located than in other communities in southern Ontario such
as Kitchener, Sarnia or Peterborough that engaged in urban
renewal work in their Central Business Districts.
The Hamilton Civic Square Urban Renewal Area consists
of 43 acres of land in 12 blocks of varying size (see
Figure 2). It is generally bounded by Merrick Street on
the north, Bay Street on the west, Main Street on the south
and James Street on the east. In the broadest sense Civic
Square included the western pension of the commercial core
of the City and a small part of the mixed commercial-in
dustrial area which surrounded the Central Business District.
There were 206 businesses in the Civic Square area. The
following table summarizes the various types of these busi
nesses.

HAMILTON -PRIMARY TRADE AREA-CENTRAL BUSINESS DISTRICT
2.THE NORTH END
3. YORK STREET
BOUNDARIES—CITY OF HAMILTON- 4. CIVIC SQUARE O .5 0 > i i _
MILES

5
^
HAMILTON CIVIC SQUARE
STUDY AREA
200 400 600
FEET
LAND NOT ACQUIRED BY 1972
A EATONS DEPARTMENT STORE
B THE HAMILTON MARKET
C THE HAMILTON EDUCATION CENTRE
D CENTENARY UNITED CHURCH
O LAND ACQUIRED BY 1972 (EXCLUDING A—D)
FIGURE 2.

6
TABLE ONE
BUSINESSES IN CIVIC SQUARE AREA
Retail 112
Wholesale 12
Manufacturing 6
Service 76
Total 206
Of the 112 retail businesses originally located in
the Civic Square Area the 43 which relocated within the
Hamilton C.B.D. were included in the relocation study (see
Figure 3)* Many of the original retail businesses were
not included in the study for the following reasons: Some
of the businessmen retired and did not relocate. A few
others moved into widespread areas outside the Hamilton
Central Business District and because the numbers involved
were few and the areas so extensive it was considered beyond
the scope of this paper. Several were chain store operations
and the data related to the economic viability of the parti
cular store located in Hamilton was not available. Restaurants
were bought outright by the city because of the large in
vestment which had been made in equipment. Lastly, the meat
and butcher shops on McNab Street enjoyed retail corapatability
with each other and retail affinity with the market and
special arrangements were made for them.
The Civic Square Renewal Area was to be replaced by

7
^
NOTE-
HAMILTON CIVIC SQUARE
STUDY AREA
200 400 600
FEET
ORIGINAL SITES OF RETAIL BUSINESSES INCLUDED IN MODEL
i)EACH IS OWNED BY A SINGLE PROPRIETOR ii)EACH RELOCATED WITHIN THE C.B.D.
(DEFINED BY THE PLANNING DEPT.-CITY OF HAMILTON)
12 BUSINESSES INCLUDED IN THIS STUDY WERE LOCATED ON BLOCKS ON KING ST. WEST BETWEEN THE ADDRESSES OF 2 AND 46 KING ST. W.
A-EATONS DEPARTMENT STORE B-THE MARKET
C-TEMPORARY MALL D-THE EDUCATION CENTRE
FIGURE 3.

8
a new complex of buildings housing a variety of uses. There
were to be two new office towers, an education centre, two
theatres, an art gallery, a shopping mall, a hotel and a
6 convention centre. By January 1974 the shopping mall had
been completed. The new centre was named after a former
Hamilton mayor and is known as the Lloyd D. Jackson Square.
As the urban renewal programme proceeded many
questions were raised. Would the businesses forced to move
relocate in the Hamilton Central Business District? If many
of the businesses did relocate downtown, could a model be
developed which could show the spatial distribution of the
relocated businesses in the C.B.D.?
C. THE RELOCATION DIFFUSION MODEL
The movement or spreading of phenomena in space is
referred to as diffusion. If a particular phenomena moves
from one place and relocates in another place it is referred
to as relocation diffusion. The movement of businesses from
the Civic Square Area to another part of the Hamilton Central
Business District is an example of relocation diffusion.
Any model developed predicting a relocation diffusion pattern
could be referred to as a relocation diffusion model.
R.L. Nelson who is widely recognized for his work in
retail locations lists eight main principles which should
serve as a guide in selecting a suitable location for a re
ft tail business. Nelson*s eight principles are:

9
1. Check the potential of the present trade area to be quite sure it will continue to grow and be adequate to support your business.
2. The site selected must be accessible to a large portion of the market area. Different forms of accessibility will be required by different forms of businesses such as generative or suscipient businesses.
3. The site chosen should be located in a trading area with a growing population and income.
4. Note whether there is an opportunity for business interception such as locating between two department stores.
5. Businesses often benefit from cumulative attraction. It is often advisable to locate a business near similar or complimentary types of businesses.
6. The area should be compatible and there should be no interruption of shopper traffic.
7. The businessmen must in locating attempt to improve on the location chosen by a rival business thus minimizing the competitive hazard.
8. Site economics such as the overall efficiency of the layout or adjacent amenities are also important in choosing a site.
Other researchers disagree with the number and
relative importance of the factors to be considered in site
selection. F.J. Jones limits site selection to two main 9
principles. Assuming agreement has been reached on locating
within a particular market area the pedestrian traffic
passing the site and the store building are prime determinants.
Duncan and Phillips elicit several points for considerations
under the areas of selecting a city and selecting a specific
site. In selecting a site such characteristics of the

10
population as their numbers, buying habits and wealth are
important considerations. For a specific site the customer
buying habits, estimated business volume, location in relation
to competitors and the availability of the site should be
examined.
William Applebaum has several articles dealing
with aspects of retail trade. In 1966 he set out eighteen
12 guidelines which could serve for store location strategy.
With respect to the business itself the entrepreneur should
define the objective, analyze the present or potential market
coverage, analyze the stores' performance, appraise the
facilities and physical requirements and project the invest
ment requirements. It is important to make an inventory of
the competition, to appriase them and calculate the likely
location moves they will make. Study the population and its
characteristics in conjunction with an analysis of the
economic base of the community. Applebaum completes his
list of guidelines with other points such as noting environ
mental conditions and the need to develop a store-location
strategy.
It is obvious that researchers are in some dis
agreement about the number of factors to be considered and
the relative importance one might ascribe to any one of them.
Some, such as business objectives could only be determined
by the owner himself. Others, dealing with special cases
such as retail affinity or complimentary sites are neither

11
easily defined nor applicable to studies such as this
dealing with several different business types simultaneously.
For these reasons factors which were considered universal
and for which data was readily available were included in
this study.
The use of these factors in the model and the
data collected for each will be described in detail in
Chapter V. Two factors are applicable to all businesses
relocating in the C.B.D.. They are:
1. The adequacy and potential of the trade area for the Hamilton C.B.D.
2. The accessibility of the population to the entire C.B.D.
Five factors relate directly to variations within the Hamilton C.B.D.. They are:
1. The number of store sites available in downtown Hamilton in various blocks.
2. The vacancy rate exhibited in the blocks.
3. The accessibility of a large number of customers to each block considered individually.
4. The distance of the blocks with potential locations or sites from the original location of any business.
5. The rent structure of the C.B.D.
Two factors relate to the businesses included in the model and will be further amplified in Chapter III. They are:
1. The economic viability of e. ch enterprise included in the study as exhibited by the credit rating of each.
2. The rent paid by each enterprise in its location within the Civic Square Renewal Area.

12
D. DATA FOR STUDY
A detailed examination of the businesses located
in the Hamilton Civic Square Area was conducted. This in
volved field studies during I969, 1970, and 1971. City
directories for 1967, 1968, and 1969 were used to obtain
the address, business name and the owner of each enterprise 13
in the area. Using records compiled by Mr. Paul Waind,
the Retail Relocation Officer for the Urban Renewal Depart
ment of the City of Hamilton, information concerning the
Standard Industrial Classification and rents paid by each
14 business were ascertained. The new location for some
businesses was also available at this office but many had
to be obtained from City Directories.
Information concerning the economic viability of a
firm was not readily available. Retailers would not re
lease this information to independent researchers and the
records compiled by the city were held in confidence.
Credit ratings t$ere used as a surrogate for actual sales
figures or profit and loss statements. The Dun and Brad-
street Canadian Middle Market Directory was used to obtain tlie
15 credit rating and the estimated worth of each business.
The figures collected came from the March edition of 1965,
1966 and 1967. These figures reflected the status and success
of the business before expropriation started. By I969 or
1970 many financial ratings for the firms were not classified
by Dun and Bradstreet because of the uncertainty under which

13
the businesses operated at the time. Many had not found
new locations and it was not certain they would remain in
business.
According to Nelson and the other researchers re
ferred to earlier, the retail business relocation decision
will be largely affected by the differences which exist
within the C.B.D. The Hamilton Central Business District
was the receiving area for the businesses included in this
thesis. The boundaries of the C.B.D. are the same as those
established by the City Planning Department using techniques
similar to those outlined by Murphy and Vance. ° The
boundaries are approximately Cannon Street in the north,
Wellington Street in the east, Duke Street in the south and
Hess Street in the west (see Figure 4). There is some
spillage to side streets north-east of the main intersection
of King and James Streets but generally the C.B.D. is
cross-shaped running along both main arteries.
The model which is developed in Chapter V uses cer
tain information concerning the businesses in the Hamilton
Civic Square Renewal Area in conjunction with the information
about the C.B.D. Therefore, having delimited the Hamilton
Central Business District it was necessary to collect the
following data:
1. the number of store sites on each block,
2. the number of vacancies found in any block,
3. the number of pedestrians walking down any street,

14
4. the mean rents paid for floor space in each block of the study area,
5. the distance of each block in the C.B.D. from the Civic Square Renewal Area. This was measured in city blocks.
The number of store sites was ascertained by field
work. This was carried out in the spring of 1972 and
involved counting each address having a retail, service or
wholesale business as well as vacant building units which
were available if an entrepreneur moved to that location.
It is possible the accuracy of the count could be affected
if a business were to move to a site but only occupy a portion
of it or if a business moved to adjacent vacant units and
occupied both units.
The number of vacancies found during the field work
in the spring of 1972 was not relevant for this study. By
that date many of the businesses examined in this thesis
had already relocated, moving to what had previously been
vacant units. To acquire the information concerning the
number of vacancies before relocation begaa it was necessary
to obtain records from the Hamilton Urban Renewal Department.
Mr. Waind, the Relocation Officer, had conducted a survey of
the number of vacancies in the Hamilton C.B.D. in 1968 and
these are the figures used in this study.
The Traffic Department which is part of the City
Engineer1s Department regularly conducts pedestrian traffic
counts. These counts are conducted at intersections and

17
solve some of these problems.
This thesis is divided into six chapters. The next
chapter describes diffusion studies and outlines types
of studies and important terms used in them. A review of
the literature covers diffusion studies done by geographers
relevant to this study and outlines the history of urban
renewal in Hamilton and Canada. A detailed description
of the Hamilton Civic Square Urban Renewal Area and the
businesses included in this study is provided in Chapter Three.
Chapter Four describes the Hamilton C.B.D. in detail and
outlines the data which is incorporated in the model. The
model is developed in Chapter Five while the final chapter
of this thesis outlines the conclusions which can be made
concerning the usefulness and reliability of the model.

18
FOOTNOTES TO CHAPTER ONE
S c o t t Greer , Urban Renewal and American C i t i e s (New York: B o b b - M e r r i l l Company, I n c . , 1 9 6 5 ) , pp . 1 3 - 1 5 .
Torsten Hagerstrand, "The Propagation of Innovation Waves," Lund Series in Geographyf Series B. Human Geography. Vol. 4, 1952, pp. 3-19.
, "Migration and Area: survey of a sample of Swedish migration fields and hypothetical considerations on their genesis," Lund Series in Geography. Series D. Human Geography. Vol. 13, 1957, PP. 27-158.
, "On Monte Carlo Simulation of Diffusion," in William L. Garrison and Duane Marble (eds.) Quantitative GeographyP Part I: Economic and Cultural Topics. Northwestern University, Evanston, 111., 1967, pp. 1-32.
Richard L. Morrill, "The Negro Ghetto: problems and alternatives," Geographic Reviewf Vol. 55, 1965, Pp. 339-361.
•^Hamilton: Urban Renewal Study (Hamilton: Planning Department, 1958).
Sarnia Area Urban Renewal Study (Toronto: Murray V. Jones and Associates Limited, 1967).
City of Kitchener, Ontario Downtown Urban Renewal Scheme (Kitchener: Planning Department and Project Planning Associates Limited, 1967).
Peterborough: Urban Renewal: A Study of the C.B.D. (Peteroborugh: City Planning Board, 1962).
Hamilton Civic Square Urban Renewal Study (Toronto: Murray V. Jones and Associates Limited) pp.30-34.
6Ibid., p. 1-43.
'Ronald Abler, John S. Adams and Peter Gould, Spatial Organization: The Geographer's View of the World (Englewood Cliffs, New Jersey: Prentice-Hall Inc., 1971), PP. 389-450.

19
o Richard Laurence Nelson, The Selection of Retail
Locations (New York: F.W. Corporation, 1958) p. 52.
Q
Fred M. Jones, Retail Merchandising (Homewood: Richard D. Irwin Inc., 1957) Pp. 103-128.
Delbert J. Duncan and Charles F. Phillips, Retailing: Principles and Methods 7th ed. rev.: (Homewood, Illinois: Richard D. Irwin Inc., 1967) p. 91.
William Applebaum, "A New Approach to Mapping Store Facilities," Professional Geographerf 16 (1), 1964, pp. 9-11.
, "Store Performance in Relation to Location and Other Characteristics," Chain Store Age. 41 (6), 1965, PP. 14-16.
, "Can Store Location Research be a Science," Economic Geography. 41 (3), 1965, pp. 234-237.
_, "Methods for Determining Store-Location Strategy Study, Journal of Marketing. 30 (4), 1966, pp. 42-45.
12 William Applebaum, "Guidelines for a Store-
Location Strategy Study, Journal of Marketing. 30 (4), 1966, pp. 42-45.
T O JVernon*s Hamilton City Directory (Hamilton: Vernon
Directories Limited, 1967-70.)
14U.S. Statistical Policy Division, Office of Management and Budget, Standard Industrial Classification Manualf 1972 (Washington: U.S. Government Printing Office, 1972), pp. 259-329.
5Dun and Bradstreet Canadian Middle Market Directory, (New York: Dun and Bradstreet Inc., 1967).
1 ft
Raymond E. Murphy and J.E. Vanoe Tr., "Delimiting the C.B.D.," Economic Geography. Vol. 30, 1954, pp. 189-222.

C H A P T E R T W O
REVIEW OF THE LITERATURE

20
A. DIFFUSION STUDIES: AN EXPLANATION
Geographers have been concerned about spatial patterns
as they existed and spread on their earth for some time.
However, in recent years considerably more emphasis has been 2
placed on the dynamics of these patterns. The understanding
of man's use of space over time has led to the study of
diffusion or the spreading of phenomena.
Most writers recognize at least three distinct types
of diffusion. These are expansion or contagious diffusion,
hierarchical diffusion and relocation diffusion.0 The first
of these types is distinct because, ideas, techniques, or
phenomena are passed directly from a carrier to a receiver
and the total number of people or areas using or exhibiting
this characteristic is increased. Most studies of this
type assume that distance between a receiver and carrier is
a factor in the likelihood of the diffusion taking place.4
Hierarchical diffusion also results in an increase
in the use or occurrence of the phenomena being diffused.
However, in this case space is often relative and acceptance
of the phenomena is dependent on a compatibility of socio
economic characteristics. Thus an idea is likely to spread
from one person of a particular social class or economic
standing to a person of similar class or standing even though
they may live in a different community. As an example it
is argued that a nuclear physicist is more likely to communi
cate an idea to another nuclear physicist in another country

21
than he is to tell the historian who is his neighbour.
Relocation diffusion, the type dealt with in this
study, differs from the other types because there is no in
crease in the number of phenomena. The objects studied tend
to be discreet and when they relocate in their new spatial
context they no longer exist in their old setting. Thus,
we might study the diffusion of Quakers in the seventeenth
century, or of Jewish people in this century. If 1,000
people emigrate or flee a country they can no longer exist
in the old country. Likewise if a group of businesses
moves, because the old buildings they were using were de
molished, and relocate in another area there will be no in
crease in their number. This is quite a different thing
from studying the diffusion of particular business techni
ques such as discount selling, take-out foods or co-operative
buying.
Three important terms are continually used in diffusion
studies. They are carrier, barrier and mean information
field. The carrier is the person or thing which transmits
the innovation or phenomena to a new area. In relocation
diffusion the phenomena itself is moving and is considered
by some to be its own carrier. With respect to the retail
businesses of this study the entrepreneurs of the businesses
can be considered the carriers.
Things which block, slow down or change the direction
of the diffusion are considered as barriers of whish three

22
types are generally recognized. Absorbing barriers are
those barriers which stop a diffusion completely. An im
penetrable jungle may stop human migration completely.
Industrial or residential land use or zoning may serve as
absorbing barriers in the relocation of retail business.
In the study of the Hamilton C.B.D. the boundaries of the
study are absorbing barriers because the diffusion pattern
stops abruptly at its borders.
If a barrier causes the diffusion to be temporarily
stopped and then channelled in another direction it is con
sidered a reflecting barrier. In a business district the
lack of vacancies or potential sites in one area may cause
an intensification of the relocations occurring in another
area. In this situation incompatible land use in one part
may cause the relocation of the businesses to be channelled
to another section of the business district where more
favourable conditions are present.
A permeable barrier is the third type of barrier
commonly distinguished as a separate type of barrier. This
type of barrier allows a phenomena to pass through or over
it but greatly reduces the strength or size of the diffusion.
Within a Central Business District there may be a main traffic
artery which tends to separate the main retail shopping area
from other businesses in the downtown core. Retail businesses
might appear on the other side of the artery but the in
tensity of retail uses may decrease sharply*

23
B. DIFFUSION STUDIES: REVIEW OF THE LITERATURE
This review is not meant to be exhaustive but rather
to highlight some studies which pertain to this thesis.
Other sources provide a more complete review of the work
that has been done.
Learning the way a phenomenom or new idea spreads or
fails to spread contributes to our understanding of change.
Many studies have been carried out in the natural sciences.
Work by botanists on the diffusion of plant types in plant
succession studies or the work of stream pattern development
7 by geographers has been important.
In the social sciences various disciplines have had
explicit and unique interests in diffusion. Anthropologists
have championed diffusion studies as they have examined the
spread of various aspects of one civilization to another.
Although ideas, and techniques did spread from one area to
another it appears that several xmportant ideas and concepts of
modern man developed independently in civilizations that were
not in contact with one another. Thus the anthropologists who
have emphasized diffusion studies have met opposition from
other anthropologists who consider evolution as a more im-
9 portant line of attack in their work.
Sociologists have not been concerned with the spread
of ideas between societies but rather with the diffusion
within a society. Katz, Levin and Hamilton are often cited
as having given a classical definition of diffusion in their

24
field:
...the process of diffusion may be characterized as the (1) acceptance. (2) over time. (3) of some specific item - an idea or practice, (4) by individuals, groups or other adopting units, linked (5) to specific channels of communication, (6) to a social structure. and (7) to a given system of values, or culture.10
As Cohen points out there is an emphasis on the
spread within a society which is linked by communication
networks. Much of the work by sociologists exhibit little
interest in the impact of the change, the rate of adoption 11
of the change or the spatial extent of the change.
Economists have concerned themselves with studies
analyzing the impact and rate of change as a result of the
diffusion of an idea. These ideas for economists invariably
deal with technological, managerial or organizational inno
vations which change a production function or create a new
one.
The credit for being the first geographer to develop
a model which describes the spread of an innovation over
space is usually given to Torsten HHgerstrand. His first
major work in diffusion consisted of three models which des
cribed the spread of new agricultural techniques from central
Sweden. 3 There were six working assumptions in his model:
1. Only one person possessed the information at the start.
2. The probability of the information being accepted varied through five classes of "resistance." These classes were established entirely arbitrarily.

25
3. The information is spread only by telling at pairwise meetings.
4. The telling takes place only at certain times with constant time intervals.
5. At each of these times every knower tells one other person, knower or nonknower.
6. The probability of being paired with a knower depends upon geographical distance between teller and receiver of information.
In Hagerstrandfs models a floating grid is established
and each cell in the matrix acquires a probability based
on the likelihood of that cell adopting the phenomenon being
diffused. These probabilities are accumulated and each
cell acquires an address. Hagerstrand1s methods have largely
been adopted in this study except in this study the Mean
Information Field is not floating. The M.I.F. is stationary
because the movement of the businesses occurs only once from
a starting position which has been established over a period
of years.
At the urban level Richard L. Morrill used a pro
babilistic approach to a simulation model which described
the spatial diffusion process exhibited by the Negro ghetto 14
in Seattle. Morrill argued that using the probabilistic
approach was correct because he lacked sufficient definite
information concerning the reasons for people making specific
house-to-house moves. He noted that this approach was more
suitable because the study involved only a few individuals
and not a few thousand. As Morrill points out the model
is simulated rather than "real" because it does no* purport

26
to predict the behaviour of actual people.
Morrill thought the model was successful with respect
to a comparison of the general patterns generated. However
if a comparison on a block by block basis was carried out the
blocks corresponded directly less than two-thirds of the time.
This was attributed to the insufficient weighting of the
values of the homes concerned and topographical factors.
Neighbourhood® with homes of greater value were more resis
tant to the infiltration of the ghetto. Likewise the neigh
bourhoods situated on higher land did not become part of the
ghetto as quickly while the ghetto advanced more quickly
than the model anticipated into low lying areas.
C. URBAN RENEWAL: REVIEW OF THE LEGISLATION
i) Urban Renewal in Canada
The main catalyst for the following study has been the
increasing importance of urban renewal as an aspect of public
policy of the municipal governments of Canada. Urban renewal
policy of today has developed over the past forty years. In
1935 the Federal Government passed the Dominion Housing Act. J
The Minister of Finance was empowered to join with lending
institutions in making loans "to assist in the building of
houses." By I964 the Dominion Housing Act had undergone
revisions and was now known as the National Housing Act.
In 1964 the National Housing Act was amended to
allow the Central Mortgage and Housing Corporation to enter

27
into agreements to assist a province and a municipality
17 in carrying out an urban renewal scheme. The project did
not have to involve residential property either before or
after the completion of the renewal. Under the scle me
C.M.H.C. would pay 50$ of the costs of studies, land ac
quisition and installation of services for the project as
well as provide loans for another 33 1/3$ of the costs pro
viding they were secured by municipal or provincial deben
tures .
It was through these measures that cities such as
Hamilton, Ontario, became involved in the type of large
scale urban renewal project causing the relocation diffusion
which is the subject of this thesis.
ii) Urban Renewal in Hamilton
In 1957, the City Planning Commissioner was requested
by the Board of Control to investigate the advisability
of undertaking an urban renewal study. The Planning Commissioner
in his report recommended that such a study be carried out
and that the City apply to C.M.H.C. for a grant of $12,000
for this purpose. The City was to contribute another $4,000.
After the approval by the Minister, the agreement between
C.M.H.C. and the City of Hamilton was signed in November
1957.18
The total funds available were later increased from
$16,000 to $28,000 by two additional grants from the federal
28
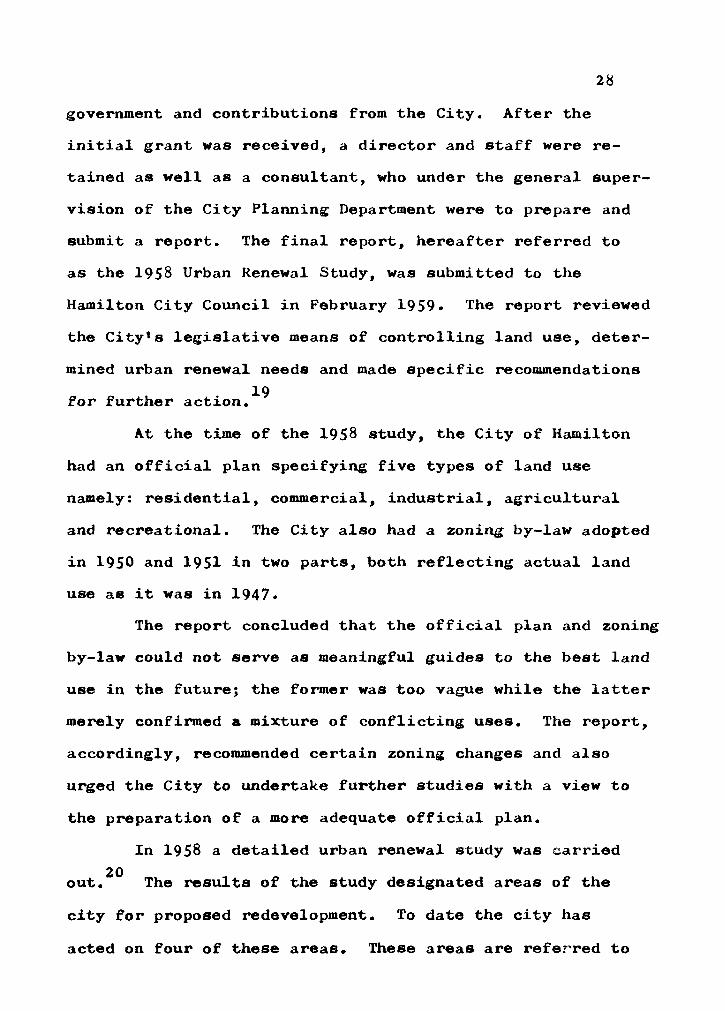
government and contributions from the City. After the
initial grant was received, a director and staff were re
tained as well as a consultant, who under the general super
vision of the City Planning Department were to prepare and
submit a report. The final report, hereafter referred to
as the 1958 Urban Renewal Study, was submitted to the
Hamilton City Council in February 1959. The report reviewed
the Cityts legislative means of controlling land use, deter
mined urban renewal needs and made specific recommendations
19 for further action.
At the time of the 1958 study, the City of Hamilton
had an official plan specifying five types of land use
namely: residential, commercial, industrial, agricultural
and recreational. The City also had a zoning by-law adopted
in 1950 and 1951 in two parts, both reflecting actual land
use as it was in 1947.
The report concluded that the official plan and zoning
by-law could not serve as meaningful guides to the best land
use in the future; the former was too vague while the latter
merely confirmed a mixture of conflicting uses. The report,
accordingly, recommended certain zoning changes and also
urged the City to undertake further studies with a view to
the preparation of a more adequate official plan.
In 1958 a detailed urban renewal study was carried
20 out. The results of the study designated areas of the
city for proposed redevelopment. To date the city has
acted on four of these areas. These areas are referred to

29
as the Burlington Beach and Van Wagner*s, the North End,
York Street, and the Civic Square. (see Figure 1).
The Van Wagner Beach project started in 1959. Towards
the end of that year land was expropriated, cleared and con
verted into a park and beach for recreational purposes.
A number of unsightly and run-down cottages which had been
converted to year round use during the war were removed
and considering the city has few accessible unpolluted shore
areas for recreation a much needed recreation facility was
provided.
The North End Urban Renewal Area is the largest
among those selected by the 1958 Study and also the most
populous. In this area the City has attempted to place
a considerable emphasis on rehabilitation. To encourage and
assist the residents of the area the City acquired a number
of properties which they refurbished and are using as public
housing. A new school which incorporated a community centre
and recreation facility complete with a swimming pool was
constructed. Two large apartment towers near the waterfront
were constructed, one being used for a senior citizen resi
dence. Having completed these projects the city has had a
hands-off policy attempting to encourage private citizens
and developers to continue the urban renewal work.
The Civic Square Urban Renewal Area and the York
Street Renewal Area were both going to be refurbished and
reconstructed. A lack of money, however, made it necessary

30
to subsequently shelve the York Street programme. The city
was, however, able to move ahead with the Civic Square pro
gramme. The total scheme involved 43 acres of land and 12
blocks of varying size. In clearing the land for the new
buildings which included two theatres, two office towers,
an art gallery, education centre and shopping mall, 206
businesses would be forced to give up their present location
and move to a new site.

31
FOOTNOTES TO CHAPTER TWO
Carl Ortwin Sauer, "A Geographic Sketch of Early Man in America," Geographical Review. Vol. 34, 1944, pp. 529-573.
Dan Stanislawski, "The Origin and Spread of the Grid-Pattern Town," Geographical Review, Vol. 36, 1946, pp. 105-120.
Peter Haggett, Locational Analysis In Human Geography, (London: Edward Arnold Ltd.,1965), p. 56.
3 Ronald Abler, John S. Adams and Peter Gould,
Spatial Organization: The Geographer's View of the World. (Englewood Cliffs, New Jersey: Prentice-Hall Inc., 1971), PP. 389-450.
^Maurice H. Yeates, An Introduction to Quantitative Analysis in Economic Geography (New York: McGraw-Hill Book Company, 1968), p. 57.
Abler, Adams and Gould, loc. cit.
Everett M. Rodgers. Diffusion of Innovations (New York: The Free Press, 1962).
Lawrence A. Brown, Diffusion Processes and Location: A Conceptual Framework and Bibliography, Bibliography Series No. 4 (Philadelphia, Pa.: Regional Science Research Institute, 1968).
'J. Greig-Smith, Quantitative Plant Ecology (London Penguin Books, 1964).
A.N. Strahler, "Statistical Analysis in Geographic Research," Journal of Geology. Vol. 62, 1954, pp. 1-25.
o
Homer G. Barnett, Innovation: The Basis of Cultural Change (New York: McGraw-Hill and Company Inc. 1953), p. 291.
/
32
10 Elihu Katz, Martin L. Levin and Herbert Hamilton,
"Traditions of Research on the Diffusion of Innovation," American Sociological Review. Vol. 28, 1963, p. 240.
Yehoshua S. Cohen, Diffusion of an Innovation in an Urban Systemf Research Paper No. 140 Dept. of Geography (Chicago: University of Chicago, 1972), p. 9.
12 National Science Foundation "Diffusion of Techno
logical Change," Reviews of Data on Research and Development, No. 31, 1961, p. 493-503.
13 Torsten Hagerstrand, "The Propagation of Innovation
Waves," Lund Series in Geography. Series B, Human Geography, Vol. 4, 1952, pp. 3-19.
., "Migration and Area: survey of a sample of Swedish Migration fields and hypothetical considerations on their genesis," Lund Series in Geography, Series B, Human Geography, Vol. 13, 1957, pp. 27-158.
, "On Monte Carlo Simulation of Diffusion," in William L. Garrison and Duane Marble (eds.), Quantitative Geography, Part I: Economic and Cultural Topics, Northwestern University, Evanston, 111., 1967, pp. 1-32.
14 Richard L. Morrill, "The Negro Ghetto: problems
and alternatives," Geographxc Review, Vol. 55, 1965, pp. 339-361.
5Canada, "The Dominion Housing Act 1935," Statutes of Canada. Chapter 58, pp. 354-355.
16 Canada, "The National Housing Act 1938," Statutes
of Canada. Chapter 49, pp. 353-367.
Canada, "The Improvement Loans Guarantee Act 1937," Statutes of Canada. Chapter 11, pp. 31-34.
Canada, "The National Housing Act 1938," Statutes of Canada. Chapter 11, section 15, pp. 361.
Canada, "The National Housing Act 1944," Statutes of Canada. Chapter 46, pp. 399-422.
'Canada, "The National Housing Act 1964," Statutes

33
of Canada. Chapter 15, Section 23, pp. 111-115.
18 Agreement for Planning Studv of Potential Urban
Renewal Areas, Hamilton, Ontario. (Hamilton: City of Hamilton and Central Mortgage and Housing Corporation, 1957).
19 Hamilton Urban Renewal Study. (Hamilton: Hamilton
Planning Department, 1958). 20 A Detailed, Stttdv of Urban Renewal Areas of the
City of Hamilton (Hamilton: Hamilton Planning Department 1959).

C H A P T E R T H R E E
A DESCRIPTION OF THE HAMILTON CIVIC SQUARE URBAN RENEWAL AREA AND THE BUSINESSES
ORIGINALLY LOCATED THERE
34
A. PHYSICAL CHARACTERISTICS
i) Location and Character
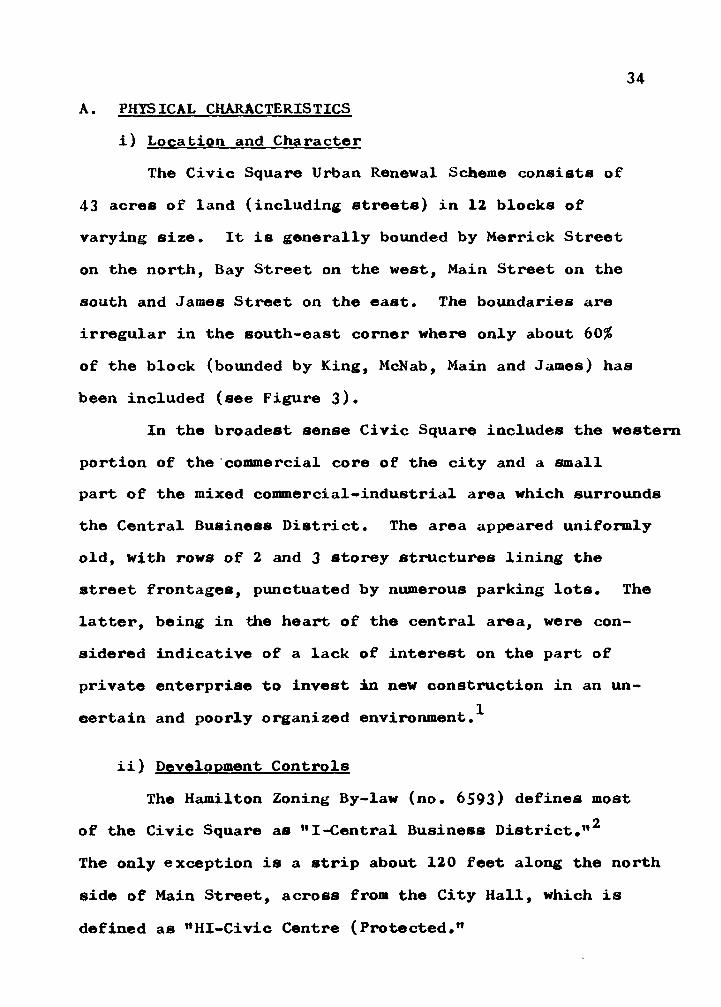
The Civic Square Urban Renewal Scheme consists of
43 acres of land (including streets) in 12 blocks of
varying size. It is generally bounded by Merrick Street
on the north, Bay Street on the west, Main Street on the
south and James Street on the east. The boundaries are
irregular in the south-east corner where only about 60%
of the block (bounded by King, McNab, Main and James) has
been included (see Figure 3).
In the broadest sense Civic Square includes the western
portion of the commercial core of the city and a small
part of the mixed commercial-industrial area which surrounds
the Central Business District. The area appeared uniformly
old, with rows of 2 and 3 storey structures lining the
street frontages, punctuated by numerous parking lots. The
latter, being in the heart of the central area, were con
sidered indicative of a lack of interest on the part of
private enterprise to invest in new construction in an un
certain and poorly organized environment.
ii) Development Controls
The Hamilton Zoning By-law (no. 6593) defines most 2
of the Civic Square as "I-Central Business District."
The only exception is a strip about 120 feet along the north
side of Main Street, across from the City Hall, which is
defined as "Hi-Civic Centre (Protected."
35
Uses permitted in the Central Business District
zone include any residential, institutional or public uses,
commercial uses with few limitations, and some manu
facturing or industrial land uses of very limited size and
type. Maximum height is 10 storeys and/or 120 feet or
greater if within a 75 light angle. Fifteen-foot minimum
rear yards are required, plus side yards for residential
buildings only. The maximum floor area ratio is 11 to 1,
with a bonus permitted in conjunction with the development
of large lots.
The Civic Centre Protected zone permits hotels,
most public uses including libraries, art galleries, ob
servatories, etc., and a variety of common commercial
uses, subject to some restrictions but including offices
and private parking garages. Height limits are 4 storeys
or 55 feet without sideyards, and unlimited when 10-foot
setbacks are provided above the fourth floor. The mini
mum rear yard is ten feet while the maximum permitted floor
area ratio is 8 to 1.
The Official Plan for the City of Hamilton defines
the whole area as commercial; no further policies or de
finitions can be specified due to the absence of any
text in the Plan.
iii) Existing Land Use
The significant feature of land use in the Civic
Square was the great variety and intermixture of uses.

36
These ranged from high-quality store and office space,
associated with the core of the central area, down to
warehouse, manufacturing and wholesale uses in seriously
dilapidated buildings.
The blocks on King Street between James and McNab
Streets contain a number of retail shops and a few service
stores such as restaurants. These were generally high
quality businesses, paying relatively high rents because of
their good location within the C.B.D. and were in old build
ings which had been renovated in terms of their ground floor
space and facade.
A great variety of lower quality retail stores were
scattered along the remainder of King Street as well as on
other streets in the area (particularly York Street). The
level of rent (see appendix 2) which they could support
was generally in inverse proportion to the distance from
the prime corner of King and James Streets. Most of these
were small owner-operated businesses, frequently long-estab
lished and offering varied and specialized products at low
cost and with low profits. They occupied old converted
buildings varying in condition from fair to very poor. A
small amount of space was used for offices, mostly on the
upper floors of buildings scattered throughout the re
newal area.
Table 2 shows a complete list of the retail businesses
which existed in the study area prior to expropriation. There 2
were 112 retail businesses in the area. Of these, 43 were

37
included in the model because they met the two criteria of
being operated by a single proprietor and because they re
located in the study area. As outlined in Chapter One there
were 69 retail businesses not included in the study. Eighteen
were not included because they were part of chain store
operations. As such there was a strong likelihood they
would move into new Civic Square Mall and not be part of the
relocation diffusion to other parts of the C.B.D. Information
concerning the economic viability used as part of the input
for the model was not available for the individual chain
stores in Hamilton but only for the entire chain operation.
Twenty-seven businesses were not included because
they did not relocate in the C.B.D. Some of these were
still planning to relocate but had not done so by September
1973* There were several reasons businessmen did not
plan to relocate in the C.B.D. A few had decided to retire.
Others moved their business to traffic arteries such as
Concession Street. Some relocated in plazas and business
districts in the suburban area of Dundas, Ancaster and
Stoney Creek.
Restaurants and drinking places provided a particular
problem to the Hamilton Civic Square Project. Owners of
restaurants had large investments in equipment which was
very suitable for its location but would not necessarily
be suitable for the locations available in other areas of
the C.B.D. As a result it was decided that the restaurants

38
Table 2: Retail Businesses in the Hamilton Civic Square Study Area
Included in Study
Not Included
S.I.C. Number S.I.C. Description'
1
1 2
4
2 1
2 3 1
1 1
3
3
1
3 1 2 1
2
2
5
2 4 7 3 1 2 1
1 1
6 1 1
2
1 1 16 1 4
1 1
2
3 1
1 1 1 2
5251 5411 5423 5441 5462 5541 5611
5621 5631
5661 5681 5699
5712 5713 5719
5722 5732 5812 5813 5912
5921 5931 5941
5942 5943 5944 5947
5948 5983 5992 5996 5999
Hardware Stores Grocery S tores Meat and Fish Markets Candy, Nut, Confectionery Stores Retail Bakeries Gasoline Service Stations Men's & Boy's Clothing & Furnishing Stores Women* s Ready-to-Wear Stores Women's Accessory and Specialty Stores Shoe Stores Furriers and Fur Shops Miscellaneous Apparel and Accessory Stores Furniture Stores Floor Covering Stores Miscellaneous Home Furnishing Stores Household Appliances Radio and Television Stores Restaurants: Eating Places Restaurants: Drinking Places Drug Stores and Proprietary Stores Liquor Stores Used Clothing Sporting Goods Stores and Bicycle Stores Book Stores Stationery Stores Jewellry Stores Gift, Novelty and Souvenir Stores Luggage and Leather Goods Fuel Oil Dealers Florists Cameras, Photographic Equipment Miscellaneous Retail Stores

39
located in the Civic Square Renewal Area would be pur
chased by the City of Hamilton. Some restaurants did re
locate in the C.B.D. and with the capital available to them
purchased new equipment, created new decor considerably
enhancing their image.
Lastly, seven meat and fish stores were not included
in the relocation model. These businesses had enjoyed a
particular retail affinity and were complemented by the
market located across York Street behind Eaton's department
store. At the time of this study two of these butchers
had retired, two had taken positions with chain grocery
stores and one had relocated in another part of the C.B.D.
to the east of the market. It was hoped by city planners
that they would relocate in the market itself. Plans to
provide suitable accommodation, however, appear to have
never reached fruition.
Table 3
Total Retail Businesses in Study Area 112 Retail Businesses Included in Study 43 (a) i Individual proprietorship 43
ii Relocated in C.B.D. 43 Total Retail Businesses Not Included 69 (a) Individual Proprietorship but did not re
locate in the C.B.D. 27 (b) Not individual proprietorship 18 (c) Restaurants or drinking places 17 (d) Meat and Fish Stores 7
Table 3 shows a summary of the retail businesses
found in the Civic Square Area indicating the numbers included
in the study and those excluded for various reasons.

40
The amount of rent paid by a business was generally
unavailable since the contract between the tenant and the
landlord was considered by both parties to be private in
formation. The rent paid was considered to be high or low
depending on which area of figure 6 the business was located.
The information for this figure was extrapolated from sample
data collected within the C.B.D. as outlined in Chapter 1.
The economic viability of a business was determined by using
Dun and Bradstreet credit ratings as a surrogate.
Table 4 shows a breakdown of the rents paid and the
estimate of the economic viability of the retail businesses
included in the study. These figures were used in the
modified form of the model and explanations are provided
in Chapter V,
Several service industries were located in the Civic
Square Area. They are not included in the study because
they do not depend on necessarily the same trade area as
the retail business; they were in some cases closely inte
grated with the manufacturing and wholesaling sector of the
Civic Square Area economy; the data was not readily avail
able for them with respect to the viability of their enter
prise. Several of the service businesses were closely allied
with the financial sector of the economy. A chartered bank,
licensed loan lender, stock broker, and insurance brokers
were among the service industries located in this area.
Several industries including 7 beauty shops and 7 barber

41
> S.I.C.
5251 5441 5462 5611 5621 5631 5661 5671 5681 5713 5719 5732 5912 5942 5943 5944 5947 5948 5952 5992 5999
Rents of the
^ Total Number
1 1 2 4 2 1 2 1 3 1 2 3 3 3 1 2 1 2 1 2 5
Paid and Retail
Rent High
1 2 1 1 2
2
1 2
1
1
1 15
TABLE 4
Economic Viability Ratings Businesses
Paid Low
1 1 1 2 1
1 1 1 2 3 2 1 1 1 1 1 1 2 4 28
Included
Economic High
1 1
3 1
2
3
1
2 1 1 2
2 1 2 2 25
in Study
Viability Low
2 1 1
1
1 1 3 1 2
1
3 18
43 43 43
shops catered to personal needs. Electric motor repairs and
automobile body repair industries were closely integrated
with the wholesale automobile industries. Physiotherapists,
dentists and optomoetrists represented the health service
field. Other professionals included engineers, architects,
surveyors, and lawyers. Table 5 shows a complete list
of the service industry sector of the economy found in the
Civic Square Area excluded from this study for the reasons
outlined above.

42
TABLE H
Service Industries in the Hamilton Civic Square Study Area
S.I.C. Number
6011 6145 6211 6311 6411
7011 7211 7216
7218 7221 7231 7241 7251 7299 7311 7312 7523 7531 7539 7629 7694 7922 8021 8041 8049 8111 8244 8249 8361 8611 8631 8699 8911
No. of Businesses
1 3 1 1 1
5 2 1
1 3 7 7 4 4 1 1 2 2 2 1 1 1 5 3 1 2 1 1 1 1 4 3 2
S.I.C. Description
Canadian Charter Banks Licensed Small Loan Lenders Security Brokers 6* Dealers Life Insurance Insurance Agents, Brokers & Service Hotels Drycleaners Dry cleaning plants except rugs Industrial cleaners Photographic Studio Beauty Shops Barber Shops Shoe Repair & Hat Cleaning Miscellaneous Personal Services Advertising Agency Outdoor Advertising Service Parking Lots Automobile Body Repairs Ignition and Electric Repair Electrical Repair Shops Electrical Motor Repair Theatrical Producers & Services Dentists Optometrists Physiotherapist Legal Services Business & Secretarial School Vocational School Residential Care Business Association Labour Unions Membership Organizations Engineering & Architectural Services
The greatest variety of land uses and the buildings
in poorest condition were to be found in the blocks furthest

43
removed from James Street. A large amount of space was de
voted to parking lots, particularly near the City Hall on
Main Street. Manufacturing operations were scattered through
out the area, often on upper floors, while wholesale and
warehouse operations were also in dispersed locations. Al
most all of these operations were located close to the
Central Market, some of this space being refrigerated and
most of it having 'drive-in' truck loading.
TABLE 6
Wholesale Businesses in Hamilton Civic Square Study Area
S.I.C. Number
No. of Businesses S.I.C. Description
5013 5021 5048 5049 5051 5064 5086
4 1 3 1 1 1 1
Automotive Parts Supply Furniture Grocery Fruits and Produce Metal Restaurant & Electrical Equip, Dental Equipment
Several automotive parts distributors were located
in the vicinity of Park Street North, most of them occupying
all floor levels of old, converted and dilapidated buildings.
Their primary needs were for a reasonably central location
adequate parking space and a location close to their com
petitors, all of which helped to account for their grouping
in the area. Tables 6 and 7 show a complete list of the
manufacturing and wholesale industries found in the area.

44
TABLE 7
Manufacturing Industries in Hamilton Civic Square Study Area
S.I.C. Number
1711 2512 2751 3231
3572 3599
No. of Businesses
1 1 1 1
1 1
S.I.C. Description
Construction: Special Trade Furniture Manufacturing Commercial Printing Manufactured Products of Purchased Glass Typewriter Manufacturing Miscellaneous non-electrical machinery.
Mixed in with these commercial-industrial uses were
a few old houses and some apartments on upper floors over
stores. These at present accommodated about 500 people
but were mostly in poor condition and had substandard
features.
Three large buildings included in Civic Square have
been retained. These are the Canadian Imperial Bank of
Commerce Building at King and James Streets (a recently
modernized 10-storey office building), Eaton's department
store at York and James Streets and the combined Central
Market and Garage at York and MacNab Streets. The Market
Garage is the only publicly owned building in the Civic
Square Area.

45
This chapter examined the characteristics of the Hamilton
Civic Square Renewal Area. In particular a complete des
cription of the businesses which were found in the area was
provided. Many of these, for reasons which have been cited,
were not included in the relocation diffusion model. Those
which were included are described in greater detail. The
next chapter examines the Central Business District in detail
and outlines the differences that exist in the various sections
of this area of Hamilton.

46
FOOTNOTES TO CHAPTER THREE
Murray V. Jones, Civic Square Area Urban Renewal Area (Toronto: Murray V. Jones and Associates, 1965), pp. 1-43.
The Corporation of the City of Hamilton, Zoning Bylaw No. 6593 (Hamilton: City Clerk's Office, 1968)p. 2.
3Vernon's Hamilton City Directory (Hamilton: Vernon Directories Limited, 1969) pp. 128-200.
^U.S. Statistical Policy Division, Office of Management and Budget, Standard Industrial Classification Manual, 1972. (Washington: U.S. Government Printing Office, 1972) pp. 259-329.

C H A P T E R
A DESCRIPTION OF THE
THE HAMILTON CENTRAL
F O U R
VARIATIONS WITHIN
BUSINESS DISTRICT

47
A. VARIATIONS IN THE HAMILTON CENTRAL BUSINESS DISTRICT
All of the businesses whose relocation decisions are
included in this paper had been located in the Hamilton
C.B.D. It is assumed that they found the trade sufficient
to provide the necessary threshold population for their
business. At the time these businessmen were making their
relocation decision Hamilton with a population just under
500,000 in its metropolitan area was the sixth largest city in
Canada. It had a ten year growth rate from 1959 to 1969 of 28%.
The mean income was 121^ of the national average and ex
ceeded Montreal, Vancouver, Winnipeg, Calgary and Edmonton.
Per capita income in I969 was $2710 with $1360 being spent 1
on retail purchase®. The trade area for the merchants of
the Hamilton Central Business District includes much of the
suburban area around Hamilton such as Stoney Creek, Ancaster,
Dundas, and Burlington. Huff defined a trade area as:
A geographically delineated region, containing potential customers for whom there exists a probability greater than zero of their purchasing a given class of products or services offered for sale by a particular firm or by a particular agglomeration of firms.2
This definition can be shown in a mathematical equation as:
Tj - * (Pij • Ci) x=»l
Where Tj is the trading area of a particular
firm, or agglomeration of firms j, that is, the total
number of consumers within a given region who are likely to
patronize j for a specific class of products or services.

48
Pij is the probability of an individual consumer residing
within a given gradient i shopping at j. Ci is the
number of consumers within a given gradient i. In the
Hamilton trade area the gradient passing through Burlington
may be as low as .10 since many shoppers in that town use
their own Burlington Mall or the new malls in west Toronto.
On the other hand the gradient passing through the western
part of Hamilton may be as high as .80. Regardless of the
exact figures it is assumed that businessmen conducting
a viable enterprise in the Civic Square Area would wish
to relocate in another section of the Hamilton Central
Business District.
Since this study is restricted to businesses which
relocated in the C.B.D. these figures may not seem necessary.
However, it points out two things. First, since the
Hamilton C.B.D. is a viable trade area it is one of the
reasons many of the businesses originally located in the
Civic Square Renewal Area made the decision to stay within
the C.B.D. Secondly it in part justifies not including other
commercial areas within the Hamilton Region as possible
locations in the diffusion model. Thus, assuming the Hamilton
C.B.D. as a whole is a viable answer to the relocation
problem this next section will examine the variations
which exist within the C.B.D. These variations will be
included as factors in the model in the next chapter to
determine their affect on the relocation decision.
49
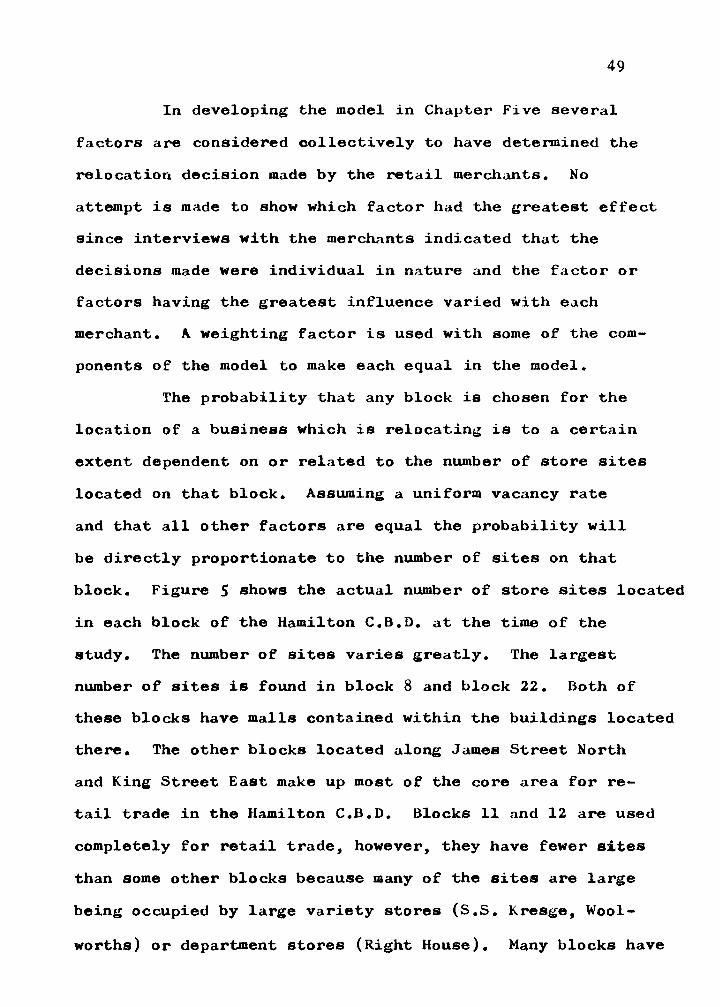
In developing the model in Chapter Five several
factors are considered collectively to have determined the
relocation decision made by the retail merchants. No
attempt is made to show which factor had the greatest effect
since interviews with the merchants indicated that the
decisions made were individual in nature and the factor or
factors having the greatest influence varied with each
merchant. A weighting factor is used with some of the com
ponents of the model to make each equal in the model.
The probability that any block is chosen for the
location of a business which is relocating is to a certain
extent dependent on or related to the number of store sites
located on that block. Assuming a uniform vacancy rate
and that all other factors are equal the probability will
be directly proportionate to the number of sites on that
block. Figure 5 shows the actual number of store sites located
in each block of the Hamilton C.B.D. at the time of the
study. The number of sites varies greatly. The largest
number of sites is found in block 8 and block 22. Both of
these blocks have malls contained within the buildings located
there. The other blocks located along James Street North
and King Street East make up most of the core area for re
tail trade in the Hamilton C.B.D. Blocks 11 and 12 are used
completely for retail trade, however, they have fewer sites
than some other blocks because many of the sites are large
being occupied by large variety stores (S.S. Kresge, Wool-
worths) or department stores (Right House). Many blocks have

CANNON
o c JO m cn
HAMILTON CENTRAL BUSINESS DISTRICT
jn 3sl LSI
ig5 -|42 -M
5
1
ACTUAL NUMBER OF
STORE SITES LOCATED
IN EACH BLOCK
NUMBER ASSIGNED TO BLOCK IN STUDY
2000

51
very low totals. On James Street South many of the blocks
are used primarily for institutional uses (i.e. churches,
Y.M.C.A.) or professional uses (i.e. Alexander Square,
Professional Arts Building, Medical Arts Building). As one
approaches the fringes of the C.B.D. or is removed from the
two main axes - King Street and James Street - the number
of sites decreases with much of the land being used for
parking lots.
Because a city block contains many store sites is
no guarantee that a business will be able to locate there.
Obviously it would be necessary to have a vacant site on-
that block. Figure 6 shows the average vacancy rate for
each block of the Hamilton C.B.D. These were established
with the assistance of Mr. Waind and the Hamilton Real
Estate Board. Not every block within the C.B.D. had vacancies.
To a certain extent this reflects the small number of
store sites found on that block. Some blocks may have had
many sites but few vacancies since the locations were quite
desirable.
High vacancies may occur in undesirable areas of a
C.B.D. If this is the case in some areas of the Hamilton
C.B.D. it will be reflected in the low ratings these blocks
receive for other factors in the relocation model.
This factor in the model is a very dynamic one.
In any block some vacant sites will become occupied but others
may become available at any time. Thus, the vacancy situation

HAMILTON CENTRAL BUSINESS DISTRICT
'mm*. INDICATES HIGH RENT AREA OF C.B.D.
MEAN NUMBER OF VACANCIES RECORDED DURING 1970
a c 3) m
VACANCY FACTOR = 4(No OF VACANCIES)
cn
CANNON
2000

53
at any site may change quickly. Field studies and other
vacancy figures, however, indicated that the vacancy situation
on any individual block did not appear to change very much.
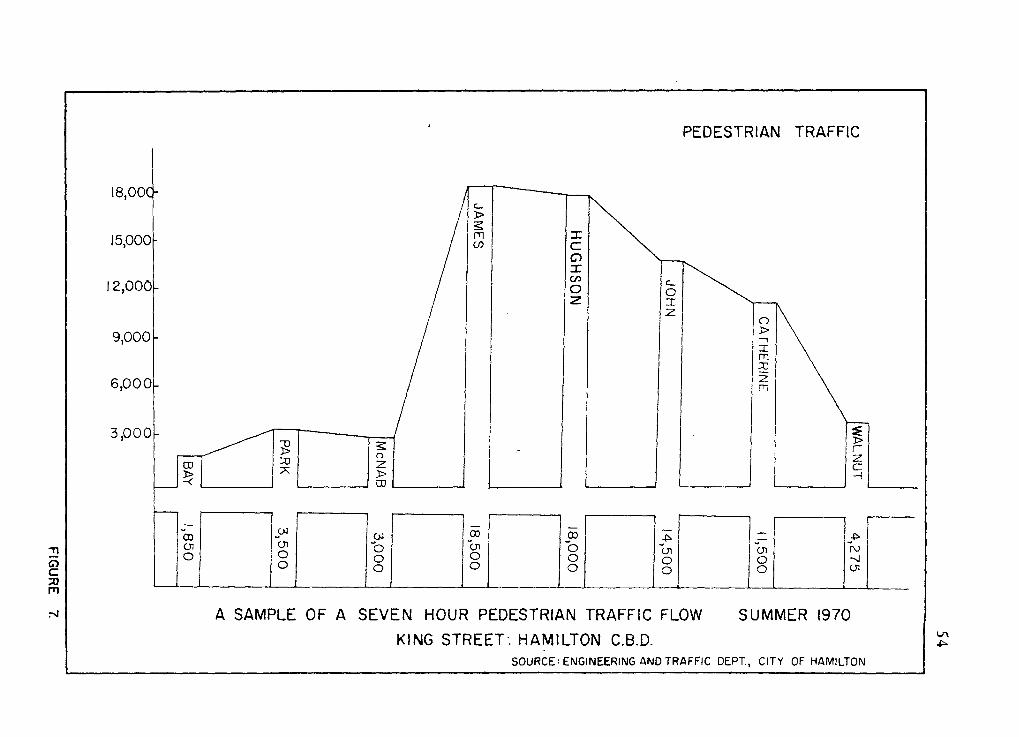
The accessibility of large numbers of potential
customers is widely recognized as a prerequisite for a 3
profitable retail location. Within the C.B.D. there is
a wide range in the amount of pedestrian traffic on each
block. Whether this has resulted from a convergence of
bus routes, main arteries with nearby parking, or the
shopping opportunities provided at any one block is a moot
4 point. Whatever the reasons there is a wide range in the
amount of pedestrian traffic occurring on the various down
town blocks. Figure 7 shows a sample of a seven hour
pedestrian traffic flow along King Street. This was re
corded during the summer of 1970 with the datum for each
corner being the sum of data recorded for pedestrian
crossings in each direction at the corner of the block.
The blocks located on King Street East have much heavier
pedestrian traffic than the blocks located along King Street
West. The pedestrian traffic along King Street East is
heaviest at James Street and decreases on the blocks further
east. Once pedestrian traffic was collected for each block
within the C.B.D. an accessibility factor was interpolated
from this data. Figure 8 shows the accessibility factor
used for each block of the model. The actual method at
arriving at this figure is explained in the next chapter
I8.00C
15,000
12,000
9,000
6,000
3,000
-
-
-
m > -c
OD
o
PEDESTRIAN TRAFFIC
3 X 7K
o o
2
2
> CD
OJ
"o o o
>
m CO
-
f'
c o X cn
o
o
1
5 o o o
o X 2 o
> H X m XI 2 m
"CJI o o
cn O o
\
\
\
t J>
r cz —i
,4* "fvJ •^1 CJl
A SAMPLE OF A SEVEN HOUR PEDESTRIAN TRAFFIC FLOW SUMMER 1970
KING STREET-. HAMILTON C.B.D. SOURCE: ENGINEERING AND TRAFFIC DEPT, CITY OF HAMILTON

HAMILTON CENTRAL DISTRICT
BUSINESS
1/1 L
12 ACCESSIBILITY FACTOR INTERPOLATED FROM PEDESTRIAN TRAFFIC DATA
o c 33
m oo
CANNON
12 12 12 JSUJB
^
2000
I = 667'

56
on page 64. It will be noted that pedestrian traffic de
creases in all directions from the corner of king Street
and James Street.
The fourth factor included in the basic model which
attempts to assess the differences and variations which
exist within the Hamilton C.B.D. is a distance decay factor.
It is assumed that businessmen will wish to acquire new
locations which are close to their former locations in order
not to lose regular customers who may have patronized their
business. This is particularly true for customers who walked
to the former location. These customers may have lived in
apartments nearby, walked to the store during noon hour breaks
or stopped at the store on their way to and from parking
lots. Figure 9 shows the data for the actual distance de
cay factor used in the model. It will be noted that each
block adjacent to the Civic Square Renewal Area has a score
of twenty. Blocks which are situated one block from the
Civic Square Area have a score of fifteen. Blocks two re
moved have a factor score of ten, blocks three removed have a
factor score of five and all other blocks have a factor
score of one.
The distance decay factor is weighted in units of
five in order to make the highest values equal the highest
values of the other factors and the lowest value equal the
lowest values of the other factors.
Assigning a factor score for a distance decay
factor changes the relative strength of the probabilities

HAMILTON CENTRAL BUSINESS DISTRICT
20 20
20
CD C
m IP
DISTANCE DECAY FACTOR
USE IN THE MODEL
CANNON
15 10
15 10
10
DUKE ST
5
q 2000
I = 6 6 7

58
on King Street West. These blocks have low scores when the
other factors are used alone yet a few businesses did
locate on King Street West. Interviews indicated that a
desire to be close to their old locations was a definite
factor in their relocation decision.
In assessing the possibilities of any new location
each entrepreneur had to decide what rent he could afford
or his business could withstand. For this reason it was
necessary to collect information about the rents charged
for retail floor space in the various areas of the Hamilton
C.B.D. Eleven of the blocks within the study had prime
floor space for rent and thus they were considered to con
stitute the high rent area of the C.B.D. (see Figure 5).
The other thirty-six blocks in the study had properties for
rent at an amount which was considerably less than the
high rent area (see appendix 2).
Having assessed and described the businesses in
cluded in the study as well as the variations within the
Hamilton C.B.D. it is necessary to develop the model in
the next chapter.

FOOTNOTES TO CHAPTER FOUR
1969 Survey of Markets and Business Year Book (Toronto: McLean Hunter Limited, I969) p. 141.
2 David L. Huff, "Defining and Estimating Trade
Area," Journal of Marketing. 1964, pp. 34-38.
3 John E. Mertes, "A Retail Structural Theory for
Site Analysis," Journal of Retailing. Vol. 40, No. 2, (Summer 1964), p. 23.
^Hamilton Street Railway Annual Reports (Hamilton: Hamilton Street Railway, 1969) pp. 20-30.
Field Survey conducted by the author.
"Peter Scott, Geography and Retailing (London: Hutchinson and Company 1970),P» 25.

C H A P T E R F I V E
THE MODEL

60
A. THE MEAN INFORMATION FIELD
In many geographical diffusion studies the area
which receives the phenomena which are relocating, changes
or moves after each one of the phenomena has relocated.
This is done for two reasons. First, the study may deal
with contagious diffusion and the movements in the second
stage of diffusion will originate from the new location
which was generated or designated in the first stage of
the diffusion. Second, the study may be a relocation study
which studies simultaneous movement of phenomena which are
originally widely dispersed. The mean information field in
the two cases mentioned must be dynamic to allow for
differences which would be evident at the different places
of origin. In this thesis the place of origin, the Civic
Square Urban Renewal Area, is contagious and small relative
to the Central Business District as a whole. The type of
diffusion study which is considered is not contagious.
For these reasons the Mean Information Field (here
after referred to as M.I.F.) in this study is fixed. It
consists of the Hamilton Central Business District which
is shown in Figure 10. The eastern limit is Wellington
Street; the southern limit is Duke Street; the western
limit is Hess Street; the northern limit is Cannon Street.
The main axes are King Street running east and west and
James Street running north and south. The numbers shown
on each block are those to which reference is made in this

HAMILTON CENTRAL BUSINESS DISTRICT
CANNON
BLOCK NUMBERS REFERRED TO IN STUDY
GORE PARK
CLEARED EXPROPRIATED AREA CIVIC SQUARE
35
34
26
L33 33
32
28
^
31
29
DUKE ST 30
1000 2000
6 6 7

62
chapter. In total there are 47 blocks in the C.B.D. of
Hamilton which is the M.I.F. of this study.
B- THE BASIC COMPONENTS OF THE MODEL
The basic model is build around four factors which
are used to determine the probability in that block that
any business would relocate (for each block of the Hamilton
C.B.D.). This formula is additive rather than multiplicative.
In certain circumstances it may be impossible for a block
within the Central Business District to receive a business
when it relocates. If a block had no vacant store sites
at the time a business was relocating it would be impossible
for that block to receive that business. This factor
in the formula would be zero. Since the number of vacant
stores sites in any block is often rapidly changing and since
there is often a lag between the time data is collected and
subsequently used it was decided the formula should be additive.
In this way no block was eliminated from the possiblity of
receiving a business even though at the time of the survey
or data collection there was no store vacancy on that block.
In this situation the weight of the probability would be
determined by the other factors.
Each factor or component in the basic model is
given an equal weighting in the formulae used. It is
quite possible one factor is more important in determining
the relocation of the businesses in particular cases. How-
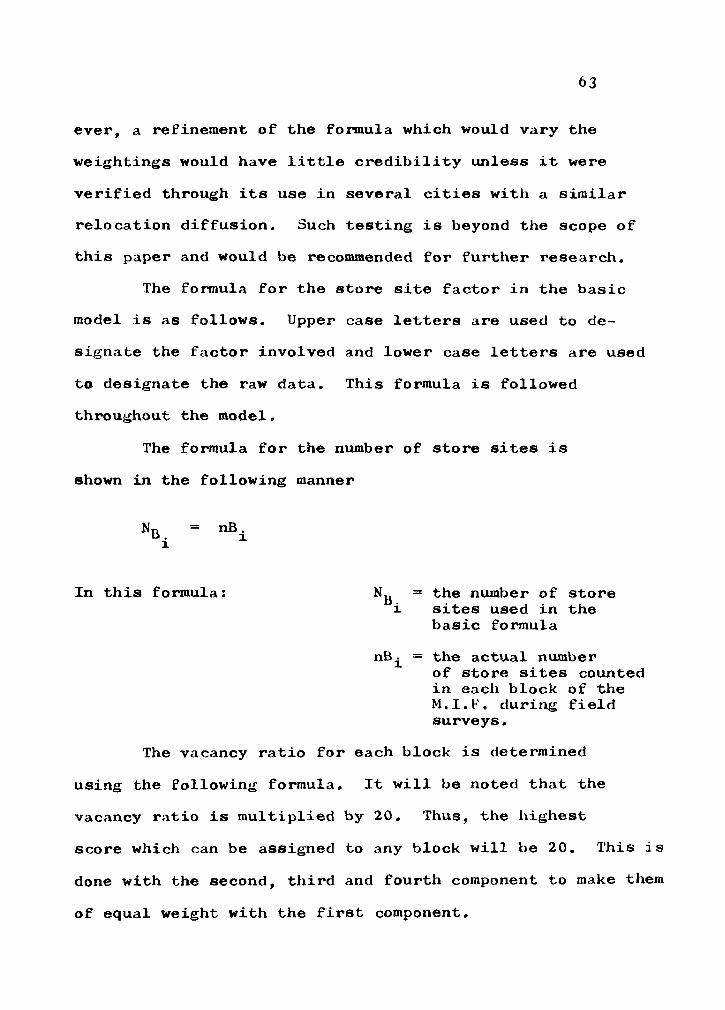
63
ever, a refinement of the formula which would vary the
weightings would have little credibility unless it were
verified through its use in several cities with a similar
relocation diffusion. Such testing is beyond the scope of
this paper and would be recommended for further research.
The formula for the store site factor in the basic
model is as follows. Upper case letters are used to de
signate the factor involved and lower case letters are used
to designate the raw data. This formula is followed
throughout the model.
The formula for the number of store sites is
shown in the following manner
N n = nB. B.
In this formula: N. = the number of store i sites used in the
basic formula
nB^ = the actual number of store sites counted in each block of the M.I.F. during field surveys.
The vacancy ratio for each block is determined
using the following formula. It will be noted that the
vacancy ratio is multiplied by 20. Thus, the highest
score which can be assigned to any block will be 20. This is
done with the second, third and fourth component to make them
of equal weight with the first component.

64
vB. V = i- . 20 \ v Bh
In this formula: vB. = the mean number of vacant sites for block i during the survey period.
vB. = is the actual mean number of vacant sites for the block with the highest mean number of vacant sites during the survey period. In this thesis this number is 5.
An important consideration in determining a new
location for any business is the accessibility that the
shoppers within the trade area will have to that site.
Generally, the entire C.B.D. is accessible and it is
difficult to isolate the most accessible parts from the
least accessible parts. As a surrogate measure of this
factor, pedestrian traffic data was collected for each
intersection within the study area. A factor was assigned
each block by taking the mean of the pedestrian traffic
entering the block at each corner of the busiest traffic
artery (street) of the block.
The accessibility factor for each block is deter*
mined using the following formula:
aB. ABi - alT ' 2°
h

65
In this formula: AB. = the actual pedestrian traffic x along the busiest edge (street)
of block i as determined by the traffic counts of the Hamilton Traffic and Engineering Department
aBn = the actual pedestrian traffic along the busiest edge (street) of the block located in the M.I.F. which had the highest pedestrian traffic count as determined by the Hamilton Traffic and Engineering Department.
The distance decay factor for each block is
determined using the following formula:
DBi " k • f
k = is a constant required to make the highest category match the total of the highest other factors. In this thesis the constant is 5 since there are 4 categories in the distance decay mapping and the highest category for other factors is 20.
d = distance decay factor which is assigned the rings of blocks. These range from 4 for those blocks adjacent to the Civic Square Renewal Area, 3 for those blocks one block further away, 2 for those blocks 3 blocks away from the Civic Square Renewal Area and 1 for all blocks 4 blocks away from the Civic Square Renewal Area and 1/5

66
for all other blocks.
C. THE BASIC MODEL
The model in this thesis can be expressed in the
following mathematical formula.
PBi ^NBi+VBi+AB.+DBi)
(NBl+VB +ABi+DBl...NBn+Vun+ABi+DBi
In this formula: PB_ = the probability that block x i in the Hamilton Central
Business District will receive any business which is relocating
Ng = the number of store sites i which are located on block
i
V = the vacancy factor for block i i
A = the accessibility factor for i block i
Dg = the distance decay factor i for block i
The probability that any one block in the M.I.F.
would receive a retail business during the relocation
diffusion process is expressed by the above formula. Each
factor - the number of store sites, store vacancies, access
ibility, distance decay - is given an equal weight in the
formula.
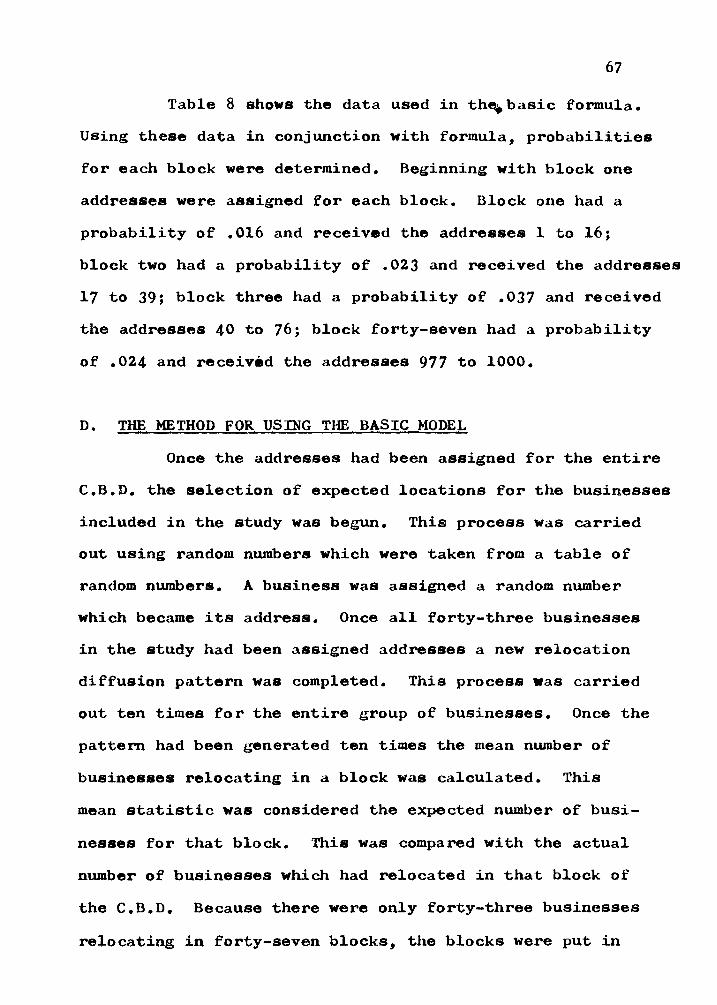
67
Table 8 shows the data used in the^basic formula.
Using these data in conjunction with formula, probabilities
for each block were determined. Beginning with block one
addresses were assigned for each block. Block one had a
probability of .016 and received the addresses 1 to 16;
block two had a probability of .023 and received the addresses
17 to 39; block three had a probability of .037 and received
the addresses 40 to 76; block forty-seven had a probability
of .024 and received the addresses 977 to 1000.
D. THE METHOD FOR USING THE BASIC MODEL
Once the addresses had been assigned for the entire
C.B.D. the selection of expected locations for the businesses
included in the study was begun. This process was carried
out using random numbers which were taken from a table of
random numbers. A business was assigned a random number
which became its address. Once all forty-three businesses
in the study had been assigned addresses a new relocation
diffusion pattern was completed. This process was carried
out ten times for the entire group of businesses. Once the
pattern had been generated ten times the mean number of
businesses relocating in a block was calculated. This
mean statistic was considered the expected number of busi
nesses for that block. This was compared with the actual
number of businesses which had relocated in that block of
the C.B.D. Because there were only forty-three businesses
relocating in forty-seven blocks, the blocks were put in

68
groups of eight and the sum of the actual for all the blocks
in a group was compared to the sum of the expected for all
the blocks in the same group. Pearsonian Product Moment
Correlation tests were administered to test the strength
of the relationship between the actual and the expected.
The results of these tests are completely described and
explained in Section F of this chapter.
E. THE MODIFIED MODEL
The basic model used characteristics of the mean
information field as the significant variables which would
determine the pattern of the relocation diffusion process
while assuming the phenomena relocating were equal or
uniform in all respects.
It is true that all the businesses relocating had
a number of characteristics in common. They were retail
businesses; they were operated by a single proprietor; they
had been located in the Civic Square Renewal Area; they
all relocated in another area of the Central Business
District. Despite these similarities the businesses differed
in rather significant ways. Some of the businesses were
located in high rent sections of the Civic Square Area while
the remainder paid comparatively low rents. The better locations
of the C.B.D. command higher rents and businessmen will attempt
to relocate in the best location they can afford. Those
in high rent areas will attempt to relocate in the high rent

69 TABLE 8 DATA FOR BASIC FORMULA OF THE MODEL
ILOCK 1 2 3 4 5 6 7 8 9
10 1 1 12 13 14 15 16 17 18 19 20 2 1 22 23 24 25 26 27 28 29 30 3 1 32 33 34 35 36 37 38 39 40 4 1 42 43 44 4 5 46 47
s. 1
1 1 20 10
8 20
5 35
9 2
18 18 2 1 1 3 2 1 14 14 15 14 12 14 58 16
8 12
1 I 6 4 1 9 1 1 1 1
1 5 10 12 12
2 3 2 5 3 4 2 5
V. — 4
16 8 4
12 4
16 8
— - -
4 12 12 20 12 12 16 18 12
8 20
4 4 4
— — — — - -
4 — — — _ -
8 —
4 4
— — - -
4 4 4
— 8
A. 3 3 3 2 2 7 2
2 2
20 18 12
9 7 5 3 2 2 3 5 8
12 12 12
9 2 2 2 1 1 2 2 2 9
12 4 3 2 1 1 1 1 1 1 1 1
D. 20 15 15 10
5 20 15 20 15 10 20 15 10
5 5 5 1 1
1 1 1 5 5
10 10 15 10
5 5 1 1 1 5 5
10 15 20 20 20 20 20 1 5 10
5 5
10 15 20
P . . 0 1 6 . 0 2 3 . 0 3 7 . 0 2 1 . 0 1 3 . 0 4 2 . 0 1 8 . 0 5 8 . 0 2 4 . 0 0 9 . 0 4 0 . 0 3 8 . 0 3 8 . 0 2 7 . 0 3 6 . 0 2 5 . 0 2 1 . 0 2 4 . 0 1 7 . 0 1 9 . 0 2 2 . 0 6 3 . 0 2 9 . 0 2 4 . 0 3 0 . 0 1 3
. 0 0 9
. 0 0 5
. 0 0 2
. 0 1 0
. 0 0 6
. 0 0 6
. 0 0 9
. 0 1 7
. 0 1 9
. 0 2 4
. 0 2 7
. 0 2 7
. 0 1 6
. 0 1 3
. 0 0 9
. 0 1 0
. 0 0 9
. 0 1 3
. 0 1 2
. 0 2 4
ADDRESSES 1 -16
1 7 - 3 9 4 0 - 7 6 7 7 - 9 7 9 8 - 1 1 0
1 1 1 - 1 5 2 1 5 3 - 1 7 0 1 7 1 - 2 2 8 2 2 9 - 2 5 2 2 5 3 - 2 6 1 2 6 2 - 3 0 1 3 0 2 - 3 3 9 3 4 0 - 3 7 7 3 7 8 - 4 0 4 4 0 5 - 4 4 0 4 4 1 - 4 6 5 4 6 6 - 4 8 6 4 8 7 - 5 1 0 5 1 1 - 5 2 7 5 2 8 - 5 4 6 5 4 7 - 5 6 8 5 6 9 - 6 3 1 6 3 2 - 6 6 0 6 6 1 - 6 8 4 6 8 5 - 7 1 4 7 1 5 - 7 2 7 « o O ** *\ 1
734-742 743-747 748-749 750-759 760-765 7 6 6 - 7 7 1 772-780 781-797 798-816 817-840 841-867 868-894 895-910 911 -923 924-932 933-942 943 -951 952-964 965-976 977-1000
70
area of the C.B.D. It can be assumed that if a businessman
could only afford a low rent site in the Civic Square Area
he will likely be forced to relocate his business in the
other low rent area of the C.B.D. Although this is logical
and straightforward it overlooks some important considerations.
Not all businesses have perfect knowledge of the urban land
market. Many businessmen have seen the profitability of
their business change radically since they moved into their
old location. Therefore a man operating a business which
has been very successful in a low rent area may be tempted
to acquire a location in a high rent area in the hope that
increased sales will more than offset any increase in rent.
Unfortunately some businessmen have seen their profit de
cline in their old location. As a result they may wish to
relocate in a new site which has a lower rent than was being
paid at the old location. As a surrogate for the success
of a particular business Dun and Bradstreet credit appraisals
were used.
It was difficult to determine exactly how well the
businesses in this study were actually doing. No financial
statements or profit or loss statements were available.
As a surrogate to overcome this void in the research data,
composite credit appraisals available from Dun and Bradstreet*s
Middle Market Directories were used. Retail businesses are
very dependent on having credit extended to them by the
various wholesalers who supply them. The better a firra»s
credit appraisal the more merchandise they will be able to

71
have on hand. This, of course, provides them greater
opportunities for sales and hence profits. It is assumed
that each business in this study wishes to have the highest
credit appraisal possible. It is also assumed that a fair
or limited credit appraisal is an indication that the firm*s
profit in the months proceeding the appraisal was less
than the amount desired.
During expropriation proceedings from 1969 to 1972
the normal business patterns in the Civic Square Area were
greatly disrupted. For this reason credit appraisals during
this period were often not listed or classified for the
businesses in this study. For this reason the figures
collected came from the March editions of 1965, 1966 and
1967.
Interviews with the retail merchants in Hamilton
confirmed the following trends. Four out of five businesses
with good or high credit appraisals which had been located
in the high rent area of the Civic Square Area located in
the high rent area of the C.B.D. One out of every five
businesses with these credentials relocated in the low
rent area of the C.B.D. Four out of five businesses with
a fair or limited credit appraisal which had been located
in the low rent sections of the Civic Square Area were
forced to relocate in the low rent areas of the C.B.D. As
in the former case it was found that about one out of
five businesses with these characteristics shifted the rent

72
structure of the operating costs.
Businesses which had been in the high rent area but
had only fair or limited credit appraisals as well as
businesses which had been in the low rent area but had good
or high credit appraisals showed no marked trend to relocate
in the high rent areas or low rent areas of the C.B.D.
Table 9 summarizes these trends and relates them to pro
babilities which will be used as input in determining
probabilities and addresses for the modified form of the
basic model.
TABLE 9
PROBABILITIES OF RELOCATION RELATED TO ECONOMIC VIABILITY AND RENT PAID
Former Probability of Relocating in:
Characteristics Hi^h Rent Area or Low Rent Area
1. High rent/good credit .800 .200
2. High rent/limited credit .500 .500
3. Low rent/good credit .500 .500
4. Low rent/limited credit .200 .800
The figures collected for the businesses included in this
study showed 25 had high or good credit appraisals and 18
had only fair or limited appraisals. Of the twenty-five
businesses which had high credit appraisals eleven were
located in the high rent areas and fourteen were located
in the low rent areas of the Civic Square Area. Of the
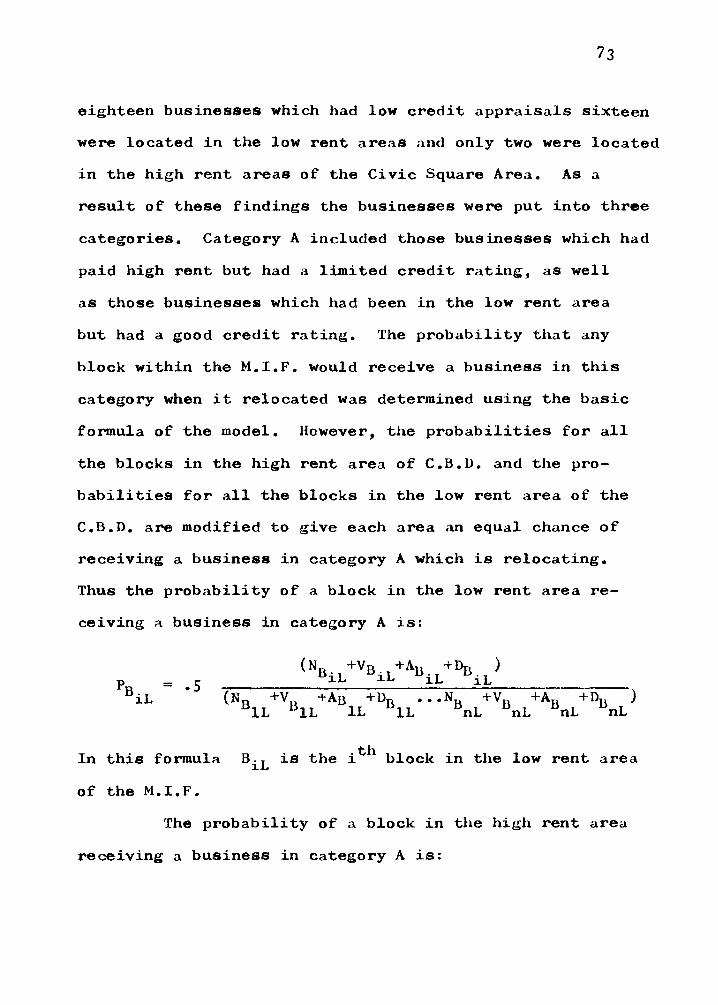
73
eighteen businesses which had low credit appraisals sixteen
were located in the low rent areas and only two were located
in the high rent areas of the Civic Square Area. As a
result of these findings the businesses were put into three
categories. Category A included those businesses which had
paid high rent but had a limited credit rating, as well
as those businesses which had been in the low rent area
but had a good credit rating. The probability that any
block within the M.I.F. would receive a business in this
category when it relocated was determined using the basic
formula of the model. However, the probabilities for all
the blocks in the high rent area of C.B.D. and the pro
babilities for all the blocks in the low rent area of the
C.B.D. are modified to give each area an equal chance of
receiving a business in category A which is relocating.
Thus the probability of a block in the low rent area re
ceiving a business in category A is:
( NB i L+ VB i L
+ Ab. L+ DB i L>
PBlL _ 'S ( N B 1 L+ V B 1 L
+ A \ L+ D B 1 L - " X ;
+ V B n L+ A B n L
+ DB n L >
In this formula B-L is the i block in the low rent area
of the M.I.F.
The probability of a block in the high rent area
receiving a business in category A is:
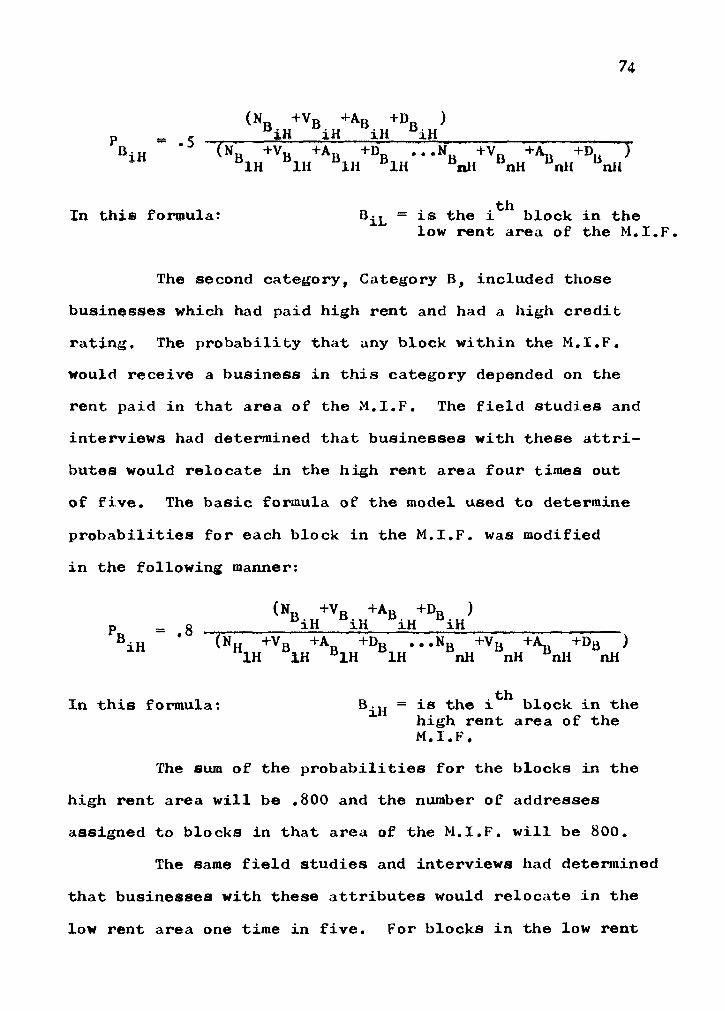
74
(N +VB +AB +D ) P „ r iH iH jH aiH B *5 iH (NB + V
B +A B +DB ...N +VB +A.. +D.. ) lH B1H B1H B1H B1H BnH BnH % H bnii
th In this formula: B^L = is the i block in the
low rent area of the M.I.F,
The second category, Category B, included those
businesses which had paid high rent and had a high credit
rating. The probability that any block within the M.I.F.
would receive a business in this category depended on the
rent paid in that area of the M.I.F. The field studies and
interviews had determined that businesses with these attri
butes would relocate in the high rent area four times out
of five. The basic formula of the model used to determine
probabilities for each block in the M.I.F. was modified
in the following manner:
(N +VB +AB +DB ) p = g xH iH iH iH B.H ' (NH +VB +A +DB ...NB +VB +A^ +DB )
IH IH B1H IH nH nH anU nH
th In this formula: B.„ = is the i block in the
high rent area of the
M.I.F.
The sum of the probabilities for the blocks in the
high rent area will be .800 and the number of addresses
assigned to blocks in that area of the M.I.F. will be 800.
The same field studies and interviews had determined
that businesses with these attributes would relocate in the
low rent area one time in five. For blocks in the low rent

75
area the basic formula for determining probabilities for
each block in the M.I.F. was modified in the following
manner:
(NB +VB +AB +DB ) P = 2 iL iL iL iL B ± L ' (NB +VB +AB +DB ...NB +VB +AB +DB )
IL IL IL IL nL nL nL nL
In this formula: B.T = is the i block in the low rent area of the M.I.F.
The sum of the probabilities for the blocks in
the low rent area will be .200 and th? number of addresses
assigned to the blocks in that area of the M.I.F. will be
200. The sum of the probabilities for all the blocks in
the M.I.F. used in conjunction with businesses in category
B is 1.000 and with addresses assigned total 1000.
The third category, eaLegury C, included those
businesses which had paid low rent and had a low credit
rating. The probability that any block within the M.I.F.
would receive a business in this category depended on the
rent paid in that area of the M.I.F. The field studies and
interviews had determined that businesses in this category
would relocate in the low rent area of the M.I.F. four
times out of five. For blocks in the low rent area the
basic formula was modified in the following manner.
(NB +Vfi +AB +DB ) p = 8 B i L ' (N +VB +A +D ...NB +VB +AB +J^ )
IL IL IL IL nL nL nL nL

76
In this formula: B. = is the i block in the i L low rent of the M.I.F.
The sum of the probabilities for the blocks in
the low rent area will be .800 and the number of addresses
assigned to the blocks in that area of the M.I.F. will be
800.
The same field studies and interviews had determined
that businesses with these attributes would relocate in
the high rent area one time in five. For blocks in the
high rent area the basic formula for determining probabilities
for each block in the M.I.F. was modified in the following
manner:
(NB +VB +AQ +DB ) p = 2 iH iH iH iH
B . „ • (N_ +vT +A~ +DT . . ,Nn +v\, +ATJ TbT J 1 H B,„ o B-.„ B-„ B u H u B B ' IH IH IH IH nH nH nH nH
In this formula: B.„ = is the i block in l H the high rent area of
the M.I.F.
The sum of the probabilities for the blocks in
the high rent area will be .200 and the number of addresses
assigned to the blocks in that area of the M.I.F. will be
200.
The sum of the probabilities for all the blocks in
the M.I.F. used in conjunction with the businesses in
category C is 1.000 and the addresses assigned total 1000.
Table 10 shows a complete breakdown of the pro
babilities and addresses which were used for the various

77
TABLE 10 PROBABILITIES AND ADDRESSES DERIVED FROM THE MODIFIED FORMULAE OF THE MODEL
BLOCK NO. 1 2
3 4 5 6 7 8 H 9
10 11 H 12 H 13 H 14 H 15 H 16 17 18 19 20 21 22 H 23 H 24 H 9 C U — j »*
26 27 28 29 30 31 32 33 34 35 36 H 37 38 39 40 41 42 43 44 45 46 47
CATEGORY A P. .013 .019 .031 .018 .011 .035 .015 .073 .020 .008 .050 .047 .047 .034 .045 .021 .018 .020 .014 .016 .018 .078 .036 .030 ni7
. w ^ /
.011
.005
.008
.004
.002
.008
.005
.005
.008
.014
.023
.020
.022
.022
.013
.011
.008
.008
.008
.011
.010
.020
A. 1-13
14-32 33-63 64-81 82-92 93-127
128-142 143-215 216-235 236-243 244-293 294-340 341-387 388-421 422-466 467-487 488-505 506-525 526-539 540-555 556-573 574-651 652-687 688-717 71 a_TC/l / — ~ 1 J-9
755-765 766-770 771-778 779-782 783-784 785-792 793-797 798-802 803-810 811-824 825-847 848-867 868-889 890-911 912-924 925-935 936-943 944-951 952-959 960-970 971-980 981-1000
CATEGORY B P. .005 .008 .013 .007 .004 .014 .006 .115 .008 .003 .079 .076 .076 .054 .072 .009 .007 .008 .006 .006 .008 .124 .058 .048 n^n
. V \J V
.004
.002
.003
.002
.001
.003
.002
.002
.003
.006
.038
.008
.009
.009
.005
.004
.003
.003
.003
.004
.004
.008
A. 1-5 6-13
14-26 27-33 34-37 38-51 52-57 58-172
173-180 181-183 184-262 263-338 339-414 415-468 469-540 541-549 550-556 557-564 565-570 571-576 577-584 585-708 709-766 767-814 si c^a-iA y j ^ j — yJI •»
875-878 879-880 881-883 884-885
886 887-889 890-891 892-893 894-896 897-902 903-940 941-948 949-957 958-966 967-971 972-975 976-978 979-981 982-984 985-988 989-992 993-1000
CATEGORY C P. .020 .032 .052 .028 .016 .056 .024 .029 .032 .012 .020 .019 .019 .013 .018 .036 .028 .032 .024 .024 .032 .031 .015 .012
m r • W A J
.016
.008
.012
.008
.004
.012
.008
.008
.012
.024
.009
.032
.036
.036
.020
.016
.012
.012
.012
.016
.016
.032
A. 1-20
21-52 53-104
105-132 133-148 149-204 205-228 229-257 258-289 290-301 302-321 322-340 341-359 360-372 373-390 391-426 427-454 455-486 487-510 5H-534 535-566 56 7-597 598-612 613-624 A 0 r £. in v/^ j — \> oy 640-655 656-663 664-675 676-683 684-687 688-699 7OO-707 708-715 716-727 728-751 752-760 761-792 793-828 829-864 865-884 885-900 901-912 913-924 925-936 937-952 953-968 969-IOOO

HAMILTON CENTRAL DISTRICT
BUSINESS
8 «
3S9
848 867
MEAN INFORMATION FIELD'
ADDRESSES ASSIGNED BLOCKS USED IN
CONJUNCTION WITH BUSINESSES IN
CATEGORY A
CANNON
811-824
803-8!0
755-765
766- 1 770^J
JBUMOL
7 9 8 -802
793-797
785-792
DIKE ST
7 7 1 -778
^
779-782
7 8 3 -784
2 0 0 0
6 6 7
oo

HAMILTON CENTRAL DISTRICT
BUSINESS
94<
957
941-948
MEAN INFORMATION FIELD =
ADDRESSES ASSIGNED BLOCKS USED IN
CONJUNCTION WITH BUSINESSES IN
CATEGORY B.
CANNON
2000
^1
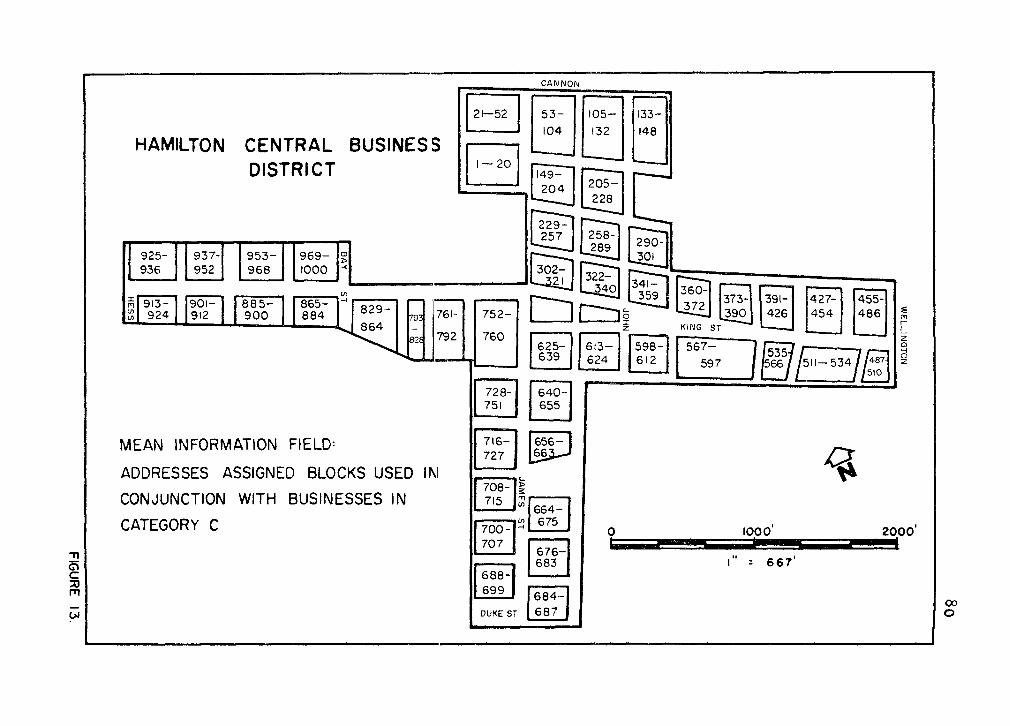
HAMILTON CENTRAL BUSINESS DISTRICT
CANNON
925-936
937-952
913-924
901-912
427-454
455-4 8 6
MEAN INFORMATION FIELD'
ADDRESSES ASSIGNED BLOCKS USED IN
CONJUNCTION WITH BUSINESSES IN
CATEGORY C
- 5 3 4 7 J
m r
a - t o
708-715
700-707
ess-egg
DUKE S
> 2 U)
H
r
664-675
6 7 6 -683
684 -687
^
2000
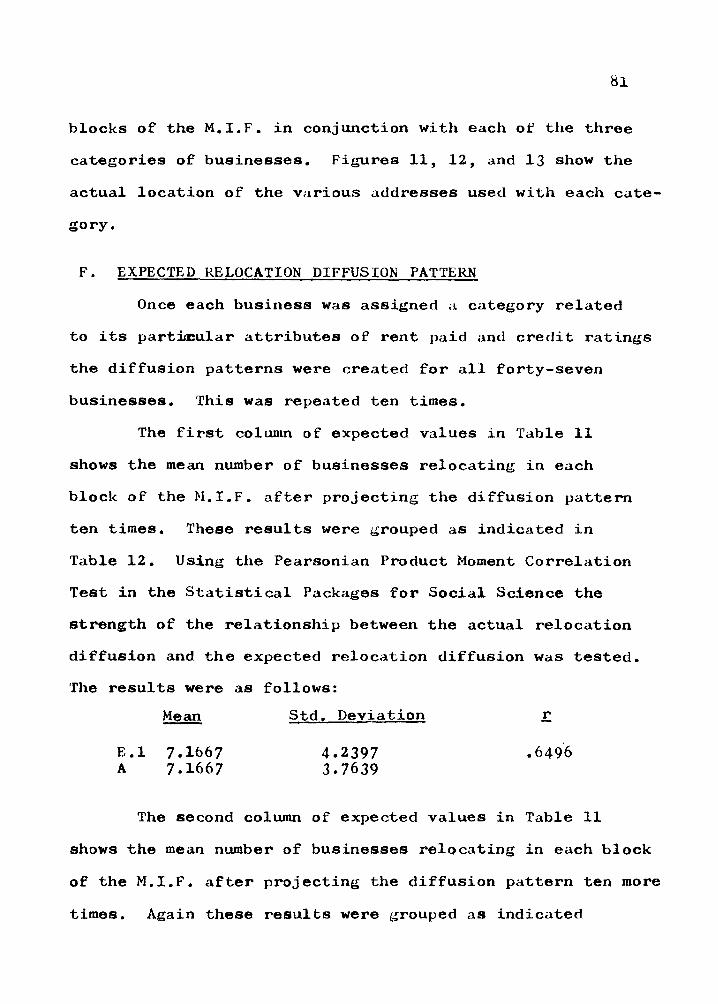
81
blocks of the M.I.F. in conjunction with each of the three
categories of businesses. Figures 11, 12, and 13 show the
actual location of the various addresses used with each cate
gory.
F. EXPECTED RELOCATION DIFFUSION PATTERN
Once each business was assigned a category related
to its particular attributes of rent paid and credit ratings
the diffusion patterns were created for all forty-seven
businesses. This was repeated ten times.
The first column of expected values in Table 11
shows the mean number of businesses relocating in each
block of the M.I.F. after projecting the diffusion pattern
ten times. These results were grouped as indicated in
Table 12. Using the Pearsonian Product Moment Correlation
Test in the Statistical Packages for Social Science the
strength of the relationship between the actual relocation
diffusion and the expected relocation diffusion was tested.
The results were as follows:
Mean Std. Deviation r
E.l 7.1667 4.2397 .6496 A 7.1667 3.7639
The second column of expected values in Table 11
shows the mean number of businesses relocating in each block
of the M.I.F. after projecting the diffusion pattern ten more
times. Again these results were grouped as indicated

82
in Table 12. The Pearsonian Product Moment Correlation test
was administered. The results were:
Mean Std. Deviation r
E.2 7.1667 4.6877 .6238
A 7.1667 3.7639
The third column of expected values in Table 11
shows the mean number of businesses relocating in each
block of the M.I.F. after projecting the diffusion pattern
another ten times. Once more these results were grouped
as is shown in Table 12. The results from the Pearson Product Moment Correlation test were:
Mean Std. Deviation r
E.3 7.1667 4.2415 .6544 A 7.1667 3.7639
These tests had four degrees of freedom. The
number of degrees of freedom is equal to N - n where N
is the number of groups of observations (pairs, trials,
etc.) and n is the number of variables, counting both
dependent and independent variables. The tests reported
here compared two variables, one dependent one independent.
The results were arranged and tabulated in six groups of
observations. Thus, the degree of freedom was equal to
six minus two.

83
TABLE 11 ACTUAL AND PROJECTED RESULTS USING THE RELOCATION DIFFUSION MODEL
BLOCK ACTUAL 1. EXPECTED 2. EXPECTED 3. EXPECTED NO. 1 2 3 4 5 6 7 8 9
1 0 1 1 12 13 1 4 15 16 17 18 19 20 21 22 23 2 4 o r "J 26 27 28 29 30 31 32 33 34 35 36 37 38 39 40 41 42 43 44 45 46 47
_ _ _ _ 1.0 2 . 0 -.—-.— 2.0 2.0 1.0 5.0 1.0 1.0 1.0 __-._
1 . 0 1.0 2 . 0 ——_ 4 . 0 ——_— 1 . 0
4 . 0 1 . 0 2 . 0 1. 0
__ — _
— _-._ -_-_
1 . 0 ————
____
1 . 0 ____
1 . 0 1 . 0 1 . 0
*-•_.»-•
1 . 0 1 . 0
1 . 0 2 . 0
_ _ _ _ . 8
1 . 2 1.0 1 . 3 2.0
. 3 3 . 2
. 2
. 3 2 . 8 2.0 1 . 5 1.2 2.7 1 . 3 1 . 3
. 6
. 9 1 . 6
. 7 4 . 3 1 . 4
. 8 2.0
— ___
. 3
. 6
. 5
. 5
.2
. 4 1 . 6
. 7
. 8
. 4
. 1
.2
. 4
. 3
___—
. 6
. 2
. 7
. 8 _
. 6 1 . 7
_ — _ 4 . 6
. 4 —_—
2 . 5 3 . 4 1 . 8
. 7 1 . 8 1 . 0 1 . 2 1 . 5
. 9 1 . 0 1 . 3 5 . 1 2 . 2
. 6 1.2
. 7
. 3
. 6
. 2
. 5 2 . 8
. 7
. 5
. 3
. 2
. 5
. 4
. 2
. 3
_ _ _ -1.0 1.0
. 7
. 8 1 . 2
. 5 3 . 6
. 4
. 4 3 . 0 1 . 7 2 . 2 1.0
. 9 1 . 2 1 . 6
. 7 1 . 0 1 . 4 1 . 7 4 . 0 2 . 4
. 9 1 . 5
. 3
. 2
.2
. 3
. 4
. 6
. 4
_—_—
1 . 4 . 7 . 5
1 . 0 . 3
. 6
. 4
. 5
. 4

84
TABLE 12 ACTUAL AND PROJECTED RESULTS SHOWN IN GROUPS USED
BLOCK NO.
1-8
9 - 1 6
1 7 - 2 3
2 4 - 3 1
3 2 - 3 9
4 0 - 4 7
FOR CORRELATION
ACTUAL
1 3
7
1 0
3
4
6
1 .
TESTS
EXPECTED 2 . EXPECTED
9 . 8
1 2 . 0
1 0 . 8
4 . 2
4 . 6
1 . 6
8 . 6
1 1 . 6
1 3 . 2
3 . 4
4 . 6
1 . 6
3 . EXPECTED
8 . 8
1 0 . 8
1 2 . 8
4 . 4
4 . 0
2 . 2
TOTAL 43.0 43.0 43.0 43.0
This thesis deals with human decision and subsequent
action. It is contended that in view of the difficulty in
predicting human decision the r values obtained are
quite acceptable. The model does work and it does
accurately reflect the relocation diffusion process in
the Hamilton Central Business District.

C H A P T E R S I X
CONCLUSIONS

85
A. SUMMARY
The model deveL oped in this thesis generates a
relocation diffusion pattern for retail businesses. A
number of factors were combined in this model and when used
collectively in this manner give a close fit to reality.
The model is developed around five premises which are com
bined to project the diffusion pattern. The premises in
clude :
1. A business is more likely to relocate in a block which has a great many store sites.
2. A business is more likely to relocate in a block of the C.B.D. which has a large number of vacant sites.
3. If a city block in the C.B.D. has a great deal of pedestrian traffic and therefore is quite accessible, it is more likely to receive a business when they relocate.
4. A business is more likely to relocate in a block of the C.B.D. close to its original location.
5. A retail business is most likely going to relocate in a block in which the mean rents charged are consistent with that firm1s ability to pay that rent.
Based on these premises the model developed used
raw data in a modified form to assign probabilities which
were converted to addresses from 1 to 1,000. Each block
in the C.B.D. was assigned a score using the following
input:
1. The actual number of store sites as determined
by a field survey was assigned to each block as raw data.

86
2. A score of 1 per 1,000 pedestrians was added
to the fcaw score for each block. The pedestrian traffic
data for a block was based on data for the busiest axis of
that block. The data for the block was extrapolated from
traffic counts taken at the corners at either end of the
major axis of the block.
3. A score of 1, 5, 10, 15, or 20 was assigned
a block based on its distance from the Civic Square Urban
Renewal Area.
4. The addresses were adjusted to relate the rents
which a business could afford to the rents demanded in
parts of the C.B.D. Addresses in the high rent areas were
adjusted to total 500, and 500 in low rent areas of
the C.B.D. for businesses which had high financial ratings
but were formerly located in low rent areas or for businesses
which had low financial ratings but were formerly in high
rent areas. Businesses which fell in these two categories
showed no marked trends in relocating in particular rent
sections of the C.B.D. Thus, each section of the C.B.D.
(the high rent area and the low rent area) had the
same number of addresses assigned to it. Addresses in the
high rent areas were adjusted to total 800 and 200 in the
low rent areas of the C.B.D., for businesses which had a
high financial rating and had been located in a high rent
area. Addresses in high rent areas totalled 200, and 800
in low rent areas of the C.B.D. for businesses which a

87
low financial rating and had been located in a low rent
area.
5. As an alternative to adjusting the addresses
assigned in step 4 a range could be assigned for each rent
category and using * computer, random numbers could be
selected from the first range four times and from the second
range one time.
B. EVALUATION OF THE MODEL THE STOCHASTIC APPROACH
Interviews with merchants who operate retail busi
nesses indicate there are many reasons why a businessman
may choose to relocate in a particular location. It is
this researcher*s opinion that it would be unrealistic an
impractical to attempt to incorporate every reason or cause
in a model which would be completely deterministic. A more
correct approach would be to incorporate some main deter
mining factors in a model and then use random numbers to
assign new locations. The stochastic approach compensates
for the fact that it is virtually impossible to develop
perfect cause and effect situations when the human element
is a major component. The stochastic approach is realistic
and the simulated diffusion patterns which were generated
reflect the actual pattern which developed.
The relocation diffusion pattern which is generated
using stochastic techniques may differ each time it is
generated. For obvious reasons, models using these techni-

88
niques are often critioized and their validity doubted since
there is no guarantee that the next time they are used they
will generate a diffusion pattern which resembles the actual
diffusion pattern. This is a fair criticism and one which
the researcher who uses stochastic techniques must accept.
Over the long run these techniques, however, do
generate simulated relocation diffusion patterns which re
semble the actual relocation diffusion pattern. The model
does not require a great quantity of data; it is easily
administered; the results reflect the actual situation.
C. AREAS FOR FURTHER RESEARCH
1. This model should be tried in other communities where
for some reason a large number of retail businesses
U „...•. U-~—.~ * ? _ _ _ _ _l j 1 _ - - J
« i a w M » ^ U l. %J A \^*+\A U U l'CZ<2-di;c& c*cs .
2. Models should be developed that would account for and
predict the relocation of:
(i) retail businesses operated as part of a chain, (ii) service industries
(iii) wholesale businesses
(iv) manufacturing industries.
3. Using a computer the model could be refined to allow
for the effects of changes over time. If a block of
the C.B.D. received a business the probability it would
receive another business would be reduced.
4. The model could be enlarged to allow for the predicting
of and accounting for relocations outside the C.B.D.

89
Using the results of this study further research may
uncover ways to provide greater assistance to private
entrepreneurs who are going to relocate.
The results of further study will provide civic ad
ministrators with information which will assist them
in minimizing the problems created in cities when re
location of businesses is made necessary on a large
scale.

A P P E N D I X O N E
COMMERCIAL RELOCATION INVENTORY FORM
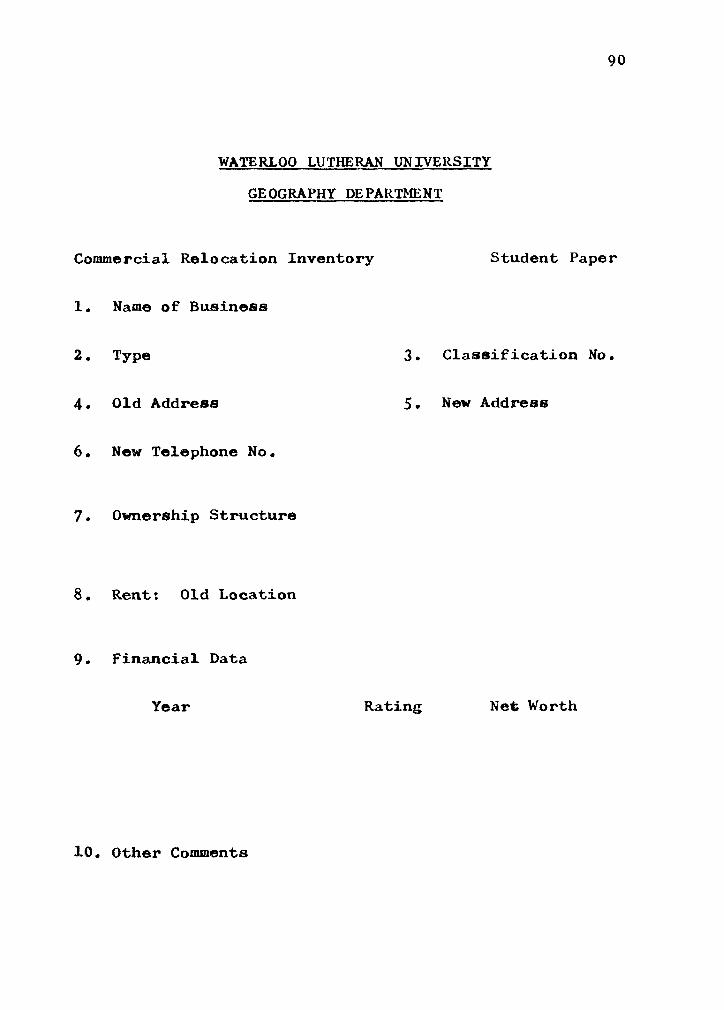
WATERLOO LUTHERAN UNIVERSITY
GE OGRAPHY DEPARTMENT
Commercial Relocation Inventory Student Paper
1. Name of Business
2. Type 3. Classification No,
4. Old Address 5. New Address
6. New Telephone No,
7. Ownership Structure
8. Rent: Old Location
9. Financial Data
Year Rating Net Worth
10. Other Comments

A P P E N D I X T W O

91
APPENDIX TWO
Those blocks with rents exceeding $4.00 per square foot
per annum excluding taxes and common costs are considered to
be in the high rent area for ground floor retail space.
Sample Rents Block
1 2 3 4 5 6 7
H 8 9 10
H 11 H 12 H 13 H 14
15 16 17 18 19 20 21 22 23 24 25 26 27 28 29 30 31 32 33 34 35 36 37 38
No.
H
H II H H
1 3.50 3.00 3.00 2.90 2.50 3.75 2.90 6.50 3.75 3.75 7.00 6.50 6.00 5.00 5.50 3.75 3.00 2.75 3.00 3.25 4.00 6.00 6.50 6.50 6.00 3.75 3.50 3.00 2.90 3.50 3.00 3.00 3.00 3.50 4.00 4.50 4.00 3.00
2 3
2.90 3.50 2.50 2.90 2.90 3.50 2.75 5.25 3.75 3.50 6.50 7.00 6.25 6.00 6.00 4.50 5.25 4.00 3.50 3.50
3.25 2.90 3.00 5.25 5.72 6.00 6.00
3.00 3.50 3.00 2.75
3.75 5.50 3.00 3.50

Block No.
39 40 41 42 43 44 45 46 47.
Sample 1 3.00 2.90 2.90 3.50 4.00 3.50 3.00 3.50 4.00
Rents 2
3.00 3.50
2.50 3.50 3.50
3.50
3 3.50
3.00
3.50
Source: Interviews with owners and Hamilton Real Estate Board, 1972. Data shows rents charged during 1971-72.

93
BIBLIOGRAPHY
Abler, Ronald, Adams, John S. and Gould Peter. Spatial Organization: The Geographic View of the World Englewood Cliffs, New Jersey: Prentice Hall Inc., 1971.
Applebaum, William. "A New Approach to Mapping Store Facilities." Professional Geographer. 16(1), 1964, pp. 9-11.
, "Store Performance in Relation to Location and Other Characteristics," Chain Store Age, 41(6), 1965, PP. 14-16.
, "Can Store Location Research be a Science," Economic Geography. 41(3), 1965, PP. 234-237.
, "Methods for Determining Store Trade Areas, Market Penetration and Potential Sales," Journal of Marketing, 30(3), 1966, pp. 127-141.
, "Guidelines for a Store-Location Strategy Study," Journal of Marketing. 30(4), 1966, pp. 42-45.
Barnett, Homer G. Innovation: The Basis of Cultural Change. New York: McGraw-Hill and Company Inc., 1953.
Berry, Brain J.L. Commercial Structure and Commercial Blight. Research Paper No. 85, Department of Geography Research Series. Chicago: University of Chicago Press, 1963.
Blalock, Hubert M. Social Statistics. New York: McGraw-Hill Book Company, i960.
Boal, F.W. and Johnson, D.B. "The Functions of Retail and Service Establishments on Commercial Ribbons," Canadian Geographer. Vol. 9, 1965, pp. 154-169.
Bohnert, J.E. and Mattingly, P.F. "Delimitation of the C.B.D. Through Time," Economic Geography. Vol. 40, I964, pp. 337-347.
Bourne, Larry S. Private Redevelopment of the Central City. Research Paper No. 112, Department of Geography, Research Series, Chicago: U. of Chicago Press, 1967.

94
Brown, Lawrence A. Diffusion Processes and Location: A Conceptual Framework and Bibliography. Bibliography Series No. 4, Philadelphia, Pa.: Regional Science Research Institute, 1968.
. and B. Lentek, "Innovation Diffusion in a Developing Economy: A Mesoscale View," Economic Geography, Vol. 50, 1974, PP. 300-311.
, Edward J. Malecki, Susan R. Gross, Mohan N. Shrestha and R. Keith Semple. "Diffusion of Cable Television in Ohio: A Case Study of Diffusion Location Patterns and Processes of the Polynuclear Type," Economic Geography. Vol. 50, 1974, pp. 285-299.
Canada. "The Improvement Loans Guarantee Act 1937," Statutes of Canada. Chapter 11.
Canada. "The National Housing Act I938," Statutes of Canada. Chapter 11.
Canada. "The National Housing Act 1944," Statutes of Canada. Chapter 46.
Canada. "The National Housing Act I964," Statutes of Canada. Chapter 15.
Canada. "The Dominion Housing Act 1935," Statutes of Canada. Chapter 58.
Canada. "The National Housing Act 1938," Statutes of Canada. Chapter 49.
Carol, Hans. "The Hierarchy of Central Functions Within the City," Annals of the Association of American Geographers. Vol. 50, I960, pp. 419-438.
Clark, David. "Technology, Diffusion and Time-space Convergence: The Example of S.T.D, Telephone," Area. Volume 6, no. 3, 1974, pp. I8I-I84.
Cohen, Mehoshua. Diffusion of an Innovation in an Urban System. Research Paper No. 140, Department of Geography Research Series. Chicago: University of Chicago Press, 1972.
Davies, D.H. "Boundary Study as a Tool in C.B.D. Analysis: an Interpretation of Certain Aspects of the Boundary of Cape Town*s Central Business District." Economic Geography. Vol. 35, 1959, pp. 322-345.

95
DeBlij, H.J. "The Functional Structure and Central Business District of Lorenco Marques, Mozambique," Economic Geographyf vol. 38, 1962, pp. 56-77.
Dun and Bradstreet Canadian Middle Market Directory. Dun and Bradstreet Inc., 1967.
Duncan, Delbert J. and Phillips, Charles F. Retailing: Principles and Methods. Homewood, Illinois: Richard D. Irwin Inc., 1967.
Earickson, Robert and Brian J. Murton. "Assumptions About Spatial Behaviour Implicit in Urban Settlement Diffusion," Proceedings of the Association of American Geographers. 1974, pp. 127-130.
Field Survey. Conducted by the author. July, August, 1972.
Garst, Ronald D. "Spatial Diffusion and Information Diffusion," Proceedings of the Association of American Geographersf 1973, PP. 75-80.
, "Innovation Diffusion Among the Gusii of Kenya," Economic Geographyf Volume 50, 1974, pp. 300-311.
Greig-Smith, J. Quantitative Plant Ecology. London: Penguin Books Ltd., 1964.
Haggett, Peter. Locational Analysis in Human Geography. London: Edward Arnold Ltd., 1965.
Garrison, William L. and Marble, Duane (eds.) Quantitative Geography. Part I: Economic and Cultural Topics. Evanston, Illinois: Northwestern University, 1967.
Hamilton, Corporation of the City of. Pedestrian Traffic Data. Hamilton: Traffic Department: Department of City Engineers, 1968, 1970.
Hamilton, Corporation of the City of. Hamilton Street Railway Annual Report. Hamilton: Hamilton Street Railway Inc., 1969.
Huff, David L. "Defining and Estimating a Trade Area," Journal of Marketing. 1964.
Jones, Fred M. Retail Merchandising. Homewood: Richard D. Irwin Inc., 1957.
Katz, Elihu, Levin, Martin L. and Hamilton, Herbert. "Tradition of Research on the Diffusion of Innovation,"

96
American Sociological Review. Vol. 28, 1963.
Kitchener, City of. City of Kitchener, Ontario Downtown Urban Renewal Scheme. Kitchener, Planning Department and Project Planning Associates Limited, 1967.
Lineup. Waterloo: University of Waterloo, July 1972.
Loboda, Jan. "The Diffusion of Television in Poland," Economic Geography, volume 50, 1974, pp. 70-82.
Mclntyre, W.E. "Tbe Retail Pattern of Manila," Geographical Review, vol. 45, 1945.
Mertes, John E. "A Retail Structural Theory for Site Analysis," Journal of Retailing, vol. 40, 1964.
Meyer, J.W. Diffusion of an American Montessori Education Chicago: University of Chicago Research Paper Series, 1974.
Morrill, Richard L. "The Negro Ghetto: Problems and Alternatives," Geographical Reviewf Vol. 55, 1965, pp. 339-361.
Murphy, Raymond E. and Vance Jr. J.E. "De limiting the C.B.D., "Economic Geography. Vol. 30, 1954.
National Science Foundation, "Diffusion of Technological Change," Review of Data on Research and Developmentf No. 31, Washington: National Science Foundation, 1961.
Nelson, Richard Lawrence. The Selection of Retail Locations. New York: F.W. Dodge Corporation, 1958.
1969 Survey of Markets and Business Year Book. Toronto: McLean-Hunter Limited, 1969.
Ontario, "Ontario Planning and Development Act, 1946," Statutes of Ontario. Chapter 54.
Ontario, "Ontario Planning and Development Act, 1952," Statutes of Ontario. Chapter 118.
Peterborough, City of. Peterborough: Urban Renewal: A Study of the C.B.D. Peterborough: City Planning Board, 1962.

97
Price, Edward T. "A Spatial Classification of Diffusion," Proceedings of the Association of American Geographers, 1974, PP. 32-36.
Proudfoot, Malcolm J. "City Retail Structure," Economic Geography. Vol. 13, 1937.
Rodgers, Everett M. Diffusion of Innovation. New York The Free Press, 1962.
Sarnia, City of. Sarnia Area Urban Renewal Study. Toronto: Murray V. Jones and Associates Limited, 1967.
Sauer, Carl Ortwin. "A Geographical Sketch of Early Man in America," Geographical Review. Vol. 34, 1944, PP. 529-551.
Scott, Peter. "Some Functional Aspects of Cape Town," Economic Geography, vol. 30, 1954, pp. 347-363.
, "The Australian C.B.D.," Economic Geography. Vol. 35, 1959, PP. 290-312.
_, Geography and Retailing, London: Hutchinson and Company, 1970.
Sendut, H. "The Structure of Kuala Lumpur, " Town Planning Review, Vol. 36, 1965, pp. 125-138.
Simmons, James. The Changing Pattern of Retail Location. Research Paper No. 92, Department of Geography, Research Series, Chicago: University of Chicago, 1964.