a. regulatory framework 1. air quality standards
TRANSCRIPT
P:\BMD1201 Larkspur\PRODUCTS\Working Papers\1-AirQuality.doc (7/30/2012) DRAFT 2 1
1. AIR QUALITY
The following discussion provides an overview of existing air quality conditions in and around the vicinity of the Larkspur SMART Station Area Plan (Plan) area and the San Francisco Bay Area. Ambient air quality standards and the regulatory framework related to air quality are summarized. Climate, air quality conditions, and typical air pollutant types and sources are described. A. REGULATORY FRAMEWORK
Air quality standards, the regulatory framework, and State and federal attainment status are discussed below. 1. Air Quality Standards
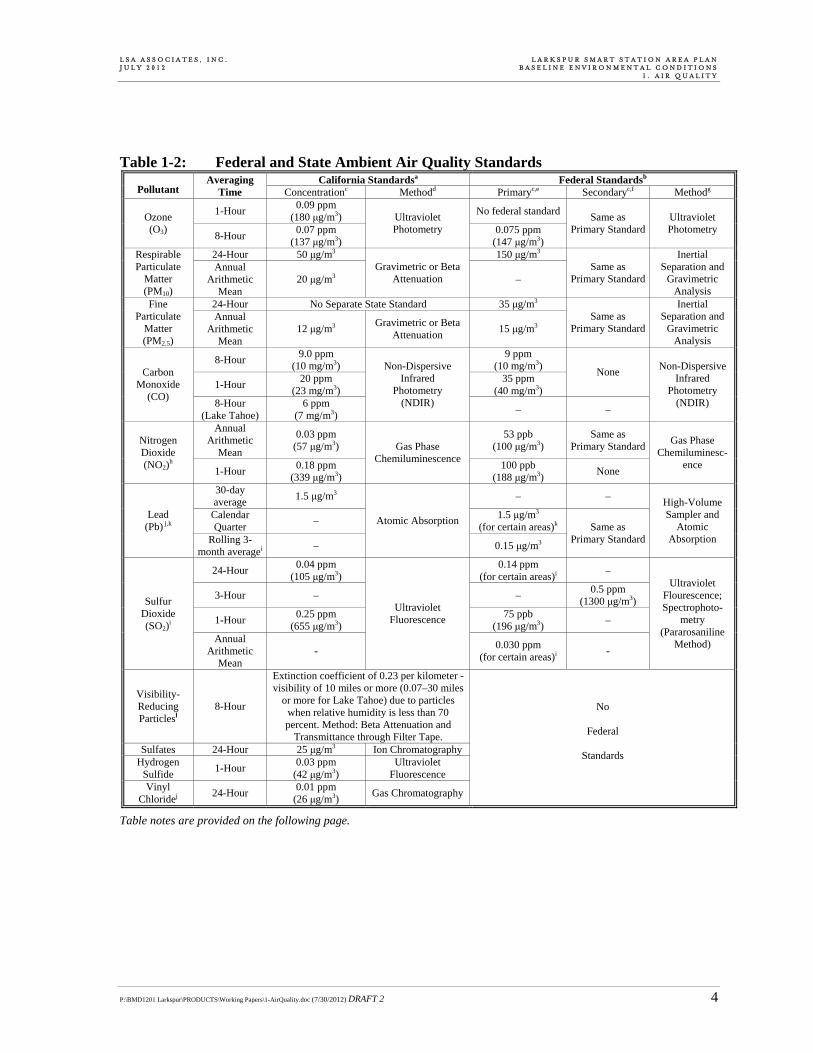
Pursuant to the federal Clean Air Act (CAA) of 1970, the U.S. Environmental Protection Agency (EPA) established national ambient air quality standards (NAAQS). The NAAQS were established for major pollutants, termed “criteria” pollutants. Criteria pollutants are defined as those pollutants for which the federal and State governments have established ambient air quality standards, or criteria, for outdoor concentrations in order to protect public health. Both the EPA and the California Air Resources Board (CARB) have established ambient air quality standards for common pollutants: carbon monoxide (CO), ozone (O3), nitrogen dioxide (NO2), sulfur dioxide (SO2), lead (Pb), and suspended particulate matter (PM). In addition, the State has set stand-ards for sulfates, hydrogen sulfide, vinyl chloride, and visibility reducing particles. These standards are designed to protect the health and welfare of the public with a reasonable margin of safety. These ambient air quality standards are levels of contaminants which represent safe levels that avoid specific adverse health effects associated with each criteria pollutant. Federal standards include both primary and secondary standards. Primary standards set limits to protect public health, including the health of sensitive populations such as asthmatics, children, and the elderly. Secondary standards set limits to protect public welfare, including protection against decreased visibility, damage to animals, crops, vegetation, and buildings.1 Health effects of criteria pollutants and their potential sources are described below and summarized in Table 1-1. The standards would have to be exceeded by a large margin, or for a prolonged period of time, for the health effects to occur. Table 1-2 shows both the State and federal standards for these criteria pollutants; the California Ambient Air Quality Standards (CAAQS) are more stringent than the NAAQS.
1 U.S. Environmental Protection Agency, 2012. Website: www.epa.gov/air/criteria.html. May.
L S A A S S O C I A T E S , I N C . L A R K S P U R S M A R T S T A T I O N A R E A P L A N J U L Y 2 0 1 2 B A S E L I N E E N V I R O N M E N T A L C O N D I T I O N S 1 . A I R Q U A L I T Y
P:\BMD1201 Larkspur\PRODUCTS\Working Papers\1-AirQuality.doc (7/30/2012) DRAFT 2 2
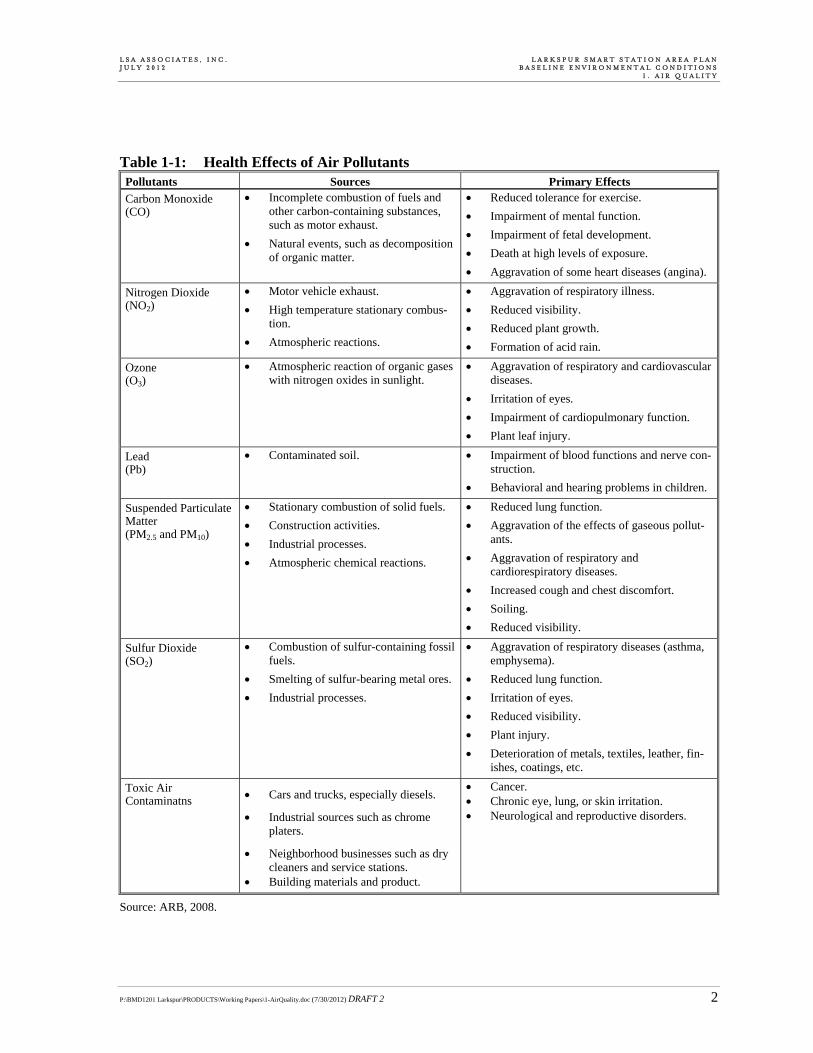
Table 1-1: Health Effects of Air Pollutants Pollutants Sources Primary Effects
Carbon Monoxide (CO)
Incomplete combustion of fuels and other carbon-containing substances, such as motor exhaust.
Natural events, such as decomposition of organic matter.
Reduced tolerance for exercise.
Impairment of mental function.
Impairment of fetal development.
Death at high levels of exposure.
Aggravation of some heart diseases (angina).
Nitrogen Dioxide (NO2)
Motor vehicle exhaust.
High temperature stationary combus-tion.
Atmospheric reactions.
Aggravation of respiratory illness.
Reduced visibility.
Reduced plant growth.
Formation of acid rain.
Ozone (O3)
Atmospheric reaction of organic gases with nitrogen oxides in sunlight.
Aggravation of respiratory and cardiovascular diseases.
Irritation of eyes.
Impairment of cardiopulmonary function.
Plant leaf injury.
Lead (Pb)
Contaminated soil. Impairment of blood functions and nerve con-struction.
Behavioral and hearing problems in children.
Suspended Particulate Matter (PM2.5 and PM10)
Stationary combustion of solid fuels.
Construction activities.
Industrial processes.
Atmospheric chemical reactions.
Reduced lung function.
Aggravation of the effects of gaseous pollut-ants.
Aggravation of respiratory and cardiorespiratory diseases.
Increased cough and chest discomfort.
Soiling.
Reduced visibility.
Sulfur Dioxide (SO2)
Combustion of sulfur-containing fossil fuels.
Smelting of sulfur-bearing metal ores.
Industrial processes.
Aggravation of respiratory diseases (asthma, emphysema).
Reduced lung function.
Irritation of eyes.
Reduced visibility.
Plant injury.
Deterioration of metals, textiles, leather, fin-ishes, coatings, etc.
Toxic Air Contaminatns Cars and trucks, especially diesels.
Industrial sources such as chrome platers.
Neighborhood businesses such as dry cleaners and service stations.
Building materials and product.
Cancer. Chronic eye, lung, or skin irritation. Neurological and reproductive disorders.
Source: ARB, 2008.
L S A A S S O C I A T E S , I N C . L A R K S P U R S M A R T S T A T I O N A R E A P L A N J U L Y 2 0 1 2 B A S E L I N E E N V I R O N M E N T A L C O N D I T I O N S 1 . A I R Q U A L I T Y
P:\BMD1201 Larkspur\PRODUCTS\Working Papers\1-AirQuality.doc (7/30/2012) DRAFT 2 3
a. Ozone. Ozone is a secondary air pollutant produced in the atmosphere through a complex series of photochemical reactions involving ROG and NOx. The main sources of ROG and NOx, often referred to as ozone precursors, are combustion processes (including combustion in motor vehicle engines) and the evaporation of solvents, paints, and fuels. In the Bay Area, automobiles are the single largest source of ozone precursors. Ozone is referred to as a regional air pollutant because its precursors are transported and diffused by wind concurrently with ozone production through the photochemical reaction process. Ozone causes eye irritation, airway constriction, and shortness of breath and can aggravate existing respiratory diseases such as asthma, bronchitis, and emphysema. b. Carbon Monoxide. Carbon monoxide (CO) is an odorless, colorless gas usually formed as the result of the incomplete combustion of fuels. The single largest source of CO is motor vehicles. While CO transport is limited, it disperses with distance from the source under normal meteorological conditions. However, under certain extreme meteorological conditions, CO concentrations near congested roadways or intersections may reach unhealthful levels that adversely affect local sensitive receptors (e.g., residents, schoolchildren, the elderly, hospital patients, etc.). Typically, high CO concentrations are associated with roadways or intersections operating at unacceptable levels of service (LOS) or with extremely high traffic volumes. Exposure to high concentrations of CO reduces the oxygen-carrying capacity of the blood and can cause headaches, nausea, dizziness, and fatigue, impair central nervous system function, and induce angina (chest pain) in persons with serious heart disease. Very high levels of CO can be fatal. c. Nitrogen Dioxide. NO2 is a reddish brown gas that is a byproduct of combustion processes. Automobiles and industrial operations are the main sources of NO2. Aside from its contribution to ozone formation, NO2 also contribute to other pollution problems, including a high concentration of fine particulate matter, poor visibility, and acid deposition. NO2 may be visible as a coloring compo-nent on high pollution days, especially in conjunction with high ozone levels. NO2 decreases lung function and may reduce resistance to infection. On January 22, 2010 the EPA strengthened the health-based NAAQS for NO2. d. Sulfur Dioxide. Sulfur dioxide (SO2) is a colorless, irritating gas formed primarily from incomplete combustion of fuels containing sulfur. Industrial facilities also contribute to gaseous SO2 levels in the region. SO2 irritates the respiratory tract, can injure lung tissue when combined with fine particulate matter, and reduces visibility and the level of sunlight. e. Particulate Matter. Particulate matter is the term used for a mixture of solid particles and liquid droplets found in the air. Coarse particles are those that are larger than 2.5 microns but smaller than 10 microns, or PM10. PM2.5 refers to fine suspended particulate matter with an aerodynamic diameter of 2.5 microns or less that is not readily filtered out by the lungs. Nitrates, sulfates, dust, and combustion particulates are major components of PM10 and PM2.5. These small particles can be directly emitted into the atmosphere as by-products of fuel combustion, through abrasion, such as tire or brake lining wear, or through fugitive dust (wind or mechanical erosion of soil). They can also be formed in the atmosphere through chemical reactions. Particulates may transport carcinogens and other toxic compounds that adhere to the particle surfaces, and can enter the human body through the lungs.
L S A A S S O C I A T E S , I N C . L A R K S P U R S M A R T S T A T I O N A R E A P L A N J U L Y 2 0 1 2 B A S E L I N E E N V I R O N M E N T A L C O N D I T I O N S 1 . A I R Q U A L I T Y
P:\BMD1201 Larkspur\PRODUCTS\Working Papers\1-AirQuality.doc (7/30/2012) DRAFT 2 4
Table 1-2: Federal and State Ambient Air Quality Standards California Standardsa Federal Standardsb
Pollutant Averaging
Time Concentrationc Methodd Primaryc,e Secondaryc,f Methodg
1-Hour 0.09 ppm
(180 μg/m3) No federal standard
Ozone (O3) 8-Hour
0.07 ppm (137 μg/m3)
Ultraviolet Photometry 0.075 ppm
(147 μg/m3)
Same as Primary Standard
Ultraviolet Photometry
24-Hour 50 μg/m3 150 μg/m3 Respirable Particulate
Matter (PM10)
Annual Arithmetic
Mean 20 μg/m3
Gravimetric or Beta Attenuation –
Same as Primary Standard
Inertial Separation and
Gravimetric Analysis
24-Hour No Separate State Standard 35 μg/m3 Fine Particulate
Matter (PM2.5)
Annual Arithmetic
Mean 12 μg/m3
Gravimetric or Beta Attenuation
15 μg/m3 Same as
Primary Standard
Inertial Separation and
Gravimetric Analysis
8-Hour 9.0 ppm
(10 mg/m3) 9 ppm
(10 mg/m3)
1-Hour 20 ppm
(23 mg/m3) 35 ppm
(40 mg/m3)
None Carbon Monoxide
(CO) 8-Hour
(Lake Tahoe) 6 ppm
(7 mg/m3)
Non-Dispersive Infrared
Photometry (NDIR)
– –
Non-Dispersive Infrared
Photometry (NDIR)
Annual Arithmetic
Mean
0.03 ppm (57 μg/m3)
53 ppb (100 μg/m3)
Same as Primary Standard
Nitrogen Dioxide (NO2)
h 1-Hour
0.18 ppm (339 μg/m3)
Gas Phase Chemiluminescence
100 ppb (188 μg/m3)
None
Gas Phase Chemiluminesc-
ence
30-day average
1.5 μg/m3 – –
Calendar Quarter
– 1.5 μg/m3
(for certain areas)k Lead
(Pb) j,k Rolling 3-
month averagei –
Atomic Absorption
0.15 μg/m3
Same as Primary Standard
High-Volume Sampler and
Atomic Absorption
24-Hour 0.04 ppm
(105 μg/m3) 0.14 ppm
(for certain areas)i –
3-Hour – – 0.5 ppm
(1300 μg/m3)
1-Hour 0.25 ppm
(655 μg/m3) 75 ppb
(196 μg/m3) –
Sulfur Dioxide (SO2)
i Annual
Arithmetic Mean
-
Ultraviolet Fluorescence
0.030 ppm (for certain areas)i
-
Ultraviolet Flourescence; Spectrophoto-
metry (Pararosaniline
Method)
Visibility-Reducing Particlesl
8-Hour
Extinction coefficient of 0.23 per kilometer - visibility of 10 miles or more (0.07–30 miles
or more for Lake Tahoe) due to particles when relative humidity is less than 70 percent. Method: Beta Attenuation and
Transmittance through Filter Tape. Sulfates 24-Hour 25 μg/m3 Ion Chromatography
Hydrogen Sulfide
1-Hour 0.03 ppm
(42 μg/m3) Ultraviolet
Fluorescence Vinyl
Chloridej 24-Hour
0.01 ppm (26 μg/m3)
Gas Chromatography
No
Federal
Standards
Table notes are provided on the following page.
L S A A S S O C I A T E S , I N C . L A R K S P U R S M A R T S T A T I O N A R E A P L A N J U L Y 2 0 1 2 B A S E L I N E E N V I R O N M E N T A L C O N D I T I O N S 1 . A I R Q U A L I T Y
P:\BMD1201 Larkspur\PRODUCTS\Working Papers\1-AirQuality.doc (7/30/2012) DRAFT 2 5
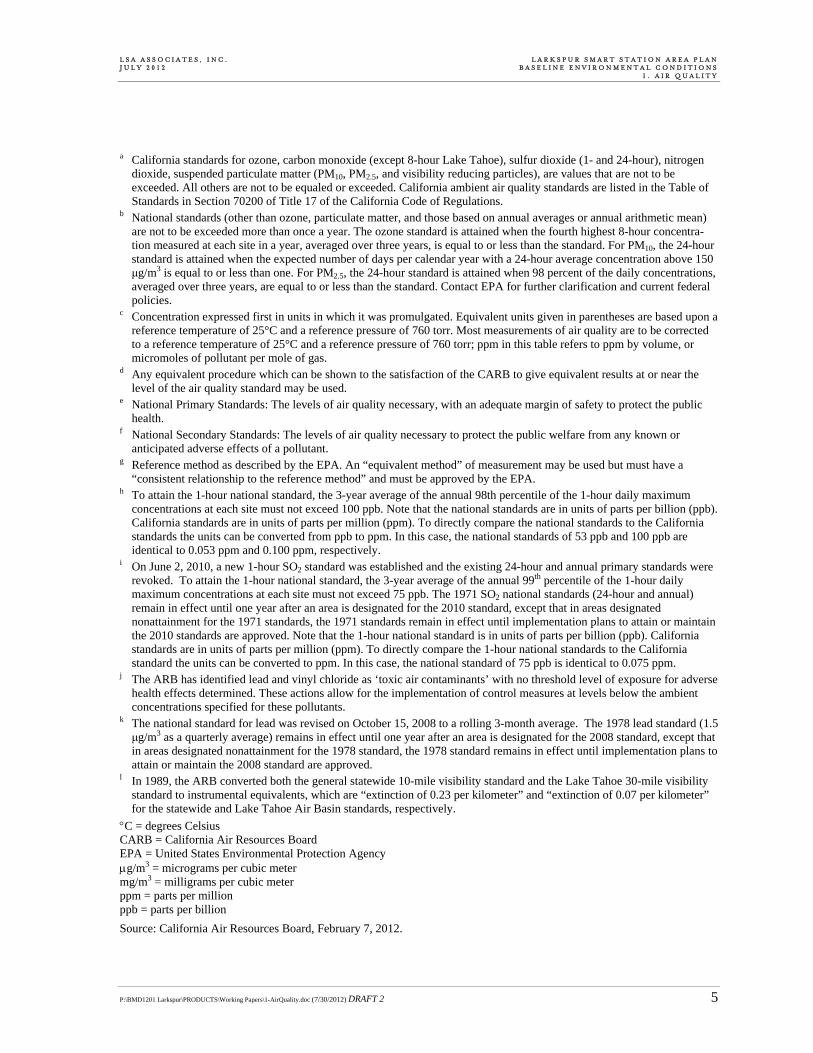
a California standards for ozone, carbon monoxide (except 8-hour Lake Tahoe), sulfur dioxide (1- and 24-hour), nitrogen dioxide, suspended particulate matter (PM10, PM2.5, and visibility reducing particles), are values that are not to be exceeded. All others are not to be equaled or exceeded. California ambient air quality standards are listed in the Table of Standards in Section 70200 of Title 17 of the California Code of Regulations.
b National standards (other than ozone, particulate matter, and those based on annual averages or annual arithmetic mean) are not to be exceeded more than once a year. The ozone standard is attained when the fourth highest 8-hour concentra-tion measured at each site in a year, averaged over three years, is equal to or less than the standard. For PM10, the 24-hour standard is attained when the expected number of days per calendar year with a 24-hour average concentration above 150 μg/m3 is equal to or less than one. For PM2.5, the 24-hour standard is attained when 98 percent of the daily concentrations, averaged over three years, are equal to or less than the standard. Contact EPA for further clarification and current federal policies.
c Concentration expressed first in units in which it was promulgated. Equivalent units given in parentheses are based upon a reference temperature of 25°C and a reference pressure of 760 torr. Most measurements of air quality are to be corrected to a reference temperature of 25°C and a reference pressure of 760 torr; ppm in this table refers to ppm by volume, or micromoles of pollutant per mole of gas.
d Any equivalent procedure which can be shown to the satisfaction of the CARB to give equivalent results at or near the level of the air quality standard may be used.
e National Primary Standards: The levels of air quality necessary, with an adequate margin of safety to protect the public health.
f National Secondary Standards: The levels of air quality necessary to protect the public welfare from any known or anticipated adverse effects of a pollutant.
g Reference method as described by the EPA. An “equivalent method” of measurement may be used but must have a “consistent relationship to the reference method” and must be approved by the EPA.
h To attain the 1-hour national standard, the 3-year average of the annual 98th percentile of the 1-hour daily maximum concentrations at each site must not exceed 100 ppb. Note that the national standards are in units of parts per billion (ppb). California standards are in units of parts per million (ppm). To directly compare the national standards to the California standards the units can be converted from ppb to ppm. In this case, the national standards of 53 ppb and 100 ppb are identical to 0.053 ppm and 0.100 ppm, respectively.
i On June 2, 2010, a new 1-hour SO2 standard was established and the existing 24-hour and annual primary standards were revoked. To attain the 1-hour national standard, the 3-year average of the annual 99th percentile of the 1-hour daily maximum concentrations at each site must not exceed 75 ppb. The 1971 SO2 national standards (24-hour and annual) remain in effect until one year after an area is designated for the 2010 standard, except that in areas designated nonattainment for the 1971 standards, the 1971 standards remain in effect until implementation plans to attain or maintain the 2010 standards are approved. Note that the 1-hour national standard is in units of parts per billion (ppb). California standards are in units of parts per million (ppm). To directly compare the 1-hour national standards to the California standard the units can be converted to ppm. In this case, the national standard of 75 ppb is identical to 0.075 ppm.
j The ARB has identified lead and vinyl chloride as ‘toxic air contaminants’ with no threshold level of exposure for adverse health effects determined. These actions allow for the implementation of control measures at levels below the ambient concentrations specified for these pollutants.
k The national standard for lead was revised on October 15, 2008 to a rolling 3-month average. The 1978 lead standard (1.5 μg/m3 as a quarterly average) remains in effect until one year after an area is designated for the 2008 standard, except that in areas designated nonattainment for the 1978 standard, the 1978 standard remains in effect until implementation plans to attain or maintain the 2008 standard are approved.
l In 1989, the ARB converted both the general statewide 10-mile visibility standard and the Lake Tahoe 30-mile visibility standard to instrumental equivalents, which are “extinction of 0.23 per kilometer” and “extinction of 0.07 per kilometer” for the statewide and Lake Tahoe Air Basin standards, respectively.
C = degrees Celsius CARB = California Air Resources Board EPA = United States Environmental Protection Agency g/m3 = micrograms per cubic meter mg/m3 = milligrams per cubic meter ppm = parts per million ppb = parts per billion
Source: California Air Resources Board, February 7, 2012.
L S A A S S O C I A T E S , I N C . L A R K S P U R S M A R T S T A T I O N A R E A P L A N J U L Y 2 0 1 2 B A S E L I N E E N V I R O N M E N T A L C O N D I T I O N S 1 . A I R Q U A L I T Y
P:\BMD1201 Larkspur\PRODUCTS\Working Papers\1-AirQuality.doc (7/30/2012) DRAFT 2 6
f. Lead. Lead is a metal found naturally in the environment as well as in manufactured products. The major sources of lead emissions have historically been mobile and industrial sources. As a result of the phase-out of leaded gasoline, metal processing is currently the primary source of lead emis-sions. The highest levels of lead in air are generally found near lead smelters. Other stationary sources are waste incinerators, utilities, and lead-acid battery manufactures. Twenty years ago, mobile sources were the main contributor to ambient lead concentrations in the air. In the early 1970s, the U.S. EPA established national regulations to gradually reduce the lead content in gasoline. In 1975, unleaded gasoline was introduced for motor vehicles equipped with catalytic converters. The EPA banned the use of leaded gasoline in highway vehicles in December 1995. As a result of the EPA’s regulatory efforts to remove lead from gasoline, emissions of lead from the transportation sector and levels of lead in the air decreased dramatically g. Toxic Air Contaminants. In addition to the criteria pollutants discussed above, Toxic Air Contaminants (TACs) are another group of pollutants of concern. TACs are injurious in small quantities and are regulated by the EPA and the CARB. Some examples of TACs include: benzene, butadiene, formaldehyde, and hydrogen sulfide. The identification, regulation and monitoring of TACs is relatively recent compared to that for criteria pollutants. High volume freeways, stationary diesel engines, and facilities attracting heavy and constant diesel vehicle traffic (distribution centers, truck stops) were identified as having posing the highest risk to adjacent receptors. Other facilities associated with increased risk include warehouse distribution centers, large retail or industrial facilities, high volume transit centers or schools with a high volume of bus traffic. Health risks from TACs are a function of both concentration and duration of exposure. 2. Regulatory Framework
The Bay Area Air Quality Management District (BAAQMD) is primarily responsible for regulating air pollution emissions from stationary sources (e.g., factories) and indirect sources (e.g., traffic associated with new development), as well as for monitoring ambient pollutant concentrations. The District’s jurisdiction encompasses seven counties—Alameda, Contra Costa, Marin, San Francisco, San Mateo, Santa Clara and Napa—and portions of Solano and Sonoma counties. The CARB and EPA regulate direct emissions from motor vehicles. a. Federal Air Quality Regulations. At the federal level, the EPA has been charged with imple-menting national air quality programs. EPA’s air quality mandates are drawn primarily from the Federal Clean Air Act (FCAA), which was enacted in 1963. The FCAA was amended in 1970, 1977, and 1990. The FCAA required EPA to establish primary and secondary NAAQS and required each state to prepare an air quality control plan referred to as a State Implement Plan (SIP). The Federal Clean Air Act Amendments of 1990 (FCAAA) added requirements for states with nonattainment areas to revise their SIPs to incorporate additional control measures to reduce air pollution. The SIP is periodically modified to reflect the latest emissions inventories, planning documents, and rules and regulations of the air basins as reported by their jurisdictional agencies. EPA has responsibility to review all state SIPs to determine conformity with the mandates of the FCAAA and determine if implementation will achieve air quality goals. If the EPA determines a SIP to be inadequate, a Federal Implementation Plan (FIP) may be prepared for the nonattainment area which imposes additional control measures.
L S A A S S O C I A T E S , I N C . L A R K S P U R S M A R T S T A T I O N A R E A P L A N J U L Y 2 0 1 2 B A S E L I N E E N V I R O N M E N T A L C O N D I T I O N S 1 . A I R Q U A L I T Y
P:\BMD1201 Larkspur\PRODUCTS\Working Papers\1-AirQuality.doc (7/30/2012) DRAFT 2 7
Failure to submit an approvable SIP or to implement the plan within the mandated timeframe may result in the application of sanctions on transportation funding and stationary air pollution sources in the air basin. The 1970 FCAA authorized the establishment of national health-based air quality standards and also set deadlines for their attainment. The FCAA Amendments of 1990 changed deadlines for attaining NAAQS as well as the remedial actions required of areas of the nation that exceed the standards. Under the FCAA, State and local agencies in areas that exceed the NAAQS are required to develop SIPs to show how they will achieve the NAAQS by specific dates. The FCAA requires that projects receiving federal funds demonstrate conformity to the approved SIP and local air quality attainment plan for the region. Conformity with the SIP requirements would satisfy the FCAA requirements. b. State Air Quality Regulations. The CARB is the agency responsible for the coordination and oversight of State and local air pollution control programs in California and for implementing the California Clean Air Act (CCAA), adopted in 1988. The CCAA requires that all air districts in the State achieve and maintain the California Ambient Air Quality Standards (CAAQS) by the earliest practical date. The CCAA specifies that districts should focus on reducing the emissions from transportation and air-wide emission sources, and provides districts with the authority to regulate indirect sources. CARB is also responsible for developing and implementing air pollution control plans to achieve and maintain the NAAQS. CARB is primarily responsible for Statewide pollution sources and produces a major part of the SIP. Local air districts provide additional strategies for sources under their jurisdic-tion. CARB combines this data and submits the completed SIP to the EPA. Other CARB duties include monitoring air quality (in conjunction with air monitoring networks maintained by air pollution control and air quality management districts), establishing CAAQS (which in many cases are more stringent than the NAAQS), determining and updating area designa-tions and maps, and setting emissions standards for new mobile sources, consumer products, small utility engines, and off-road vehicles.
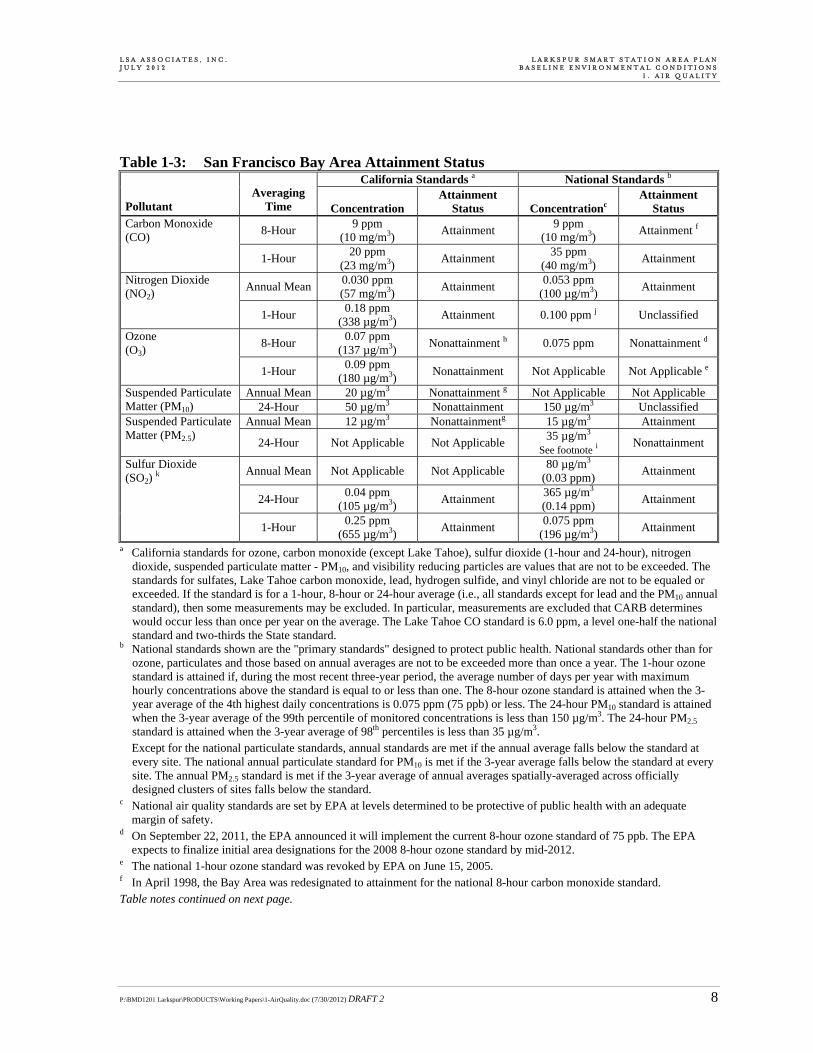
Attainment Status Designations. The CARB is required to designate areas of the State as attainment, nonattainment or unclassified for all State standards. An “attainment” designation for an area signifies that pollutant concentrations did not violate the standard for that pollutant in that area. A “nonattainment” designation indicates that a pollutant concentration violated the standard at least once, excluding those occasions when a violation was caused by an exceptional event, as defined in the criteria. An “unclassified” designation signifies that data does not support either an attainment or nonattainment status. The CCAA divides districts into moderate, serious, and severe air pollution categories, with increasingly stringent control requirements mandated for each category. The EPA designates areas for O3, CO, and NO2 as either “does not meet the primary standards,” or “cannot be classified” or “better than national standards.” For SO2, areas are designated as “does not meet the primary standards,” “does not meet the secondary standards,” “cannot be classified” or “better than national standards.” Table 1-3 provides a summary of the attainment status for the San Francisco Bay Area with respect to national and State ambient air quality standards.
L S A A S S O C I A T E S , I N C . L A R K S P U R S M A R T S T A T I O N A R E A P L A N J U L Y 2 0 1 2 B A S E L I N E E N V I R O N M E N T A L C O N D I T I O N S 1 . A I R Q U A L I T Y
P:\BMD1201 Larkspur\PRODUCTS\Working Papers\1-AirQuality.doc (7/30/2012) DRAFT 2 8
Table 1-3: San Francisco Bay Area Attainment Status California Standards a National Standards b
Pollutant Averaging
Time Concentration Attainment
Status Concentrationc Attainment
Status
8-Hour 9 ppm
(10 mg/m3) Attainment
9 ppm (10 mg/m3)
Attainment f Carbon Monoxide (CO)
1-Hour 20 ppm
(23 mg/m3) Attainment
35 ppm (40 mg/m3)
Attainment
Annual Mean 0.030 ppm (57 mg/m3)
Attainment 0.053 ppm
(100 µg/m3) Attainment
Nitrogen Dioxide (NO2)
1-Hour 0.18 ppm
(338 µg/m3) Attainment 0.100 ppm j Unclassified
8-Hour 0.07 ppm
(137 µg/m3) Nonattainment h 0.075 ppm Nonattainment d
Ozone (O3)
1-Hour 0.09 ppm
(180 µg/m3) Nonattainment Not Applicable Not Applicable e
Annual Mean 20 µg/m3 Nonattainment g Not Applicable Not Applicable Suspended Particulate Matter (PM10) 24-Hour 50 µg/m3 Nonattainment 150 µg/m3 Unclassified
Annual Mean 12 µg/m3 Nonattainmentg 15 µg/m3 Attainment Suspended Particulate Matter (PM2.5) 24-Hour Not Applicable Not Applicable
35 µg/m3
See footnote i Nonattainment
Annual Mean Not Applicable Not Applicable 80 µg/m3
(0.03 ppm) Attainment
24-Hour 0.04 ppm
(105 µg/m3) Attainment
365 µg/m3 (0.14 ppm)
Attainment
Sulfur Dioxide (SO2)
k
1-Hour 0.25 ppm
(655 µg/m3) Attainment
0.075 ppm (196 µg/m3)
Attainment
a California standards for ozone, carbon monoxide (except Lake Tahoe), sulfur dioxide (1-hour and 24-hour), nitrogen dioxide, suspended particulate matter - PM10, and visibility reducing particles are values that are not to be exceeded. The standards for sulfates, Lake Tahoe carbon monoxide, lead, hydrogen sulfide, and vinyl chloride are not to be equaled or exceeded. If the standard is for a 1-hour, 8-hour or 24-hour average (i.e., all standards except for lead and the PM10 annual standard), then some measurements may be excluded. In particular, measurements are excluded that CARB determines would occur less than once per year on the average. The Lake Tahoe CO standard is 6.0 ppm, a level one-half the national standard and two-thirds the State standard.
b National standards shown are the "primary standards" designed to protect public health. National standards other than for ozone, particulates and those based on annual averages are not to be exceeded more than once a year. The 1-hour ozone standard is attained if, during the most recent three-year period, the average number of days per year with maximum hourly concentrations above the standard is equal to or less than one. The 8-hour ozone standard is attained when the 3-year average of the 4th highest daily concentrations is 0.075 ppm (75 ppb) or less. The 24-hour PM10 standard is attained when the 3-year average of the 99th percentile of monitored concentrations is less than 150 µg/m3. The 24-hour PM2.5 standard is attained when the 3-year average of 98th percentiles is less than 35 µg/m3.
Except for the national particulate standards, annual standards are met if the annual average falls below the standard at every site. The national annual particulate standard for PM10 is met if the 3-year average falls below the standard at every site. The annual PM2.5 standard is met if the 3-year average of annual averages spatially-averaged across officially designed clusters of sites falls below the standard.
c National air quality standards are set by EPA at levels determined to be protective of public health with an adequate margin of safety.
d On September 22, 2011, the EPA announced it will implement the current 8-hour ozone standard of 75 ppb. The EPA expects to finalize initial area designations for the 2008 8-hour ozone standard by mid-2012.
e The national 1-hour ozone standard was revoked by EPA on June 15, 2005. f In April 1998, the Bay Area was redesignated to attainment for the national 8-hour carbon monoxide standard. Table notes continued on next page.
L S A A S S O C I A T E S , I N C . L A R K S P U R S M A R T S T A T I O N A R E A P L A N J U L Y 2 0 1 2 B A S E L I N E E N V I R O N M E N T A L C O N D I T I O N S 1 . A I R Q U A L I T Y
P:\BMD1201 Larkspur\PRODUCTS\Working Papers\1-AirQuality.doc (7/30/2012) DRAFT 2 9
g In June 2002, CARB established new annual standards for PM2.5 and PM10. Statewide VRP Standard (except Lake Tahoe Air Basin): Particles in sufficient amount to produce an extinction coefficient of 0.23 per kilometer when the relative humidity is less than 70 percent. This standard is intended to limit the frequency and severity of visibility impairment due to regional haze and is equivalent to a 10-mile nominal visual range.
h The 8-hour CA ozone standard was approved by the CARB on April 28, 2005 and became effective on May 17, 2006. i EPA lowered the 24-hour PM2.5 standard from 65 µg/m3 to 35 µg/m3 in 2006. EPA designated the Bay Area as
nonattainment of the PM2.5 standard on October 8, 2009. The effective date of the designation is December 14, 2009, and the Air District has three years to develop a SIP that demonstrates the Bay Area will achieve the revised standard by December 14, 2014. The SIP for the new PM2.5 standard must be submitted to the EPA by December 14, 2012.
j To attain this standard, the 3-year average of the 98th percentile of the daily maximum 1-hour average at each monitor within an area must not exceed 0.100ppm (effective January 22, 2010).
k On June 2, 2010, the EPA established a new 1-hour SO2 standard, effective August 23, 2010, which is based on the 3-year average of the annual 99th percentile of 1-hour daily maximum concentrations. The existing 0.030 ppm annual and 0.14 ppm 24-hour SO2 NAAQS however must continue to be used until one year following EPA initial designations of the new 1-hour SO2 NAAQS. EPA expects to designate areas by June 2012.
Lead (Pb) is not listed in the above table because it has been in attainment since the 1980s. ppm = parts per million mg/m3 = milligrams per cubic meter µg/m3 = micrograms per cubic meter
Source: Bay Area Air Quality Management District, 2012.
(1) California Clean Air Act. In 1988, the CCAA required that all air districts in the State endeavor to achieve and maintain CAAQS for carbon monoxide (CO), ozone (O3), sulfur dioxide (SO2) and nitrogen dioxide (NO2) by the earliest practical date. The CCAA provides districts with authority to regulate indirect sources and mandates that air quality districts focus particular attention on reducing emissions from transportation and area-wide emission sources. Each nonattainment district is required to adopt a plan to achieve a 5 percent annual reduction, averaged over consecutive 3-year periods, in district-wide emissions of each nonattainment pollutant or its precursors. A Clean Air Plan shows how a district would reduce emissions to achieve air quality standards. Generally, the State standards for these pollutants are more stringent than the national standards.
(2) California Air Resources Board Handbook. In 1998, CARB identified particulate matter from diesel-fueled engines as a toxic air contaminant. CARB has completed a risk management process that identified potential cancer risks for a range of activities using diesel-fueled engines.2 The CARB has also developed an Air Quality and Land Use Handbook3 (Handbook) which is intended to serve as a general reference guide for evaluating and reducing air pollution impacts associated with new projects that go through the land use decision-making process. The CARB Handbook recommends that planning agencies strongly consider proximity to these sources when finding new locations for “sensitive” land uses such as homes, medical facilities, daycare centers, schools and playgrounds. Air pollution sources of concern include freeways, rail yards, ports, refineries, distribution centers, chrome plating facilities, dry cleaners and large gasoline service stations. Key recommendations in the Handbook include taking steps to avoid siting new, sensitive land uses:
2 California Air Resources Board, 2000. Risk Reduction Plan to Reduce Particulate Matter Emissions from
Diesel-Fueled Engines and Vehicles. October. 3 California Air Resources Board, 2005. Air Quality and Land Use Handbook: A Community Health Perspective.
April.
L S A A S S O C I A T E S , I N C . L A R K S P U R S M A R T S T A T I O N A R E A P L A N J U L Y 2 0 1 2 B A S E L I N E E N V I R O N M E N T A L C O N D I T I O N S 1 . A I R Q U A L I T Y
P:\BMD1201 Larkspur\PRODUCTS\Working Papers\1-AirQuality.doc (7/30/2012) DRAFT 2 10
Within 500 feet of a freeway, urban roads with 100,000 vehicles/day or rural roads with 50,000 vehicles/day.
Within 1,000 feet of a major service and maintenance rail yard.
Immediately downwind of ports (in the most heavily impacted zones) and petroleum refineries. c. Bay Area Air Quality Management District. The BAAQMD seeks to attain and maintain air quality conditions in the San Francisco Bay Area Air Basin through a comprehensive program of planning, regulation, enforcement, technical innovation, and education. The clean air strategy includes the preparation of plans for the attainment of ambient air quality standards, adoption and enforcement of rules and regulations, and issuance of permits for stationary sources. The BAAQMD also inspects stationary sources and responds to citizen complaints, monitors ambient air quality and meteorological conditions, and implements programs and regulations required by law.
(1) Clean Air Plan. The BAAQMD is responsible for developing a Clean Air Plan which guides the region’s air quality planning efforts to attain the CAAQS. The BAAQMD’s 2010 Clean Air Plan is the latest Clean Air Plan which contains district-wide control measures to reduce ozone precursor emissions (i.e., ROG and NOx), particulate matter and greenhouse gas emissions. The Bay Area 2010 Clean Air Plan, which was adopted on September 15, 2010 by the BAAQMD’s board of directors:
Updates the Bay Area 2005 Ozone Strategy in accordance with the requirements of the California Clean Air Act to implement “all feasible measures” to reduce ozone;
Provides a control strategy to reduce ozone, particulate matter (PM), air toxics, and greenhouse gases in a single, integrated plan;
Reviews progress in improving air quality in recent years; and
Establishes emission control measures to be adopted or implemented in the 2010 to 2012 timeframe.
(2) BAAQMD CARE Program. The Community Air Risk Evaluation (CARE) program
was initiated in 2004 to evaluate and reduce health risks associated with exposures to outdoor TACs in the Bay Area. The program examines TAC emissions from point sources, area sources and on-road and off-road mobile sources with an emphasis on diesel exhaust, which is a major contributor to airborne health risk in California. The CARE program is an on-going program that encourages community involvement and input. The technical analysis portion of the CARE program is being implemented in three phases that includes an assessment of the sources of TAC emissions, modeling and measurement programs to estimate concentrations of TAC, and an assessment of exposures and health risks. Throughout the program, information derived from the technical analyses will be used to focus emission reduction measures in areas with high TAC exposures and high density of sensitive populations. Risk reduction activities associated with the CARE program are focused on the most at-risk communities in the Bay Area. The BAAQMD has identified six communities as impacted: Concord, Richmond/San Pablo, Western Alameda County, San Jose, Redwood City/East Palo Alto and Eastern San Francisco. The City of Larkspur has not been included as an impacted community, and no other communities within Marin County have been identified as in need of immediate emission reduction measures.
L S A A S S O C I A T E S , I N C . L A R K S P U R S M A R T S T A T I O N A R E A P L A N J U L Y 2 0 1 2 B A S E L I N E E N V I R O N M E N T A L C O N D I T I O N S 1 . A I R Q U A L I T Y
P:\BMD1201 Larkspur\PRODUCTS\Working Papers\1-AirQuality.doc (7/30/2012) DRAFT 2 11
(3) BAAQMD CEQA Air Quality Guidelines. The BAAQMD CEQA Air Quality Guide-lines4 were prepared to assist in the evaluation of air quality impacts of projects and plans proposed within the Bay Area. The guidelines provide recommended procedures for evaluating potential air impacts during the environmental review process consistent with CEQA requirements including thresholds of significance, mitigation measures and background air quality information. They also include assessment methodologies for air toxics, odors and greenhouse gas emissions. In June 2010, the BAAQMD’s Board of Directors adopted CEQA thresholds of significance and an update of their CEQA Guidelines. In May 2011, the updated BAAQMD CEQA Air Quality Guidelines were amended to include a risk and hazards threshold for new receptors and modify procedures for assessing impacts related to risk and hazard impacts. On March 5, 2012, the Alameda County Superior Court issued a judgment finding that the BAAQMD had failed to comply with CEQA when it adopted the thresholds of significance in the 2011 BAAQMD CEQA Air Quality Guidelines. The court issued a writ of mandate ordering the BAAQMD to set aside the thresholds and cease dissemination of them until the BAAQMD complied with CEQA. In view of the court’s order, the BAAQMD is no longer recommending that the thresholds of significance be used as a generally applicable measure of a project’s significant air quality impacts. However, these thresh-olds have not been rescinded and are still being used to evaluate and determine GHG emission impacts. On May 4, 2012, BAAQMD commenced an appeal in the First District of the California Court of Appeal seeking to overturn the Alameda County Superior Court decision. d. City of Larkspur. The Health and Safety Chapter5 of the City of Larkspur’s 1990 General Plan includes the following goals, policies, and programs related to Air Quality: Health and Safety Element Goal 10: Ensure that air pollution levels do not threaten public health and safety.
Policy r: Seek to comply with State and federal standards for air quality.
Policy s: Seek to reduce auto travel and, thereby, the pollutants from auto emissions.
Policy t: Ensure that traffic generated from new development is not the cause of State and federal air quality standards being exceeded in Marin County.
o Action Program (37): Require new development to mitigate impacts if the project causes a change in the level of air pollutants by a specified amount.
B. EXISTING CLIMATE AND AIR QUALITY
Regional air quality, local climate, air quality, and air pollution climatology within the Marin County region is described below. 1. Regional Air Quality
The City of Larkspur is located in the San Francisco Bay Area, a large shallow air basin ringed by hills that taper into a number of sheltered valleys around the perimeter. Two primary atmospheric outlets exist. One is through the strait known as the Golden Gate, a direct outlet to the Pacific Ocean.
4 Bay Area Air Quality Management District, 2011. CEQA Air Quality Guidelines. May. 5 Larkspur, City of, 1990. Larkspur General Plan.
L S A A S S O C I A T E S , I N C . L A R K S P U R S M A R T S T A T I O N A R E A P L A N J U L Y 2 0 1 2 B A S E L I N E E N V I R O N M E N T A L C O N D I T I O N S 1 . A I R Q U A L I T Y
P:\BMD1201 Larkspur\PRODUCTS\Working Papers\1-AirQuality.doc (7/30/2012) DRAFT 2 12
The second extends to the northeast, along the west delta region of the Sacramento and San Joaquin Rivers. The City of Larkspur is within the jurisdiction of the BAAQMD. Air quality conditions in the San Francisco Bay Area have improved significantly since the BAAQMD was created in 1955. Ambient concentrations of air pollutants, and the number of days during which the region exceeds air quality standards, have fallen dramatically. Exceedances of air quality standards occur primarily during meteorological conditions conducive to high pollution levels, such as cold, windless winter nights or hot, sunny summer afternoons. Ozone levels, measured by peak concentrations and the number of days over the State 1-hour stan-dard, have declined substantially in the San Francisco Bay Area as a result of aggressive programs by the BAAQMD and other regional, State and federal agencies. The reduction of peak concentrations represents progress in improving public health; however, the Bay Area still exceeds the State standard for 1-hour ozone. Levels of PM10 have exceeded State standards two of the last three years, and the area is considered a nonattainment area for this pollutant relative to the State standards. The Bay Area is an unclassified area for the federal PM10 standard. No exceedances of the State or federal CO standards have been recorded at any of the region’s moni-toring stations since 1991. The Bay Area is currently considered a maintenance area for State and federal CO standards. 2. Local Climate and Air Quality
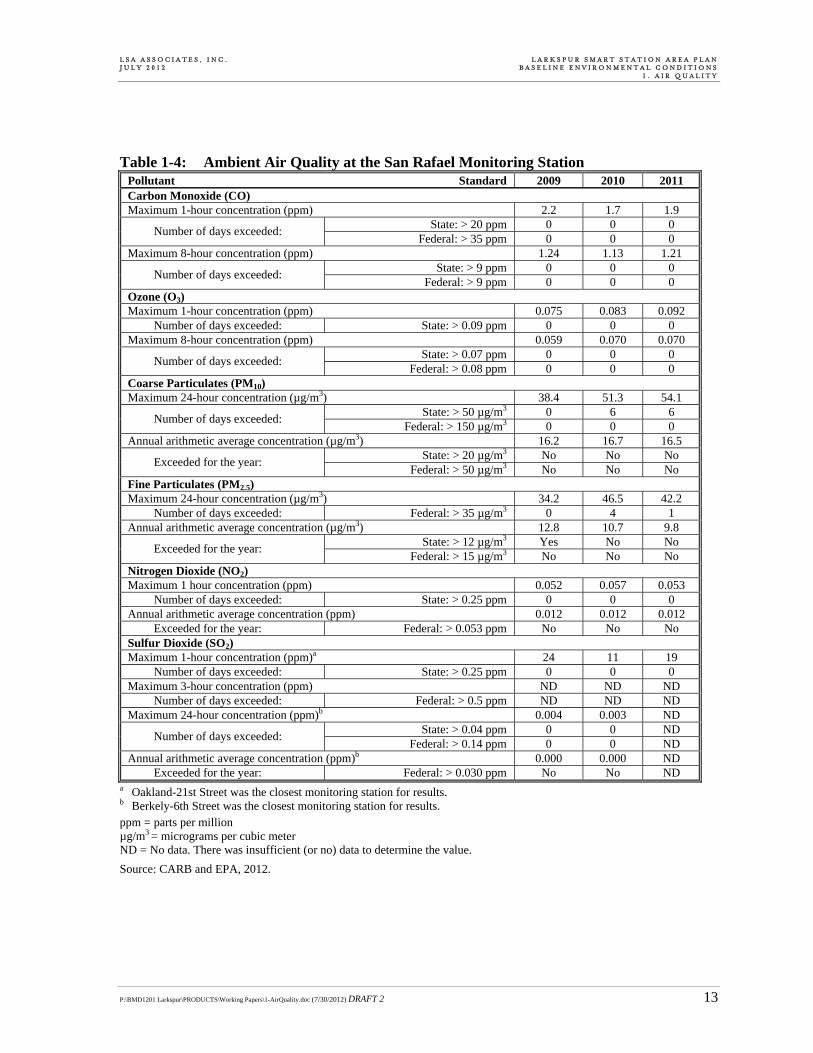
Air quality is a function of both local climate and local sources of air pollution. Air quality is the balance of the natural dispersal capacity of the atmosphere and emissions of air pollutants from human uses of the environment. Climate and topography are major influences on air quality in the project area. Marin County benefits from constant winds, a marine layer of fog which lifts in the morning hours during the summer, and heavy winter precipitation compared to other parts of the Bay Area. Wind direction is east-west, in alignment with the ridges (Corte Madera Ridge and Southern Heights Ridge in Larkspur). The combination of wind direction and topography allows for constant scouring of the ambient air, resulting in good air quality most of the time. It also means that air pollution generated in Marin County is dispersed to other parts of the Bay Area. The CARB monitors air pollution at various sites within California. The closest monitoring site to the Plan area in Marin County is located in the City of San Rafael. Pollutant monitoring results for the years 2009 to 2011 at the San Rafael ambient air quality monitoring station, shown in Table 1-4, indicate that air quality in the Plan area has generally been good. There were 6 exceedances of the State PM10 standard recorded in 2010 and 2011 and no exceedances of the federal PM10 standard during the 3-year period were recorded. There were 4 exceedances recorded in 2010 and 1 exceedance recorded in 2011 of the federal PM2.5 standard. Additionally, there was an exceedance of the State annual arithmetic standard for PM2.5 in 2009. The State 1-hour ozone standard was not exceeded during the 3-year period at this monitoring station. State and federal 8-hour ozone standards were also not exceeded during the 3-year period at this monitoring station. In addition, CO, SO2, and NO2 stan-dards were not exceeded in this area during the 3-year period.
L S A A S S O C I A T E S , I N C . L A R K S P U R S M A R T S T A T I O N A R E A P L A N J U L Y 2 0 1 2 B A S E L I N E E N V I R O N M E N T A L C O N D I T I O N S 1 . A I R Q U A L I T Y
P:\BMD1201 Larkspur\PRODUCTS\Working Papers\1-AirQuality.doc (7/30/2012) DRAFT 2 13
Table 1-4: Ambient Air Quality at the San Rafael Monitoring Station Pollutant Standard 2009 2010 2011 Carbon Monoxide (CO) Maximum 1-hour concentration (ppm) 2.2 1.7 1.9
State: > 20 ppm 0 0 0 Number of days exceeded:
Federal: > 35 ppm 0 0 0 Maximum 8-hour concentration (ppm) 1.24 1.13 1.21
State: > 9 ppm 0 0 0 Number of days exceeded:
Federal: > 9 ppm 0 0 0 Ozone (O3)
Maximum 1-hour concentration (ppm) 0.075 0.083 0.092
Number of days exceeded: State: > 0.09 ppm 0 0 0 Maximum 8-hour concentration (ppm) 0.059 0.070 0.070
State: > 0.07 ppm 0 0 0 Number of days exceeded:
Federal: > 0.08 ppm 0 0 0 Coarse Particulates (PM10)
Maximum 24-hour concentration (µg/m3) 38.4 51.3 54.1
State: > 50 µg/m3 0 6 6 Number of days exceeded:
Federal: > 150 µg/m3 0 0 0 Annual arithmetic average concentration (µg/m3) 16.2 16.7 16.5
State: > 20 µg/m3 No No No Exceeded for the year:
Federal: > 50 µg/m3 No No No Fine Particulates (PM2.5)
Maximum 24-hour concentration (µg/m3) 34.2 46.5 42.2
Number of days exceeded: Federal: > 35 µg/m3 0 4 1 Annual arithmetic average concentration (µg/m3) 12.8 10.7 9.8
State: > 12 µg/m3 Yes No No Exceeded for the year:
Federal: > 15 µg/m3 No No No Nitrogen Dioxide (NO2)
Maximum 1 hour concentration (ppm) 0.052 0.057 0.053
Number of days exceeded: State: > 0.25 ppm 0 0 0 Annual arithmetic average concentration (ppm) 0.012 0.012 0.012
Exceeded for the year: Federal: > 0.053 ppm No No No Sulfur Dioxide (SO2) Maximum 1-hour concentration (ppm)a 24 11 19
Number of days exceeded: State: > 0.25 ppm 0 0 0 Maximum 3-hour concentration (ppm) ND ND ND
Number of days exceeded: Federal: > 0.5 ppm ND ND ND Maximum 24-hour concentration (ppm)b 0.004 0.003 ND
State: > 0.04 ppm 0 0 ND Number of days exceeded:
Federal: > 0.14 ppm 0 0 ND Annual arithmetic average concentration (ppm)b 0.000 0.000 ND
Exceeded for the year: Federal: > 0.030 ppm No No ND a Oakland-21st Street was the closest monitoring station for results. b Berkely-6th Street was the closest monitoring station for results. ppm = parts per million µg/m3 = micrograms per cubic meter ND = No data. There was insufficient (or no) data to determine the value.
Source: CARB and EPA, 2012.
L S A A S S O C I A T E S , I N C . L A R K S P U R S M A R T S T A T I O N A R E A P L A N J U L Y 2 0 1 2 B A S E L I N E E N V I R O N M E N T A L C O N D I T I O N S 1 . A I R Q U A L I T Y
P:\BMD1201 Larkspur\PRODUCTS\Working Papers\1-AirQuality.doc (7/30/2012) DRAFT 2 14
This page intentionally left blank.
P:\BMD1201 Larkspur\PRODUCTS\Working Papers\2-GCC.doc (7/30/2012) DRAFT 2 1
2. GLOBAL CLIMATE CHANGE
This chapter describes the general background information on global climate change, meteorology, the regulatory framework for global climate change, and provides data on the existing global climate setting and greenhouse gas emissions in the vicinity of the City of Larkspur and the SMART Station Area Plan (Plan) area. A. GLOBAL CLIMATE CHANGE BACKGROUND
The following section provides background information on greenhouse gases and global climate change. 1. Greenhouse Gases
Global climate change is the observed increase in the average temperature of the Earth’s atmosphere and oceans in recent decades. Global surface temperatures have risen by 1.1 ± 0.4° Fahrenheit (°F) over the last 100 years (1906 to 2005). The rate of warming over the last 50 years is almost double that over the last 100 years.1 The prevailing scientific opinion on climate change is that most of the warming observed over the last 50 years is attributable to human activities. The increased amounts of carbon dioxide (CO2) and other greenhouse gases are the primary causes of the human-induced component of warming. Greenhouse gases are released by the burning of fossil fuels, land clearing, agriculture, and other activities, and lead to an increase in the greenhouse effect.2 Greenhouse gases are present in the atmosphere naturally, are released by natural sources, or are formed from secondary reactions taking place in the atmosphere. The gases that are widely seen as the principal contributors to human-induced global climate change are:
Carbon dioxide (CO2)
Methane (CH4)
Nitrous oxide (N2O)
Hydrofluorocarbons (HFCs)
Perfluorocarbons (PFCs)
Sulfur Hexafluoride (SF6)
1 Intergovernmental Panel on Climate Change (IPCC), 2007. Climate Change 2007: The Physical Science Basis.
Contribution of Working Group I to the Fourth Assessment Report of the IPCC. 2 The temperature on Earth is regulated by a system commonly known as the "greenhouse effect." Just as the glass in
a greenhouse lets heat from sunlight in and reduces the heat escaping, greenhouse gases like carbon dioxide, methane, and nitrous oxide in the atmosphere keep the Earth at a relatively even temperature. Without the greenhouse effect, the Earth would be a frozen globe; thus, although an excess of greenhouse gas results in global warming, the naturally occurring greenhouse effect is necessary to keep our planet at a comfortable temperature.
L S A A S S O C I A T E S , I N C . L A R K S P U R S M A R T S T A T I O N A R E A P L A N J U L Y 2 0 1 2 B A S E L I N E E N V I R O N M E N T A L C O N D I T I O N S 2 . G L O B A L C L I M A T E C H A N G E
P:\BMD1201 Larkspur\PRODUCTS\Working Papers\2-GCC.doc (7/30/2012) DRAFT 2 2
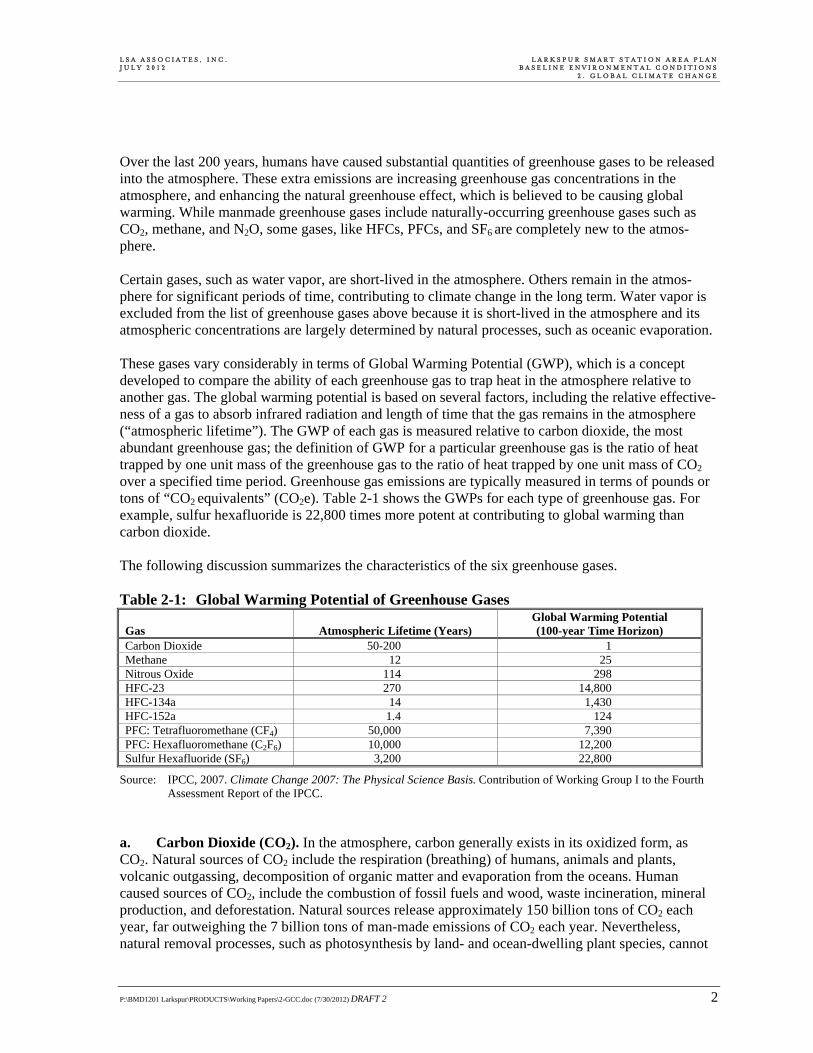
Over the last 200 years, humans have caused substantial quantities of greenhouse gases to be released into the atmosphere. These extra emissions are increasing greenhouse gas concentrations in the atmosphere, and enhancing the natural greenhouse effect, which is believed to be causing global warming. While manmade greenhouse gases include naturally-occurring greenhouse gases such as CO2, methane, and N2O, some gases, like HFCs, PFCs, and SF6 are completely new to the atmos-phere. Certain gases, such as water vapor, are short-lived in the atmosphere. Others remain in the atmos-phere for significant periods of time, contributing to climate change in the long term. Water vapor is excluded from the list of greenhouse gases above because it is short-lived in the atmosphere and its atmospheric concentrations are largely determined by natural processes, such as oceanic evaporation. These gases vary considerably in terms of Global Warming Potential (GWP), which is a concept developed to compare the ability of each greenhouse gas to trap heat in the atmosphere relative to another gas. The global warming potential is based on several factors, including the relative effective-ness of a gas to absorb infrared radiation and length of time that the gas remains in the atmosphere (“atmospheric lifetime”). The GWP of each gas is measured relative to carbon dioxide, the most abundant greenhouse gas; the definition of GWP for a particular greenhouse gas is the ratio of heat trapped by one unit mass of the greenhouse gas to the ratio of heat trapped by one unit mass of CO2 over a specified time period. Greenhouse gas emissions are typically measured in terms of pounds or tons of “CO2 equivalents” (CO2e). Table 2-1 shows the GWPs for each type of greenhouse gas. For example, sulfur hexafluoride is 22,800 times more potent at contributing to global warming than carbon dioxide. The following discussion summarizes the characteristics of the six greenhouse gases. Table 2-1: Global Warming Potential of Greenhouse Gases
Gas Atmospheric Lifetime (Years) Global Warming Potential (100-year Time Horizon)
Carbon Dioxide 50-200 1 Methane 12 25 Nitrous Oxide 114 298 HFC-23 270 14,800 HFC-134a 14 1,430 HFC-152a 1.4 124 PFC: Tetrafluoromethane (CF4) 50,000 7,390 PFC: Hexafluoromethane (C2F6) 10,000 12,200 Sulfur Hexafluoride (SF6) 3,200 22,800
Source: IPCC, 2007. Climate Change 2007: The Physical Science Basis. Contribution of Working Group I to the Fourth Assessment Report of the IPCC.
a. Carbon Dioxide (CO2). In the atmosphere, carbon generally exists in its oxidized form, as CO2. Natural sources of CO2 include the respiration (breathing) of humans, animals and plants, volcanic outgassing, decomposition of organic matter and evaporation from the oceans. Human caused sources of CO2, include the combustion of fossil fuels and wood, waste incineration, mineral production, and deforestation. Natural sources release approximately 150 billion tons of CO2 each year, far outweighing the 7 billion tons of man-made emissions of CO2 each year. Nevertheless, natural removal processes, such as photosynthesis by land- and ocean-dwelling plant species, cannot
L S A A S S O C I A T E S , I N C . L A R K S P U R S M A R T S T A T I O N A R E A P L A N J U L Y 2 0 1 2 B A S E L I N E E N V I R O N M E N T A L C O N D I T I O N S 2 . G L O B A L C L I M A T E C H A N G E
P:\BMD1201 Larkspur\PRODUCTS\Working Papers\2-GCC.doc (7/30/2012) DRAFT 2 3
keep pace with this extra input of man-made CO2, and consequently, the gas is building up in the atmosphere. In 2002, CO2 emissions from fossil fuel combustion accounted for approximately 98 percent of man-made CO2 emissions and approximately 84 percent of California's overall greenhouse gas emissions (CO2e). The transportation sector accounted for California’s largest portion of CO2 emissions, with gasoline consumption making up the greatest portion of these emissions. Electricity generation was California’s second largest category of greenhouse gas emissions. b. Methane (CH4). Methane is produced when organic matter decomposes in environments lacking sufficient oxygen. Natural sources include wetlands, termites, and oceans. Decomposition occurring in landfills accounts for the majority of human-generated CH4 emissions in California and in the United States as a whole. Agricultural processes such as intestinal fermentation, manure management, and rice cultivation are also significant sources of CH4 in California. Methane accounted for approximately 6 percent of gross climate change emissions (CO2e) in California in 2002. Total annual emissions of methane are approximately 500 million tons, with manmade emissions accounting for the majority. As with CO2, the major removal process of atmospheric methane – a chemical breakdown in the atmosphere – cannot keep pace with source emissions, and methane concentrations in the atmosphere are increasing. c. Nitrous Oxide (N2O). Nitrous oxide is produced naturally by a wide variety of biological sources, particularly microbial action in soils and water. Tropical soils and oceans account for the majority of natural source emissions. Nitrous oxide is a product of the reaction that occurs between nitrogen and oxygen during fuel combustion. Both mobile and stationary combustion emit N2O, and the quantity emitted varies according to the type of fuel, technology, and pollution control device used, as well as maintenance and operating practices. Agricultural soil management and fossil fuel combustion are the primary sources of human-generated N2O emissions in California. Nitrous oxide emissions accounted for nearly 7 percent of man-made greenhouse gas emissions (CO2e) in California in 2002. d. Hydrofluorocarbons (HFCs), Perfluorocarbons (PFCs), and Sulfur Hexafluoride (SF6). HFCs are primarily used as substitutes for ozone-depleting substances regulated under the Montreal Protocol.3 PFCs and SF6 are emitted from various industrial processes, including aluminum smelting, semiconductor manufacturing, electric power transmission and distribution, and magnesium casting. There is no aluminum or magnesium production in California; however, the rapid growth in the semiconductor industry leads to greater use of PFCs. HFCs, PFCs, and SF6 accounted for about 3.5 percent of man-made greenhouse gas emissions (CO2e) in California in 2002. 2. Impacts of Climate Change
The potential impacts of global climate change are described in the following section.
3 The Montreal Protocol is an international treaty that was approved on January 1, 1989, and was designated to
protect the ozone layer by phasing out the production of several groups of halogenated hydrocarbons believed to be responsible for ozone depletion.
L S A A S S O C I A T E S , I N C . L A R K S P U R S M A R T S T A T I O N A R E A P L A N J U L Y 2 0 1 2 B A S E L I N E E N V I R O N M E N T A L C O N D I T I O N S 2 . G L O B A L C L I M A T E C H A N G E
P:\BMD1201 Larkspur\PRODUCTS\Working Papers\2-GCC.doc (7/30/2012) DRAFT 2 4
a. Temperature Increase. The latest projections, based on state-of-the art climate models, indicate that temperatures in California are expected to rise 3 to 10.5°F by the end of the century.4 Because greenhouse gases persist for a long time in the atmosphere, accumulate over time, and are generally well-mixed, their impact on the atmosphere cannot be tied to a specific point of emission. Climate change refers to any significant change in measures of climate (such as temperature, precipi-tation, or wind) lasting for an extended period (decades or longer). Climate change may result from:
Natural factors, such as changes in the sun’s intensity or slow changes in the Earth’s orbit around the sun;
Natural processes within the climate system (e.g., changes in ocean circulation and reduction in sunlight from the addition of greenhouse gases and other gases to the atmosphere from volcanic eruptions); and
Human activities that change the atmosphere’s composition (e.g., through burning fossil fuels) and the land surface (e.g., from deforestation, reforestation, urbanization, and desertification).
The primary effect of global climate change has been a rise in the average global temperature. The impact of human activities on global climate change is readily apparent in the observational record. For example, surface temperature data show that 11 of the 12 years from 1995 to 2006 rank among the 12 warmest since 1850, the beginning of the instrumental record for global surface temperature.5 Climate change modeling shows that further warming could occur, which would induce additional changes in the global climate system during the current century. Changes to the global climate system, ecosystems, and the environment of California could include, but are not limited to:
The loss of sea ice and mountain snow pack, resulting in higher sea levels and higher sea surface evaporation rates with a corresponding increase in tropospheric water vapor due to the atmos-phere’s ability to hold more water vapor at higher temperatures;
Rise in global average sea level primarily due to thermal expansion and melting of glaciers and ice caps in the Greenland and Antarctic ice sheets;
Changes in weather that include widespread changes in precipitation, ocean salinity, and wind patterns, and more energetic aspects of extreme weather, including droughts, heavy precipitation, heat waves, extreme cold, and the intensity of tropical cyclones;
Decline of the Sierra snowpack, which accounts for a significant amount of the surface water storage in California, by 70 percent to as much as 90 percent over the next 100 years;
Increase in the number of days conducive to ozone formation by 25 to 85 percent (depending on the future temperature scenario) in high ozone areas of Los Angeles and the San Joaquin Valley by the end of the 21st century; and
High potential for erosion of California’s coastlines and seawater intrusion into the Delta and levee systems due to the rise in sea level.
4 California Climate Change Center, 2006. Our Changing Climate. Assessing the Risks to California. July. 5 California, State of, 2009. California Energy Commission’s Public Interest Energy Research Program. The Future
is Now: An Update on Climate Change Science, Impacts, and Response Options for California. May.
L S A A S S O C I A T E S , I N C . L A R K S P U R S M A R T S T A T I O N A R E A P L A N J U L Y 2 0 1 2 B A S E L I N E E N V I R O N M E N T A L C O N D I T I O N S 2 . G L O B A L C L I M A T E C H A N G E
P:\BMD1201 Larkspur\PRODUCTS\Working Papers\2-GCC.doc (7/30/2012) DRAFT 2 5
b. Precipitation and Water Supply. Global average precipitation is expected to increase overall during the 21st century as the result of climate change, but will vary in different parts of the world. However, global climate models are generally not well suited for predicting regional changes in precipitation because of the scale of regionally important factors, such as the proximity of mountain ranges that affect precipitation.6 Most of California’s precipitation falls in the northern part of the State during the winter. A vast network of man-made reservoirs and aqueducts capture and transport water throughout the State from northern California rivers, as the greatest demand for water comes from users in the southern part of the State during the spring and summer.7 The current distribution system relies on Sierra Nevada mountain snowpack to supply water during the dry spring and summer months. Rising temperatures, potentially compounded by decreases in precipitation, could severely reduce spring snowpack, increasing the risk of summer water shortages. Some models predict drier conditions and decreased water flows, while others predict wetter condi-tions in various parts of the world. If heat-trapping emissions continue unabated, more precipitation will fall as rain instead of snow, and the snow that does fall will melt earlier, reducing the Sierra Nevada spring snowpack by as much as 70 to 90 percent over the next 100 years. The extent to which various meteorological conditions will impact groundwater supply is unknown. Warmer temperatures could increase the period when water is on the ground by reducing soil freeze. However, warmer temperatures could also lead to higher evaporation or shorter rainfall seasons, shortening the recharge season. Warmer winters could increase the amount of runoff available for groundwater recharge. However, the additional runoff would occur at a time when some basins, particularly in Northern California, are being recharged at their maximum capacity. Where precipitation is projected to increase in California, the increases are focused in Northern California. However, various California climate models provide mixed results regarding changes in total annual precipitation in the State through the end of this century; therefore, no conclusion on an increase or decrease can be made. Considerable uncertainties about the precise effects of climate change on California hydrology and water resources will remain until there is more precise and consistent information about how precipitation patterns, timing, and intensity will change.8 The City of Larkspur receives its water supply from the Marin Municipal Water District (MMWD) which serves central and southern Marin County. The residents of southern and central Marin are served by a unique water supply system. MMWD obtains 75 percent of the water consumed annually from rainfall collected in seven reservoirs in Marin. Five of the reservoirs are on the Mount Tamal-pais Watershed and the other two are located in West Marin. The remaining 25 percent of their water comes from the Russian River in Sonoma County under a contract with the Sonoma County Water Agency.9
6 Intergovernmental Panel on Climate Change, 2007, op. cit. 7 California Climate Change Center, 2006. Our Changing Climate. Assessing the Risks to California. July. 8 California, State of. Department of Water Resources, 2006. Progress on Incorporating Climate Change into
Management of California’s Water Resources. July. 9 Marin Municipal Water District, 2012. Current Sources. Website: marinwater.org/controller?action=menuclick
&id=221 (accessed June, 2012).
L S A A S S O C I A T E S , I N C . L A R K S P U R S M A R T S T A T I O N A R E A P L A N J U L Y 2 0 1 2 B A S E L I N E E N V I R O N M E N T A L C O N D I T I O N S 2 . G L O B A L C L I M A T E C H A N G E
P:\BMD1201 Larkspur\PRODUCTS\Working Papers\2-GCC.doc (7/30/2012) DRAFT 2 6
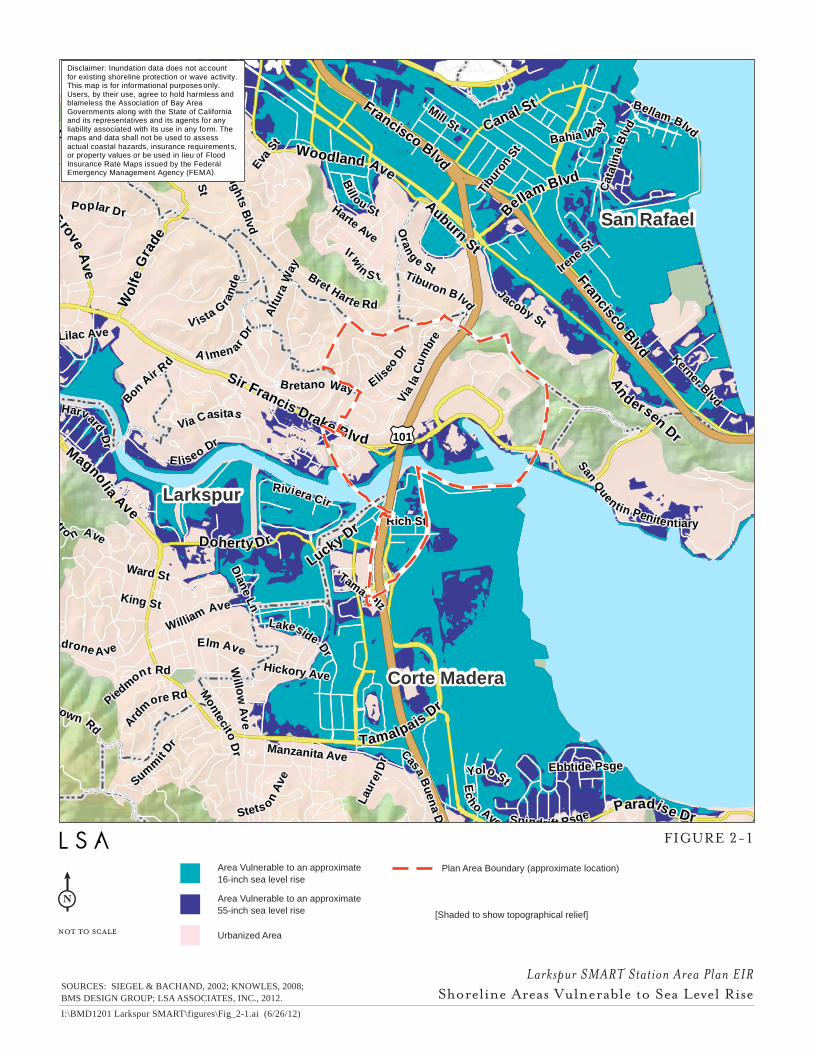
c. Sea Level Rise. Rising sea level is one of the major areas of concern related to global climate change. Two of the primary causes for a sea level rise are the thermal expansion of ocean waters (water expanding as it heats up) and the addition of water to ocean basins by the melting of land-based ice. From 1961 to 2003, global average sea level rose at an average rate of 0.07 inches per year, and at an accelerated average rate of about 0.12 inches per year during the last decade of this period (1993 to 2003).10 Over the past 100 years, sea levels along California’s coasts and estuaries have risen about 7 inches.11 Sea levels could rise an additional 22 to 35 inches by the end of the century as global climate change continues.12 Although these projections are on a global scale, the rate of sea level rise along California’s coast is relatively consistent with the worldwide average rate observed over the past century. Therefore, it is reasonable to assume that changes in worldwide sea level rise will also be experienced along California’s coast.13 Sea level rise of this magnitude would increasingly threaten California’s coastal regions with more intense coastal storms, accelerated coastal erosion, threats to vital levees, and disruption of inland water systems, wetlands and natural habitats. Rising sea levels and more intense storm surges could increase the risk for coastal flooding. Because of scientific uncertainties, it is difficult to predict with a high degree of accuracy the sea level rise that will impact Marin County residents. The San Francisco Bay Conservation and Develop-ment Commission’s (BCDC) most recent assessment assumes a 1.8° to 5.4° F (1° to 3° C) rise in global temperature over the next century and a corresponding sea level rise in San Francisco Bay of 16 inches by mid-century and 55 inches by 2100.14 Sea level rise of this magnitude would have dramatic impacts on residences, businesses, schools, and public infrastructure located near the shoreline. Inundation maps created by BCDC integrate geographic information system software data from the U.S. Geological Survey and sea level rise projections to assess the vulnerability of Bay Area communities to different level rise scenarios. A 16-inch rise in sea level would result in the flooding of 180,000 acres of shoreline, which is roughly equivalent to today’s 100-year floodplain. A 55-inch rise in sea level would flood over 213,000 acres of shoreline, putting billions of dollars of private and public development at risk. Figure 2-1 shows shoreline areas vulnerable to sea level rise.
10 California, State of, 2008. California Energy Commission’s Public Interest Energy Research Program. The Future
is Now: An Update on Climate Change Science, Impacts, and Response Options for California. May. 11 Ibid. 12 California Climate Change Center, 2006. Our Changing Climate. Assessing the Risks to California. July. 13 California, State of, 2006. Department of Water Resources. Progress on Incorporating Climate Change into
Management of California’s Water Resources. July. 14 San Francisco Bay Conservation and Development Commission, 2011. Living with a Rising Bay: Vulnerability
and Adaptation in San Francisco Bay and on its Shoreline. Website: www.bcdc.ca.gov/BPA/LivingWithRisingBay.pdf (accessed June 2012). October.
Francisco Blvd
D S
t
Sir Francis Drake Blvd
An
dersen Dr
Paradise Dr
Doherty Dr
Woodland Ave
Magnolia Ave
Tamalpais Dr
Canal St
Laurel Grove Ave
Wo
lfe
Gra
de
Bellam Blvd
Auburn St
Lucky Dr
Francisco Blvd
C S
t
Irwin S tBret Harte Rd
Poplar Dr
Glen Dr
El iseo Dr
Crown Rd
Jacoby St
Upper Toyon Dr
Mon
tecito D
r
Lakeside DrMadrone Ave
Kerner BlvdMill St
William Ave
Casa Bu
ena D
r
A lmen ar D
rV ista G
ran
de
C
itro n Ave
Bon Air
Rd
Willo
w A
ve
Billou St
Yolo St
Bellam Blvd
Manzanita Ave
Tiburon Blvd
Bretano Way
Ec
h
o Ave
King St
Cla
rk S
t
Bahia W ay
Elm Ave
Alt
ura
Way
Ward St
Cat
alin
a B
lvd
Riviera Cir
Harvard Dr
Mak in
Via
la C
um
bre
Via Casitas
Spindrift Psge
Sum
mit
Dr
Ash
Ave
Rich St
So
uth
ern H
eigh
ts Blvd
Lau
rel D
r
San Quentin Penitentiary
Piedm
ont Rd Hickory Ave
Ora
nge St
Harte Ave
Stets on A
ve
Tibu
ron
St
Dian
e Ln
Tamal Plz
Ardm
ore Rd
Irene S
t
Alta Way
Ebbtide Psge
Lilac Ave
Eva S
t
Eliseo
Dr
Larkspur
Corte Madera
Mill Valley
San Rafael
Ross
£¤101
Area Vulnerable to an approximate16-inch sea level rise
Area Vulnerable to an approximate55-inch sea level rise
Urbanized Area
Plan Area Boundary (approximate location)
[Shaded to show topographical relief]
Disclaimer: Inundation data does not accountfor existing shoreline protection or wave activity.This map is for informational purposes only.Users, by their use, agree to hold harmless andblameless the Association of Bay AreaGovernments along with the State of Californiaand its representatives and its agents for anyliability associated with its use in any form. Themaps and data shall not be used to assessactual coastal hazards, insurance requirements,or property values or be used in lieu of FloodInsurance Rate Maps issued by t eh FederalEmergency Management Agency (FEMA).
not to scale
Larkspur SMART Station Area Plan EIRShoreline Areas Vulnerable to Sea Level Rise
SOURCES: SIEGEL & BACHAND, 2002; KNOWLES, 2008; BMS DESIGN GROUP; LSA ASSOCIATES, INC., 2012.
I:\BMD1201 Larkspur SMART\figures\Fig_2-1.ai (6/26/12)
FIGURE 2-1
L S A A S S O C I A T E S , I N C . L A R K S P U R S M A R T S T A T I O N A R E A P L A N J U L Y 2 0 1 2 B A S E L I N E E N V I R O N M E N T A L C O N D I T I O N S 2 . G L O B A L C L I M A T E C H A N G E
P:\BMD1201 Larkspur\PRODUCTS\Working Papers\2-GCC.doc (7/30/2012) DRAFT 2 8
This page intentionally left blank.
L S A A S S O C I A T E S , I N C . L A R K S P U R S M A R T S T A T I O N A R E A P L A N J U L Y 2 0 1 2 B A S E L I N E E N V I R O N M E N T A L C O N D I T I O N S 2 . G L O B A L C L I M A T E C H A N G E
P:\BMD1201 Larkspur\PRODUCTS\Working Papers\2-GCC.doc (7/30/2012) DRAFT 2 9
According to the BCDC, changes in climate may cause increased storm activity, which in combina-tion with higher sea level, may cause even greater flooding. It is expected that extreme storm events will cause most of the shoreline damage from flooding. Rising sea levels could impact the delivery of petroleum products, electricity, and drinking water to Bay Area residents and businesses. Residents may also suffer if wastewater treatment is compromised by inundation from rising sea levels, given that a number of treatment plants discharge to the Bay. d. Water Quality. Water quality depends on a wide range of variables such as water temperature, flow, runoff rates and timing, waste discharge loads, and the ability of watersheds to assimilate wastes and pollutants. Climate change could alter water quality in a variety of ways, including higher winter flows that reduce pollutant concentrations (through dilution) or increase erosion of land surfaces and stream channels, leading to higher sediment, chemical, and nutrient loads in rivers. Water temperature increases and decreased water flows can result in increasing concentrations of pollutants and salinity. Increases in water temperature alone can likely to lead to adverse changes in water quality, even in the absence of changes in precipitation. Land and resource use changes can have impacts on water quality comparable to or even greater than those from global climate change. The net effect on water quality for rivers, lakes, and groundwater in the future is dependent not just on climate conditions, but also on a wide range of other human actions and management decisions. Fortunately, there are a number of stewardship actions that cities and counties can take that reduce costs and improve the reliability and quality of water resources. The City of Larkspur’s Climate Action Plan has identified several programs to improve water quality, which the City is working to implement through the City’s Climate Action Plan.15 e. Public Health. Global climate change is anticipated to result in not only changes to average temperature, but also to more extreme heat events.16 These extreme heat events increase the risk of death from dehydration, heart attack, stroke, and respiratory distress, especially with people who are ill, children, the elderly, and the poor, who may lack access to air conditioning and medical assis-tance. According to the California Climate Change Center, more research is needed to understand the effects of higher temperatures and how adapting to these temperatures can minimize health effects.17 B. REGULATORY FRAMEWORK
The federal and State regulatory framework related to greenhouse gas emissions is described below. 1. Federal Regulations
The United States has historically had a voluntary approach to reducing greenhouse gas emissions. However, on April 2, 2007, the United States Supreme Court ruled that the Environmental Protection Agency (EPA) has the authority to regulate CO2 emissions under the federal Clean Air Act (CAA). While there currently are no adopted federal regulations for the control or reduction of greenhouse
15 Larkspur, City of, 2010. Climate Action Plan. June. 16 California Climate Change Center, 2006. Our Changing Climate. Assessing the Risks to California. July. 17 Ibid.
L S A A S S O C I A T E S , I N C . L A R K S P U R S M A R T S T A T I O N A R E A P L A N J U L Y 2 0 1 2 B A S E L I N E E N V I R O N M E N T A L C O N D I T I O N S 2 . G L O B A L C L I M A T E C H A N G E
P:\BMD1201 Larkspur\PRODUCTS\Working Papers\2-GCC.doc (7/30/2012) DRAFT 2 10
gas emissions, the EPA commenced several actions in 2009 to implement a regulatory approach to global climate change, including the ones described below. On September 22, 2009, the EPA issued a final rule for mandatory reporting of greenhouse gases from large greenhouse gas emission sources in the United States. In general, this national reporting requirement will provide the EPA with accurate and timely greenhouse gas emissions data from facilities that emit 25,000 metric tons or more of CO2 per year. This publicly-available data will allow the reporters to track their own emissions, compare them to similar facilities, and aid in identifying cost-effective opportunities to reduce emissions in the future. Reporting is at the facility level, except that certain suppliers of fossil fuels and industrial greenhouse gases, along with vehicle and engine manufacturers, will report at the corporate level. An estimated 85 percent of the total U.S. greenhouse gas emissions, from approximately 10,000 facilities, are covered by this rule. On December 7, 2009, the EPA Administrator signed a final action under the CAA, finding that six greenhouse gases (CO2, CH4, N2O, HFCs, PFCs, SF6) constitute a threat to public health and welfare, and that the combined emissions from motor vehicles contribute to global climate change. This EPA action does not impose any requirements on industry or other entities. However, the findings are a prerequisite to finalizing the greenhouse gas emission standards for light-duty vehicles mentioned below. EPA received ten petitions challenging this determination. On July 29, 2010, EPA denied these petitions. On April 1, 2010, the EPA and the Department of Transportation’s National Highway Traffic Safety Administration (NHTSA) announced a final joint rule to establish a national program consisting of new standards for model year 2012 through 2016 light-duty vehicles that will reduce greenhouse gas emissions and improve fuel economy. EPA is finalizing the first-ever national greenhouse gas emis-sions standards under the Clean Air Act, and NHTSA is finalizing Corporate Average Fuel Economy standards under the Energy Policy and Conservation Act. The EPA greenhouse gas standards require light-duty vehicles to meet an estimated combined average emissions level of 250 grams of CO2 per mile in model year 2016, equivalent to 35.5 miles per gallon. In December 2010, the EPA issued its plan for establishing greenhouse gas pollution standards under the CAA in 2011. The agency looked at a number of sectors and is moving forward on greenhouse gas standards for fossil fuel power plants and petroleum refineries – two of the largest industrial sources, representing nearly 40 percent of the greenhouse gas pollution in the United States.18 On August 9, 2011, EPA and the NHTSA announced the first-ever standards to reduce greenhouse gas emissions and improve the fuel efficiency of heavy-duty trucks and buses. The final combined standards of the Heavy-Duty National Program will reduce CO2 emissions by about 270 MMT and save about 530 million barrels of oil over the life of vehicles built for the 2014 to 2018 model years. The heavy duty sector addressed in the EPA and NHTSA rules (including the largest pickup trucks and vans, semi-trucks, and all types and sizes of work trucks and buses in between) accounts for nearly 6 percent of all U.S. greenhouse gas emissions and 20 percent of transportation emissions. In addition, air quality will continue to improve as less fuel use leads to reduced ozone and particulate matter.
18 U.S. EPA, 2010. Press Release. December 23.
L S A A S S O C I A T E S , I N C . L A R K S P U R S M A R T S T A T I O N A R E A P L A N J U L Y 2 0 1 2 B A S E L I N E E N V I R O N M E N T A L C O N D I T I O N S 2 . G L O B A L C L I M A T E C H A N G E
P:\BMD1201 Larkspur\PRODUCTS\Working Papers\2-GCC.doc (7/30/2012) DRAFT 2 11
2. State Regulations
The CARB is typically the lead agency for implementing climate change regulations in the State. There are many regulations and statutes in California that address both directly and indirectly, green-house gas emissions, such as renewable portfolio standards (SB 1078, SB 107, SB 2(1X) and energy efficiency standards (Title 24, Cal. Code Regs.). Many of the most prominent state regulatory activi-ties addressing specifically climate change and greenhouse gas emissions are discussed below.
Assembly Bill 1493 (2002). In a response to the transportation sector’s significant contribution to California’s CO2 emissions, AB 1493 (Pavley) was enacted on July 22, 2002. AB 1493 requires the CARB to set greenhouse gas emission standards for passenger vehicles and light duty trucks (and other vehicles whose primary use is noncommercial personal transportation in the State) manufactured in 2009 and all subsequent model years. These standards (starting in model years 2009 to 2016) were approved by the CARB in 2004, but the needed waiver of Clean Air Act Preemption was not granted by the EPA until June 30, 2009. The CARB responded by amending its original regulation, now referred to as Low Emission Vehicle III greenhouse gas, to take effect for model years starting in 2017 to 202519.
Executive Order S-3-05 (2005). Governor Arnold Schwarzenegger signed Executive Order S-3-05 on June 1, 2005, which proclaimed that California is vulnerable to the impacts of climate change. To combat those concerns, the executive order established California’s greenhouse gas emissions reduction targets, which established the following goals:
greenhouse gas emissions should be reduced to 2000 levels by 2010;
greenhouse gas emissions should be reduced to 1990 levels by 2020; and
greenhouse gas emissions should be reduced to 80 percent below 1990 levels by 2050. The Secretary of the California Environmental Protection Agency (CalEPA) is required to coordinate efforts of various State agencies in order to collectively and efficiently reduce greenhouse gases. A biannual progress report must be submitted to the Governor and State Legislature disclosing the progress made toward greenhouse gas emission reduction targets. In addition, another biannual report must be submitted illustrating the impacts of global warming on California’s water supply, public health, agriculture, the coastline, and forestry, and report possible mitigation and adaptation plans to address these impacts.
Assembly Bill 32 (2006), California Global Warming Solutions Act. California’s major initiative for reducing greenhouse gas emissions is AB 32, passed by the State legislature on August 31, 2006. This effort aims at reducing greenhouse gas emissions to 1990 levels by 2020. The CARB has established the level of greenhouse gas emissions in 1990 at 427 MMT CO2e. The emissions target of 427 MMT requires the reduction of 169 MMT from the State’s projected business-as-usual 2020 emissions of 596 MMT. AB 32 requires the CARB to prepare a Scoping Plan that outlines the main State strategies for meeting the 2020 deadline and to reduce greenhouse gases that contribute to global climate change. The Scoping Plan was approved by the CARB on December 11, 2008, and includes measures to reduce greenhouse gas emissions related to energy efficiency, water use,
19 California Air Resources Board, 2010. California Clean Car Standards – Pavely, Assembly Bill 1493. Website:
arb.ca.gov/cc/ccms/ccms.htm (accessed November 2011).
L S A A S S O C I A T E S , I N C . L A R K S P U R S M A R T S T A T I O N A R E A P L A N J U L Y 2 0 1 2 B A S E L I N E E N V I R O N M E N T A L C O N D I T I O N S 2 . G L O B A L C L I M A T E C H A N G E
P:\BMD1201 Larkspur\PRODUCTS\Working Papers\2-GCC.doc (7/30/2012) DRAFT 2 12
recycling, solid waste, and other sources.20 The Scoping Plan includes a range of greenhouse gas reduction actions that may include direct regulations, alternative compliance mechanisms, monetary and non-monetary incentives, voluntary actions, and market-based mechanisms such as a cap-and-trade system. The Scoping Plan, even after CARB approval, remains a recommendation. The measures in the Scoping Plan will not be binding until after they are adopted through the normal rulemaking process. The CARB rulemaking process includes preparation and release of each of the draft measures, public input through workshops, and a public comment period, followed by a CARB hearing and rule adoption. In addition to reducing greenhouse gas emissions to 1990 levels by 2020, AB 32 directed the CARB and the newly created Climate Action Team (CAT) to identify a list of “discrete early action green-house gas reduction measures” that could be adopted and made enforceable by January 1, 2010. On January 18, 2007, Governor Schwarzenegger signed Executive Order S-1-07, further solidifying California’s dedication to reducing greenhouse gases by setting a new Low Carbon Fuel Standard. The Executive Order sets a target to reduce the carbon intensity of California transportation fuels by at least 10 percent by 2020 and directs the CARB to consider the Low Carbon Fuel Standard as a discrete early action measure. In June 2007, the CARB approved a list of 37 early action measures, including three discrete early action measures (Low Carbon Fuel Standard, Restrictions on GWP Refrigerants, and Landfill CH4
Capture). 21 Discrete early action measures are measures that were required to be adopted as regula-tions and made effective no later than January 1, 2010, the date established by Health and Safety Code Section 38560.5. The CARB adopted additional early action measures in October 2007 that tripled the number of discrete early action measures. These measures relate to truck efficiency, port electrification, reduction of PFCs from the semiconductor industry, reduction of propellants in consumer products, proper tire inflation, and SF6 reductions from the non-electricity sector. The combination of early action measures is estimated to reduce State-wide greenhouse gas emissions by nearly 16 MMT.22 To assist public agencies in analyzing the effects of greenhouse gases under CEQA, Senate Bill 97 (Chapter 185, 2007) required the Governor’s Office of Planning and Research (OPR) to develop CEQA guidelines on how to minimize and mitigate a project’s greenhouse gas emissions. On December 30, 2009, the Natural Resources Agency adopted amendments to the CEQA Guidelines related to climate change. These amendments became effective on March 18, 2010. In December 2008, CARB adopted its Climate Change Scoping Plan, which contains the main strate-gies California will implement to achieve reduction of approximately 169 MMT of CO2e, or approxi-mately 30 percent from the State’s projected 2020 emission level of 596 MMT of CO2e under a business-as-usual scenario (this is a reduction of 42 MMT CO2e, or almost 10 percent from 2002-2004 average emissions). The Scoping Plan also includes CARB-recommended greenhouse gas reductions for each emissions sector of the State’s greenhouse gas inventory. The Scoping Plan calls
20 California Air Resources Board, 2008. Climate Change Scoping Plan: a framework for change. December. 21 California Air Resources Board, 2007. Expanded List of Early Action Measures to Reduce Greenhouse Gas
Emissions in California Recommended for Board Consideration. October. The Low Carbon Fuel Standard has been the subject of litigation in federal court that is still pending.
22 California Air Resources Board, 2007. “ARB approves tripling of early action measures required under AB 32” News Release 07-46. Website: www.arb.ca.gov/newsrel/nr102507.htm. October 25.
L S A A S S O C I A T E S , I N C . L A R K S P U R S M A R T S T A T I O N A R E A P L A N J U L Y 2 0 1 2 B A S E L I N E E N V I R O N M E N T A L C O N D I T I O N S 2 . G L O B A L C L I M A T E C H A N G E
P:\BMD1201 Larkspur\PRODUCTS\Working Papers\2-GCC.doc (7/30/2012) DRAFT 2 13
for the largest reductions in greenhouse gas emissions to be achieved by implementing the following measures and standards:
Improved emissions standards for light-duty vehicles (estimated reductions of 31.7 MMT CO2e);
The Low-Carbon Fuel Standard (15.0 MMT CO2e);
Energy efficiency measures in buildings and appliances and the widespread development of combined heat and power systems (26.3 MMT CO2e); and
A renewable portfolio standard for electricity production (21.3 MMT CO2e). The Scoping Plan identifies 18 emission reduction measures that address cap-and-trade programs, vehicle gas standards, energy efficiency, low carbon fuel standards, renewable energy, regional trans-portation-related greenhouse gas targets, vehicle efficiency measures, goods movement, solar roof programs, industrial emissions, high speed rail, green building strategies, recycling, sustainable forests, water, and air. The measures would result in a total reduction of 174 MMT CO2e by 2020. On August 24, 2011, CARB unanimously approved both CARB’s new supplemental assessment and re-approved its Scoping Plan, which provides the overall roadmap and rule measures to carry out AB 32. CARB also approved a more robust CEQA equivalent document supporting the supplemental analysis of the cap-and-trade program. CARB also announced that it would be delaying the date that entities would be required to comply with its cap-and-trade program until 2013. CARB has not yet determined what amount of greenhouse gas reductions it recommends from local government operations; however, the Scoping Plan states that land use planning and urban growth decisions will play an important role in the State’s greenhouse gas reductions because local govern-ments have primary authority to plan, zone, approve, and permit how land is developed to accommo-date population growth and the changing needs of their jurisdictions (meanwhile, CARB is also developing an additional protocol for community emissions). CARB further acknowledges that decisions on how land is used will have large impacts on the greenhouse gas emissions that will result from the transportation, housing, industry, forestry, water, agriculture, electricity, and natural gas emission sectors. The Scoping Plan states that the ultimate greenhouse gas reduction assignment to local government operations is to be determined. With regard to land use planning, the Scoping Plan expects an approximately 5.0 MMT CO2e reduction due to implementation of SB 375, which is discussed further below.
Senate Bill 1368 (2006). SB 1368 is the companion bill of AB 32 and was signed by Governor Schwarzenegger in September 2006. SB 1368 requires the California Public Utilities Commission (PUC) to establish a greenhouse gas emission performance standard for baseload generation from investor- owned utilities and local publicly-owned utilities These standards cannot exceed the green-house gas emission rate from a baseload combined-cycle natural gas fired plant. The legislation further requires that all electricity provided to California, including imported electricity, must be generated from plants that meet the standards set by the PUC.
Executive Order S-1-07. Executive Order S-1-07 in 2007 indicates that the transportation sector accounts for over 40 percent of Statewide greenhouse gas emissions and establishes a goal to reduce the carbon intensity of transportation fuels sold in California by a minimum of 10 percent by 2020.
L S A A S S O C I A T E S , I N C . L A R K S P U R S M A R T S T A T I O N A R E A P L A N J U L Y 2 0 1 2 B A S E L I N E E N V I R O N M E N T A L C O N D I T I O N S 2 . G L O B A L C L I M A T E C H A N G E
P:\BMD1201 Larkspur\PRODUCTS\Working Papers\2-GCC.doc (7/30/2012) DRAFT 2 14
Senate Bill 97 (2007). SB 97, signed by the Governor in August 2007 (Chapter 185, Statutes of 2007; Public Resources Code, Sections 21083.05 and 21097), acknowledges climate change is a prominent environmental issue that requires analysis under CEQA. This bill directed the OPR to prepare, develop, and transmit to the California Resources Agency guidelines for mitigating green-house gas emissions or the effects of greenhouse gas emissions, as required by CEQA. The California Natural Resources Agency adopted the amendments to the CEQA Guidelines in January 2010, which went into effect in March 2010. The amendments do not identify a threshold of significance for greenhouse gas emissions, nor do they prescribe assessment methodologies or specific mitigation measures. The amendments encourage lead agencies to consider many factors in performing a CEQA analysis, but preserve the discretion granted by CEQA to lead agencies in making their own determinations based on substantial evidence. The amendments also encourage public agencies to make use of programmatic mitigation plans and programs when they perform individual project analyses.
Senate Bill 375 (2008). Signed into law on October 1, 2008, SB 375 supplements greenhouse gas reductions from new vehicle technology and fuel standards with reductions from more efficient land use patterns and improved transportation. Under the law, CARB approved greenhouse gas reduction targets in February 2011 for California’s 18 federally designated regional planning bodies, known as Metropolitan Planning Organizations (MPOs). CARB may update the targets every 4 years and must update them every 8 years. MPOs in turn must demonstrate how their plans, policies and transportation investments meet the targets set by CARB through Sustainable Community Strategies (SCS). The SCS are included with the Regional Transportation Plan (RTP), a report required by State law. However, if an MPO finds that their SCS will not meet the greenhouse gas reduction target, they may prepare an Alternative Planning Strategy (APS). The APS identifies the impediments to achieving the targets.
Executive Order S-13-08. Governor Schwarzenegger signed Executive Order S-13-08 on November 14, 2008, which directs California to develop methods for adapting to climate change through preparation of a Statewide plan. The executive order directed OPR, in cooperation with the California Resources Agency (CRA), to provide land use planning guidance related to sea level rise and other climate change impacts by May 30, 2009.
Office of Planning and Research. On December 30, 2009, the California Natural Resources Agency adopted amendments to the CEQA Guidelines related to Climate Change. These amendments became effective on March 18, 2010. Revisions to Appendix G of the CEQA Guidelines suggest that development projects be evaluated based on the following thresholds:
Would the project generate greenhouse gas emissions, either directly or indirectly, that may have a significant impact on the environment; and
Would the project conflict with an applicable plan, policy or regulation adopted for the purpose of reducing the emissions of greenhouse gases.
3. Bay Area Air Quality Management District
BAAQMD is the regional government agency that regulates sources of air pollution within the nine San Francisco Bay Area counties. The BAAQMD regulates greenhouse gas emissions through the following plans, programs, and guidelines.
L S A A S S O C I A T E S , I N C . L A R K S P U R S M A R T S T A T I O N A R E A P L A N J U L Y 2 0 1 2 B A S E L I N E E N V I R O N M E N T A L C O N D I T I O N S 2 . G L O B A L C L I M A T E C H A N G E
P:\BMD1201 Larkspur\PRODUCTS\Working Papers\2-GCC.doc (7/30/2012) DRAFT 2 15
Regional Clean Air Plans. BAAQMD and other air districts prepare clean air plans in accor-dance with the State and federal Clean Air Acts. The Bay Area 2010 Clean Air Plan (CAP) is a comprehensive plan to improve Bay Area air quality and protect public health through implementation of a control strategy designed to reduce emissions and ambient concentrations of harmful pollutants. The most recent CAP also includes measures designed to reduce greenhouse gas emissions.
BAAQMD Climate Protection Program. The BAAQMD established a climate protection
program to reduce pollutants that contribute to global climate change and affect air quality in the San Francisco Bay Area Air Basin. The climate protection program includes measures that promote energy efficiency, reduce vehicle miles traveled, and develop alternative sources of energy, all of which assist in reducing emissions of greenhouse gas and in reducing air pollutants that affect the health of residents. BAAQMD also seeks to support current climate protection programs in the region and to stimulate additional efforts through public education and outreach, technical assistance to local governments and other interested parties, and promotion of collaborative efforts among stakeholders.
BAAQMD CEQA Air Quality Guidelines. The BAAQMD adopted revised CEQA Air Quality Guidelines on June 2, 2010 and then adopted a modified version of the Guidelines in May, 2011. The BAAQMD CEQA Air Quality Guidelines include thresholds of significance for green-house gas emissions.23 Under the latest CEQA Air Quality Guidelines, a local government may prepare a qualified greenhouse gas Reduction Strategy that is consistent with AB 32 goals. If a project is consistent with an adopted qualified greenhouse gas Reduction Strategy and General Plan that addresses the project’s greenhouse gas emissions, it can be presumed that the project will not have significant greenhouse gas emissions under CEQA.24 The BAAQMD also adopted a quantitative threshold for project level analyses based on estimated greenhouse gas emissions as well as per capita metrics. C. EMISSIONS INVENTORIES
An emissions inventory that identifies and quantifies the primary human-generated sources and sinks of greenhouse gases is a well-recognized and useful tool for addressing climate change. This section summarizes the latest information on global, United States, California, and local greenhouse gas emission inventories. 1. Global Emissions
Worldwide emissions of greenhouse gases in 2004 were 30 billion tons of CO2e per year (including both ongoing emissions from industrial and agricultural sources, but excluding emissions from land-use changes).25
23 On March 5, 2012, the Alameda County Superior Court issued a judgment finding that the BAAQMD had failed
to comply with CEQA when it adopted the thresholds of significance in the 2011 BAAQMD CEQA Air Quality Guidelines. The court issued a writ of mandate ordering the BAAQMD to set aside the thresholds and cease dissemination of them until the BAAQMD complied with CEQA. In view of the court’s order, the BAAQMD is no longer recommending that the thresholds of significance be used as a generally applicable measure of a project’s significant air quality impacts.
24 Bay Area Air Quality Management District, 2011. CEQA Air Quality Guidelines. May. 25 United Nations Framework Convention on Climate Change (UNFCCC), 2007. Sum of Annex I and Non-Annex I
Countries Without Counting Land-Use, Land-Use Change and Forestry (LULUCF). Predefined Queries: Greenhouse gas
L S A A S S O C I A T E S , I N C . L A R K S P U R S M A R T S T A T I O N A R E A P L A N J U L Y 2 0 1 2 B A S E L I N E E N V I R O N M E N T A L C O N D I T I O N S 2 . G L O B A L C L I M A T E C H A N G E
P:\BMD1201 Larkspur\PRODUCTS\Working Papers\2-GCC.doc (7/30/2012) DRAFT 2 16
2. United States Emissions
In 2010, the U.S. emitted about 1,633.2 million metric tons of CO2e with each individual at home releasing approximately 4 metric tons per year. Of the four major sectors nationwide – residential, commercial, industrial and transportation – transportation accounts for the highest amount of greenhouse gas emissions (approximately 35 to 40 percent); these emissions are entirely generated from direct fossil fuel combustion. Between 1990 and 2009, total U.S. greenhouse gas emissions rose by 7.3 percent, but emissions decreased from 2008 to 2009 by 6.1 percent. This decrease was primarily due to: (1) a decrease in economic output resulting in a decrease in energy consumption across all sectors; and (2) a decrease in the carbon intensity of fuels used to generate electricity due to fuel switching as the price of coal increased, and the price of natural gas decreased significantly. Since 1990, U.S. emissions have increased at an average annual rate of 0.4 percent.26 3. State of California Emissions
According to CARB emission inventory estimates, California’s gross greenhouse gas emissions decreased 1.5 percent, from 463.6 MMT27 of CO2e emissions in 2000 to 456.8 million in 2009, with a maximum of 488.8 million in 2007.28 During the same period, California’s population grew by 9.1 percent, from 33.9 to 37.2 million people and greenhouse gas emissions per person decreased from 13.7 to 12.4 metric tons of CO2e per person. The year 2009 saw a 5.8 percent decrease in Statewide greenhouse gas emissions, driven by a noticeable drop in on-road transportation, cement production, and electricity. The year 2009 also reflects the full effects of the economic recession and higher fuel prices. As the economy recovers, greenhouse gas emissions are likely to rise again without other mitigation actions. The California EPA Climate Action Team stated in its March 2006 report29 that the composition of gross climate change pollutant emissions in California in 2002 (expressed in terms of CO2e) was as follows:
Carbon dioxide (CO2) accounted for 83.3 percent;
Methane (CH4) accounted for 6.4 percent;
Nitrous oxide (N2O) accounted for 6.8 percent; and
Fluorinated gases (HFCs, PFC, and SF6) accounted for 3.5 percent.30
total without LULUCF (Annex I Parties). Bonn, Germany. Website: unfccc.int/ghg_emissions_data/predefined_queries/ items/3814.php (accessed June 2012).
26 U.S. Environmental Protection Agency, 2011. The U.S. Greenhouse Gas Emissions and Sinks: Fast Facts. Website: www.epa.gov/climatechange/emissions/usinventoryreport.html (accessed June 2012).
27 A metric ton is equivalent to approximately 1.1 tons. 28 California Air Resources Board, 2011. Trends in California GHG Emissions for 2000 to 2009 by Category as
Defined in the Scoping Plan. December. Website: www.arb.ca.gov/cc/inventory/pubs/reports/ghg_inventory_00-09_trends.pdf (accessed June 2012).
29 California Environmental Protection Agency, 2006. Climate Action Team Report to Governor Schwarzenegger and the Legislature. March. Website: www.climatechange.ca.gov/climate_action_team/reports/#2006 (accessed July 2012)
30 California Environmental Protection Agency, 2006. Climate Action Team Report to Governor Schwarzenegger and the Legislature. March.
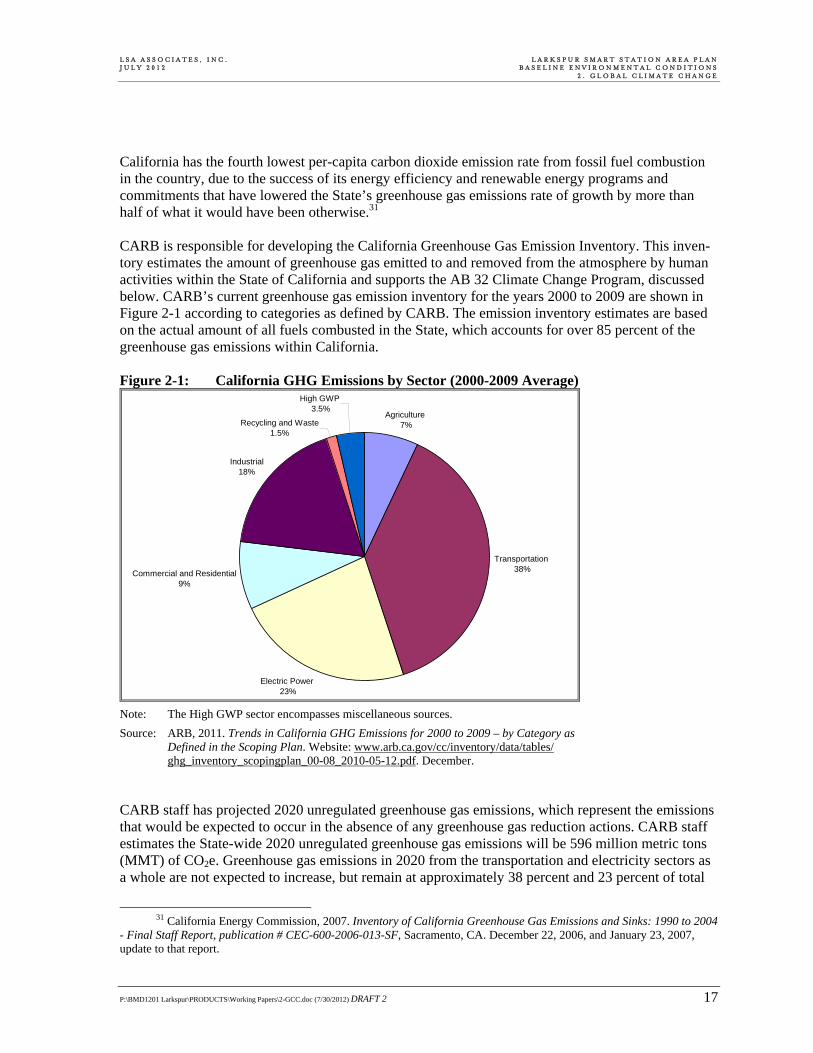
L S A A S S O C I A T E S , I N C . L A R K S P U R S M A R T S T A T I O N A R E A P L A N J U L Y 2 0 1 2 B A S E L I N E E N V I R O N M E N T A L C O N D I T I O N S 2 . G L O B A L C L I M A T E C H A N G E
P:\BMD1201 Larkspur\PRODUCTS\Working Papers\2-GCC.doc (7/30/2012) DRAFT 2 17
California has the fourth lowest per-capita carbon dioxide emission rate from fossil fuel combustion in the country, due to the success of its energy efficiency and renewable energy programs and commitments that have lowered the State’s greenhouse gas emissions rate of growth by more than half of what it would have been otherwise.31 CARB is responsible for developing the California Greenhouse Gas Emission Inventory. This inven-tory estimates the amount of greenhouse gas emitted to and removed from the atmosphere by human activities within the State of California and supports the AB 32 Climate Change Program, discussed below. CARB’s current greenhouse gas emission inventory for the years 2000 to 2009 are shown in Figure 2-1 according to categories as defined by CARB. The emission inventory estimates are based on the actual amount of all fuels combusted in the State, which accounts for over 85 percent of the greenhouse gas emissions within California. Figure 2-1: California GHG Emissions by Sector (2000-2009 Average)
Electric Power 23%
Commercial and Residential 9%
Industrial18%
Recycling and Waste1.5%
High GWP 3.5%
Agriculture 7%
Transportation 38%
Note: The High GWP sector encompasses miscellaneous sources.
Source: ARB, 2011. Trends in California GHG Emissions for 2000 to 2009 – by Category as Defined in the Scoping Plan. Website: www.arb.ca.gov/cc/inventory/data/tables/ ghg_inventory_scopingplan_00-08_2010-05-12.pdf. December.
CARB staff has projected 2020 unregulated greenhouse gas emissions, which represent the emissions that would be expected to occur in the absence of any greenhouse gas reduction actions. CARB staff estimates the State-wide 2020 unregulated greenhouse gas emissions will be 596 million metric tons (MMT) of CO2e. Greenhouse gas emissions in 2020 from the transportation and electricity sectors as a whole are not expected to increase, but remain at approximately 38 percent and 23 percent of total
31 California Energy Commission, 2007. Inventory of California Greenhouse Gas Emissions and Sinks: 1990 to 2004
- Final Staff Report, publication # CEC-600-2006-013-SF, Sacramento, CA. December 22, 2006, and January 23, 2007, update to that report.
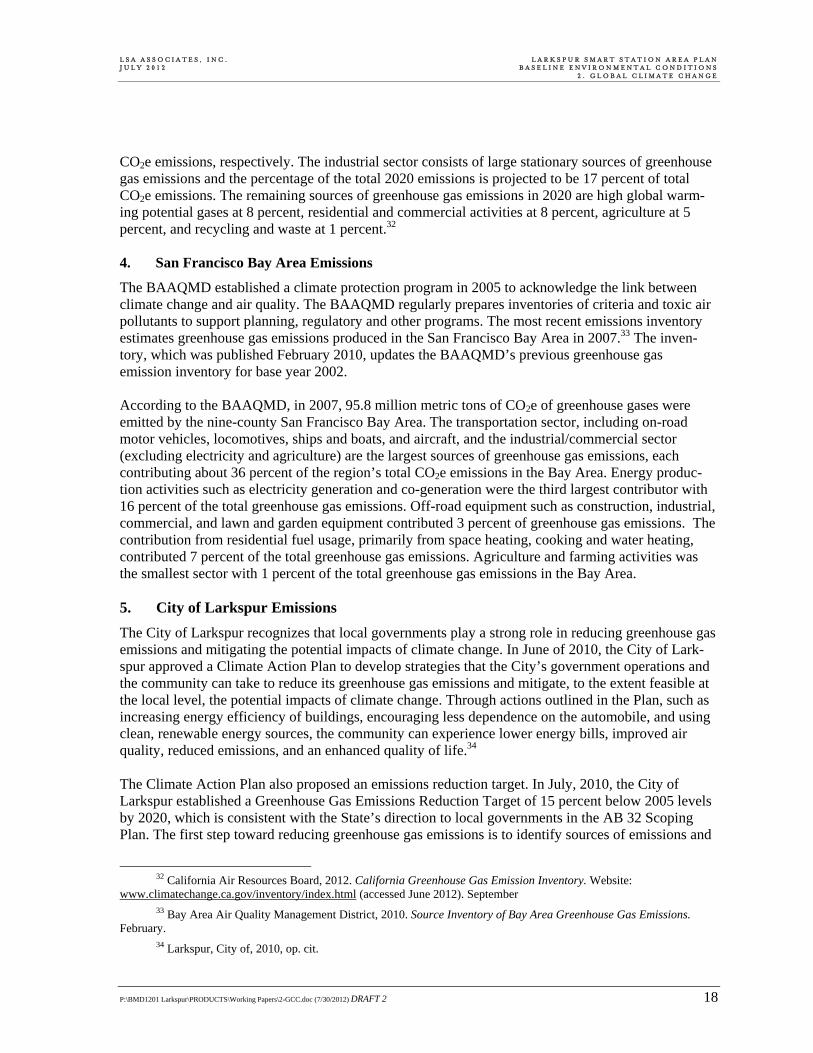
L S A A S S O C I A T E S , I N C . L A R K S P U R S M A R T S T A T I O N A R E A P L A N J U L Y 2 0 1 2 B A S E L I N E E N V I R O N M E N T A L C O N D I T I O N S 2 . G L O B A L C L I M A T E C H A N G E
P:\BMD1201 Larkspur\PRODUCTS\Working Papers\2-GCC.doc (7/30/2012) DRAFT 2 18
CO2e emissions, respectively. The industrial sector consists of large stationary sources of greenhouse gas emissions and the percentage of the total 2020 emissions is projected to be 17 percent of total CO2e emissions. The remaining sources of greenhouse gas emissions in 2020 are high global warm-ing potential gases at 8 percent, residential and commercial activities at 8 percent, agriculture at 5 percent, and recycling and waste at 1 percent.32 4. San Francisco Bay Area Emissions
The BAAQMD established a climate protection program in 2005 to acknowledge the link between climate change and air quality. The BAAQMD regularly prepares inventories of criteria and toxic air pollutants to support planning, regulatory and other programs. The most recent emissions inventory estimates greenhouse gas emissions produced in the San Francisco Bay Area in 2007.33 The inven-tory, which was published February 2010, updates the BAAQMD’s previous greenhouse gas emission inventory for base year 2002. According to the BAAQMD, in 2007, 95.8 million metric tons of CO2e of greenhouse gases were emitted by the nine-county San Francisco Bay Area. The transportation sector, including on-road motor vehicles, locomotives, ships and boats, and aircraft, and the industrial/commercial sector (excluding electricity and agriculture) are the largest sources of greenhouse gas emissions, each contributing about 36 percent of the region’s total CO2e emissions in the Bay Area. Energy produc-tion activities such as electricity generation and co-generation were the third largest contributor with 16 percent of the total greenhouse gas emissions. Off-road equipment such as construction, industrial, commercial, and lawn and garden equipment contributed 3 percent of greenhouse gas emissions. The contribution from residential fuel usage, primarily from space heating, cooking and water heating, contributed 7 percent of the total greenhouse gas emissions. Agriculture and farming activities was the smallest sector with 1 percent of the total greenhouse gas emissions in the Bay Area. 5. City of Larkspur Emissions
The City of Larkspur recognizes that local governments play a strong role in reducing greenhouse gas emissions and mitigating the potential impacts of climate change. In June of 2010, the City of Lark-spur approved a Climate Action Plan to develop strategies that the City’s government operations and the community can take to reduce its greenhouse gas emissions and mitigate, to the extent feasible at the local level, the potential impacts of climate change. Through actions outlined in the Plan, such as increasing energy efficiency of buildings, encouraging less dependence on the automobile, and using clean, renewable energy sources, the community can experience lower energy bills, improved air quality, reduced emissions, and an enhanced quality of life.34 The Climate Action Plan also proposed an emissions reduction target. In July, 2010, the City of Larkspur established a Greenhouse Gas Emissions Reduction Target of 15 percent below 2005 levels by 2020, which is consistent with the State’s direction to local governments in the AB 32 Scoping Plan. The first step toward reducing greenhouse gas emissions is to identify sources of emissions and
32 California Air Resources Board, 2012. California Greenhouse Gas Emission Inventory. Website:
www.climatechange.ca.gov/inventory/index.html (accessed June 2012). September 33 Bay Area Air Quality Management District, 2010. Source Inventory of Bay Area Greenhouse Gas Emissions.
February. 34 Larkspur, City of, 2010, op. cit.
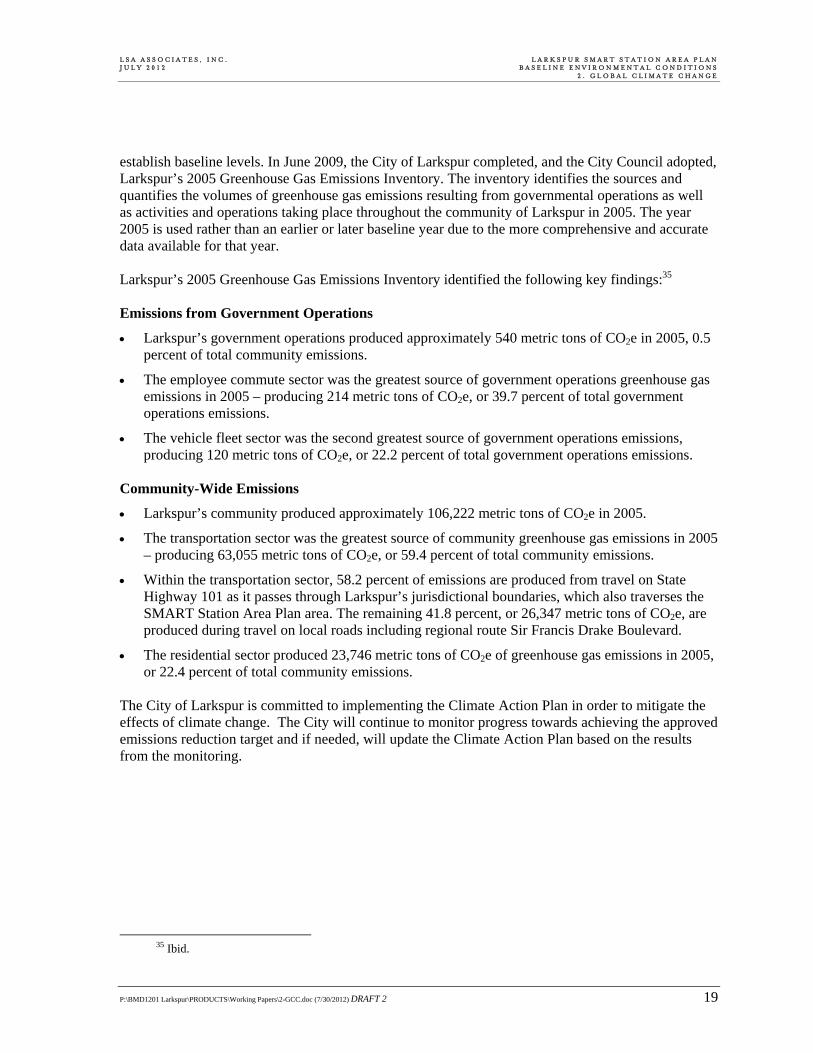
L S A A S S O C I A T E S , I N C . L A R K S P U R S M A R T S T A T I O N A R E A P L A N J U L Y 2 0 1 2 B A S E L I N E E N V I R O N M E N T A L C O N D I T I O N S 2 . G L O B A L C L I M A T E C H A N G E
P:\BMD1201 Larkspur\PRODUCTS\Working Papers\2-GCC.doc (7/30/2012) DRAFT 2 19
establish baseline levels. In June 2009, the City of Larkspur completed, and the City Council adopted, Larkspur’s 2005 Greenhouse Gas Emissions Inventory. The inventory identifies the sources and quantifies the volumes of greenhouse gas emissions resulting from governmental operations as well as activities and operations taking place throughout the community of Larkspur in 2005. The year 2005 is used rather than an earlier or later baseline year due to the more comprehensive and accurate data available for that year. Larkspur’s 2005 Greenhouse Gas Emissions Inventory identified the following key findings:35 Emissions from Government Operations
Larkspur’s government operations produced approximately 540 metric tons of CO2e in 2005, 0.5 percent of total community emissions.
The employee commute sector was the greatest source of government operations greenhouse gas emissions in 2005 – producing 214 metric tons of CO2e, or 39.7 percent of total government operations emissions.
The vehicle fleet sector was the second greatest source of government operations emissions, producing 120 metric tons of CO2e, or 22.2 percent of total government operations emissions.
Community-Wide Emissions
Larkspur’s community produced approximately 106,222 metric tons of CO2e in 2005.
The transportation sector was the greatest source of community greenhouse gas emissions in 2005 – producing 63,055 metric tons of CO2e, or 59.4 percent of total community emissions.
Within the transportation sector, 58.2 percent of emissions are produced from travel on State Highway 101 as it passes through Larkspur’s jurisdictional boundaries, which also traverses the SMART Station Area Plan area. The remaining 41.8 percent, or 26,347 metric tons of CO2e, are produced during travel on local roads including regional route Sir Francis Drake Boulevard.
The residential sector produced 23,746 metric tons of CO2e of greenhouse gas emissions in 2005, or 22.4 percent of total community emissions.
The City of Larkspur is committed to implementing the Climate Action Plan in order to mitigate the effects of climate change. The City will continue to monitor progress towards achieving the approved emissions reduction target and if needed, will update the Climate Action Plan based on the results from the monitoring.
35 Ibid.

L S A A S S O C I A T E S , I N C . L A R K S P U R S M A R T S T A T I O N A R E A P L A N J U L Y 2 0 1 2 B A S E L I N E E N V I R O N M E N T A L C O N D I T I O N S 2 . G L O B A L C L I M A T E C H A N G E
P:\BMD1201 Larkspur\PRODUCTS\Working Papers\2-GCC.doc (7/30/2012) DRAFT 2 20
This page intentionally left blank.
P:\BMD1201 Larkspur\PRODUCTS\Working Papers\3-Noise.doc (7/30/2012) DRAFT 2 1
3. NOISE
The following discussion describes the general characteristics of sound and the categories of audible noise. The noise-related regulatory framework at the City, County, State and federal levels is also described. Lastly, potential sources of noise are summarized. Additional information on traffic related noise conditions within and around the vicinity of the Larkspur SMART Station Area Plan (Plan) area will be provided upon completion of the related traffic study. A. CHARACTERISTICS OF SOUND
Noise is generally defined as unwanted sound. Noise consists of any sound that may produce physio-logical or psychological damage and/or interfere with communication, work, rest, recreation, and sleep. To the human ear, sound has two significant characteristics: pitch and loudness. Pitch is the number of complete vibrations or cycles per second of a wave that results in the range of tone from high to low. Loudness is the strength of a sound that describes a noisy or quiet environment, and it is measured by the amplitude of the sound wave. Loudness is determined by the intensity of the sound waves combined with the reception characteristics of the human ear. Sound intensity refers to how hard the sound wave strikes an object, which in turn produces the sound’s effect. This characteristic of sound can be precisely measured with instruments. 1. Measurement of Sound
Sound is characterized by various parameters that describe the rate of oscillation (frequency) of sound waves, the distance between successive troughs or crests in the wave, the speed that it travels, and the pressure level or energy content of a given sound. The sound pressure level has become the most common descriptor used to characterize the loudness (or amplitude) of an ambient sound, and the decibel (dB) scale is used to quantify sound intensity. A decibel (dB) is a unit of measurement which indicates the relative intensity of a sound. The 0 point on the dB scale is based on the lowest sound level that the healthy, unimpaired human ear can detect. Changes of 3 dB or less are only perceptible in laboratory environments. Audible increases in noise levels generally refer to a change of 3 dB or more, as this level has been found to be barely perceptible to the human ear in outdoor environments. Because sound can vary in intensity by over one million times within the range of human hearing, a logarithmic loudness scale1 is used to keep sound intensity numbers at a convenient and manageable level. Thus, a 10 dBA increase in the level of a continuous noise represents a perceived doubling of loudness, while a 20 dBA increase is 100 times more intense, and a 30 dBA increase is 1,000 times more intense. As noise spreads from a source, it loses energy so that the farther away the noise
1 Unlike linear units such as inches or pounds, decibels are measured on a logarithmic scale, representing points on a
sharply rising curve. The logarithmic decibel scale allows an extremely wide range of acoustic energy to be characterized in a manageable notation.
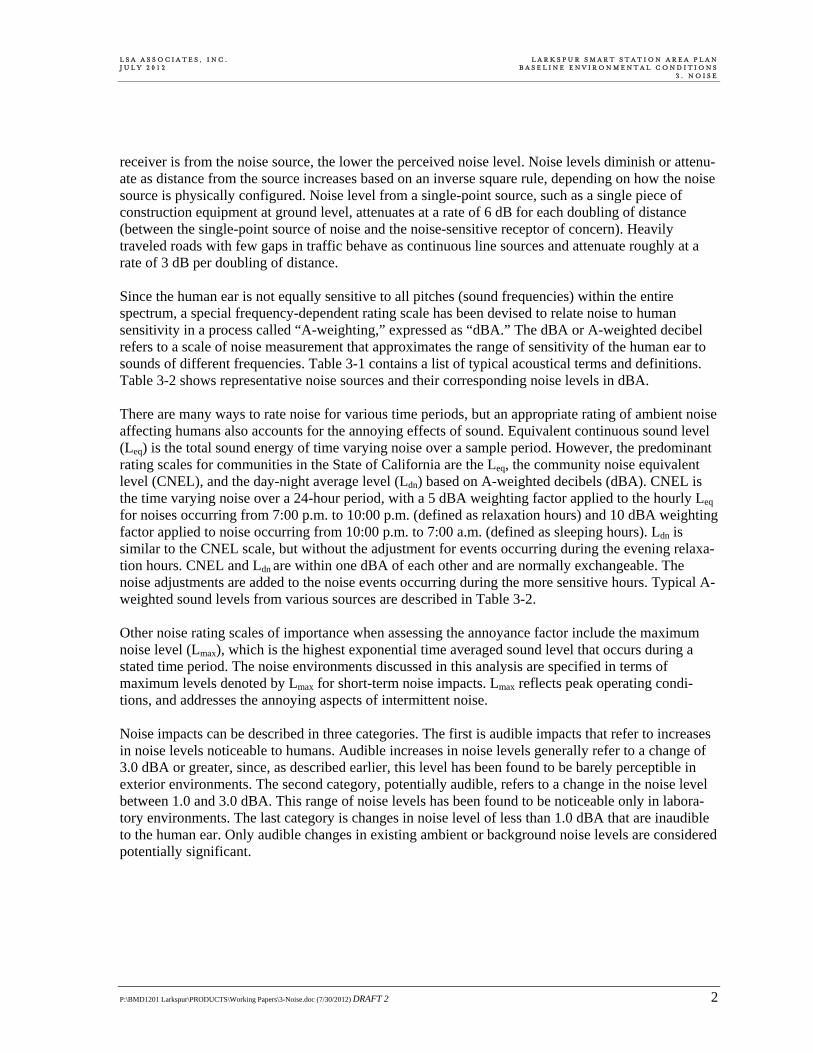
L S A A S S O C I A T E S , I N C . L A R K S P U R S M A R T S T A T I O N A R E A P L A N J U L Y 2 0 1 2 B A S E L I N E E N V I R O N M E N T A L C O N D I T I O N S 3 . N O I S E
P:\BMD1201 Larkspur\PRODUCTS\Working Papers\3-Noise.doc (7/30/2012) DRAFT 2 2
receiver is from the noise source, the lower the perceived noise level. Noise levels diminish or attenu-ate as distance from the source increases based on an inverse square rule, depending on how the noise source is physically configured. Noise level from a single-point source, such as a single piece of construction equipment at ground level, attenuates at a rate of 6 dB for each doubling of distance (between the single-point source of noise and the noise-sensitive receptor of concern). Heavily traveled roads with few gaps in traffic behave as continuous line sources and attenuate roughly at a rate of 3 dB per doubling of distance. Since the human ear is not equally sensitive to all pitches (sound frequencies) within the entire spectrum, a special frequency-dependent rating scale has been devised to relate noise to human sensitivity in a process called “A-weighting,” expressed as “dBA.” The dBA or A-weighted decibel refers to a scale of noise measurement that approximates the range of sensitivity of the human ear to sounds of different frequencies. Table 3-1 contains a list of typical acoustical terms and definitions. Table 3-2 shows representative noise sources and their corresponding noise levels in dBA. There are many ways to rate noise for various time periods, but an appropriate rating of ambient noise affecting humans also accounts for the annoying effects of sound. Equivalent continuous sound level (Leq) is the total sound energy of time varying noise over a sample period. However, the predominant rating scales for communities in the State of California are the Leq, the community noise equivalent level (CNEL), and the day-night average level (Ldn) based on A-weighted decibels (dBA). CNEL is the time varying noise over a 24-hour period, with a 5 dBA weighting factor applied to the hourly Leq for noises occurring from 7:00 p.m. to 10:00 p.m. (defined as relaxation hours) and 10 dBA weighting factor applied to noise occurring from 10:00 p.m. to 7:00 a.m. (defined as sleeping hours). Ldn is similar to the CNEL scale, but without the adjustment for events occurring during the evening relaxa-tion hours. CNEL and Ldn are within one dBA of each other and are normally exchangeable. The noise adjustments are added to the noise events occurring during the more sensitive hours. Typical A-weighted sound levels from various sources are described in Table 3-2. Other noise rating scales of importance when assessing the annoyance factor include the maximum noise level (Lmax), which is the highest exponential time averaged sound level that occurs during a stated time period. The noise environments discussed in this analysis are specified in terms of maximum levels denoted by Lmax for short-term noise impacts. Lmax reflects peak operating condi-tions, and addresses the annoying aspects of intermittent noise. Noise impacts can be described in three categories. The first is audible impacts that refer to increases in noise levels noticeable to humans. Audible increases in noise levels generally refer to a change of 3.0 dBA or greater, since, as described earlier, this level has been found to be barely perceptible in exterior environments. The second category, potentially audible, refers to a change in the noise level between 1.0 and 3.0 dBA. This range of noise levels has been found to be noticeable only in labora-tory environments. The last category is changes in noise level of less than 1.0 dBA that are inaudible to the human ear. Only audible changes in existing ambient or background noise levels are considered potentially significant.
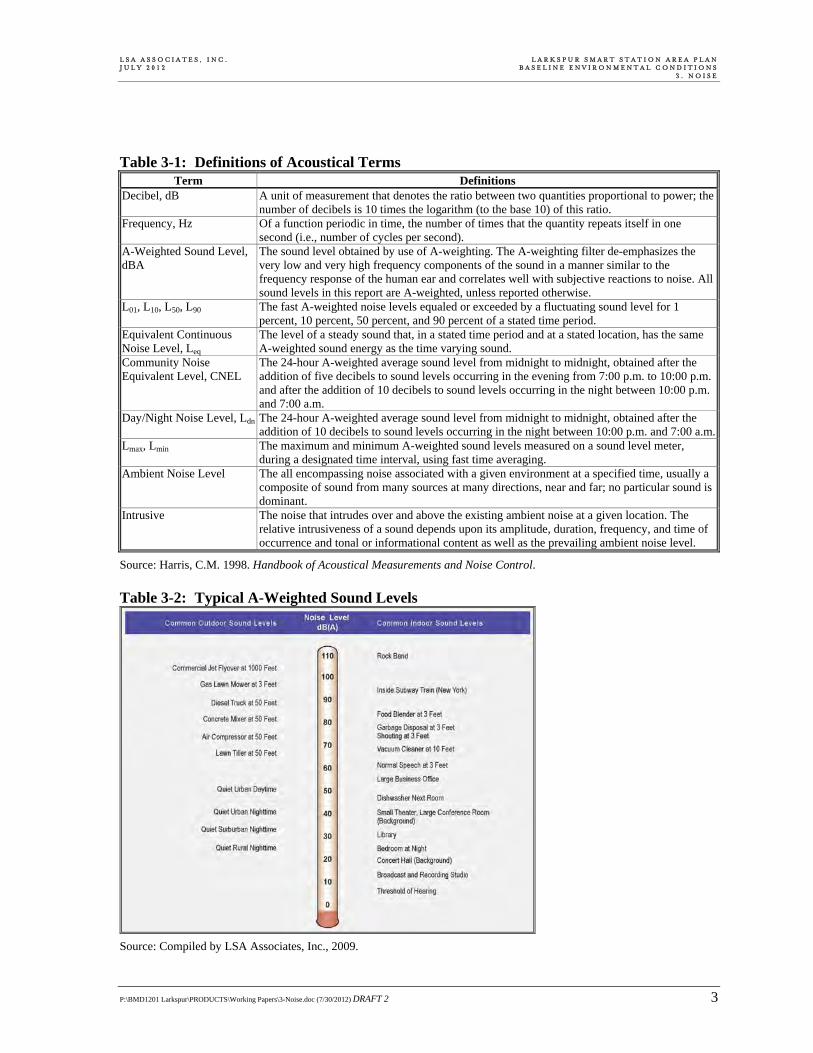
L S A A S S O C I A T E S , I N C . L A R K S P U R S M A R T S T A T I O N A R E A P L A N J U L Y 2 0 1 2 B A S E L I N E E N V I R O N M E N T A L C O N D I T I O N S 3 . N O I S E
P:\BMD1201 Larkspur\PRODUCTS\Working Papers\3-Noise.doc (7/30/2012) DRAFT 2 3
Table 3-1: Definitions of Acoustical Terms Term Definitions
Decibel, dB A unit of measurement that denotes the ratio between two quantities proportional to power; the number of decibels is 10 times the logarithm (to the base 10) of this ratio.
Frequency, Hz Of a function periodic in time, the number of times that the quantity repeats itself in one second (i.e., number of cycles per second).
A-Weighted Sound Level, dBA
The sound level obtained by use of A-weighting. The A-weighting filter de-emphasizes the very low and very high frequency components of the sound in a manner similar to the frequency response of the human ear and correlates well with subjective reactions to noise. All sound levels in this report are A-weighted, unless reported otherwise.
L01, L10, L50, L90 The fast A-weighted noise levels equaled or exceeded by a fluctuating sound level for 1 percent, 10 percent, 50 percent, and 90 percent of a stated time period.
Equivalent Continuous Noise Level, Leq
The level of a steady sound that, in a stated time period and at a stated location, has the same A-weighted sound energy as the time varying sound.
Community Noise Equivalent Level, CNEL
The 24-hour A-weighted average sound level from midnight to midnight, obtained after the addition of five decibels to sound levels occurring in the evening from 7:00 p.m. to 10:00 p.m. and after the addition of 10 decibels to sound levels occurring in the night between 10:00 p.m. and 7:00 a.m.
Day/Night Noise Level, Ldn The 24-hour A-weighted average sound level from midnight to midnight, obtained after the addition of 10 decibels to sound levels occurring in the night between 10:00 p.m. and 7:00 a.m.
Lmax, Lmin The maximum and minimum A-weighted sound levels measured on a sound level meter, during a designated time interval, using fast time averaging.
Ambient Noise Level The all encompassing noise associated with a given environment at a specified time, usually a composite of sound from many sources at many directions, near and far; no particular sound is dominant.
Intrusive The noise that intrudes over and above the existing ambient noise at a given location. The relative intrusiveness of a sound depends upon its amplitude, duration, frequency, and time of occurrence and tonal or informational content as well as the prevailing ambient noise level.
Source: Harris, C.M. 1998. Handbook of Acoustical Measurements and Noise Control. Table 3-2: Typical A-Weighted Sound Levels
Source: Compiled by LSA Associates, Inc., 2009.
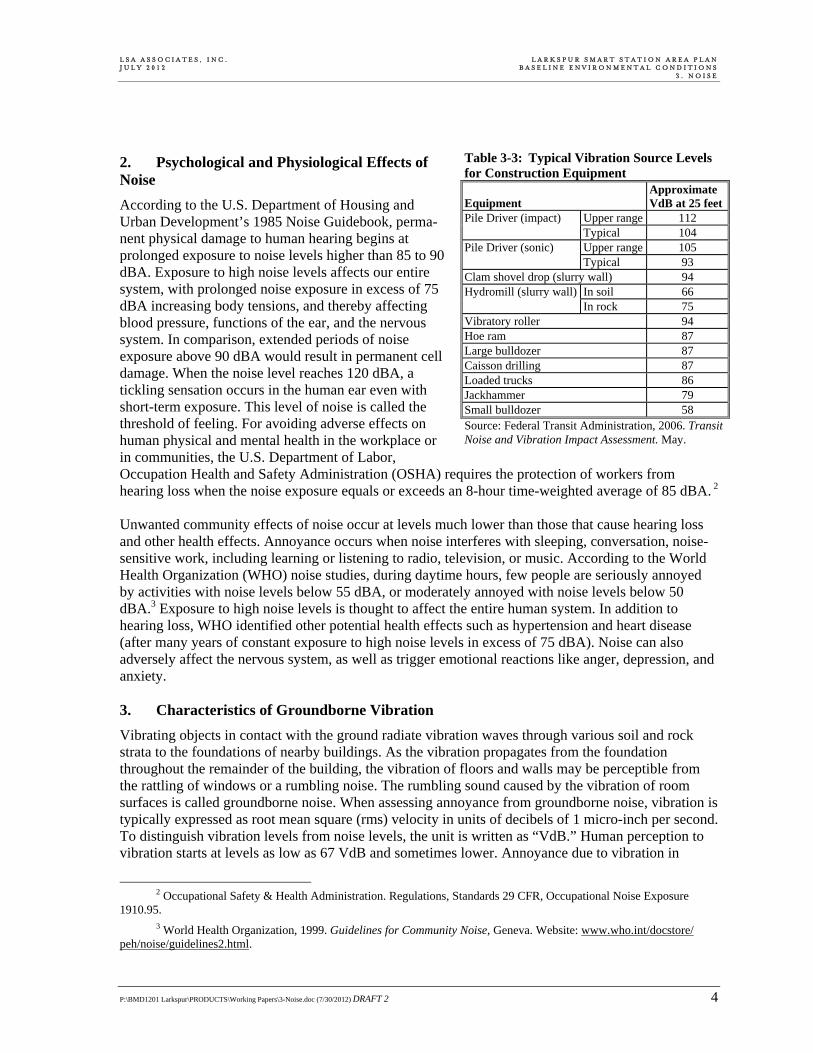
L S A A S S O C I A T E S , I N C . L A R K S P U R S M A R T S T A T I O N A R E A P L A N J U L Y 2 0 1 2 B A S E L I N E E N V I R O N M E N T A L C O N D I T I O N S 3 . N O I S E
P:\BMD1201 Larkspur\PRODUCTS\Working Papers\3-Noise.doc (7/30/2012) DRAFT 2 4
2. Psychological and Physiological Effects of Noise
According to the U.S. Department of Housing and Urban Development’s 1985 Noise Guidebook, perma-nent physical damage to human hearing begins at prolonged exposure to noise levels higher than 85 to 90 dBA. Exposure to high noise levels affects our entire system, with prolonged noise exposure in excess of 75 dBA increasing body tensions, and thereby affecting blood pressure, functions of the ear, and the nervous system. In comparison, extended periods of noise exposure above 90 dBA would result in permanent cell damage. When the noise level reaches 120 dBA, a tickling sensation occurs in the human ear even with short-term exposure. This level of noise is called the threshold of feeling. For avoiding adverse effects on human physical and mental health in the workplace or in communities, the U.S. Department of Labor, Occupation Health and Safety Administration (OSHA) requires the protection of workers from hearing loss when the noise exposure equals or exceeds an 8-hour time-weighted average of 85 dBA. 2 Unwanted community effects of noise occur at levels much lower than those that cause hearing loss and other health effects. Annoyance occurs when noise interferes with sleeping, conversation, noise-sensitive work, including learning or listening to radio, television, or music. According to the World Health Organization (WHO) noise studies, during daytime hours, few people are seriously annoyed by activities with noise levels below 55 dBA, or moderately annoyed with noise levels below 50 dBA.3 Exposure to high noise levels is thought to affect the entire human system. In addition to hearing loss, WHO identified other potential health effects such as hypertension and heart disease (after many years of constant exposure to high noise levels in excess of 75 dBA). Noise can also adversely affect the nervous system, as well as trigger emotional reactions like anger, depression, and anxiety. 3. Characteristics of Groundborne Vibration
Vibrating objects in contact with the ground radiate vibration waves through various soil and rock strata to the foundations of nearby buildings. As the vibration propagates from the foundation throughout the remainder of the building, the vibration of floors and walls may be perceptible from the rattling of windows or a rumbling noise. The rumbling sound caused by the vibration of room surfaces is called groundborne noise. When assessing annoyance from groundborne noise, vibration is typically expressed as root mean square (rms) velocity in units of decibels of 1 micro-inch per second. To distinguish vibration levels from noise levels, the unit is written as “VdB.” Human perception to vibration starts at levels as low as 67 VdB and sometimes lower. Annoyance due to vibration in
2 Occupational Safety & Health Administration. Regulations, Standards 29 CFR, Occupational Noise Exposure
1910.95. 3 World Health Organization, 1999. Guidelines for Community Noise, Geneva. Website: www.who.int/docstore/
peh/noise/guidelines2.html.
Table 3-3: Typical Vibration Source Levels for Construction Equipment
Equipment Approximate VdB at 25 feet
Upper range 112 Pile Driver (impact) Typical 104 Upper range 105 Pile Driver (sonic) Typical 93
Clam shovel drop (slurry wall) 94 In soil 66 Hydromill (slurry wall) In rock 75
Vibratory roller 94 Hoe ram 87 Large bulldozer 87 Caisson drilling 87 Loaded trucks 86 Jackhammer 79 Small bulldozer 58 Source: Federal Transit Administration, 2006. Transit Noise and Vibration Impact Assessment. May.
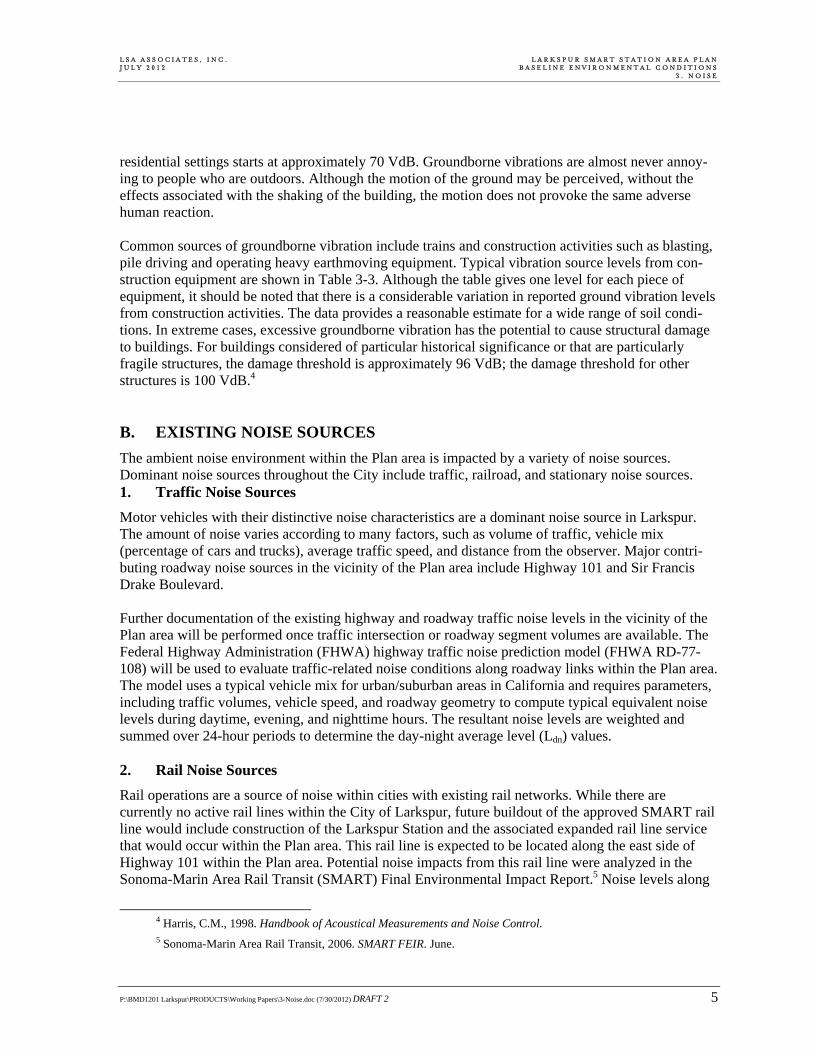
L S A A S S O C I A T E S , I N C . L A R K S P U R S M A R T S T A T I O N A R E A P L A N J U L Y 2 0 1 2 B A S E L I N E E N V I R O N M E N T A L C O N D I T I O N S 3 . N O I S E
P:\BMD1201 Larkspur\PRODUCTS\Working Papers\3-Noise.doc (7/30/2012) DRAFT 2 5
residential settings starts at approximately 70 VdB. Groundborne vibrations are almost never annoy-ing to people who are outdoors. Although the motion of the ground may be perceived, without the effects associated with the shaking of the building, the motion does not provoke the same adverse human reaction. Common sources of groundborne vibration include trains and construction activities such as blasting, pile driving and operating heavy earthmoving equipment. Typical vibration source levels from con-struction equipment are shown in Table 3-3. Although the table gives one level for each piece of equipment, it should be noted that there is a considerable variation in reported ground vibration levels from construction activities. The data provides a reasonable estimate for a wide range of soil condi-tions. In extreme cases, excessive groundborne vibration has the potential to cause structural damage to buildings. For buildings considered of particular historical significance or that are particularly fragile structures, the damage threshold is approximately 96 VdB; the damage threshold for other structures is 100 VdB.4 B. EXISTING NOISE SOURCES
The ambient noise environment within the Plan area is impacted by a variety of noise sources. Dominant noise sources throughout the City include traffic, railroad, and stationary noise sources. 1. Traffic Noise Sources
Motor vehicles with their distinctive noise characteristics are a dominant noise source in Larkspur. The amount of noise varies according to many factors, such as volume of traffic, vehicle mix (percentage of cars and trucks), average traffic speed, and distance from the observer. Major contri-buting roadway noise sources in the vicinity of the Plan area include Highway 101 and Sir Francis Drake Boulevard. Further documentation of the existing highway and roadway traffic noise levels in the vicinity of the Plan area will be performed once traffic intersection or roadway segment volumes are available. The Federal Highway Administration (FHWA) highway traffic noise prediction model (FHWA RD-77-108) will be used to evaluate traffic-related noise conditions along roadway links within the Plan area. The model uses a typical vehicle mix for urban/suburban areas in California and requires parameters, including traffic volumes, vehicle speed, and roadway geometry to compute typical equivalent noise levels during daytime, evening, and nighttime hours. The resultant noise levels are weighted and summed over 24-hour periods to determine the day-night average level (Ldn) values. 2. Rail Noise Sources
Rail operations are a source of noise within cities with existing rail networks. While there are currently no active rail lines within the City of Larkspur, future buildout of the approved SMART rail line would include construction of the Larkspur Station and the associated expanded rail line service that would occur within the Plan area. This rail line is expected to be located along the east side of Highway 101 within the Plan area. Potential noise impacts from this rail line were analyzed in the Sonoma-Marin Area Rail Transit (SMART) Final Environmental Impact Report.5 Noise levels along
4 Harris, C.M., 1998. Handbook of Acoustical Measurements and Noise Control. 5 Sonoma-Marin Area Rail Transit, 2006. SMART FEIR. June.
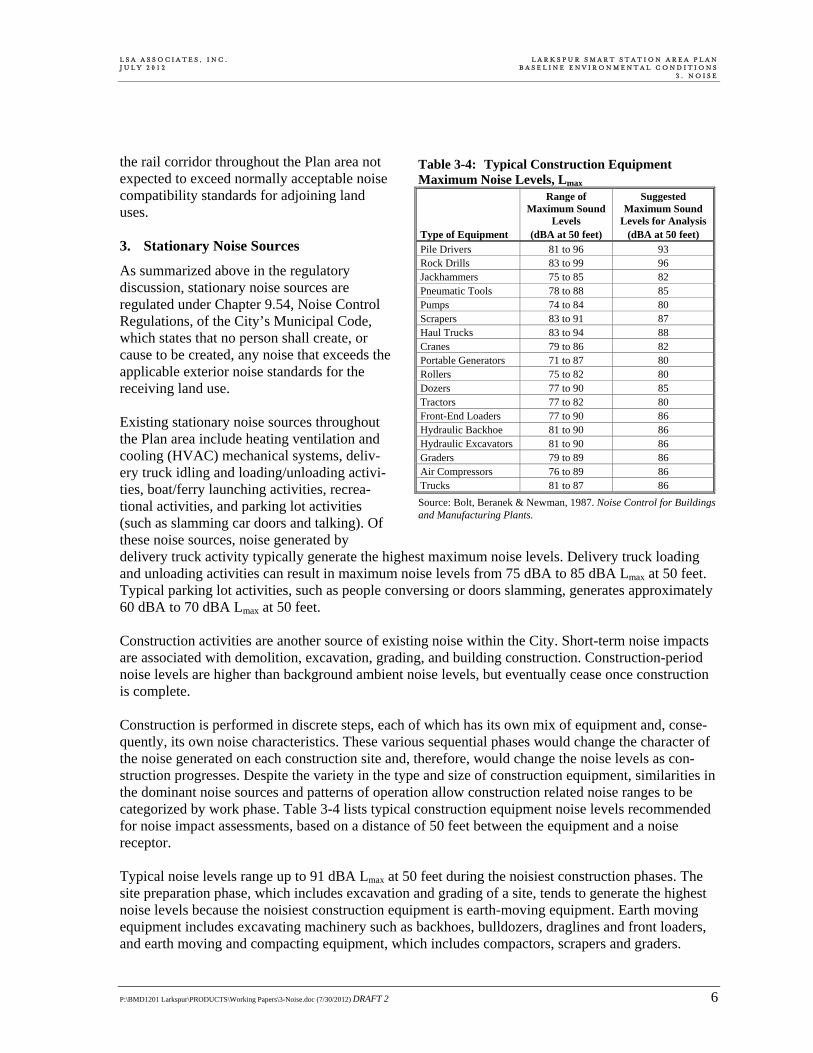
L S A A S S O C I A T E S , I N C . L A R K S P U R S M A R T S T A T I O N A R E A P L A N J U L Y 2 0 1 2 B A S E L I N E E N V I R O N M E N T A L C O N D I T I O N S 3 . N O I S E
P:\BMD1201 Larkspur\PRODUCTS\Working Papers\3-Noise.doc (7/30/2012) DRAFT 2 6
the rail corridor throughout the Plan area not expected to exceed normally acceptable noise compatibility standards for adjoining land uses. 3. Stationary Noise Sources
As summarized above in the regulatory discussion, stationary noise sources are regulated under Chapter 9.54, Noise Control Regulations, of the City’s Municipal Code, which states that no person shall create, or cause to be created, any noise that exceeds the applicable exterior noise standards for the receiving land use. Existing stationary noise sources throughout the Plan area include heating ventilation and cooling (HVAC) mechanical systems, deliv-ery truck idling and loading/unloading activi-ties, boat/ferry launching activities, recrea-tional activities, and parking lot activities (such as slamming car doors and talking). Of these noise sources, noise generated by delivery truck activity typically generate the highest maximum noise levels. Delivery truck loading and unloading activities can result in maximum noise levels from 75 dBA to 85 dBA Lmax at 50 feet. Typical parking lot activities, such as people conversing or doors slamming, generates approximately 60 dBA to 70 dBA Lmax at 50 feet. Construction activities are another source of existing noise within the City. Short-term noise impacts are associated with demolition, excavation, grading, and building construction. Construction-period noise levels are higher than background ambient noise levels, but eventually cease once construction is complete. Construction is performed in discrete steps, each of which has its own mix of equipment and, conse-quently, its own noise characteristics. These various sequential phases would change the character of the noise generated on each construction site and, therefore, would change the noise levels as con-struction progresses. Despite the variety in the type and size of construction equipment, similarities in the dominant noise sources and patterns of operation allow construction related noise ranges to be categorized by work phase. Table 3-4 lists typical construction equipment noise levels recommended for noise impact assessments, based on a distance of 50 feet between the equipment and a noise receptor. Typical noise levels range up to 91 dBA Lmax at 50 feet during the noisiest construction phases. The site preparation phase, which includes excavation and grading of a site, tends to generate the highest noise levels because the noisiest construction equipment is earth-moving equipment. Earth moving equipment includes excavating machinery such as backhoes, bulldozers, draglines and front loaders, and earth moving and compacting equipment, which includes compactors, scrapers and graders.
Table 3-4: Typical Construction Equipment Maximum Noise Levels, Lmax
Type of Equipment
Range of Maximum Sound
Levels (dBA at 50 feet)
Suggested Maximum Sound
Levels for Analysis (dBA at 50 feet)
Pile Drivers 81 to 96 93 Rock Drills 83 to 99 96 Jackhammers 75 to 85 82 Pneumatic Tools 78 to 88 85 Pumps 74 to 84 80 Scrapers 83 to 91 87 Haul Trucks 83 to 94 88 Cranes 79 to 86 82 Portable Generators 71 to 87 80 Rollers 75 to 82 80 Dozers 77 to 90 85 Tractors 77 to 82 80 Front-End Loaders 77 to 90 86 Hydraulic Backhoe 81 to 90 86 Hydraulic Excavators 81 to 90 86 Graders 79 to 89 86 Air Compressors 76 to 89 86 Trucks 81 to 87 86
Source: Bolt, Beranek & Newman, 1987. Noise Control for Buildings and Manufacturing Plants.
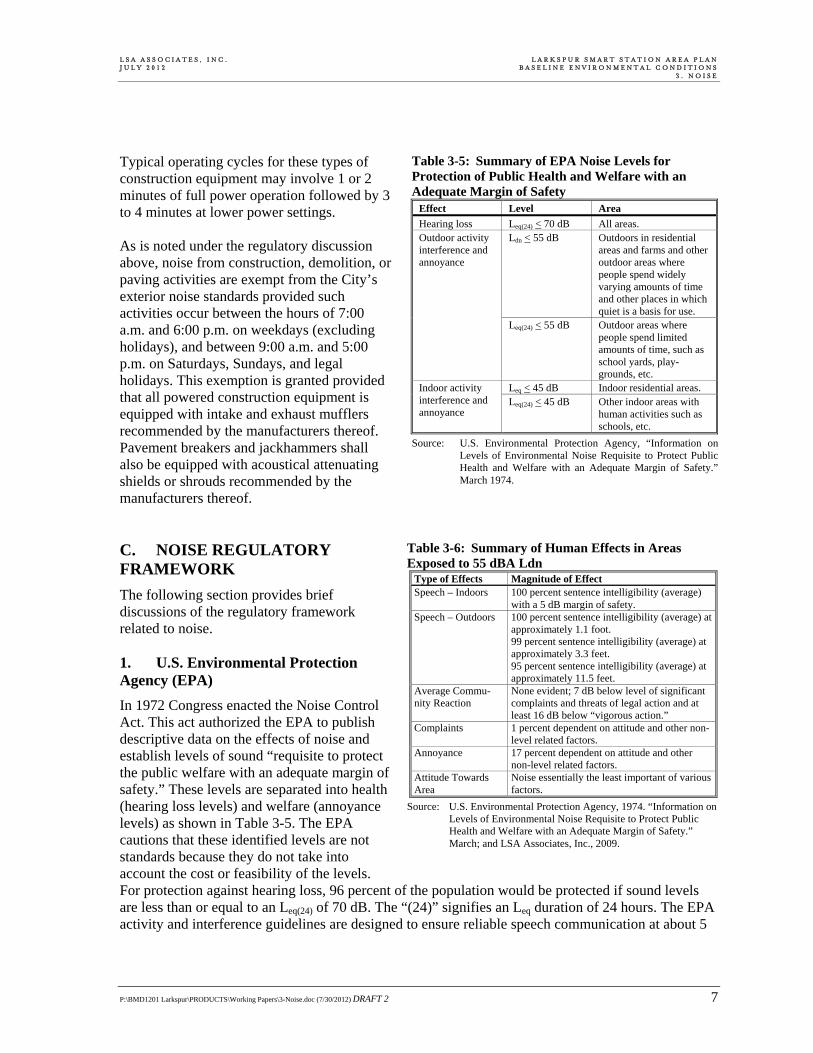
L S A A S S O C I A T E S , I N C . L A R K S P U R S M A R T S T A T I O N A R E A P L A N J U L Y 2 0 1 2 B A S E L I N E E N V I R O N M E N T A L C O N D I T I O N S 3 . N O I S E
P:\BMD1201 Larkspur\PRODUCTS\Working Papers\3-Noise.doc (7/30/2012) DRAFT 2 7
Typical operating cycles for these types of construction equipment may involve 1 or 2 minutes of full power operation followed by 3 to 4 minutes at lower power settings. As is noted under the regulatory discussion above, noise from construction, demolition, or paving activities are exempt from the City’s exterior noise standards provided such activities occur between the hours of 7:00 a.m. and 6:00 p.m. on weekdays (excluding holidays), and between 9:00 a.m. and 5:00 p.m. on Saturdays, Sundays, and legal holidays. This exemption is granted provided that all powered construction equipment is equipped with intake and exhaust mufflers recommended by the manufacturers thereof. Pavement breakers and jackhammers shall also be equipped with acoustical attenuating shields or shrouds recommended by the manufacturers thereof. C. NOISE REGULATORY FRAMEWORK
The following section provides brief discussions of the regulatory framework related to noise. 1. U.S. Environmental Protection Agency (EPA)
In 1972 Congress enacted the Noise Control Act. This act authorized the EPA to publish descriptive data on the effects of noise and establish levels of sound “requisite to protect the public welfare with an adequate margin of safety.” These levels are separated into health (hearing loss levels) and welfare (annoyance levels) as shown in Table 3-5. The EPA cautions that these identified levels are not standards because they do not take into account the cost or feasibility of the levels. For protection against hearing loss, 96 percent of the population would be protected if sound levels are less than or equal to an Leq(24) of 70 dB. The “(24)” signifies an Leq duration of 24 hours. The EPA activity and interference guidelines are designed to ensure reliable speech communication at about 5
Table 3-5: Summary of EPA Noise Levels for Protection of Public Health and Welfare with an Adequate Margin of Safety
Effect Level Area
Hearing loss Leq(24) < 70 dB All areas. Outdoor activity interference and annoyance
Ldn < 55 dB Outdoors in residential areas and farms and other outdoor areas where people spend widely varying amounts of time and other places in which quiet is a basis for use.
Leq(24) < 55 dB Outdoor areas where people spend limited amounts of time, such as school yards, play-grounds, etc.
Leq < 45 dB Indoor residential areas. Indoor activity interference and annoyance
Leq(24) < 45 dB Other indoor areas with human activities such as schools, etc.
Source: U.S. Environmental Protection Agency, “Information on Levels of Environmental Noise Requisite to Protect Public Health and Welfare with an Adequate Margin of Safety.” March 1974.
Table 3-6: Summary of Human Effects in Areas Exposed to 55 dBA Ldn
Type of Effects Magnitude of Effect Speech – Indoors 100 percent sentence intelligibility (average)
with a 5 dB margin of safety. Speech – Outdoors 100 percent sentence intelligibility (average) at
approximately 1.1 foot. 99 percent sentence intelligibility (average) at approximately 3.3 feet. 95 percent sentence intelligibility (average) at approximately 11.5 feet.
Average Commu-nity Reaction
None evident; 7 dB below level of significant complaints and threats of legal action and at least 16 dB below “vigorous action.”
Complaints 1 percent dependent on attitude and other non-level related factors.
Annoyance 17 percent dependent on attitude and other non-level related factors.
Attitude Towards Area
Noise essentially the least important of various factors.
Source: U.S. Environmental Protection Agency, 1974. “Information on Levels of Environmental Noise Requisite to Protect Public Health and Welfare with an Adequate Margin of Safety.” March; and LSA Associates, Inc., 2009.
L S A A S S O C I A T E S , I N C . L A R K S P U R S M A R T S T A T I O N A R E A P L A N J U L Y 2 0 1 2 B A S E L I N E E N V I R O N M E N T A L C O N D I T I O N S 3 . N O I S E
P:\BMD1201 Larkspur\PRODUCTS\Working Papers\3-Noise.doc (7/30/2012) DRAFT 2 8
feet in the outdoor environment. For outdoor and indoor environments, interference with activity and annoyance should not occur if levels are below 55 dBA and 45 dBA, respectively.
The noise effects associated with an outdoor Ldn of 55 dB are summarized in Table 3-6. At 55 dB Ldn, 95 percent sentence clarity (intelligibility) may be expected at 3.5 meters, and no community reaction. However, 1 percent of the population may complain about noise at this level and 17 percent may indicate annoyance. 2. State of California
The State of California has established regulations that help prevent adverse impacts to occupants of buildings located near noise sources. Referred to as the “State Noise Insulation Standard,” it requires buildings to meet performance standards through design and/or building materials that would offset any noise source in the vicinity of the receptor. State construction regulations include requirements that are intended to limit the extent of noise transmitted into habitable spaces of new hotels, motels, apartment houses, and dwellings other than detached single-family dwellings. These requirements are found in the California Code of Regulations, Title 24 (known as the Building Standards Administra-tive Code), Part 2 (known as the California Building Code), Appendix Chapters 12 and 12A. For limiting noise transmitted between adjacent dwelling units, the noise insulation standards specify the extent to which walls, doors, and floor ceiling assemblies must block or absorb sound. For limiting noise from exterior noise sources, the noise insulation standards set an interior standard of 45 dBA Ldn in any habitable room with all doors and windows closed. In addition, the standards require preparation of an acoustical analysis demonstrating the manner in which dwelling units have been designed to meet this interior standard, where such units are proposed in an area with exterior noise levels greater than 60 dBA Ldn.
The State has also established land use compatibility guidelines for determining acceptable noise lev-els for specified land uses.6 The City has adopted and modified the State’s land use compatibility guidelines as shown in Table 3-7 and discussed below. 3. City of Larkspur Noise Regulations
The City of Larkspur addresses noise in the Health & Safety Chapter of the General Plan7 and in Chapter 9.54 of the Municipal Code.8 The City’s land use compatibility standards for new develop-ment are shown in Table 3-7. The standards show that environments with ambient noise levels of up to 55 dBA Ldn are considered normally acceptable for new residential development. Interior noise levels should be maintained so as to not exceed 45 dBA Ldn for new residential development. Project specific acoustical studies are required for all new development projects that would be exposed to noise levels in excess of the established normally acceptable noise standards for the indicated land use. The City has established exterior noise limits in the Noise Ordinance of the Municipal Code. These standards restrict persons from creating, or causing to be created, noise that exceeds 50 dBA between
6 State of California, Governor’s Office of Planning and Research, General Plan Guidelines, 1998 (Appendix A,
Figure 2). 7 Larkspur, City of, 1990. City of Larkspur, California General Plan. Chapter 7. 8 Larkspur, City of, 2012. Larkspur Municipal Code, Chapter 9.54. May 2.
L S A A S S O C I A T E S , I N C . L A R K S P U R S M A R T S T A T I O N A R E A P L A N J U L Y 2 0 1 2 B A S E L I N E E N V I R O N M E N T A L C O N D I T I O N S 3 . N O I S E
P:\BMD1201 Larkspur\PRODUCTS\Working Papers\3-Noise.doc (7/30/2012) DRAFT 2 9
7:00 a.m. and 10:00 p.m. or exceeding 40 dBA between the hours of 10:00 p.m. and 7:00 a.m. for more than 30 minutes within any hour as measured at any receiving residential land use. In addition, noise levels are not permitted to exceed 60 dBA at any time for more than 30 minutes within any hour as measured at a receiving commercial land use. However, noise from construction, demolition, or paving activities are exempt from these exterior noise standards provided such activities occur between the hours of 7:00 a.m. and 6:00 p.m. on weekdays (excluding holidays), and between 9:00 a.m. and 5:00 p.m. on Saturdays, Sundays, and legal holidays. This exemption is granted provided that all powered construction equipment is equipped with intake and exhaust mufflers recommended by the manufacturers thereof. Pavement breakers and jackhammers shall also be equipped with acoustical attenuating shields or shrouds recommended by the manufacturers thereof.
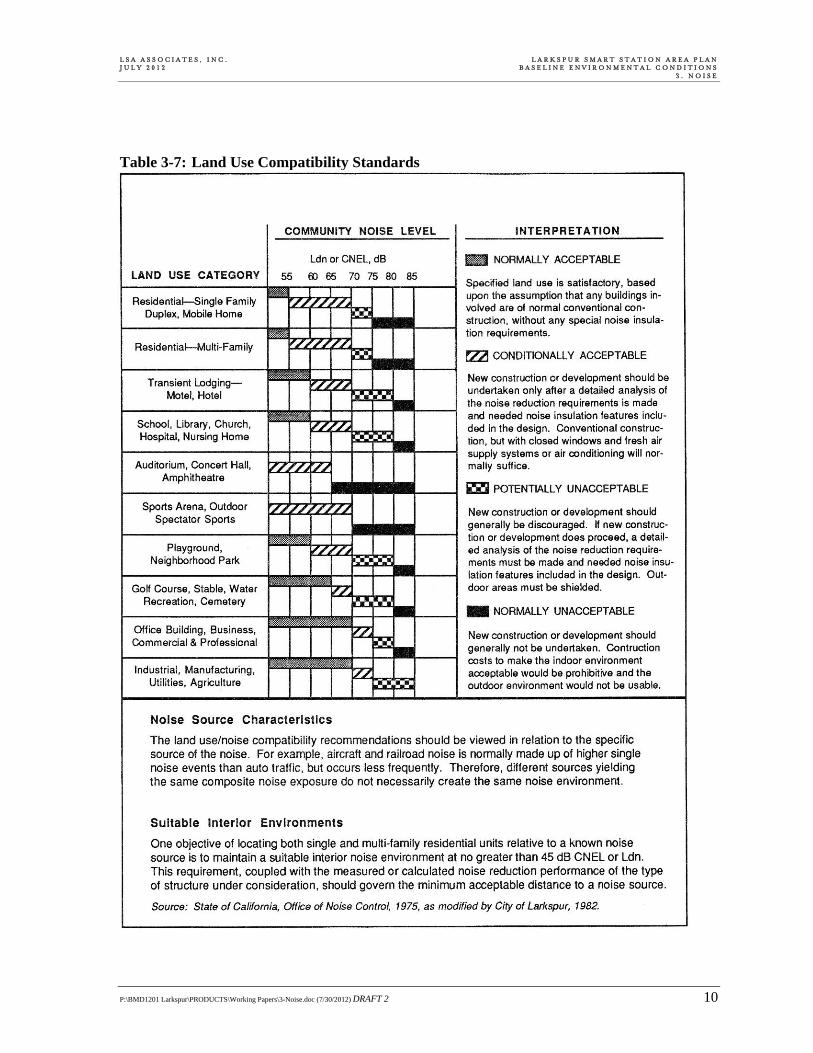
L S A A S S O C I A T E S , I N C . L A R K S P U R S M A R T S T A T I O N A R E A P L A N J U L Y 2 0 1 2 B A S E L I N E E N V I R O N M E N T A L C O N D I T I O N S 3 . N O I S E
P:\BMD1201 Larkspur\PRODUCTS\Working Papers\3-Noise.doc (7/30/2012) DRAFT 2 10
Table 3-7: Land Use Compatibility Standards
P:\BMD1201 Larkspur\PRODUCTS\Working Papers\4-Bio.doc (7/30/2012) DRAFT 2 1
4. BIOLOGICAL RESOURCES
This chapter provides a general description of the biological resources in and around the vicinity of the Larkspur SMART Station Area Plan (Plan) area and contains the following sections: (1) a description of the methods used by LSA to obtain the information contained in this chapter; (2) descriptions of the existing habitat types, wildlife habitat values, special-status species, and sensitive habitats within the Plan area; (3) an overview of the existing federal and State regulations pertaining to biological resources; and (4) a summary of applicable existing Larkspur General Plan policies. A. METHODS
Prior to conducting fieldwork, LSA reviewed previous background reports prepared for the Plan area. Information from these reports was used to gain familiarity with the habitat types present within the Plan area and identify areas of interest for a future site visit. Sources of information on vegetation and habitat types included:
The Transportation Authority of Marin Central Marin Ferry Connection Multi-use Pathway Phase 1 Project, Marin County, California, Initial Study/Mitigated Negative Declaration;1
Transportation Authority of Marin Central Marin Ferry Connection Multi-use Pathway Phase 1 Project, Marin County, California, Natural Resources Study Report;2
The Initial Study for the Monahan Pacific Project;3 and
The 2000 Larkspur Landing Circle Expanded Initial Study.4 Concurrent with this review, LSA developed an aerial photograph base map of the Plan area using aerial imagery and geographic information system (GIS) layers depicting the Plan area boundary provided by the BMS Design Group. Given the relatively large size of the Plan area and its urban setting, LSA determined that a broad level of habitat analysis was appropriate for this report. As such, the habitat types identified in this chapter have been customized for the Plan area and rely on general habitat characteristics and land use patterns rather than plant species composition. Vegetation mapping was performed manually in ArcGIS 10, based on aerial photography provided by Esri and the United States Department of Agriculture.
1 Transportation Authority of Marin, 2010. Central Marin Ferry Connection Multi-use Pathway Phase 1 Project,
Marin County, California, Initial Study/Mitigated Negative Declaration. September. 2 Transportation Authority of Marin, 2010. Central Marin Ferry Connection Multi-use Pathway Phase 1 Project,
Marin County, California, Natural Resources Study Report. April. 3 EDAW, Inc., 1999. Initial Study for the Monahan Pacific Project, City of Larkspur, California. June 4. 4 Turnstone Consulting, 2004. 2000 Larkspur Landing Circle Expanded Initial Study. October 20.
L S A A S S O C I A T E S , I N C . L A R K S P U R S M A R T S T A T I O N A R E A P L A N J U L Y 2 0 1 2 B A S E L I N E E N V I R O N M E N T A L C O N D I T I O N S 4 . B I O L O G I C A L R E S O U R C E S
P:\BMD1201 Larkspur\PRODUCTS\Working Papers\4-Bio.doc (7/30/2012) DRAFT 2 2
LSA collected information on special-status species known to occur or potentially occurring in the Plan area by searching the California Natural Diversity Database5 (CNDDB) and California Native Plant Species (CNPS) Inventory of Rare and Endangered Plants6 for records within the San Rafael U.S. Geological Survey (USGS) 7.5-minute quadrangle. Additional sources of information included The Marin County Breeding Bird Atlas: A Distributional and Natural History of Coastal California Birds,7 and LSA biologists’ personal knowledge of species occurrences in the Larkspur vicinity. For the purposes of this report, special-status species are defined as follows:
Species that are listed, formally proposed, or designated as candidates for listing as threatened or endangered under the federal Endangered Species Act (ESA);
Species that are listed, or designated as candidates for listing, as rare, threatened, or endangered under the California Endangered Species Act (CESA);
Plant species on Lists 1A, 1B and 2 in the CNPS Inventory of Rare and Endangered Plants;
Animal species designated as Species of Special Concern or Fully Protected by the California Department of Fish and Game (CDFG);
Species that meet the definition of rare, threatened, or endangered under Section 15380 of the CEQA guidelines; or
Species considered to be a taxon of special concern by the relevant local agencies. LSA biologist Dan Sidle conducted a reconnaissance-level survey of the Plan area on June 7, 2012. The purpose of this visit was to assess the habitat conditions and the potential for those habitats to support special-status plant and animal species. Although it was not feasible to cover the entire Plan area on foot, representative areas for each habitat type were identified prior to fieldwork and visited during the survey. Basic information on dominant plant species and animal species were collected. Due to the broad level of habitat mapping for the Plan area, most habitat type boundaries were easily identified on the aerial photograph base map prior to fieldwork. No focused rare plant or special-status animal surveys were conducted for the Plan area, nor was a formal jurisdictional delineation of waters of the United States conducted. Plant taxonomy and nomenclature in this chapter follows Baldwin et al.8 Common and scientific names for special-status species or subspecies conform to the CNDDB.9 Common and scientific names for fish, reptiles, amphibians, birds, and mammals conform to Nelson et al,10 Crother,11 the
5 California Department of Fish and Game, 2012. California Natural Diversity Database (commercial version),
Biogeographic Data Branch. April 29. 6 California Native Plant Society, 2012. Inventory of rare and endangered plants in California (online edition, v7-
09a). Website: www.cnps.org/inventory (accessed May 21). 7 Shuford, W.D., 1993. The Marin County Breeding Bird Atlas: A Distributional and Natural History of Coastal
California Birds. California Avifauna Series 1. 8 Baldwin, B.G., et al., eds., 2012. The Jepson Manual: Vascular Plants of California, Second Edition. University of
California Press, Berkeley. 9 California Department of Fish and Game, 2012, op. cit. 10 Nelson, J.S., et al., eds., 2004. A list of common and scientific names of fishes from the United States, Canada, and
Mexico. Sixth edition. American Fisheries Society Special Publication 20.
L S A A S S O C I A T E S , I N C . L A R K S P U R S M A R T S T A T I O N A R E A P L A N J U L Y 2 0 1 2 B A S E L I N E E N V I R O N M E N T A L C O N D I T I O N S 4 . B I O L O G I C A L R E S O U R C E S
P:\BMD1201 Larkspur\PRODUCTS\Working Papers\4-Bio.doc (7/30/2012) DRAFT 2 3
American Ornithologists’ Union (AOU) Check-list of North American Birds,12 and Baker and others,13 respectively. B. BIOLOGICAL RESOURCES WITHIN THE PLAN AREA
The following section provides a description of the Plan area’s habitat types, wildlife habitat values, special-status species, and sensitive habitats. The Plan area comprises approximately 404.94 acres of Marin County and is bounded to the north and west by residential, commercial, and industrial development; to the south by urban development, Corte Madera Creek, and Corte Madera Marsh State Ecological Reserve; and to the east by open space, Shoreline Band Park, and San Quentin State Prison. Corte Madera Creek flows east and becomes the Corte Madera Channel before flowing into the San Francisco Bay. 1. Habitat Types
As shown in Table 4-1, LSA identified eight habitat types within the approximately 404.94-acre Plan area: developed; ruderal/non-native annual grassland; non-native woody vegetation; coast live oak woodland; riparian woodland; tidal marsh/ mudflat; freshwater/brackish marsh; and creek/open water. Figure 4-1 identifies the locations of these habitat types. Three sub-areas are identified within the Plan area: Larkspur Landing – Sub-Area 1A; Greenbrae Area – Sub-Area 1B; and Redwood Highway Area – Sub-Area 2. These sub-areas are shown on Figure 4-1. Table 4-1 summarizes the approximate acreage of each habitat type within the Plan area, except for creeks. These acreages were calculated from polygons that were manually digitized using GIS software (i.e., ArcGIS 10) and based on habitat boundaries that were hand-drawn on aerial photo-graphs by LSA Associates, Inc. Besides the open water habitats of the Corte Madera Creek and Corte Madera Channel, the majority of the undeveloped areas within the Plan area are located along the northern shoreline of Corte Madera Creek and in the northern and eastern portions of Sub-Area 1A. These areas also support the majority of grassland, tidal marsh/mudflat, and woodland habitat, as shown in Figure 4-1.
11 Crother, B.I., editor, 2008. Scientific and standard English names of amphibians and reptiles of North American
north of Mexico. Society for the Study of Amphibians and Reptiles (SSAR) Herpetological Circular 37. 12 American Ornithologists’ Union, 1998. Check-list of North American birds. Seventh edition. American
Ornithologists’ Union, Washington, D.C. 13 Baker, R. J., et al., 2003. Revised checklist of North American mammals north of Mexico, 2003.
Table 4-1: Acreages of Habitat Types within the Plan Area
Habitat Type Approximate
Acres Developed 320.73 Ruderal/Non-native annual grassland 20.22 Non-native woody vegetation 11.05 Coast live oak woodland 6.04 Riparian woodland 0.46 Tidal marsh/mudflat 7.34 Freshwater/brackish marsh 2.72 Creek/open water 36.38
TOTAL 404.94 Source: LSA Associates, Inc., 2012.
L S A A S S O C I A T E S , I N C . L A R K S P U R S M A R T S T A T I O N A R E A P L A N J U L Y 2 0 1 2 B A S E L I N E E N V I R O N M E N T A L C O N D I T I O N S 4 . B I O L O G I C A L R E S O U R C E S
P:\BMD1201 Larkspur\PRODUCTS\Working Papers\4-Bio.doc (7/30/2012) DRAFT 2 4
Habitat types present in the Plan area are described below, and these descriptions are based on LSA’s reconnaissance survey of the Plan area, unless otherwise noted. a. Developed Habitat. Developed habitats of the Plan area include residential neighborhoods; commercial and industrial buildings; roads; parking lots, neighborhood parks, and associated landscaping consisting of lawns and ornamental trees and shrubs. Ornamental trees in the developed portions of the Plan area are primarily non-native, but include some native species. Common non-native trees and shrubs observed in developed habitats include the following: blue gum (Eucalyptus globulus), sweet gum (Liquidambar styraciflua), weeping willow (Salix babylonica), acacia (Acacia spp.), fruit trees (Prunus spp.), oleander (Nerium oleander), pine (Pinus spp.), poplar (Populus spp.), olive (Oleo europea), tobira (Pittosporum tobira), American elm (Ulmus americana), and Mexican fan palm (Washingtonia robusta). Native but non-local trees in developed areas include Monterey pine (Pinus radiata), Douglas fir (Pseudotsuga menziesii), and coast redwood (Sequoia sempervirens). Coast live oak (Quercus agrifolia) is a local native species that was observed in developed areas of the Plan area. Ornamental shrubs observed in the urban areas include bottlebrush (Callistemon sp.), pampas grass (Cortaderia sp.), Pride of Madeira (Echium candicans), agave (Agave sp.), broom (Genista monspessulana; G. juncea; Cytisus scoparius), and the native toyon (Heteromeles arbutifolia). English ivy (Hedera helix), and Germany ivy (Delairea odorata) are also abundant in the developed portion of the Plan area. b. Ruderal/Non-Native Annual Grassland Habitat. Most of the ruderal/non-native annual grassland habitat within the Plan area occurs at Drake’s Landing in Sub-Area 1B near the northern shoreline of Corte Madera Creek and along the northern portions of Sub-Area 1A, as shown in Figure 4-1. The ruderal/non-native grassland habitat along the northern portions of Sub-Area 1A is interspersed with some rocky outcrops associated with the quarry cuts that characterize the steep hillside above the multi-family housing. This habitat type is dominated by non-native annual grasses and non-native forbs. Non-native plant species observed in ruderal/non-native grassland habitat include wild oats (Avena fatua), ripgut brome (Bromus diandrus), soft chess (Bromus hordeaceus), Italian thistle (Carduus pycnocephalus), sweet fennel (Foeniculum vulgare), summer mustard (Hirschfeldia incana), hare barley (Hordeum murinum ssp. leporinum), Italian ryegrass (Festuca perennis), common mallow (Malva neglecta), prickly ox-tongue (Helminthotheca echioides), cut-leaf plantain (Plantago coronopus), rose clover (Trifolium sp.), perennial pepperweed (Lepidium latifolium), wild radish (Raphanus sativus), brome fescue (Vulpia sp.), fountain grass (Pennisetum setaceum), lupine (Lupinus sp.) and pampas grass. Native species observed in this habitat include California poppy (Eschscholzia californica), coyote brush (Baccharis pilularis), and toyon.
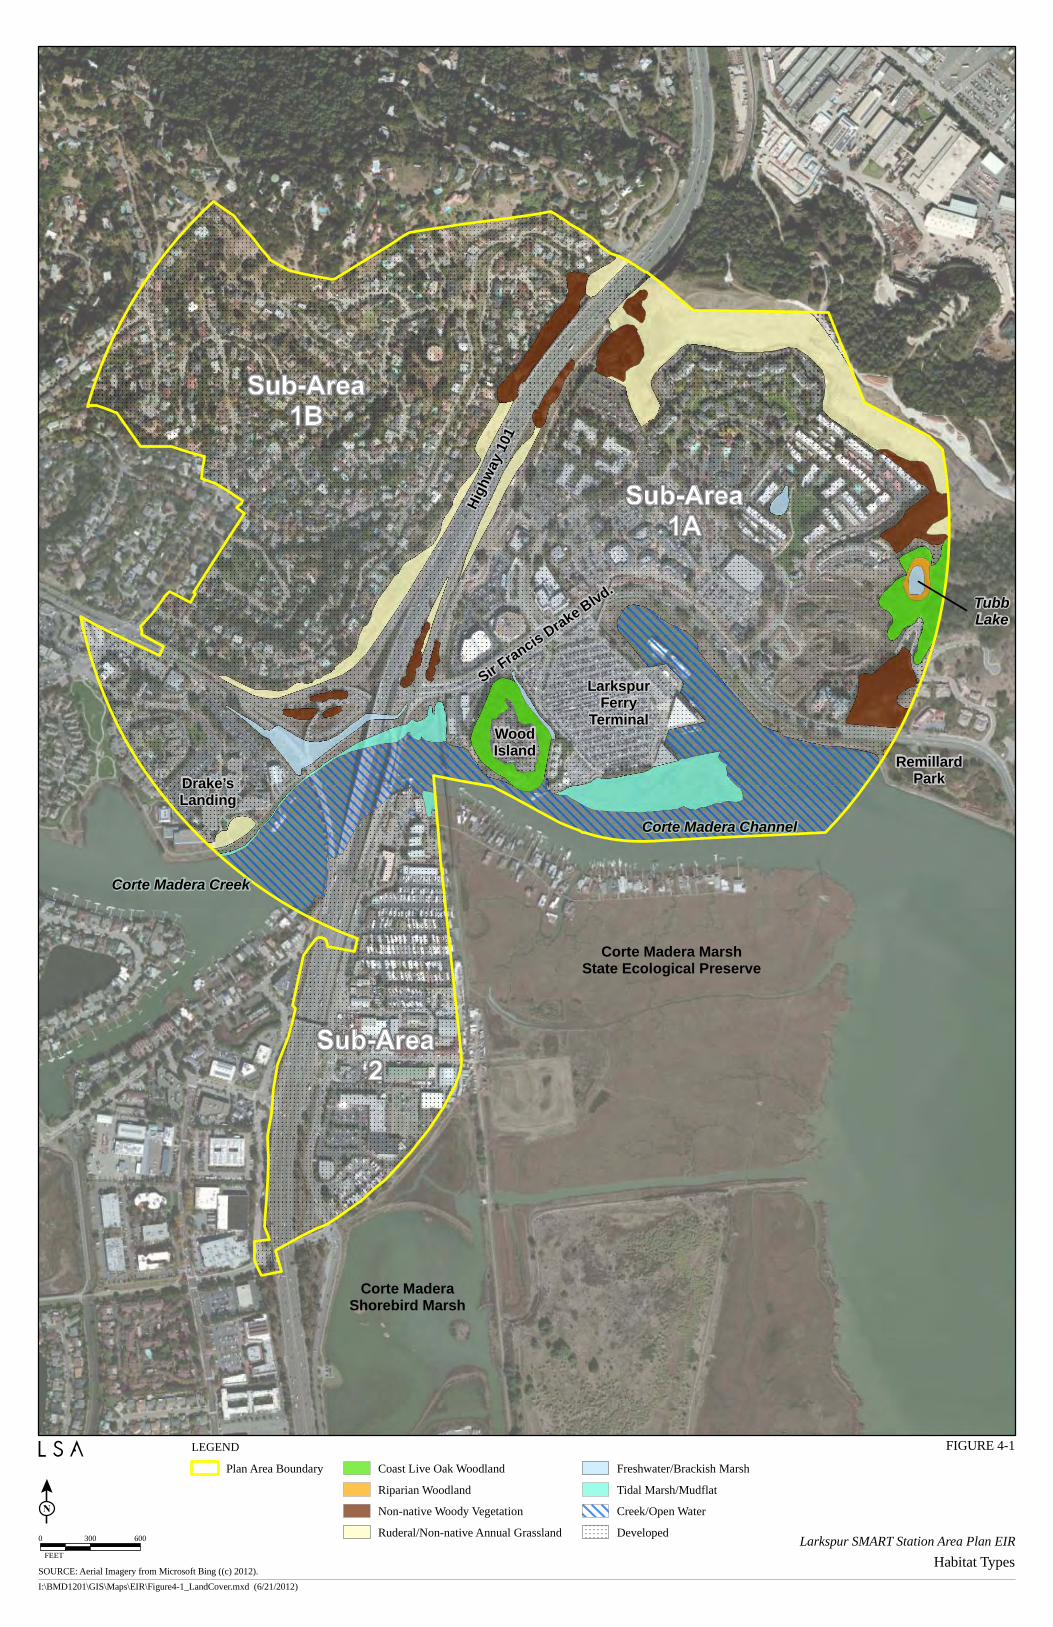
Hig
hway
101
Corte Madera Creek
Corte Madera MarshState Ecological Preserve
Corte MaderaShorebird Marsh
Corte Madera Channel
Sir Francis D
rake Blvd.
TubbLake
LarkspurFerry
TerminalWoodIsland
RemillardParkDrake’s
Landing
SOURCE: Aerial Imagery from Microsoft Bing ((c) 2012).
I:\BMD1201\GIS\Maps\EIR\Figure4-1_LandCover.mxd (6/21/2012)
FIGURE 4-1
Larkspur SMART Station Area Plan EIR
Habitat Types
0 300 600
FEET
LEGEND
Plan Area Boundary Coast Live Oak Woodland
Riparian Woodland
Non-native Woody Vegetation
Ruderal/Non-native Annual Grassland
Freshwater/Brackish Marsh
Tidal Marsh/Mudflat
Creek/Open Water
Developed
L S A A S S O C I A T E S , I N C . L A R K S P U R S M A R T S T A T I O N A R E A P L A N J U L Y 2 0 1 2 B A S E L I N E E N V I R O N M E N T A L C O N D I T I O N S 4 . B I O L O G I C A L R E S O U R C E S
P:\BMD1201 Larkspur\PRODUCTS\Working Papers\4-Bio.doc (7/30/2012) DRAFT 2 6
This page intentionally left blank.
L S A A S S O C I A T E S , I N C . L A R K S P U R S M A R T S T A T I O N A R E A P L A N J U L Y 2 0 1 2 B A S E L I N E E N V I R O N M E N T A L C O N D I T I O N S 4 . B I O L O G I C A L R E S O U R C E S
P:\BMD1201 Larkspur\PRODUCTS\Working Papers\4-Bio.doc (7/30/2012) DRAFT 2 7
c. Woodland Habitat. Woodland habitats within the Plan area consist of three broadly defined vegetation types: (1) non-native woody vegetation, (2) coast live oak woodland, and (3) riparian woodland. Woodland habitats primarily occur along the eastern, northern, and southern portions of Sub-Area 1A, as shown in Figure 4-1.
(1) Non-Native Woody Vegetation. This habitat type occurs along the Highway 101 corridor and in the northern and eastern portion of Sub-Area 1A. Dominant species observed in this habitat include eucalyptus (Eucalyptus sp.), broom, pine, acacia, coast live oak, and oleander. Associate species observed include cotoneaster (Cotoneaster lacteus), sweet fennel, pampas grass, coyote brush, toyon, and non-native forbs and annual grasses. Although a few native species were observed in this habitat, the dominant vegetation is non-native.
(2) Coast Live Oak Woodland. Coast live oak woodland occurs in the eastern portion of Sub-Area 1A and in the area surrounding the Wood Island business complex, situated just west of the Larkspur Ferry Terminal in Sub-Area 1A. Coast live oaks provide the dominate canopy layer in these areas. Dominant understory species observed within this habitat type consist of broom and annual non-native grasses. Portions of the understory of the coast live oak woodland at Wood Island have been landscaped with mulch and planted with native and ornamental shrubs, such as sticky monkey-flower (Mimulus aurantiacus) and toyon, while understory vegetation in other parts of this woodland consist of mostly broom.
(3) Riparian Woodland. Riparian woodland is dominated by riparian tree species that are adapted to wetland stream banks, floodplains and creek terraces that are seasonally flooded or permanently saturated by freshwater. Riparian woodland was observed at the southeast corner of Sub-Area 1A at Remillard Park and at Tubb Lake in the eastern portion of Sub-Area 1A. These two patches of riparian woodland habitat are dominated by native willows (Salix sp.). d. Tidal Marsh/Mudflat. Tidal marsh is a highly productive community consisting of salt-tolerant, hydrophytic plants that form moderate to dense cover. Plants are usually segregated vertically depending on their tolerance of inundation and saline soils. This habitat type is typically associated with and occurs adjacent to intertidal mudflats that are devoid of vegetation; during an ebb tide, the bottom is bare mud, cobble, or rock. Within the Plan area, this habitat type occurs along the tidal sloughs and marshlands along the northern shoreline of the Corte Madera Creek and Corte Madera Channel. All tidal marsh habitats within the Plan area are similar in vertical structure, starting at the low elevation mudflat to the upland vegetation on adjacent levees. The lowest elevation vegetation strata contain pickleweed (Salicornia pacifica) co-dominated in places by saltgrass (Distichlis spicata) interspersed with areas of open water (or mudflat at low tide). Pickleweed and saltgrass are still dominant components on the elevated benches of the tidal marsh where patches of alkali heath (Frankenia salina), gumplant (Grindelia stricta ssp. angustifolia), and cordgrass (Spartina sp.) were observed. Large patches of cordgrass were observed in the tidal wetland east of Drake’s Landing. The upland vegetation on the surrounding banks and levees is dominated by non-native grasses and ruderal herbs including mustard (Brassica sp.), ice plant (Carpobrotus sp.), English plantain (Plantago lanceolata), sweet fennel, and perennial pepperweed.
L S A A S S O C I A T E S , I N C . L A R K S P U R S M A R T S T A T I O N A R E A P L A N J U L Y 2 0 1 2 B A S E L I N E E N V I R O N M E N T A L C O N D I T I O N S 4 . B I O L O G I C A L R E S O U R C E S
P:\BMD1201 Larkspur\PRODUCTS\Working Papers\4-Bio.doc (7/30/2012) DRAFT 2 8
e. Freshwater/Brackish Marsh. This habitat type supports emergent vegetation that is adapted to permanently or seasonally flooded soils (wetlands), and occurs along the channels and wetlands north of Corte Madera Creek. This marsh habitat occurs east of Drake’s Landing in the vicinity of the Highway 101 off- and on-ramps and along the western border of the Larkspur Ferry Terminal. The dominant vegetation in this habitat consists of dense monotypic stands of cattails (Typha sp.), or mixed stands of cattails and bulrush (Scirpus sp. and/or Schoenoplectus sp.). Freshwater habitats in the Plan area include Tubb Lake at the eastern portion of Sub-Area 1A and the constructed unvege-tated pond situated within a residential complex near the center of Sub-Area 1-A. Tubb Lake supports Himalayan blackberry (Rubus armeniacus), tall flatsedge (Cyperus eragrostis), rush (Juncus sp.), teasel (Dipsacus sp.), rabbit’s-foot grass (Polypogon monspeliensis), water milfoil (Myriophyllum sp.), and cattail. f. Creek/Open Water. Creek and open water habitat within the Plan area occurs along the Corte Madera Creek and Corte Madera Channel. These open water habitats are tidally influenced and support brackish/saline habitat conditions. The northern shoreline of Corte Madera Creek and Corte Madera Channel contains rock rip-rap and/or tidal marsh habitat. 2. Wildlife Habitat Values
The following sections provide information on wildlife species expected to occur in each habitat type. Not every species mentioned was observed during the reconnaissance-level survey, and several species not mentioned may nevertheless occur in the Plan area. As such, the following discussion should not be interpreted as an exhaustive list of every species that may potentially occur, but rather a broad overview of wildlife communities within each habitat type. a. Developed Habitat. Most wildlife species that use developed habitats are generalists that have adapted to human-modified habitats, although the specific species present varies depending on the types and diversity of vegetation in an area. Industrial and commercial areas typically have less ornamental plantings and open lawns than residential neighborhoods and urban parks, and thus support fewer species. Species that use industrial and commercial areas are able to use ornamental landscaping as foraging habitat and/or escape cover, and some are able to exploit building crevices, rooftops, and/or ledges on buildings for nesting and/or roosting. Common urban bird species expected to use such features include mourning dove (Zenaida macroura), rock pigeon (Columba livia), American crow (Corvus brachyrhynchos), European starling (Sturnus vulgaris), house finch (Carpodacus mexicanus), and house sparrow (Passer domesticus). Residential neighborhoods and urban parks contain more trees, shrubs, and lawns than industrial and commercial areas, and thus support additional bird species such as Anna’s hummingbird (Calypte anna), western scrub-jay (Aphelocoma californica), American robin (Turdus migratorius), northern mockingbird (Mimus polyglottos), chestnut-backed chickadee (Poecile rufescens), bushtit (Psaltriparus minimus), and California towhee (Pipilo crissalis). Many of these species also occur in undisturbed, more natural habitats (e.g., oak woodland, coastal scrub) throughout Marin County, but have successfully adapted to urban landscapes. During the winter, the resident bird community is supplemented by species that breed farther north or at higher elevations, such as cedar waxwing (Bombycilla cedrorum), ruby-crowned kinglet (Regulus calendula), yellow-rumped warbler (Dendroica coronata), Townsend’s warbler (Dendroica townsendi), and golden-crowned sparrow (Zonotrichia atricapilla). Large heritage-sized oaks in several City parks may attract cavity-nesting oak woodland birds such as Nuttall’s woodpecker (Picoides nuttallii) and oak titmouse (Baeolophus inornatus). All of these species may occur in adjacent residential areas, as well, provided that large trees are present.
L S A A S S O C I A T E S , I N C . L A R K S P U R S M A R T S T A T I O N A R E A P L A N J U L Y 2 0 1 2 B A S E L I N E E N V I R O N M E N T A L C O N D I T I O N S 4 . B I O L O G I C A L R E S O U R C E S
P:\BMD1201 Larkspur\PRODUCTS\Working Papers\4-Bio.doc (7/30/2012) DRAFT 2 9
Several amphibians and reptile species can occur in developed habitats if suitable cover is present. Ornamental shrubs, leaf litter, and well-watered lawns provide cover and foraging habitat for Sierran treefrog (Pseudacris sierra), western toad (Bufo boreas), arboreal salamander (Aneides lugubris), California slender salamander (Batrachoseps attenuatus), and common garter snake (Thamnophis sirtalis). Such species are more likely to occur in residential areas or parks rather than industrial or commercial areas. Mammal species expected to occur in developed habitats include Virginia opossum (Didelphis virginiana), fox squirrel (Sciurus niger), Botta’s pocket gopher (Thomomys bottae), house mouse (Mus musculus), Norway rat (Rattus norvegicus), house rat (Rattus rattus), northern raccoon (Procyon lotor), striped skunk (Mephitis mephitis), and black-tailed deer (Odicoileus hemionus). Coyotes (Canis latrans) and gray fox (Urocyon cinereoargenteus) may forage in the more open or forested portions of developed areas. b. Ruderal/Non-Native Annual Grassland Habitat. As stated above, the majority of ruderal/ non-native annual grassland habitat within the Plan area is located along the northern portion of Sub-Area 1A, the Highway 101 corridor, and the southern portion of Drake’s Landing. Grasslands provide foraging habitat for raptors such as white-tailed kite (Elanus leucurus), northern harrier (Circus cyaneus), red-tailed hawk (Buteo jamaicensis), American kestrel (Falco sparverius), and barn owl (Tyto alba). Other bird species typically associated with grasslands include killdeer (Charadrius vociferus), loggerhead shrike (Lanius ludovicianus), American pipit (Anthus rubescens), savannah sparrow (Passerculus sandwichensis), western meadowlark (Sturnella neglecta), and red-winged blackbird (Agelaius phoeniceus). Common amphibian and reptile species expected to occur in grasslands include western fence lizard (Sceloporus occidentalis), gopher snake (Pituophis catenifer), Sierran treefrog, western toad, and common garter snake. Areas with accumulated thatch and sufficient grass cover are likely to support small mammal species such as deer mouse (Peromyscus maniculatus), western harvest mouse (Reithrodontomys megalotis), California vole (Microtus californicus), and Botta’s pocket gopher. Other common mammal species expected to occur in grasslands include black-tailed jackrabbit (Lepus californicus), northern raccoon, striped skunk, black-tailed deer, and coyote. c. Non-Native Woody Vegetation and Woodland Habitats. Many of the same wildlife species that occur in developed habitats also use non-native woody vegetation and native woodland habitats since such areas within the Plan area largely consist of narrow corridors (e.g., along Highway 101 or Via La Cumbre) or patches (e.g., in the northern and eastern portions of Sub-Area 1A) within an otherwise urbanized landscape. Nevertheless, the somewhat higher structural diversity of the coast live oak and riparian woodlands provides habitat for understory species such as spotted towhee (Pipilo maculatus), fox sparrow (Passerella iliaca), and hermit thrush (Catharus guttatus), the latter two of which winter but do not breed in the Bay Area. This increased structural diversity also provides migratory stopover habitat for species such as Pacific-slope flycatcher (Empidonax difficilis), warbling vireo (Vireo gilvus), yellow warbler (Dendroica petechia), Wilson’s warbler (Wilsonia pusilla), black-headed grosbeak (Pheucticus melanocephalus), and western tanager (Piranga ludoviciana). Some of these species may forage in adjacent residential areas, as well. Larger trees provide nesting habitat for red-shouldered hawk (Buteo lineatus), Cooper’s hawk (Accipiter cooperii), and downy woodpecker (Picoides pubescens).
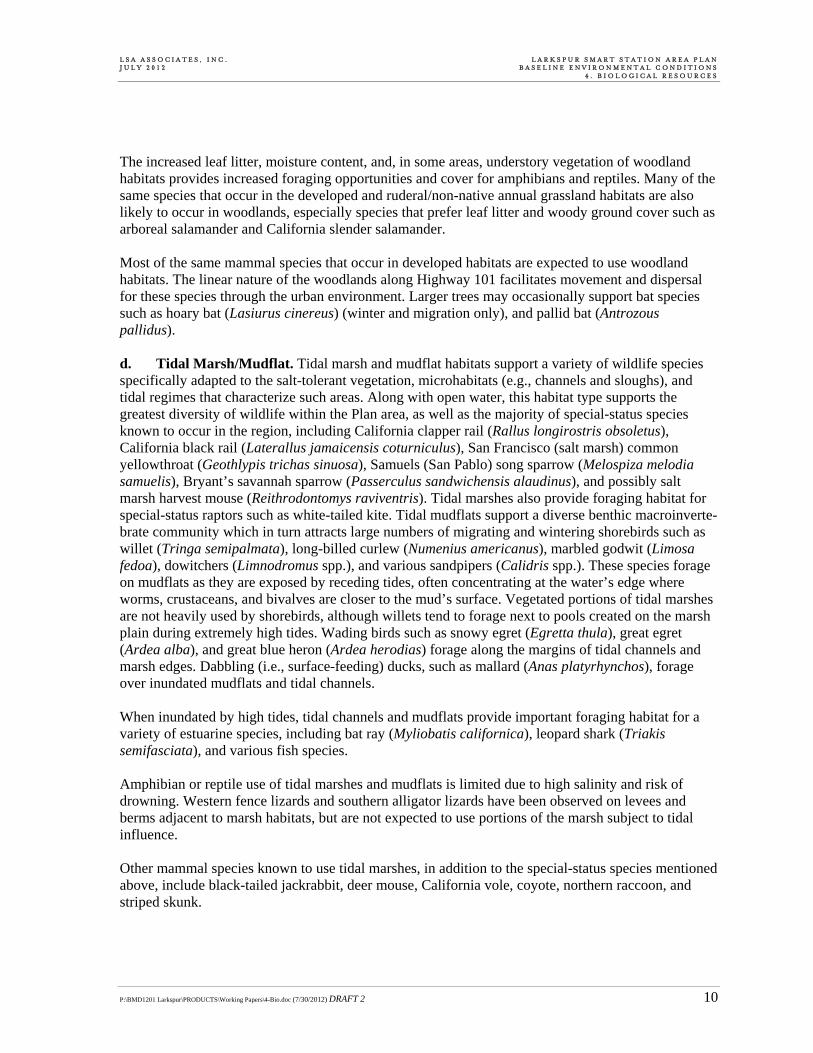
L S A A S S O C I A T E S , I N C . L A R K S P U R S M A R T S T A T I O N A R E A P L A N J U L Y 2 0 1 2 B A S E L I N E E N V I R O N M E N T A L C O N D I T I O N S 4 . B I O L O G I C A L R E S O U R C E S
P:\BMD1201 Larkspur\PRODUCTS\Working Papers\4-Bio.doc (7/30/2012) DRAFT 2 10
The increased leaf litter, moisture content, and, in some areas, understory vegetation of woodland habitats provides increased foraging opportunities and cover for amphibians and reptiles. Many of the same species that occur in the developed and ruderal/non-native annual grassland habitats are also likely to occur in woodlands, especially species that prefer leaf litter and woody ground cover such as arboreal salamander and California slender salamander. Most of the same mammal species that occur in developed habitats are expected to use woodland habitats. The linear nature of the woodlands along Highway 101 facilitates movement and dispersal for these species through the urban environment. Larger trees may occasionally support bat species such as hoary bat (Lasiurus cinereus) (winter and migration only), and pallid bat (Antrozous pallidus). d. Tidal Marsh/Mudflat. Tidal marsh and mudflat habitats support a variety of wildlife species specifically adapted to the salt-tolerant vegetation, microhabitats (e.g., channels and sloughs), and tidal regimes that characterize such areas. Along with open water, this habitat type supports the greatest diversity of wildlife within the Plan area, as well as the majority of special-status species known to occur in the region, including California clapper rail (Rallus longirostris obsoletus), California black rail (Laterallus jamaicensis coturniculus), San Francisco (salt marsh) common yellowthroat (Geothlypis trichas sinuosa), Samuels (San Pablo) song sparrow (Melospiza melodia samuelis), Bryant’s savannah sparrow (Passerculus sandwichensis alaudinus), and possibly salt marsh harvest mouse (Reithrodontomys raviventris). Tidal marshes also provide foraging habitat for special-status raptors such as white-tailed kite. Tidal mudflats support a diverse benthic macroinverte-brate community which in turn attracts large numbers of migrating and wintering shorebirds such as willet (Tringa semipalmata), long-billed curlew (Numenius americanus), marbled godwit (Limosa fedoa), dowitchers (Limnodromus spp.), and various sandpipers (Calidris spp.). These species forage on mudflats as they are exposed by receding tides, often concentrating at the water’s edge where worms, crustaceans, and bivalves are closer to the mud’s surface. Vegetated portions of tidal marshes are not heavily used by shorebirds, although willets tend to forage next to pools created on the marsh plain during extremely high tides. Wading birds such as snowy egret (Egretta thula), great egret (Ardea alba), and great blue heron (Ardea herodias) forage along the margins of tidal channels and marsh edges. Dabbling (i.e., surface-feeding) ducks, such as mallard (Anas platyrhynchos), forage over inundated mudflats and tidal channels. When inundated by high tides, tidal channels and mudflats provide important foraging habitat for a variety of estuarine species, including bat ray (Myliobatis californica), leopard shark (Triakis semifasciata), and various fish species. Amphibian or reptile use of tidal marshes and mudflats is limited due to high salinity and risk of drowning. Western fence lizards and southern alligator lizards have been observed on levees and berms adjacent to marsh habitats, but are not expected to use portions of the marsh subject to tidal influence. Other mammal species known to use tidal marshes, in addition to the special-status species mentioned above, include black-tailed jackrabbit, deer mouse, California vole, coyote, northern raccoon, and striped skunk.
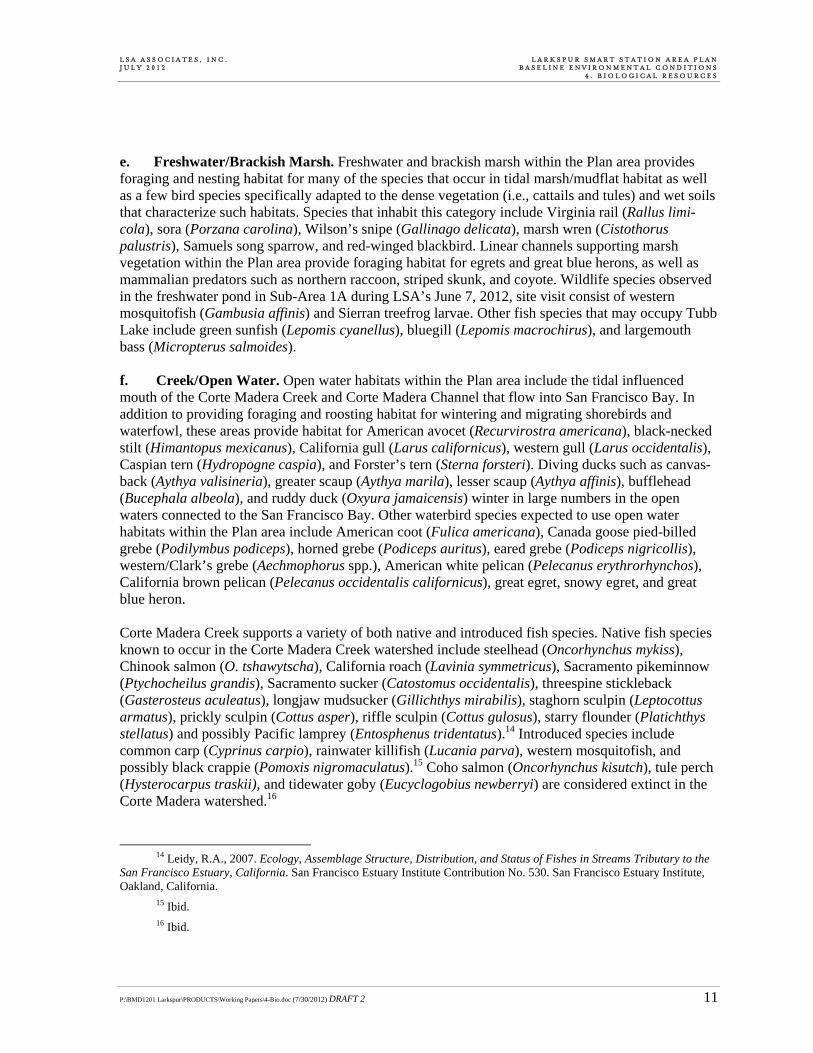
L S A A S S O C I A T E S , I N C . L A R K S P U R S M A R T S T A T I O N A R E A P L A N J U L Y 2 0 1 2 B A S E L I N E E N V I R O N M E N T A L C O N D I T I O N S 4 . B I O L O G I C A L R E S O U R C E S
P:\BMD1201 Larkspur\PRODUCTS\Working Papers\4-Bio.doc (7/30/2012) DRAFT 2 11
e. Freshwater/Brackish Marsh. Freshwater and brackish marsh within the Plan area provides foraging and nesting habitat for many of the species that occur in tidal marsh/mudflat habitat as well as a few bird species specifically adapted to the dense vegetation (i.e., cattails and tules) and wet soils that characterize such habitats. Species that inhabit this category include Virginia rail (Rallus limi-cola), sora (Porzana carolina), Wilson’s snipe (Gallinago delicata), marsh wren (Cistothorus palustris), Samuels song sparrow, and red-winged blackbird. Linear channels supporting marsh vegetation within the Plan area provide foraging habitat for egrets and great blue herons, as well as mammalian predators such as northern raccoon, striped skunk, and coyote. Wildlife species observed in the freshwater pond in Sub-Area 1A during LSA’s June 7, 2012, site visit consist of western mosquitofish (Gambusia affinis) and Sierran treefrog larvae. Other fish species that may occupy Tubb Lake include green sunfish (Lepomis cyanellus), bluegill (Lepomis macrochirus), and largemouth bass (Micropterus salmoides). f. Creek/Open Water. Open water habitats within the Plan area include the tidal influenced mouth of the Corte Madera Creek and Corte Madera Channel that flow into San Francisco Bay. In addition to providing foraging and roosting habitat for wintering and migrating shorebirds and waterfowl, these areas provide habitat for American avocet (Recurvirostra americana), black-necked stilt (Himantopus mexicanus), California gull (Larus californicus), western gull (Larus occidentalis), Caspian tern (Hydropogne caspia), and Forster’s tern (Sterna forsteri). Diving ducks such as canvas-back (Aythya valisineria), greater scaup (Aythya marila), lesser scaup (Aythya affinis), bufflehead (Bucephala albeola), and ruddy duck (Oxyura jamaicensis) winter in large numbers in the open waters connected to the San Francisco Bay. Other waterbird species expected to use open water habitats within the Plan area include American coot (Fulica americana), Canada goose pied-billed grebe (Podilymbus podiceps), horned grebe (Podiceps auritus), eared grebe (Podiceps nigricollis), western/Clark’s grebe (Aechmophorus spp.), American white pelican (Pelecanus erythrorhynchos), California brown pelican (Pelecanus occidentalis californicus), great egret, snowy egret, and great blue heron. Corte Madera Creek supports a variety of both native and introduced fish species. Native fish species known to occur in the Corte Madera Creek watershed include steelhead (Oncorhynchus mykiss), Chinook salmon (O. tshawytscha), California roach (Lavinia symmetricus), Sacramento pikeminnow (Ptychocheilus grandis), Sacramento sucker (Catostomus occidentalis), threespine stickleback (Gasterosteus aculeatus), longjaw mudsucker (Gillichthys mirabilis), staghorn sculpin (Leptocottus armatus), prickly sculpin (Cottus asper), riffle sculpin (Cottus gulosus), starry flounder (Platichthys stellatus) and possibly Pacific lamprey (Entosphenus tridentatus).14 Introduced species include common carp (Cyprinus carpio), rainwater killifish (Lucania parva), western mosquitofish, and possibly black crappie (Pomoxis nigromaculatus).15 Coho salmon (Oncorhynchus kisutch), tule perch (Hysterocarpus traskii), and tidewater goby (Eucyclogobius newberryi) are considered extinct in the Corte Madera watershed.16
14 Leidy, R.A., 2007. Ecology, Assemblage Structure, Distribution, and Status of Fishes in Streams Tributary to the
San Francisco Estuary, California. San Francisco Estuary Institute Contribution No. 530. San Francisco Estuary Institute, Oakland, California.
15 Ibid. 16 Ibid.
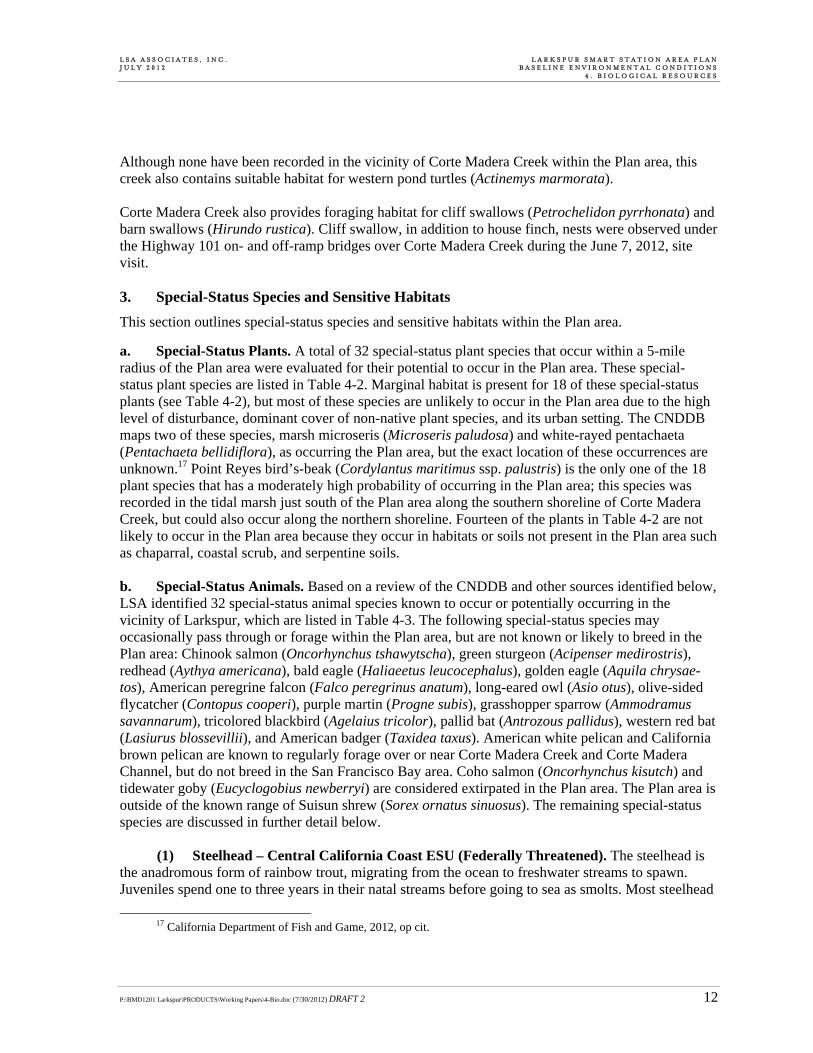
L S A A S S O C I A T E S , I N C . L A R K S P U R S M A R T S T A T I O N A R E A P L A N J U L Y 2 0 1 2 B A S E L I N E E N V I R O N M E N T A L C O N D I T I O N S 4 . B I O L O G I C A L R E S O U R C E S
P:\BMD1201 Larkspur\PRODUCTS\Working Papers\4-Bio.doc (7/30/2012) DRAFT 2 12
Although none have been recorded in the vicinity of Corte Madera Creek within the Plan area, this creek also contains suitable habitat for western pond turtles (Actinemys marmorata). Corte Madera Creek also provides foraging habitat for cliff swallows (Petrochelidon pyrrhonata) and barn swallows (Hirundo rustica). Cliff swallow, in addition to house finch, nests were observed under the Highway 101 on- and off-ramp bridges over Corte Madera Creek during the June 7, 2012, site visit. 3. Special-Status Species and Sensitive Habitats
This section outlines special-status species and sensitive habitats within the Plan area.
a. Special-Status Plants. A total of 32 special-status plant species that occur within a 5-mile radius of the Plan area were evaluated for their potential to occur in the Plan area. These special-status plant species are listed in Table 4-2. Marginal habitat is present for 18 of these special-status plants (see Table 4-2), but most of these species are unlikely to occur in the Plan area due to the high level of disturbance, dominant cover of non-native plant species, and its urban setting. The CNDDB maps two of these species, marsh microseris (Microseris paludosa) and white-rayed pentachaeta (Pentachaeta bellidiflora), as occurring the Plan area, but the exact location of these occurrences are unknown.17 Point Reyes bird’s-beak (Cordylantus maritimus ssp. palustris) is the only one of the 18 plant species that has a moderately high probability of occurring in the Plan area; this species was recorded in the tidal marsh just south of the Plan area along the southern shoreline of Corte Madera Creek, but could also occur along the northern shoreline. Fourteen of the plants in Table 4-2 are not likely to occur in the Plan area because they occur in habitats or soils not present in the Plan area such as chaparral, coastal scrub, and serpentine soils. b. Special-Status Animals. Based on a review of the CNDDB and other sources identified below, LSA identified 32 special-status animal species known to occur or potentially occurring in the vicinity of Larkspur, which are listed in Table 4-3. The following special-status species may occasionally pass through or forage within the Plan area, but are not known or likely to breed in the Plan area: Chinook salmon (Oncorhynchus tshawytscha), green sturgeon (Acipenser medirostris), redhead (Aythya americana), bald eagle (Haliaeetus leucocephalus), golden eagle (Aquila chrysae-tos), American peregrine falcon (Falco peregrinus anatum), long-eared owl (Asio otus), olive-sided flycatcher (Contopus cooperi), purple martin (Progne subis), grasshopper sparrow (Ammodramus savannarum), tricolored blackbird (Agelaius tricolor), pallid bat (Antrozous pallidus), western red bat (Lasiurus blossevillii), and American badger (Taxidea taxus). American white pelican and California brown pelican are known to regularly forage over or near Corte Madera Creek and Corte Madera Channel, but do not breed in the San Francisco Bay area. Coho salmon (Oncorhynchus kisutch) and tidewater goby (Eucyclogobius newberryi) are considered extirpated in the Plan area. The Plan area is outside of the known range of Suisun shrew (Sorex ornatus sinuosus). The remaining special-status species are discussed in further detail below.
(1) Steelhead – Central California Coast ESU (Federally Threatened). The steelhead is the anadromous form of rainbow trout, migrating from the ocean to freshwater streams to spawn. Juveniles spend one to three years in their natal streams before going to sea as smolts. Most steelhead
17 California Department of Fish and Game, 2012, op cit.
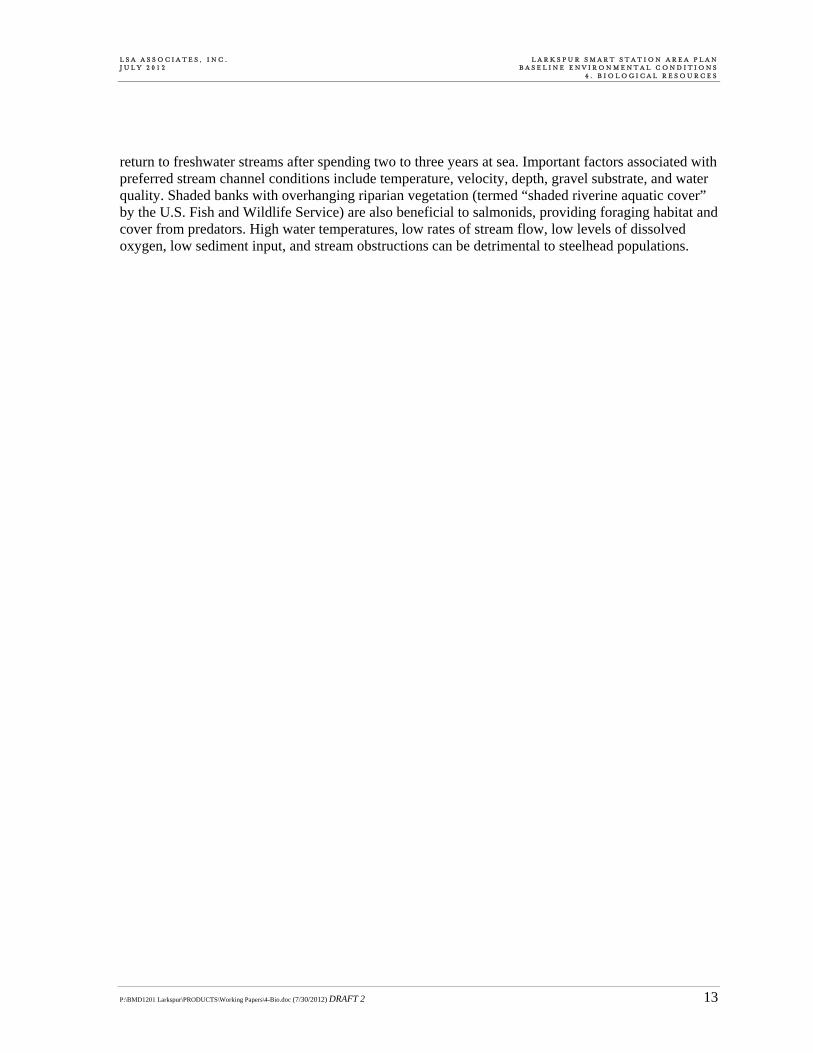
L S A A S S O C I A T E S , I N C . L A R K S P U R S M A R T S T A T I O N A R E A P L A N J U L Y 2 0 1 2 B A S E L I N E E N V I R O N M E N T A L C O N D I T I O N S 4 . B I O L O G I C A L R E S O U R C E S
P:\BMD1201 Larkspur\PRODUCTS\Working Papers\4-Bio.doc (7/30/2012) DRAFT 2 13
return to freshwater streams after spending two to three years at sea. Important factors associated with preferred stream channel conditions include temperature, velocity, depth, gravel substrate, and water quality. Shaded banks with overhanging riparian vegetation (termed “shaded riverine aquatic cover” by the U.S. Fish and Wildlife Service) are also beneficial to salmonids, providing foraging habitat and cover from predators. High water temperatures, low rates of stream flow, low levels of dissolved oxygen, low sediment input, and stream obstructions can be detrimental to steelhead populations.
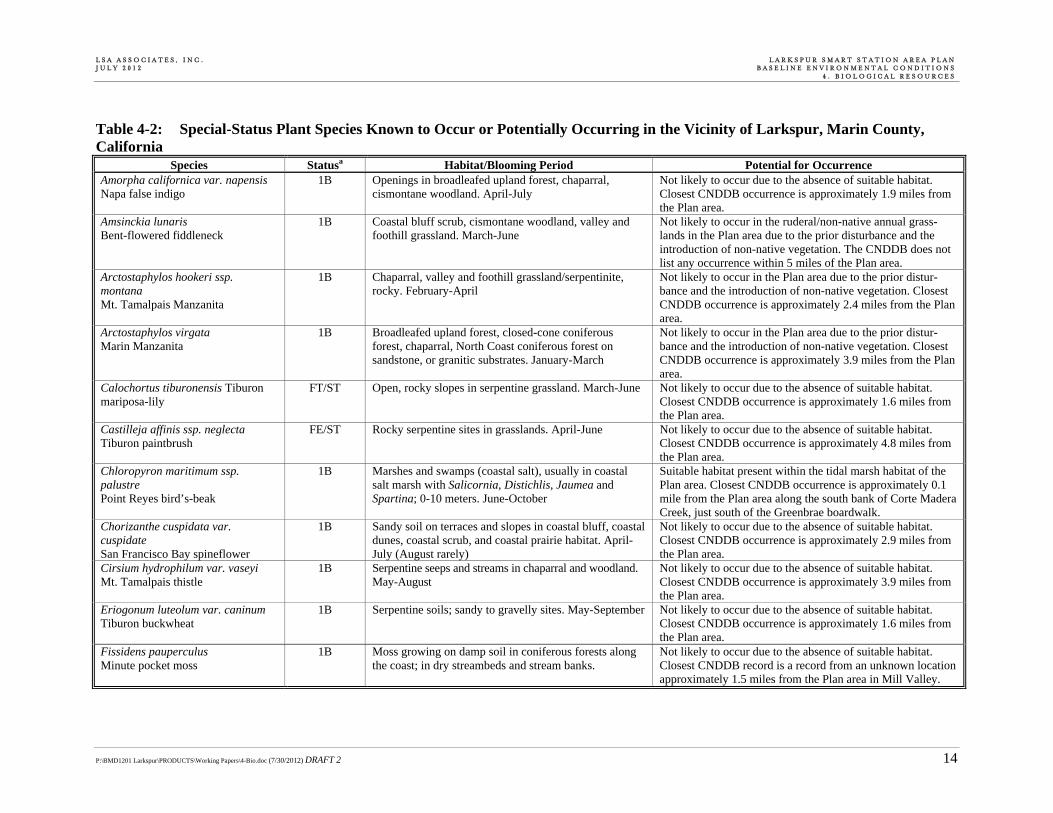
L S A A S S O C I A T E S , I N C . L A R K S P U R S M A R T S T A T I O N A R E A P L A N J U L Y 2 0 1 2 B A S E L I N E E N V I R O N M E N T A L C O N D I T I O N S 4 . B I O L O G I C A L R E S O U R C E S
P:\BMD1201 Larkspur\PRODUCTS\Working Papers\4-Bio.doc (7/30/2012) DRAFT 2 14
Table 4-2: Special-Status Plant Species Known to Occur or Potentially Occurring in the Vicinity of Larkspur, Marin County, California
Species Statusa Habitat/Blooming Period Potential for Occurrence Amorpha californica var. napensis Napa false indigo
1B Openings in broadleafed upland forest, chaparral, cismontane woodland. April-July
Not likely to occur due to the absence of suitable habitat. Closest CNDDB occurrence is approximately 1.9 miles from the Plan area.
Amsinckia lunaris Bent-flowered fiddleneck
1B Coastal bluff scrub, cismontane woodland, valley and foothill grassland. March-June
Not likely to occur in the ruderal/non-native annual grass-lands in the Plan area due to the prior disturbance and the introduction of non-native vegetation. The CNDDB does not list any occurrence within 5 miles of the Plan area.
Arctostaphylos hookeri ssp. montana Mt. Tamalpais Manzanita
1B Chaparral, valley and foothill grassland/serpentinite, rocky. February-April
Not likely to occur in the Plan area due to the prior distur-bance and the introduction of non-native vegetation. Closest CNDDB occurrence is approximately 2.4 miles from the Plan area.
Arctostaphylos virgata Marin Manzanita
1B Broadleafed upland forest, closed-cone coniferous forest, chaparral, North Coast coniferous forest on sandstone, or granitic substrates. January-March
Not likely to occur in the Plan area due to the prior distur-bance and the introduction of non-native vegetation. Closest CNDDB occurrence is approximately 3.9 miles from the Plan area.
Calochortus tiburonensis Tiburon mariposa-lily
FT/ST Open, rocky slopes in serpentine grassland. March-June Not likely to occur due to the absence of suitable habitat. Closest CNDDB occurrence is approximately 1.6 miles from the Plan area.
Castilleja affinis ssp. neglecta Tiburon paintbrush
FE/ST Rocky serpentine sites in grasslands. April-June Not likely to occur due to the absence of suitable habitat. Closest CNDDB occurrence is approximately 4.8 miles from the Plan area.
Chloropyron maritimum ssp. palustre Point Reyes bird’s-beak
1B Marshes and swamps (coastal salt), usually in coastal salt marsh with Salicornia, Distichlis, Jaumea and Spartina; 0-10 meters. June-October
Suitable habitat present within the tidal marsh habitat of the Plan area. Closest CNDDB occurrence is approximately 0.1 mile from the Plan area along the south bank of Corte Madera Creek, just south of the Greenbrae boardwalk.
Chorizanthe cuspidata var. cuspidate San Francisco Bay spineflower
1B Sandy soil on terraces and slopes in coastal bluff, coastal dunes, coastal scrub, and coastal prairie habitat. April-July (August rarely)
Not likely to occur due to the absence of suitable habitat. Closest CNDDB occurrence is approximately 2.9 miles from the Plan area.
Cirsium hydrophilum var. vaseyi Mt. Tamalpais thistle
1B Serpentine seeps and streams in chaparral and woodland. May-August
Not likely to occur due to the absence of suitable habitat. Closest CNDDB occurrence is approximately 3.9 miles from the Plan area.
Eriogonum luteolum var. caninum Tiburon buckwheat
1B Serpentine soils; sandy to gravelly sites. May-September Not likely to occur due to the absence of suitable habitat. Closest CNDDB occurrence is approximately 1.6 miles from the Plan area.
Fissidens pauperculus Minute pocket moss
1B Moss growing on damp soil in coniferous forests along the coast; in dry streambeds and stream banks.
Not likely to occur due to the absence of suitable habitat. Closest CNDDB record is a record from an unknown location approximately 1.5 miles from the Plan area in Mill Valley.
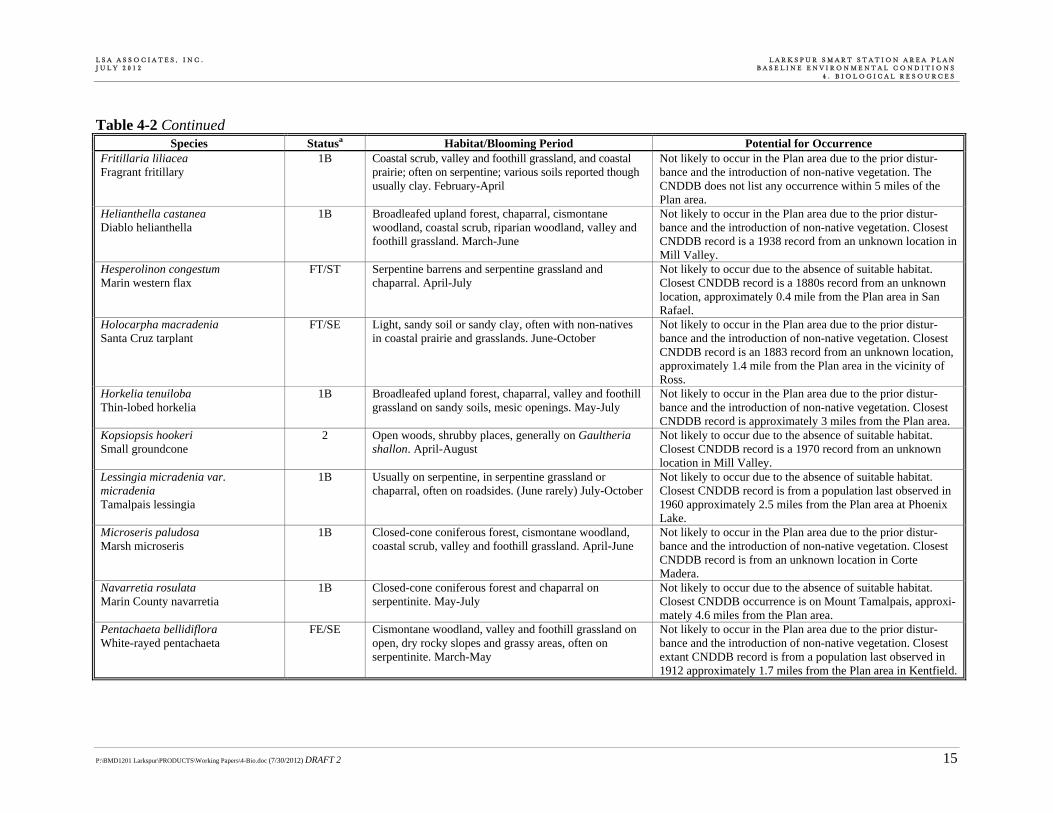
L S A A S S O C I A T E S , I N C . L A R K S P U R S M A R T S T A T I O N A R E A P L A N J U L Y 2 0 1 2 B A S E L I N E E N V I R O N M E N T A L C O N D I T I O N S 4 . B I O L O G I C A L R E S O U R C E S
Table 4-2 Continued
P:\BMD1201 Larkspur\PRODUCTS\Working Papers\4-Bio.doc (7/30/2012) DRAFT 2 15
Species Statusa Habitat/Blooming Period Potential for Occurrence Fritillaria liliacea Fragrant fritillary
1B Coastal scrub, valley and foothill grassland, and coastal prairie; often on serpentine; various soils reported though usually clay. February-April
Not likely to occur in the Plan area due to the prior distur-bance and the introduction of non-native vegetation. The CNDDB does not list any occurrence within 5 miles of the Plan area.
Helianthella castanea Diablo helianthella
1B Broadleafed upland forest, chaparral, cismontane woodland, coastal scrub, riparian woodland, valley and foothill grassland. March-June
Not likely to occur in the Plan area due to the prior distur-bance and the introduction of non-native vegetation. Closest CNDDB record is a 1938 record from an unknown location in Mill Valley.
Hesperolinon congestum Marin western flax
FT/ST Serpentine barrens and serpentine grassland and chaparral. April-July
Not likely to occur due to the absence of suitable habitat. Closest CNDDB record is a 1880s record from an unknown location, approximately 0.4 mile from the Plan area in San Rafael.
Holocarpha macradenia Santa Cruz tarplant
FT/SE Light, sandy soil or sandy clay, often with non-natives in coastal prairie and grasslands. June-October
Not likely to occur in the Plan area due to the prior distur-bance and the introduction of non-native vegetation. Closest CNDDB record is an 1883 record from an unknown location, approximately 1.4 mile from the Plan area in the vicinity of Ross.
Horkelia tenuiloba Thin-lobed horkelia
1B Broadleafed upland forest, chaparral, valley and foothill grassland on sandy soils, mesic openings. May-July
Not likely to occur in the Plan area due to the prior distur-bance and the introduction of non-native vegetation. Closest CNDDB record is approximately 3 miles from the Plan area.
Kopsiopsis hookeri Small groundcone
2 Open woods, shrubby places, generally on Gaultheria shallon. April-August
Not likely to occur due to the absence of suitable habitat. Closest CNDDB record is a 1970 record from an unknown location in Mill Valley.
Lessingia micradenia var. micradenia Tamalpais lessingia
1B Usually on serpentine, in serpentine grassland or chaparral, often on roadsides. (June rarely) July-October
Not likely to occur due to the absence of suitable habitat. Closest CNDDB record is from a population last observed in 1960 approximately 2.5 miles from the Plan area at Phoenix Lake.
Microseris paludosa Marsh microseris
1B Closed-cone coniferous forest, cismontane woodland, coastal scrub, valley and foothill grassland. April-June
Not likely to occur in the Plan area due to the prior distur-bance and the introduction of non-native vegetation. Closest CNDDB record is from an unknown location in Corte Madera.
Navarretia rosulata Marin County navarretia
1B Closed-cone coniferous forest and chaparral on serpentinite. May-July
Not likely to occur due to the absence of suitable habitat. Closest CNDDB occurrence is on Mount Tamalpais, approxi-mately 4.6 miles from the Plan area.
Pentachaeta bellidiflora White-rayed pentachaeta
FE/SE Cismontane woodland, valley and foothill grassland on open, dry rocky slopes and grassy areas, often on serpentinite. March-May
Not likely to occur in the Plan area due to the prior distur-bance and the introduction of non-native vegetation. Closest extant CNDDB record is from a population last observed in 1912 approximately 1.7 miles from the Plan area in Kentfield.
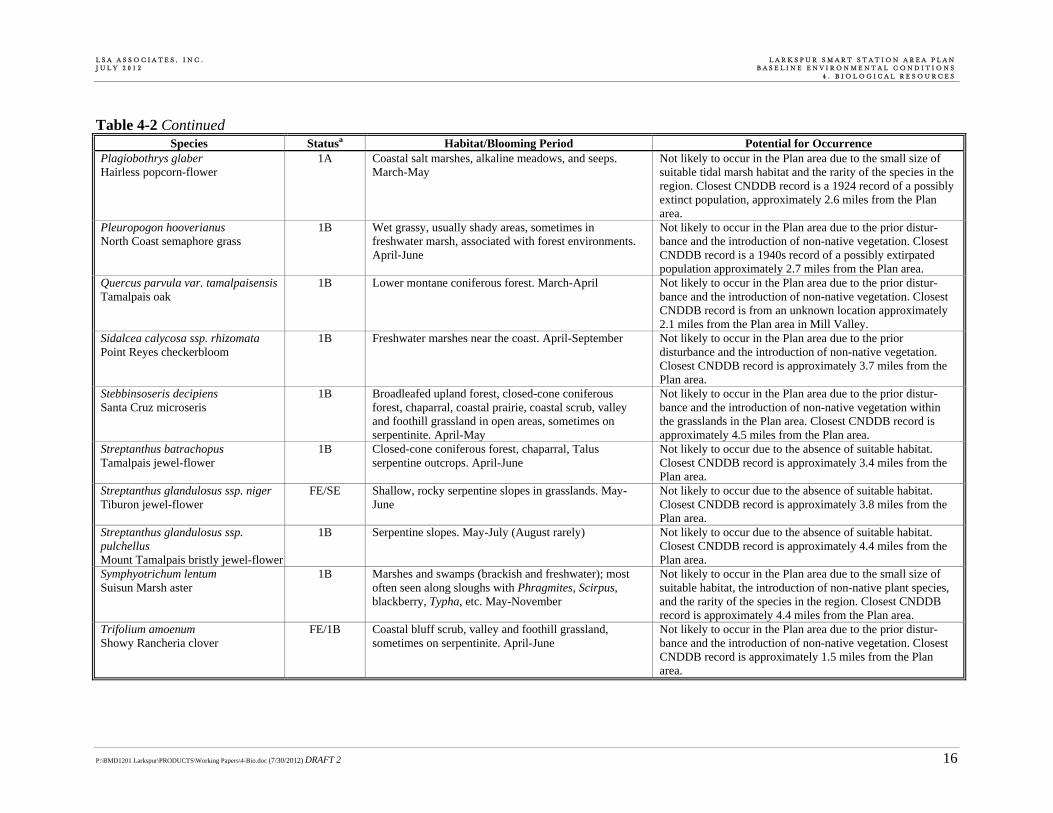
L S A A S S O C I A T E S , I N C . L A R K S P U R S M A R T S T A T I O N A R E A P L A N J U L Y 2 0 1 2 B A S E L I N E E N V I R O N M E N T A L C O N D I T I O N S 4 . B I O L O G I C A L R E S O U R C E S
Table 4-2 Continued
P:\BMD1201 Larkspur\PRODUCTS\Working Papers\4-Bio.doc (7/30/2012) DRAFT 2 16
Species Statusa Habitat/Blooming Period Potential for Occurrence Plagiobothrys glaber Hairless popcorn-flower
1A Coastal salt marshes, alkaline meadows, and seeps. March-May
Not likely to occur in the Plan area due to the small size of suitable tidal marsh habitat and the rarity of the species in the region. Closest CNDDB record is a 1924 record of a possibly extinct population, approximately 2.6 miles from the Plan area.
Pleuropogon hooverianus North Coast semaphore grass
1B Wet grassy, usually shady areas, sometimes in freshwater marsh, associated with forest environments. April-June
Not likely to occur in the Plan area due to the prior distur-bance and the introduction of non-native vegetation. Closest CNDDB record is a 1940s record of a possibly extirpated population approximately 2.7 miles from the Plan area.
Quercus parvula var. tamalpaisensis Tamalpais oak
1B Lower montane coniferous forest. March-April Not likely to occur in the Plan area due to the prior distur-bance and the introduction of non-native vegetation. Closest CNDDB record is from an unknown location approximately 2.1 miles from the Plan area in Mill Valley.
Sidalcea calycosa ssp. rhizomata Point Reyes checkerbloom
1B Freshwater marshes near the coast. April-September Not likely to occur in the Plan area due to the prior disturbance and the introduction of non-native vegetation. Closest CNDDB record is approximately 3.7 miles from the Plan area.
Stebbinsoseris decipiens Santa Cruz microseris
1B Broadleafed upland forest, closed-cone coniferous forest, chaparral, coastal prairie, coastal scrub, valley and foothill grassland in open areas, sometimes on serpentinite. April-May
Not likely to occur in the Plan area due to the prior distur-bance and the introduction of non-native vegetation within the grasslands in the Plan area. Closest CNDDB record is approximately 4.5 miles from the Plan area.
Streptanthus batrachopus Tamalpais jewel-flower
1B Closed-cone coniferous forest, chaparral, Talus serpentine outcrops. April-June
Not likely to occur due to the absence of suitable habitat. Closest CNDDB record is approximately 3.4 miles from the Plan area.
Streptanthus glandulosus ssp. niger Tiburon jewel-flower
FE/SE Shallow, rocky serpentine slopes in grasslands. May-June
Not likely to occur due to the absence of suitable habitat. Closest CNDDB record is approximately 3.8 miles from the Plan area.
Streptanthus glandulosus ssp. pulchellus Mount Tamalpais bristly jewel-flower
1B Serpentine slopes. May-July (August rarely) Not likely to occur due to the absence of suitable habitat. Closest CNDDB record is approximately 4.4 miles from the Plan area.
Symphyotrichum lentum Suisun Marsh aster
1B Marshes and swamps (brackish and freshwater); most often seen along sloughs with Phragmites, Scirpus, blackberry, Typha, etc. May-November
Not likely to occur in the Plan area due to the small size of suitable habitat, the introduction of non-native plant species, and the rarity of the species in the region. Closest CNDDB record is approximately 4.4 miles from the Plan area.
Trifolium amoenum Showy Rancheria clover
FE/1B Coastal bluff scrub, valley and foothill grassland, sometimes on serpentinite. April-June
Not likely to occur in the Plan area due to the prior distur-bance and the introduction of non-native vegetation. Closest CNDDB record is approximately 1.5 miles from the Plan area.
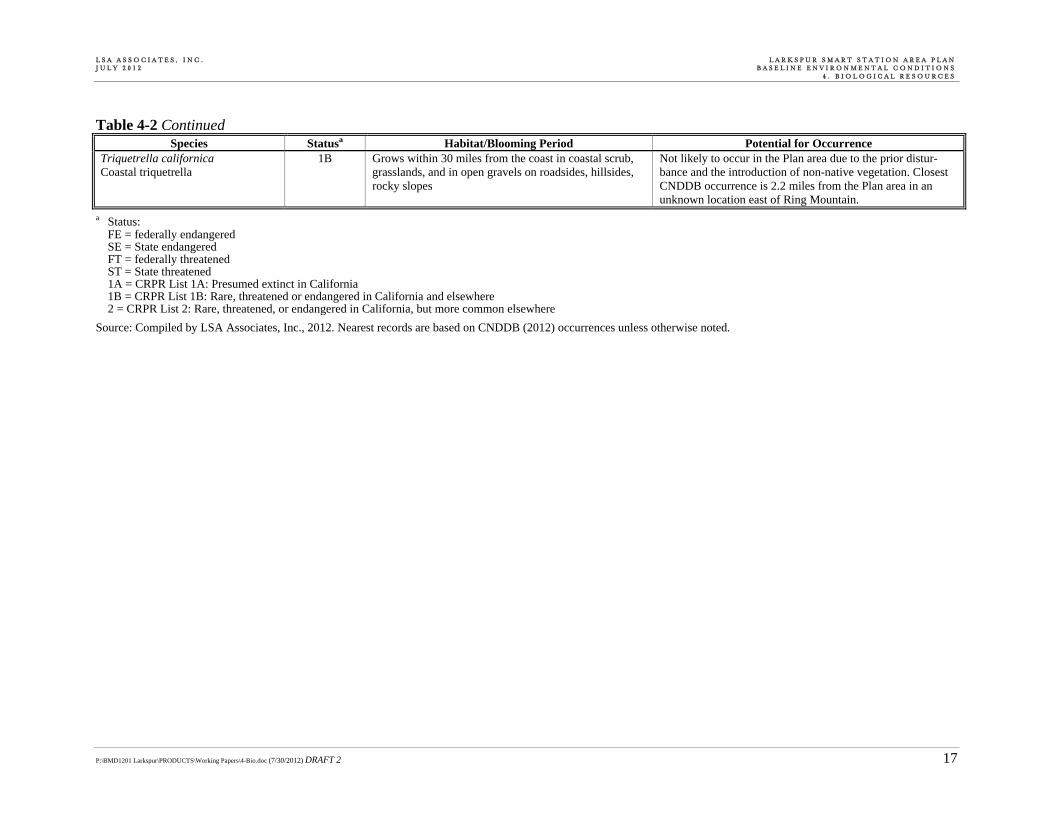
L S A A S S O C I A T E S , I N C . L A R K S P U R S M A R T S T A T I O N A R E A P L A N J U L Y 2 0 1 2 B A S E L I N E E N V I R O N M E N T A L C O N D I T I O N S 4 . B I O L O G I C A L R E S O U R C E S
Table 4-2 Continued
P:\BMD1201 Larkspur\PRODUCTS\Working Papers\4-Bio.doc (7/30/2012) DRAFT 2 17
Species Statusa Habitat/Blooming Period Potential for Occurrence Triquetrella californica Coastal triquetrella
1B Grows within 30 miles from the coast in coastal scrub, grasslands, and in open gravels on roadsides, hillsides, rocky slopes
Not likely to occur in the Plan area due to the prior distur-bance and the introduction of non-native vegetation. Closest CNDDB occurrence is 2.2 miles from the Plan area in an unknown location east of Ring Mountain.
a Status: FE = federally endangered SE = State endangered FT = federally threatened ST = State threatened 1A = CRPR List 1A: Presumed extinct in California 1B = CRPR List 1B: Rare, threatened or endangered in California and elsewhere 2 = CRPR List 2: Rare, threatened, or endangered in California, but more common elsewhere
Source: Compiled by LSA Associates, Inc., 2012. Nearest records are based on CNDDB (2012) occurrences unless otherwise noted.
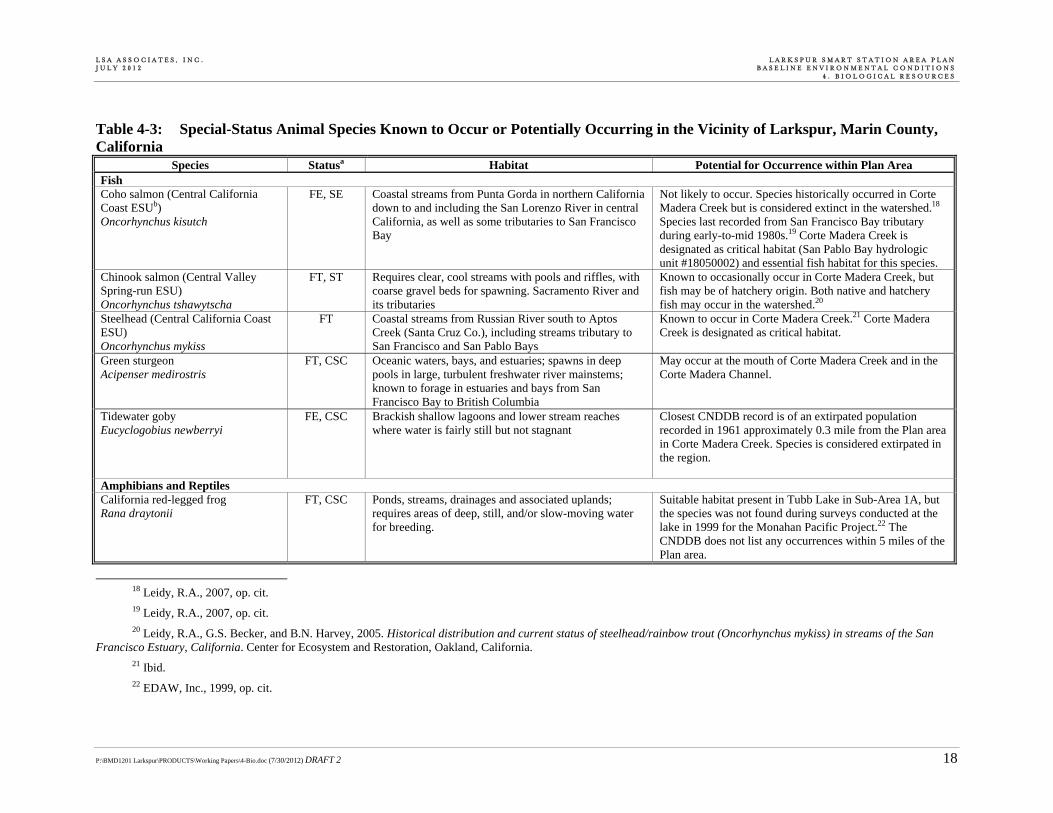
L S A A S S O C I A T E S , I N C . L A R K S P U R S M A R T S T A T I O N A R E A P L A N J U L Y 2 0 1 2 B A S E L I N E E N V I R O N M E N T A L C O N D I T I O N S 4 . B I O L O G I C A L R E S O U R C E S
P:\BMD1201 Larkspur\PRODUCTS\Working Papers\4-Bio.doc (7/30/2012) DRAFT 2 18
Table 4-3: Special-Status Animal Species Known to Occur or Potentially Occurring in the Vicinity of Larkspur, Marin County, California
Species Statusa Habitat Potential for Occurrence within Plan Area Fish Coho salmon (Central California Coast ESUb) Oncorhynchus kisutch
FE, SE Coastal streams from Punta Gorda in northern California down to and including the San Lorenzo River in central California, as well as some tributaries to San Francisco Bay
Not likely to occur. Species historically occurred in Corte Madera Creek but is considered extinct in the watershed.18 Species last recorded from San Francisco Bay tributary during early-to-mid 1980s.19 Corte Madera Creek is designated as critical habitat (San Pablo Bay hydrologic unit #18050002) and essential fish habitat for this species.
Chinook salmon (Central Valley Spring-run ESU) Oncorhynchus tshawytscha
FT, ST Requires clear, cool streams with pools and riffles, with coarse gravel beds for spawning. Sacramento River and its tributaries
Known to occasionally occur in Corte Madera Creek, but fish may be of hatchery origin. Both native and hatchery fish may occur in the watershed.20
Steelhead (Central California Coast ESU) Oncorhynchus mykiss
FT Coastal streams from Russian River south to Aptos Creek (Santa Cruz Co.), including streams tributary to San Francisco and San Pablo Bays
Known to occur in Corte Madera Creek.21 Corte Madera Creek is designated as critical habitat.
Green sturgeon Acipenser medirostris
FT, CSC Oceanic waters, bays, and estuaries; spawns in deep pools in large, turbulent freshwater river mainstems; known to forage in estuaries and bays from San Francisco Bay to British Columbia
May occur at the mouth of Corte Madera Creek and in the Corte Madera Channel.
Tidewater goby Eucyclogobius newberryi
FE, CSC Brackish shallow lagoons and lower stream reaches where water is fairly still but not stagnant
Closest CNDDB record is of an extirpated population recorded in 1961 approximately 0.3 mile from the Plan area in Corte Madera Creek. Species is considered extirpated in the region.
Amphibians and Reptiles California red-legged frog Rana draytonii
FT, CSC Ponds, streams, drainages and associated uplands; requires areas of deep, still, and/or slow-moving water for breeding.
Suitable habitat present in Tubb Lake in Sub-Area 1A, but the species was not found during surveys conducted at the lake in 1999 for the Monahan Pacific Project.22 The CNDDB does not list any occurrences within 5 miles of the Plan area.
18 Leidy, R.A., 2007, op. cit. 19 Leidy, R.A., 2007, op. cit. 20 Leidy, R.A., G.S. Becker, and B.N. Harvey, 2005. Historical distribution and current status of steelhead/rainbow trout (Oncorhynchus mykiss) in streams of the San
Francisco Estuary, California. Center for Ecosystem and Restoration, Oakland, California. 21 Ibid. 22 EDAW, Inc., 1999, op. cit.
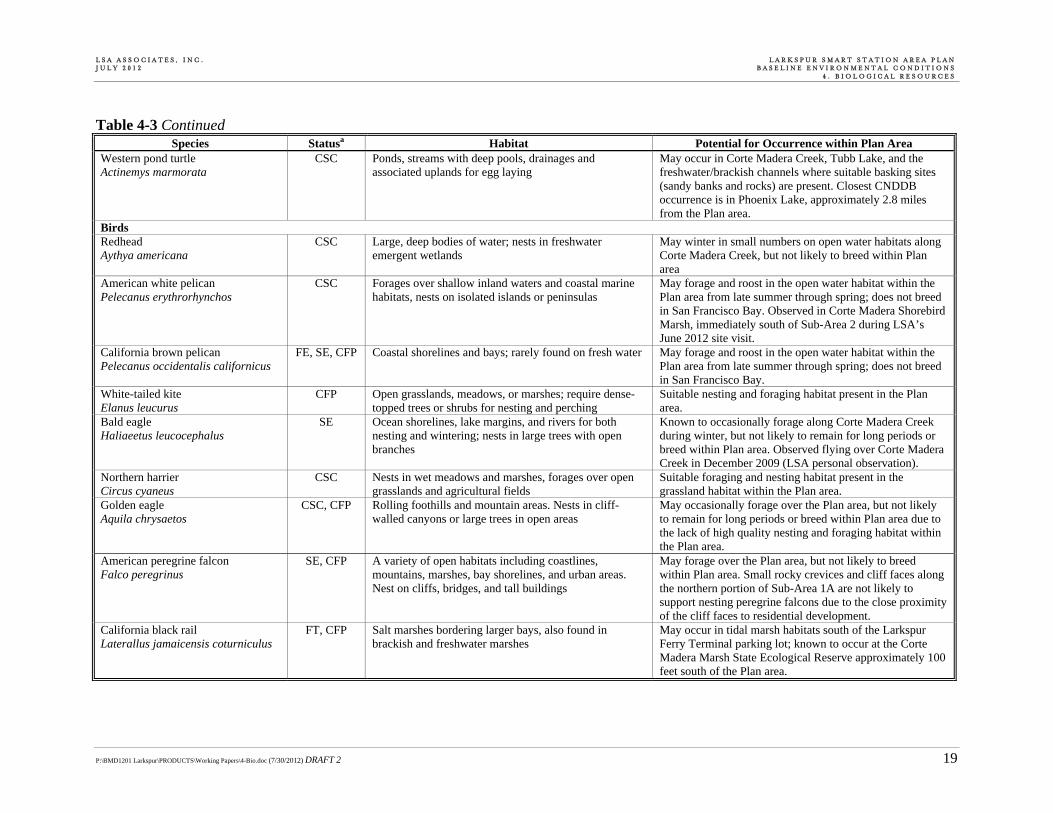
L S A A S S O C I A T E S , I N C . L A R K S P U R S M A R T S T A T I O N A R E A P L A N J U L Y 2 0 1 2 B A S E L I N E E N V I R O N M E N T A L C O N D I T I O N S 4 . B I O L O G I C A L R E S O U R C E S
Table 4-3 Continued
P:\BMD1201 Larkspur\PRODUCTS\Working Papers\4-Bio.doc (7/30/2012) DRAFT 2 19
Species Statusa Habitat Potential for Occurrence within Plan Area Western pond turtle Actinemys marmorata
CSC Ponds, streams with deep pools, drainages and associated uplands for egg laying
May occur in Corte Madera Creek, Tubb Lake, and the freshwater/brackish channels where suitable basking sites (sandy banks and rocks) are present. Closest CNDDB occurrence is in Phoenix Lake, approximately 2.8 miles from the Plan area.
Birds Redhead Aythya americana
CSC Large, deep bodies of water; nests in freshwater emergent wetlands
May winter in small numbers on open water habitats along Corte Madera Creek, but not likely to breed within Plan area
American white pelican Pelecanus erythrorhynchos
CSC Forages over shallow inland waters and coastal marine habitats, nests on isolated islands or peninsulas
May forage and roost in the open water habitat within the Plan area from late summer through spring; does not breed in San Francisco Bay. Observed in Corte Madera Shorebird Marsh, immediately south of Sub-Area 2 during LSA’s June 2012 site visit.
California brown pelican Pelecanus occidentalis californicus
FE, SE, CFP Coastal shorelines and bays; rarely found on fresh water May forage and roost in the open water habitat within the Plan area from late summer through spring; does not breed in San Francisco Bay.
White-tailed kite Elanus leucurus
CFP Open grasslands, meadows, or marshes; require dense-topped trees or shrubs for nesting and perching
Suitable nesting and foraging habitat present in the Plan area.
Bald eagle Haliaeetus leucocephalus
SE Ocean shorelines, lake margins, and rivers for both nesting and wintering; nests in large trees with open branches
Known to occasionally forage along Corte Madera Creek during winter, but not likely to remain for long periods or breed within Plan area. Observed flying over Corte Madera Creek in December 2009 (LSA personal observation).
Northern harrier Circus cyaneus
CSC Nests in wet meadows and marshes, forages over open grasslands and agricultural fields
Suitable foraging and nesting habitat present in the grassland habitat within the Plan area.
Golden eagle Aquila chrysaetos
CSC, CFP Rolling foothills and mountain areas. Nests in cliff-walled canyons or large trees in open areas
May occasionally forage over the Plan area, but not likely to remain for long periods or breed within Plan area due to the lack of high quality nesting and foraging habitat within the Plan area.
American peregrine falcon Falco peregrinus
SE, CFP A variety of open habitats including coastlines, mountains, marshes, bay shorelines, and urban areas. Nest on cliffs, bridges, and tall buildings
May forage over the Plan area, but not likely to breed within Plan area. Small rocky crevices and cliff faces along the northern portion of Sub-Area 1A are not likely to support nesting peregrine falcons due to the close proximity of the cliff faces to residential development.
California black rail Laterallus jamaicensis coturniculus
FT, CFP Salt marshes bordering larger bays, also found in brackish and freshwater marshes
May occur in tidal marsh habitats south of the Larkspur Ferry Terminal parking lot; known to occur at the Corte Madera Marsh State Ecological Reserve approximately 100 feet south of the Plan area.
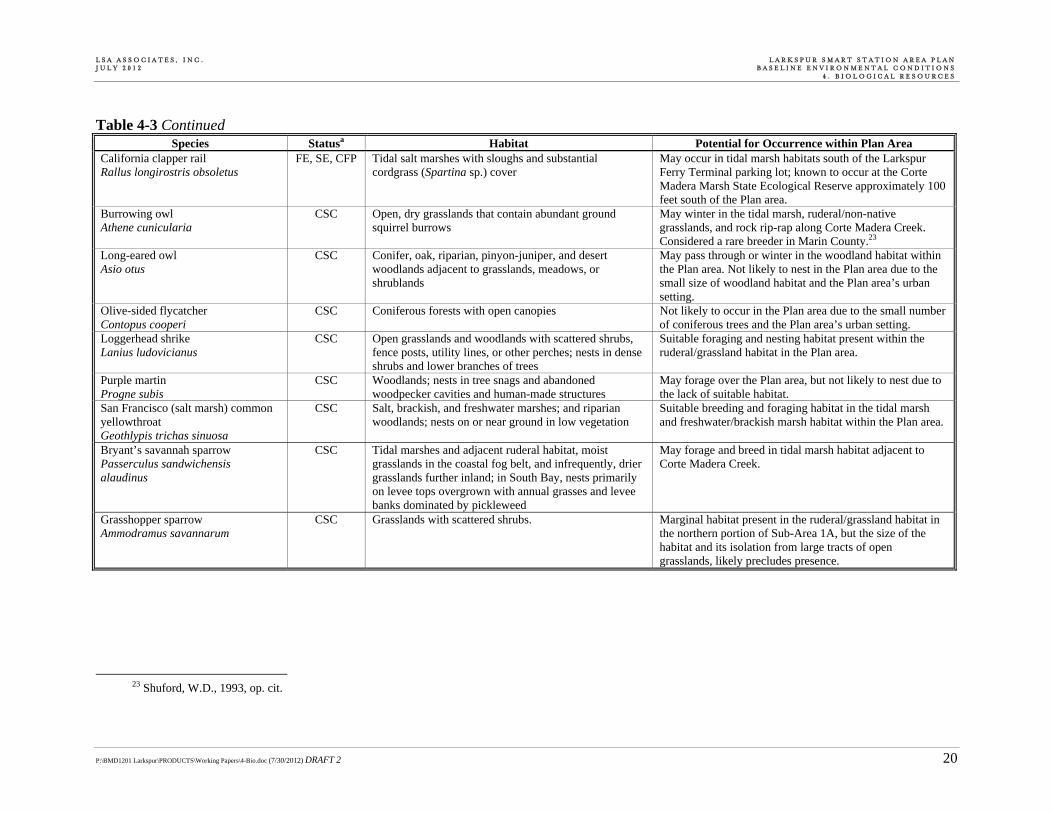
L S A A S S O C I A T E S , I N C . L A R K S P U R S M A R T S T A T I O N A R E A P L A N J U L Y 2 0 1 2 B A S E L I N E E N V I R O N M E N T A L C O N D I T I O N S 4 . B I O L O G I C A L R E S O U R C E S
Table 4-3 Continued
P:\BMD1201 Larkspur\PRODUCTS\Working Papers\4-Bio.doc (7/30/2012) DRAFT 2 20
Species Statusa Habitat Potential for Occurrence within Plan Area California clapper rail Rallus longirostris obsoletus
FE, SE, CFP Tidal salt marshes with sloughs and substantial cordgrass (Spartina sp.) cover
May occur in tidal marsh habitats south of the Larkspur Ferry Terminal parking lot; known to occur at the Corte Madera Marsh State Ecological Reserve approximately 100 feet south of the Plan area.
Burrowing owl Athene cunicularia
CSC Open, dry grasslands that contain abundant ground squirrel burrows
May winter in the tidal marsh, ruderal/non-native grasslands, and rock rip-rap along Corte Madera Creek. Considered a rare breeder in Marin County.23
Long-eared owl Asio otus
CSC Conifer, oak, riparian, pinyon-juniper, and desert woodlands adjacent to grasslands, meadows, or shrublands
May pass through or winter in the woodland habitat within the Plan area. Not likely to nest in the Plan area due to the small size of woodland habitat and the Plan area’s urban setting.
Olive-sided flycatcher Contopus cooperi
CSC Coniferous forests with open canopies Not likely to occur in the Plan area due to the small number of coniferous trees and the Plan area’s urban setting.
Loggerhead shrike Lanius ludovicianus
CSC Open grasslands and woodlands with scattered shrubs, fence posts, utility lines, or other perches; nests in dense shrubs and lower branches of trees
Suitable foraging and nesting habitat present within the ruderal/grassland habitat in the Plan area.
Purple martin Progne subis
CSC Woodlands; nests in tree snags and abandoned woodpecker cavities and human-made structures
May forage over the Plan area, but not likely to nest due to the lack of suitable habitat.
San Francisco (salt marsh) common yellowthroat Geothlypis trichas sinuosa
CSC Salt, brackish, and freshwater marshes; and riparian woodlands; nests on or near ground in low vegetation
Suitable breeding and foraging habitat in the tidal marsh and freshwater/brackish marsh habitat within the Plan area.
Bryant’s savannah sparrow Passerculus sandwichensis alaudinus
CSC Tidal marshes and adjacent ruderal habitat, moist grasslands in the coastal fog belt, and infrequently, drier grasslands further inland; in South Bay, nests primarily on levee tops overgrown with annual grasses and levee banks dominated by pickleweed
May forage and breed in tidal marsh habitat adjacent to Corte Madera Creek.
Grasshopper sparrow Ammodramus savannarum
CSC Grasslands with scattered shrubs. Marginal habitat present in the ruderal/grassland habitat in the northern portion of Sub-Area 1A, but the size of the habitat and its isolation from large tracts of open grasslands, likely precludes presence.
23 Shuford, W.D., 1993, op. cit.
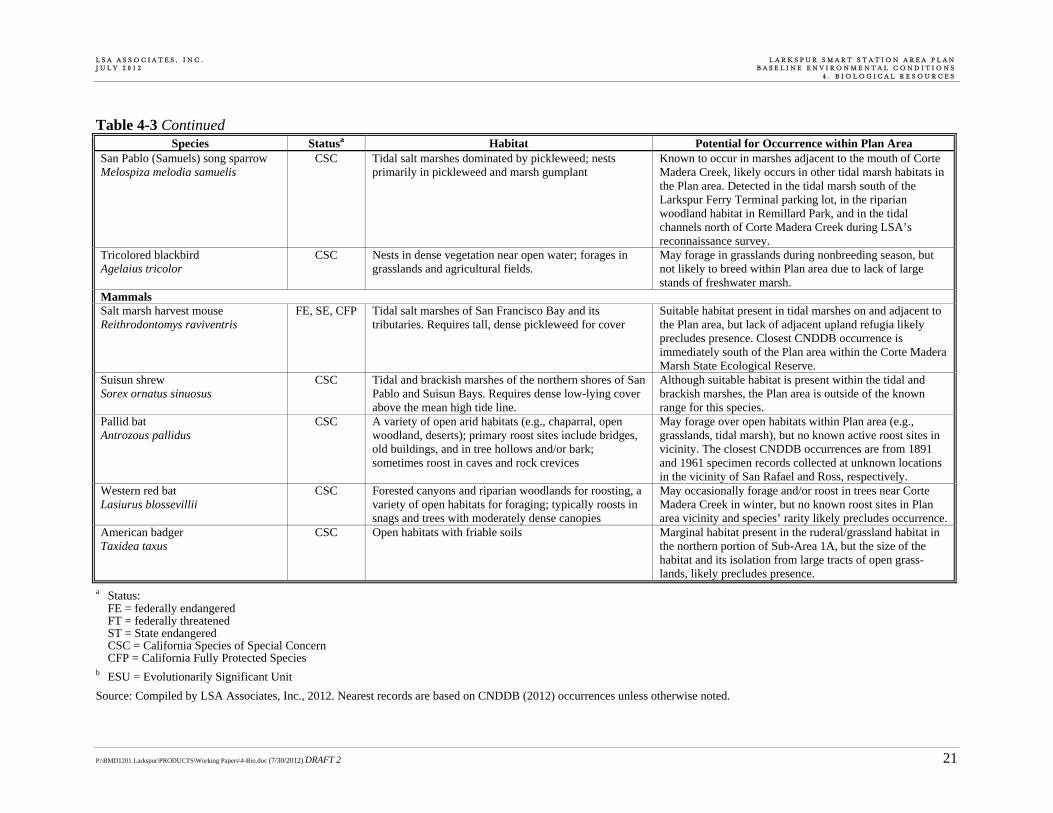
L S A A S S O C I A T E S , I N C . L A R K S P U R S M A R T S T A T I O N A R E A P L A N J U L Y 2 0 1 2 B A S E L I N E E N V I R O N M E N T A L C O N D I T I O N S 4 . B I O L O G I C A L R E S O U R C E S
Table 4-3 Continued
P:\BMD1201 Larkspur\PRODUCTS\Working Papers\4-Bio.doc (7/30/2012) DRAFT 2 21
Species Statusa Habitat Potential for Occurrence within Plan Area San Pablo (Samuels) song sparrow Melospiza melodia samuelis
CSC Tidal salt marshes dominated by pickleweed; nests primarily in pickleweed and marsh gumplant
Known to occur in marshes adjacent to the mouth of Corte Madera Creek, likely occurs in other tidal marsh habitats in the Plan area. Detected in the tidal marsh south of the Larkspur Ferry Terminal parking lot, in the riparian woodland habitat in Remillard Park, and in the tidal channels north of Corte Madera Creek during LSA’s reconnaissance survey.
Tricolored blackbird Agelaius tricolor
CSC Nests in dense vegetation near open water; forages in grasslands and agricultural fields.
May forage in grasslands during nonbreeding season, but not likely to breed within Plan area due to lack of large stands of freshwater marsh.
Mammals Salt marsh harvest mouse Reithrodontomys raviventris
FE, SE, CFP Tidal salt marshes of San Francisco Bay and its tributaries. Requires tall, dense pickleweed for cover
Suitable habitat present in tidal marshes on and adjacent to the Plan area, but lack of adjacent upland refugia likely precludes presence. Closest CNDDB occurrence is immediately south of the Plan area within the Corte Madera Marsh State Ecological Reserve.
Suisun shrew Sorex ornatus sinuosus
CSC Tidal and brackish marshes of the northern shores of San Pablo and Suisun Bays. Requires dense low-lying cover above the mean high tide line.
Although suitable habitat is present within the tidal and brackish marshes, the Plan area is outside of the known range for this species.
Pallid bat Antrozous pallidus
CSC A variety of open arid habitats (e.g., chaparral, open woodland, deserts); primary roost sites include bridges, old buildings, and in tree hollows and/or bark; sometimes roost in caves and rock crevices
May forage over open habitats within Plan area (e.g., grasslands, tidal marsh), but no known active roost sites in vicinity. The closest CNDDB occurrences are from 1891 and 1961 specimen records collected at unknown locations in the vicinity of San Rafael and Ross, respectively.
Western red bat Lasiurus blossevillii
CSC Forested canyons and riparian woodlands for roosting, a variety of open habitats for foraging; typically roosts in snags and trees with moderately dense canopies
May occasionally forage and/or roost in trees near Corte Madera Creek in winter, but no known roost sites in Plan area vicinity and species’ rarity likely precludes occurrence.
American badger Taxidea taxus
CSC Open habitats with friable soils Marginal habitat present in the ruderal/grassland habitat in the northern portion of Sub-Area 1A, but the size of the habitat and its isolation from large tracts of open grass-lands, likely precludes presence.
a Status: FE = federally endangered FT = federally threatened ST = State endangered CSC = California Species of Special Concern CFP = California Fully Protected Species
b ESU = Evolutionarily Significant Unit
Source: Compiled by LSA Associates, Inc., 2012. Nearest records are based on CNDDB (2012) occurrences unless otherwise noted.
L S A A S S O C I A T E S , I N C . L A R K S P U R S M A R T S T A T I O N A R E A P L A N J U L Y 2 0 1 2 B A S E L I N E E N V I R O N M E N T A L C O N D I T I O N S 4 . B I O L O G I C A L R E S O U R C E S
P:\BMD1201 Larkspur\PRODUCTS\Working Papers\4-Bio.doc (7/30/2012) DRAFT 2 22
Corte Madera Creek is known to support a resident steelhead population that appears to produce smolts. As recent as 1999, electrofishing surveys conducted by Friends of Corte Madera Creek found steelhead in the creek.24 Historic occurrences of steelhead were recorded within Corte Madera Creek as early as 1960.25 The portion of Corte Madera Creek within the Plan area supports migration habitat to the spawning and rearing habitat within the upper reaches of the Corte Madera Creek watershed. Corte Madera Creek is designated as critical habitat for the Central California Coast ESU of steel-head.
(2) California Red-Legged Frog (Federally Threatened). The California red-legged frog has been extirpated or nearly extirpated from 70 percent of its former range. Population declines of this species have been attributed to a variety of factors, with habitat loss and predation by non-native aquatic predators (e.g., bullfrogs, crayfish, other non-native fishes) typically implicated as the primary threats. California red-legged frogs occur in and along freshwater marshes, streams, ponds, and other semi-permanent water sources. Optimal habitat contains dense emergent or shoreline riparian vegeta-tion closely associated with deep (i.e., greater than 2.3 feet), still, or slow-moving water.26 Cattails, bulrushes, and willows provide the habitat structure that seems to be most suitable for California red-legged frogs.27 Although the species can occur in intermittent streams and ponds, they are unlikely to persist in streams in which all surface water disappears.28 Suitable breeding ponds and pools usually have a minimum depth of 20 inches, but California red-legged frogs do sometimes breed successfully in pools as shallow as 10 inches.29 Regardless of water depth, suitable breeding habitat must contain water during the entire development period for eggs and tadpoles. Reproduction for red-legged frogs is also sensitive to salinity levels in the water. The CNDDB does not list any occurrences of California red-legged frogs within 5 miles of the Plan area.30 Although no red-legged frogs were observed, the Initial Study for the Monahan Pacific Project states that suitable habitat is present in Tubb Lake (as shown in Figure 4-1).31 Red-legged frogs are not likely to occur in the Plan area’s reach of Corte Madera Creek and the Plan area’s tidal channels due to the high salinity of the water, lack of suitable breeding pools, and lack of natural streamside vegetation.
(3) Western Pond Turtle (California Species of Special Concern). Western pond turtles occur in a wide variety of aquatic habitats, including ponds, lakes, marshes, rivers, streams, and
24 Leidy, R.A., G.S. Becker, and B.N. Harvey, 2005. Historical distribution and current status of steelhead/rainbow
trout (Oncorhynchus mykiss) in streams of the San Francisco Estuary, California. Center for Ecosystem and Restoration, Oakland, California.
25 Ibid. 26 Jennings, M.R., and M.P. Hayes, 1994. Amphibian and reptile species of special concern in California. Final
report to California Department of Fish and Game, Inland Fisheries Division, Rancho Cordova. 27 Ibid. 28 Ibid. 29 Fellers, G.M., 2005. California red-legged frog. In M. Lannoo, editor. Amphibian Declines: The Conservation
Status of Unites States Species. University of California Press, Berkeley. 30 California Department of Fish and Game, 2012, op. cit. 31 EDAW, Inc., 1999, op. cit.
L S A A S S O C I A T E S , I N C . L A R K S P U R S M A R T S T A T I O N A R E A P L A N J U L Y 2 0 1 2 B A S E L I N E E N V I R O N M E N T A L C O N D I T I O N S 4 . B I O L O G I C A L R E S O U R C E S
P:\BMD1201 Larkspur\PRODUCTS\Working Papers\4-Bio.doc (7/30/2012) DRAFT 2 23
irrigation ditches that typically have a rocky or muddy bottom and contain stands of aquatic vegeta-tion.32 The presence or absence of pond turtles at a given aquatic site is largely dependent on the availability of suitable basking sites and adjacent upland habitat for egg-laying (e.g., sandy banks or grassy open fields) and over-wintering. Nests are typically dug in dry substrate with a high clay or silt fraction since the female moistens the site where she will excavate the nest prior to egg-laying.33 Hatchlings require shallow water habitat with relatively dense submergent or short emergent vegetation in which to forage.34 Western pond turtles have been recorded at Phoenix Lake, approximately 2.8 miles west of Plan area. Corte Madera Creek and the tidal channels within the Plan area may provide habitat for pond turtles, especially where suitable basking sites (sandy banks and/or rocks) are present. However, surrounding residential development has likely resulted in the elimination of suitable upland habitat for egg-laying, reducing the likelihood that the species is present in the Plan area.
(4) White-tailed Kite (California Fully Protected Species). Most white-tailed kites in California occur west of the Sierra Nevada in lowlands and foothills, where they are often seen year-round.35 This species nests in densely foliaged trees and large shrubs located near suitable foraging habitat (e.g., grasslands, marshes, agricultural fields). Preferred prey items include California voles and mice. The ruderal/non-native annual grassland and tidal marsh habitats provide foraging habitat for white-tailed kites, and the scattered trees and large shrubs provide suitable nest sites.
(5) Northern Harrier (California Species of Special Concern). Northern harriers are widespread in California, although they have become uncommon in the southern part of the State.36 Their preferred habitats are freshwater wetlands and salt marshes, although they are also commonly found over grasslands and agricultural fields.37 Harriers breed from mid-March to September, building their nests on the ground. Suitable foraging and/or nesting habitat for northern harriers is present in the ruderal/non-native annual grassland and tidal marsh habitats in the Plan area.
(6) California Black Rail (Federally Threatened; California Fully Protected Species). Around the San Francisco Bay Estuary, California black rails primarily inhabit tidal salt marsh dominated by pickleweed, but also occupy brackish marshes dominated by bulrush. California black
32 Stebbins, R.C., 2003. A field guide to western amphibians and reptiles. Third edition. Houghton Mifflin Company,
Boston, Massachusetts. 33 Holland, D.C., 1991. Status and reproductive dynamics of a population of western pond turtles (Clemmys
marmorata) in Klickitat County, Washington, in 1991. Unpublished report prepared for the Washington Department of Wildlife, Olympia. Cited in Jennings and Hayes 1994, op. cit.
34 Holland, D.C., 1994. Personal communication cited in Jennings and Hayes 1994, op. cit. 35 Peeters, H., and P. Peeters, 2005. Raptors of California. University of California Press, Berkeley. 36 Ibid. 37 Ibid.
L S A A S S O C I A T E S , I N C . L A R K S P U R S M A R T S T A T I O N A R E A P L A N J U L Y 2 0 1 2 B A S E L I N E E N V I R O N M E N T A L C O N D I T I O N S 4 . B I O L O G I C A L R E S O U R C E S
P:\BMD1201 Larkspur\PRODUCTS\Working Papers\4-Bio.doc (7/30/2012) DRAFT 2 24
rails prefer tidal marshes but apparently will use high marshlands during “wet” years.38 Black rails build nests in tall grasses or marsh vegetation during the spring, with most nests constructed of pickleweed and placed on or slightly above the ground. California black rails have been detected south of the Plan area within the Corte Madera Marsh State Ecological Reserve and in the tidal marsh habitat along Corte Madera Creek just east of the Plan area.39 This species may inhabit the tidal marsh habitat south of the Larkspur Ferry Terminal parking lot and in other tidal marsh habitat within the Plan area.
(7) California Clapper Rail (Federally and State Endangered; California Fully Protected Species). This secretive species prefers tidal salt marshes dominated by pickleweed and cordgrass with adjacent areas of high marsh cover dominated by pickleweed, gumplant, saltgrass, alkali heath, and/or fleshy jaumea (Jaumea carnosa).40 Clapper rails also occupy tidal brackish marshes dominated by bulrush. The California subspecies of clapper rail is now restricted to the tidal marshlands around the San Francisco, San Pablo, and Suisun Bays. A Bay-wide survey in the early 1970s estimated a total population of between 4,000 and 6,000 birds.41 The most recent population estimate for California clapper rails was approximately 1,040 to 1,264 individuals in San Francisco Bay.42 Although habitat loss is implicated in population declines, predation of rails by the introduced red fox (Vulpes vulpes) is another major threat. Clapper rails have been detected in the tidal marsh habitat along Corte Madera Creek.43 This species may inhabit the tidal marsh habitat south of the Larkspur Ferry Terminal parking lot in other tidal marsh habitat within the Plan area.
(8) Burrowing Owl (California Species of Special Concern). Burrowing owls have undergone substantial population declines throughout central and coastal California, primarily due to habitat loss.44 This species occurs in open, well-drained grasslands with abundant small mammal burrows, particularly those of California ground squirrels. Burrowing owls also prefer areas with
38 Trulio, L.A., and J.G. Evens, 2000. California Black Rail. Pages 341-345 in Goals Project. Baylands Ecosystem
Species and Community Profiles: Life histories and environmental requirements of key plants, fish, and wildlife. Prepared by the San Francisco Bay Area Wetlands Ecosystem Goals Project. P. R. Olofson, ed. San Francisco Bay Regional Water Quality Control Board, Oakland, California.
39 California Department of Fish and Game, 2012, op. cit. 40 Albertson, J.D., and J.G. Evens, 2000. California Clapper Rail. Pages 332-340 in Goals Project. Baylands
Ecosystem Species and Community Profiles: Life histories and environmental requirements of key plants, fish, and wildlife. Prepared by the San Francisco Bay Area Wetlands Ecosystem Goals Project. P. R. Olofson, ed. San Francisco Bay Regional Water Quality Control Board, Oakland, California.
41 Gill, Jr., R., 1979. Status and distribution of the California clapper rail (Rallus longirostris obsoletus). California Fish and Game 65:36–49.
42 Albertson, J. D., and J. G. Evens, 2000, op. cit. 43 California Department of Fish and Game, 2012, op. cit. 44 DeSante, D.F., et al., 2007. A census of Burrowing Owls in central California in 1991. Pages 38–48 in J. L. Lincer
and K. Steenhof, eds. The Burrowing Owl, Its Biology and Management: Including the Proceedings of the First International Symposium. Raptor Research Report No. 9.
L S A A S S O C I A T E S , I N C . L A R K S P U R S M A R T S T A T I O N A R E A P L A N J U L Y 2 0 1 2 B A S E L I N E E N V I R O N M E N T A L C O N D I T I O N S 4 . B I O L O G I C A L R E S O U R C E S
P:\BMD1201 Larkspur\PRODUCTS\Working Papers\4-Bio.doc (7/30/2012) DRAFT 2 25
short vegetation so they can easily scan their surroundings and spot potential predators.45 In human-modified areas, burrowing owls often use burrows under the edges of concrete, asphalt, rubble piles, and riprap.46 Burrowing owls may winter in the tidal marsh and associated rock rip-rap along Corte Madera Creek and in the ruderal/non-native annual grasslands within the Plan area. They are considered a very rare breeder in Marin County.47
(9) Loggerhead Shrike (California Species of Special Concern). Loggerhead shrikes occur in open habitats with scattered shrubs, trees, posts, fences, utility lines, and other perches. Shrikes primarily nest in the lower branches of dense shrubs and tall trees, although they have also been observed nesting in buildings and debris piles. They feed primarily on large insects, small birds, and mammals. The ruderal/non-native annual grasslands and scattered trees and shrubs provide suitable habitat conditions for loggerhead shrikes. Shrikes may also occasionally forage over tidal marshes, if suitable perches are nearby.
(10) San Francisco (Salt Marsh) Common Yellowthroat (California Species of Special Concern). The common yellowthroat is a widely distributed warbler in North America, occurring in wetlands, moist thickets, and grasslands. The San Francisco subspecies is restricted to riparian habitat, brackish marsh, freshwater marsh, tidal salt marsh, and adjacent grassland and ruderal vegetation along the margins of San Francisco Bay. Despite the common name, most salt marsh common yellowthroats breed in brackish or freshwater marshes. Within the Plan area, suitable habitat for salt marsh common yellowthroats is present in the brackish or freshwater marsh vegetation along the northern shoreline of Corte Madera Channel and Corte Madera Creek. In particular the freshwater marsh and riparian woodland habitat at Remillard Park (shown in Figure 4-1) provides suitable habitat for this species.
(11) Bryant's Savannah Sparrow (California Species of Special Concern). Bryant’s savannah sparrow is a California endemic restricted to a narrow coastal strip between Humboldt Bay south to the Morro Bay area, with its primary center of abundance appearing to be the San Francisco Bay area.48 This subspecies occupies low, tidally influenced habitats, adjacent ruderal areas, moist grasslands within and just above the fog belt, and infrequently drier grasslands. Around San Francisco
45 Zarn, M., 1974. Burrowing owl (Spetyto cunicularia hypugaea). Habitat management series for unique or
endangered species. Technical Report T-N-250. Bureau of Land Management, Denver, Colorado. 46 Barclay, J., 2001. Burrowing owl species summary. Appendix IV in Colonel Allensworth State Historic Park Final
Burrowing Owl Mitigation and Management Plan. Albion Environmental, Inc., Santa Cruz, California. March. 47 Shuford, W.D., 1993, op. cit. 48 Fitton, S.D., 2008. Bryant’s Savannah Sparrow (Passerculus sandwichensis alaudinus). Pages 382–387 in
Shuford, W.D., and T. Gardali, eds. California Bird Species of Special Concern: A ranked assessment of species, subspecies, and distinct populations of birds of immediate conservation concern in California. Studies of Western Birds 1. Western Field Ornithologists, Camarillo, California, and California Department of Fish and Game, Sacramento.
L S A A S S O C I A T E S , I N C . L A R K S P U R S M A R T S T A T I O N A R E A P L A N J U L Y 2 0 1 2 B A S E L I N E E N V I R O N M E N T A L C O N D I T I O N S 4 . B I O L O G I C A L R E S O U R C E S
P:\BMD1201 Larkspur\PRODUCTS\Working Papers\4-Bio.doc (7/30/2012) DRAFT 2 26
Bay, Bryant’s savannah sparrows primarily occur in the transition zone between tidal marsh and upland; such habitats are typically dominated by pickleweed or saltgrass.49
(12) Samuels (San Pablo) Song Sparrow (California Species of Special Concern). This subspecies of the widely distributed song sparrow is restricted to the tidal marshes and adjacent uplands around the San Pablo Bay portion of the San Francisco Bay. They occur primarily in tidal salt marshes, but may also nest or forage in other shoreline habitats such as seasonal wetlands, intertidal mudflats, and adjacent uplands.50 Favored nesting substrates include gumplant and cordgrass adjacent to tidal sloughs, although they also occur in perennial pepperweed and bulrush. During LSA’s reconnaissance survey, Samuels song sparrows were detected in the tidal marsh south of the Larkspur Ferry Terminal parking lot, in the riparian woodland habitat in Remillard Park, in the tidal channels north of Corte Madera Creek.
(13) Salt Marsh Harvest Mouse (Federally and State Endangered; California Fully Protected Species). Salt marsh harvest mouse are endemic to the tidal salt marshes of the San Francisco Bay Estuary. This species primarily occurs in marshes dominated by pickleweed, but also uses adjacent upland habitats during high tides. The presence of adequate peripheral halophyte plant cover adjacent to the pickleweed-dominated marsh plain is an important habitat component for this species, which depends on such cover for refuge from terrestrial predators during extremely high tides. Within the Plan area, salt marsh harvest mice have been recorded at the Corte Madera Marsh State Ecological Reserve and along the northern shoreline of Corte Madera Creek.51 The mice recorded along the north bank of the mouth of Corte Madera Creek are from specimens collected in the 1940s and 1960s when upland refugia was more abundant. This species is likely extirpated from the northern shoreline of Corte Madera Creek due to the lack of adjacent upland habitat. c. Sensitive Habitats. Special plant communities and jurisdictional waters are described below.
(1) Special Plant Communities. The CDFG tracks the occurrences of “special” plant communities that are either known or believed to be of high priority for inventory in the CNDDB. These plant communities are listed in the CDFG publication List of California Terrestrial Natural Communities Recognized by the California Natural Diversity Database.52 These communities are sometimes addressed by lead or trustee agencies in CEQA documents, but generally are not afforded the same protection as CNPS List 1B and 2 plant species. Many special plant communities support special-status plants and animals and are addressed under CEQA as habitat for those species.
49 Fitton, S.D., 2008, op. cit. 50 Cogswell, H., 2000. Song Sparrow. Pages 374–385 in Goals Project. Baylands Ecosystem Species and
Community Profiles: Life histories and environmental requirements of key plants, fish, and wildlife. Prepared by the San Francisco Bay Area Wetlands Ecosystem Goals Project. P. R. Olofson, ed. San Francisco Bay Regional Water Quality Control Board, Oakland, California.
51 California Department of Fish and Game, 2012, op. cit. 52 California Department of Fish and Game, 2003. List of California Terrestrial Natural Communities Recognized by
the California Natural Diversity Data Base. Wildlife and Habitat Data Analysis Branch, Vegetation Classification and Mapping Program, California Department of Fish and Game, Sacramento.
L S A A S S O C I A T E S , I N C . L A R K S P U R S M A R T S T A T I O N A R E A P L A N J U L Y 2 0 1 2 B A S E L I N E E N V I R O N M E N T A L C O N D I T I O N S 4 . B I O L O G I C A L R E S O U R C E S
P:\BMD1201 Larkspur\PRODUCTS\Working Papers\4-Bio.doc (7/30/2012) DRAFT 2 27
The following special plant communities occur within a 5-mile radius of the Plan area: northern coastal salt marsh, coastal brackish marsh, and coastal terrace prairie. The latter two are known to occur in Marin County and but are unlikely to occur in the Plan area. Northern coastal salt marsh is dominated by native halophytes and usually supports an abundance of native forbs and potentially supports special-status plants. This community occurs along the northern shoreline Corte Madera Creek within the Plan area.
(2) Jurisdictional Waters. Although a formal jurisdictional delineation of wetlands and other waters of the U.S. and State was not conducted for the Plan area, several features can be assumed to fall under U.S. Army Corps of Engineers (Corps) and Regional Water Quality Control Board (RWQCB) jurisdiction pursuant to Sections 401 and 404 of the federal Clean Water Act and the Porter-Cologne Water Quality Control Act. Features within the Plan area that would likely be considered wetlands or other waters of the U.S. by the Corps include Corte Madera Channel, Corte Madera Creek; Tubb Lake and the associated drainage channel; tidal marshes along the northern shoreline of Corte Madera Creek; and the tidal channels and associated wetlands north of Corte Madera Creek. Additional other waters and wetlands may be present in other undeveloped portions of the Plan area, but would require site-specific evaluations to be fully identified. Tubb Lake and all the creeks and channels within the Plan area are also expected to fall under CDFG jurisdiction pursuant to Section 1602 of the California Fish and Game Code. Unlike Corps jurisdic-tion, however, which is limited to the Ordinary High Water Mark, CDFG jurisdiction over these features extends to the top of bank, or the outer dripline of riparian vegetation, whichever is greater. C. REGULATORY CONTEXT
Biological resources within the Plan area are subject to agency jurisdiction and regulations, as described below. 1. Endangered Species Act
The U.S. Fish and Wildlife Service (USFWS) has jurisdiction over federally listed threatened and endangered plant and animal species. The federal Endangered Species Act (ESA) and its implement-ing regulations prohibit the take of any fish or wildlife species that is federally listed as threatened or endangered without prior approval pursuant to either Section 7 or Section 10 of the ESA. ESA defines “take” as “harass, harm, pursue, hunt, shoot, wound, kill, trap, capture, or collect, or to attempt to engage in any such conduct.” Federal regulation 50 CFR 17.3 defines the term “harass” as an inten-tional or negligent act that creates the likelihood of injuring wildlife by annoying it to such an extent as to significantly disrupt normal behavior patterns such as breeding, feeding, or sheltering (50 CFR §17.3). Furthermore, federal regulation 50 CFR 17.3 defines “harm” as an act that either kills or injures a listed species. By definition, “harm” includes habitat modification or degradation that actually kills or injures a listed species by significantly impairing essential behavior patterns such as breeding, spawning, rearing, migrating, feeding, or sheltering (50 CFR 217.12). Section 10(a) of the ESA establishes a process for obtaining an incidental take permit that authorizes nonfederal entities to incidentally take federally listed wildlife or fish. Incidental take is defined by
L S A A S S O C I A T E S , I N C . L A R K S P U R S M A R T S T A T I O N A R E A P L A N J U L Y 2 0 1 2 B A S E L I N E E N V I R O N M E N T A L C O N D I T I O N S 4 . B I O L O G I C A L R E S O U R C E S
P:\BMD1201 Larkspur\PRODUCTS\Working Papers\4-Bio.doc (7/30/2012) DRAFT 2 28
ESA as take that is “incidental to, and not the purpose of, the carrying out of an otherwise lawful activity.” Preparation of a habitat conservation plan, generally referred to as an HCP, is required for all Section 10(a) permit applications. The USFWS and National Oceanic and Atmospheric Admini-stration’s National Marine Fisheries Service (NOAA Fisheries Service) have joint authority under the ESA for administering the incidental take program. NOAA Fisheries Service has jurisdiction over anadromous fish species and USFWS has jurisdiction over all other fish and wildlife species. Section 7 of the ESA requires all federal agencies to ensure that any action they authorize, fund, or carry out is not likely to jeopardize the continued existence of any species listed under the ESA, or result in the destruction or adverse modification of its habitat. Federal agencies are also required to minimize impacts to all listed species resulting from their actions, including issuance or permits or funding. Section 7 requires consideration of the indirect effects of a project, effects on federally listed plants, and effects on critical habitat (ESA requires that the USFWS identify critical habitat to the maximum extent that it is prudent and determinable when a species is listed as threatened or endan-gered). This consultation results in a Biological Opinion prepared by the USFWS stating whether implementation of the HCP will result in jeopardy to any HCP Covered Species or will adversely modify critical habitat and the measures necessary to avoid or minimize effects to listed species. Although federally listed animals are legally protected from harm no matter where they occur, the Section 9 of the ESA provides protection for endangered plants by prohibiting the malicious destruc-tion on federal land and other “take” that violates State law. Protection for plants not living on federal lands is provided by the California Endangered Species Act. 2. Clean Water Act
The Corps is responsible under Section 404 of the Clean Water Act to regulate the discharge of fill material into waters of the U.S. These waters, and their lateral limit, are defined in 33 CFR Part 328.3(a) and include streams that are tributaries to navigable waters and their adjacent wetlands. The lateral limits of jurisdiction for a non-tidal stream are measured at the line of the Ordinary High Water Mark (33 CFR Part 328.3[e]) or the limit of adjacent wetlands (33 CFR Part 328.3[b]). Any perma-nent extension of the limits of an existing water of the U.S., whether natural or man-made, results in a similar extension of Corps jurisdiction (33 CFR Part 328.5). Waters of the U.S. fall into two broad categories: wetlands and other waters. Other waters include waterbodies and watercourses generally lacking plant cover such as rivers, streams, lakes, springs, ponds, coastal waters, and estuaries. Wetlands are aquatic habitats that support hydrophytic wetland plants and include marshes, wet meadows, seeps, floodplains, basins, and other areas experiencing extended seasonal soil saturation. Seasonally or intermittently inundated features, such as seasonal ponds, ephemeral streams, and tidal marshes, are categorized as wetlands if they have hydric soils and support wetland plant communities. Seasonally inundated waterbodies or watercourses that do not exhibit wetland characteristics are classified as other waters of the U.S. Waters and wetlands that cannot trace a continuous hydrologic connection to a navigable water of the U.S. are not tributary to waters of the U.S. These are termed “isolated wetlands.” Isolated wetlands are jurisdictional when their destruction or degradation can affect interstate or foreign commerce (33 CFR Part 328.3[a]). The Corps may or may not take jurisdiction over isolated wetlands depending on the specific circumstances.
L S A A S S O C I A T E S , I N C . L A R K S P U R S M A R T S T A T I O N A R E A P L A N J U L Y 2 0 1 2 B A S E L I N E E N V I R O N M E N T A L C O N D I T I O N S 4 . B I O L O G I C A L R E S O U R C E S
P:\BMD1201 Larkspur\PRODUCTS\Working Papers\4-Bio.doc (7/30/2012) DRAFT 2 29
In general, a project proponent must obtain a Section 404 permit from the Corps before placing fill or grading in wetlands or other waters of the U.S. Prior to issuing the permit, the Corps is required to consult with the USFWS under Section 7 of the ESA if the project may affect federally listed species. All Corps permits require water quality certification under Section 401 of the Clean Water Act. In the San Francisco Bay Area, this regulatory program is administered by the San Francisco Bay RWQCB. Project proponents who propose to fill wetlands or other waters of the U.S. must apply for water quality certification from the RWQCB. The RWQCB has adopted a policy requiring mitigation for any loss of wetland, streambed, or other jurisdictional area. 3. Migratory Bird Treaty Act
The federal Migratory Bird Treaty Act (MBTA) prohibits the taking, hunting, killing, selling, pur-chasing, etc. of migratory birds, parts of migratory birds, or their eggs and nests. As used in the MBTA, the term “take” is defined as “to pursue, hunt, shoot, capture, collect, kill, or attempt to pursue, hunt, shoot, capture, collect, or kill, unless the context otherwise requires.” Most bird species native to North America are covered by this act. 4. California Endangered Species Act
The CDFG has jurisdiction over State-listed endangered, threatened, and rare plant and animal species under the California Endangered Species Act (CESA). CESA is similar to the federal ESA both in process and substance; it is intended to provide additional protection to threatened and endangered species in California. Species may be listed as threatened or endangered under both acts (in which case the provisions of both State and federal laws apply) or under only one act. A candidate species is one that the Fish and Game Commission has formally noticed as being under review by CDFG for addition to the State list. Candidate species are protected by the provisions of CESA. 5. California Environmental Quality Act
The California Environmental Quality Act (CEQA) applies to “projects” proposed to be undertaken or requiring approval by State and local government agencies. Projects are defined as having the potential to have physical impact on the environment. Under Section 15380 of CEQA, a species not included on any formal list “shall nevertheless be considered rare or endangered if the species can be shown by a local agency to meet the criteria” for listing. With sufficient documentation, a species could be shown to meet the definition of rare or endangered under CEQA and be considered a “de facto” rare or endangered species. 6. California Fish and Game Code
The CDFG is also responsible for enforcing the California Fish and Game Code, which contains several provisions potentially relevant to construction projects. For example, Section 1602 of the Fish and Game Code governs the issuance of Lake and Streambed Alteration Agreements by the CDFG. Lake or Streambed Alteration Agreements are required whenever project activities substantially divert or obstruct the natural flow or substantially change the bed, channel, or bank of any river, stream, or lake designated as such by the CDFG. The Fish and Game Code also lists animal species designated as Fully Protected or Protected, which may not be taken or possessed at any time. The CDFG does not issue licenses or permits for take of
L S A A S S O C I A T E S , I N C . L A R K S P U R S M A R T S T A T I O N A R E A P L A N J U L Y 2 0 1 2 B A S E L I N E E N V I R O N M E N T A L C O N D I T I O N S 4 . B I O L O G I C A L R E S O U R C E S
P:\BMD1201 Larkspur\PRODUCTS\Working Papers\4-Bio.doc (7/30/2012) DRAFT 2 30
these species except for necessary scientific research, habitat restoration/species recovery actions, or live capture and relocation pursuant to a permit for the protection of livestock. Fully Protected species are listed in Sections 3511 (birds), 4700 (mammals), 5050 (reptiles and amphibians), and 5515 (fish) of the Fish and Game Code, while Protected amphibians and reptiles are listed in Chapter 5, Sections 41 and 42. Section 3503 of the Fish and Game Code prohibits the take, possession, or needless destruction of the nest or eggs of any bird. Subsection 3503.5 specifically prohibits the take, possession, or destruction of any birds in the orders Falconiformes (hawks and eagles) or Strigiformes (owls) and their nests. These provisions, along with the federal MBTA, essentially serve to protect nesting native birds. Non-native species, including European starling, house sparrow, and rock pigeon, are not afforded any protection under the MBTA or California Fish and Game Code. 7. Porter-Cologne Water Quality Control Act
Under this Act (California Water Code Sections 13000–14920), the RWQCB is authorized to regulate the discharge of waste that could affect the quality of the State’s waters. The RWQCB asserts juris-diction over isolated waters and wetlands, as well as waters and wetlands that are regulated by the Corps. Therefore, even if a project does not require a federal permit, it still requires review and approval by the RWQCB. When reviewing applications, the RWQCB focuses on ensuring that projects do not adversely affect the “beneficial uses” associated with waters of the State. In most cases, the RWQCB seeks to protect these beneficial uses by requiring the integration of waste discharge requirements (WDRs) into projects that will require discharge into waters of the State. For most construction projects, the RWQCB requires the use of construction and post-construction Best Management Practices (BMPs). 8. McAteer-Petris Act
The McAteer-Petris Act and Suisun Marsh Preservation Act were adopted to protect San Francisco Bay and Suisun Marsh as great natural resources for the benefit of the public and to encourage development compatible with this protection. The San Francisco Bay Conservation and Development Commission (BCDC) was established to carry out this Act. The two primary goals of the BCDC are (1) to prevent the unnecessary filling of San Francisco Bay, and (2) to increase public access to and along the Bay shoreline. BCDC approval is required for all projects within 100 feet of the Bay shoreline, as well as projects that propose any filling or dredging within Bay waters. 9. Other Statutes, Codes, and Policies Affording Species Protection
The CDFG maintains an administrative list of Species of Special Concern (SSC), defined as a “species, subspecies, or distinct population of an animal native to California that currently satisfies one or more of the following (not necessarily mutually exclusive) criteria:
Is extirpated from the State, or, in the case of birds, in its primary seasonal or breeding role;
Is listed as federally, but not State-, threatened or endangered;
Meets the State definition of threatened or endangered but has not formally been listed;
Is experiencing, or formerly experienced, serious (noncyclical) population declines or range retractions (not reversed) that, if continued or resumed, could qualify it for State threatened or endangered status;
L S A A S S O C I A T E S , I N C . L A R K S P U R S M A R T S T A T I O N A R E A P L A N J U L Y 2 0 1 2 B A S E L I N E E N V I R O N M E N T A L C O N D I T I O N S 4 . B I O L O G I C A L R E S O U R C E S
P:\BMD1201 Larkspur\PRODUCTS\Working Papers\4-Bio.doc (7/30/2012) DRAFT 2 31
Has naturally small populations exhibiting high susceptibility to risk from any factor(s), that if realized, could lead to declines that would qualify it for State threatened or endangered status.”
The CDFG’s Nongame Wildlife Program is responsible for producing and updating SSC publications for mammals,53 birds,54 and reptiles and amphibians.55 The Fisheries Branch is responsible for updates to the Fish SSC document and list.56 Section 15380 of the CEQA Guidelines clearly indicates that SSC should be included in an analysis of project impacts if they can be shown to meet the criteria of sensitivity outline therein. In contrast to species listed under the federal ESA or CESA, however, SSC have no formal legal status. The California Native Plant Society (CNPS), a non-governmental conservation organization, has developed five lists of plant species of concern in California. Vascular plants included on these lists are defined as follows:
List 1A: Plants presumed extinct in California List 1B: Plants rare, threatened, or endangered in California and elsewhere List 2: Plants rare, threatened, or endangered in California, but more common elsewhere List 3: Plants about which more information is needed – a review list List 4: Plants of limited distribution – a watch list
Although the CNPS is not a regulatory agency and plants on these lists have no formal regulatory protection, plants appearing on Lists 1B and 2 may be considered to meet the definition of endan-gered, rare, or threatened species under Section 15380(d) of CEQA (see above), and impacts to these species may be considered “significant.” 10. Larkspur General Plan Policies
The following policies from the 1990 General Plan are related to biological resources: Environmental Resources Element Goal 1: Preserve and enhance a variety of open space features including ridgelines, the wetlands along the Bay and the creeks, wildlife habitats, view corridors, and other amenities which contribute to a sense of openness in Larkspur. Goal 2: Maintain Corte Madera and Southern Heights Ridges as community separators.
Policy a: Work with local and regional open space agencies and interest groups to develop an open space preservation strategy.
53 Williams, D.F, 1986. Mammalian species of special concern in California. California Department of Fish and
Game, Sacramento. 54 Shuford, W.D., and T. Gardali, eds., 2008. California Bird Species of Special Concern: A ranked assessment of
species, subspecies, and distinct populations of birds of immediate conservation concern in California. Studies of Western Birds 1. Western Field Ornithologists, Camarillo, California, and California Department of Fish and Game, Sacramento.
55 Jennings, M.R., and M.P. Hayes, 1994, op. cit. 56 Moyle, P.B., et al., 1995. Fish species of special concern in California: Second edition. Final report to California
Department of Fish and Game, Inland Fisheries Division, Rancho Cordova. Contract No. 2128IF.
L S A A S S O C I A T E S , I N C . L A R K S P U R S M A R T S T A T I O N A R E A P L A N J U L Y 2 0 1 2 B A S E L I N E E N V I R O N M E N T A L C O N D I T I O N S 4 . B I O L O G I C A L R E S O U R C E S
P:\BMD1201 Larkspur\PRODUCTS\Working Papers\4-Bio.doc (7/30/2012) DRAFT 2 32
o Action Program 1: Map and rank open space features as to their value to the community.
o Action Program 2: Support the efforts of the Marin County Open Space District to acquire more open space in the Larkspur Sphere of Influence.
o Action Program 3: Identify financing mechanisms to acquire privately held lands designated for future open space.
o Action Program 4: Educate school children and the general public about Larkspur’s open space resources.
Policy b: Designate and preserve in open space the areas so shown on the General Plan Land Use map. They include those of the Northridge that are above the 350-foot elevation, Baltimore canyon, the Piedmont and Redwood Avenue areas, Big and Little King Mountains and their saddle area, the Tubb Lake water-shed, and the ridge above the old quarries on the San Quentin Peninsula.
Policy c: Designate and preserve in Shoreline/Marsh Conservation area the wetlands along Corte Madera Creek and at Piper Park, Redwood High School, and the Larkspur Ferry Terminal, and the shoreline between East Sir Francis Drake Boulevard and the Bay waters.
o Action Program 5: Designate and preserve in Shoreline/Marsh Conservation area the wetlands along Corte Madera Creek and at Piper Park, Redwood High School, and the Larkspur Ferry Terminal, and the shoreline between East Sir Francis Drake Boulevard and the Bay waters.
Policy d: Allow low-intensity development on hillsides and near Corte Madera Creek only if the design preserves natural features, such as significant stands of trees, forested hillsides, riparian vegetation, marshlands, wildlife habitats, ridgelines, and buffer zones.
Policy e: Encourage the use of cluster site plans for large parcels of land provided the design will not be detrimental to the character and scale of the community.
o Action Program 6: Require new development to preserve some natural area.
o Action Program 7: If a development proposal requires the removal of trees or other vegetation of significant resource value or adversely impacts a wetlands area (as defined in implementing ordinances), require the developer to replace the lost resources.
o Action Program 8: Avoid development in areas which contain rare or endangered species of plants or animals.
Goal 3: Provide reasonable access to open space areas and trails without adversely impacting natural habitats.
Policy h: Seek a balance between the recreational aspects of open space and the need to protect wildlife and fragile vegetation from intrusion by humans and domestic animals.
o Action Program 12: Provide a buffer zone between natural habitats and human use areas (such as paths), and clearly mark the boundaries. Place restrictions on access to these sensitive areas by pets.
o Action Program 13: Provide hiking trails to connect Tubb Lake with the ridge top, Larkspur Landing, and Sir Francis Drake Boulevard.
Policy i: Seek to balance the needs for community safety with the goal for protection of the environment.
o Action Program 14: When dredging Corte Madera Creek, protect the wetlands along the creek.
o Action Program 15: Plan future development of the ferry terminal so as to minimize impact on nearby creek and marshland habitats.
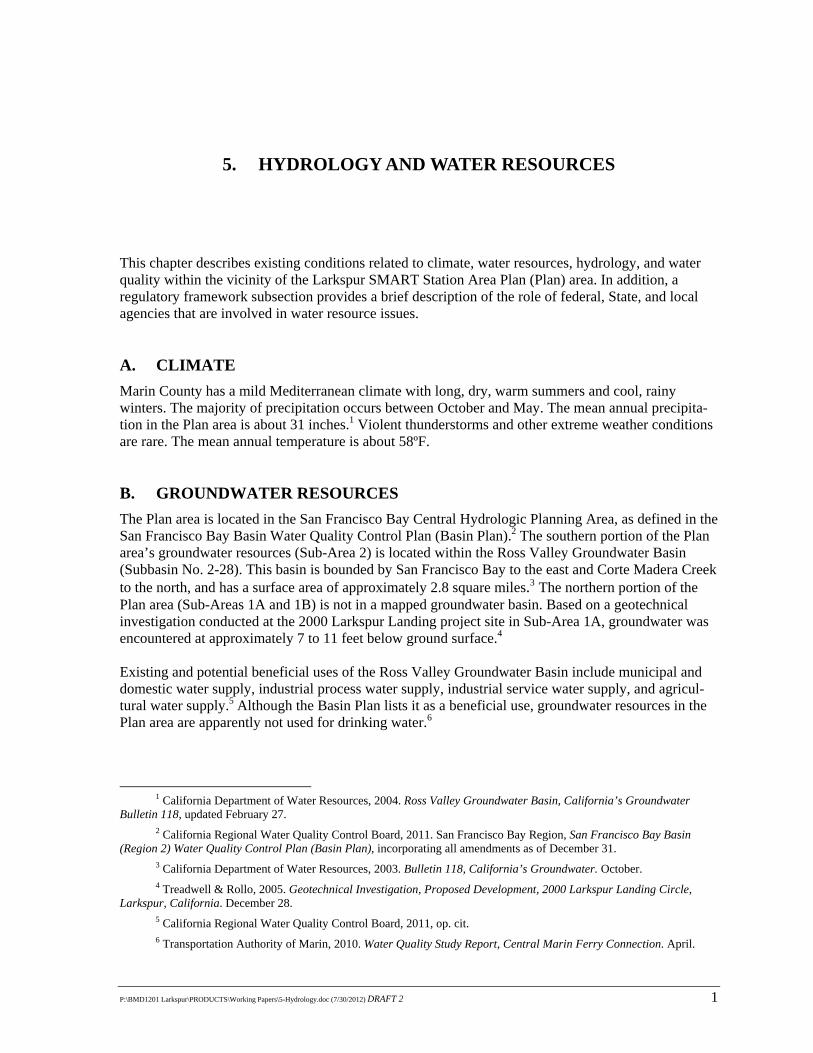
P:\BMD1201 Larkspur\PRODUCTS\Working Papers\5-Hydrology.doc (7/30/2012) DRAFT 2 1
5. HYDROLOGY AND WATER RESOURCES
This chapter describes existing conditions related to climate, water resources, hydrology, and water quality within the vicinity of the Larkspur SMART Station Area Plan (Plan) area. In addition, a regulatory framework subsection provides a brief description of the role of federal, State, and local agencies that are involved in water resource issues. A. CLIMATE
Marin County has a mild Mediterranean climate with long, dry, warm summers and cool, rainy winters. The majority of precipitation occurs between October and May. The mean annual precipita-tion in the Plan area is about 31 inches.1 Violent thunderstorms and other extreme weather conditions are rare. The mean annual temperature is about 58ºF. B. GROUNDWATER RESOURCES
The Plan area is located in the San Francisco Bay Central Hydrologic Planning Area, as defined in the San Francisco Bay Basin Water Quality Control Plan (Basin Plan).2 The southern portion of the Plan area’s groundwater resources (Sub-Area 2) is located within the Ross Valley Groundwater Basin (Subbasin No. 2-28). This basin is bounded by San Francisco Bay to the east and Corte Madera Creek to the north, and has a surface area of approximately 2.8 square miles.3 The northern portion of the Plan area (Sub-Areas 1A and 1B) is not in a mapped groundwater basin. Based on a geotechnical investigation conducted at the 2000 Larkspur Landing project site in Sub-Area 1A, groundwater was encountered at approximately 7 to 11 feet below ground surface.4 Existing and potential beneficial uses of the Ross Valley Groundwater Basin include municipal and domestic water supply, industrial process water supply, industrial service water supply, and agricul-tural water supply.5 Although the Basin Plan lists it as a beneficial use, groundwater resources in the Plan area are apparently not used for drinking water.6
1 California Department of Water Resources, 2004. Ross Valley Groundwater Basin, California’s Groundwater
Bulletin 118, updated February 27. 2 California Regional Water Quality Control Board, 2011. San Francisco Bay Region, San Francisco Bay Basin
(Region 2) Water Quality Control Plan (Basin Plan), incorporating all amendments as of December 31. 3 California Department of Water Resources, 2003. Bulletin 118, California’s Groundwater. October. 4 Treadwell & Rollo, 2005. Geotechnical Investigation, Proposed Development, 2000 Larkspur Landing Circle,
Larkspur, California. December 28. 5 California Regional Water Quality Control Board, 2011, op. cit. 6 Transportation Authority of Marin, 2010. Water Quality Study Report, Central Marin Ferry Connection. April.
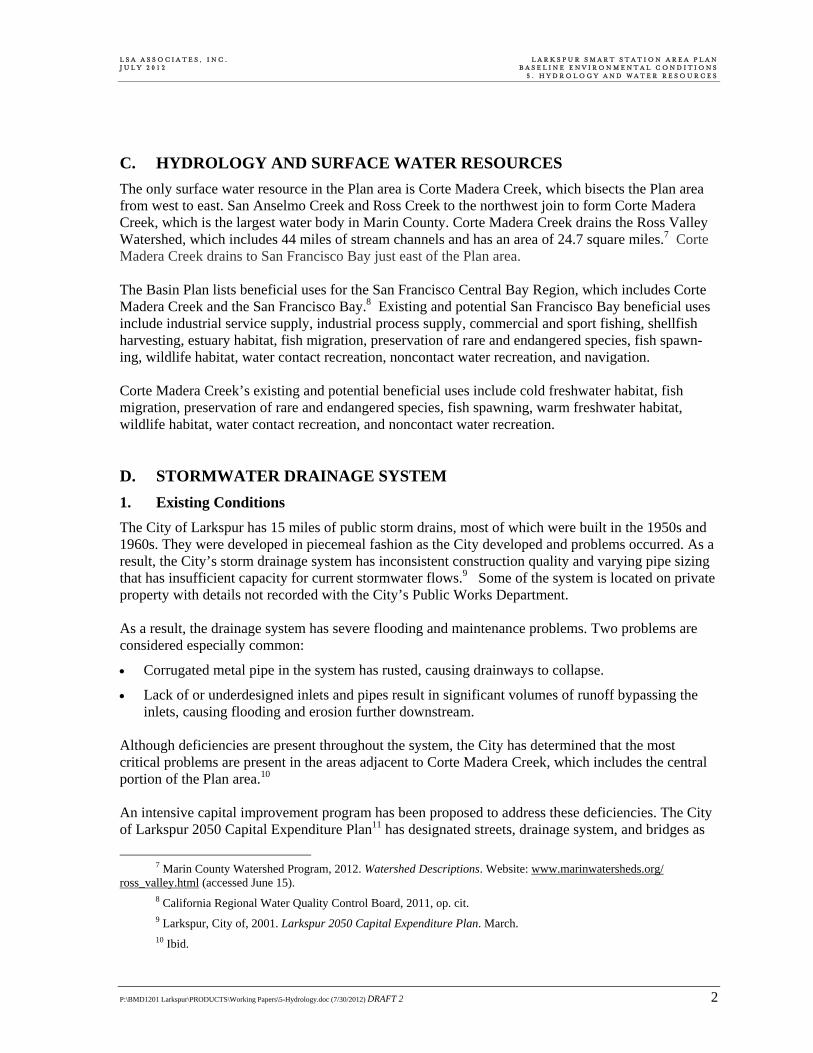
L S A A S S O C I A T E S , I N C . L A R K S P U R S M A R T S T A T I O N A R E A P L A N J U L Y 2 0 1 2 B A S E L I N E E N V I R O N M E N T A L C O N D I T I O N S 5 . H Y D R O L O G Y A N D W A T E R R E S O U R C E S
P:\BMD1201 Larkspur\PRODUCTS\Working Papers\5-Hydrology.doc (7/30/2012) DRAFT 2 2
C. HYDROLOGY AND SURFACE WATER RESOURCES
The only surface water resource in the Plan area is Corte Madera Creek, which bisects the Plan area from west to east. San Anselmo Creek and Ross Creek to the northwest join to form Corte Madera Creek, which is the largest water body in Marin County. Corte Madera Creek drains the Ross Valley Watershed, which includes 44 miles of stream channels and has an area of 24.7 square miles.7 Corte Madera Creek drains to San Francisco Bay just east of the Plan area. The Basin Plan lists beneficial uses for the San Francisco Central Bay Region, which includes Corte Madera Creek and the San Francisco Bay.8 Existing and potential San Francisco Bay beneficial uses include industrial service supply, industrial process supply, commercial and sport fishing, shellfish harvesting, estuary habitat, fish migration, preservation of rare and endangered species, fish spawn-ing, wildlife habitat, water contact recreation, noncontact water recreation, and navigation. Corte Madera Creek’s existing and potential beneficial uses include cold freshwater habitat, fish migration, preservation of rare and endangered species, fish spawning, warm freshwater habitat, wildlife habitat, water contact recreation, and noncontact water recreation. D. STORMWATER DRAINAGE SYSTEM
1. Existing Conditions
The City of Larkspur has 15 miles of public storm drains, most of which were built in the 1950s and 1960s. They were developed in piecemeal fashion as the City developed and problems occurred. As a result, the City’s storm drainage system has inconsistent construction quality and varying pipe sizing that has insufficient capacity for current stormwater flows.9 Some of the system is located on private property with details not recorded with the City’s Public Works Department. As a result, the drainage system has severe flooding and maintenance problems. Two problems are considered especially common:
Corrugated metal pipe in the system has rusted, causing drainways to collapse.
Lack of or underdesigned inlets and pipes result in significant volumes of runoff bypassing the inlets, causing flooding and erosion further downstream.
Although deficiencies are present throughout the system, the City has determined that the most critical problems are present in the areas adjacent to Corte Madera Creek, which includes the central portion of the Plan area.10 An intensive capital improvement program has been proposed to address these deficiencies. The City of Larkspur 2050 Capital Expenditure Plan11 has designated streets, drainage system, and bridges as
7 Marin County Watershed Program, 2012. Watershed Descriptions. Website: www.marinwatersheds.org/
ross_valley.html (accessed June 15). 8 California Regional Water Quality Control Board, 2011, op. cit. 9 Larkspur, City of, 2001. Larkspur 2050 Capital Expenditure Plan. March. 10 Ibid.
L S A A S S O C I A T E S , I N C . L A R K S P U R S M A R T S T A T I O N A R E A P L A N J U L Y 2 0 1 2 B A S E L I N E E N V I R O N M E N T A L C O N D I T I O N S 5 . H Y D R O L O G Y A N D W A T E R R E S O U R C E S
P:\BMD1201 Larkspur\PRODUCTS\Working Papers\5-Hydrology.doc (7/30/2012) DRAFT 2 3
its second priority and proposes replacement of approximately 4.5 miles of drain pipe over the next 20 years. 2. Storm Drain Design Standard
The City uses the 10-year storm event as the basis of its storm drain system design, which is consis-tent with nearby municipalities and standard practice of the industry. This criterion corresponds to the flow level that would allow minimum standing water but prevent flooding of streets and private properties when runoff is collected and conveyed by ditches, storm drain inlets, and pipes without impediment. E. FLOODING
Flooding, flood zones, sea level rise, and other flooding conditions are described below. 1. Historic Flood Events
Four historic floods, resulting in significant flood damage, have occurred in Larkspur during the last 60 years. These four floods occurred in December 1955, April 1958, January 1973, and January 1982.12 During the 1955 and 1982 floods, the area was designated a disaster area and received federal aid. Many streets were flooded and residents had to be evacuated. During the 1982 flood, most of the damage was due to mudslides which were caused by extreme precipitation. Another significant flood, which began on December 31, 2005, prompted the creation of the Ross Valley Watershed Flood Protection and Watershed Program to develop a comprehensive strategy to address the causes and consequences of flooding in the region. The program is led by the County of Marin Department of Public Works and includes the City of Larkspur and towns of Fairfax, Ross, and San Anselmo. 2. Localized Flooding
As noted above, under Storm Water Drainage System, localized flooding occurs in many parts of the City due to inadequate drainage systems, with the most significant flooding near Corte Madera Creek, which includes the central portion of the Plan area. 3. FEMA Flood Zones
Sub-Area 2 and the southern portion of Sub-Areas 1A and 1B, near Corte Madera Creek, are located in the 100-year flood zone, as determined by FEMA.13 Flood zones are shown on Figure 5-1. Portions of Sub-Area 1A are shown in Zone VE, a coastal high hazard zone where wave action and/or high velocity water can cause structural damage during the base flood. Portions of Sub-Area 1B and Sub-Area 2 are shown in Zone AE, an area with a 1.0 percent annual chance of flooding where base flood
11 Ibid. 12 Transportation Authority of Marin, 2010. Location Hydraulic Study, Central Marin Ferry Connection. April. 13 It should be noted that FEMA is currently updating its flood maps within the Larkspur area.
L S A A S S O C I A T E S , I N C . L A R K S P U R S M A R T S T A T I O N A R E A P L A N J U L Y 2 0 1 2 B A S E L I N E E N V I R O N M E N T A L C O N D I T I O N S 5 . H Y D R O L O G Y A N D W A T E R R E S O U R C E S
P:\BMD1201 Larkspur\PRODUCTS\Working Papers\5-Hydrology.doc (7/30/2012) DRAFT 2 4
elevations have been determined. The base flood elevation for both zones was determined to be 9 feet above sea-level.14 4. Tidal Flooding
When heavy rains coincide with unusually high tides, tidal flooding can occur. Low-lying areas close to Corte Madera Creek are particularly susceptible. A combination of low barometric pressure, winds, and rain can raise tide levels by as much as 3 feet. If the tide level exceeds the height of the Creek banks, which is possible during severe events, traditional responses to flooding such as pumping are ineffective until the tide recedes. As part of the Larkspur 2050 Capital Expenditure Plan, the City plans to implement a system of levees, floodwalls, pumps, and flood control gates that would prevent tidal flooding. 5. Tsunamis and Seiches
A tsunami is a large ocean wave generated by an earthquake in or near the ocean. A seiche is an earth-quake-generated wave within an enclosed body of water, such as a reservoir or lake. According to tsunami information maps produced by the California Emergency Management Agency (CalEMA), in a worst-case scenario, most of Sub-Zone 1A, the southwestern portion of Sub-Zone 1B, and all of Sub-Zone 2 could be inundated during a tsunami.15 The inundation map is presented as Figure 5-2. This inundation map represents the worst-case scenario, intended for evacuation planning only. CalEMA plans to prepare tsunami hazard maps for land use planning purposes sometime in the future. No large enclosed bodies of water, likely to generate a seiche, are located in the Plan area vicinity. 6. Sea Level Rise
A predicted rise in sea levels will exacerbate already existing coastal flooding hazards. Over the last few decades, the rate of sea level rise has been accelerating. Between 1961 and 2003, global sea level rose by an average of 0.07 inch per year, while from 1993 to 2003 the rate has increased to 0.12 inch per year.16 The San Francisco Bay Plan from the San Francisco Bay Conservation and Development Commission (BCDC)17 anticipates a rise in Bay waters of 16 inches by 2050 and 55 inches by 2100. The BCDC in partnership with the federal National Oceanic and Atmospheric Administration (NOAA) is sponsoring the Adapting to Rising Tides (ART) pilot program which aims to aid local governments in planning for sea level rise over the next century. The ART policy model is anticipated to be com-pleted in late 2012.
14 Federal Emergency Management Agency, 2009. Flood Insurance Rate Map, Marin County, California and
Incorporated Areas, Map Number 06051C0459D, Panel 459 of 531, Effective Date May 4. 15 California Department of Conservation, Emergency Management Agency, 2009. Tsunami Inundation Map for
Emergency Planning, San Rafael Quadrangle and San Quentin Quadrangle. July 1. 16 San Francisco Bay Conservation and Development Commission (BCDC), 2011, Living with a Rising Bay:
Vulnerability and Adaptation in San Francisco Bay and on its Shoreline, October 6. 17 Ibid.
s
GREENBRAE BOARDWALKRIVIERA CIRCLE
RED
WO
OD
HIG
HW
AY
WORNUM DRIVE
LARKSPUR LANDING
VIA LA BRISA
Sandra Marker Trail
Cal P
ark
Hill
Tunn
el B
ike
Rout
e
SIR FRANCIS DRAKE BLVD.
GREENBRAE BOARDWALKRIVIERA CIRCLE
LUCKY D
RIVE
FIFER AVE
RED
WO
OD
HIG
HW
AY
WORNUM DRIVE
Sandra Marker Trail
TAM
AL V
ISTA BLV
D.
VIA L
A C
UM
BRE
LARKSPUR LANDING
101
101
101
SIR FRANCIS DRAKE BLVD.
VIA LA BRISA
BRETANO WAY
Cal P
ark
Hill
Tunn
el B
ike
Rout
e
DOHERTY DRIVE
Corte Madera Creek
High Canal
Lark
spur
Cre
ek
San Francisco Bay
Corte Madera Creek
High Canal
Lark
spur
Cre
ek
San Francisco Bay
SAN RAFAEL
COUNTY OF MARIN
COUNTY OF MARINSAN RAFAEL
LARKSPUR
LARKSPUR
CORTE MADERA
COUNTY OF
MARIN
SAN RAFAEL
CORTE MADERA
COUNTY OF MARIN
COUNTY OF
MARIN
COUNTY OF MARINSAN RAFAEL
LARKSPUR
LARKSPUR
LA C
UES
TRA
DR.
ELIS
EO D
R.
BARR
Y WAY
ROUTE 20
ROUTE
20
LOS C
ERROS DR.
S. ELISEO DR.
STUDY AREA BOUNDARYLEGEND
CITY BOUNDARY
LARKSPUR FERRY TERMINAL
SMART STATION LOCATION s
CITY OF LARKSPUR SMART STATION AREA PLAN
0 300 600 1200’
AREA PLAN
1200’
STUDY AREA
FIGURE 5-1
SOURCES: FEMA, 2009; BMS DESIGN GROUP; LSA ASSOCIATES, INC., 2012.
I:\BMD1201 Larkspur SMART\figures\Fig_5-1.ai (7/5/12)
Larkspur SMART Station Area Plan EIR100 Year Flood Zone
s
100-Year Flood Zone (approximate location)
Plan Area Boundary
SMART Station Location
Larkspur Ferry Terminal
City Boundaryfeet
12000 600
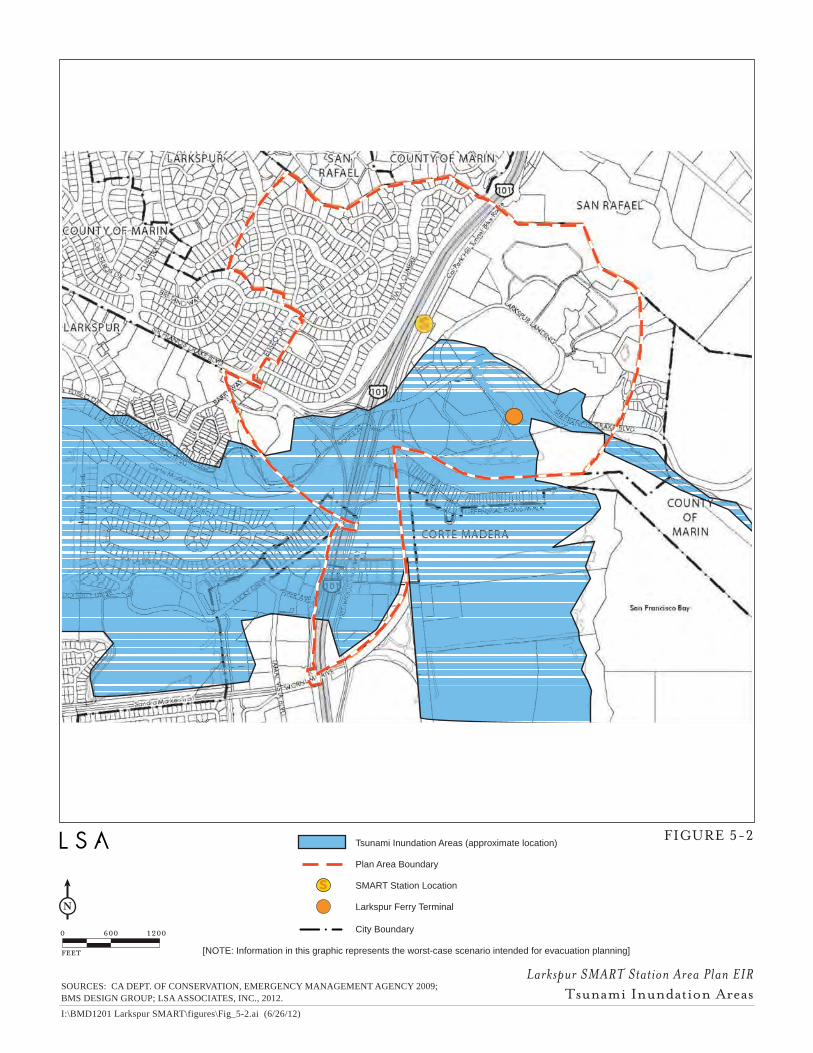
s
Tsunami Inundation Areas (approximate location)
Plan Area Boundary
SMART Station Location
Larkspur Ferry Terminal
City Boundary
[NOTE: Information in this graphic represents the worst-case scenario intended for evacuation planning]feet
12000 600
Larkspur SMART Station Area Plan EIRTsunami Inundation Areas
SOURCES: CA DEPT. OF CONSERVATION, EMERGENCY MANAGEMENT AGENCY 2009;BMS DESIGN GROUP; LSA ASSOCIATES, INC., 2012.
I:\BMD1201 Larkspur SMART\figures\Fig_5-2.ai (6/26/12)
FIGURE 5-2
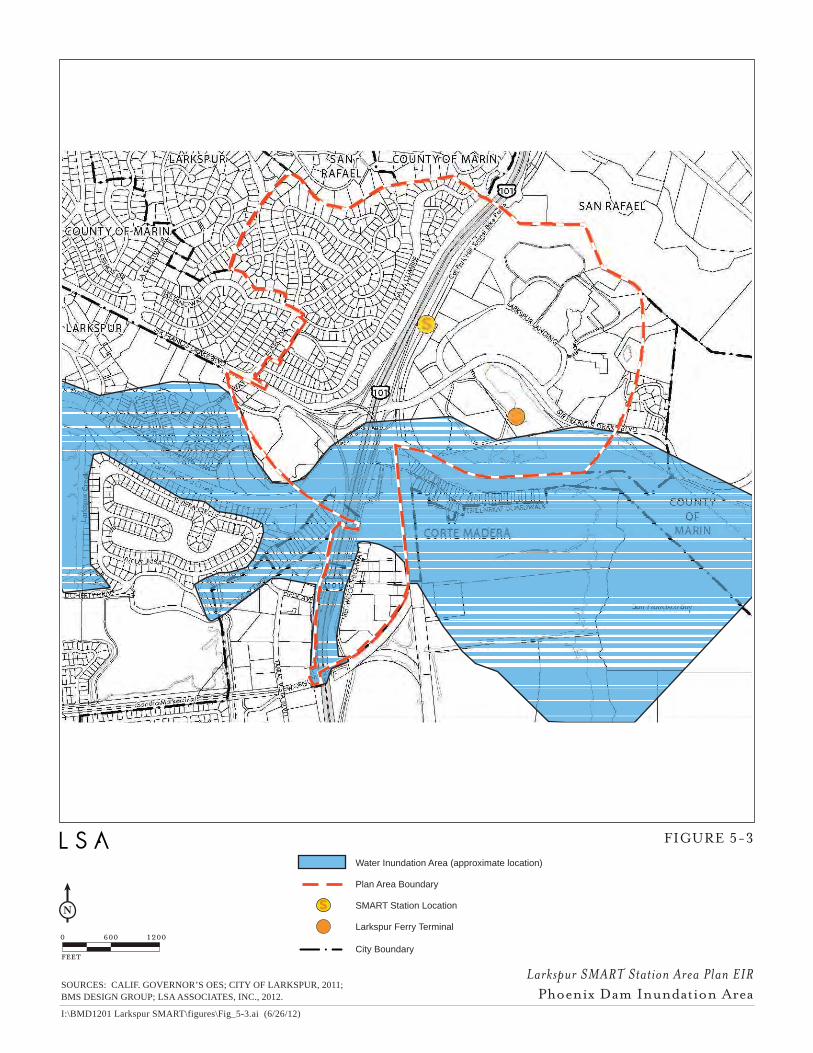
s
Water Inundation Area (approximate location)
Plan Area Boundary
SMART Station Location
Larkspur Ferry Terminal
City Boundaryfeet
12000 600
Larkspur SMART Station Area Plan EIRPhoenix Dam Inundation Area
SOURCES: CALIF. GOVERNOR’S OES; CITY OF LARKSPUR, 2011;BMS DESIGN GROUP; LSA ASSOCIATES, INC., 2012.
I:\BMD1201 Larkspur SMART\figures\Fig_5-3.ai (6/26/12)
FIGURE 5-3
L S A A S S O C I A T E S , I N C . L A R K S P U R S M A R T S T A T I O N A R E A P L A N J U L Y 2 0 1 2 B A S E L I N E E N V I R O N M E N T A L C O N D I T I O N S 5 . H Y D R O L O G Y A N D W A T E R R E S O U R C E S
P:\BMD1201 Larkspur\PRODUCTS\Working Papers\5-Hydrology.doc (7/30/2012) DRAFT 2 8
This page intentionally left blank.
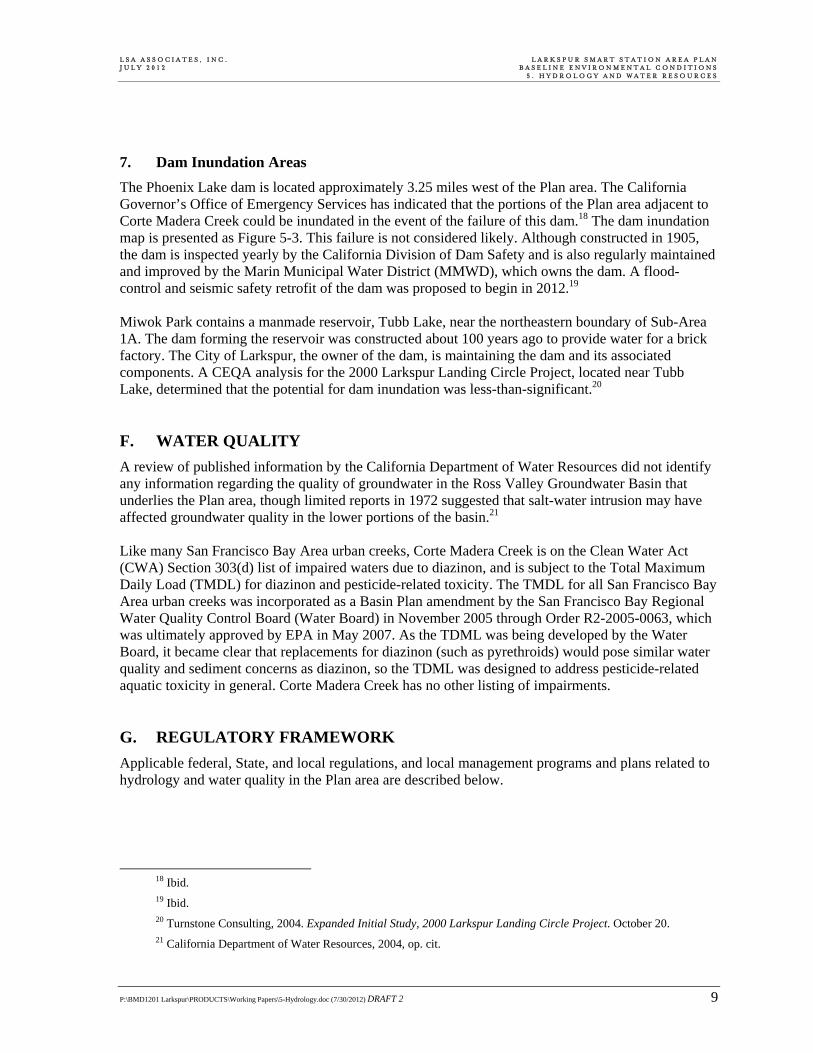
L S A A S S O C I A T E S , I N C . L A R K S P U R S M A R T S T A T I O N A R E A P L A N J U L Y 2 0 1 2 B A S E L I N E E N V I R O N M E N T A L C O N D I T I O N S 5 . H Y D R O L O G Y A N D W A T E R R E S O U R C E S
P:\BMD1201 Larkspur\PRODUCTS\Working Papers\5-Hydrology.doc (7/30/2012) DRAFT 2 9
7. Dam Inundation Areas
The Phoenix Lake dam is located approximately 3.25 miles west of the Plan area. The California Governor’s Office of Emergency Services has indicated that the portions of the Plan area adjacent to Corte Madera Creek could be inundated in the event of the failure of this dam.18 The dam inundation map is presented as Figure 5-3. This failure is not considered likely. Although constructed in 1905, the dam is inspected yearly by the California Division of Dam Safety and is also regularly maintained and improved by the Marin Municipal Water District (MMWD), which owns the dam. A flood-control and seismic safety retrofit of the dam was proposed to begin in 2012.19 Miwok Park contains a manmade reservoir, Tubb Lake, near the northeastern boundary of Sub-Area 1A. The dam forming the reservoir was constructed about 100 years ago to provide water for a brick factory. The City of Larkspur, the owner of the dam, is maintaining the dam and its associated components. A CEQA analysis for the 2000 Larkspur Landing Circle Project, located near Tubb Lake, determined that the potential for dam inundation was less-than-significant.20 F. WATER QUALITY
A review of published information by the California Department of Water Resources did not identify any information regarding the quality of groundwater in the Ross Valley Groundwater Basin that underlies the Plan area, though limited reports in 1972 suggested that salt-water intrusion may have affected groundwater quality in the lower portions of the basin.21 Like many San Francisco Bay Area urban creeks, Corte Madera Creek is on the Clean Water Act (CWA) Section 303(d) list of impaired waters due to diazinon, and is subject to the Total Maximum Daily Load (TMDL) for diazinon and pesticide-related toxicity. The TMDL for all San Francisco Bay Area urban creeks was incorporated as a Basin Plan amendment by the San Francisco Bay Regional Water Quality Control Board (Water Board) in November 2005 through Order R2-2005-0063, which was ultimately approved by EPA in May 2007. As the TDML was being developed by the Water Board, it became clear that replacements for diazinon (such as pyrethroids) would pose similar water quality and sediment concerns as diazinon, so the TDML was designed to address pesticide-related aquatic toxicity in general. Corte Madera Creek has no other listing of impairments. G. REGULATORY FRAMEWORK
Applicable federal, State, and local regulations, and local management programs and plans related to hydrology and water quality in the Plan area are described below.
18 Ibid. 19 Ibid. 20 Turnstone Consulting, 2004. Expanded Initial Study, 2000 Larkspur Landing Circle Project. October 20. 21 California Department of Water Resources, 2004, op. cit.
L S A A S S O C I A T E S , I N C . L A R K S P U R S M A R T S T A T I O N A R E A P L A N J U L Y 2 0 1 2 B A S E L I N E E N V I R O N M E N T A L C O N D I T I O N S 5 . H Y D R O L O G Y A N D W A T E R R E S O U R C E S
P:\BMD1201 Larkspur\PRODUCTS\Working Papers\5-Hydrology.doc (7/30/2012) DRAFT 2 10
1. Municipal Stormwater Program Requirements
Pursuant to Section 402 of the CWA and the Porter-Cologne Water Quality Control Act, municipal stormwater discharges in Marin County are regulated under the statewide National Pollutant Discharge Elimination System (NPDES) General Permit for the Discharge of Storm Water from Small Municipal Separate Storm Sewer Systems (Small MS4 Permit). Prior to being regulated under the Small MS4 Permit, the municipalities in Marin County formed the Marin County Stormwater Pollution Prevention Program (MCSTOPPP) for the purpose of developing a countywide program to satisfy the requirements of the CWA and Basin Plan. The MCSTOPPP also developed a Stormwater Management Plan (Action Plan 2010) to comply with the requirements of the Small MS4 Permit. The Action Plan 2010 includes Performance Standards for the program elements that must be addressed under the Small MS4 Permit: municipal maintenance activities (including road repair and mainte-nance); illicit discharge controls; new development, redevelopment, and construction site controls; industrial and commercial discharge controls; and public information and participation. Local Small MS4 Permit activities (MCSTOPPP) are overseen by the Water Board. 2. Construction General Permit
Pursuant to CWA Section 402 and the Porter-Cologne Water Quality Control Act, the SWRCB adopted an NPDES General Permit for Storm Water Discharges Associated with Construction and Land Disturbance Activities (Construction General Permit) (Order No. 2009-0009-DWQ, NPDES No. CAR000002) on September 2, 2009. To obtain coverage under the Construction General Permit, the discharger must provide via electronic submittal, a Notice of Intent, a Storm Water Pollution Prevention Plan (SWPPP), and other documents required by Attachment B of the Construction General Permit. Construction activities subject to the Construction General Permit include clearing, grading, and disturbances to the ground, such as grubbing or excavation, that result in soil disturbances of at least 1.0 acre of total land area (or smaller sites that are part of a common plan of development or sale that disturbs more than 1.0 acre of land surface). A SWPPP must be prepared by a Qualified SWPPP Developer that meets the certification requirements in the Construction General Permit. The purpose of the SWPPP is: (1) to help identify the sources of sediment and other pollutants that could affect the quality of stormwater discharges; and (2) to describe and ensure the implementation of Best Manage-ment Practices (BMPs) to reduce or eliminate sediment and other pollutants in stormwater as well as non-stormwater discharges resulting from construction activity. The Construction General Permit mandates certain requirements based on the risk level of the project (Level 1, Level 2, or Level 3), which is based on the risk of sediment discharge and the receiving water risk. The SWPPP must also include a Construction Site Monitoring Program. The monitoring program includes, depending on the project risk level, visual observations of site discharges, water quality monitoring of site discharges (pH, turbidity, and non-visible pollutants, if applicable), and receiving water monitoring (pH, turbidity, suspended sediment concentration, and bioassessment). The performance standard in the Construction General Permit is that dischargers shall minimize or prevent pollutants in stormwater discharges and authorized non-stormwater discharges through the use of controls, structures, and management practices that achieve Best Available Technology (BAT) for treatment toxic and non-conventional pollutants and Best Conventional Technology (BCT) for
L S A A S S O C I A T E S , I N C . L A R K S P U R S M A R T S T A T I O N A R E A P L A N J U L Y 2 0 1 2 B A S E L I N E E N V I R O N M E N T A L C O N D I T I O N S 5 . H Y D R O L O G Y A N D W A T E R R E S O U R C E S
P:\BMD1201 Larkspur\PRODUCTS\Working Papers\5-Hydrology.doc (7/30/2012) DRAFT 2 11
treatment of conventional pollutants.22 The permit also imposes numeric action levels and numeric effluent limits for pH and turbidity (for Level 2 and Level 3 risk dischargers). Local General Construction Permit activities are overseen by the Water Board. 3. City of Larkspur General Plan
The City’s 1990 General Plan contains the following policies and action programs regarding hydrology and water quality: Health and Safety Element
Policy e: Allow land uses in areas prone to natural hazards only with appropriate mitigation.
o Action Program [6]: Continue to regulate development to assure the adequate mitigation of safety hazards on sites having a history or threat of slope instability, seismic activity (including liquefaction, subsidence, and differential settlement), flooding, or fire.
Policy f: Seek to have the Corte Madera Creek flood control improvements completed upstream from Larkspur.
o Action Program [7]: Work with the Marin County Flood Control District, the Army Corps of Engineers, and the Town of Ross to develop and implement an improvement plan that protects against flooding.
Policy g: Work with other cities in the Ross Valley to develop a comprehensive master plan for flood control and management of Corte Madera Creek.
Policy h: Regulate land uses in flood-prone areas and allow development in those areas only with appropriate mitigation.
o Action Program [8]: Establish standards for minimum grades and minimum finished floor elevations that take into consideration the rising sea level during the expected life of the project.
Policy i: Continue to upgrade the City's drainage system.
o Action Program [9]: Implement the recommendations of the 1988 Storm Drain Master Plan study.
o Action Program [10]: Construct flood walls and a tide gate in the area east of Highway 101.
o Action Program [11]: Balance required protection measures with the need to protect environmental resources, and do so in such a way as to integrate design improvements with the protection of natural resources.
o Action Program [12]: Require site plans to locate structures outside or above the 100-year flood zone wherever possible.
o Action Program [26]: Adopt standards for geologic and geotechnical reports that outline the type and extent of investigation required for various stages of the development process, for various geologic and soils conditions, and for the type of land use and structure proposed.
22 As defined by the EPA, Best Available Technology (BAT) is a technology-based standard established by the
CWA as the most appropriate means available on a national basis for controlling the direct discharge of toxic and non-conventional pollutants to navigable waters. The BAT effluent limitations guidelines, in general, represent the best existing performance of treatment technologies that are economically achievable. Best Conventional Technology (BCT) is a technology-based standard that applies to treatment of conventional pollutants, such as total suspended solids.
L S A A S S O C I A T E S , I N C . L A R K S P U R S M A R T S T A T I O N A R E A P L A N J U L Y 2 0 1 2 B A S E L I N E E N V I R O N M E N T A L C O N D I T I O N S 5 . H Y D R O L O G Y A N D W A T E R R E S O U R C E S
P:\BMD1201 Larkspur\PRODUCTS\Working Papers\5-Hydrology.doc (7/30/2012) DRAFT 2 12
(a) Proposed development should include detailed plans for drainage facilities. These plans should incorporate a hydrologic and, where appropriate, a geomorphic evaluation of existing drainage courses and City drainage facilities that will be impacted by the project. The evaluation should demonstrate the adequacy of these systems. After adequacy is demonstrated, the drainage facilities should be connected to City storm drains.
4. Ross Valley Flood Protection and Watershed Program
The Ross Valley Watershed and Flood Protection Program (RVFPWP), a project of the MCDPW, was established after the 2005 New Years’ Eve flood at the request of impacted communities. The RVFPWP includes participation from MCDPW as well as Fairfax, Larkspur, Ross, San Anselmo, and Flood Zone No. 9. In 2011, the RVFPWP completed a Capital Improvement Plan to provide improved flood protection to the watershed. Proposed capital projects would allow Corte Madera Creek to contain the 100-year flood by enlarging the channel, removing or modifying structures within three critical reaches of the Creek, and attenuating flood flows in five large detention basins.23 These projects are intended to be implemented over the next 10 to 20 years.
23 Marin County Flood Control and Water Conservation District, Flood Zone 9, 2011, Capital Improvement Plan
Study for Flood Damage Reduction and Creek Management in Flood Zone 9/Ross Valley, May.
P:\BMD1201 Larkspur\PRODUCTS\Working Papers\6-Hazards.doc (7/30/2012) DRAFT 2 1
6. HAZARDS AND HAZARDOUS MATERIALS
This chapter describes hazardous materials1 and other public health and safety issues within the vicinity of the Larkspur SMART Station Area Plan (Plan) area, identifies potential hazards and hazardous materials issues, and the pertinent federal, State, and local agency laws, regulations, and programs related to these hazards. The issues discussed below focus on hazardous materials, but also include wildland fire hazards, aviation hazards, and emergency response. A. HAZARDOUS MATERIALS
Products as diverse as gasoline, paint, solvents, household cleaning products, refrigerants, and radioactive substances are categorized as hazardous materials. The proper management of hazardous materials is a common concern for all communities. Beginning in the 1970s, governments at the federal, State, and local levels became increasingly concerned about the effects of hazardous materials on human health and the environment. Numerous laws and regulations were developed to investigate and mitigate these effects. As a result, the storage, use, generation, transport, and disposal of hazardous materials are highly regulated by federal, State, and local laws and regulations. Due to the highly regulated nature of hazardous materials, this section begins with a description of the regulatory agency framework, and is followed by an overview of specific hazards and hazardous materials issues in the Plan area. 1. Regulatory Agency Framework
Regulations pertaining to the management of hazardous materials are administered by a combination of federal, State, and local agencies. These agencies, and information about the laws and regulations they administer, are summarized below. a. Federal Regulations. The U.S. Environmental Protection Agency (EPA) is the lead agency responsible for enforcing federal laws and regulations governing hazardous materials that affect public health or the environment. The major federal laws and regulations enforced by the EPA include: the Resource Conservation and Recovery Act (RCRA); the Toxic Substances Control Act (TSCA); the Comprehensive Environmental Response, Compensation and Liability Act (CERCLA); and the Superfund Amendments and Reauthorization Act (SARA). In 1976, RCRA was enacted to provide a general framework for the EPA to regulate hazardous waste from the time it is generated until its ultimate disposal. In accordance with RCRA, facilities that
1 The California Health and Safety Code defines a hazardous material as “... any material that, because of its
quantity, concentration, or physical or chemical characteristics, poses a significant present or potential hazard to human health and safety, or to the environment. Hazardous materials include, but are not limited to, hazardous substances, hazard-ous waste, radioactive materials, and any material which a handler or the administering agency has a reasonable basis for believing that it would be injurious to the health and safety of persons or harmful to the environment if released into the workplace or the environment.” (Health and Safety Code, Section 25501).
L S A A S S O C I A T E S , I N C . L A R K S P U R S M A R T S T A T I O N A R E A P L A N J U L Y 2 0 1 2 B A S E L I N E E N V I R O N M E N T A L C O N D I T I O N S 6 . H A Z A R D S A N D H A Z A R D O U S M A T E R I A L S
P:\BMD1201 Larkspur\PRODUCTS\Working Papers\6-Hazards.doc (7/30/2012) DRAFT 2 2
generate, treat, store, or dispose of hazardous waste are required to ensure that the wastes are properly managed from “cradle to grave.” In 1976, TSCA was enacted to provide the EPA authority to regulate the production, importation, use, and disposal of chemicals that pose a risk of adversely impacting public health and the environment, such as polychlorinated biphenyls (PCBs), asbestos-containing materials (ACM), and lead-based paint. TSCA also gives the EPA authority to regulate the cleanup of sites contaminated with specific chemicals, such as PCBs. Additional regulations concerning the management of PCBs, ACM, and lead-based paint are discussed, below, under “State” regulations. In 1980, CERCLA, commonly known as the Superfund, was enacted to ensure that a source of funds was available for the EPA to clean up uncontrolled or abandoned hazardous materials release sites that pose a risk of adversely impacting public health and the environment. Prohibitions and require-ments regarding closed or abandoned hazardous waste sites and liability standards for responsible parties were also established by CERCLA. In 1986, SARA amended CERCLA to increase the Superfund budget, modify contaminated site cleanup criteria and schedules, and revise settlement procedures. While the EPA regulates overall use and cleanup of hazardous materials, the U.S. Department of Transportation (DOT) is the federal administering agency responsible for hazardous materials transportation regulations. The DOT Office of Hazardous Materials Safety oversees a national safety program to minimize the risks related to commercial transportation of hazardous materials. The federal hazardous materials transportation law (49 USC 5101 et seq.) is the basic statute regulating hazardous materials transportation in the United States. Federal hazardous materials transportation regulations are contained in 49 Code of Federal Regulations Parts 171-180. In California, the California Department of Transportation (Caltrans) is the implementing agency for DOT laws and regulations. Worker health and safety is protected by federal and State laws and regulations. The Occupational Health and Safety Administration (OSHA) is the federal agency responsible for enforcement and implementation of federal laws and regulations pertaining to worker health and safety. Under OSHA jurisdiction, the Hazardous Waste Operations and Emergency Response (HAZWOPER) regulations (29 CFR 1910.120) require training and medical supervision for workers at hazardous waste sites. Additional regulations have been developed for construction workers regarding exposure to lead (29 CFR 1926.62) and asbestos (29 CFR 1926.1101) during construction activities. State regulations pertaining to worker health and safety are discussed, below, under “State” regulations. b. State Regulations. In California, the EPA has granted most enforcement authority over federal hazardous materials regulations to the California Environmental Protection Agency (Cal/EPA). The mission of Cal/EPA is to restore, protect, and enhance the environment to ensure public health, envi-ronmental quality, and economic vitality. Under the authority of Cal/EPA, the Department of Toxic Substances Control (DTSC) and the San Francisco Bay Regional Water Quality Control Board (Water Board) are responsible for overseeing the cleanup of contaminated sites in the Plan area. The California Department of Industrial Relations, Division of Occupational Safety and Health (DOSH), enforces State regulations and supervision of workplaces in California that are not under direct federal jurisdiction. State worker health and safety regulations applicable to construction
L S A A S S O C I A T E S , I N C . L A R K S P U R S M A R T S T A T I O N A R E A P L A N J U L Y 2 0 1 2 B A S E L I N E E N V I R O N M E N T A L C O N D I T I O N S 6 . H A Z A R D S A N D H A Z A R D O U S M A T E R I A L S
P:\BMD1201 Larkspur\PRODUCTS\Working Papers\6-Hazards.doc (7/30/2012) DRAFT 2 3
workers include training requirements for hazardous waste operations and emergency response (8 CCR 5192), and lead (8 CCR 1532.1) and asbestos (8 CCR 1529) regulations, which equal or exceed their federal counterparts. c. Local Regulations. The routine management of hazardous materials in California is adminis-tered under the Unified Program.2 The Cal/EPA has granted responsibilities to the Marin County Department of Public Works, Waste Management Division (MCDPW) for implementation and enforcement of hazardous material regulations under the Unified Program as a Certified Unified Program Agency (CUPA). CUPA responsibilities and requirements are codified in the Marin County Municipal Code Title 7 (Health and Sanitation), Chapters 7.80-7.83. In addition, the Larkspur Fire Department (LFD) ensures that businesses in the Plan area maintain required hazardous materials permits through annual business inspections to enforce the City’s Fire Code.
Policy SAF-8.2: Coordinate with the County of Marin to monitor and enforce regulations concerning the use and handling of hazardous materials and waste.
o Action Program SAF-8.2.a: Require the use, storage, transportation and handling of hazardous materials and waste within the City to comply with applicable County, State and federal laws.
o Action Program SAF-8.2.b: Ensure that the City’s municipal code is regularly updated to reflect current standards for the handling, storage, and transport of hazardous materials and waste.
o Action Program SAF-8.2.c: Ensure that project review complies with the California Environmental Quality Act, as pertaining to identification, evaluation, and remediation of contaminated project sites.
Policy SAF-8.4: Promote educational programs to enhance public awareness of proper hazardous material or waste storage, transport, and disposal.
o Action Program SAF-8.4.a: Provide educational materials in City Hall and the City website on hazardous material and waste collection facilities and suggested handling strategies for household hazardous materials and wastes.
2. Hazardous Materials Programs
Within the Plan area, most of hazardous materials programs are administered and enforced under the Unified Program, described below. These programs address businesses only. Household hazardous waste, generated by residents, is administered separately. a. Hazardous Materials Programs under the Unified Program. The Unified Program consoli-dates, coordinates, and makes consistent the administrative requirements, permits, inspections, and enforcement activities of the following hazardous materials programs: Hazardous Materials Business Plan (HMBP) Program, California Accidental Release Prevention (CalARP) Program, Underground Storage Tank (UST) Program, Aboveground Storage Tank (AST) Program, and Hazardous Waste Generator Program. The hazardous materials programs administered under the Unified Program are described below.
(1) Hazardous Materials Business Plan Program. Any facility storing aggregate quantities of any hazardous materials equal to or greater than 55 gallons of liquids, 500 pounds of solids, or 200 cubic feet of gases is required to report their chemical inventories by preparing a HMBP which is submitted to MCDPW. An HMBP must include measures for safe storage, transportation, use, and
2 California Health and Safety Code, Chapter 6.11, Sections 25404-25404.8
L S A A S S O C I A T E S , I N C . L A R K S P U R S M A R T S T A T I O N A R E A P L A N J U L Y 2 0 1 2 B A S E L I N E E N V I R O N M E N T A L C O N D I T I O N S 6 . H A Z A R D S A N D H A Z A R D O U S M A T E R I A L S
P:\BMD1201 Larkspur\PRODUCTS\Working Papers\6-Hazards.doc (7/30/2012) DRAFT 2 4
handling of hazardous materials. The HMBP must also include a contingency plan that describes the facility’s response procedures in the event of a hazardous materials release. This informs the commu-nity on chemical use, storage, handling, and disposal practices. It is also intended to provide essential information to fire fighters, health officials, planners, elected officials, workers, and their representa-tives so that they can plan for and respond to potential exposures to hazardous materials.
(2) California Accidental Release Prevention Program. Under The CalARP Program, the HMCD requires facilities that handle more than a threshold quantity of a regulated hazardous substance (listed in Tables 1-3, 19 CCR 2770.5), such as federally listed extremely hazardous toxic and flammable substances and state listed acutely hazardous materials, to prepare a risk management plan (RMP). An RMP must analyze the potential for an accidental release and provide measures that can be implemented to reduce this potential. Facilities that are required to prepare an RMP must obtain and keep current a CalARP Program Facility Permit. Based on a review of environmental regulatory databases, no CalARP facilities are located within the Plan area.
(3) Underground Storage Tank Program. Due to fire hazards, flammable liquids, such as gasoline, have historically been stored in USTs, which, over time, may leak, resulting in potential risks for the general public and the environment. The UST Program implemented by the MCDPW requires that USTs be installed, monitored, operated, and maintained in a manner that protects public health and the environment. Tanks must be constructed with primary and secondary levels of containment and be designed to protect public health and the environment for the lifetime of the installation. The USTs must be monitored for leaks and built such that a leak from the primary container into the secondary container will be detected. When a UST is proposed to be removed, a detailed permit application must be submitted to MCDPW. The MCDPW oversees UST removal activities to identify potential evidence of leakage.
(4) Aboveground Storage Tank Program. The Aboveground Petroleum Storage Act (APSA) requires facilities in California storing petroleum products in aboveground tanks greater than or equal to 55 gallons and having an aggregate aboveground storage capacity greater than or equal to 1,320 gallons to prepare and implement a Spill Prevention, Countermeasure, and Control (SPCC) plan (40 CFR 112). An SPCC plan must address prevention, preparation, and response measures to prevent oil discharges into navigable water and adjoining shorelines. Facilities with aggregate aboveground storage capacity of 1,320 gallons or more of petroleum are required to operate under a Hazardous Materials Permit and submit a tank facility statement annually to the MCDPW. At least once every three years, the MCDPW inspects storage tanks with a storage capacity of 10,000 gallons or more of petroleum to determine if the owner or operator is in compliance with the SPCC plan requirements of the APSA.
(5) Hazardous Waste Generator Program. Once a hazardous material has been used or processed, what remains may be considered a hazardous waste. Facilities that generate more than 100 kilograms of hazardous waste per month, or more than one kilogram of acutely hazardous waste, must be registered with EPA’s RCRA program and are subject to extensive regulations regarding storage and disposal. At least once every three years, the MCDPW inspects hazardous waste generators to ensure that they are adhering to RCRA requirements. b. Household Hazardous Wastes. Many residents routinely store and dispose of hazardous materials, such as paints and thinners, cleaning products, motor oil, batteries, electronics, and other
L S A A S S O C I A T E S , I N C . L A R K S P U R S M A R T S T A T I O N A R E A P L A N J U L Y 2 0 1 2 B A S E L I N E E N V I R O N M E N T A L C O N D I T I O N S 6 . H A Z A R D S A N D H A Z A R D O U S M A T E R I A L S
P:\BMD1201 Larkspur\PRODUCTS\Working Papers\6-Hazards.doc (7/30/2012) DRAFT 2 5
such items. Long-term storage of hazardous products in residences poses an unnecessary risk of accidentally poisoning children and/or pets. When residents discard these kinds of hazardous materials, they become a household hazardous waste (HHW). Pouring HHW down the drain, into storm sewers, or on the ground and placing HHW in the trash could potentially contaminate soil, groundwater, or surface water. In California, it is illegal to dispose of HHW in the trash, down the drain, or by abandonment.3 The Marin Hazardous and Solid Waste Joint Powers Authority provides recycling and disposal options for HHW. Drop-off services for HHW are available to Plan area residents at the Marin Household Hazardous Waste Facility at 565 Jacoby Street in San Rafael. 3. Hazardous Materials in Soil, Groundwater, and Surface Water
The following describes hazardous materials releases known to have occurred in the Plan area. a. Hazardous Materials Release Sites. Releases of hazardous materials may occur during use, storage, transfer, and disposal activities and contaminate soil, groundwater, and surface water. Known or suspected contaminated sites under DTSC or Water Board oversight are identified by Cal/EPA pursuant to Government Code 65962.5. The provisions of Government Code 65962.5, which are commonly referred to as the Cortese List, require the DTSC, the Water Board, the California Depart-ment of Health Services, and the California Integrated Waste Management Board to submit informa-tion pertaining to sites associated with solid waste disposal, hazardous waste disposal, and/or hazard-ous materials releases to the Secretary of Cal/EPA. Under the authority of the DTSC and Water Board, the MCDPW oversees the investigation and remediation of leaking UST (LUST) sites in the Plan area. Redevelopment projects at or near hazardous material release sites have the potential to encounter hazardous materials in soil and groundwater during construction, and, if not remediated, this contami-nation could result in health risks to future workers or residents. A review of environmental database information identified eleven reported hazardous material release sites at and adjacent to the Plan area.4 These included two sites in Sub-Area 1A, two sites in Sub-Area 1B, three sites in Sub-Area 2, and four sites in the light industrial area west of Sub-Area 2. These sites are listed in Table 6-1 and the locations are shown in Figure 6-1. Nine of the reported release sites involve the release of petroleum products from a LUST. As these releases are underground, contamination from LUST release sites may spread to groundwater, through which it can migrate away from the release site. Eight of the nine LUST sites have been closed by MCDPW, indicating that remediation is complete or was not necessary (Table 6-1). Only the Marin Car Wash site, at 2066 Redwood Highway (Site 4 on Table 6-1 and Figure 6-1) remains under active investigation. The two remaining release sites include the 2000 Larkspur Landing site (Site 1 on Table 6-1 and Figure 6-1), where contaminated soil is known to be present, and the Larkspur Ferry Terminal (Site 7 on Table 6-1 and Figure 6-1), where four small releases of oil have been reported.
3 California Health and Safety Code, Section 25218-25218.13 4 Environmental Data Resources, 2012. EDR Radius Map with GeoCheck, Larkspur SMART Station Area, Inquiry
Number 3345737.1s. June 15.
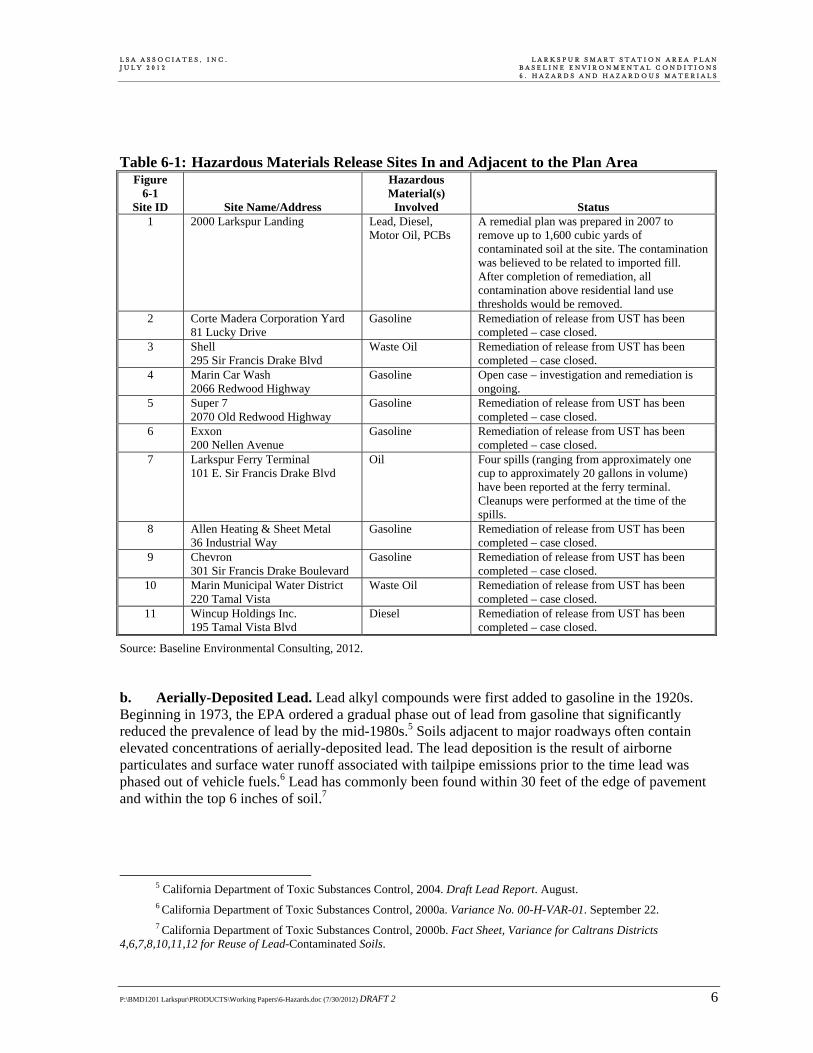
L S A A S S O C I A T E S , I N C . L A R K S P U R S M A R T S T A T I O N A R E A P L A N J U L Y 2 0 1 2 B A S E L I N E E N V I R O N M E N T A L C O N D I T I O N S 6 . H A Z A R D S A N D H A Z A R D O U S M A T E R I A L S
P:\BMD1201 Larkspur\PRODUCTS\Working Papers\6-Hazards.doc (7/30/2012) DRAFT 2 6
Table 6-1: Hazardous Materials Release Sites In and Adjacent to the Plan Area Figure
6-1 Site ID Site Name/Address
Hazardous Material(s)
Involved Status 1 2000 Larkspur Landing Lead, Diesel,
Motor Oil, PCBs A remedial plan was prepared in 2007 to remove up to 1,600 cubic yards of contaminated soil at the site. The contamination was believed to be related to imported fill. After completion of remediation, all contamination above residential land use thresholds would be removed.
2 Corte Madera Corporation Yard 81 Lucky Drive
Gasoline Remediation of release from UST has been completed – case closed.
3 Shell 295 Sir Francis Drake Blvd
Waste Oil Remediation of release from UST has been completed – case closed.
4 Marin Car Wash 2066 Redwood Highway
Gasoline Open case – investigation and remediation is ongoing.
5 Super 7 2070 Old Redwood Highway
Gasoline Remediation of release from UST has been completed – case closed.
6 Exxon 200 Nellen Avenue
Gasoline Remediation of release from UST has been completed – case closed.
7 Larkspur Ferry Terminal 101 E. Sir Francis Drake Blvd
Oil Four spills (ranging from approximately one cup to approximately 20 gallons in volume) have been reported at the ferry terminal. Cleanups were performed at the time of the spills.
8 Allen Heating & Sheet Metal 36 Industrial Way
Gasoline Remediation of release from UST has been completed – case closed.
9 Chevron 301 Sir Francis Drake Boulevard
Gasoline Remediation of release from UST has been completed – case closed.
10 Marin Municipal Water District 220 Tamal Vista
Waste Oil Remediation of release from UST has been completed – case closed.
11 Wincup Holdings Inc. 195 Tamal Vista Blvd
Diesel Remediation of release from UST has been completed – case closed.
Source: Baseline Environmental Consulting, 2012. b. Aerially-Deposited Lead. Lead alkyl compounds were first added to gasoline in the 1920s. Beginning in 1973, the EPA ordered a gradual phase out of lead from gasoline that significantly reduced the prevalence of lead by the mid-1980s.5 Soils adjacent to major roadways often contain elevated concentrations of aerially-deposited lead. The lead deposition is the result of airborne particulates and surface water runoff associated with tailpipe emissions prior to the time lead was phased out of vehicle fuels.6 Lead has commonly been found within 30 feet of the edge of pavement and within the top 6 inches of soil.7
5 California Department of Toxic Substances Control, 2004. Draft Lead Report. August. 6 California Department of Toxic Substances Control, 2000a. Variance No. 00-H-VAR-01. September 22. 7 California Department of Toxic Substances Control, 2000b. Fact Sheet, Variance for Caltrans Districts
4,6,7,8,10,11,12 for Reuse of Lead-Contaminated Soils.
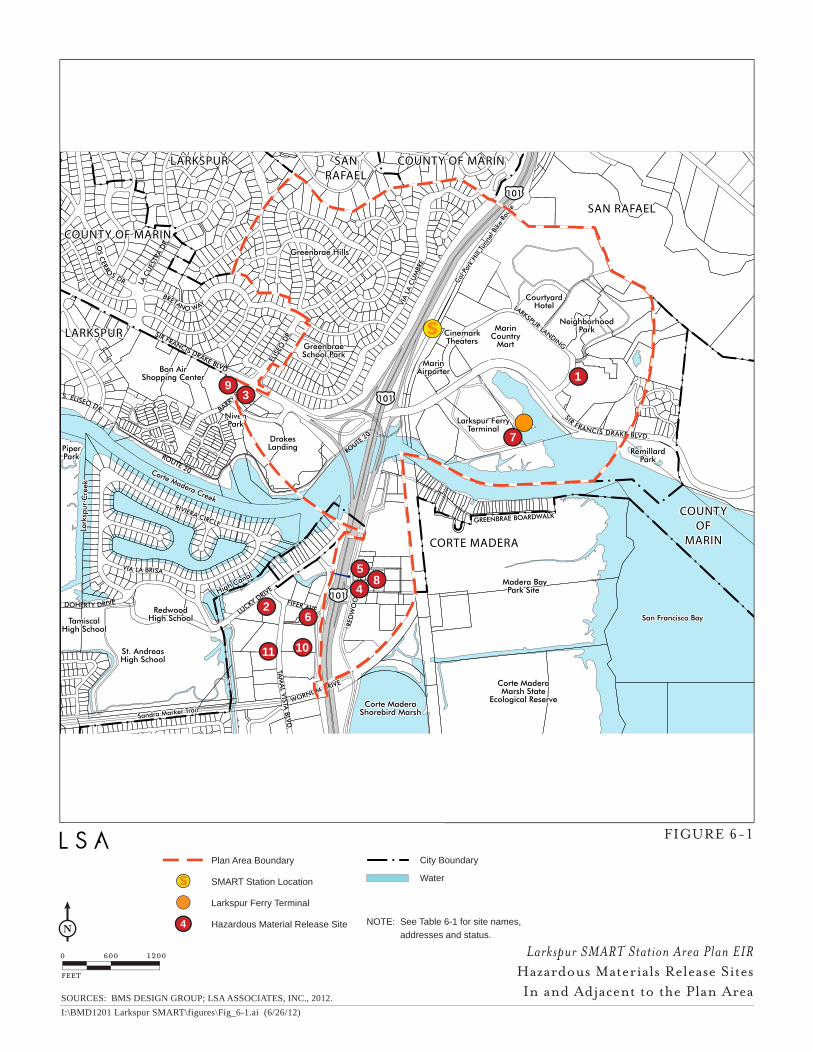
sSIR FRANCIS DRAKE BLVD.
GREENBRAE BOARDWALKRIVIERA CIRCLE
LUCKY D
RIVE
FIFER AVE
RED
WO
OD
HIG
HW
AY
WORNUM DRIVE
Sandra Marker Trail
TAM
AL V
ISTA BLV
D.
VIA L
A C
UM
BRE
LARKSPUR LANDING
101
101
101
SIR FRANCIS DRAKE BLVD.
VIA LA BRISA
BRETANO WAY
Cal P
ark
Hill
Tunn
el B
ike
Rout
e
DOHERTY DRIVE
Tamiscal High School
St. AndreasHigh School
RedwoodHigh School
PiperPark
NivenPark
Greenbrae School Park
NeighborhoodPark
RemillardPark
Larkspur Ferry Terminal
Marin Country
Mart
Marin Airporter
CinemarkTheaters
CourtyardHotel
Madera BayPark Site
Corte MaderaShorebird Marsh
Corte Madera Marsh State
Ecological Reserve
Bon AirShopping Center
DrakesLanding
Greenbrae Hills
Corte Madera Creek
High Canal
Lark
spur
Cre
ek
San Francisco Bay
SAN RAFAEL
CORTE MADERA
COUNTY OF MARIN
COUNTY OF
MARIN
COUNTY OF MARINSAN RAFAEL
LARKSPUR
LARKSPUR
LA C
UES
TRA
DR.
ELIS
EO D
R.
BARR
Y WAY
ROUTE 20
ROUTE
20
LOS C
ERROS DR.
S. ELISEO DR.
NDARY
ERMINAL
OCATION
ANAN
sPlan Area Boundary
SMART Station Location
Larkspur Ferry Terminal
Hazardous Material Release Site
City Boundary
Water
NOTE: See Table 6-1 for site names,
addresses and status.4
feet
12000 600 Larkspur SMART Station Area Plan EIRHazardous Materials Release SitesIn and Adjacent to the Plan Area
SOURCES: BMS DESIGN GROUP; LSA ASSOCIATES, INC., 2012.
I:\BMD1201 Larkspur SMART\figures\Fig_6-1.ai (6/26/12)
FIGURE 6-1
1
3
7
9
58
2
4
6
1011
L S A A S S O C I A T E S , I N C . L A R K S P U R S M A R T S T A T I O N A R E A P L A N J U L Y 2 0 1 2 B A S E L I N E E N V I R O N M E N T A L C O N D I T I O N S 6 . H A Z A R D S A N D H A Z A R D O U S M A T E R I A L S
P:\BMD1201 Larkspur\PRODUCTS\Working Papers\6-Hazards.doc (7/30/2012) DRAFT 2 8
This page intentionally left blank.
L S A A S S O C I A T E S , I N C . L A R K S P U R S M A R T S T A T I O N A R E A P L A N J U L Y 2 0 1 2 B A S E L I N E E N V I R O N M E N T A L C O N D I T I O N S 6 . H A Z A R D S A N D H A Z A R D O U S M A T E R I A L S
P:\BMD1201 Larkspur\PRODUCTS\Working Papers\6-Hazards.doc (7/30/2012) DRAFT 2 9
In the Plan area, a soil investigation was performed for the Central Marin Ferry Connection Project to evaluate the presence of aerially-deposited lead.8 The investigation included the collection of 12 soil samples from four locations near the intersection of Highway 101 and Sir Francis Drake Boulevard. Total lead in soil was identified at concentrations ranging from 8.0 to 100 milligrams per kilogram (mg/kg, often referred to as parts per million), below the health-risk based threshold of 200 mg/kg for residential land uses established by the Water Board.9 As Highway 101 and Sir Francis Drake Boulevard are the most heavily trafficked roadways in the Plan area, these findings suggest that aerially-deposited lead is not present in elevated concentrations in the Plan area. 4. Sensitive Receptors
Some populations, such as children, the elderly, and the infirm, are more susceptible to health effects of hazardous materials than the general population. Hazardous materials use near schools, day care centers, senior housing, and hospitals must consider potential health effects to these populations, often referred to as “sensitive receptors.” Construction or redevelopment on contaminated properties that could potentially generate vapors or fugitive dust containing contaminants may potentially pose a health risk to these populations. In addition, commercial and industrial facilities in proximity to sensitive receptors may have hazardous emissions or handle hazardous or acutely hazardous materials that could pose a health risk to these sensitive receptors. In the Plan area, residential areas and schools would be considered areas with sensitive receptors. These include the multi-family residential buildings in Sub-Area 1A, the single-family homes in the Sub-Area 1B, and the trailer parks in Sub-Area 2. Schools in and near the Plan area include the Children’s Cooperative Pre-school at 2900 Larkspur Landing Circle in Sub-Area 1B, and the Red-wood, San Andreas, and Tamiscal High Schools located west of Sub-Area 2. 5. Hazardous Building Materials
Hazardous materials are commonly found in the types of building materials that may be affected during demolition and renovation activities in the Plan area. Building materials such as thermal system insulation, surfacing materials, and asphalt and vinyl flooring materials installed in buildings prior to 1981 may contain asbestos according to DOSH.10 Asbestos is a known human carcinogen.11 Prior to 1978, lead compounds were commonly used in interior and exterior paints. Demolition or renovation in the Plan area could release asbestos fibers and lead particles into the air from structures constructed prior to 1981 and 1978, respectively, which then may be inhaled by construction workers and the general public. In addition, other common items present in buildings, such as electrical transformers, fluorescent lighting, electrical switches, heating/cooling equipment, and thermostats could contain hazardous materials, which may pose a health risk if not handled and disposed of properly. Federal and State regulations govern the removal of asbestos-containing material (ACM) from structures prior to demolition. These requirements are promulgated by the EPA, OSHA, DTSC, and
8 Transportation Authority of Marin, 2010. Phase II Soil Investigation, Central Marin Ferry Connection, Larkspur, California. April.
9 Ibid. 10 California Code of Regulations, Title 8, Section 5208. 11 Agency for Toxic Substances and Disease Registry, 2001. ToxFAQs for Asbestos. September.
L S A A S S O C I A T E S , I N C . L A R K S P U R S M A R T S T A T I O N A R E A P L A N J U L Y 2 0 1 2 B A S E L I N E E N V I R O N M E N T A L C O N D I T I O N S 6 . H A Z A R D S A N D H A Z A R D O U S M A T E R I A L S
P:\BMD1201 Larkspur\PRODUCTS\Working Papers\6-Hazards.doc (7/30/2012) DRAFT 2 10
the Bay Area Air Quality Management District (BAAQMD). The BAAQMD, under authority of the California Air Resources Board (CARB), is the lead agency overseeing hazardous air emissions. All friable (crushable by hand) ACMs, or non-friable ACMs subject to damage, must be abated prior to demolition in accordance with applicable requirements. Friable ACM must be disposed of as an asbestos waste at an approved facility. Non-friable ACM may be disposed of as non-hazardous waste at landfills that will accept such wastes. Workers conducting asbestos abatement must be trained in accordance with DOSH and OSHA requirements. The BAAQMD must be notified at least ten working days prior to commencement of renovation or demolition involving the removal of regulated ACM. In addition, Section 19827.5 of the California Health and Safety Code prohibits local agencies from issuing demolition permits until an applicant has demonstrated compliance with asbestos notification requirements pursuant to the National Emissions Standards for Hazardous Air Pollutants (40 CFR Part 61). Federal and State regulations also govern the renovation or demolition of structures where lead or material containing lead is present. Regulations pertaining to renovation or demolition of structures with lead-based paint are promulgated by the EPA, the U.S. Department of Housing and Urban Development (HUD), DOSH, and DTSC. Federal regulations require that lead-based paint equal to or greater than 1.0 milligram per square centimeter or 0.5 percent by weight be removed prior to renovation or demolition if the paint is loose and peeling (40 CFR 745.227(h)). Loose and peeling paint must be disposed of as a State and/or federal hazardous waste if the concentration of lead equals or exceeds applicable waste thresholds. State and federal construction worker health and safety regulations require air monitoring and other protective measures during demolition activities where lead-based paint is present, and notification to DOSH for abatement activities (8 CCR 1532.1). Fluorescent lighting tubes and ballasts, mercury thermometers, and several other common items containing hazardous materials are regulated as “universal wastes” by the State of California. Universal waste must be recycled to be managed under the simple, streamlined universal waste handler standards for the State of California.12 B. WILDLAND FIRE HAZARDS
In accordance with California Public Resource Code Section 4201-4204 and Government Code Section 51175-51189, the California Department of Forestry and Fire Protection (CDF) has mapped areas of significant fire hazards based on fuels, terrain, weather, and other relevant factors. These zones, referred to as Fire Hazard Severity Zones (FHSZ), represent the risks associated with wildland fires. Fire Hazard Severity Zones mapped by CDF for State and local responsibility areas are classified as either “Medium,” “High,” or “Very High” based on fire hazards; however, the law only requires identification of Very High Fire Hazard Severity Zones in local responsibility areas. Wildland-Urban Interface Areas designated by local agencies are also classified as Fire Hazard Severity Zones. No Fire Hazard Severity Zones for State responsibility areas13 or Very High Fire Hazard Severity Zones for local responsibility areas14 have been identified in the Plan area, though
12 California Code of Regulations, Title 22, Division 4.5. 13 California Department of Forestry and Fires, 2007. Fire Hazard Severity Zones in SRA, Marin County, Adopted by
CAL FIRE on November 7. 14 California Department of Forestry and Fires, 2008. Very High Fire Hazard Severity Zones in LRA, Marin County,
Recommended for Adoption by CAL FIRE in October.
L S A A S S O C I A T E S , I N C . L A R K S P U R S M A R T S T A T I O N A R E A P L A N J U L Y 2 0 1 2 B A S E L I N E E N V I R O N M E N T A L C O N D I T I O N S 6 . H A Z A R D S A N D H A Z A R D O U S M A T E R I A L S
P:\BMD1201 Larkspur\PRODUCTS\Working Papers\6-Hazards.doc (7/30/2012) DRAFT 2 11
part of the San Quentin peninsula east of Sub-Area 1A, including San Quentin prison and Shoreline Band Park, has been designated as a Medium Fire Hazard Severity Zone. 15 The Health and Safety Element of the Larkspur 1990 General Plan contains the following policies and action programs related to wildland fire hazards. Health and Safety Element
Policy o: Maintain an aggressive fire prevention program.
o Action Program [28]: Continue to inspect all businesses, public buildings and apartment buildings annually for fire and building code violations.
o Action Program [29]: Continue to require that all vacant lots annually be cleared of excessive vegetation.
o Action Program [30]: Continue to require smoke alarms and Class C or better fire retardant roofs for all new construction.
Policy p: Establish more stringent fire protection standards for private development in high risk fire hazard areas.
o Action Program [31]: Require that automatic sprinkler systems be installed in new residences in areas with difficult access and/or poor water supply.
o Action Program [32]: Require that brush be cleared for a distance of 30 feet from residences in high fire-hazard areas.
o Action Program [33]: Establish landscaping guidelines that encourage the use of fire-resistant plants in high fire-hazard areas.
C. AVIATION HAZARDS
No public airports or private use airfields are located within 2 miles of the Plan area. As a result, no likely sources of aviation hazards are present in the area. D. EMERGENCY RESPONSE
Larkspur’s Emergency Management Plan (EMP) is the City’s action plan for responding to major disasters, including but not limited to flooding, a major earthquake, landslides, a major transportation accident, wildland fire, and hazardous materials incident. The EMP establishes operation protocols for an Emergency Operations Center (located at the Twin Cities Police Authority station), and addresses the coordination and integration of Larkspur’s emergency response operations with other governmental agencies. The LFD participates with other agencies in Marin County’s emergency preparedness programs including Get Ready Marin and the County’s Community Emergency Response Training program. The City of Larkspur General Plan has the following policies and action programs related to emer-gency response:
15 California Department of Forestry and Fires, 2007, op. cit.
L S A A S S O C I A T E S , I N C . L A R K S P U R S M A R T S T A T I O N A R E A P L A N J U L Y 2 0 1 2 B A S E L I N E E N V I R O N M E N T A L C O N D I T I O N S 6 . H A Z A R D S A N D H A Z A R D O U S M A T E R I A L S
P:\BMD1201 Larkspur\PRODUCTS\Working Papers\6-Hazards.doc (7/30/2012) DRAFT 2 12
Policy a: Maintain an updated emergency response plan.
Policy b: Identify essential emergency facilities and make provisions to ensure that they will function in the event of a disaster.
Policy c: Strive to educate the community about environmental hazards, measures which can be taken to protect lives and property, and methods for responding to various disasters.
Policy d: Cooperate with other public agencies to store, organize, distribute, and administer emergency medical equipment, supplies, services, and communications systems.
o Action Program [1]: Continue to update the City's emergency plan.
o Action Program [2]: Identify specific facilities and lifelines critical to effective disaster response, and evaluate their abilities to survive and operate efficiently immediately after a major disaster.
P:\BMD1201 Larkspur\PRODUCTS\Working Papers\7-PublicServices.doc (7/30/2012) DRAFT 2 1
7. PUBLIC SERVICES
This chapter describes the existing public services, including police, fire and emergency medical services, school services and solid waste within the Larkspur SMART Station Area (Plan area). This chapter also identifies policies related to public services in the 1990 City of Larkspur General Plan. A. FIRE AND EMERGENCY MEDICAL SERVICES
This section includes a brief discussion of City of Larkspur Fire Department (LFD) staffing levels, facilities and programs, emergency response times, and the most common types of emergencies reported in Larkspur. 1. Existing Staff
The LFD provides fire protection and emergency medical services within Larkspur and the Plan area. The LFD has 17 full-time staff for the 2011-12 fiscal year, which are augmented by a part-time contract staffer and approximately 15 volunteers.1,2 The LFD operates in three shifts, with two captains and three firefighters on duty during each shift. The Fire Chief handles administrative functions.3 The LFD staff is divided into three divisions: the Administrative Services Division, the Fire Preven-tion Division and the Fire Protection and Emergency Medical Services Division. While not part of the LFD, the Building Code Enforcement Division is overseen by the LFD Fire Chief. The Administra-tive Services Division is staffed by a single Fire Chief.4 The Fire Prevention Division, which focuses on avoiding or reducing the impact of fires (e.g., plan reviews and inspections), is staffed by one Fire Prevention Inspector. The Fire Protection and Emergency Medical Services Division is tasked with the delivery of fire protection and pre-hospital emergency medical care services. It is staffed with six captains and ten firefighters/engineers. The Building Code Enforcement Division employs one part-time Contract Building Inspector.5
1 Volunteers are not involved in fire suppression or emergency response. 2 Sinnott, Bob, 2012. Fire Chief, Larkspur Fire Department. Personal Communication with LSA Associates, Inc.
May 22. 3 Larkspur, City of, 2011. Capabilities of Your Fire Department. Website: www.ci.larkspur.ca.us/
DocumentView.aspx?DID=190 (accessed May 21, 2012). 4 Note that the Fire Chief position is split between the Administrative Services Division (50 percent), the Fire
Prevention Division (10 percent), the Emergency Medical Services (30 percent) and the Building Code Enforcement Division (10 percent).
5 Larkspur, City of, 2011. City of Larkspur Adopted Budget FY2011-2012. June.
L S A A S S O C I A T E S , I N C . L A R K S P U R S M A R T S T A T I O N A R E A P L A N J U L Y 2 0 1 2 B A S E L I N E E N V I R O N M E N T A L C O N D I T I O N S 7 . P U B L I C S E R V I C E S
P:\BMD1201 Larkspur\PRODUCTS\Working Papers\7-PublicServices.doc (7/30/2012) DRAFT 2 2
2. Existing Facilities
The LFD operates out of two fire stations. The main fire station – Fire Station 15 – is located at 420 Magnolia Avenue. Originally built in 1939, Fire Station 15 is staffed by three employees per shift: a chief officer, a captain and one engineer/firefighter. One fire engine and one water tender (i.e., water tanker) is housed at Fire Station 15.6 Fire Station 15 has been identified as needing extensive reha-bilitation, including structural repairs and redesign to bring the station up to seismic safety require-ments and to better accommodate its use as a fire station; however, no schedule or funding has been identified for this rehabilitation. Fire Station 16 is located at 15 Barry Way and is staffed by a captain and two engineer/firefighters. Two fire engines (one on-duty and one reserve) and one wildland fire engine are housed at Fire Station 16.7 Fire Station 16 was demolished and replaced on the same site with a new station in 1990. This new station is designed in two modular sections, one for an engine room, and the other for an office/living unit. Fire Station 16, which is approximately 3 miles (driving distance) from the Plan area, is the closest station, and would be the first responder in an emergency. 3. Types of Calls and Department Goals
The LFD receives approximately 1,500 calls each year, 70 percent of which are related to medical rescue. Cardiac, respiratory and neurological emergencies, falls and vehicle collisions are the most common call types.8 The target response time for fire protection services is 5 to 7 minutes or less, 90 percent of the time.9 4. Fire Prevention Programs
The LFD administers fire prevention activities designed to reduce fire loss, preserve life and control other hazardous conditions. Additionally, the LFD conducts plan reviews and inspections to ensure that new construction or the remodeling of existing building conforms to applicable codes and safety ordinances.10 Each of these program components are described in further detail below:
Community Emergency Response Training. The Marin County fire departments, including the LFD, have adopted a citizen training program: Community Emergency Response Training (CERT). CERT is designed to train citizens to care for themselves and neighbors in the event of a disaster, such as an earthquake or wildland fire.
Cardiopulmonary Resuscitation Training. The LFD offers Cardiopulmonary Resuscitation (CPR) training. This approximately three-hour class gives students the skills needed to handle basic emergencies as well as CPR and choke-saving skills, and students are certified through the American Heart Association.
6 Larkspur, City of, 2012. Larkspur Fire Department, Fire Stations & Apparatus, website: www.ci.larkspur.ca.us/
index.aspx?nid=240 (accessed May 18, 2012). 7 Ibid. 8 Larkspur, City of, 2011. PowerPoint Presentation: Larkspur Fire Department. Website: ca-larkspur.civicplus.com/
DocumentCenter/Home/View/1080 (accessed May 21, 2012). 9 Sinnott, 2012, op. cit. 10 Larkspur, City of, 2012. Larkspur Fire Department, Prevention, Education & Preparedness. Website:
www.ci.larkspur.ca.us/index.aspx?NID=227 (accessed May 21, 2012).
L S A A S S O C I A T E S , I N C . L A R K S P U R S M A R T S T A T I O N A R E A P L A N J U L Y 2 0 1 2 B A S E L I N E E N V I R O N M E N T A L C O N D I T I O N S 7 . P U B L I C S E R V I C E S
P:\BMD1201 Larkspur\PRODUCTS\Working Papers\7-PublicServices.doc (7/30/2012) DRAFT 2 3
Neighborhood Emergency Response Training. Similar to CERT, the LFD has used the Neighborhood Emergency Response Team (NERT) program to train citizens to be better prepared and provide for themselves, their families, and their neighbors in the event of an emergency.
Vegetation Management. The LFD addresses wildland fire through their Master Fire Ordinance, which designates high-hazard fire zone areas, details specific vegetation problems, provides an abatement policy for the enforcement of fire hazards, addresses the need for chimney spark arrestors, and provides guidelines for vegetation management on properties within the City that are owned by public agencies and utilities.
5. Emergency Medical Services
The Ross Valley Paramedic Authority (RVPA) is responsible for EMS/paramedic emergency ambu-lance services for the communities of Corte Madera, Larkspur, Kentfield, Ross, San Anselmo, Sleepy Hollow, Fairfax, and County Service Area 27. While firefighters at the LFD are trained as paramedics and EMTs, and thus can provide medical care in an emergency, the LFD does not maintain any ambulances and thus relies on the RVPA for medical transport. The RVPA contracts with the Marin County Fire Department (MCFD).11 MCFD administers and staffs Medical Station 18 (Medic 18) at the Ross Valley Fire Station on 33 Sir Francis Drake Boulevard, Ross, CA.12 Medical Station 18 is approximately 3.1 miles from the Plan area (driving distance). One ambulance is staffed by two MCFD paramedics at all times.13 6. Larkspur General Plan Policies
The following policies from the 1990 General Plan are related to fire and emergency medical services. Community Facilities and Services Element Goal 6: Renovate and modify public buildings to meet future demands.
Policy p: Renovate public buildings to conform to seismic safety requirements, space needs, and use of new technology, while respecting historic values.
o Action Program 16: Rehabilitate City Hall and Fire Station 1 in accordance with structural design standards.
o Action Program 17: Explore the relocation of Fire Station 1 to allow potential future expansion of city services such as planning, library, recreation, etc., in existing historic building.
Health and Safety Element Goal 3: Avoid development in areas prone to natural hazards.
Policy e: Allow land uses in areas prone to natural hazards only with appropriate mitigation.
11 Marin, County of, 2012. Emergency Medical Services. Website: www.co.marin.ca.us/depts/fr/main/fire/
services.cfm (accessed May 21, 2012). April 25. 12 Marin County Fire Department, 2011. Fire Stations. Website: www.xmrfire.org/mrn/about/stations.aspx (accessed
May 21, 2012). 13 Sinnott, Bob, 2012. Executive Director, Ross Valley Medical Authority. Personal Communication with LSA
Associates, Inc. May 22.
L S A A S S O C I A T E S , I N C . L A R K S P U R S M A R T S T A T I O N A R E A P L A N J U L Y 2 0 1 2 B A S E L I N E E N V I R O N M E N T A L C O N D I T I O N S 7 . P U B L I C S E R V I C E S
P:\BMD1201 Larkspur\PRODUCTS\Working Papers\7-PublicServices.doc (7/30/2012) DRAFT 2 4
o Action Program 6: Continue to regulate development to assure the adequate mitigation of safety hazards on sites having a history or threat of slope instability, seismic activity (including liquefaction, subsidence, and differential settlement), flooding, or fire.
Goal 7: Protect Larkspur residents and property from fire hazards. Goal 8: Minimize the risk of wildland and structural fires, and ensure adequate fire protection.
Policy n: Provide fast and efficient fire suppression service to Larkspur residents.
o Action Program 27: Establish performance standards such as desired response times for police, fire, and other public services.
Policy o: Maintain an aggressive fire prevention program.
o Action Program 28: Continue to inspect all business, public buildings and apartment buildings annually for fire and building code violations.
o Action Program 29: Continue to require that all vacant lots annually be cleared of excessive vegetation.
o Action Program 30: Continue to require smoke alarms and Class C or better fire retardant roofs for all new construction.
Policy p: Establish more stringent fire protection standards for private development in high risk fire hazard areas.
o Action Program 31: Require that automatic sprinkler systems be installed in new residences in areas with difficult access and/or poor water supply.
o Action Program 32: Require that brush be cleared for a distance of 30 feet from residences in high fire-hazard areas.
o Action Program 33: Establish landscaping guidelines that encourage the use of fire-resistant plants in high fire-hazard areas.
B. POLICE SERVICES
This section describes police services within the Plan area. It includes a brief discussion of Twin Cities Police Authority (TCPA), staffing levels, facilities and programs, response times, and the most common types of emergencies reported in Larkspur. 1. Existing Staff
The TCPA provides police services for both the Town of Corte Madera and the City of Larkspur. In 1980, the TCPA was formed under a joint powers agreement between the two cities. Along with automatic response agreements between the surrounding jurisdictions of Tiburon, Belvedere, Larkspur, Mill Valley, and Marin County, the TCPA has a State Mutual Aid Agreement with the County Sheriff to provide services in emergency situations. The TCPA has 44 employees with 33 sworn full-time officers.14 The TCPA is divided into four divisions: Administration, Field Operations, Traffic and Support Services. Administration handles general department management duties and includes the police
14 Twin Cities Police Authority, 2012. Twin Cities Police Authority. Website: www.ci.larkspur.ca.us/ index.aspx?NID=446 (accessed May 21, 2012).
L S A A S S O C I A T E S , I N C . L A R K S P U R S M A R T S T A T I O N A R E A P L A N J U L Y 2 0 1 2 B A S E L I N E E N V I R O N M E N T A L C O N D I T I O N S 7 . P U B L I C S E R V I C E S
P:\BMD1201 Larkspur\PRODUCTS\Working Papers\7-PublicServices.doc (7/30/2012) DRAFT 2 5
chief, patrol captain, police lieutenant and the police chief’s secretary. Field Operations is responsible for carrying out the department's principal function of regulating criminal activities and providing emergency and public services. It is staffed by a captain, 5 sergeants, 19 police officers, and 3 com-munity service officers.15 The traffic division consists of three police motorcycle officers, which includes one sergeant.16 Finally, Support Services includes Investigations, which investigates assigned people- and property related crimes, and Communications, which runs the dispatch. Support Services includes three detectives, five dispatchers, one telecommunications specialist, and one dispatch supervisor.17 The TCPA calculates the need for new officers based on the number of officers per capita. The County average, which serves as a benchmark, is 2.03 officers per 1,000 people. TCPA is currently at 1.3 officers per 1,000 people.18 2. Existing Facilities and Beat Patrol
The TCPA’s only Police Station is located in Larkspur at 250 Doherty Drive, approximately 1 mile from the Plan area. The TCPA has a fleet of 11 marked and 6 unmarked police vehicles. Additional TCPA vehicles include: 3 motorcycle units, 2 radar trailers, 1 mobile sign board and 2 armored Humvees.19 The TCPA’s jurisdiction is split into three beats: the eastern portion of Corte Madera, a central area encompassing most of Larkspur and the western portion of Corte Madera, and the area from North Magnolia Avenue to north of Sir Francis Drake Boulevard. The Plan Area falls within the central area beat. There is always one officer in every beat with one supervisor. When fully staffed, a third and fourth officer acts as a general patrol or cover officer.20 3. Response Times
While the TCPA has no formally adopted response times, the smaller size of Corte Madera and Larkspur allow officers to respond anywhere within the jurisdiction within 1 to 5 minutes for emergency calls.21 4. Crime Statistics and Issues
In 2011, the TCPA received 19,827 calls for service. For the purposes of crime statistics, the TCPA defines Part I crimes to include: homicide, rape, robbery, assaults, burglary, theft, auto theft and
15 Twin Cities Police Authority, 2012. Field Operations. Website: www.ci.larkspur.ca.us/index.aspx?nid=349
(accessed May 21, 2012). 16 Twin Cities Police Authority, 2012. Traffic Services. Website: www.ci.larkspur.ca.us/index.aspx?nid=447
(accessed May 21, 2012). 17 Twin Cities Police Authority, 2012. Support Services. Website: www.ci.larkspur.ca.us/index.aspx?nid=353
(accessed May 21, 2012). 18 Shirk, Jim, 2012. Captain, Twin Cities Police Authority. Written communication with LSA Associates, Inc. June
6. 19 Kalili, Hamid, 2012. Sergeant, Twin Cities Police Authority. Personal communication with LSA Associates, Inc.
June 5. 20 Larkspur Citizen Advisory Committee, 2010. Meeting Minutes. Website: www.ci.larkspur.ca.us/
Archive.aspx?ADID=114 (accessed May 21, 2012). September 13. 21 Shirk, 2012, op. cit.
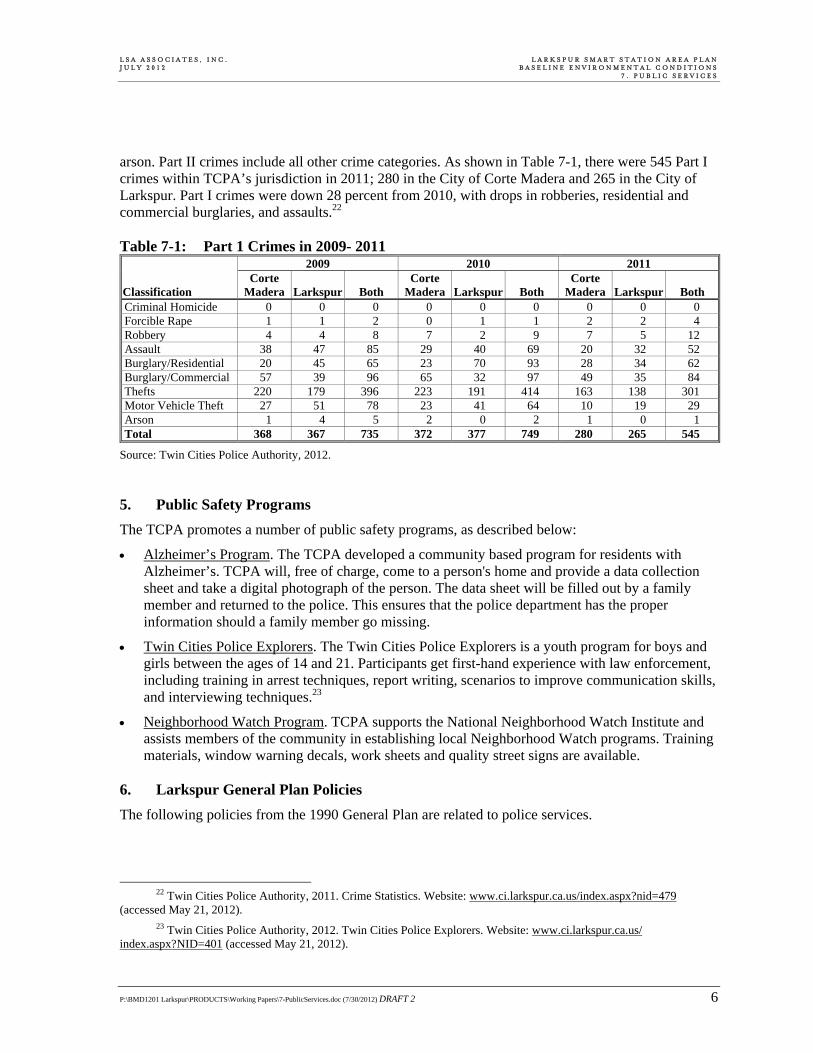
L S A A S S O C I A T E S , I N C . L A R K S P U R S M A R T S T A T I O N A R E A P L A N J U L Y 2 0 1 2 B A S E L I N E E N V I R O N M E N T A L C O N D I T I O N S 7 . P U B L I C S E R V I C E S
P:\BMD1201 Larkspur\PRODUCTS\Working Papers\7-PublicServices.doc (7/30/2012) DRAFT 2 6
arson. Part II crimes include all other crime categories. As shown in Table 7-1, there were 545 Part I crimes within TCPA’s jurisdiction in 2011; 280 in the City of Corte Madera and 265 in the City of Larkspur. Part I crimes were down 28 percent from 2010, with drops in robberies, residential and commercial burglaries, and assaults.22 Table 7-1: Part 1 Crimes in 2009- 2011 2009 2010 2011
Classification Corte
Madera Larkspur Both Corte
Madera Larkspur Both Corte
Madera Larkspur Both Criminal Homicide 0 0 0 0 0 0 0 0 0 Forcible Rape 1 1 2 0 1 1 2 2 4 Robbery 4 4 8 7 2 9 7 5 12 Assault 38 47 85 29 40 69 20 32 52 Burglary/Residential 20 45 65 23 70 93 28 34 62 Burglary/Commercial 57 39 96 65 32 97 49 35 84 Thefts 220 179 396 223 191 414 163 138 301 Motor Vehicle Theft 27 51 78 23 41 64 10 19 29 Arson 1 4 5 2 0 2 1 0 1 Total 368 367 735 372 377 749 280 265 545
Source: Twin Cities Police Authority, 2012. 5. Public Safety Programs
The TCPA promotes a number of public safety programs, as described below:
Alzheimer’s Program. The TCPA developed a community based program for residents with Alzheimer’s. TCPA will, free of charge, come to a person's home and provide a data collection sheet and take a digital photograph of the person. The data sheet will be filled out by a family member and returned to the police. This ensures that the police department has the proper information should a family member go missing.
Twin Cities Police Explorers. The Twin Cities Police Explorers is a youth program for boys and girls between the ages of 14 and 21. Participants get first-hand experience with law enforcement, including training in arrest techniques, report writing, scenarios to improve communication skills, and interviewing techniques.23
Neighborhood Watch Program. TCPA supports the National Neighborhood Watch Institute and assists members of the community in establishing local Neighborhood Watch programs. Training materials, window warning decals, work sheets and quality street signs are available.
6. Larkspur General Plan Policies
The following policies from the 1990 General Plan are related to police services.
22 Twin Cities Police Authority, 2011. Crime Statistics. Website: www.ci.larkspur.ca.us/index.aspx?nid=479
(accessed May 21, 2012). 23 Twin Cities Police Authority, 2012. Twin Cities Police Explorers. Website: www.ci.larkspur.ca.us/
index.aspx?NID=401 (accessed May 21, 2012).
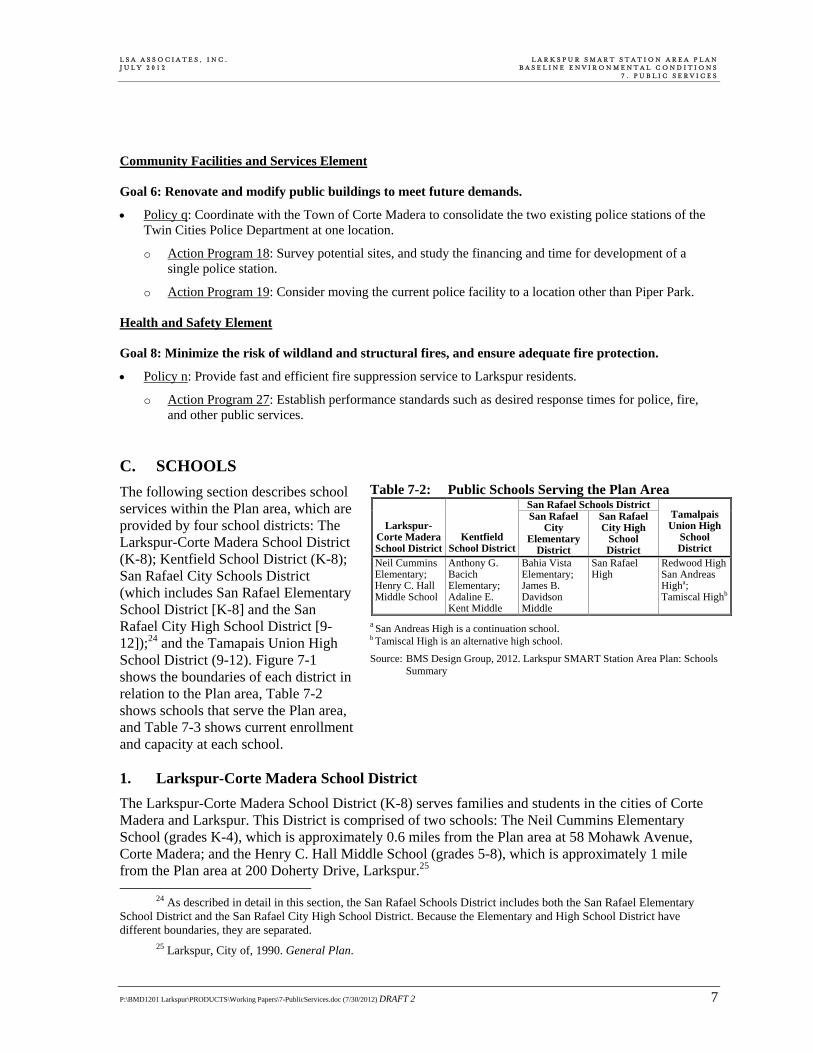
L S A A S S O C I A T E S , I N C . L A R K S P U R S M A R T S T A T I O N A R E A P L A N J U L Y 2 0 1 2 B A S E L I N E E N V I R O N M E N T A L C O N D I T I O N S 7 . P U B L I C S E R V I C E S
P:\BMD1201 Larkspur\PRODUCTS\Working Papers\7-PublicServices.doc (7/30/2012) DRAFT 2 7
Community Facilities and Services Element Goal 6: Renovate and modify public buildings to meet future demands.
Policy q: Coordinate with the Town of Corte Madera to consolidate the two existing police stations of the Twin Cities Police Department at one location.
o Action Program 18: Survey potential sites, and study the financing and time for development of a single police station.
o Action Program 19: Consider moving the current police facility to a location other than Piper Park. Health and Safety Element Goal 8: Minimize the risk of wildland and structural fires, and ensure adequate fire protection.
Policy n: Provide fast and efficient fire suppression service to Larkspur residents.
o Action Program 27: Establish performance standards such as desired response times for police, fire, and other public services.
C. SCHOOLS
The following section describes school services within the Plan area, which are provided by four school districts: The Larkspur-Corte Madera School District (K-8); Kentfield School District (K-8); San Rafael City Schools District (which includes San Rafael Elementary School District [K-8] and the San Rafael City High School District [9-12]);24 and the Tamapais Union High School District (9-12). Figure 7-1 shows the boundaries of each district in relation to the Plan area, Table 7-2 shows schools that serve the Plan area, and Table 7-3 shows current enrollment and capacity at each school. 1. Larkspur-Corte Madera School District
The Larkspur-Corte Madera School District (K-8) serves families and students in the cities of Corte Madera and Larkspur. This District is comprised of two schools: The Neil Cummins Elementary School (grades K-4), which is approximately 0.6 miles from the Plan area at 58 Mohawk Avenue, Corte Madera; and the Henry C. Hall Middle School (grades 5-8), which is approximately 1 mile from the Plan area at 200 Doherty Drive, Larkspur.25
24 As described in detail in this section, the San Rafael Schools District includes both the San Rafael Elementary School District and the San Rafael City High School District. Because the Elementary and High School District have different boundaries, they are separated.
25 Larkspur, City of, 1990. General Plan.
Table 7-2: Public Schools Serving the Plan Area San Rafael Schools District
Larkspur-Corte Madera School District
Kentfield School District
San Rafael City
Elementary District
San Rafael City High
School District
Tamalpais Union High
School District
Neil Cummins Elementary; Henry C. Hall Middle School
Anthony G. Bacich Elementary; Adaline E. Kent Middle
Bahia Vista Elementary; James B. Davidson Middle
San Rafael High
Redwood High San Andreas Higha; Tamiscal Highb
a San Andreas High is a continuation school. b Tamiscal High is an alternative high school.
Source: BMS Design Group, 2012. Larkspur SMART Station Area Plan: Schools Summary
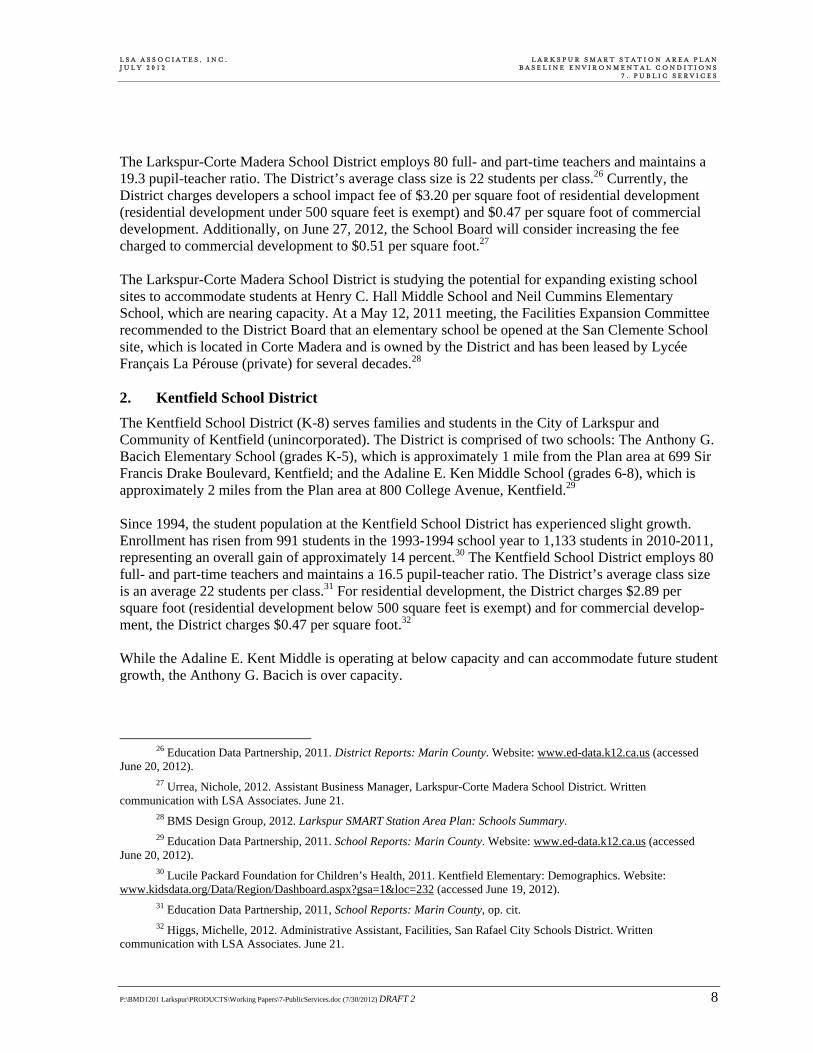
L S A A S S O C I A T E S , I N C . L A R K S P U R S M A R T S T A T I O N A R E A P L A N J U L Y 2 0 1 2 B A S E L I N E E N V I R O N M E N T A L C O N D I T I O N S 7 . P U B L I C S E R V I C E S
P:\BMD1201 Larkspur\PRODUCTS\Working Papers\7-PublicServices.doc (7/30/2012) DRAFT 2 8
The Larkspur-Corte Madera School District employs 80 full- and part-time teachers and maintains a 19.3 pupil-teacher ratio. The District’s average class size is 22 students per class.26 Currently, the District charges developers a school impact fee of $3.20 per square foot of residential development (residential development under 500 square feet is exempt) and $0.47 per square foot of commercial development. Additionally, on June 27, 2012, the School Board will consider increasing the fee charged to commercial development to $0.51 per square foot.27 The Larkspur-Corte Madera School District is studying the potential for expanding existing school sites to accommodate students at Henry C. Hall Middle School and Neil Cummins Elementary School, which are nearing capacity. At a May 12, 2011 meeting, the Facilities Expansion Committee recommended to the District Board that an elementary school be opened at the San Clemente School site, which is located in Corte Madera and is owned by the District and has been leased by Lycée Français La Pérouse (private) for several decades.28 2. Kentfield School District
The Kentfield School District (K-8) serves families and students in the City of Larkspur and Community of Kentfield (unincorporated). The District is comprised of two schools: The Anthony G. Bacich Elementary School (grades K-5), which is approximately 1 mile from the Plan area at 699 Sir Francis Drake Boulevard, Kentfield; and the Adaline E. Ken Middle School (grades 6-8), which is approximately 2 miles from the Plan area at 800 College Avenue, Kentfield.29 Since 1994, the student population at the Kentfield School District has experienced slight growth. Enrollment has risen from 991 students in the 1993-1994 school year to 1,133 students in 2010-2011, representing an overall gain of approximately 14 percent.30 The Kentfield School District employs 80 full- and part-time teachers and maintains a 16.5 pupil-teacher ratio. The District’s average class size is an average 22 students per class.31 For residential development, the District charges $2.89 per square foot (residential development below 500 square feet is exempt) and for commercial develop-ment, the District charges $0.47 per square foot.32 While the Adaline E. Kent Middle is operating at below capacity and can accommodate future student growth, the Anthony G. Bacich is over capacity.
26 Education Data Partnership, 2011. District Reports: Marin County. Website: www.ed-data.k12.ca.us (accessed
June 20, 2012). 27 Urrea, Nichole, 2012. Assistant Business Manager, Larkspur-Corte Madera School District. Written
communication with LSA Associates. June 21. 28 BMS Design Group, 2012. Larkspur SMART Station Area Plan: Schools Summary. 29 Education Data Partnership, 2011. School Reports: Marin County. Website: www.ed-data.k12.ca.us (accessed
June 20, 2012). 30 Lucile Packard Foundation for Children’s Health, 2011. Kentfield Elementary: Demographics. Website:
www.kidsdata.org/Data/Region/Dashboard.aspx?gsa=1&loc=232 (accessed June 19, 2012). 31 Education Data Partnership, 2011, School Reports: Marin County, op. cit. 32 Higgs, Michelle, 2012. Administrative Assistant, Facilities, San Rafael City Schools District. Written
communication with LSA Associates. June 21.
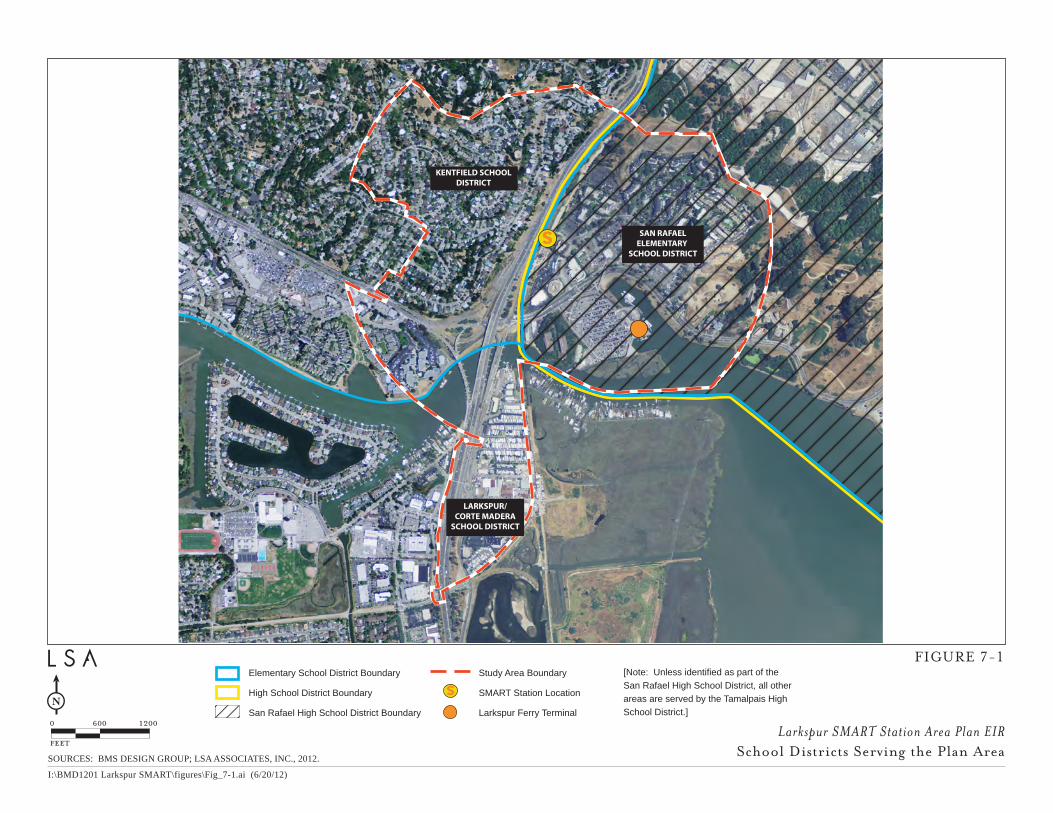
KENTFIELD SCHOOLDISTRICT
SAN RAFAELELEMENTARY
SCHOOL DISTRICT
LARKSPUR/CORTE MADERA
SCHOOL DISTRICT
s
feet
12000 600
[Note: Unless identified as part of the
San Rafael High School District, all other
areas are served by the Tamalpais High
School District.]
Elementary School District Boundary
High School District Boundary
San Rafael High School District Boundary
sStudy Area Boundary
SMART Station Location
Larkspur Ferry Terminal
FIGURE 7-1
SOURCES: BMS DESIGN GROUP; LSA ASSOCIATES, INC., 2012.
I:\BMD1201 Larkspur SMART\figures\Fig_7-1.ai (6/20/12)
Larkspur SMART Station Area Plan EIRSchool Districts Serving the Plan Area
L S A A S S O C I A T E S , I N C . L A R K S P U R S M A R T S T A T I O N A R E A P L A N J U L Y 2 0 1 2 B A S E L I N E E N V I R O N M E N T A L C O N D I T I O N S 7 . P U B L I C S E R V I C E S
P:\BMD1201 Larkspur\PRODUCTS\Working Papers\7-PublicServices.doc (7/30/2012) DRAFT 2 10
This page intentionally left blank.
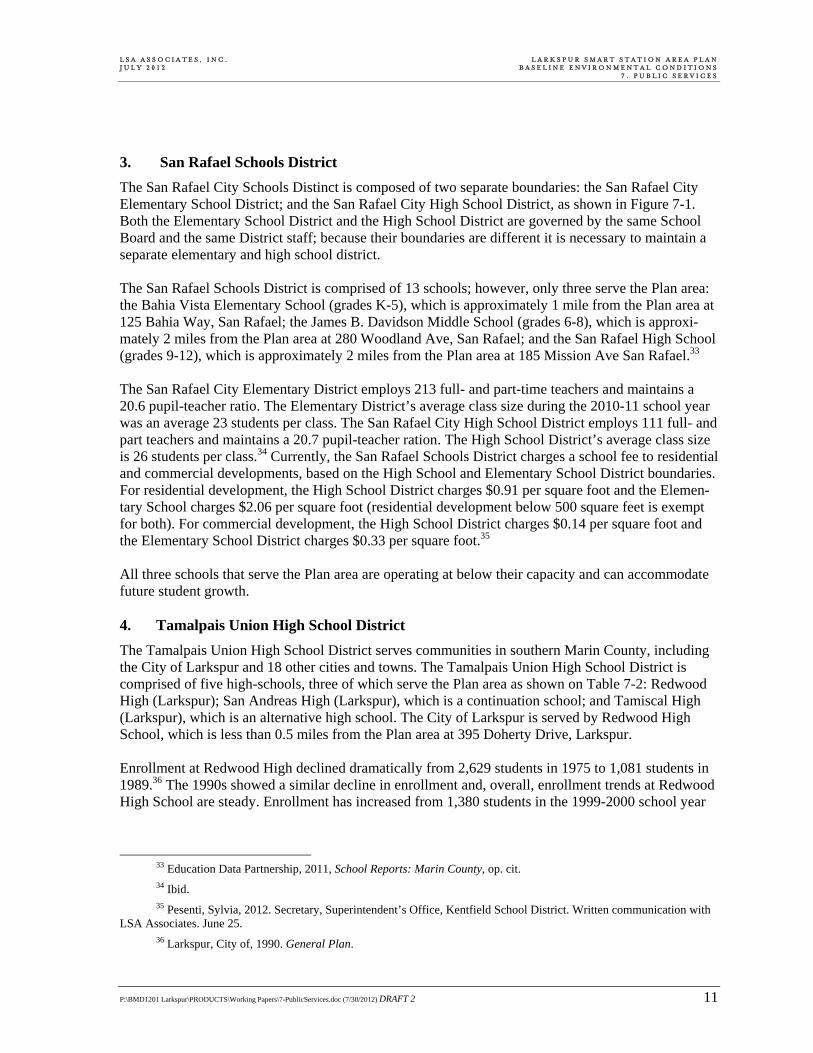
L S A A S S O C I A T E S , I N C . L A R K S P U R S M A R T S T A T I O N A R E A P L A N J U L Y 2 0 1 2 B A S E L I N E E N V I R O N M E N T A L C O N D I T I O N S 7 . P U B L I C S E R V I C E S
P:\BMD1201 Larkspur\PRODUCTS\Working Papers\7-PublicServices.doc (7/30/2012) DRAFT 2 11
3. San Rafael Schools District
The San Rafael City Schools Distinct is composed of two separate boundaries: the San Rafael City Elementary School District; and the San Rafael City High School District, as shown in Figure 7-1. Both the Elementary School District and the High School District are governed by the same School Board and the same District staff; because their boundaries are different it is necessary to maintain a separate elementary and high school district. The San Rafael Schools District is comprised of 13 schools; however, only three serve the Plan area: the Bahia Vista Elementary School (grades K-5), which is approximately 1 mile from the Plan area at 125 Bahia Way, San Rafael; the James B. Davidson Middle School (grades 6-8), which is approxi-mately 2 miles from the Plan area at 280 Woodland Ave, San Rafael; and the San Rafael High School (grades 9-12), which is approximately 2 miles from the Plan area at 185 Mission Ave San Rafael.33 The San Rafael City Elementary District employs 213 full- and part-time teachers and maintains a 20.6 pupil-teacher ratio. The Elementary District’s average class size during the 2010-11 school year was an average 23 students per class. The San Rafael City High School District employs 111 full- and part teachers and maintains a 20.7 pupil-teacher ration. The High School District’s average class size is 26 students per class.34 Currently, the San Rafael Schools District charges a school fee to residential and commercial developments, based on the High School and Elementary School District boundaries. For residential development, the High School District charges $0.91 per square foot and the Elemen-tary School charges $2.06 per square foot (residential development below 500 square feet is exempt for both). For commercial development, the High School District charges $0.14 per square foot and the Elementary School District charges $0.33 per square foot.35 All three schools that serve the Plan area are operating at below their capacity and can accommodate future student growth. 4. Tamalpais Union High School District
The Tamalpais Union High School District serves communities in southern Marin County, including the City of Larkspur and 18 other cities and towns. The Tamalpais Union High School District is comprised of five high-schools, three of which serve the Plan area as shown on Table 7-2: Redwood High (Larkspur); San Andreas High (Larkspur), which is a continuation school; and Tamiscal High (Larkspur), which is an alternative high school. The City of Larkspur is served by Redwood High School, which is less than 0.5 miles from the Plan area at 395 Doherty Drive, Larkspur. Enrollment at Redwood High declined dramatically from 2,629 students in 1975 to 1,081 students in 1989.36 The 1990s showed a similar decline in enrollment and, overall, enrollment trends at Redwood High School are steady. Enrollment has increased from 1,380 students in the 1999-2000 school year
33 Education Data Partnership, 2011, School Reports: Marin County, op. cit. 34 Ibid. 35 Pesenti, Sylvia, 2012. Secretary, Superintendent’s Office, Kentfield School District. Written communication with
LSA Associates. June 25. 36 Larkspur, City of, 1990. General Plan.
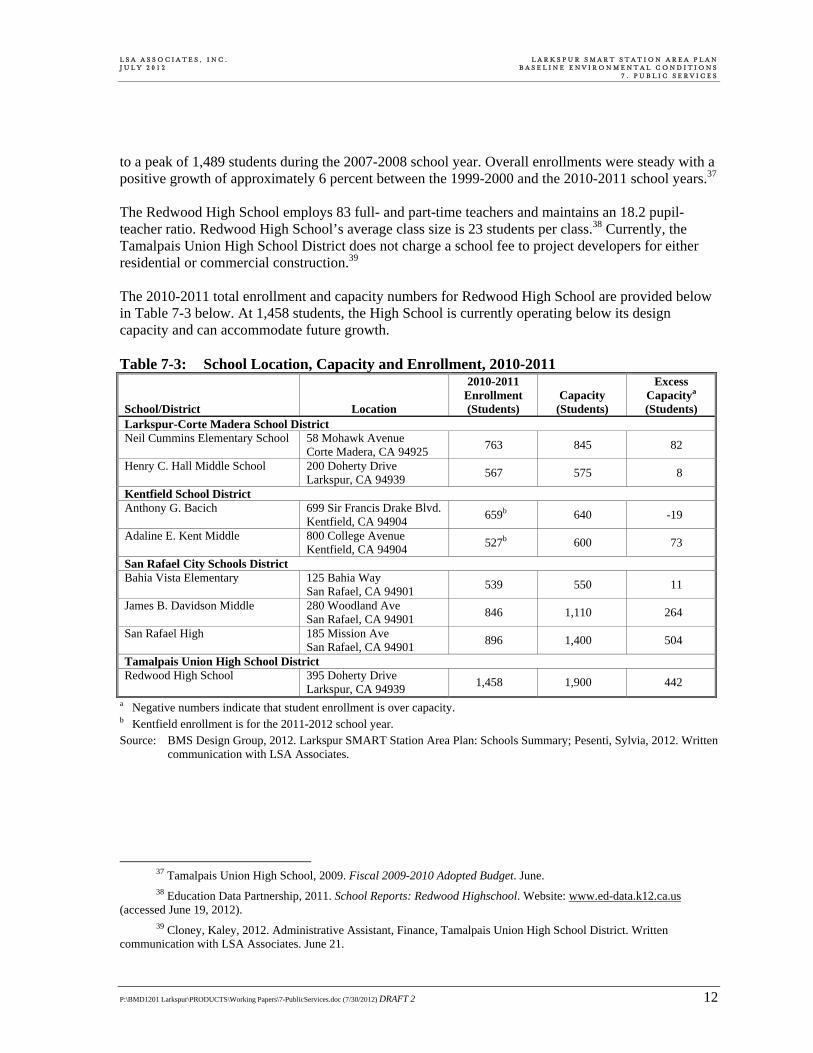
L S A A S S O C I A T E S , I N C . L A R K S P U R S M A R T S T A T I O N A R E A P L A N J U L Y 2 0 1 2 B A S E L I N E E N V I R O N M E N T A L C O N D I T I O N S 7 . P U B L I C S E R V I C E S
P:\BMD1201 Larkspur\PRODUCTS\Working Papers\7-PublicServices.doc (7/30/2012) DRAFT 2 12
to a peak of 1,489 students during the 2007-2008 school year. Overall enrollments were steady with a positive growth of approximately 6 percent between the 1999-2000 and the 2010-2011 school years.37 The Redwood High School employs 83 full- and part-time teachers and maintains an 18.2 pupil-teacher ratio. Redwood High School’s average class size is 23 students per class.38 Currently, the Tamalpais Union High School District does not charge a school fee to project developers for either residential or commercial construction.39 The 2010-2011 total enrollment and capacity numbers for Redwood High School are provided below in Table 7-3 below. At 1,458 students, the High School is currently operating below its design capacity and can accommodate future growth. Table 7-3: School Location, Capacity and Enrollment, 2010-2011
School/District Location
2010-2011 Enrollment (Students)
Capacity (Students)
Excess Capacitya (Students)
Larkspur-Corte Madera School District Neil Cummins Elementary School 58 Mohawk Avenue
Corte Madera, CA 94925 763 845 82
Henry C. Hall Middle School 200 Doherty Drive Larkspur, CA 94939
567 575 8
Kentfield School District Anthony G. Bacich 699 Sir Francis Drake Blvd.
Kentfield, CA 94904 659b 640 -19
Adaline E. Kent Middle 800 College Avenue Kentfield, CA 94904
527b 600 73
San Rafael City Schools District Bahia Vista Elementary 125 Bahia Way
San Rafael, CA 94901 539 550 11
James B. Davidson Middle 280 Woodland Ave San Rafael, CA 94901
846 1,110 264
San Rafael High 185 Mission Ave San Rafael, CA 94901
896 1,400 504
Tamalpais Union High School District Redwood High School 395 Doherty Drive
Larkspur, CA 94939 1,458 1,900 442
a Negative numbers indicate that student enrollment is over capacity. b Kentfield enrollment is for the 2011-2012 school year.
Source: BMS Design Group, 2012. Larkspur SMART Station Area Plan: Schools Summary; Pesenti, Sylvia, 2012. Written communication with LSA Associates.
37 Tamalpais Union High School, 2009. Fiscal 2009-2010 Adopted Budget. June. 38 Education Data Partnership, 2011. School Reports: Redwood Highschool. Website: www.ed-data.k12.ca.us
(accessed June 19, 2012). 39 Cloney, Kaley, 2012. Administrative Assistant, Finance, Tamalpais Union High School District. Written
communication with LSA Associates. June 21.
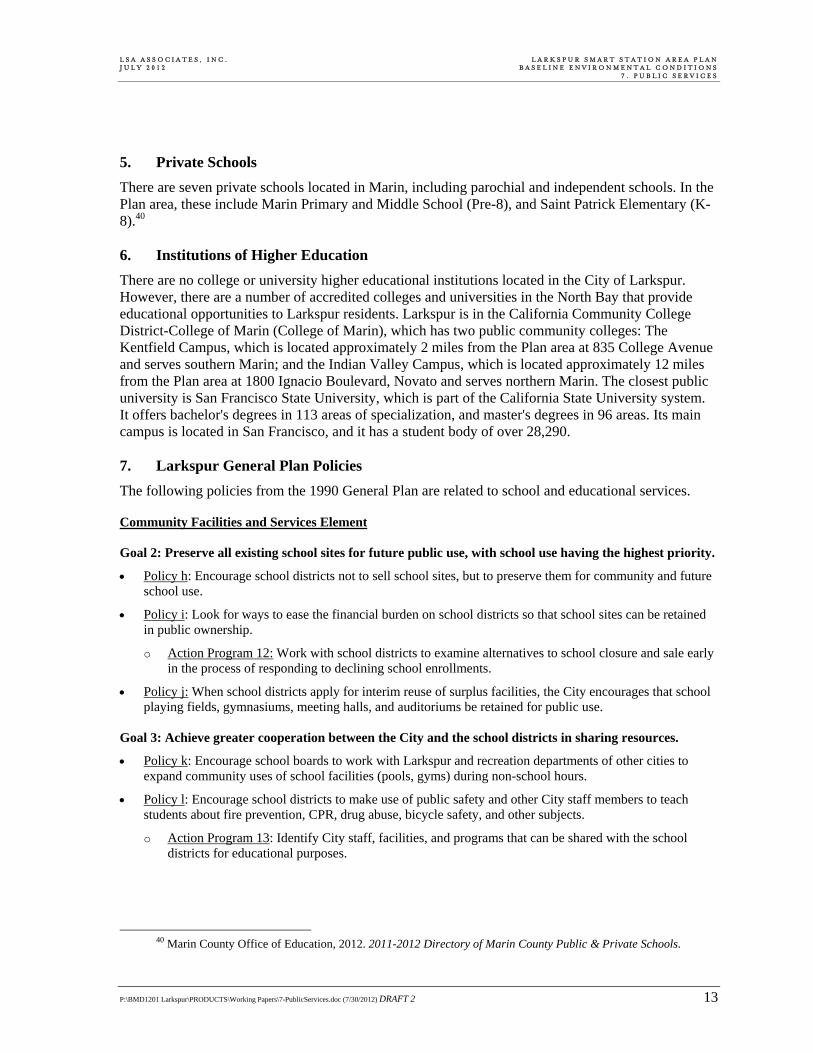
L S A A S S O C I A T E S , I N C . L A R K S P U R S M A R T S T A T I O N A R E A P L A N J U L Y 2 0 1 2 B A S E L I N E E N V I R O N M E N T A L C O N D I T I O N S 7 . P U B L I C S E R V I C E S
P:\BMD1201 Larkspur\PRODUCTS\Working Papers\7-PublicServices.doc (7/30/2012) DRAFT 2 13
5. Private Schools
There are seven private schools located in Marin, including parochial and independent schools. In the Plan area, these include Marin Primary and Middle School (Pre-8), and Saint Patrick Elementary (K-8).40 6. Institutions of Higher Education
There are no college or university higher educational institutions located in the City of Larkspur. However, there are a number of accredited colleges and universities in the North Bay that provide educational opportunities to Larkspur residents. Larkspur is in the California Community College District-College of Marin (College of Marin), which has two public community colleges: The Kentfield Campus, which is located approximately 2 miles from the Plan area at 835 College Avenue and serves southern Marin; and the Indian Valley Campus, which is located approximately 12 miles from the Plan area at 1800 Ignacio Boulevard, Novato and serves northern Marin. The closest public university is San Francisco State University, which is part of the California State University system. It offers bachelor's degrees in 113 areas of specialization, and master's degrees in 96 areas. Its main campus is located in San Francisco, and it has a student body of over 28,290. 7. Larkspur General Plan Policies
The following policies from the 1990 General Plan are related to school and educational services. Community Facilities and Services Element Goal 2: Preserve all existing school sites for future public use, with school use having the highest priority.
Policy h: Encourage school districts not to sell school sites, but to preserve them for community and future school use.
Policy i: Look for ways to ease the financial burden on school districts so that school sites can be retained in public ownership.
o Action Program 12: Work with school districts to examine alternatives to school closure and sale early in the process of responding to declining school enrollments.
Policy j: When school districts apply for interim reuse of surplus facilities, the City encourages that school playing fields, gymnasiums, meeting halls, and auditoriums be retained for public use.
Goal 3: Achieve greater cooperation between the City and the school districts in sharing resources.
Policy k: Encourage school boards to work with Larkspur and recreation departments of other cities to expand community uses of school facilities (pools, gyms) during non-school hours.
Policy l: Encourage school districts to make use of public safety and other City staff members to teach students about fire prevention, CPR, drug abuse, bicycle safety, and other subjects.
o Action Program 13: Identify City staff, facilities, and programs that can be shared with the school districts for educational purposes.
40 Marin County Office of Education, 2012. 2011-2012 Directory of Marin County Public & Private Schools.
L S A A S S O C I A T E S , I N C . L A R K S P U R S M A R T S T A T I O N A R E A P L A N J U L Y 2 0 1 2 B A S E L I N E E N V I R O N M E N T A L C O N D I T I O N S 7 . P U B L I C S E R V I C E S
P:\BMD1201 Larkspur\PRODUCTS\Working Papers\7-PublicServices.doc (7/30/2012) DRAFT 2 14
D. SOLID WASTE AND MAINTENANCE SERVICES
The following section describes solid waste and maintenance services in the City of Larkspur. 1. Solid Waste Services
Marin Sanitary Services (MMS) provides solid waste and recycling services to the Plan area. These services include weekly garbage, recycling, food scrap and yard waste collection services to residential customers and businesses. All refuse collected is transferred to the Marin Sanitary Service Transfer Station (Transfer Station) at 1060 Andersen Drive in San Rafael and then transported to the Redwood Sanitary Landfill. MMS delivers recyclable materials and yard waste to either the Marin Resource and Recovery (MRR) or the Marin Resource Recovery Center (MRRC), where the materi-als are processed. Residual waste from both facilities is sent to the Transfer Station. Yard waste is delivered to Northern Recycling Compost-Zamora for composting.41 2. City Maintenance
The City of Larkspur provides street sweeping services to each city-maintained street on a monthly basis. The streets are swept twice a month from October through January through a contract with MSS.42 3. Larkspur General Plan Policies
The following policies from the 1990 General Plan are related to solid waste and maintenance. Environmental Resources Element Goal 6: Reduce the Total Volume of the City’s Waste Stream.
Policy k: Support programs to recycle paper, cardboard, glass, metal, plastics, motor oil, and to compost or generate energy from tree prunings, brush and other vegetation.
o Action Program 18: Promote the use of goods containing recycled materials through City purchasing policies and other efforts.
Health and Safety Element Goal 9: Protect Larkspur from accidental exposure to hazardous materials from spills, leaks, vapor
releases, and improper or illegal storage and disposal.
Policy q: Limit the use and storage of hazardous materials in Larkspur to commercial and industrial areas.
o Action Program 34: Designate zone districts where hazardous materials can be used and stored.
o Action Program 35: Closely monitor and enforce regulations concerning the use and handling of hazardous materials.
o Action Program 36: Require transporters of hazardous materials to notify the City before moving such materials along City streets.
41 Hilton Farnkopf & Hobson (HF&H) Consultants, 2009. Review of Marin Sanitary Sewer’s 2010 Rate Application.
December 32. 42 Larkspur, City of, 2012. Frequently Asked Questions, “When is My Street Scheduled to be Swept?” Website:
www.ci.larkspur.ca.us/FAQ.aspx?QID=108 (accessed May 21, 2012).
P:\BMD1201 Larkspur\PRODUCTS\Working Papers\8-CulturalResources.doc (7/30/2012) DRAFT 2 1
8. CULTURAL RESOURCES
This chapter identifies the cultural resources in the vicinity of the Larkspur SMART Station Area Plan (Plan) area. Cultural resources are sites, buildings, structures, objects, and districts that may have traditional or cultural value for their historical significance. Cultural resources include a broad range of resources, examples of which include archaeological sites, historic roadways and railroad tracks, and buildings of architectural significance. Under the California Environmental Quality Act (CEQA), paleontological resources are a subset of cultural resources and include fossil plants and animals, and evidence of past life such as trace fossils and tracks. This chapter contains: (1) a description of the methods used by LSA to obtain the baseline informa-tion for cultural resources; (2) an overview of the Plan area’s prehistoric, ethnographic, historical, and paleontological settings; and (3) an overview of the local and State regulations that pertain to cultural resources. A. METHODS
The methods used to develop the baseline conditions for cultural resources in the Plan area consist of records searches and a literature review. No archaeological or architectural field studies were under-taken by LSA; only previously prepared documentation was used. 1. Records Searches
A summary of the records searches conducted is provided below. a. Northwest Information Center. LSA conducted a records search on June 11, 2012, at the Northwest Information Center (NWIC) of the California Historical Resources Information System, Sonoma State University, Rohnert Park, California.1 The records search identified recorded cultural resources within the Plan area and provided information about the general sensitivity of the area for prehistoric and historical cultural resources. LSA reviewed other State and local cultural resource inventories, including:
California Inventory of Historic Resources;2
Five Views: An Ethnic Historic Sites Survey for California;3
1 The NWIC is an affiliate of the California Office of Historic Preservation and is the official State repository of
cultural resources reports and records for Marin County. 2 California Department of Parks and Recreation, 1976. California Inventory of Historic Resources. Sacramento. 3 California Department of Parks and Recreation, Office of Historic Preservation, 1988. Five Views: An Ethnic
Historic Site Survey for California. Sacramento.
L S A A S S O C I A T E S , I N C . L A R K S P U R S M A R T S T A T I O N A R E A P L A N J U L Y 2 0 1 2 B A S E L I N E E N V I R O N M E N T A L C O N D I T I O N S 8 . C U L T U R A L R E S O U R C E S
P:\BMD1201 Larkspur\PRODUCTS\Working Papers\8-CulturalResources.doc (7/30/2012) DRAFT 2 2
Directory of Properties in the Historic Property Data File for Marin County.4 The directory includes the listings of the National Register of Historic Places, National Historic Landmarks, the California Register of Historical Resources, California Historical Landmarks, and California Points of Historical Interest;
Shipwreck Database;5 and
City of Larkspur Historic Resources Inventory.6 b. Native American Heritage Commission. On June 13, 2012, LSA faxed and mailed a letter describing the project and a map depicting the Plan area to the Native American Heritage Commis-sion (NAHC) in Sacramento requesting a review of the Sacred Lands File for any Native American cultural resources that might be affected by the proposed project.7 2. Literature Review
LSA conducted a literature review of the Plan area for archaeological, ethnographic, historical, and environmental information for cultural resources baseline conditions. This review included previous cultural resource background reports prepared for projects within the Plan area, including the Historic Resources and Archaeological Resources sections of the SMART EIR (2005). The City’s General Plan and Municipal Code were also reviewed to identify policies and guidelines pertinent to cultural resources. LSA also reviewed paleontological and geological maps and literature pertaining to the Plan area to prepare the paleontological setting section below. B. CULTURAL RESOURCES SETTING
This section briefly describes the setting for cultural resources in the Plan area as informed by the records searches and literature review described above. 1. Prehistory
The Paleo-Archaic-Emergent cultural sequence developed by Fredrickson8,9 is commonly used to interpret the prehistoric occupation of Central California. The sequence consists of three broad periods: the Paleoindian Period (10,000-6000 B.C.); the three-stage Archaic Period, consisting of the
4 California Department of Parks and Recreation, 2011. Office of Historic Preservation, Directory of Properties in the Historic Property Data File. Sacramento. August 15.
5 California State Lands Commission, 2012. Shipwreck Database Search Form. Electronic document: shipwrecks.slc.ca.gov/ShipwrecksDatabase/Shipwrecks_Database.asp (accessed June 7, 2012).
6 Larkspur, City of, 2008. Historic Resources Inventory. Electronic document, www.ci.larkspur.ca.us/ DocumentCenter/Home/View/411 (accessed June 7, 2012).
7 The NAHC is the official state repository of Native American sacred site location records. 8 Fredrickson, David A., 1974. Cultural Diversity in Early Central California: A View from the North Coast Ranges.
Journal of California Anthropology 1(1):41-53. 9 Fredrickson, David A., 1994. Archaeological Taxonomy in Central California Reconsidered. In Toward a New
Taxonomic Framework for Central California Archaeology, pp. 91-103. Contributions of the University of California Archaeological Research Facility, Number 52, edited by Richard E. Hughes, Berkeley.
L S A A S S O C I A T E S , I N C . L A R K S P U R S M A R T S T A T I O N A R E A P L A N J U L Y 2 0 1 2 B A S E L I N E E N V I R O N M E N T A L C O N D I T I O N S 8 . C U L T U R A L R E S O U R C E S
P:\BMD1201 Larkspur\PRODUCTS\Working Papers\8-CulturalResources.doc (7/30/2012) DRAFT 2 3
Lower Archaic (6000-3000 B.C.), Middle Archaic (3000-500 B.C.), and Upper Archaic (500 B.C.-A.D. 1000); and the Emergent Period (A.D. 1000-1800). The Paleoindian Period began with the first entry of people into California. These people probably subsisted mainly on big game, minimally processed plant foods, and had few or no trade networks. During the Lower Archaic, milling stones for plant processing are abundant and hunting is less important than obtaining plant foods. Artifacts are predominantly of local materials, suggesting that few if any extensive trade networks were established at this time. During the Middle Archaic, the subsistence base begins to expand and diversify with a developing acorn economy, as evidenced by the mortar and pestle, and the growing importance of hunting. Status and wealth distinctions are evidenced in the Upper Archaic archaeological record, and regional trade networks are well established at this time for the exchange of goods and ideas, such as obsidian and Kuksu ceremonial practices involving spirit impersonations. Increasing social complexity continued during the Lower Emergent. Territorial boundaries were well established by this time with regularized inter-group exchanges involving more and varied goods, people, and ideas. Bow and arrow technology was also introduced. By the Upper Emergent, a monetary system based on the clamshell disk bead had been established. Native population reached its zenith during this time, as evidenced by high site densities and large village sites in the archaeological record. Excavations at archaeological site CA-MRN-255/H in the Plan area yielded numerous prehistoric artifacts, including stone tool chipping waste; projectile points and bifaces; bone, antler, and shell artifacts, including awls and beads; mortars and pestles; shellfish roasting pits; and Native American graves.10 The artifacts and dates obtained from CA-MRN-255/H indicate that the site that was occupied by family units for much of the year during the Upper Archaic Period. The occupants of CA-MRN-255/H hunted a variety of game, took fish and shellfish from the Bay, and exchanged items (e.g., obsidian) with groups to the north in Napa Valley and near present-day Santa Rosa. 2. Ethnography
The Plan area is in the ethnographic territory of the Coast Miwok, who occupied what are now Marin and southern Sonoma counties.11 The Coast Miwok language is subsumed under the Penutian language stock and includes two dialects: Western, or Bodega, and Southern, or Marin, with Southern being further divided into valley and coast.12,13 Coast Miwok territories were comprised of one or more land-holding groups that anthropologists refer to as “tribelets.” The tribelet, a nearly universal characteristic throughout native California, consists of a principle village occupied year round, and a series of smaller hamlets and resource
10 Bieling, David G., 2000. Archaeological Investigations at CA-MRN-255/H, Larkspur, Marin County, California.
Holman & Associates, San Francisco, California. 11 Kelly, Isabel, 1978. Coast Miwok. In California, edited by Robert F. Heizer, pp. 485-495. Handbook of North
American Indians, Volume 8, William C. Sturtevant, general editor. Smithsonian Institution, Washington, D.C. 12 Barrett, Samuel A., 1908. The Ethno-geography of the Pomo and Neighboring Indians. University of California
Publications in American Archaeology and Ethnology 6(1). Berkeley. 13 Kelly, Isabel, 1978. Native Languages of California. In California, edited by Robert F. Heizer, pp. 80-90.
Handbook of North American Indians, Volume 8, William C. Sturtevant, general editor. Smithsonian Institution, Washington, D.C.
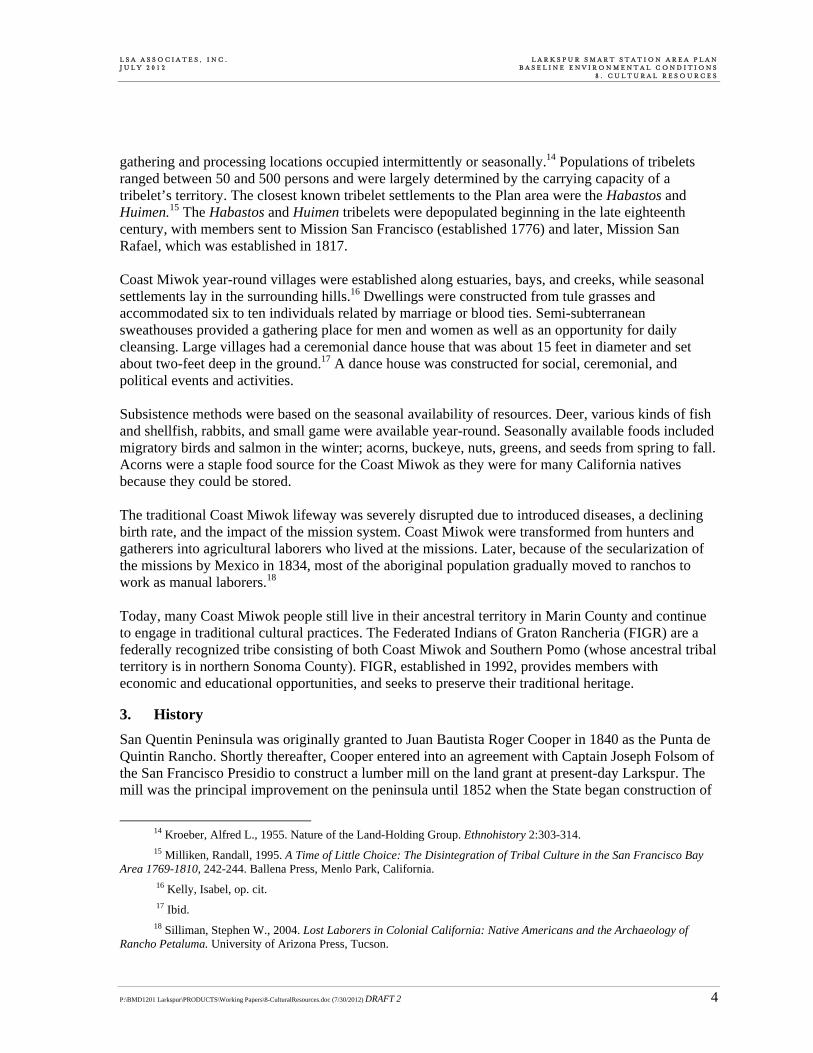
L S A A S S O C I A T E S , I N C . L A R K S P U R S M A R T S T A T I O N A R E A P L A N J U L Y 2 0 1 2 B A S E L I N E E N V I R O N M E N T A L C O N D I T I O N S 8 . C U L T U R A L R E S O U R C E S
P:\BMD1201 Larkspur\PRODUCTS\Working Papers\8-CulturalResources.doc (7/30/2012) DRAFT 2 4
gathering and processing locations occupied intermittently or seasonally.14 Populations of tribelets ranged between 50 and 500 persons and were largely determined by the carrying capacity of a tribelet’s territory. The closest known tribelet settlements to the Plan area were the Habastos and Huimen.15 The Habastos and Huimen tribelets were depopulated beginning in the late eighteenth century, with members sent to Mission San Francisco (established 1776) and later, Mission San Rafael, which was established in 1817. Coast Miwok year-round villages were established along estuaries, bays, and creeks, while seasonal settlements lay in the surrounding hills.16 Dwellings were constructed from tule grasses and accommodated six to ten individuals related by marriage or blood ties. Semi-subterranean sweathouses provided a gathering place for men and women as well as an opportunity for daily cleansing. Large villages had a ceremonial dance house that was about 15 feet in diameter and set about two-feet deep in the ground.17 A dance house was constructed for social, ceremonial, and political events and activities. Subsistence methods were based on the seasonal availability of resources. Deer, various kinds of fish and shellfish, rabbits, and small game were available year-round. Seasonally available foods included migratory birds and salmon in the winter; acorns, buckeye, nuts, greens, and seeds from spring to fall. Acorns were a staple food source for the Coast Miwok as they were for many California natives because they could be stored. The traditional Coast Miwok lifeway was severely disrupted due to introduced diseases, a declining birth rate, and the impact of the mission system. Coast Miwok were transformed from hunters and gatherers into agricultural laborers who lived at the missions. Later, because of the secularization of the missions by Mexico in 1834, most of the aboriginal population gradually moved to ranchos to work as manual laborers.18 Today, many Coast Miwok people still live in their ancestral territory in Marin County and continue to engage in traditional cultural practices. The Federated Indians of Graton Rancheria (FIGR) are a federally recognized tribe consisting of both Coast Miwok and Southern Pomo (whose ancestral tribal territory is in northern Sonoma County). FIGR, established in 1992, provides members with economic and educational opportunities, and seeks to preserve their traditional heritage.
3. History
San Quentin Peninsula was originally granted to Juan Bautista Roger Cooper in 1840 as the Punta de Quintin Rancho. Shortly thereafter, Cooper entered into an agreement with Captain Joseph Folsom of the San Francisco Presidio to construct a lumber mill on the land grant at present-day Larkspur. The mill was the principal improvement on the peninsula until 1852 when the State began construction of
14 Kroeber, Alfred L., 1955. Nature of the Land-Holding Group. Ethnohistory 2:303-314. 15 Milliken, Randall, 1995. A Time of Little Choice: The Disintegration of Tribal Culture in the San Francisco Bay
Area 1769-1810, 242-244. Ballena Press, Menlo Park, California. 16 Kelly, Isabel, op. cit. 17 Ibid.
18 Silliman, Stephen W., 2004. Lost Laborers in Colonial California: Native Americans and the Archaeology of Rancho Petaluma. University of Arizona Press, Tucson.
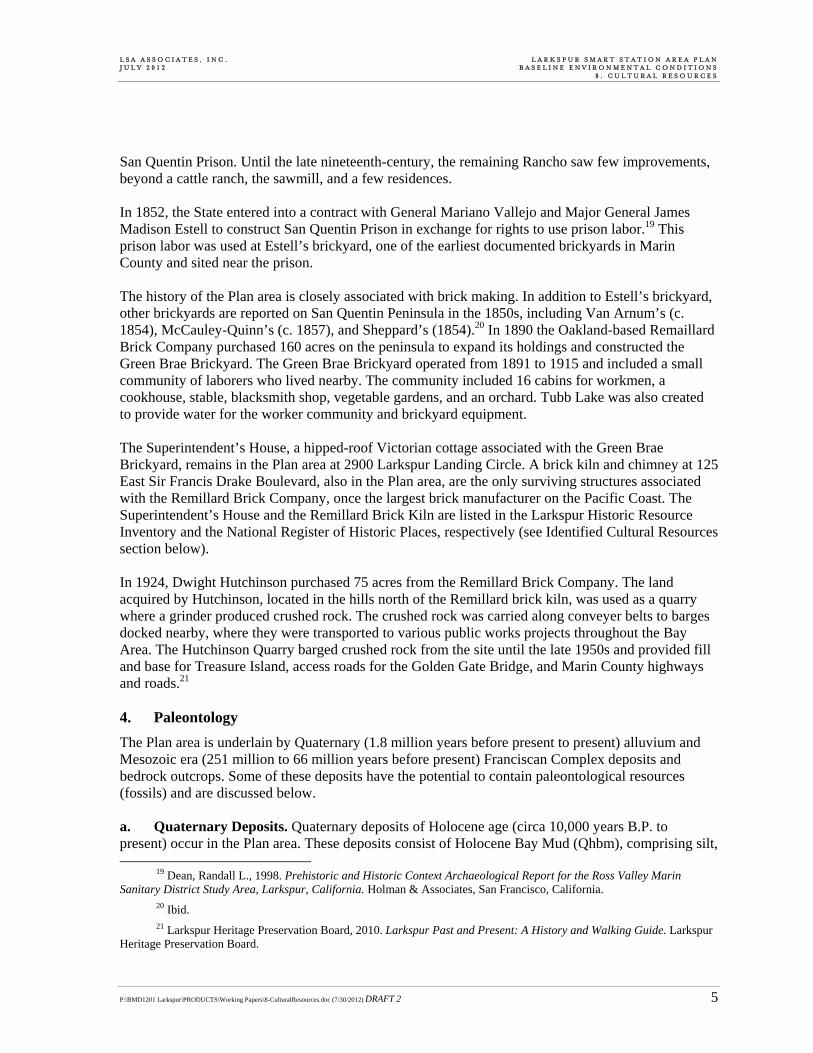
L S A A S S O C I A T E S , I N C . L A R K S P U R S M A R T S T A T I O N A R E A P L A N J U L Y 2 0 1 2 B A S E L I N E E N V I R O N M E N T A L C O N D I T I O N S 8 . C U L T U R A L R E S O U R C E S
P:\BMD1201 Larkspur\PRODUCTS\Working Papers\8-CulturalResources.doc (7/30/2012) DRAFT 2 5
San Quentin Prison. Until the late nineteenth-century, the remaining Rancho saw few improvements, beyond a cattle ranch, the sawmill, and a few residences. In 1852, the State entered into a contract with General Mariano Vallejo and Major General James Madison Estell to construct San Quentin Prison in exchange for rights to use prison labor.19 This prison labor was used at Estell’s brickyard, one of the earliest documented brickyards in Marin County and sited near the prison. The history of the Plan area is closely associated with brick making. In addition to Estell’s brickyard, other brickyards are reported on San Quentin Peninsula in the 1850s, including Van Arnum’s (c. 1854), McCauley-Quinn’s (c. 1857), and Sheppard’s (1854).20 In 1890 the Oakland-based Remaillard Brick Company purchased 160 acres on the peninsula to expand its holdings and constructed the Green Brae Brickyard. The Green Brae Brickyard operated from 1891 to 1915 and included a small community of laborers who lived nearby. The community included 16 cabins for workmen, a cookhouse, stable, blacksmith shop, vegetable gardens, and an orchard. Tubb Lake was also created to provide water for the worker community and brickyard equipment. The Superintendent’s House, a hipped-roof Victorian cottage associated with the Green Brae Brickyard, remains in the Plan area at 2900 Larkspur Landing Circle. A brick kiln and chimney at 125 East Sir Francis Drake Boulevard, also in the Plan area, are the only surviving structures associated with the Remillard Brick Company, once the largest brick manufacturer on the Pacific Coast. The Superintendent’s House and the Remillard Brick Kiln are listed in the Larkspur Historic Resource Inventory and the National Register of Historic Places, respectively (see Identified Cultural Resources section below). In 1924, Dwight Hutchinson purchased 75 acres from the Remillard Brick Company. The land acquired by Hutchinson, located in the hills north of the Remillard brick kiln, was used as a quarry where a grinder produced crushed rock. The crushed rock was carried along conveyer belts to barges docked nearby, where they were transported to various public works projects throughout the Bay Area. The Hutchinson Quarry barged crushed rock from the site until the late 1950s and provided fill and base for Treasure Island, access roads for the Golden Gate Bridge, and Marin County highways and roads.21 4. Paleontology
The Plan area is underlain by Quaternary (1.8 million years before present to present) alluvium and Mesozoic era (251 million to 66 million years before present) Franciscan Complex deposits and bedrock outcrops. Some of these deposits have the potential to contain paleontological resources (fossils) and are discussed below. a. Quaternary Deposits. Quaternary deposits of Holocene age (circa 10,000 years B.P. to present) occur in the Plan area. These deposits consist of Holocene Bay Mud (Qhbm), comprising silt,
19 Dean, Randall L., 1998. Prehistoric and Historic Context Archaeological Report for the Ross Valley Marin Sanitary District Study Area, Larkspur, California. Holman & Associates, San Francisco, California.
20 Ibid. 21 Larkspur Heritage Preservation Board, 2010. Larkspur Past and Present: A History and Walking Guide. Larkspur
Heritage Preservation Board.
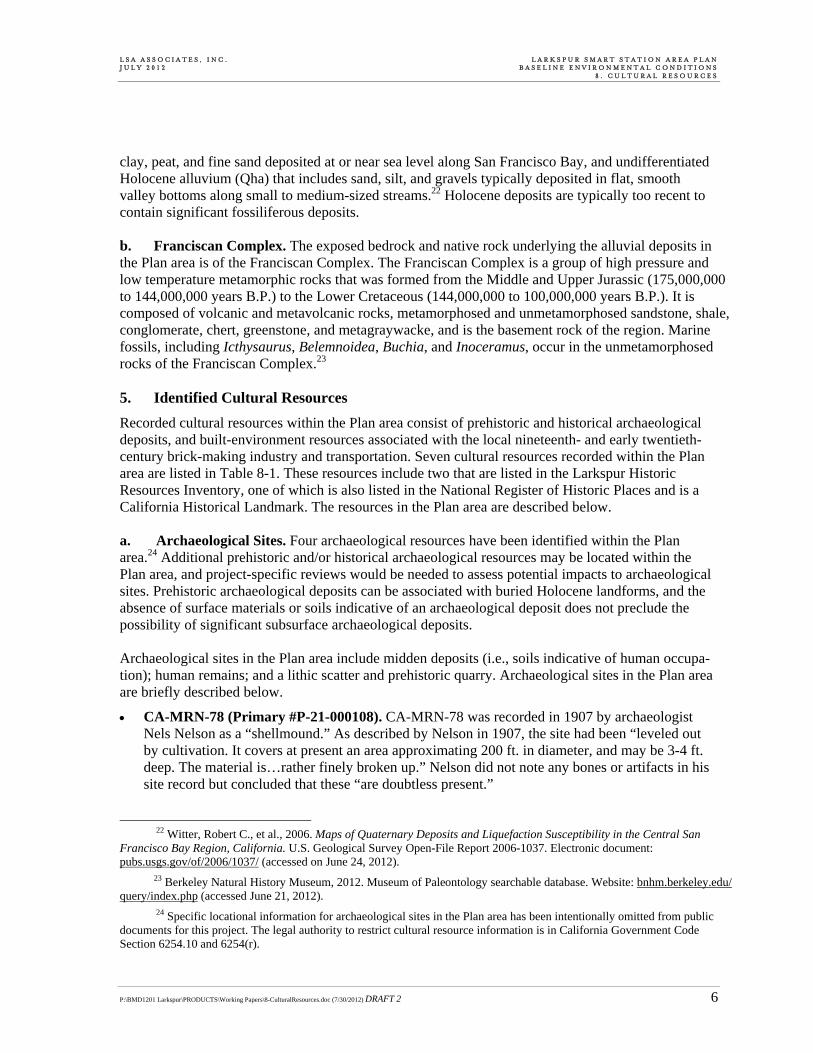
L S A A S S O C I A T E S , I N C . L A R K S P U R S M A R T S T A T I O N A R E A P L A N J U L Y 2 0 1 2 B A S E L I N E E N V I R O N M E N T A L C O N D I T I O N S 8 . C U L T U R A L R E S O U R C E S
P:\BMD1201 Larkspur\PRODUCTS\Working Papers\8-CulturalResources.doc (7/30/2012) DRAFT 2 6
clay, peat, and fine sand deposited at or near sea level along San Francisco Bay, and undifferentiated Holocene alluvium (Qha) that includes sand, silt, and gravels typically deposited in flat, smooth valley bottoms along small to medium-sized streams.22 Holocene deposits are typically too recent to contain significant fossiliferous deposits. b. Franciscan Complex. The exposed bedrock and native rock underlying the alluvial deposits in the Plan area is of the Franciscan Complex. The Franciscan Complex is a group of high pressure and low temperature metamorphic rocks that was formed from the Middle and Upper Jurassic (175,000,000 to 144,000,000 years B.P.) to the Lower Cretaceous (144,000,000 to 100,000,000 years B.P.). It is composed of volcanic and metavolcanic rocks, metamorphosed and unmetamorphosed sandstone, shale, conglomerate, chert, greenstone, and metagraywacke, and is the basement rock of the region. Marine fossils, including Icthysaurus, Belemnoidea, Buchia, and Inoceramus, occur in the unmetamorphosed rocks of the Franciscan Complex.23 5. Identified Cultural Resources
Recorded cultural resources within the Plan area consist of prehistoric and historical archaeological deposits, and built-environment resources associated with the local nineteenth- and early twentieth-century brick-making industry and transportation. Seven cultural resources recorded within the Plan area are listed in Table 8-1. These resources include two that are listed in the Larkspur Historic Resources Inventory, one of which is also listed in the National Register of Historic Places and is a California Historical Landmark. The resources in the Plan area are described below. a. Archaeological Sites. Four archaeological resources have been identified within the Plan area.24 Additional prehistoric and/or historical archaeological resources may be located within the Plan area, and project-specific reviews would be needed to assess potential impacts to archaeological sites. Prehistoric archaeological deposits can be associated with buried Holocene landforms, and the absence of surface materials or soils indicative of an archaeological deposit does not preclude the possibility of significant subsurface archaeological deposits. Archaeological sites in the Plan area include midden deposits (i.e., soils indicative of human occupa-tion); human remains; and a lithic scatter and prehistoric quarry. Archaeological sites in the Plan area are briefly described below.
CA-MRN-78 (Primary #P-21-000108). CA-MRN-78 was recorded in 1907 by archaeologist Nels Nelson as a “shellmound.” As described by Nelson in 1907, the site had been “leveled out by cultivation. It covers at present an area approximating 200 ft. in diameter, and may be 3-4 ft. deep. The material is…rather finely broken up.” Nelson did not note any bones or artifacts in his site record but concluded that these “are doubtless present.”
22 Witter, Robert C., et al., 2006. Maps of Quaternary Deposits and Liquefaction Susceptibility in the Central San
Francisco Bay Region, California. U.S. Geological Survey Open-File Report 2006-1037. Electronic document: pubs.usgs.gov/of/2006/1037/ (accessed on June 24, 2012).
23 Berkeley Natural History Museum, 2012. Museum of Paleontology searchable database. Website: bnhm.berkeley.edu/ query/index.php (accessed June 21, 2012).
24 Specific locational information for archaeological sites in the Plan area has been intentionally omitted from public documents for this project. The legal authority to restrict cultural resource information is in California Government Code Section 6254.10 and 6254(r).
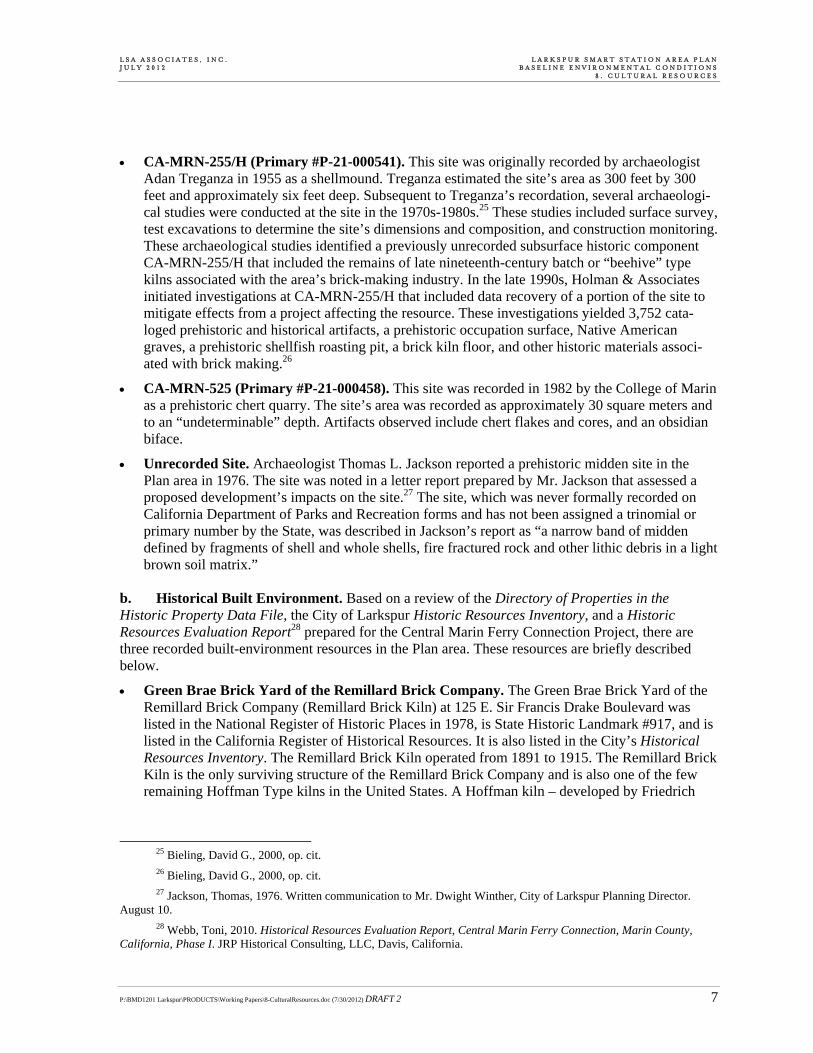
L S A A S S O C I A T E S , I N C . L A R K S P U R S M A R T S T A T I O N A R E A P L A N J U L Y 2 0 1 2 B A S E L I N E E N V I R O N M E N T A L C O N D I T I O N S 8 . C U L T U R A L R E S O U R C E S
P:\BMD1201 Larkspur\PRODUCTS\Working Papers\8-CulturalResources.doc (7/30/2012) DRAFT 2 7
CA-MRN-255/H (Primary #P-21-000541). This site was originally recorded by archaeologist Adan Treganza in 1955 as a shellmound. Treganza estimated the site’s area as 300 feet by 300 feet and approximately six feet deep. Subsequent to Treganza’s recordation, several archaeologi-cal studies were conducted at the site in the 1970s-1980s.25 These studies included surface survey, test excavations to determine the site’s dimensions and composition, and construction monitoring. These archaeological studies identified a previously unrecorded subsurface historic component CA-MRN-255/H that included the remains of late nineteenth-century batch or “beehive” type kilns associated with the area’s brick-making industry. In the late 1990s, Holman & Associates initiated investigations at CA-MRN-255/H that included data recovery of a portion of the site to mitigate effects from a project affecting the resource. These investigations yielded 3,752 cata-loged prehistoric and historical artifacts, a prehistoric occupation surface, Native American graves, a prehistoric shellfish roasting pit, a brick kiln floor, and other historic materials associ-ated with brick making.26
CA-MRN-525 (Primary #P-21-000458). This site was recorded in 1982 by the College of Marin as a prehistoric chert quarry. The site’s area was recorded as approximately 30 square meters and to an “undeterminable” depth. Artifacts observed include chert flakes and cores, and an obsidian biface.
Unrecorded Site. Archaeologist Thomas L. Jackson reported a prehistoric midden site in the Plan area in 1976. The site was noted in a letter report prepared by Mr. Jackson that assessed a proposed development’s impacts on the site.27 The site, which was never formally recorded on California Department of Parks and Recreation forms and has not been assigned a trinomial or primary number by the State, was described in Jackson’s report as “a narrow band of midden defined by fragments of shell and whole shells, fire fractured rock and other lithic debris in a light brown soil matrix.”
b. Historical Built Environment. Based on a review of the Directory of Properties in the Historic Property Data File, the City of Larkspur Historic Resources Inventory, and a Historic Resources Evaluation Report28 prepared for the Central Marin Ferry Connection Project, there are three recorded built-environment resources in the Plan area. These resources are briefly described below.
Green Brae Brick Yard of the Remillard Brick Company. The Green Brae Brick Yard of the Remillard Brick Company (Remillard Brick Kiln) at 125 E. Sir Francis Drake Boulevard was listed in the National Register of Historic Places in 1978, is State Historic Landmark #917, and is listed in the California Register of Historical Resources. It is also listed in the City’s Historical Resources Inventory. The Remillard Brick Kiln operated from 1891 to 1915. The Remillard Brick Kiln is the only surviving structure of the Remillard Brick Company and is also one of the few remaining Hoffman Type kilns in the United States. A Hoffman kiln – developed by Friedrich
25 Bieling, David G., 2000, op. cit. 26 Bieling, David G., 2000, op. cit. 27 Jackson, Thomas, 1976. Written communication to Mr. Dwight Winther, City of Larkspur Planning Director.
August 10. 28 Webb, Toni, 2010. Historical Resources Evaluation Report, Central Marin Ferry Connection, Marin County,
California, Phase I. JRP Historical Consulting, LLC, Davis, California.
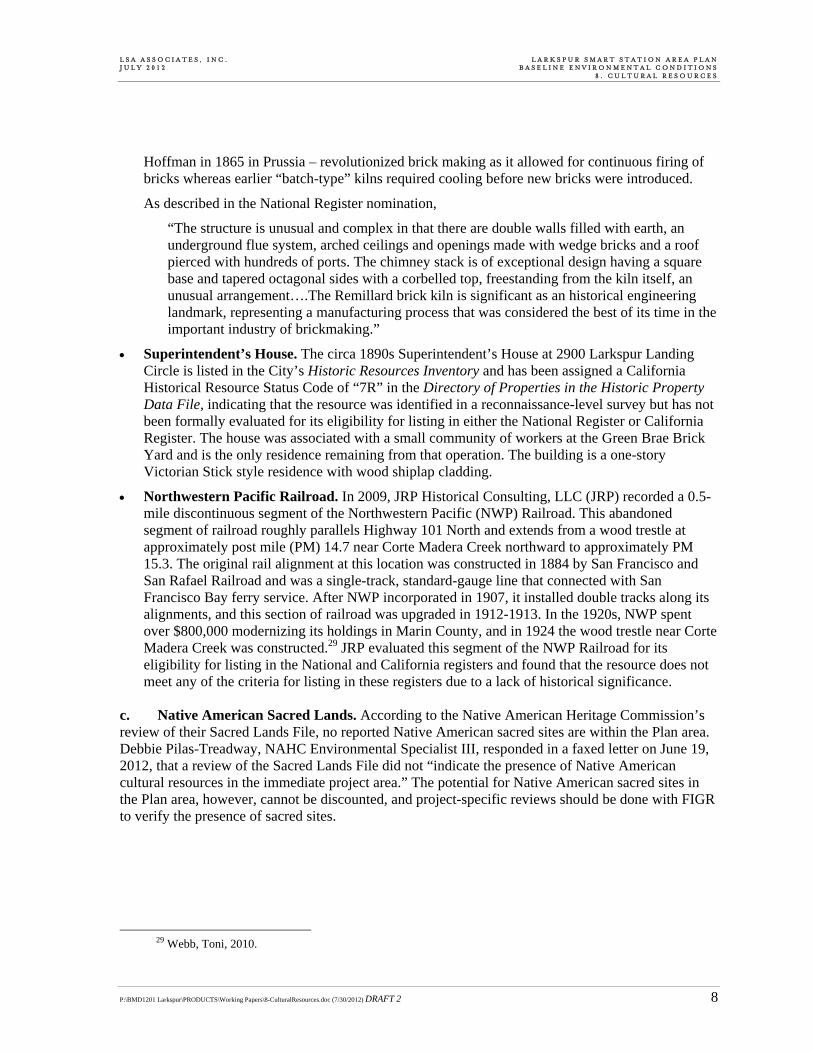
L S A A S S O C I A T E S , I N C . L A R K S P U R S M A R T S T A T I O N A R E A P L A N J U L Y 2 0 1 2 B A S E L I N E E N V I R O N M E N T A L C O N D I T I O N S 8 . C U L T U R A L R E S O U R C E S
P:\BMD1201 Larkspur\PRODUCTS\Working Papers\8-CulturalResources.doc (7/30/2012) DRAFT 2 8
Hoffman in 1865 in Prussia – revolutionized brick making as it allowed for continuous firing of bricks whereas earlier “batch-type” kilns required cooling before new bricks were introduced.
As described in the National Register nomination,
“The structure is unusual and complex in that there are double walls filled with earth, an underground flue system, arched ceilings and openings made with wedge bricks and a roof pierced with hundreds of ports. The chimney stack is of exceptional design having a square base and tapered octagonal sides with a corbelled top, freestanding from the kiln itself, an unusual arrangement….The Remillard brick kiln is significant as an historical engineering landmark, representing a manufacturing process that was considered the best of its time in the important industry of brickmaking.”
Superintendent’s House. The circa 1890s Superintendent’s House at 2900 Larkspur Landing Circle is listed in the City’s Historic Resources Inventory and has been assigned a California Historical Resource Status Code of “7R” in the Directory of Properties in the Historic Property Data File, indicating that the resource was identified in a reconnaissance-level survey but has not been formally evaluated for its eligibility for listing in either the National Register or California Register. The house was associated with a small community of workers at the Green Brae Brick Yard and is the only residence remaining from that operation. The building is a one-story Victorian Stick style residence with wood shiplap cladding.
Northwestern Pacific Railroad. In 2009, JRP Historical Consulting, LLC (JRP) recorded a 0.5-mile discontinuous segment of the Northwestern Pacific (NWP) Railroad. This abandoned segment of railroad roughly parallels Highway 101 North and extends from a wood trestle at approximately post mile (PM) 14.7 near Corte Madera Creek northward to approximately PM 15.3. The original rail alignment at this location was constructed in 1884 by San Francisco and San Rafael Railroad and was a single-track, standard-gauge line that connected with San Francisco Bay ferry service. After NWP incorporated in 1907, it installed double tracks along its alignments, and this section of railroad was upgraded in 1912-1913. In the 1920s, NWP spent over $800,000 modernizing its holdings in Marin County, and in 1924 the wood trestle near Corte Madera Creek was constructed.29 JRP evaluated this segment of the NWP Railroad for its eligibility for listing in the National and California registers and found that the resource does not meet any of the criteria for listing in these registers due to a lack of historical significance.
c. Native American Sacred Lands. According to the Native American Heritage Commission’s review of their Sacred Lands File, no reported Native American sacred sites are within the Plan area. Debbie Pilas-Treadway, NAHC Environmental Specialist III, responded in a faxed letter on June 19, 2012, that a review of the Sacred Lands File did not “indicate the presence of Native American cultural resources in the immediate project area.” The potential for Native American sacred sites in the Plan area, however, cannot be discounted, and project-specific reviews should be done with FIGR to verify the presence of sacred sites.
29 Webb, Toni, 2010.
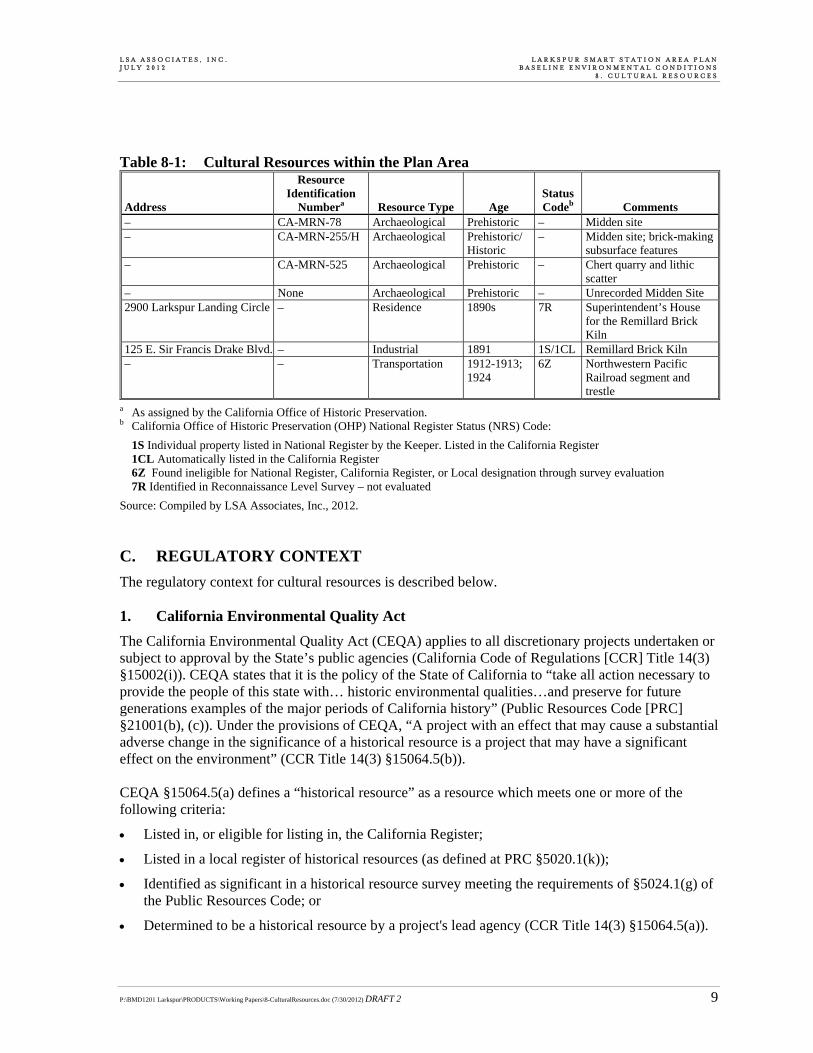
L S A A S S O C I A T E S , I N C . L A R K S P U R S M A R T S T A T I O N A R E A P L A N J U L Y 2 0 1 2 B A S E L I N E E N V I R O N M E N T A L C O N D I T I O N S 8 . C U L T U R A L R E S O U R C E S
P:\BMD1201 Larkspur\PRODUCTS\Working Papers\8-CulturalResources.doc (7/30/2012) DRAFT 2 9
Table 8-1: Cultural Resources within the Plan Area
Address
Resource Identification
Numbera Resource Type Age Status Codeb Comments
– CA-MRN-78 Archaeological Prehistoric – Midden site – CA-MRN-255/H Archaeological Prehistoric/
Historic – Midden site; brick-making
subsurface features – CA-MRN-525 Archaeological Prehistoric – Chert quarry and lithic
scatter – None Archaeological Prehistoric – Unrecorded Midden Site 2900 Larkspur Landing Circle – Residence 1890s 7R Superintendent’s House
for the Remillard Brick Kiln
125 E. Sir Francis Drake Blvd. – Industrial 1891 1S/1CL Remillard Brick Kiln – – Transportation 1912-1913;
1924 6Z Northwestern Pacific
Railroad segment and trestle
a As assigned by the California Office of Historic Preservation. b California Office of Historic Preservation (OHP) National Register Status (NRS) Code:
1S Individual property listed in National Register by the Keeper. Listed in the California Register 1CL Automatically listed in the California Register 6Z Found ineligible for National Register, California Register, or Local designation through survey evaluation 7R Identified in Reconnaissance Level Survey – not evaluated
Source: Compiled by LSA Associates, Inc., 2012. C. REGULATORY CONTEXT
The regulatory context for cultural resources is described below. 1. California Environmental Quality Act
The California Environmental Quality Act (CEQA) applies to all discretionary projects undertaken or subject to approval by the State’s public agencies (California Code of Regulations [CCR] Title 14(3) §15002(i)). CEQA states that it is the policy of the State of California to “take all action necessary to provide the people of this state with… historic environmental qualities…and preserve for future generations examples of the major periods of California history” (Public Resources Code [PRC] §21001(b), (c)). Under the provisions of CEQA, “A project with an effect that may cause a substantial adverse change in the significance of a historical resource is a project that may have a significant effect on the environment” (CCR Title 14(3) §15064.5(b)). CEQA §15064.5(a) defines a “historical resource” as a resource which meets one or more of the following criteria:
Listed in, or eligible for listing in, the California Register;
Listed in a local register of historical resources (as defined at PRC §5020.1(k));
Identified as significant in a historical resource survey meeting the requirements of §5024.1(g) of the Public Resources Code; or
Determined to be a historical resource by a project's lead agency (CCR Title 14(3) §15064.5(a)).
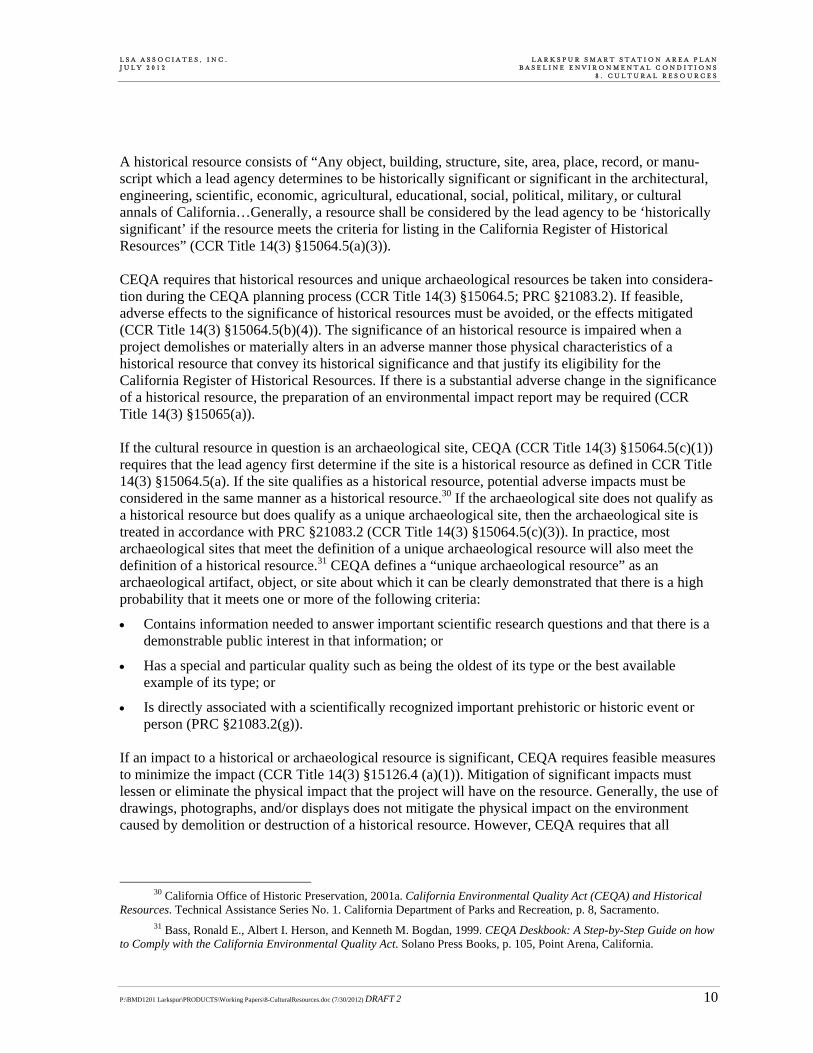
L S A A S S O C I A T E S , I N C . L A R K S P U R S M A R T S T A T I O N A R E A P L A N J U L Y 2 0 1 2 B A S E L I N E E N V I R O N M E N T A L C O N D I T I O N S 8 . C U L T U R A L R E S O U R C E S
P:\BMD1201 Larkspur\PRODUCTS\Working Papers\8-CulturalResources.doc (7/30/2012) DRAFT 2 10
A historical resource consists of “Any object, building, structure, site, area, place, record, or manu-script which a lead agency determines to be historically significant or significant in the architectural, engineering, scientific, economic, agricultural, educational, social, political, military, or cultural annals of California…Generally, a resource shall be considered by the lead agency to be ‘historically significant’ if the resource meets the criteria for listing in the California Register of Historical Resources” (CCR Title 14(3) §15064.5(a)(3)). CEQA requires that historical resources and unique archaeological resources be taken into considera-tion during the CEQA planning process (CCR Title 14(3) §15064.5; PRC §21083.2). If feasible, adverse effects to the significance of historical resources must be avoided, or the effects mitigated (CCR Title 14(3) §15064.5(b)(4)). The significance of an historical resource is impaired when a project demolishes or materially alters in an adverse manner those physical characteristics of a historical resource that convey its historical significance and that justify its eligibility for the California Register of Historical Resources. If there is a substantial adverse change in the significance of a historical resource, the preparation of an environmental impact report may be required (CCR Title 14(3) §15065(a)). If the cultural resource in question is an archaeological site, CEQA (CCR Title 14(3) §15064.5(c)(1)) requires that the lead agency first determine if the site is a historical resource as defined in CCR Title 14(3) §15064.5(a). If the site qualifies as a historical resource, potential adverse impacts must be considered in the same manner as a historical resource.30 If the archaeological site does not qualify as a historical resource but does qualify as a unique archaeological site, then the archaeological site is treated in accordance with PRC §21083.2 (CCR Title 14(3) §15064.5(c)(3)). In practice, most archaeological sites that meet the definition of a unique archaeological resource will also meet the definition of a historical resource.31 CEQA defines a “unique archaeological resource” as an archaeological artifact, object, or site about which it can be clearly demonstrated that there is a high probability that it meets one or more of the following criteria:
Contains information needed to answer important scientific research questions and that there is a demonstrable public interest in that information; or
Has a special and particular quality such as being the oldest of its type or the best available example of its type; or
Is directly associated with a scientifically recognized important prehistoric or historic event or person (PRC §21083.2(g)).
If an impact to a historical or archaeological resource is significant, CEQA requires feasible measures to minimize the impact (CCR Title 14(3) §15126.4 (a)(1)). Mitigation of significant impacts must lessen or eliminate the physical impact that the project will have on the resource. Generally, the use of drawings, photographs, and/or displays does not mitigate the physical impact on the environment caused by demolition or destruction of a historical resource. However, CEQA requires that all
30 California Office of Historic Preservation, 2001a. California Environmental Quality Act (CEQA) and Historical
Resources. Technical Assistance Series No. 1. California Department of Parks and Recreation, p. 8, Sacramento. 31 Bass, Ronald E., Albert I. Herson, and Kenneth M. Bogdan, 1999. CEQA Deskbook: A Step-by-Step Guide on how
to Comply with the California Environmental Quality Act. Solano Press Books, p. 105, Point Arena, California.
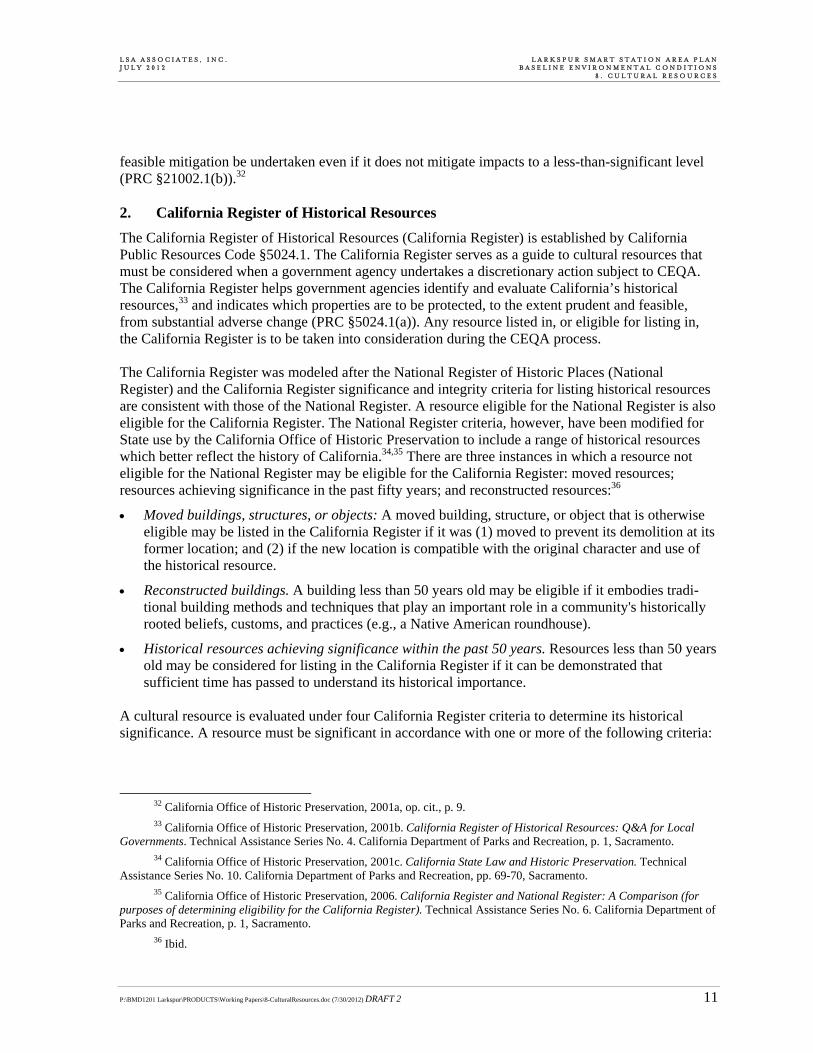
L S A A S S O C I A T E S , I N C . L A R K S P U R S M A R T S T A T I O N A R E A P L A N J U L Y 2 0 1 2 B A S E L I N E E N V I R O N M E N T A L C O N D I T I O N S 8 . C U L T U R A L R E S O U R C E S
P:\BMD1201 Larkspur\PRODUCTS\Working Papers\8-CulturalResources.doc (7/30/2012) DRAFT 2 11
feasible mitigation be undertaken even if it does not mitigate impacts to a less-than-significant level (PRC §21002.1(b)).32 2. California Register of Historical Resources
The California Register of Historical Resources (California Register) is established by California Public Resources Code §5024.1. The California Register serves as a guide to cultural resources that must be considered when a government agency undertakes a discretionary action subject to CEQA. The California Register helps government agencies identify and evaluate California’s historical resources,33 and indicates which properties are to be protected, to the extent prudent and feasible, from substantial adverse change (PRC §5024.1(a)). Any resource listed in, or eligible for listing in, the California Register is to be taken into consideration during the CEQA process. The California Register was modeled after the National Register of Historic Places (National Register) and the California Register significance and integrity criteria for listing historical resources are consistent with those of the National Register. A resource eligible for the National Register is also eligible for the California Register. The National Register criteria, however, have been modified for State use by the California Office of Historic Preservation to include a range of historical resources which better reflect the history of California.34,35 There are three instances in which a resource not eligible for the National Register may be eligible for the California Register: moved resources; resources achieving significance in the past fifty years; and reconstructed resources:36
Moved buildings, structures, or objects: A moved building, structure, or object that is otherwise eligible may be listed in the California Register if it was (1) moved to prevent its demolition at its former location; and (2) if the new location is compatible with the original character and use of the historical resource.
Reconstructed buildings. A building less than 50 years old may be eligible if it embodies tradi-tional building methods and techniques that play an important role in a community's historically rooted beliefs, customs, and practices (e.g., a Native American roundhouse).
Historical resources achieving significance within the past 50 years. Resources less than 50 years old may be considered for listing in the California Register if it can be demonstrated that sufficient time has passed to understand its historical importance.
A cultural resource is evaluated under four California Register criteria to determine its historical significance. A resource must be significant in accordance with one or more of the following criteria:
32 California Office of Historic Preservation, 2001a, op. cit., p. 9. 33 California Office of Historic Preservation, 2001b. California Register of Historical Resources: Q&A for Local
Governments. Technical Assistance Series No. 4. California Department of Parks and Recreation, p. 1, Sacramento. 34 California Office of Historic Preservation, 2001c. California State Law and Historic Preservation. Technical
Assistance Series No. 10. California Department of Parks and Recreation, pp. 69-70, Sacramento. 35 California Office of Historic Preservation, 2006. California Register and National Register: A Comparison (for
purposes of determining eligibility for the California Register). Technical Assistance Series No. 6. California Department of Parks and Recreation, p. 1, Sacramento.
36 Ibid.
L S A A S S O C I A T E S , I N C . L A R K S P U R S M A R T S T A T I O N A R E A P L A N J U L Y 2 0 1 2 B A S E L I N E E N V I R O N M E N T A L C O N D I T I O N S 8 . C U L T U R A L R E S O U R C E S
P:\BMD1201 Larkspur\PRODUCTS\Working Papers\8-CulturalResources.doc (7/30/2012) DRAFT 2 12
1) Is associated with events that have made a significant contribution to the broad pattern of California’s history and cultural heritage;
2) Is associated with the lives of persons important in our past;
3) Embodies the distinctive characteristics of a type, period, region, or method of construction, or represents the work of an important creative individual, or possesses high artistic values; or
4) Has yielded, or may be likely to yield, information important in prehistory or history.
Age. In addition to meeting one or more of the above criteria, the California Register requires that sufficient time must have passed to allow a “scholarly perspective on the events or individuals associated with the resource.” Fifty years is used as a general estimate of the time needed to under-stand the historical importance of a resource (CCR Title 14(11.5) §4852 (d)(2)). The State of California Office of Historic Preservation recommends documenting, and taking into consideration in the planning process, any cultural resource that is 45 years or older.37
Period of Significance. The period of significance for a property is “the span of time when a property was associated with important events, activities, persons, cultural groups, and land uses or attained important physical qualities or characteristics.”38 The period of significance begins with the date of the earliest important land use or activity that is reflected by historic characteristics tangible today. The period closes with the date when events having historical importance ended.39 The period of significance for an archeological property is “the time range (which is usually estimated) during which the property was occupied or used and for which the property is likely to yield important information.”40 Archaeological properties may have more than one period of significance.
Historic Context. The significance of cultural resources is generally evaluated using a historic context, which groups information about related historical resources based on theme, geographic limits, and chronological period.41
Integrity. The California Register also requires a resource to possess integrity, which is defined as “the authenticity of a historical resource’s physical identity evidenced by the survival of character-istics that existed during the resource’s period of significance. Integrity is evaluated with regard to the following aspects: retention of location, design, setting, materials, workmanship, feeling, and associa-tion.”42 Archaeologists use the term “integrity” to describe the level of preservation or quality of information contained within a district, site, or excavated assemblage. Integrity is relative to the specific signifi-
37 California Office of Historic Preservation, 1995. Instructions for Recording Historical Resources, p. 2,
Sacramento. 38 National Park Service, 1999. Guidelines for Evaluating and Documenting Rural Historic Landscapes, p. 21,
Washington, D.C. 39 Ibid. 40 National Park Service, 2000:34. Guidelines for Evaluating and Registering Archeological Properties, p. 34,
Washington, D.C. 41 California Office of Historic Preservation, 1995, op. cit., p. 11. 42 California Office of Historic Preservation, 2006, op. cit., p. 2.
L S A A S S O C I A T E S , I N C . L A R K S P U R S M A R T S T A T I O N A R E A P L A N J U L Y 2 0 1 2 B A S E L I N E E N V I R O N M E N T A L C O N D I T I O N S 8 . C U L T U R A L R E S O U R C E S
P:\BMD1201 Larkspur\PRODUCTS\Working Papers\8-CulturalResources.doc (7/30/2012) DRAFT 2 13
cance which the resource conveys. Although it is possible to correlate the aspects of integrity, listed above, with standard archaeological site characteristics, those aspects are often unclear for evaluating the ability of an archaeological resource to convey significance under California Register criterion 4 (has yielded, or may be likely to yield, information important in prehistory or history). The integrity of archaeological resources, therefore, is judged according to the ability of the site to yield scientific and cultural information that can be used to address important research questions.43
Eligibility. Resources that are significant, meet the age guidelines, and possess integrity will generally be considered eligible for listing in the California Register. 3. Larkspur 1990 General Plan
The Community Character Element of the Larkspur 1990 General Plan discusses the City’s goals, policies, and action programs for cultural resources. Relevant goals and policies for historical resources and archaeological resources are presented below. Community Character Element Goal 3: Assure the survival of Larkspur’s “special sense of place.”
Policy i: Identify significant archaeological, historic, and natural resources representing all of the ethnic, cultural, and economic groups that have lived and worked in Larkspur.
o Action Program [7]: Maintain an up-to-date inventory of existing historic resources, including artifacts, structures, sites, areas, and natural phenomena.
o Action Program [8]: Maintain a City adopted list of historic, archaeological, and natural resources worthy of preservation.
o Action Program [9]: Map the location of historic districts and historic and natural resources.
Policy j: Safeguard and maintain significant historic, archaeological, and natural resources.
o Action Program [10]: Administer the Heritage Preservation Ordinance so as to provide for the appropriate development and maintenance of historic resources and their environments.
o Action Program [11]: Maintain and support the Heritage Preservation Board.
Policy k: Accommodate anticipated development and population growth in ways that will not damage Larkspur’s historic, archaeological, and natural resources.
o Action Program [13]: Provide a quick-response mechanism for saving resources threatened by construction or demolition.
o Action Program [14]: Establish design guidelines for property owners, developers, and public agencies to use with respect to land use and building construction in areas of identified historic, archaeological, or natural significance.
o Action Program [15]: Review all public policies, and modify them as necessary, to support the policies of this chapter to protect and preserve historic, archaeological, and natural resources while protecting the general health, welfare, and safety of the public.
o Action Program [16]: Direct capital improvement programs toward protecting, preserving, rehabilitating, and enhancing archaeological, and natural resources.
43 National Park Service, 2000, op. cit., pp. 35-42.
L S A A S S O C I A T E S , I N C . L A R K S P U R S M A R T S T A T I O N A R E A P L A N J U L Y 2 0 1 2 B A S E L I N E E N V I R O N M E N T A L C O N D I T I O N S 8 . C U L T U R A L R E S O U R C E S
P:\BMD1201 Larkspur\PRODUCTS\Working Papers\8-CulturalResources.doc (7/30/2012) DRAFT 2 14
o Action Program [17]: Provide local incentives for restoring and maintaining historic, archaeological, and natural resources.
o Action Program [18]: Coordinate City and other public agency programs so that the City’s objectives and standards for preserving historic, archaeological, and natural resources are met.
o Action Program [19]: Use the principles and practices of land use planning to promote the preservation of historic, archaeological, and natural resources.
Goal 4: Promote a greater awareness of and sensitivity toward Larkspur’s archaeological heritage.
Policy l: The City shall cooperate with the Northwest Information Center toward the protection and pres-ervation of artifacts in those areas already identified as containing archaeological remains.
Policy m: The City shall cooperate with the Northwest Information Center in the development of informa-tion which will allow the prediction of additional sites likely to contain archaeological remains.
o Action Program [21]: All development applications and public projects that require EIRs will routinely be sent to the Northwest Information Center…for review and recommendations regarding archaeologi-cal findings.
o Action Program [22]: The City shall promote the preservation of archaeological sites by considering any significant remains in its planning for parks.
o Action Program [23]: The City may permit land uses other than those designated on the General Plan Land Use and Circulation map on sites with archaeological merit, in order to preserve the archaeologi-cal record.
o Action Program [24]: Where an archaeological site is in proximity to a project under review, City staff in conjunction with the Northwest Information Center will determine the particular qualities to be preserved and the methods of preservation.
4. Larkspur Municipal Code
The City’s Municipal Code includes provisions for protection and preservation of cultural resources in Chapter 15.42 (Archaeological Resources) and Chapter 18.19 (Heritage Preservation). Chapter 15.42 provides “procedures for studying and/or preserving valuable archaeological resources in the City.” This chapter requires that an “archaeological investigation permit” be issued prior to the issuance of a building or grading permit in those instances where such entitlements would affect archaeological resources. Chapter 15.42 also requires that “complete and accurate” records of archaeological findings be submitted to appropriate repositories. Chapter 18.19 includes provisions “for the review, evaluation, enhancement, protection and preservation of natural phenomena, structures, sites and areas that possess unique character, special architectural appearance, historical value or which generate special aesthetic or cultural interest.” This chapter allows for designation of heritage preservation combining zoning districts (H) and review by the City Heritage Preservation Board of projects that: (1) require discretionary land use permits; (2) require building permits; (3) require grading or demolition permits for properties listed on City’s Historic Resources Inventory; or (4) are located within an “H” district.